


Abstract
While the importance of entrepreneurial orientation (EO) for business performance (BP) is well established, the mechanisms underlying the EO-BP relationship remain unclear, especially in emerging economies. In this study, we explored the role of innovation capability (IC) as a mediator between EO and BP among small and medium-sized enterprises (SMEs) in Kosovo. A quantitative research design was used, and a survey was conducted with 525 SME owner-managers and senior managers. We used PLS-SEM in SmartPLS 4 to test the proposed model, including measurement model assessment, mediation testing using 5000 bootstrap replications with bias-corrected confidence intervals, moderation testing, and out-of-sample prediction (PLS predict). The results show that EO is positively associated with IC and that IC is positively associated with BP. The model explains 60.3% of the variance in BP, and IC partially mediates the EO-BP relationship, accounting for 44.4% of the total effect. The model specification examined found no statistically significant moderating effect of firm size on the EO–BP relationship (β = 0.052, p = 0.120). This finding emphasises that innovation capability is a suitable mediating variable between EO and BP in an emerging-economy context.
1. Introduction
SMEs are widely recognised as pivotal actors in entrepreneurship, innovation, and economic development in emerging economies, particularly through employment creation, local wealth generation, and market dynamism (Dzogbenuku & Keelson, 2019; Edeh et al., 2024).
EO is typically defined as an entrepreneurial strategy manifested through innovative, proactive, and risk-taking behaviours that allow firms to detect and capture market opportunities (Jalali, 2025). EO plays a special role for SMEs in emerging economies because it helps them cope with uncertainty, increases competitiveness, and improves performance (Jalali, 2025). However, the EO–performance relationship is not always direct or consistent, as firms frequently face resource limitations, institutional voids, and environmental uncertainty (Edeh et al., 2024). Kosovo’s operating environment includes structural constraints, such as productivity challenges and market fragmentation, that affect SMEs. For these reasons, researchers have recently explored other mechanisms and contextual factors that explain the link between EO and performance outcomes (Demirkan et al., 2019; Jalali, 2025).
A related mechanism is IC, which reflects a firm’s capacity to convert knowledge, technological adaptation, and creative ideas into new products, services, or processes (Wang & Ahmed, 2007; Edeh et al., 2024). SMEs in developing economies also face considerable resource and institutional limitations, but through strategic measures such as exporting, quality certification, and external collaboration, they can improve their innovation performance (Edeh et al., 2024). This implies that IC is a firm-level dynamic capability through which entrepreneurial behaviour is converted into better BP (Barney, 2001; Wang & Ahmed, 2007). Despite numerous studies investigating direct associations between EO and BP, and between EO and other innovation-related constructs such as IC, the relative contribution of direct versus innovation capability-mediated associations remains unclear (Jalali, 2025; Demirkan et al., 2019; Marcotte, 2014). Previous studies have identified the role of organisational capabilities and context in explaining entrepreneurial outcomes, especially in resource-constrained and institutional settings (Bruton et al., 2018; Saha et al., 2023). Specifically, Ngo (2023) empirically showed that the relationship between EO and BP in a transitional economy is mediated by IC. Thus, the current research does not suggest a novel mediation process. Rather, it explores how much of the EO-BP association is captured by IC and whether there is a statistically significant direct association remaining after controlling for IC. This distinction is theoretically significant because it allows IC to be considered a key, yet not exclusive, intermediate in the EO-BP chain. To explore the relevance of these well-known relationships, the Kosovo SME setting is considered. Some works have focused on related areas of SME development such as digital transformation (Gashi et al., 2026), and green innovation (Qabrati et al., 2026). It does so without assuming that unobserved institutional factors account for the observed empirical regularities but instead offers further evidence for the framework’s applicability.
In this context, the present study aims to investigate the relationship between EO and BP among SMEs in Kosovo, with innovativeness capability as the focus. In particular, it focuses on the direct linkages between EO, IC, and BP and whether IC is an organisational mechanism through which EO is related to performance outcomes. The study also examines firm size as a boundary condition of the EO-BP relationship because firm-level resources and environmental conditions may also affect this relationship (Barney, 2001; Jalali, 2025; Wang & Ahmed, 2007).
The EO-IC relationships are well known, but their empirical applicability in various economic situations needs further exploration. This study examines the mediating effect of innovation capability and the moderating effect of firm size using data from 525 SMEs in Kosovo. It makes an empirical and contextual contribution by providing evidence of established relationships in an under-investigated context, and it does not claim to explain institutional effects. Evidence from Kosovo shows the significance of digital competencies, technological innovation, training, and organisational preparedness for SME innovation and transformation outcomes. (Gashi et al., 2026; Qabrati et al., 2026). New technologies such as AI and data-driven management practices are transforming how companies design and implement organisational capabilities, aiming to make decision-making more efficient and effective. The study therefore evaluates the continued relevance of the EO-IC-BP mechanism when the transformation of EO into realised performance is not always substantively guaranteed.
2. Literature Review and Hypotheses Development
2.1. Entrepreneurial Orientation and Innovation Capability
EO is the strategic orientation of the firm, defined by innovativeness, proactiveness, and risk-taking, which guides a firm’s ability to see opportunities and adapt to uncertainty (Covin & Slevin, 1989; Lumpkin & Dess, 1996). EO is especially important in SMEs because of resource constraints and environmental pressures, and entrepreneurial behaviour is crucial for adaptation and competitiveness (Covin & Slevin, 1989). According to Lumpkin and Dess (1996), EO is conceptualised as multidimensional and can relate to firm outcomes directly or indirectly. From an RBV perspective, EO is an intangible strategic resource that can be exploited and developed to provide competitive advantage (Barney, 2001). In a dynamic environment, however, resources are not enough; firms need DC to reconfigure and renew resources (Wang & Ahmed, 2007). IC is one such mechanism, as it is defined as a firm’s ability to convert knowledge, learning and strategic orientation into new products, services and processes (Calantone et al., 2002; Akman & Yilmaz, 2008). The correlation between entrepreneurial behaviour and innovation outcomes is supported by previous studies. Calantone et al. (2002) link learning orientation to innovativeness and performance, and Akman and Yilmaz (2008) find that proactiveness and analytical abilities help drive innovation. Likewise, Gomes et al. (2022) show that EO spurs service innovation through organisational learning capability. Earlier studies also support the present study, indicating that companies with a high level of IC have advantages in developing technology, products, and processes (Guan & Ma, 2003; Yam et al., 2004). Thus, SMEs with higher EO are more likely to have higher IC because pro-innovation, risk-taking organisations actively seek new opportunities and invest in innovative solutions (Covin & Slevin, 1989; Lumpkin & Dess, 1996; Gomes et al., 2022). Previous research also supports this study, showing that firms with a high degree of IC benefit from technology, product, and process development (Guan & Ma, 2003; Yam et al., 2004). However, the literature does not prove that an EO necessarily leads to IC. The entrepreneurial intentions and behaviours need to be translated into organisational routines that facilitate learning, reconfiguration of resources and implementation of innovation (Wang & Ahmed, 2007) from a DC viewpoint. This transformation may be difficult for SMEs, whose entrepreneurial activities do not always directly connect to their IC and whose institutional and resource constraints make the process more complex. Thus, the EO-IC relationship cannot be taken for granted across contexts and needs to be studied specifically in transition-economy SMEs. Therefore, organisations characterised by stronger pro-innovation and risk-taking behaviours are more likely to demonstrate higher levels of IC; similarly, SMEs with higher EO are more likely to have higher IC (Covin & Slevin, 1989; Lumpkin & Dess, 1996; Gomes et al., 2022). Consequently, the following hypothesis is made:
H1.
Entrepreneurial orientation (EO) positively affects innovation capability (IC) in SMEs.
2.2. Innovation Capability and Business Performance
IC is well known as a factor affecting firm performance, reflecting a firm’s capacity to develop and implement novel ideas, products, and processes (Calantone et al., 2002; Guan & Ma, 2003). Knowledge acquisition and application are closely linked to innovation, and improved performance depends on innovation (Calantone et al., 2002). Empirical evidence indicates that IC contributes to improved competitiveness, adaptation to technological change, and firm performance (Guan & Ma, 2003; Yam et al., 2004). SMEs are especially significant in this regard because they do not benefit from scale advantages and must be flexible and learn to compete (Guan & Ma, 2003; Oduro, 2024). In addition, Oduro (2024) validated that innovation plays a key role in sustainable performance across economic, social, and environmental dimensions. In terms of the RBV and the dynamic capability view, IC is seen as a process that transforms resources into performance outcomes (Barney, 2001; Wang & Ahmed, 2007). However, the performance returns on IC should not be taken for granted or assumed to be identical. Developing or generating innovations does not mean firms can commercialise them or turn them into revenue growth, profitability, and market gains. This depends on complementary resources, market access, organisational learning, and the effective deployment and reconfiguration of the firm’s resources (Wang & Ahmed, 2007; Edeh et al., 2024). This is particularly important for SMEs with limited resources, which may have innovation capacity but lack the corresponding capacity to capture its value. In this way, SMEs with greater innovation capabilities are expected to perform better in dynamic environments (Wang & Ahmed, 2007; Oduro, 2024). Based on this, it is hypothesised that:
H2.
Innovation capability (IC) positively affects business performance (BP) in SMEs.
2.3. Entrepreneurial Orientation and Business Performance
The relationship between EO and BP is a central issue in entrepreneurship research (Lumpkin & Dess, 1996; Wiklund & Shepherd, 2005). EO captures entrepreneurial behaviour through innovation, proactiveness and risk-taking, enabling firms to exploit opportunities and create competitive advantage (Lumpkin & Dess, 1996; Wiklund & Shepherd, 2005). Covin and Slevin (1989) show that entrepreneurial posture improves performance in hostile environments, highlighting its relevance for SMEs facing uncertainty. Wiklund and Shepherd (2005) argue that EO positively influences performance but also emphasise that this relationship depends on contextual factors such as access to capital and environmental dynamism. Similarly, Gruber-Muecke and Hofer (2015) find that entrepreneurial and market-oriented behaviours improve performance in emerging markets, while Jalali (2025) shows that EO enhances SME performance, particularly when supported by institutional mechanisms. DC research further supports this relationship by demonstrating that firms must deploy entrepreneurial and knowledge-based capabilities to improve performance under uncertainty (Hernández-Linares et al., 2024; Wang & Ahmed, 2007). Hernández-Linares et al. (2024) show that EO helps extract value from DC, reinforcing its importance in translating resources into performance outcomes. Taken together, these studies suggest that a positive relationship between EO and performance exists across a wide range of contexts, but it is not always invariant. However, evidence suggests that EO’s performance value depends on factors such as access to capital and environmental dynamism (Wiklund & Shepherd, 2005), and more recent evidence indicates that boundary factors like institutional and organisational conditions are important (Jalali, 2025). Evidence from emerging-economy SMBs also suggests that entrepreneurial action may require other abilities, environmental factors, and conditions to translate into performance (Aftab et al., 2024). So, the question is not just whether EO correlates with performance, but whether EO has value in the presence of resource and institutional constraints. Therefore, SMEs with stronger EO are expected to achieve higher BP because they are more proactive, innovative and opportunity-oriented (Covin & Slevin, 1989; Lumpkin & Dess, 1996; Jalali, 2025). Accordingly, the following hypothesis is proposed:
H3.
Entrepreneurial orientation (EO) has a positive effect on business performance (BP) in SMEs.
2.4. Mediation and Moderation Effects
While EO has a direct effect on performance, prior research indicates that EO effects are mediated by intermediate mechanisms (Lumpkin & Dess, 1996; Gomes et al., 2022; Hernández-Linares et al., 2024). Lumpkin and Dess (1996) emphasise that the relationship between EO and performance may be mediated and moderated. Based on empirical evidence, Gomes et al. (2022) conclude that the EO–performance link is mediated by organisational learning and innovation. Theoretically, IC may be an appropriate mediator between EO and innovation outcomes because opportunity-seeking behaviours are translated into innovation outcomes through IC (Calantone et al., 2002; Gomes et al., 2022). The theoretical support for IC as a mediator stems from incorporating RBV and DC perspectives. Incorporating RBV and DC perspectives supports IC’s role as a mediator. The RBV view is that EO is an entrepreneurial asset that adds value by enabling superior business performance from a strategic perspective. However, possessing resources does not account for the actualisation of this potential. This is supported by DC theory, which focuses on firms’ ability to mobilise, reconfigure, and deploy resources to meet evolving market demands (Wang & Ahmed, 2007). In the current model, IC is the mechanism of this transformation, converting the entrepreneurial resource represented as EO into innovation output that supports BP. Thus, the EO-IC-BP pathway operationalises the integration of two theoretical perspectives, entrepreneurial resource value (RBV) and entrepreneurial capabilities (DC), to transform the resource into performance outcomes. However, IC is not the only potential mediator between entrepreneurial orientation and business performance. Other organisational processes may also relate to the EO-BP association, including market responsiveness, opportunity recognition, and strategic flexibility. The proposed framework therefore conceptualises IC as one theoretically relevant mediating pathway, not an exclusive explanation of the relationship. Based on this, the following hypothesis is proposed:
H4.
Entrepreneurial orientation (EO) is positively associated with business performance (BP) through innovation capability (IC).
Firm size may also represent an organisational boundary condition because larger firms typically have more financial, technological and managerial resources, which can facilitate entrepreneurship (Barney, 2001; Wiklund & Shepherd, 2005). According to the RBV, the more resources a firm has, the more likely it is to achieve better performance outcomes if it has a higher EO (Barney, 2001). Likewise, Wiklund and Shepherd (2005) argue that the effects of EO on BP can be understood in the context of its environment, including resources, which may shape the extent to which it affects performance. However, an alternative view is that EO benefits can be large in smaller companies as well. Smaller firms typically have fewer rules, fewer hierarchies, less formality, and more flexibility and the ability to pursue new market opportunities quickly than larger firms. These attributes can help them execute entrepreneurial projects more effectively and adjust more rapidly to environmental shifts. Previous empirical results have also yielded mixed results for the influence of contextual factors. Other studies report a varying relationship between digital transformation and performance by context (Bindeeba et al., 2025) and a direct effect of policy support as an enabler rather than a moderator (Gashi et al., 2026). These results indicate that contextual factors do not systematically enhance capability–performance relationships. Thus, the evidence is inconclusive on whether EO consistently benefits the performance of larger firms. When examining firm size as a moderator, it is possible to explore whether the nature of EO’s effects on firm performance differs, or whether EO has the same effects on every firm. Based on this, the following hypothesis is put forward:
H5.
Firm size moderates the relationship between entrepreneurial orientation (EO) and business performance (BP), such that the relationship is stronger for larger firms.
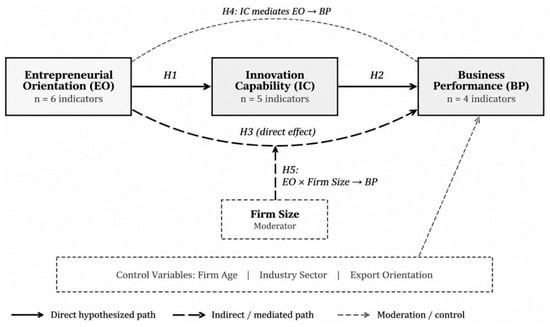
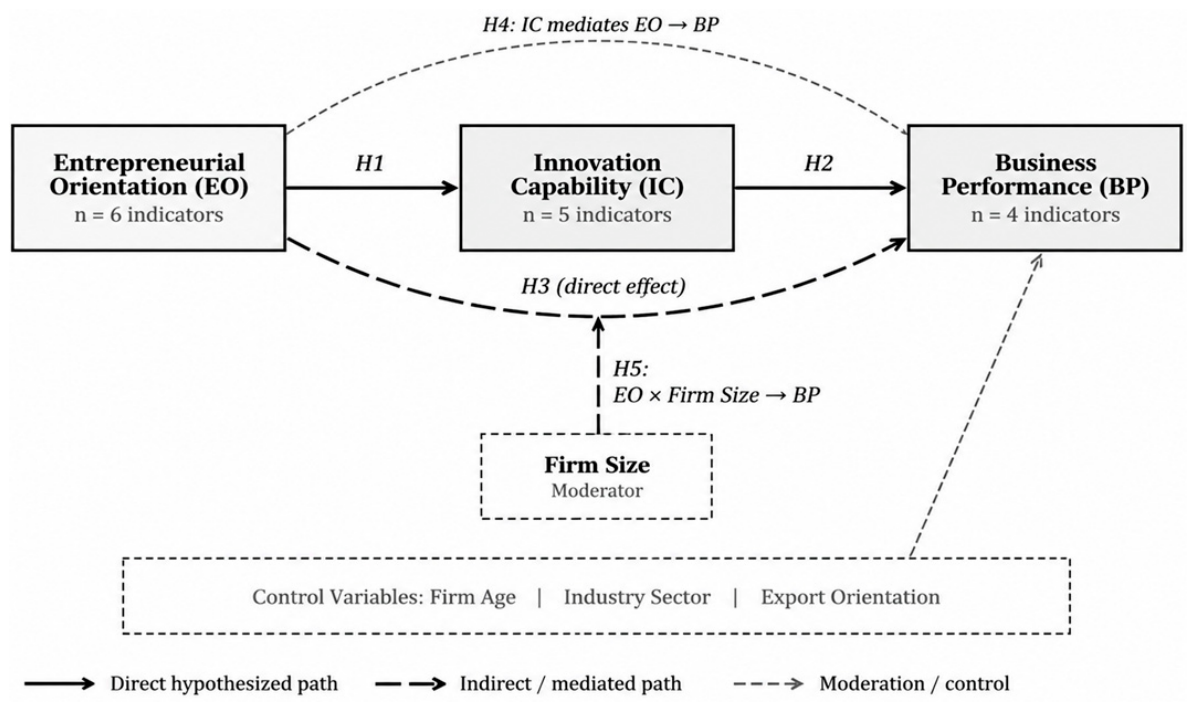
The conceptual model assumes direct relationships between EO and IC (H1), IC and BP (H2), and EO and BP (H3), as well as an indirect relationship between EO and BP via IC (H4). Firm size is hypothesised to moderate only the direct path between EO and BP (H5), rather than the indirect relationship through IC. Firm size, firm age, and export orientation are also used as control variables predicting BP. The conceptual framework proposed can be seen in Figure 1.
Figure 1.
Conceptual framework of the proposed research model.
2.5. Institutional Context of the EO-IC-BP Relationship
Institutional context can influence the relationship between EO and BP. Literature from transition economies suggests that institutional conditions moderate the effect of entrepreneurial behaviour on BP (Bruton et al., 2018), and that institutional constraints affect SME performance by limiting market access, skilled labour, resources, and competencies (Saha et al., 2023). Thus, EO can shape a firm’s entrepreneurial attitude, and the performance value linked to that attitude can be moderated by the extent to which firms can internalise entrepreneurial capabilities and convert entrepreneurial initiatives into innovation outputs. An argument similar to that of another economy undergoing a transition toward a more developed, innovation-driven economic environment, namely another transitional economy, is consistent with evidence that IC lies between EO and performance (Ngo, 2023). Kosovo is thus a theoretically relevant context for considering the continued substantive significance of this mechanism under alternative structural constraints and a changing innovation context. In the present study, institutional conditions are not directly measured or modelled as moderators; they set the context for examining the EO-IC-BP relationship.
2.6. Theoretical Positioning
This study combines the resource-based view (RBV) and DC theory in a resource–capability–outcome logic. RBV and DC complement each other in describing the relationship between EO and BP. EO is defined as a strategic organisational orientation toward opportunity seeking, innovativeness, proactiveness, and risk-taking, while IC is defined as the firm’s organisational capacity to undertake innovation-related activities. IC can help firms adapt and reconfigure organisational resources to meet market demands (Barney, 2001; Wang & Ahmed, 2007). However, the current research does not directly measure resource reconfiguration over time, so this study cannot prove IC is a dynamic capability. Moreover, while conceptually similar, EO and IC are two distinct constructs. EO innovativeness reflects a strategic attitude toward innovation and experimentation, while IC refers to the organisational ability to implement innovation-related initiatives. Therefore, EO reflects a strategic focus on innovation, while IC represents the perceived capacity to carry out innovation-related activities. This distinction justifies their different theoretical functions within the proposed EO-IC-BP, while recognising that they can overlap empirically. As such, the Kosovo case is not only a geographically under-researched context, but also a theoretically informative setting in which the EO-IC-BP relationship may be explored in an institutionally evolving context. The suggested concept of IC is therefore analysed in light of evidence from other transitional economies (Ngo, 2023) to determine whether it can be characterised as a substantive link between EO and BP for SMEs in Kosovo. Therefore, DC logic is not necessarily context-invariant. Resource scarcity and institutional constraints can affect whether SMEs can build and implement IC as the means by which EO ensures performance gains.
3. Methodology
3.1. Sample and Data Collection
The study used a quantitative survey method to analyse SMEs in Kosovo. Information was gathered from owner-managers and top managers of SMEs with first-hand knowledge of their businesses’ EO, IC, and BP. An anonymous online questionnaire was used to collect data from SME owner-managers and senior managers in January and February 2026. Participation was preceded by electronic informed consent. The study collected no personally identifiable or sensitive information, and participation was entirely voluntary and anonymous. Owner-managers and senior managers were identified as key informants because of their knowledge of firm strategy, innovation activities, and performance. The study obtained 525 valid responses, meeting the recommended sample size for variance-based structural equation modelling (PLS-SEM), including models with mediation and moderation (Hair et al., 2019). The focus on SMEs is consistent with previous studies on EO and innovation capacity in small businesses operating under uncertain conditions (Covin & Slevin, 1989). The sample covers SMEs in Kosovo by size, sector, age, and export orientation.
The sampling frame was SMEs from various economic sectors located in Kosovo. Firms were identified using publicly available business directories, professional networks, chambers of commerce, and regional business associations. The study used non-probability purposive sampling, as it sought owner-managers and senior managers with direct knowledge of strategic orientation, innovation activities, and organisational performance. In the data collection period, 612 companies were initially contacted. Of these, 548 firms confirmed their participation, for a response rate of 89.5%. Data screening excluded 23 questionnaires due to incomplete or missing answers, leaving 525 questionnaires with valid answers. To prevent duplication of organisational responses, only one respondent was chosen from each firm. Eligibility of the respondents was determined through confirmation that the respondents were in managerial roles directly involved in strategic decision-making before completing the online questionnaire. The characteristics of the study participants are presented in Table 1.
Table 1.
Characteristics of the study participants (n = 525).
Strategic-level insights with the sample dominated by owners (40.4%) and operational managers (25.1%). Most firms are small (39.6%) and medium-sized (43.2%), with more than half (56.9%) in existence for more than 10 years and therefore well established. The sectoral distribution generally aligns with the Kosovo economy, where manufacturing, trade, and services dominate, and almost half of the firms report regular export activities (49.9%), indicating the sample’s high exposure to international markets.
3.2. Measurement of Variables
We measured the constructs using established scales that have been validated in previous studies to ensure construct validity and reliability and to allow comparison across studies. The EO constructs were assessed using six items derived from Covin and Slevin (1989) and Lumpkin and Dess (1996), focusing on innovativeness, proactiveness, and risk-taking as key aspects of the firm’s strategic orientation. The dimensions are based on the way firms seek opportunities and react to uncertainty in changing environments (Covin & Slevin, 1989; Lumpkin & Dess, 1996). The five items measuring IC were based on Saunila (2020) and Rajapathirana and Hui (2018), which define IC as the firm’s capability to convert knowledge and ideas into new products, services, and processes. IC is described as a multidimensional capability and is viewed as a dynamic process that helps sustain competitiveness (Saunila, 2020; Rajapathirana & Hui, 2018). BP was measured with four items adapted from Venkatraman (1989) and Wiklund and Shepherd (2005) that subjectively assess performance outcomes. The discriminant validity of a fifth item (BP5: competitiveness) was a concern and led to its removal, per SEM guidelines (Henseler et al., 2015). Subjective measures suit SME studies because subjective and objective measures are strongly related (Wiklund & Shepherd, 2005; Venkatraman, 1989). Conceptually, IC and BP are different areas of the organisation, although they are theoretically related. IC captures the firm’s perceived organisational capacity to create new products/services, enhance business operations, adjust to technological advancements, and execute innovative concepts. BP, on the other hand, is a perceived organisational outcome composed of performance, revenue growth, improved profitability, and market-share growth. In this case, IC reflects the organisation’s ability to engage in innovation-related activities, while BP reflects what the firm hopes to gain from innovation. However, their conceptual closeness and shared respondents suggest they warrant careful empirical investigation, especially since IC is defined as a mediating variable between entrepreneurial orientation and business performance.
3.3. Survey Instrument and Scale Development
The questionnaire was structured into four parts: (A) organisational and demographic characteristics, (B) entrepreneurial orientation (EO), (C) innovation capability (IC), and (D) business performance (BP). The responses to the construct-related items were made on a five-point Likert scale ranging from strongly disagree (1) to strongly agree (5). The measurement items were selected and adapted from the existing literature sources (Covin & Slevin, 1989; Lumpkin & Dess, 1996; Saunila, 2020; Rajapathirana & Hui, 2018; Venkatraman, 1989) to suit the context of the present study. Firm size was also categorised by the number of employees: micro firms (1–9 employees), small firms (10–49 employees), and medium firms (50–249 employees). These categories were then recoded as an ordinal variable (1 = micro, 2 = small and 3 = medium) and incorporated into the interaction term between entrepreneurial orientation and firm size in the moderation analysis. The results are based on the assumption that there is an equal incremental moderating effect between all adjacent size categories, which should be taken into account when interpreting the results of this specification. The questionnaire was pretested and reviewed with a small group of academic experts and SME managers to check the clarity, relevance and contextual appropriateness of the items before the main data collection process. This standardised measurement approach aligns with previous studies on entrepreneurship and innovation (Covin & Slevin, 1989; Saunila, 2020) and supports the systematic evaluation of managers’ perceptions of strategic orientation and organisational capabilities. The full questionnaire can be found in Appendix B.
3.4. Data Analysis Technique
This study used PLS-SEM with SmartPLS 4 to analyse the data. This method is suitable for predictive and exploratory research, especially when relationships are complex, such as mediation and moderation (Hair et al., 2019). Moreover, unlike traditional methods, PLS-SEM does not require strict normality assumptions, making it appropriate for survey data from SMEs. It is also suitable for estimating models involving multiple constructs/indicators. The analysis was conducted in two stages. The measurement model was initially assessed in terms of reliability, convergent validity, and discriminant validity. Second, the path coefficients were analysed for meaning, significance and predictive value of the structural model. The significance of the direct and indirect effects was tested using 5000 resampling procedures (Hair et al., 2019). Discriminant validity was tested using the HTMT method, a more reliable measure than other traditional methods (Henseler et al., 2015).
3.5. Common Method Bias
Two complementary diagnostic procedures were used to assess potential common method bias (CMB). The Harman Single Factor test showed that the first factor accounted for less than 50% of the total variance in the responses, so a single factor was not a major determinant (Podsakoff et al., 2003). In addition, the full collinearity VIF values were assessed per Kock (2015). The VIF values for EO (2.056), IC (2.314), and BP (2.559) were below the recommended threshold of 3.3. Under these criteria, these diagnostic results did not indicate severe common method bias. However, Harman’s single-factor test and full-collinearity VIF diagnostics cannot definitively be used to rule out common method variance. Social desirability bias and shared method effects are possible, as suggested by the cross-sectional, single-informant, self-report design of the data.
4. Results
4.1. Descriptive Statistics and Correlations
Descriptive statistics and inter-construct correlations are given in Table A1. The mean values indicate relatively high levels of EO (4.102), IC (4.394), and BP (4.436). This clustering at the high end of the five-point Likert scale, along with negative skewness and high kurtosis for IC and BP, suggests potential ceiling effects, especially for IC and BP. The self-reported assessments should be analysed in light of this pattern. The correlation results showed positive, statistically significant relationships between the main constructs. EO is positively correlated with IC (r = 0.640, p < 0.001) and BP (r = 0.681, p < 0.001), while IC is also positively correlated with BP (r = 0.717, p < 0.001). Positive relationships are also found with the major constructs and export orientation. Further descriptive data and correlations are provided in Table A1 (Appendix A).
4.2. Measurement Model Assessment
4.2.1. Indicator Loadings
To test the reflective measurement model, we assessed indicator loadings, reliability, and validity according to the guidelines recommended by Hair et al. (2019) and Henseler et al. (2015). All indicator loadings are statistically significant (p < 0.001), and the BCa confidence intervals do not include zero. All EO indicators ranged from 0.683 to 0.843, IC indicators from 0.687 to 0.772, and BP indicators from 0.765 to 0.797, indicating acceptable indicator reliability. A few (EO1, IC1, IC2) are slightly below the recommended value of 0.70 but were included because of their theoretical relevance and because they contribute only minimally to convergent validity. BP5’s outer loading was relatively low (0.618), so it was removed. Excluding the indicator improved the measure’s properties but reduced the conceptual coverage of business performance by reducing the measurement of relative competitiveness. The revised BP construct consisted of four indicators, each with a loading >0.75. Detailed indicator loadings and bootstrapping results are reported in Table A12 in Appendix A.
4.2.2. Reliability and Convergent Validity
The reliability and convergent validity results are shown in Table 2. The Cronbach’s alpha values range from 0.763 to 0.842, the rho_A values range from 0.764 to 0.844, and the composite reliability values range from 0.841 to 0.884. These values exceed the suggested 0.70 threshold, indicating acceptable internal consistency reliability (Hair et al., 2019). The AVE values are also above the 0.50 threshold for all constructs: EO = 0.561, IC = 0.514, and BP = 0.608. Thus, the convergent validity is validated. Increasing the BP AVE from 0.544 to 0.608 and obtaining a more uniform set of BP loadings did not change the substantive structural results; this was achieved by removing BP5. However, removing BP5 limits the conceptual scope of the BP construct because it excludes a measure of the firm’s competitiveness relative to its competitors. The remaining performance indicators thus focus on overall performance, revenue growth, profitability, and market-share growth rather than relative competitiveness. The level of collinearity was determined by the inner model VIF values. All VIF values are below the conservative threshold of 3.3: EO → IC = 1.000, EO → BP = 1.992, IC → BP = 1.740, and EO × Firm Size → BP = 1.029. The results show that collinearity does not pose a problem in the model.
Table 2.
Reliability and Validity of Constructs, and VIF Results.
4.2.3. Discriminant Validity
The HTMT and bootstrapped HTMT inference (Henseler et al., 2015) were used to assess discriminant validity; cross-loadings and the Fornell–Larcker criterion were used as secondary measures of discriminant validity. Based on the values in Table 3, the HTMT values for EO-IC (0.801) and EO-BP (0.835) were below the conservative threshold of 0.85, indicating discriminant validity for those construct pairs. However, the HTMT value for IC-BP (0.928) was above the typical threshold of 0.90, suggesting significant empirical overlap between Innovation Capability and Business Performance. The bootstrapped HTMT method yielded a 95% confidence interval of [0.866, 0.981] with 5000 resamples. This interval does not contain 1.00, but it contains 0.90, suggesting that the traditional HTMT criterion cannot demonstrate discriminant validity between IC and BP. The same concern emerged in the complementary Fornell–Larcker assessment (Table A13), as the square root of AVE for IC (0.717) was slightly lower than its correlation with BP (0.720). However, in the cross-loading assessment (Table A4), using the final measurement model, which excluded BP5, all 15 indicators loaded more heavily on their constructs than on other constructs. These results provide additional evidence of differentiation among the indicators but do not dispel the concern raised by the HTMT assessment. Theoretically, IC and BP are two conceptually different dimensions. Innovation Capability is defined as the capacity to create, refine, and commercialise innovative products, processes, and concepts. At the same time, Business Performance represents the organisation’s business outcomes as perceived by the organisation (overall performance, revenue growth, profitability, and market share). Thus, IC is an organisational capability and innovation-related process, and BP reflects the results of the organisation’s activity. Together, the results suggest perceptual differences between IC and BP at the indicator level, and that they are theoretically differentiable. However, they showed significant empirical overlap and did not meet the usual HTMT threshold. Consequently, findings involving these constructs should be interpreted with appropriate caution. Although IC and BP are conceptually different, the high overlap in empirical indicators is suggested by the high HTMT value (0.928) and the Fornell–Larcker results. Therefore, discriminant validity between these constructs is a measurement issue, and the IC-BP relationship and mediation effect should be interpreted cautiously.
Table 3.
Heterotrait–Monotrait Ratio (HTMT) and HTMT Inference.
The HTMT, bootstrapped confidence intervals, the Fornell–Larcker criterion, and indicator cross-loadings were used to assess discriminant validity. The HTMT values for EO-IC (0.801) and EO-BP (0.835) were below the conservative threshold of 0.85. However, the HTMT for IC–BP surpassed the 0.90 threshold, taken as the empirical distinctiveness threshold, indicating substantial empirical overlap between these constructs. The original SmartPLS bootstrap confidence interval [0.866, 0.981] did not contain 1.00 but did exceed 0.90, thus failing to meet the more stringent threshold for satisfactory discriminant validity. This was further confirmed by the Fornell–Larcker assessment, as the square root of the AVE for IC (0.717) was slightly lower than its correlation with BP (0.720). The cross-loading analysis showed that the indicators retained loaded better on their respective constructs. A supplementary analysis that compared the original five-indicator IC specification to a four-indicator specification (excluding IC2) was performed to assess the sensitivity of this finding. The estimated HTMT value decreased from 0.928 to 0.883. The percentile bootstrapped 95% confidence interval for the alternative specification was, however, [0.801, 0.954], which still included values above 0.90. For the alternative IC model, the convergent validity (AVE = 0.561) and composite reliability (CR = 0.836) were kept at acceptable levels. However, the alternative specification minimised the observed overlap. Appendix A, Table A14, provides detailed results. We also used the original five-indicator IC specification as the main model because IC2 measures the continuous improvement of organisational processes, an important aspect of innovation capability. However, deleting this indicator solely to lower HTMT could reduce the construct’s conceptual scope. Thus, the four-indicator specification was only provided as a sensitivity analysis and was not treated as the measurement model for the theoretical specification.
4.3. Structural Model Assessment
4.3.1. Multicollinearity
Before testing the hypotheses, multicollinearity among predictor constructs was assessed. As reported in Table 2, all VIF values are below 3.3, confirming that collinearity does not bias the structural estimates. This also indicates that the moderation interaction term does not introduce multicollinearity into the model.
4.3.2. Coefficient of Determination
The model’s ability to explain variance was evaluated using R2, and it was found that the model explains 41.9% of the variance in IC (R2 = 0.419) and 60.3% of the variance in BP (R2 = 0.603). We evaluated predictive performance using PLSpredict and Q2predict statistics (IC = 0.396; BP = 0.586). Both models had positive Q2predict values, but their out-of-sample predictive performance was mixed compared with the linear model benchmark. The Stone-Geisser Q2 statistic is computed using blindfolding, while Q2predict is used for out-of-sample prediction. The results for the coefficient of determination (R²) and predictive relevance (Q²predict) are presented in Table 4.
Table 4.
Coefficient of Determination (R2) and Predictive Relevance (Q2predict).
4.3.3. Effect Sizes
Table 5 reports Cohen’s f2 effect sizes. EO also has a large effect on IC (f2 = 0.672), so EO is a good predictor of IC. The effect of IC on BP (f2 = 0.342) is medium, approaching the conventional large-effect threshold of 0.35. The partial mediation results support a medium direct effect of EO on BP (f2 = 0.201). The interaction effect between EO and firm size, by contrast, is small (f2 = 0.007), indicating that firm size does not significantly moderate the EO-BP relationship.
Table 5.
Effect Sizes (f2) of Structural Model Paths.
4.3.4. Model Fit
The indices of model fit are presented in Table 6. The SRMR value is 0.069, below the 0.08 threshold and indicating a good fit. NFI is 0.795, which is below the recommended threshold (0.90) and not optimal; however, NFI is often lower in PLS-SEM models with multiple indicators and is not considered disqualifying when other criteria are satisfactory. Overall, the SRMR, reliability, validity, VIF, and structural results support the model’s adequacy.
Table 6.
Model Fit Indices of the PLS-SEM Model.
4.4. Hypothesis Testing (Bootstrapping)
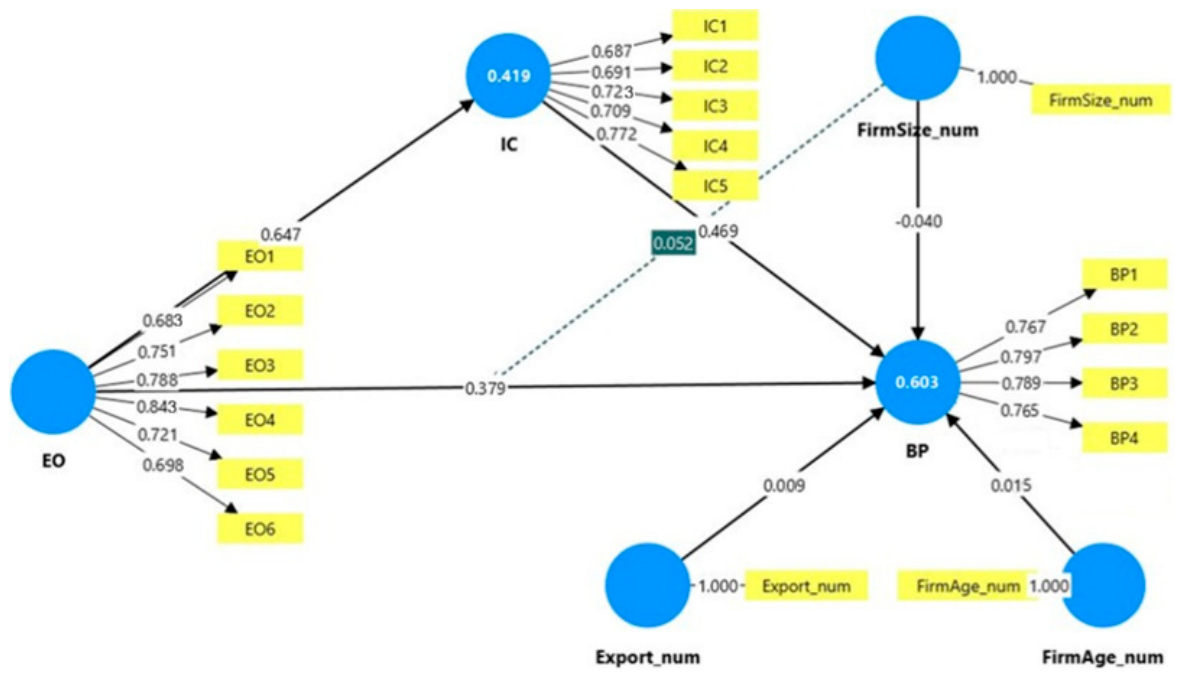
The estimates based on the bootstrapping are reported in Table 7, with 5000 subsamples used. Based on the results, EO was positively and statistically significantly related to IC (β = 0.647, t = 18.319, p < 0.001), supporting H1. Another positive, statistically significant correlation was found between IC and BP (β = 0.469, t = 10.995, p < 0.001), supporting H2. The direct EO-BP relationship was positive and statistically significant (β = 0.379, t = 8.143, p < 0.001), showing support for H3. The EO × Firm Size interaction was not statistically significant (β = 0.052, t = 1.556, p = 0.120), so H5 was not supported. None of the control variables (firm size, firm age, and export orientation) had a statistically significant relationship with BP in the PLS-SEM structural model.
Table 7.
Bootstrapping Results for Structural Model Paths (5000 Subsamples).
A summary of the hypothesis testing results is presented in Table 8.
Table 8.
Summary of Hypothesis Test Results.
4.5. Mediation Analysis
Table 9 presents the mediation results. The indirect effect of EO on BP through IC is positive and significant (β = 0.303, t = 8.677, p < 0.001), with a BCa 95% confidence interval of [0.236, 0.373], which excludes zero. Thus, it can be concluded that H4 is accepted. The direct effect of EO on BP remains significant (β = 0.379, p < 0.001), suggesting partial mediation. IC accounts for 44.4% of the total EO → BP effect, calculated as 0.303/0.682. This suggests that the effects of EO on BP are partially mediated and that there is a direct impact on BP mediated by IC.
Table 9.
Results of Mediation Analysis (Bootstrapping, 5000 Subsamples).
To assess the potential influence of the original definition of IC on the estimated indirect EO-IC-BP association, another sensitivity analysis was conducted that compared results to the association between EO and BP when IC was operationalised using an alternative four-indicator measurement specification excluding IC2. The indirect association was positive in the original model that was estimated independently (β = 0.303, percentile bootstrap 95% CI [0.234, 0.378]). In the other, non-IC2, specification, the indirect association was also positive (β = 0.245, percentile bootstrap 95% CI [0.170, 0.326]). The confidence interval did not cross zero, but the indirect coefficient decreased by about 19.1%. The results suggest that the positive indirect relationship remains in the alternative specification, but its size depends on how IC is measured. Thus, the results do not conclusively establish two separate causal mediation mechanisms underlying the relationship between the two variables, but rather an indirect statistical association in both cases that is consistent with the proposed frameworks. A comparison is provided in Appendix A, Table A14.
4.6. Moderation Analysis
The moderation analysis was conducted to determine whether the direct link between entrepreneurial orientation (EO) and business performance (BP) is moderated by firm size, which was hypothesised in H5. The interaction effect was positive and statistically non-significant (β = 0.052, p = 0.120) and had a negligible effect size (f2 = 0.007). So, H5 was not supported. This finding suggests that the moderating effect of firm size was not found in the present analysis. However, it does not imply that the EO-BP relationship is the same across SME size categories. For firm size, an ordinal variable with three categories (micro, small, and medium) was included, assuming equal increments between the categories. The interaction effect was not significant (β = 0.052, p = 0.120). This result applies to the model specification used and does not necessarily imply that the EO-BP relationship is equivalent across different firm size groups.
We used PLS-predict to evaluate out-of-sample predictive relevance, which showed moderate predictive relevance, as indicated by positive Q2predict values for all BP indicators and acceptable predictive relevance at both the indicator and construct levels, consistent with previous applications of PLS-SEM in social science research (Shmueli et al., 2019). Further, a robustness check (OLS regression with robust SE) also verifies that export orientation is positive and significant, that firm size is insignificant at the 10% level, and that firm age is only marginally significant. The above results confirm the robustness of the findings, but the relationships identified were mainly based on the PLS-SEM model. Detailed results are in Appendix A.
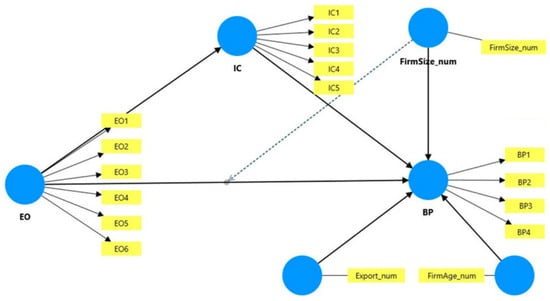
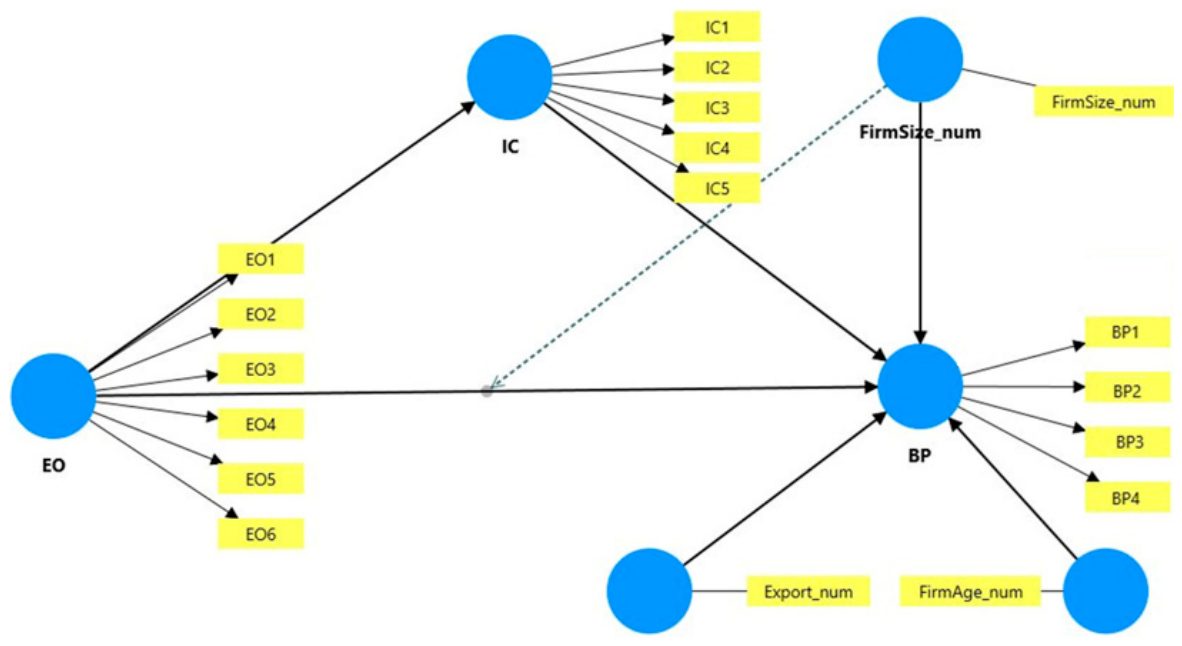
The reflective measurement model estimated in SmartPLS 4 is presented in Figure 2. EO, IC, and BP are included as reflective constructs, and Firm Size, Firm Age, and Export are single-indicator control variables. The dotted line is a moderation path between EO and firm size. The reflective measurement model depicts the three latent variables (EO, IC, BP) with their indicators. EO = 6 indicators (EO1-EO6); IC = 5 indicators (IC1-IC5); BP = 4 indicators (BP1-BP4). The single-indicator control constructs are Firm Size, Firm Age and Export. The dashed blue line represents the moderation path (Firm Size × EO interaction). In this view, the outer loadings and structural paths are not shown; the tables below provide them—estimates are based on SmartPLS 4 (mode A, reflective, path-weighting scheme).
Figure 2.
Measurement Model (PLS-SEM).
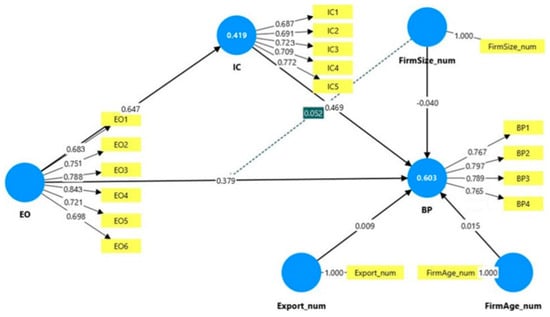
The final structural model is shown in Figure 3, along with the path coefficients and R2 values. The model confirms the strong EO → IC path, the significant IC → BP path, and the significant direct EO → BP path. It also demonstrates that the moderation route is not important. Final PLS-SEM structural model with the moderation effect of Firm Size (H5). Structural arrows with numbers = standardised path coefficients. Numbers with IC and BP circles = R2. Numbers on measurement arrows = outer loadings. The dashed blue line represents the interaction between EO and FirmSize_num. EO → IC: β = 0.647 (p < 0.001); IC → BP: β = 0.469 (p < 0.001); EO → BP: β = 0.379 (p < 0.001); EO × FirmSize → BP: β = 0.052 (p = 0.120, ns); R2(IC) = 0.419; R2(BP) = 0.603. Estimated with the PLS Algorithm (path weighting scheme), 5000 bootstrapped subsamples and BCa confidence intervals (two-tailed test).
Figure 3.
Final Structural Model with Path Coefficients and R2 Values.
We re-estimated the BP construct after excluding BP5 (‘our organisation is more competitive than its rivals’), which had the lowest loading (0.618), to ensure measurement quality. The modified four-item BP construct improved AVE from 0.544 to 0.608, yielded higher BP loadings (0.765 to 0.797), and improved HTMT values, without altering any substantive structural conclusions. Thus, we retained the final four-item BP model and used it consistently throughout all analyses reported in the manuscript.
5. Discussion
5.1. Interpretation of Results
The results provide empirical evidence for the proposed EO-IC-BP in SMEs in Kosovo’s emerging economy, where SME development is shaped by external resource constraints, institutional conditions, and competitiveness challenges (EBRD, 2022; European Commission, 2023; Edeh et al., 2024). Consistent with H1, the results indicate a positive and statistically significant relationship between EO and IC. The findings supported the hypothesis, yielding positive, significant results for EO vis-à-vis IC. This suggests that SMEs with higher entrepreneurial behaviour, in terms of innovativeness, proactiveness, and risk-taking, are more likely to innovate, improve internal processes, adapt to technological changes, and turn ideas into tangible products (Gomes et al., 2022; Foli et al., 2024). This finding aligns with Gomes et al. (2022), who conclude that EO significantly affects both service innovation and organisational performance, and with Foli et al. (2024), who show that the capacity to manage risk and adapt in turbulent contexts influences innovation performance in SMEs. Support for H2 also indicates a positive relationship between IC and BP. This finding indicates that SMEs benefit from entrepreneurial behaviour when it is translated into innovation-related capabilities, including process improvement, technological adaptation, and market-oriented renewal (Edeh et al., 2024; Foli et al., 2024). This result aligns with Edeh et al. (2024), who argue that SMEs in developing economies can improve innovation outcomes despite resource constraints by adopting strategic responses to weak institutional environments. It is also aligned with Chatzinikolaou and Vlados (2024), who emphasise that innovation and change management remain critical but often underdeveloped areas for micro and small firms. H3 is also supported, showing that EO has a direct positive effect on BP. This confirms that EO remains an important strategic posture for SME competitiveness in Kosovo and similar emerging-economy contexts (Jalali, 2025; Fatima & Bilal, 2020). Jalali (2025) shows that EO contributes to SME performance in international markets, especially when firms actively adopt entrepreneurial behaviour and benefit from external support. Likewise, Fatima and Bilal (2020) demonstrate the role of EO in SME’s performance with active relational and networking activities. The mediation results indicate that IC is an important pathway linking EO to BP, but the direct effect is also significant. Given the continued significance of the direct relationship between EO and BP after introducing IC, other mechanisms may also help translate EO into BP. Innovation-related capabilities are not the only ones that may help entrepreneurially oriented firms benefit; networking, opportunity recognition, market responsiveness, first-mover advantages, and other organisational capabilities may also play a role. Hence, innovation capability is an important, though not exhaustive, mechanism linking EO and BP.
One key finding of the study concerns the mediating role of innovation capability. H4 is supported: IC significantly mediates the EO-BP relationship (β = 0.303, p < 0.001), and the direct EO-BP effect is also significant (β = 0.379, p < 0.001), suggesting partial mediation. The IC accounts for 44.4% of the total EO-BP effect. This aligns with Gomes et al. (2022) and Ngo (2023), which also identified capability-based mechanisms between EO and performance. While similar to previous studies, this relationship is indirect and could be driven by reverse causality, unobserved managerial skills, or significant empirical overlap between IC and BP. Hence, the results should not be viewed as evidence of a causal mediation mechanism. More crucially, this finding can be interpreted through the resource–capability–outcome perspective, where EO provides entrepreneurial direction, and IC serves as an organisational mechanism linking EO to actual output (Barney, 2001; Wang & Ahmed, 2007; Bhardwaj et al., 2024). This is especially relevant in transition economies, where institutional factors can affect entrepreneurial outcomes and the availability of complementary resources for SMEs (Bruton et al., 2018; Saha et al., 2023). The Kosovo case further explores the empirical evaluation of the EO-IC-BP relationships among SMEs in an emerging economy. However, the observed associations could not be attributed to specific regulatory or institutional factors because the institutional conditions were not measured directly. The moderating effect of firm size was not statistically significant under the model specification investigated (β = 0.052, p = 0.120) and was therefore not supported here; this means that H5 could not be accepted. However, this does not imply equivalent EO-BP relationships across firm sizes (Aftab et al., 2024; Chatzinikolaou & Vlados, 2024; Edeh et al., 2024; Jalali, 2025). Combined with the mediation results, this suggests that the importance of a firm’s ability to translate entrepreneurial resources into IC may outweigh the absolute number of resources it has (relative to its size). That is, SMEs with more resources will not necessarily have better performance; rather, their ability to convert entrepreneurial initiatives into organisational capabilities drives performance outcomes. IC can be used by the SMEs to create value for their customers and the organisation by enhancing products, services, and processes, which may further help to improve business performance, but was not directly measured in this study (Barney, 2001; Wang & Ahmed, 2007).
5.2. Theoretical Contributions
A distinction is made between conclusions that can be drawn from the present empirical analysis, interpretations that are consistent with the previous theoretical and empirical literature, and conceptually plausible conclusions that demand further research. The empirical results show statistically significant relationships between EO, IC, and BP, with partial mediation. However, the study does not directly measure value creation or specific managerial interventions, and the cross-sectional design does not allow causal inference. For this reason, implications are explicitly discussed in terms of their evidential scope as detailed in Table 10.
Table 10.
Classification of theoretical and practical implications according to their evidential basis.
The results support empirical knowledge of the existing EO-IC-BP linkages from the perspective of RBV and DC. This study adds further empirical evidence on the relative size of direct and IC-mediated relationships between EO and BP for SMEs. The results do not suggest a new mediation process; rather, they offer a more nuanced analysis of IC within a pre-existing theory. In particular, the indirect association via IC (β = 0.303) explains about 44.4% of the total EO-BP association, while the direct association is still statistically significant (β = 0.379, p < 0.001). This pattern of partial mediation indicates that IC plays an important but not exclusive role as an intermediary between EO and BP (Edeh et al., 2024; Fatima & Bilal, 2020; Foli et al., 2024; Jalali, 2025). These findings align with the conceptualisation of EO as a strategic orientation and IC as an organisational capability in the innovation process, as suggested by the resource-based view (RBV) and dynamic capabilities (DC) perspectives (Barney, 2001; Gomes et al., 2022; Wang & Ahmed, 2007). However, the study does not directly observe the reconfiguration of resources or the development of capabilities over time. The findings do not demonstrate a unique causal transformation mechanism but do support a theoretically based interpretation of the EO-IC-BP framework. One must also consider the strong empirical overlap between IC and BP, since IC must be interpreted in the context of BP. The positive indirect relationship between EO and BP is consistent with the alternative measurement specification in the supplementary sensitivity analysis; however, the specificity of the indirect association between EO and BP constructs cannot be fully established using the sensitivity analysis. Thus, the results generally align with the proposed theory but do not support a unique causal mediation mechanism. The Kosovo SME setting also offers additional insights into the applicability of the EO-IC-BP framework in an emerging economy (Bruton et al., 2018; Saha et al., 2023; Ngo, 2023). However, direct measures of institutional conditions were not made, and the associations observed cannot be attributed to particular institutional features. In addition, the direct EO–BP association did not significantly differ across firm size as specified in the model (β = 0.052, p = 0.120). The study thus adds to the body of knowledge on direct and indirect associations and highlights the need for future studies to explore further the mediating mechanisms and context (Bhardwaj et al., 2024; Edeh et al., 2024).
5.3. Practical Implications
Findings guide implications for managers in relation to the relationships between EO, IC and BP; broader implications for organisations and policies are drawn from literature and should be empirically tested. The findings suggest that for managers, the EO needs to be translated into IC. To make proactiveness, risk-taking, and opportunity recognition effective, organisations must invest in products, processes, technological adaptation, and employee-driven innovation (Gomes et al., 2022; Foli et al., 2024). Thus, EO should be viewed as a strategic stance, complemented and sustained by organisational routines and learning systems (Wang & Ahmed, 2007). The findings argue that SME support programmes need to be more than just general entrepreneurship promotion and be directed towards capability development, for the benefit of policymakers. Several instruments can support the transfer of entrepreneurial behaviour into results (Edeh et al., 2024; Jalali, 2025), including training, digitalisation support, innovation grants, and export-readiness programmes. In Kosovo, building innovation ecosystems is very important. Policies should foster technological capabilities, learning, product development, and collaboration with institutions such as universities and business incubators, as IC plays a significant role in linking EO and BP (European Commission, 2023; Edeh et al., 2024). Under the model specification studied, no significant difference was found in the moderating effect by firm size, but this does not imply that the effect is the same within firm-size groups. To that end, capacity development programmes should be designed to meet individual firms’ needs and resource limitations and should not assume the benefits will be the same (Chatzinikolaou & Vlados, 2024; Bhardwaj et al., 2024). For this to be translated into practice, SME managers need to enhance their IC through specific digital capability programmes, increase R&D investment and join innovation incubators and university-industry partnerships. In terms of policy, export-support schemes and government innovation policies could assist SMEs to address resource constraints and turn innovation into better BP.
Table 11 summarises the proposed managerial and policy implications and distinguishes their evidential basis. The present research should not be taken to mean that these recommendations are interventions that have been proven to be effective. Instead, they suggest practices that could help SMEs build and develop their innovation capability and offer guidelines for future empirical testing.
Table 11.
Practical implications and their potential contribution to managerial practices.
6. Conclusions
6.1. Summary of Key Findings
This study gives empirical evidence regarding the EO-IC-BP nexus in SMEs in an emerging economy. The results support the hypothesis that EO significantly influences IC and BP. Moreover, IC is an important intervening construct, explaining 44.4% of the overall mediation between EO and BP, suggesting that IC mediates the relationship between EO and BP more than anything else. The results also indicate no significant moderation of the EO-IC-BP mechanism by firm size, suggesting the EO-IC-BP mechanism is consistent across firm sizes. This result corroborates the capability view, which holds that EO improves performance by boosting firms’ innovation capabilities.
6.2. Limitations and Future Research
The cross-sectional, observational design does not allow causal interpretation or determine the temporal ordering of the EO-IC-BP relationships. Highly successful firms may have more resources to devote to developing their innovation capabilities, so reverse causality between IC and BP is possible. There may be organisational factors that impact these relationships that are not observed, which creates potential endogeneity. Longitudinal design and appropriate methods to test temporal relationships and endogeneity would be useful for future research. Because the study relies on self-reported data from a single informant, common method and social desirability effects cannot be ruled out by the diagnostic tests. Future studies should include multiple informants and objective performance measures to strengthen the robustness of the findings. The discriminant validity (HTMT = 0.928) is also suggested by the significant empirical overlap between IC and BP. A different IC specification did not significantly alter the positive indirect association between EO and BP, but it provided only partial empirical support for their distinctiveness. Furthermore, BP5 had positive impacts on measurement properties, and negative impacts on conceptual coverage of business performance. Further research is needed to improve construct measurement and to use more differentiated, independent measures of innovation capability and business performance. Ordinal coding of firm size assumes equal differences between levels, which may mask nonlinear differences in moderation effects. The categories for size of the firm should be explored in future research through the use of dummy-coded interactions. The purposive sampling method and the high percentage of exporting firms (92.2%) limit the sample’s representativeness and generalizability. Factors within the institutions were not measured directly. Future studies should use probability or stratified sampling, include a more balanced sample of exporting and non-exporting companies, and directly address relevant institutional conditions.
Author Contributions
Conceptualization, L.S.H., K.G., K.S. and S.G.; methodology, K.G. and K.S.; software, K.G.; validation, K.G., K.S. and S.G.; formal analysis, K.G.; investigation, L.S.H.; resources, L.S.H. and K.G.; data curation, L.S.H.; writing—original draft preparation, L.S.H.; writing—review and editing, K.G., K.S. and S.G.; visualisation, K.G.; supervision, K.G. and S.G.; project administration, K.G. All authors have read and agreed to the published version of the manuscript.
Funding
This research received no external funding.
Institutional Review Board Statement
The Research Ethics Committee of the University “Ukshin Hoti” Prizren formally reviewed the research methodology, questionnaire, participant information, informed consent procedure, and the data collected. The study was conducted through an anonymous online questionnaire involving 525 adult owners and managers of small and medium-sized enterprises (SMEs) in Kosovo. Participation was entirely voluntary and anonymous. No personally identifiable or sensitive personal data were collected, and no intervention was performed. Prior to participation, all participants were informed of the purpose of the research, the voluntary nature of their participation, the anonymity of their responses, and the use of the collected data solely for scientific research purposes. Informed consent was obtained electronically prior to participation through the introductory information provided in the questionnaire. Following its formal review of the submitted documentation, the Research Ethics Committee hereby confirms that, given the anonymous, voluntary, and non-interventional nature of the research, this study qualifies for exemption from the requirement for prior formal ethical approval.
Informed Consent Statement
Informed consent was obtained from all subjects involved in the study.
Data Availability Statement
Additional data are available from the corresponding author upon reasonable request, subject to privacy and confidentiality considerations.
Acknowledgments
The authors would like to thank all SME owner-managers and senior managers who voluntarily participated in this study and shared their valuable insights. The authors also appreciate the constructive comments and suggestions provided during manuscript preparation.
Conflicts of Interest
The authors declare no conflicts of interest. The funder of the article processing charge (APC) had no role in the study design; data collection, analysis, or interpretation; manuscript writing; or the decision to publish the results.
Abbreviations
The following abbreviations are used in this manuscript:
| AVE | Average Variance Extracted |
| BCa | Bias-Corrected and Accelerated |
| BP | Business Performance |
| CMB | Common Method Bias |
| CR | Composite Reliability |
| EO | Entrepreneurial Orientation |
| HTMT | Heterotrait–Monotrait Ratio |
| IC | Innovation Capability |
| ICT | Information and Communication Technology |
| PLS-SEM | Partial Least Squares Structural Equation Modelling |
| Q2predict | Stone-Geisser Predictive Relevance |
| R2 | Coefficient of Determination |
| RBV | Resource-Based View |
| SEM | Structural Equation Modelling |
| SMEs | Small and Medium-Sized Enterprises |
| VIF | Variance Inflation Factor |
Appendix A
Table A1.
Means, standard deviations, and correlations.
Table A2.
PLSpredict—Manifest Variable (MV) Summary.
Table A3.
Descriptive Statistics of All Indicators (n = 525).
Table A4.
Discriminant Validity—Cross Loadings (Full Matrix).
Table A5.
Heterotrait–Monotrait Ratio (HTMT)—Full Matrix Including Control Variables and Moderator.
Table A6.
Total Effects (Direct and Indirect).
Table A7.
PLSpredict—Latent Variable (LV) Prediction Error Descriptives.
Table A8.
Full Indicator Correlation Matrix (n = 525).
Table A9.
Cronbach’s Alpha—Item-Level Statistics.
Table A10.
Common Method Bias—Harman Single Factor: Full Eigenvalue Decomposition.
Table A11.
Effects of Industry Sector on Business Performance—Full OLS Regression.
Table A12.
Indicator Loadings of Constructs (Bootstrapping Results).
Table A13.
Fornell–Larcker Criterion.
Table A14.
Supplementary Measurement and Mediation Sensitivity Analysis (5000 Bootstrap Resamples).
Appendix B. Survey Instrument
- All items were measured on a five-point Likert scale
- (1 = Strongly disagree, 5 = Strongly agree).
- Section A: Demographic and Organisational Characteristics
- Position: Owner, CEO/General Manager, Operations Manager
- Firm size: Micro (1–9); Small (10–49); Medium (50–249)
- Firm age: Less than 3 years, 3–5 years, 6–10 years, more than 10 years
- Industry Sector: Manufacturing/Production, Trade (wholesale/retail), Services, Information & Communication Technology (ICT), Construction, Textile
- Export Orientation: Export regularly, Export occasionally, do not export
- Section B: Entrepreneurial Orientation (EO)
- (Covin & Slevin, 1989; Lumpkin & Dess, 1996)
- EO1. Our organisation strongly emphasises research, development and innovation.
- EO2. Our organisation frequently introduces new products or services.
- EO3. Our organisation is usually the first to take initiative in the market.
- EO4. Our organisation often introduces new products or services ahead of competitors.
- EO5. Our organisation is willing to engage in high-risk projects.
- EO6. When faced with uncertainty, our organisation typically takes bold, aggressive action.
- Section C: Innovation Capability (IC)
- (Saunila, 2020; Rajapathirana & Hui, 2018)
- IC1. Our organisation is capable of developing new products or services.
- IC2. Our organisation continuously improves its work processes.
- IC3. Employees actively contribute innovative ideas.
- IC4. Our organisation quickly adapts to technological changes.
- IC5. Our organisation successfully transforms innovative ideas into concrete outcomes.
- Section D: Business Performance (BP)
- (Venkatraman, 1989; Wiklund & Shepherd, 2005)
- BP1. Our organisation’s overall performance is good.
- BP2. Our revenues have increased over the last three years.
- BP3. Our organisation’s profitability has improved.
- BP4. Our market share has increased.
References
- Aftab, J., Veneziani, M., Sarwar, H., & Ishaq, M. I. (2024). Entrepreneurial orientation and firm performance in SMEs: The mediating role of entrepreneurial competencies and moderating role of environmental dynamism. International Journal of Emerging Markets, 19(10), 3329–3352. [Google Scholar] [CrossRef] [Scilit]
- Akman, G., & Yilmaz, C. (2008). Innovative capability, innovation strategy and market orientation: An empirical analysis in the Turkish software industry. International Journal of Innovation Management, 12(1), 69–111. [Google Scholar] [CrossRef] [Scilit]
- Barney, J. B. (2001). Resource-based theories of competitive advantage: A ten-year retrospective on the resource-based view. Journal of Management, 27(6), 643–650. [Google Scholar] [CrossRef]
- Bhardwaj, R., Bindra, S., Singh, T., & Sahay, A. (2024). Toward a typology of entrepreneurial bricolage and its capabilities. Journal of Entrepreneurship in Emerging Economies, 16(6), 1453–1480. [Google Scholar] [CrossRef] [Scilit]
- Bindeeba, D. S., Tukamushaba, E. K., & Bakashaba, R. (2025). Digital transformation and its multidimensional impact on sustainable business performance: Evidence from a meta-analytic review. Future Business Journal, 11, 90. [Google Scholar] [CrossRef] [Scilit]
- Bruton, G. D., Su, Z., & Filatotchev, I. (2018). New venture performance in transition economies from different institutional perspectives. Journal of Small Business Management, 56(3), 374–391. [Google Scholar] [CrossRef] [Scilit]
- Calantone, R. J., Cavusgil, S. T., & Zhao, Y. (2002). Learning orientation, firm innovation capability, and firm performance. Industrial Marketing Management, 31(6), 515–524. [Google Scholar] [CrossRef] [Scilit]
- Chatzinikolaou, D., & Vlados, C. (2024). Crisis, innovation and change management: A blind spot for micro-firms? Journal of Entrepreneurship in Emerging Economies, 16(3), 698–719. [Google Scholar] [CrossRef] [Scilit]
- Cohen, J. (1988). Statistical power analysis for the behavioural sciences (2nd ed.). Routledge. [Google Scholar] [CrossRef] [Scilit]
- Covin, J. G., & Slevin, D. P. (1989). Strategic management of small firms in hostile and benign environments. Strategic Management Journal, 10(1), 75–87. [Google Scholar] [CrossRef] [Scilit]
- Demirkan, I., Yang, Q., & Jiang, C. X. (2019). Corporate entrepreneurship of emerging market firms: Current research and future directions. New England Journal of Entrepreneurship, 22(1), 5–30. [Google Scholar] [CrossRef] [Scilit]
- Dzogbenuku, R. K., & Keelson, S. A. (2019). Marketing and entrepreneurial success in emerging markets: The nexus. Asia Pacific Journal of Innovation and Entrepreneurship, 13(2), 168–187. [Google Scholar] [CrossRef] [Scilit]
- Edeh, J., Nuhu, N., Tajeddin, M., & Simba, A. (2024). Dealing with adversity: Innovation among small and medium-sized enterprises in developing economies. International Journal of Entrepreneurial Behaviour & Research, 30(10), 2578–2600. [Google Scholar] [CrossRef] [Scilit]
- European Bank for Reconstruction and Development. (2022). Kosovo country diagnostic: Private investment challenges and opportunities. EBRD. Available online: https://www.ebrd.com/publications/country-diagnostics (accessed on 29 May 2026).
- European Commission. (2023). Kosovo 2023 report (Commission Staff Working Document SWD(2023) 692 Final). European Commission. Available online: https://eur-lex.europa.eu (accessed on 29 September 2026).
- Fatima, T., & Bilal, A. R. (2020). Achieving SME performance through individual entrepreneurial orientation: An active social networking perspective. Journal of Entrepreneurship in Emerging Economies, 12(3), 399–411. [Google Scholar] [CrossRef] [Scilit]
- Foli, S., Durst, S., & Temel, S. (2024). The link between supply chain risk management and innovation performance in SMEs in turbulent times. Journal of Entrepreneurship in Emerging Economies, 16(3), 626–648. [Google Scholar] [CrossRef] [Scilit]
- Gashi, K., Usaj, V., Bibiqaj, A., Vardari, L., Tafolli, F., & Qabrati, I. (2026). Digital transformation as a catalyst for green innovation: An examination of SMEs from developing economies. Green Technologies and Sustainability, 4(3), 100403. [Google Scholar] [CrossRef] [Scilit]
- Gomes, G., Seman, L. O., Berndt, A. C., & Bogoni, N. (2022). The role of entrepreneurial orientation, organizational learning capability and service innovation in organizational performance. Revista de Gestão, 29(1), 39–54. [Google Scholar] [CrossRef] [Scilit]
- Gruber-Muecke, T., & Hofer, K. M. (2015). Market orientation, entrepreneurial orientation and performance in emerging markets. International Journal of Emerging Markets, 10(3), 560–571. [Google Scholar] [CrossRef] [Scilit]
- Guan, J., & Ma, N. (2003). Innovative capability and export performance of Chinese firms. Technovation, 23(9), 737–747. [Google Scholar] [CrossRef] [Scilit]
- Hair, J. F., Risher, J. J., Sarstedt, M., & Ringle, C. M. (2019). When to use and how to report the results of PLS-SEM. European Business Review, 31(1), 2–24. [Google Scholar] [CrossRef] [Scilit]
- Harman, H. H. (1976). Modern factor analysis (3rd ed.). University of Chicago Press. [Google Scholar]
- Henseler, J., Hubona, G., & Ray, P. A. (2016). Using PLS path modelling in new technology research: Updated guidelines. Industrial Management & Data Systems, 116(1), 2–20. [Google Scholar] [CrossRef] [Scilit]
- Henseler, J., Ringle, C. M., & Sarstedt, M. (2015). A new criterion for assessing discriminant validity in variance-based structural equation modelling. Journal of the Academy of Marketing Science, 43(1), 115–135. [Google Scholar] [CrossRef] [Scilit]
- Hernández-Linares, R., López-Fernández, M. C., García-Piqueres, G., Pina e Cunha, M., & Rego, A. (2024). How knowledge-based dynamic capabilities relate to firm performance: The mediating role of entrepreneurial orientation. Review of Managerial Science, 18, 2781–2813. [Google Scholar] [CrossRef] [Scilit]
- Jalali, H. S. (2025). Entrepreneurial orientation and SMEs’ performance in international markets: Do government support initiatives really matter? Journal of Entrepreneurship in Emerging Economies, 17(6), 1465–1487. [Google Scholar] [CrossRef] [Scilit]
- Kock, N. (2015). Common method bias in PLS-SEM: A full collinearity assessment approach. International Journal of e-Collaboration (IJeC), 11(4), 1–10. [Google Scholar] [CrossRef] [Scilit]
- Lumpkin, G. T., & Dess, G. G. (1996). Clarifying the entrepreneurial orientation construct and linking it to performance. Academy of Management Review, 21(1), 135–172. [Google Scholar] [CrossRef] [Scilit] [PubMed]
- Marcotte, C. (2014). Entrepreneurship and innovation in emerging economies: Conceptual, methodological and contextual issues. International Journal of Entrepreneurial Behaviour & Research, 20(1), 42–65. [Google Scholar] [CrossRef] [Scilit]
- Ngo, Q.-H. (2023). The impact of entrepreneurial orientation on SMEs’ performance in a transitional economy: The mediating role of differentiation advantages and innovation capability. SAGE Open, 13(4), 1–14. [Google Scholar] [CrossRef] [Scilit]
- Oduro, S. (2024). Eco-innovation and SMEs’ sustainable performance: A meta-analysis. European Journal of Innovation Management, 27(9), 248–279. [Google Scholar] [CrossRef] [Scilit]
- Podsakoff, P. M., MacKenzie, S. B., Lee, J.-Y., & Podsakoff, N. P. (2003). Common method biases in behavioural research: A critical review of the literature and recommended remedies. Journal of Applied Psychology, 88(5), 879–903. [Google Scholar] [CrossRef] [Scilit] [PubMed]
- Qabrati, I., Gashi, K., Usaj, V., Vardari, L., & Tafolli, F. (2026). Accounting technology adoption: Managing organizational change through staff perceptions in an emerging economy. EuroMed Journal of Business. Advanced online publication. [Google Scholar] [CrossRef] [Scilit]
- Rajapathirana, R. P. J., & Hui, Y. (2018). Relationship between innovation capability, innovation type, and firm performance. Journal of Innovation & Knowledge, 3(1), 44–55. [Google Scholar] [CrossRef] [Scilit]
- Saha, K., Malesios, C., Chowdhury, S., & Dey, P. K. (2023). Impact of institutional voids on the performance of small and medium-sized enterprises. Journal of Strategy and Management, 16(1), 1–27. [Google Scholar] [CrossRef] [Scilit]
- Saunila, M. (2020). Innovation capability in SMEs: A systematic review of the literature. Journal of Innovation & Knowledge, 5(4), 260–265. [Google Scholar] [CrossRef] [Scilit]
- Shmueli, G., Sarstedt, M., Hair, J. F., Cheah, J.-H., Ting, H., Vaithilingam, S., & Ringle, C. M. (2019). Predictive model assessment in PLS-SEM: Guidelines for using PLSpredict. European Journal of Marketing, 53(11), 2322–2347. [Google Scholar] [CrossRef] [Scilit]
- Venkatraman, N. (1989). Strategic orientation of business enterprises: The construct, dimensionality, and measurement. Management Science, 35(8), 942–962. [Google Scholar] [CrossRef] [Scilit]
- Wang, C. L., & Ahmed, P. K. (2007). Dynamic capabilities: A review and research agenda. International Journal of Management Reviews, 9(1), 31–51. [Google Scholar] [CrossRef] [Scilit]
- Wiklund, J., & Shepherd, D. (2005). Entrepreneurial orientation and small business performance: A configurational approach. Journal of Business Venturing, 20(1), 71–91. [Google Scholar] [CrossRef] [Scilit]
- Yam, R. C. M., Guan, J. C., Pun, K. F., & Tang, E. P. Y. (2004). An audit of technological innovation capabilities in Chinese firms: Some empirical findings in Beijing, China. Research Policy, 33(8), 1123–1140. [Google Scholar] [CrossRef] [Scilit]

Disclaimer/Publisher’s Note: The statements, opinions and data contained in all publications are solely those of the individual author(s) and contributor(s) and not of MDPI and/or the editor(s). MDPI and/or the editor(s) disclaim responsibility for any injury to people or property resulting from any ideas, methods, instructions or products referred to in the content. |
© 2026 by the authors. Licensee MDPI, Basel, Switzerland. This article is an open access article distributed under the terms and conditions of the Creative Commons Attribution (CC BY) license.