


Abstract
Public administrations increasingly publish programmatic and sectoral data, yet fragmented formats, inconsistent terminology, and uneven documentation limit their joint use. This article presents the design and functional evaluation of the Mexican Agricultural Policy Observatory (MAPO), a digital artifact that integrates agricultural support programs with territorial and production indicators for Mexico’s 32 states. Following a design science research approach, the study constructed a 429-record documentary inventory and retained 407 records with both a recognized state and a validated primary category as the main analytical base. This base was used to generate a 32-by-8 descriptive benchmarking matrix, interactive maps, state profiles, downloadable reports, and a structured-context generative artificial intelligence module. Input acquisition, financing, and technification accounted for 71.01% of the comparable analytical base, while state comparisons revealed marked variation in program counts and thematic diversity. A bounded audit of 50 GenAI outputs showed that prompt constraints did not eliminate causal language, policy prescriptions, or count-to-impact equivalences. MAPO separates deterministic calculations from generative interpretation and requires human review before narrative outputs are used. The study contributes a replicable approach to traceable data integration and design principles for AI-assisted public-sector observatories. MAPO supports exploration, communication, and agenda setting; it does not evaluate program impact, budget adequacy, or beneficiary coverage.
1. Introduction
Digital transformation in government increasingly depends on the capacity to convert distributed records into information that can support coordination, analysis, and public accountability. Data publication is a necessary condition, but it does not by itself create an integrated evidence base. Administrative records often remain dispersed across agencies, portals, operating rules, calls for applications, and downloadable files that use different territorial labels, units, time references, and definitions. This fragmentation raises the technical cost of comparison and limits the ability of public organizations to identify patterns across programs and jurisdictions (Mergel et al., 2019; OECD, 2019).
The problem is particularly visible in multilevel policy domains. Agricultural support in Mexico is delivered through federal and state institutions and includes financing, input provision, infrastructure, water management, training, commercialization, insurance, and technological modernization. Although information on these instruments is publicly available, it is not ordinarily presented as a national and comparable portfolio. Analysts must therefore reconstruct the policy landscape from heterogeneous documents before examining how the documented mix of instruments varies territorially or relates to local productive conditions.
Fragmented information should not be equated with fragmented or incoherent policy. Cejudo and Michel (2017) distinguish coordination, coherence, and integration as separate properties of government action, while Howlett and Rayner (2007) emphasize that policy mixes must be understood through the relationships among their instruments rather than through their number alone. Nevertheless, a shared informational layer is a prerequisite for examining concentrations, absences, complementarities, and possible areas for institutional review. Digital observatories can provide such a layer by combining documentary integration, common classifications, indicators, visualization, and knowledge intermediation.
The incorporation of artificial intelligence adds a second administrative challenge. AI adoption is not simply the installation of a new technical component; it can alter workflows, roles, capabilities, and decision routines. George and Wooden (2023) frame AI implementation as a strategic transformation that requires a balanced assessment of expected benefits and institutional risks. Babashahi et al. (2024) similarly show that effective adoption depends on technical proficiency, adaptability, continuous learning, and deliberate strategies for human–machine collaboration. Murire (2024) adds that leadership, transparent communication, and cultural alignment are central when AI changes established work practices.
These organizational considerations are especially important when generative artificial intelligence (GenAI) is used to interpret public data. Natural-language interfaces may make complex indicators more accessible, but they can also produce unsupported causal claims, omit uncertainty, or blur the distinction between observed evidence and recommendation. User-side research also indicates that perceived usefulness, emotions, trust, privacy, and the balance between advantages and disadvantages shape the willingness to adopt AI systems (Sousa et al., 2024). Consequently, technical functionality alone is insufficient: AI-assisted public systems require traceable data, explicit interpretive constraints, human review, and subsequent evaluation with intended users. Recent public-administration research similarly indicates that expected gains in efficiency and service delivery depend on governance arrangements that address bias, cybersecurity, workforce adaptation, ethical risk, and accountability (OECD, 2024; Vatamanu & Tofan, 2025).
This article addresses these challenges through the design and implementation of the Mexican Agricultural Policy Observatory (MAPO). The study expands and substantially revises a preliminary conference version of MAPO (Romero-Hidalgo et al., 2026). MAPO integrates a documentary inventory of agricultural support instruments, 2024 agricultural production statistics, selected contextual indicators, and state-level cartography. The artifact combines deterministic analysis in R with a structured-context GenAI module that converts previously calculated indicators into natural-language interpretations. The model does not calculate official indicators, access the original files, browse the internet, or make autonomous policy decisions.1
Rather than testing a causal hypothesis, the study pursues three connected objectives. First, it demonstrates how fragmented agricultural program records can be transformed into a traceable national information infrastructure. Second, it identifies the thematic and territorial patterns revealed by a common taxonomy and descriptive benchmarking. Third, it derives design principles for incorporating GenAI as a controlled interpretive layer in a public-sector observatory. These objectives respond to a systemic information problem in Mexico: agricultural and agri-food policy information is public but dispersed across institutional portals, operating rules, calls for applications, and transparency materials, with no single public repository that allows users to compare programs, classify instruments, and examine territorial patterns at national scale. Within the scope of this article, the originality of the contribution lies in combining these elements in a single implemented artifact: an auditable documentary inventory, an eight-category operational codebook, a state-category benchmarking matrix, 2024 production indicators, interactive visualization, and a structured-context GenAI module whose outputs are constrained by precomputed evidence. Empirically, the article provides a national descriptive view of Mexico’s documented agricultural support portfolio across 32 states. Methodologically, it contributes an artifact-centered approach that links data governance, benchmarking, visualization, organizational caution, and human-supervised AI interpretation.
2. Theoretical Framework
2.1. Evidence-Informed and Data-Driven Public Administration
Evidence-informed policymaking requires more than access to isolated datasets. Public organizations need capacities to locate evidence, assess its quality, relate it to a defined policy problem, and communicate it in forms that can be used by decision makers. The OECD (2020a) emphasizes that evidence becomes operational only when institutions develop processes and skills for its interpretation. In this sense, data are records, indicators are structured summaries, and evidence emerges when those summaries are interpreted in relation to a concrete administrative question.
A data-driven public sector treats information as a strategic asset throughout the policy cycle (OECD, 2019). This orientation requires data governance, interoperability, documentation, and reuse rather than the accumulation of disconnected files. The FAIR principles likewise stress that data should be findable, accessible, interoperable, and reusable (Wilkinson et al., 2016). For a policy observatory, these principles imply that the provenance of each record, the transformations applied to it, and the meaning and limitations of each indicator must remain visible.
The OECD Digital Government Policy Framework further characterizes mature digital government as digital by design, data-driven, open by default, user-driven, proactive, and supported by common platforms (OECD, 2020b). The World Bank (2021) likewise emphasizes that data infrastructure, legal safeguards, and institutional governance are necessary to convert the reuse of public data into public value.
Benchmarking can support organizational learning by making differences observable, but its meaning depends on the selected reference. Comparisons among subnational governments may identify unusual patterns and prompt further questions, yet they cannot substitute for contextual analysis (Phillips, 2018). Behn (2003) similarly argues that performance measures must be interpreted according to their purpose. MAPO therefore uses benchmarking as a descriptive detection mechanism rather than as a ranking of governmental quality or a standard of policy sufficiency.
2.2. Policy Observatories, Interoperability, and Public Value
Complex policy areas commonly involve multiple instruments, agencies, and levels of government. A larger portfolio does not necessarily produce greater coherence because policy mixes must be examined in terms of the compatibility of their objectives, mechanisms, target populations, and implementation arrangements (Howlett & Rayner, 2007). Before such relationships can be assessed, records produced by different organizations must be placed within a common semantic structure. An observatory contributes to this task by connecting collection, classification, analysis, visualization, and communication within a sustained information process (Soares et al., 2022).
Interoperability has technical, semantic, and organizational dimensions. Technical interoperability concerns compatible files and systems; semantic interoperability requires shared meanings for variables and categories; and organizational interoperability depends on responsibilities and procedures for maintaining and exchanging information. Janssen et al. (2020) connect these requirements directly to trustworthy AI, arguing that reliable automated analysis depends on data provenance, quality, and governance. In MAPO, interoperability is therefore treated as an administrative design problem rather than only a software problem.
The public value of a digital government artifact does not arise from technological novelty alone. It depends on whether the artifact improves administrative efficiency, openness, access, trust, or broader social outcomes (Twizeyimana & Andersson, 2019). MAPO cannot demonstrate realized public value without evidence of institutional adoption and effects on actual decisions. It can, however, establish enabling conditions by reducing search costs, providing common definitions, preserving traceability, and making comparative information easier to communicate. Evidence from public-sector innovation initiatives also highlights the importance of multidisciplinary collaboration, practical experimentation, and organizational support in translating digital projects into administrative change (Deligiannis & Peristeras, 2025).
2.3. AI Adoption as Organizational and User-Centered Change
Research in Administrative Sciences shows that AI adoption should be understood as an organizational transformation rather than as a discrete technical upgrade. George and Wooden (2023) emphasize strategic alignment and the need to weigh efficiency and accessibility against risks involving quality, privacy, bias, safety, and employment. Babashahi et al. (2024) identify technical competence, adaptability, balanced skill development, and continuous learning as central conditions for integrating AI into work processes. Murire (2024) further highlights that altered roles and routines can generate resistance unless leadership, communication, ethical guidance, and cultural adaptation accompany implementation.
Adoption also depends on how users experience and evaluate the technology. Sousa et al. (2024) found that perceived usefulness, positive and negative emotions, privacy concerns, and the advantages and disadvantages attributed to AI systems were associated with users’ willingness to use them. Although MAPO did not conduct a formal acceptance study, this perspective is relevant because an analytically correct platform may still fail if users do not understand its indicators, trust its outputs, or perceive value in the workflow. User-centered evaluation is therefore treated as a required subsequent stage rather than as an assumed outcome of technical implementation. This concern extends beyond usability: reviews of digital-government maturity models show that citizen inclusion is often unevenly operationalized despite its importance for public value, transparency, and trust (Waara, 2025).
2.4. Design Science and Responsible AI-Assisted Policy Intelligence
Design science research (DSR) is appropriate when the research objective includes creating and evaluating an artifact that addresses an organizational problem. The artifact may include constructs, models, methods, software, or an integrated socio-technical system (Hevner et al., 2004). Peffers et al. (2007) organize DSR into problem identification, definition of solution objectives, design and development, demonstration, evaluation, and communication. MAPO includes not only a software interface but also a documentary protocol, an operational codebook, transformation rules, indicators, visual components, a guided analytical workflow, and an AI-mediated explanation layer.
Retrieval-augmented generation combines a language model with externally retrieved information to improve the specificity and factual grounding of responses (Lewis et al., 2020). MAPO uses a structured-context variant in which state-specific facts are retrieved from internal tables and inserted directly into the prompt. The language model does not calculate indicators or access the underlying databases. This separation supports a central design proposition for high-accountability settings: deterministic computation should precede generative explanation, and narrative outputs should remain subject to human review.
These safeguards are especially relevant in agricultural policy because the sector connects public finance, food production, water use, climate risk, territorial inequality, and rural livelihoods. AI-generated interpretations can help users navigate complex program and production data, but they can also introduce specific risks: unsupported causal attribution between programs and outcomes, overstatement of policy sufficiency from simple counts, omission of missing budget or beneficiary data, bias toward better-documented states, and misinterpretation of agronomic indicators such as planted-harvested differences. These risks are consistent with broader work on foundation models and model documentation, which emphasizes that model outputs must be interpreted in relation to training conditions, intended use, evaluation limits, and downstream harms (Bommasani et al., 2021; Mitchell et al., 2019). In this field, such errors are not merely technical; they can distort agenda setting, resource discussions, and perceptions of governmental performance. MAPO therefore treats AI as an interpretive support layer whose narratives must remain subordinate to documented evidence, deterministic indicators, and human review.
3. Materials and Methods
3.1. Research Design
The study used an applied, documentary, non-experimental, descriptive-comparative design embedded in a design science research process. It was qualitative in the construction of the documentary inventory, operational taxonomy, and codebook, and quantitative in the aggregation of classified records, state-category counts, benchmark gaps, territorial reach indicators, and production statistics. The study relied entirely on secondary public data: official program documents and portals, public calls for applications, operating rules, transparency materials, the SIAP 2024 Municipal Agricultural Closing dataset, selected official contextual indicators, and state cartography. No survey, experiment, interview, or beneficiary-level primary data collection was conducted.
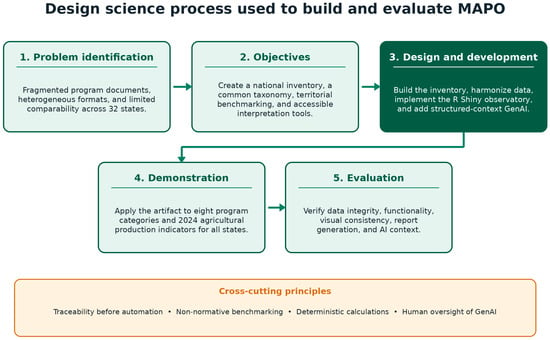
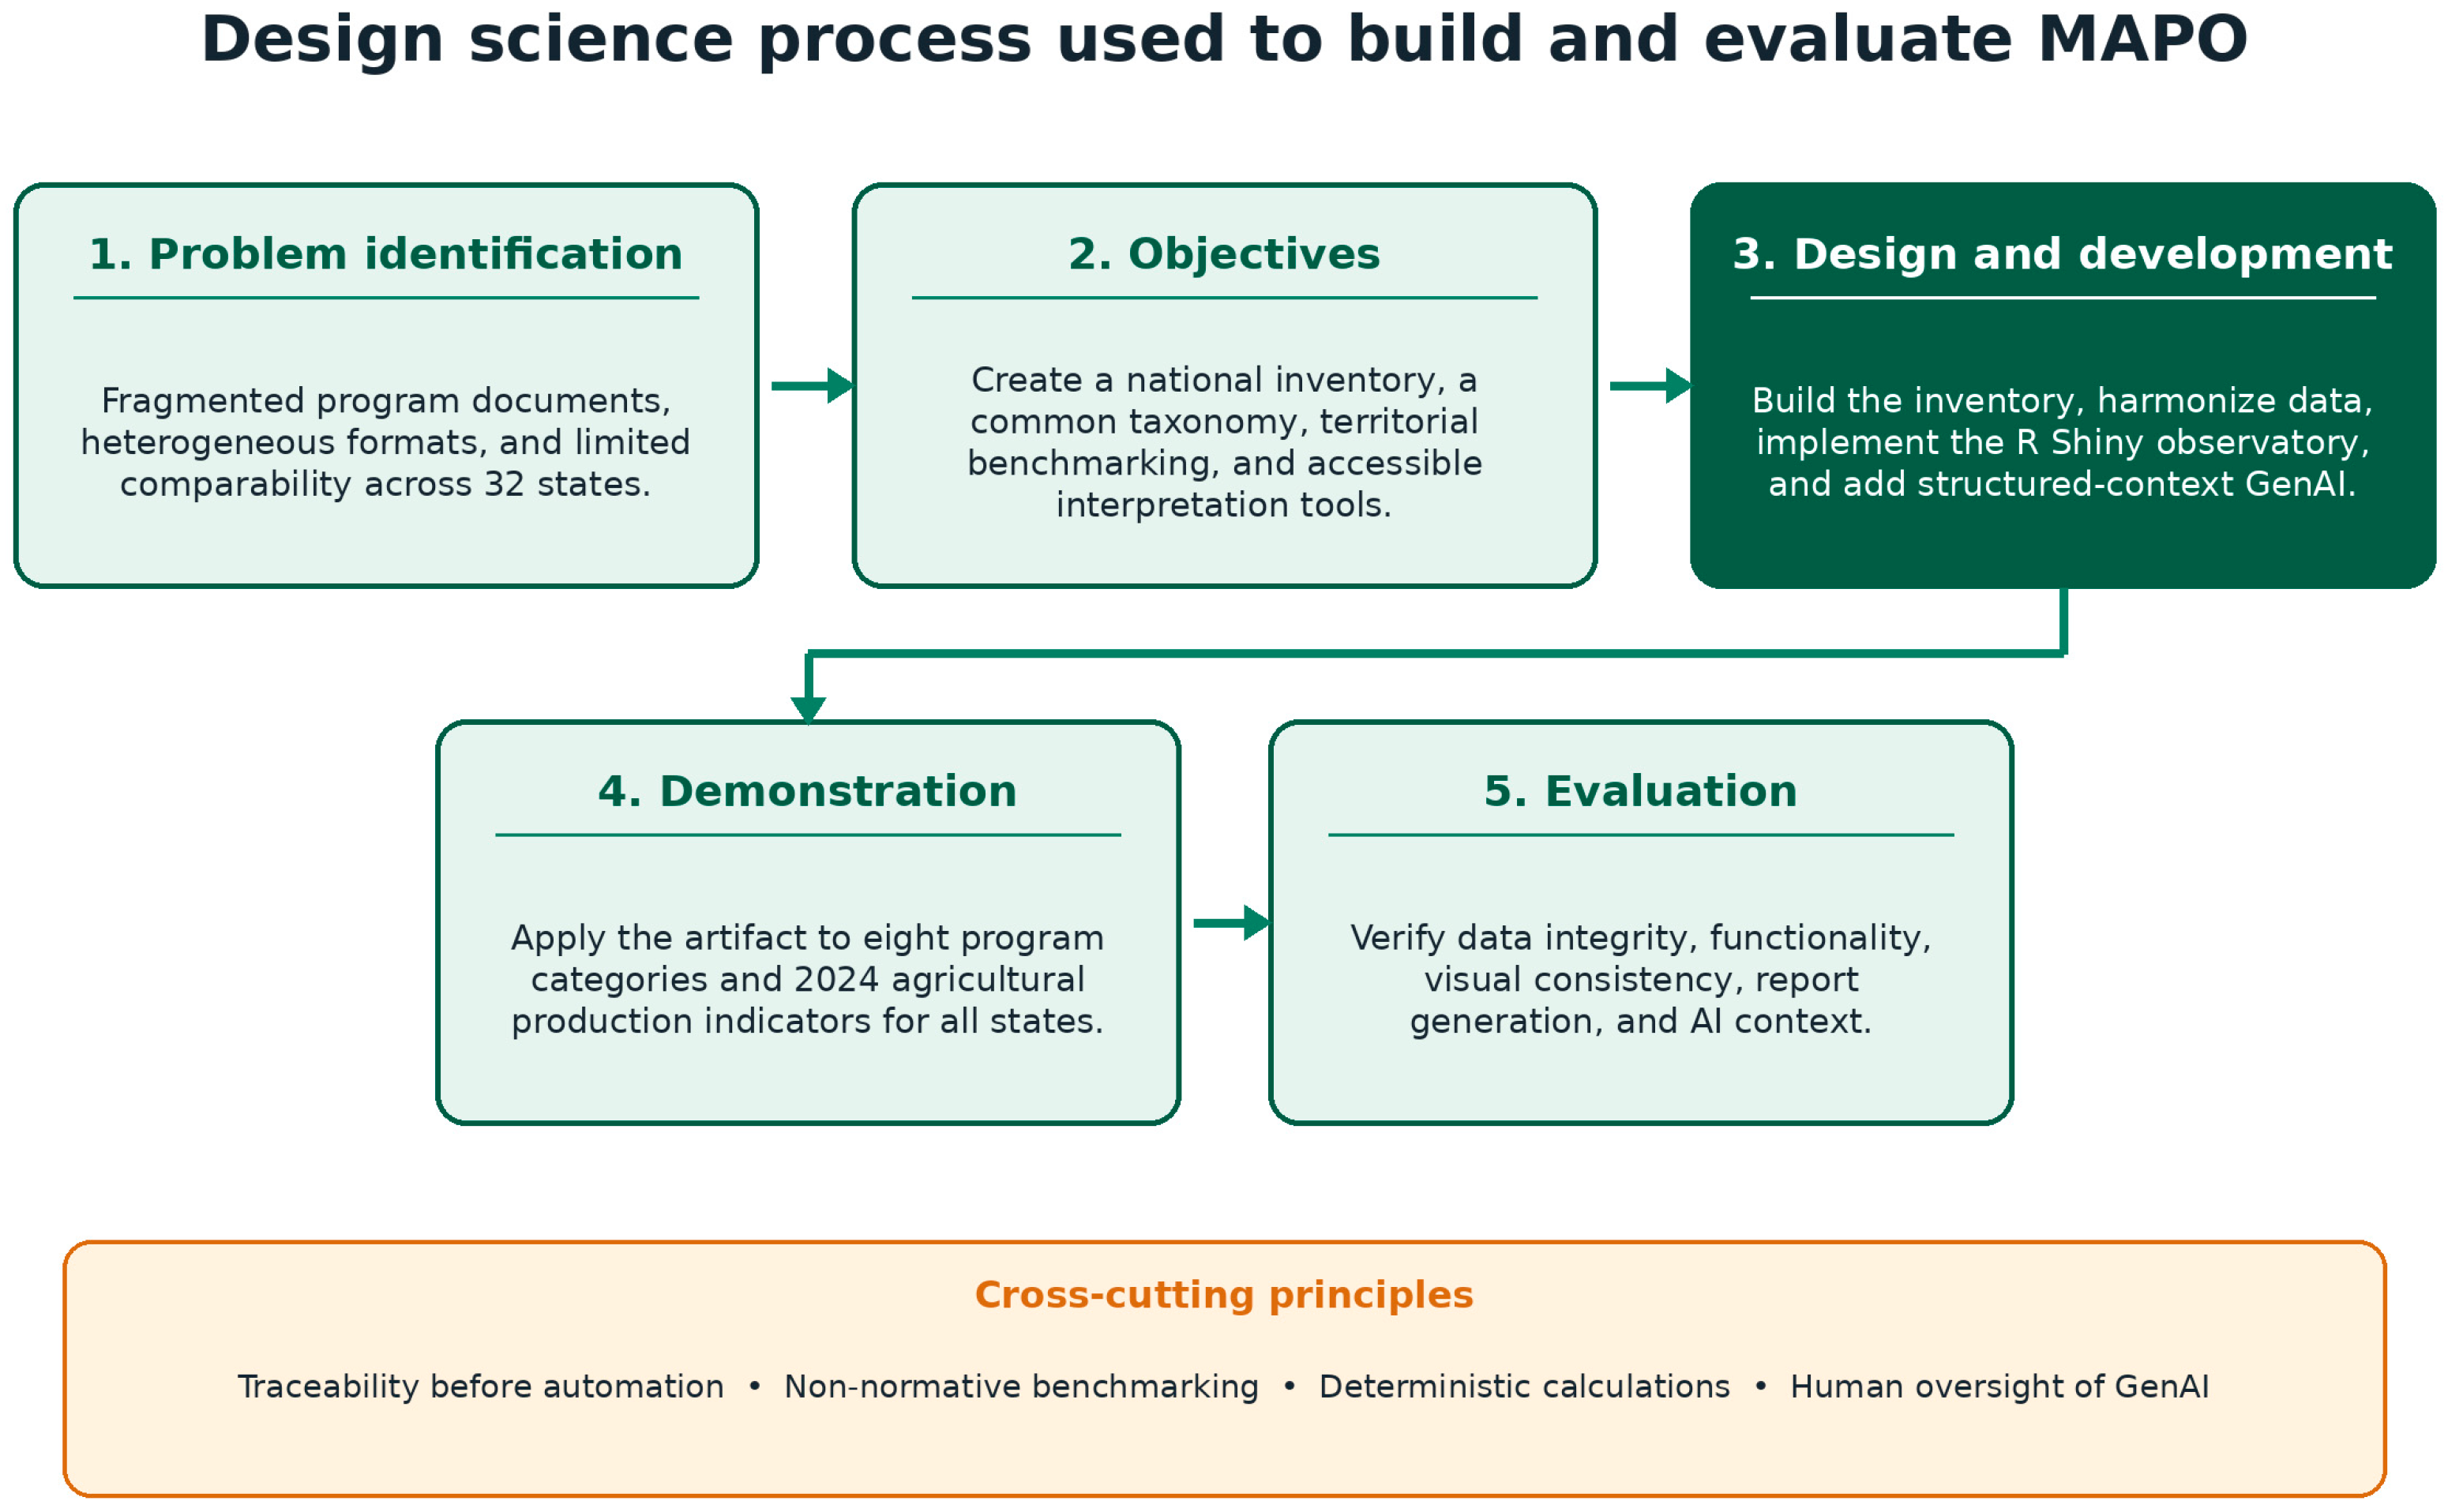
The design was selected because the research problem was not the estimation of a causal effect but the construction and evaluation of a socio-technical artifact for organizing dispersed policy information. The methodological logic follows design science research, in which artifact construction, demonstration, and evaluation are legitimate research activities when they address an organizational problem (Hevner et al., 2004; Peffers et al., 2007), as summarized in Figure 1. Documentary analysis was used to identify and code programmatic records, descriptive statistics were used to summarize the resulting portfolio, comparative benchmarking was used to make state-category differences observable, and functional testing was used to verify the implemented R Shiny artifact. The DSR process followed five operational stages (Figure 1): problem definition, objective definition, artifact development, demonstration with national and state-level data, and evaluation through data-integrity, interface, report-generation, and AI-context checks.
Figure 1.
Design science process used to build and evaluate the Mexican Agricultural Policy Observatory (MAPO). The artifact was developed iteratively, while traceability, non-normative benchmarking, deterministic calculation, and human oversight operated as cross-cutting principles. Colors distinguish artifact-construction activities from cross-cutting governance principles. Source: Authors’ elaboration.
3.2. Data Sources and Analytical Units
Four groups of public sources were integrated: (1) agricultural programs and calls for applications identified from official federal and state sources; (2) agricultural production statistics from the SIAP 2024 Municipal Agricultural Closing dataset; (3) socioeconomic and agricultural context indicators from official sources; and (4) state-level cartography. The data processed by the authors therefore consisted of structured and semi-structured administrative records, textual program descriptions, numerical production indicators, and geospatial state boundaries. Table 1 summarizes the derived analytical bases.
Table 1.
Data sources, analytical units, and uses in MAPO.
3.3. Construction of the Documentary Inventory
The inventory was assembled through a documentary search of official agricultural, rural-development, water, financing, and related agencies in Mexico’s 32 states, complemented by relevant federal sources. The search covered institutional program pages, calls for applications, operating rules, transparency portals, and official publications. The inventory represents the set of public records available and verifiable during the study’s collection and review process, with program years or operating periods recorded when they were present in the source document. Collection was manual in the completed study; automated web scraping remained a future development.
Records were included when they (a) were offered, financed, or endorsed by a public agency; (b) had an explicit connection to agricultural production or associated services; (c) identified an objective, target population, or territory; (d) had a verifiable source; and (e) could be associated with a state or national scope. News items without a defined instrument, unverifiable records, obvious duplicates, and actions whose agricultural relevance could not be established were excluded.
Available fields were organized into five functional groups: source and traceability fields, such as record identifier, source URL, document type, and retrieval notes; institutional fields, such as state, responsible agency, government level, and operating year or period; program-description fields, such as program name, objective, target group, support modality, benefit characteristics, and validity status; classification fields, such as primary category, secondary category, ambiguity notes, and review status; and derived analytical fields used for harmonization, aggregation, and visualization. These variables were chosen according to whether they supported documentary traceability, consistent classification, harmonization, aggregation, visualization, or state-level comparison. Not all fields were used in every analysis; some were retained to preserve source provenance, review notes, and reproducibility.
3.4. Operational Taxonomy and Classification
Programs were assigned to one of eight primary categories based on the dominant intervention mechanism. The program name served as an initial cue, but the decision prioritized the stated objective, eligible concepts, target population, and type of benefit. A secondary category was retained when a relevant complementary component was present. Table 2 presents the operational definitions.
Table 2.
Operational taxonomy for agricultural support instruments.
Ambiguous cases were reviewed using a codebook that specified inclusion rules, exclusions, indicative terms, examples, and boundary cases. Water-specific works were classified as water management even when they involved construction. Instruments were classified as agricultural insurance only when an explicit insurance or risk-transfer mechanism was documented.
Generative AI was used as a supporting tool during the preliminary assignment of thematic categories to previously unclassified records. The tool applied the operational codebook to the available program name, objective, target population, and support-modality fields and returned proposed labels. Cases identified as conflicting or ambiguous were checked against the official source and reviewed manually before the final analytical file was produced. AI output was treated as a coding aid rather than as an autonomous classification decision, and responsibility for the final taxonomy and reported results remained with the authors.
To assess the reliability of the taxonomy, a second coder independently classified a random 20% subsample of the 407-record analytical base (82 records) using a blind file that removed the original primary category. Cohen’s kappa was used as the agreement statistic for this nominal primary-category assignment. The second classification produced 65 agreements and 17 disagreements, corresponding to 79.27% observed agreement, 21.28% expected agreement, and Cohen’s kappa = 0.737. The result indicates substantial agreement while showing that some category boundaries remain interpretively contested.
The documentary inventory contained 429 records. For the territorial and thematic analyses reported in the Section 4, the analytical base was restricted to 407 records with both a recognized state and a validated primary category. Records that did not meet both conditions were retained for documentation but excluded from comparative calculations requiring state-category alignment.
3.5. Data Harmonization and Indicator Construction
State names were converted to canonical identifiers by harmonizing capitalization, spaces, accents, and official long-form variants. Numeric fields were cleaned by removing currency symbols and thousands of separators and by converting textual missing-value codes to explicit missing values. Original files were preserved separately from processed data.
A complete 32-state by 8-category matrix was created so that combinations without identified records were represented as zero rather than omitted. For state s and category c, the observed count was Ns,c. The national category mean and the descriptive gap were calculated as follows:
A positive value indicates a documented count above the national mean for that category and a negative value a count below it. The mean was used as a transparent descriptive reference, not as an optimal standard. State ranks were calculated in descending order, with ties sharing a position.
Production data were obtained from the SIAP 2024 Municipal Agricultural Closing dataset (SIAP, n.d.), which contained 41,574 municipal records. Records were aggregated by state and state–crop combination. Indicators included planted area, harvested area, production value, value per harvested hectare, and leading crops by value. The percentage difference between planted and harvested area was interpreted descriptively and not automatically labeled as loss, because perennial crop cycles can produce large same-year differences without crop failure.
3.6. Digital Artifact and Generative AI Module
The application was implemented in R 4.5.1 (R Core Team, 2025) using Shiny, shinydashboard, dplyr, tidyr, readr, sf (Pebesma, 2018), leaflet, plotly (Sievert, 2020), DT, httr, jsonlite, and pagedown. The artifact included three main navigation modules: (1) a state map and profile, (2) national comparisons, and (3) an AI-assisted policy analyst; a searchable program database was available as a supporting view. A selected state persisted across modules and could be exported as a PDF report.
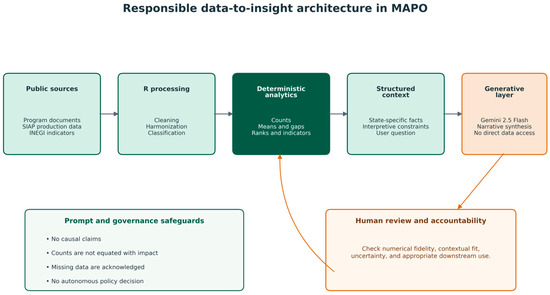
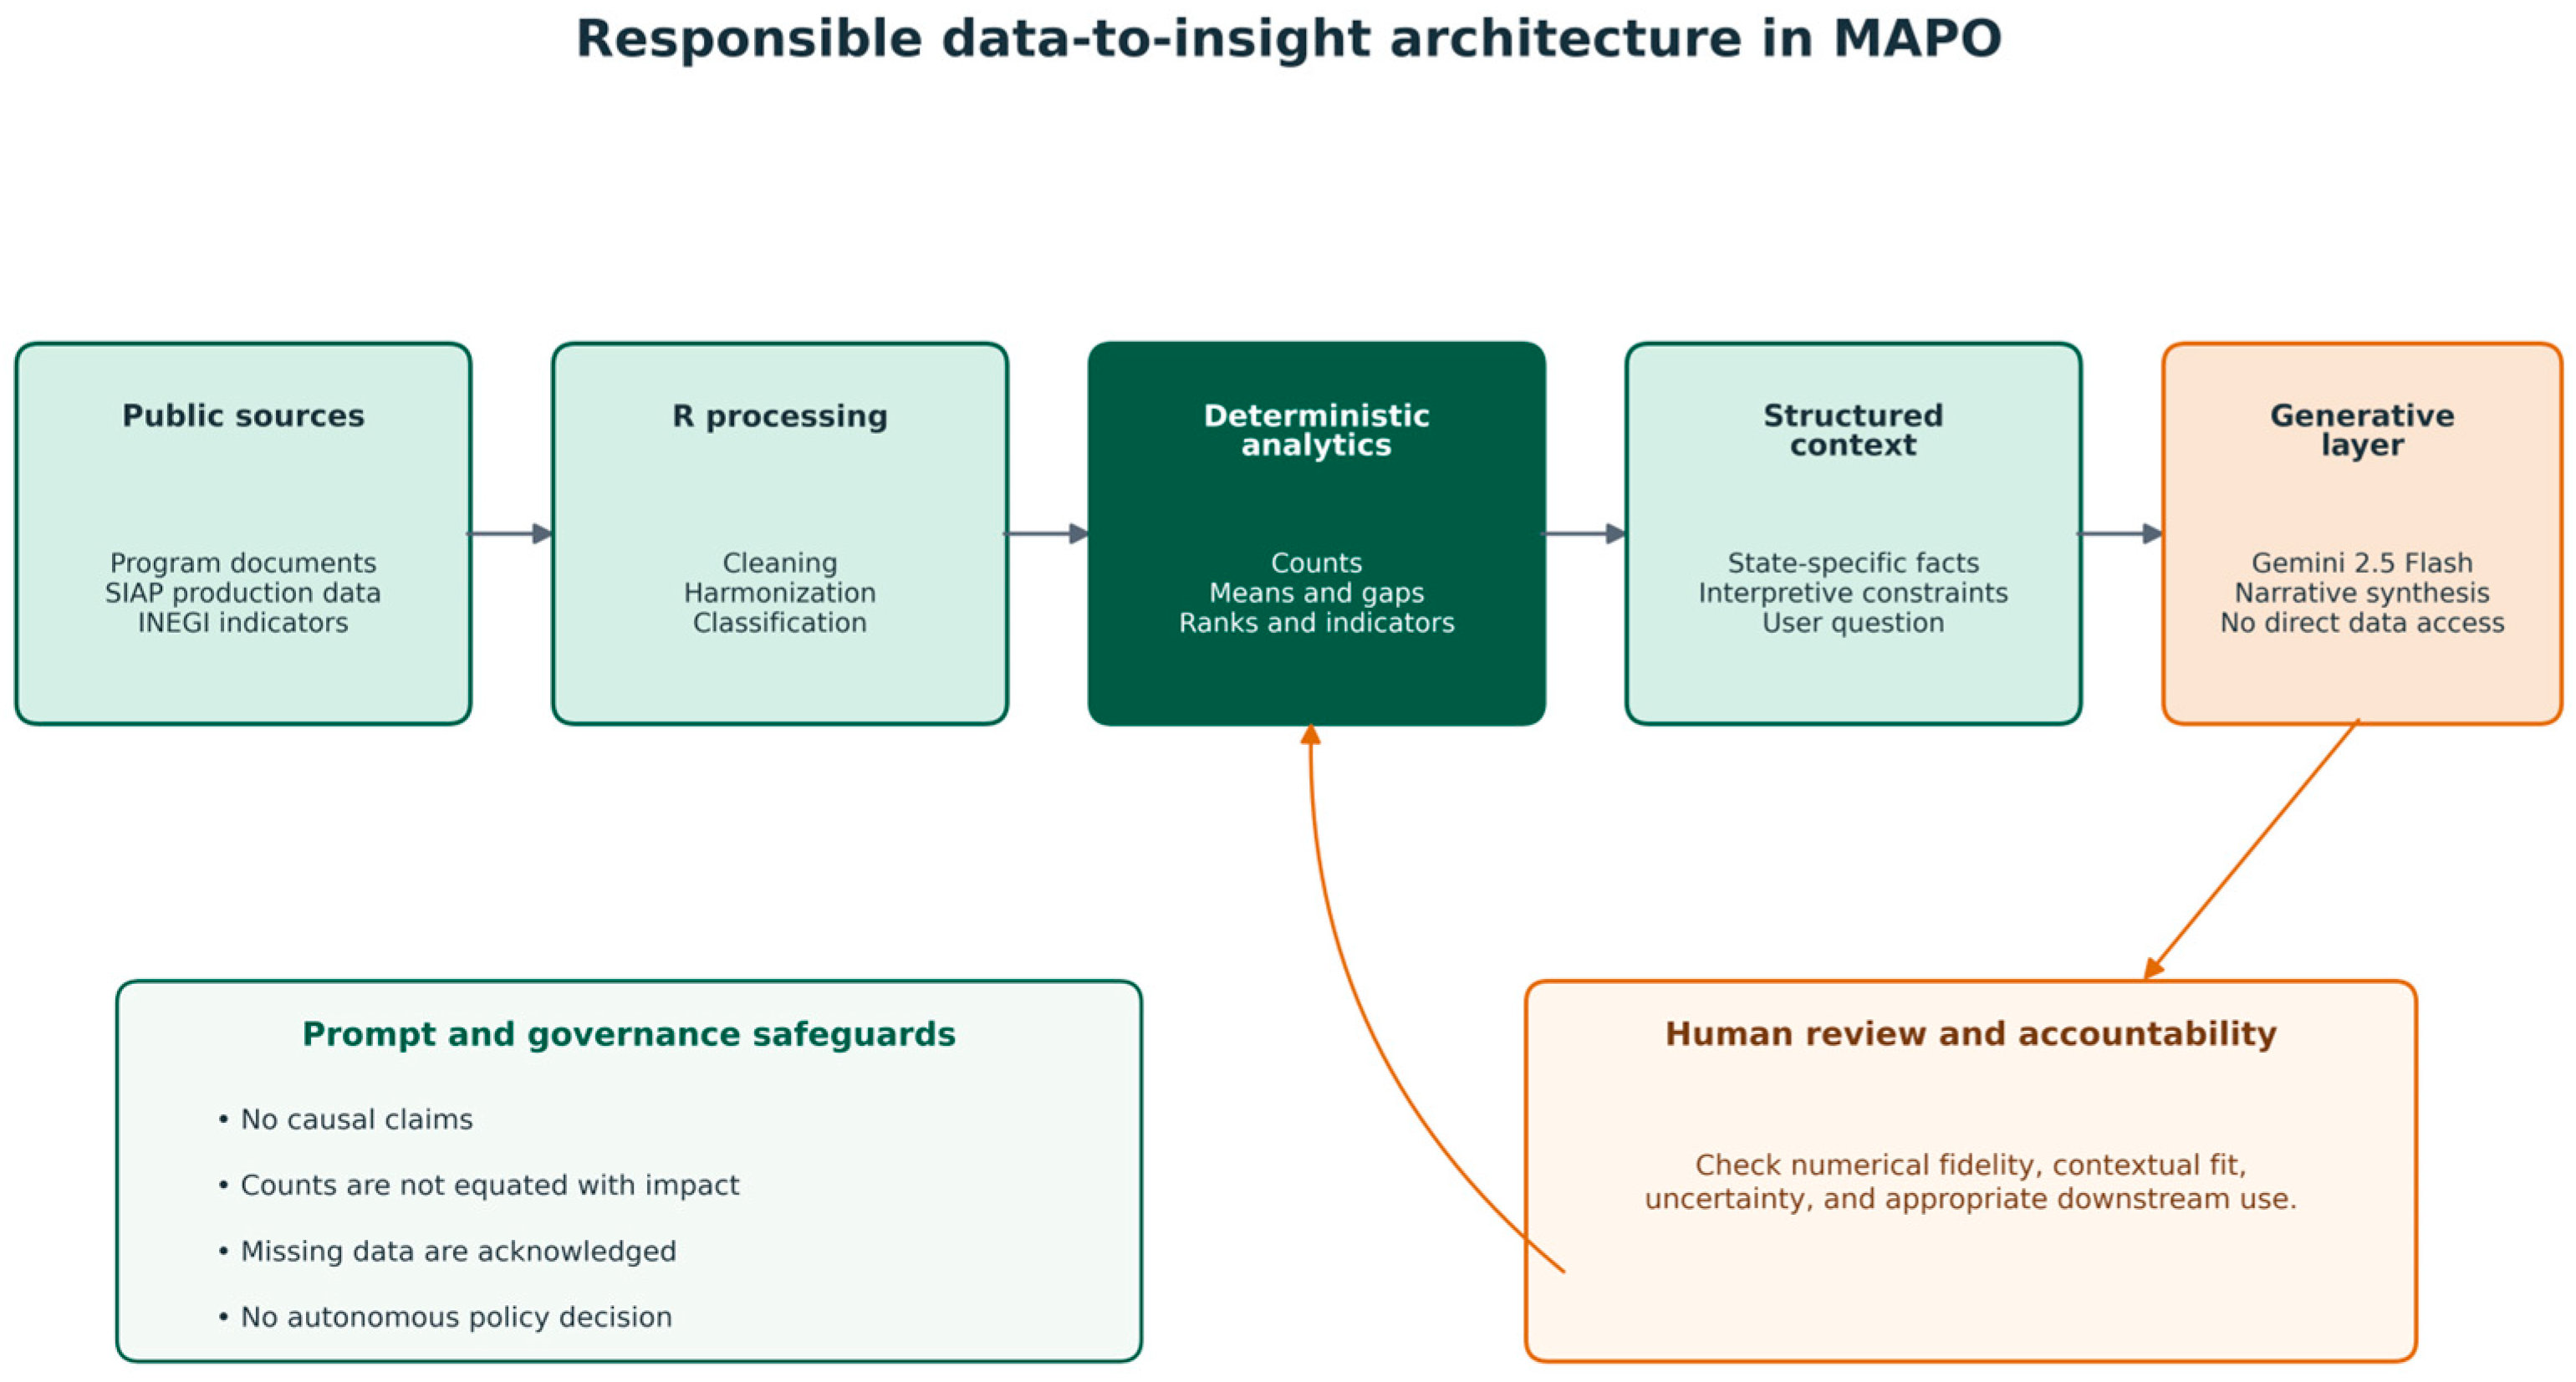
All numerical results were calculated before the GenAI call. For each state, the system assembled a structured context containing program counts by category, category means, descriptive gaps, ranks, production indicators, leading crops, and available contextual variables. The user’s question was appended to this context and submitted to Gemini 2.5 Flash through the Google Generative Language API.
The prompt required the model to distinguish observed results from inference and proposals; avoid causal claims; avoid equating program counts with budget, coverage, quality, or effectiveness; acknowledge missing data; and avoid describing planted–harvested differences as loss without specific evidence. Figure 2 summarizes this responsible data-to-insight architecture. The model did not access original files or browse the internet. Temperature was set to 0.35 to limit stylistic variability, although identical outputs were not expected.
Figure 2.
Responsible data-to-insight architecture in MAPO. Deterministic calculations are separated from the generative layer, and human review is required before narrative outputs are used in reports or decision processes. Colors distinguish data inputs, deterministic processing, generative interpretation, and human review. Source: Authors’ elaboration.
3.7. Validation, Reproducibility, and Ethics
Validation covered data integrity, application initialization, module navigation, state selection, synchronization across views, visual consistency, empty queries, API errors, PDF generation, and correspondence between structured context and generated responses. These were technical and heuristic tests rather than a formal usability study with end users.
Reproducibility was supported by separating raw data, processed bases, code, figures, and outputs. The application verified the presence of required files and columns before execution. The GenAI component was reproducible at the procedural level through preserved prompts, model identifier, API version, parameters, and structured context, but not at the level of identical wording because the service is probabilistic and externally managed.
The study used public documents and aggregated official statistics. It did not process personal data, beneficiary names, or individual-level records. The API key was stored outside the code, and no confidential information was sent to the external model.
4. Results
4.1. Inventory Coverage and Classification
The final inventory contained 429 programmatic records described through variables grouped by source traceability, institutional information, program description, classification, and derived analytical fields. These variables were selected to support traceability, classification, harmonization, and comparative analysis: they documented the source of each record, the responsible institution, territorial scope, program year or period when available, objective, target population, support modality, benefit characteristics, classification decisions, and derived analytical identifiers. For the results reported below, the analytical base was restricted to the 407 records that had both a recognized state and a validated primary category. This decision ensured that national thematic shares, territorial reach, state-category matrices, and descriptive gaps were calculated from the same comparable base. The remaining 22 records were retained in the documentary inventory but excluded from comparative calculations that required both state and category information.
State-level agencies accounted for 314 records (73.2%), while federal institutions contributed 96 records (22.4%). The remaining records lacked a fully harmonized institutional origin. This distribution reflects the emphasis of the collection strategy on programs and calls published by state ministries of agriculture, rural development, and equivalent agencies.
Temporal information was less consistent. A normalized year was available for 216 records (50.3%), while validity status was unavailable or not standardized for most entries. The inventory should therefore be interpreted as a cumulative collection of documented instruments identified during the review period rather than as a synchronized census of programs operating simultaneously.
Each record was assigned to one primary category according to its predominant intervention mechanism. Sixty-nine records (16.1%) also received at least one secondary category because they incorporated complementary mechanisms. The primary-category rule prevented double counting in the comparative indicators, while the secondary categories retained information on program multidimensionality.
4.2. National Thematic Composition
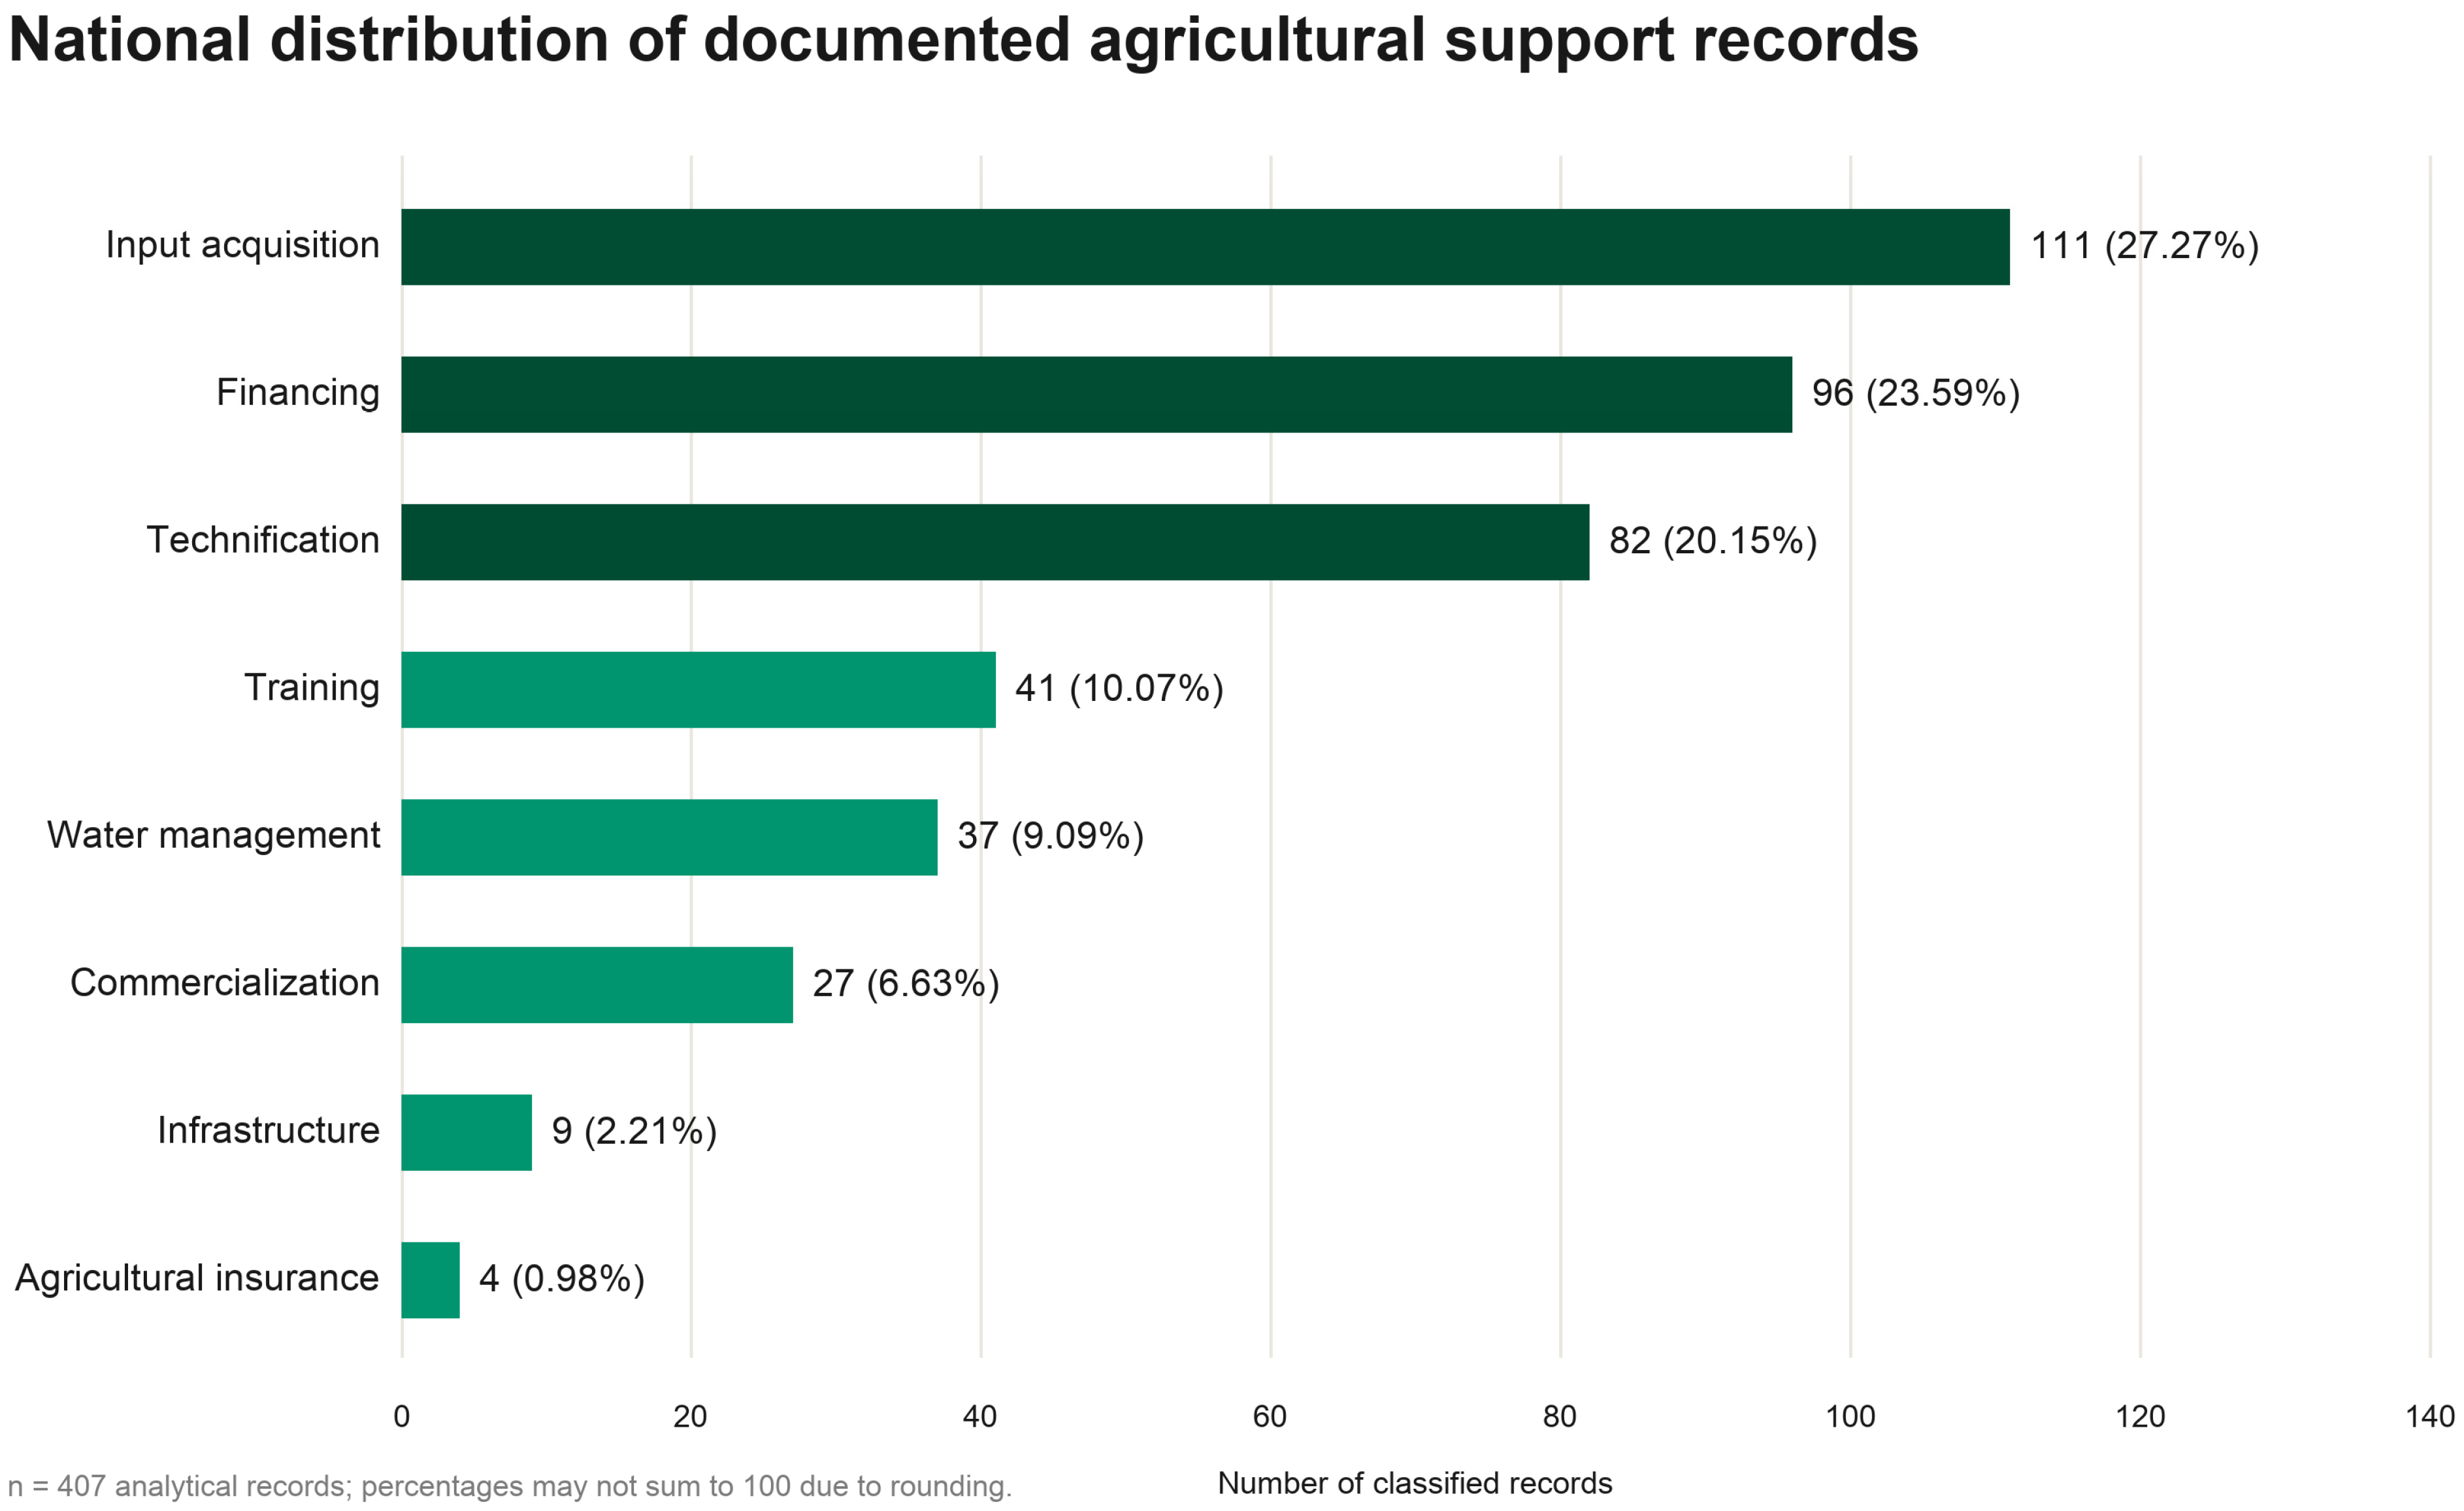
Input acquisition was the most frequent primary category, with 111 records (27.27%), followed by financing with 96 (23.59%) and technification with 82 (20.15%). Together, these three categories accounted for 289 records, or 71.01% of the 407-record analytical base.
Training accounted for 41 records, water management for 37, commercialization for 27, infrastructure for 9, and agricultural insurance for 4. The resulting distribution indicates that the documented portfolio was predominantly oriented toward productive inputs, access to economic resources, and the incorporation of machinery or technology.
The lower frequency of infrastructure and agricultural insurance was partly influenced by the operational definitions used during classification. Water-related works and equipment were assigned to water management when the management of water resources represented the principal objective. Similarly, a record was classified as agricultural insurance only when it explicitly referred to insurance, premiums, coverage, or a risk-transfer mechanism.
Territorial reach also differed across categories. Input acquisition was documented in 29 states, financing in 28, technification in 25, training in 21, water management in 19, commercialization in 15, infrastructure in 5, and agricultural insurance in 4. Figure 3 shows the national distribution of the 407 analytical records by primary category. These values describe the presence of records in the reviewed sources. A zero does not demonstrate that no related governmental action existed, as programs may have been incorporated into broader instruments or may not have been identifiable in the institutional documentation reviewed.
Figure 3.
National distribution of the 407 agricultural support records in the analytical base. Input acquisition, financing, and technification accounted for 71.01% of comparable analytical records. Colors distinguish the eight primary support categories. Source: Authors’ elaboration based on the MAPO inventory.
4.3. Territorial Patterns in Programmatic Volume and Diversity
All 32 states had at least one documented programmatic record in the 407-record analytical base. State-level totals ranged from 3 to 21 records, with a mean of 12.7. This variation indicates that the documented portfolio was unevenly distributed across the national territory, although records were not concentrated exclusively in a small number of states. These descriptive state totals, the state-category matrix, and the benchmark comparisons were calculated from the same 407 records with both a recognized state and a validated primary category. For each category, the benchmark gap was calculated as the state count minus the exact 32-state category mean derived from the Figure 3 totals, and the resulting differences were rounded to two decimals for reporting.
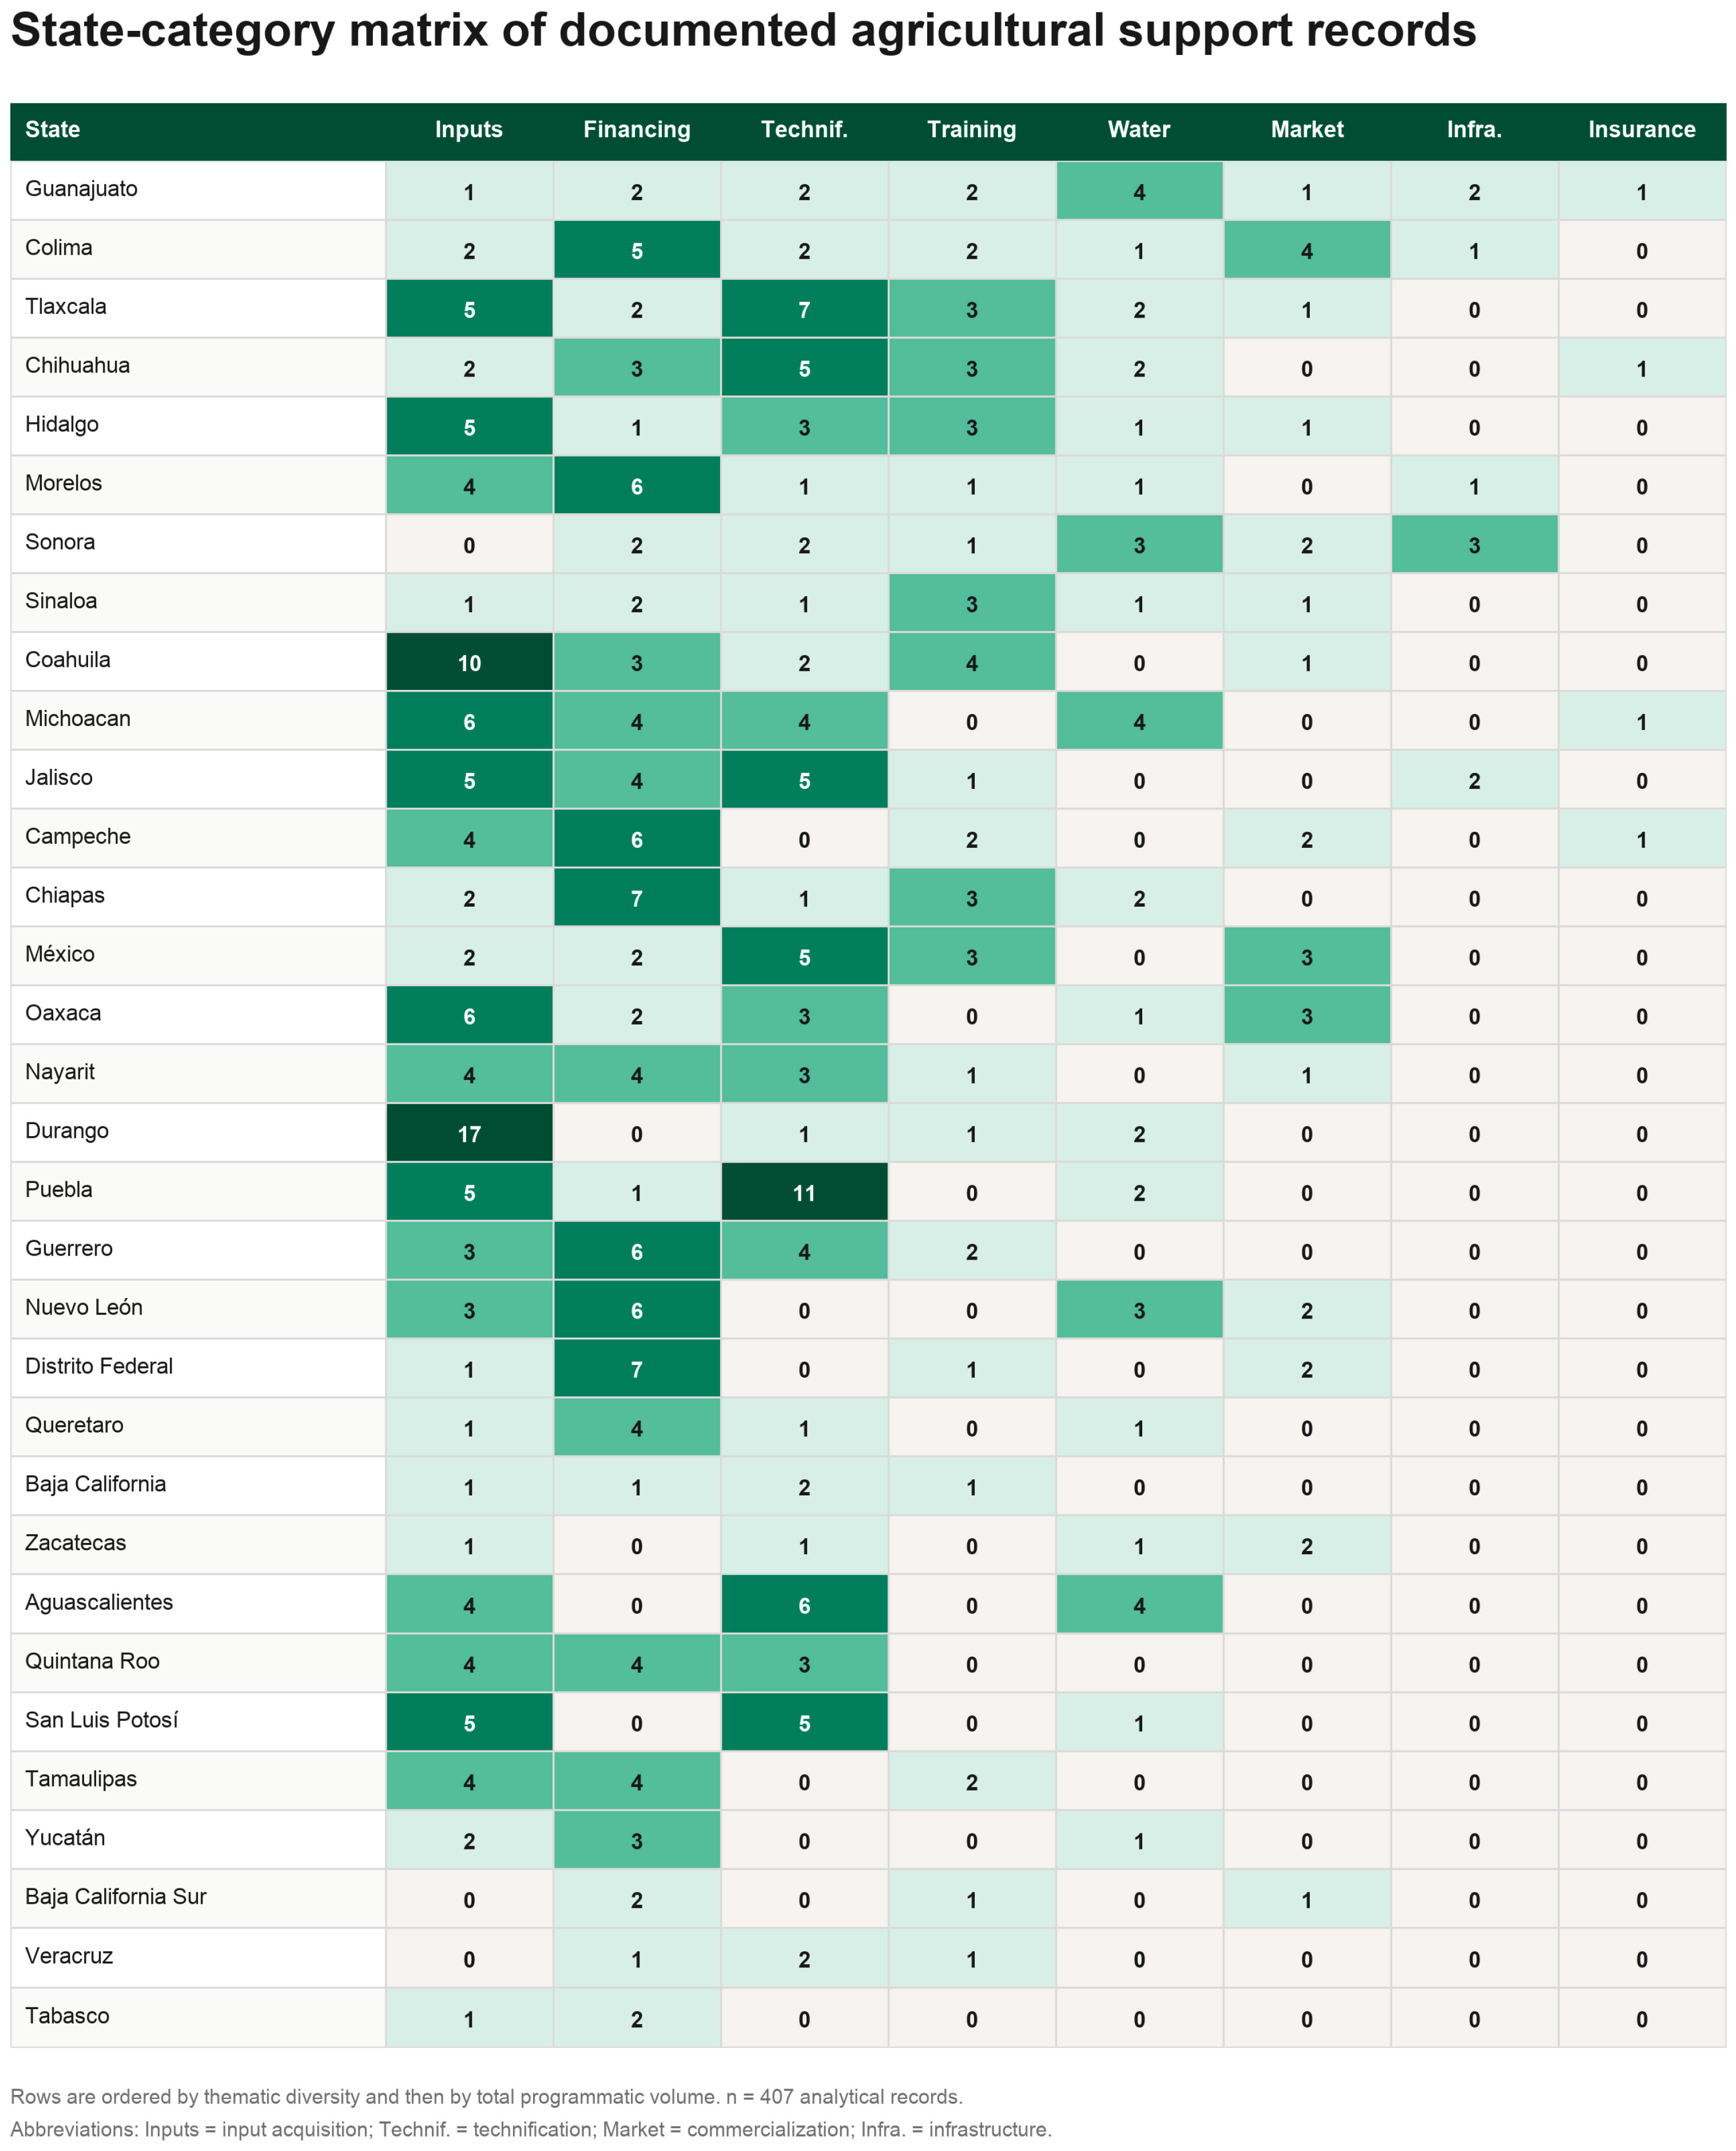
In the 407-record analytical base, the number of thematic categories represented within each state also varied. One state contained records in all eight categories, one contained seven, six states contained six, eight contained five, eight contained four, seven contained three, and one contained two categories. Figure 4 presents these territorial patterns through a state-category matrix that displays the observed number of records for every combination of state and thematic category. The left-hand column lists the states, while the eight remaining columns correspond to the primary categories used in the codebook.
Figure 4.
State-category matrix of documented agricultural support records in Mexico. The left-hand column lists the 32 Mexican states, and the category columns report the number of records identified for each state-category combination. States are ordered by thematic diversity and subsequently by total programmatic volume, while combinations with zero documented records are shown explicitly. The territorial analysis includes 407 records with both a recognized state and a validated primary category. Source: Authors’ elaboration based on the MAPO inventory.
Programmatic volume and thematic diversity did not always coincide. Some states combined relatively high record counts with concentration in a limited number of intervention mechanisms, whereas others displayed fewer records distributed across a broader set of categories. The state–category matrix therefore provided information that could not be captured by total counts alone.
Figure 4 presents the complete state-category matrix. The matrix also made combinations with zero records explicit. These zeros should be interpreted as the absence of an identified record within the reviewed corpus rather than as evidence that no public action existed. Differences may reflect state policy priorities, institutional organization, the aggregation of multiple support mechanisms within broader programs, and variation in the accessibility and structure of governmental information.
4.4. Case Study: Guanajuato
MAPO calculated a descriptive benchmark for each state–category combination using the mean number of records observed across the 32 states. The gap was defined as the difference between the observed state count and the corresponding category mean. Positive values indicated a documented count above the national reference, whereas negative values indicated a count below it.
The platform displayed the observed count, the 32-state mean, the descriptive gap, and the tied rank together. This combined presentation was necessary because ranks alone could overstate differences in categories with few records. In low-frequency categories, a change of only one record could produce a substantial shift in position.
The benchmark was therefore designed as a screening tool rather than as a measure of policy performance. The national mean does not represent an optimal or sufficient number of programs, and a negative gap does not demonstrate an unmet need. Likewise, a positive gap does not establish adequate coverage, budget, coordination, or effectiveness.
To improve interpretation, the programmatic benchmark was integrated with state-level agricultural indicators, including planted and harvested areas, production value, production value per harvested hectare, and leading crops. This contextualization allowed programmatic patterns to be examined alongside the productive structure of each territory.
The productive indicators were not used to infer causal relationships between programs and agricultural outcomes. Instead, they served to identify whether particular programmatic orientations were broadly consistent with the economic and productive characteristics of the state and to formulate questions for subsequent analysis.
Crop-level disaggregation was particularly important when interpreting differences between planted and harvested areas. Perennial crops may remain established for several years before harvest, meaning that an aggregate difference cannot automatically be interpreted as a direct production shortfall or inefficiency. This consideration was incorporated into the analytical rules and into the constraints applied to the AI-generated interpretations.
Guanajuato had 15 documented records distributed across all eight thematic categories. Its largest positive descriptive gap was observed in water management, with four records compared with a 32-state mean of 1.16, resulting in a difference of +2.84. Infrastructure (+1.72), agricultural insurance (+0.88), training (+0.72), and commercialization (+0.16) were also above their corresponding category means. By contrast, technification (−0.56), financing (−1.00), and input acquisition (−2.47) were below the respective national references. These differences are descriptive and should not be interpreted as measures of policy sufficiency, coverage, effectiveness, or unmet need.
Production indicators contextualized these differences. Guanajuato recorded approximately MXN 42.027 billion in agricultural production value in 2024, ranking seventh nationally and representing 4.91% of the national total. Its estimated value per harvested hectare was 28.1% above the national mean. These indicators describe monetary intensity and crop composition; they are not direct measures of efficiency or profitability.
The difference between planted and harvested area illustrates the importance of crop-level contextualization. Approximately 99.4% of Guanajuato’s state-level difference was associated with agave, a perennial crop whose planted area remains established for several years before harvest. Without disaggregation, the aggregate difference could have been interpreted misleadingly as a direct shortfall between planting and harvest. This case informed an explicit prompt constraint in the AI module.
4.5. Interactive Interface and Guided Analytical Workflow
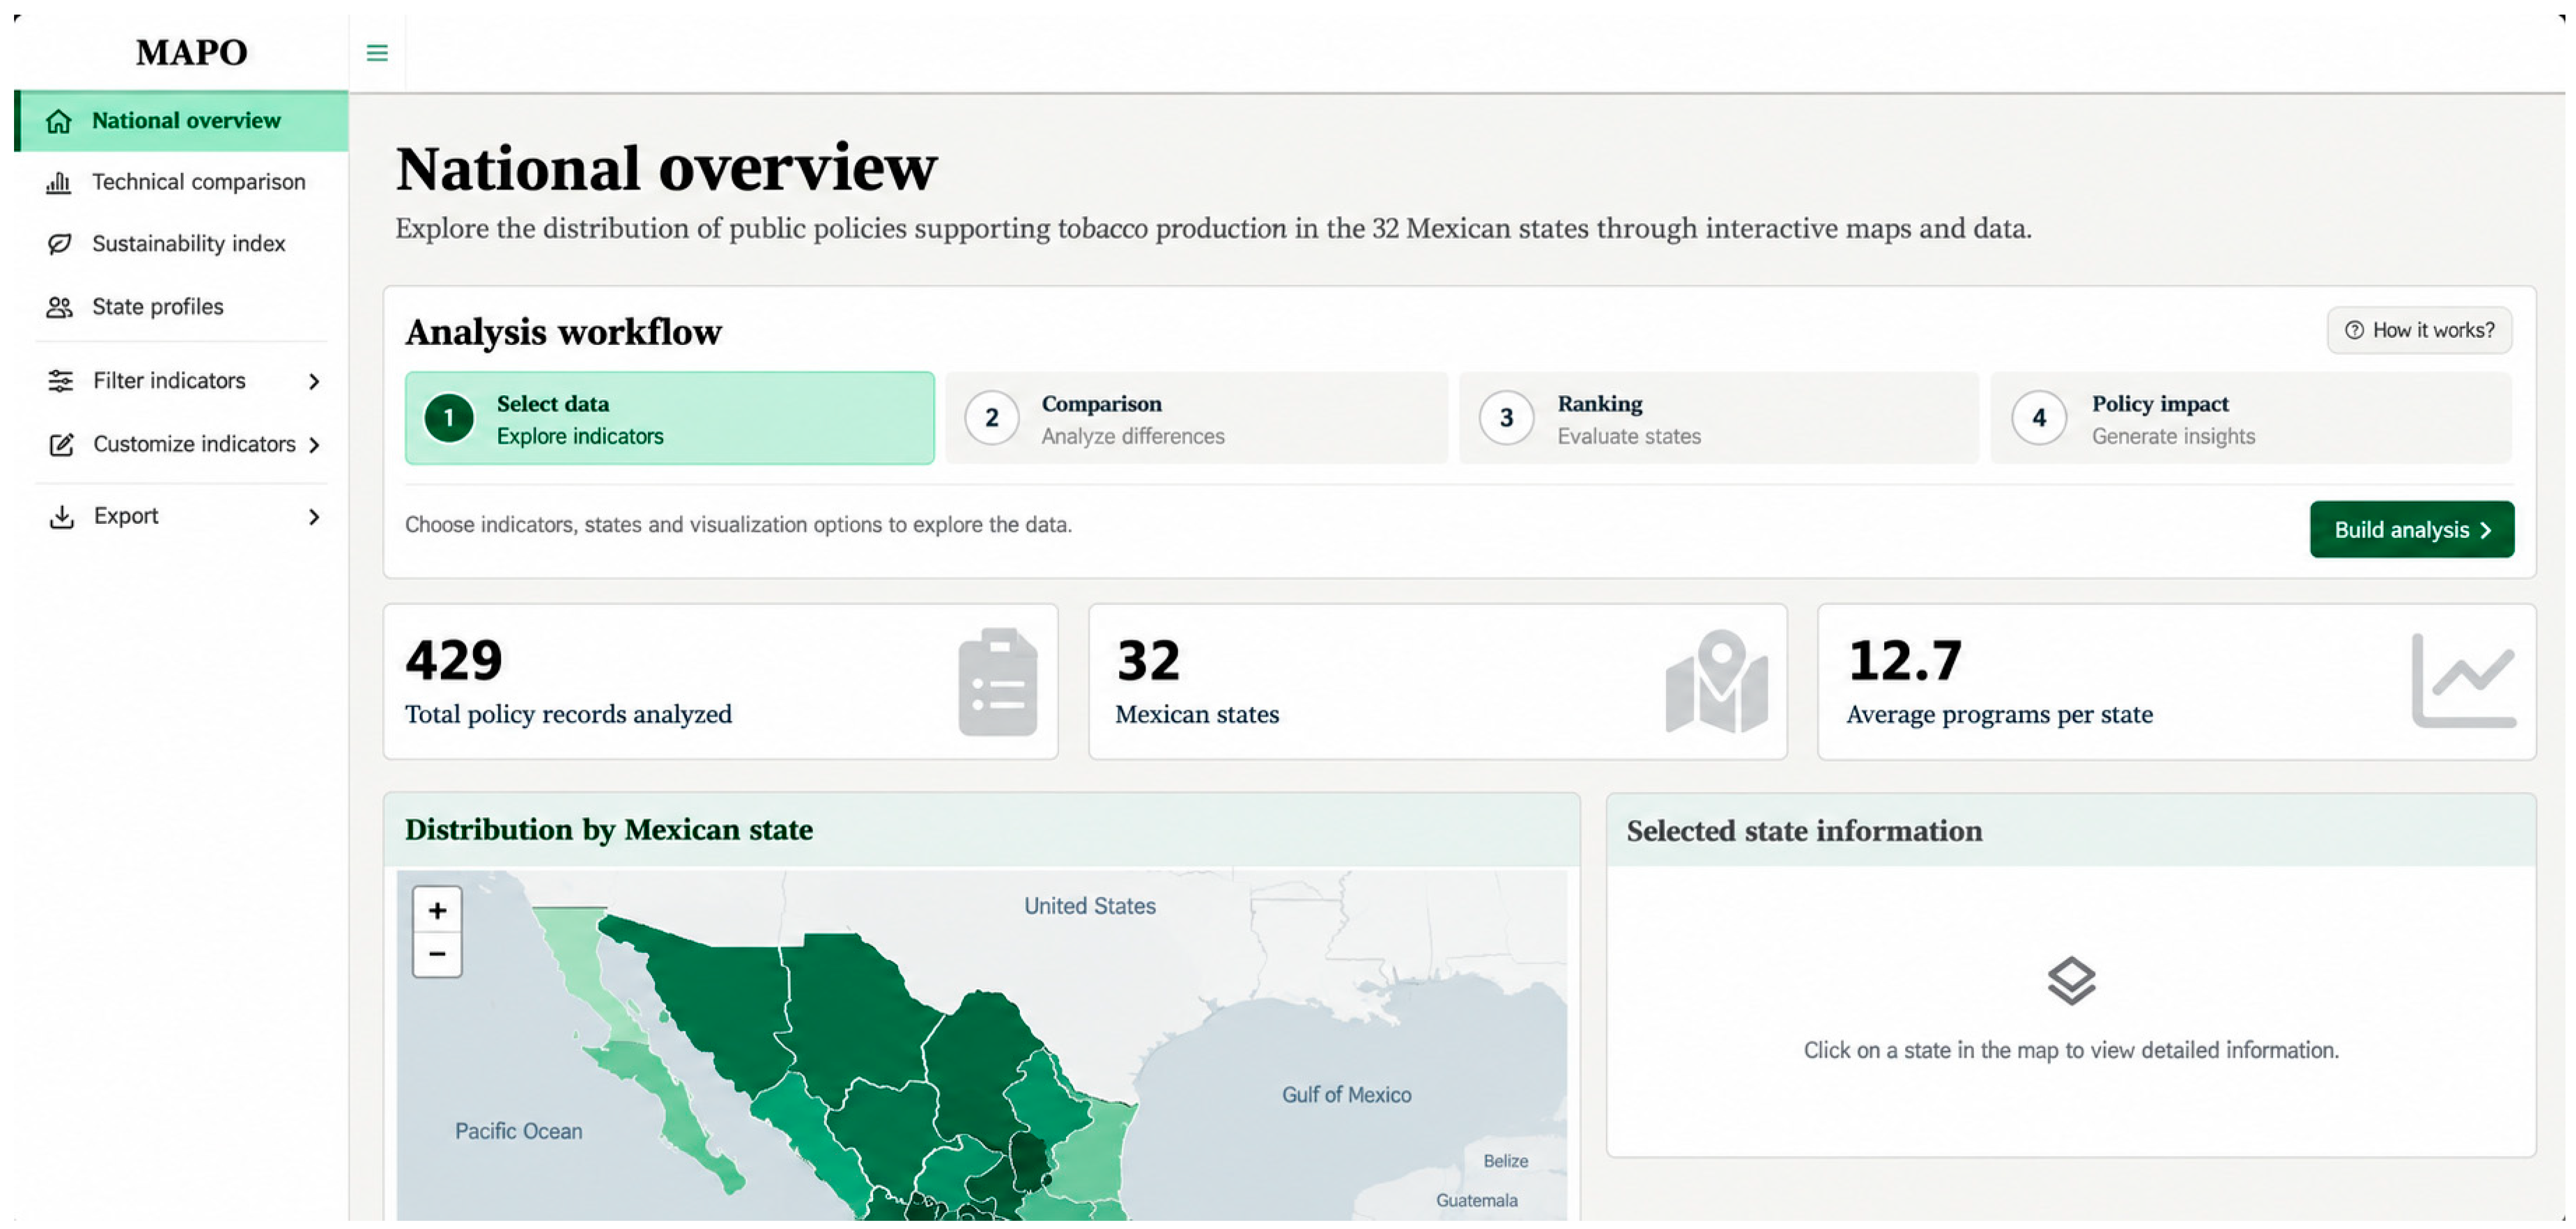
MAPO was implemented as an interactive web application organized around three main modules: Map and state profile, National comparisons, and AI policy analyst. The initial interface provides a national overview of the documented agricultural support portfolio and serves as the main entry point for territorial exploration (Figure 5).
Figure 5.
Initial interface and guided analytical workflow of the Mexican Agricultural Policy Observatory. The national overview presents summary indicators, an interactive choropleth map, state and category filters, and a four-stage workflow connecting territorial selection, national comparison, AI-assisted analysis, and report review. Source: Authors’ elaboration through MAPO.
The interface displays three summary indicators: the total number of records included in the documentary inventory, the number of states covered, and the average number of comparable analytical records per state. In the implemented version, the dashboard reports 429 inventory records, coverage of all 32 Mexican states, and an average of 12.7 comparable records per state. It also identifies the 407-record analytical base used for state-category comparisons.
Territorial exploration is supported by an interactive choropleth map. Users may select a state directly from the map or through the sidebar filter. A second filter allows a thematic category to be highlighted, facilitating the visual examination of the territorial distribution of specific intervention mechanisms. Once a state is selected, the interface retrieves its programmatic and productive profile and displays the corresponding indicators in the adjacent information panel.
To reduce the cognitive burden associated with moving between modules, the platform incorporates a four-stage guided workflow: Select state, Compare, Analyze, and Review report. This sequence connects the state profile with the national comparison, the AI-assisted interpretation, and the final state report. Users may follow this recommended route or navigate freely between modules through the sidebar.
The interface was designed to combine overview and detail within the same analytical environment. National indicators provide an initial point of reference, while filters, maps, state profiles, and comparisons allow progressively more specific exploration. The platform therefore functions not only as a repository of program records, but also as an interactive mechanism for organizing and interpreting territorial information. Figure 5 shows the initial interface and guided workflow. This overview-to-detail structure follows established principles of interactive visual analysis, in which coordinated views and progressive exploration help users move from general patterns to specific records (Heer & Shneiderman, 2012).
4.6. Artifact Implementation and Functional Validation
The implemented artifact integrated the full documentary inventory, state and crop production data, an interactive choropleth map, state profiles, national comparisons, a searchable table, AI-assisted interpretation, and downloadable PDF reports. The system recognized only the eight validated categories in analytical views, while preserving unclassified records in the documentary base.
Technical validation confirmed that all 429 source records were retained after processing, identifiers were unique, the permitted category set contained eight labels, and records without a recognized state or validated primary category were excluded only from analyses that required those fields. Application startup returned the expected general indicators: 429 inventory records, 407 comparable analytical records, 32 states, and eight categories.
State selection updated the map, profile, comparison views, structured AI context, and PDF report consistently. The report combined deterministic indicators with a clearly separated narrative section. Error handling covered empty prompts, failed connections, empty model responses, non-successful API codes, processing exceptions, and repeated clicks during generation.
The validation demonstrated functional feasibility and internal consistency. It did not establish end-user usability, institutional adoption, decision quality, or realized public value. Table 3 summarizes the main empirical and functional results.
Table 3.
Summary of the main empirical and functional results.
4.7. Bounded Audit of GenAI Outputs
A bounded audit was conducted to examine whether the structured prompt constraints were reflected in the AI policy analyst’s generated responses. The audit used five standardized questions across ten states, covering priority gaps, production interpretation, planted-harvested differences, water management and sustainability, and the limits of program counts. The resulting 50 outputs were generated and coded as a bounded evaluation of the AI policy analyst module.
Each valid output was coded for five failure modes: misalignment with the standardized question, numerical fidelity problems, causal claims, count-to-impact equivalences, and unflagged missing data. Unsolicited policy prescriptions were tracked separately because they may be substantively useful but exceed the bounded descriptive task. Table 4 reports the bounded audit results. The audit results indicate that the prompt constraints performed unevenly. Causal language and unsolicited policy prescriptions remained frequent, while a direct count-to-impact equivalence appeared in one output. These results confirm that structured-context prompting reduces but does not eliminate over-interpretation.
Table 4.
Bounded audit of GenAI outputs generated by the AI policy analyst module.
5. Discussion
5.1. From Data Aggregation to Policy Intelligence
MAPO’s principal contribution is not the accumulation of program records or the display of isolated indicators. It is the construction of a common informational layer through which documented program supply, territorial distribution, and productive context can be examined together. This layer reduces the search, cleaning, and interpretation costs that previously had to be absorbed independently by each analyst or institution.
The result supports the data-driven public-sector perspective advanced by the OECD (2019): administrative value emerges when records are governed, connected, documented, and reused rather than simply published. It also clarifies the boundary between information integration and policy integration. MAPO does not coordinate agencies, harmonize budgets, or make policy instruments coherent. It creates the visibility required to formulate more precise questions about coordination, coherence, and territorial alignment.
Accordingly, the concentration of documented records in input acquisition, financing, and technification should be interpreted as a property of the audited inventory rather than as evidence that agricultural policy is overinvested in these areas. The low counts for infrastructure and agricultural insurance likewise reflect the classification rules, program architecture, and accessibility of the reviewed sources. The observatory’s analytical value lies in making such patterns visible while repeatedly delimiting what the data cannot establish.
5.2. Design Principles for Public-Sector Observatories
The MAPO case yields five design principles that can inform observatories in other fragmented and multilevel policy domains (Table 5). Together, these principles connect data governance, semantic comparability, interpretive restraint, and accountability in the use of GenAI.
Table 5.
Design principles derived from the MAPO case.
The first principle—establishing traceability before automation—is especially relevant to public innovation projects under pressure to scale rapidly. MAPO used manual collection, explicit inclusion rules, source URLs, and separation between raw and processed data before considering automated scraping. This sequence reduces the risk of reproducing unstable classifications or undocumented errors at scale.
The second and third principles balance comparability with epistemic restraint. Assigning one primary category made the 32-by-8 matrix possible, while secondary labels preserved evidence that many instruments were multidimensional. In the same way, descriptive gaps made territorial variation observable without converting the national mean into an optimal policy threshold. These design choices are necessary because a clear visualization can otherwise appear more conclusive than the underlying data justify.
The fourth and fifth principles define the accountability boundary of the generative component. The language model receives state-specific facts that were calculated and verified beforehand; it is not the source of authoritative numerical results. Prompt restrictions, uncertainty disclosure, and mandatory human review do not eliminate error, but they make responsibility and the origin of claims more visible.
5.3. Implications for Public Management and Digital Transformation
For public managers, MAPO provides a way to move from isolated program lists to portfolio-level questions. A state can examine why a category is unusually concentrated, whether a lower count may reflect integrated instruments, and which additional variables are necessary before interpreting a difference as a policy concern. The artifact therefore supports agenda setting and diagnostic planning rather than automatic resource allocation.
The implementation also illustrates that digital transformation occurs through the redesign of information practices, not through the addition of a single advanced technology. George and Wooden (2023) argue that AI adoption must be strategically aligned with institutional goals and assessed in terms of both benefits and risks. In MAPO, the relevant transformation is the linkage of documentary review, semantic normalization, benchmarking, geospatial exploration, guided navigation, and natural-language interpretation within a single workflow. This integrated approach is also consistent with evidence that fragmented tool use can constrain digital collaboration and that AI should be embedded within broader organizational transformation practices (Stankevičė & Egerland, 2026).
Sustaining this workflow will require organizational capabilities as well as technical infrastructure. Babashahi et al. (2024) emphasize adaptability, continuous learning, and balanced technical and non-technical skills, while Murire (2024) highlights leadership, communication, and cultural alignment during AI-driven change. These findings suggest that institutional adoption of MAPO would require training users to interpret descriptive gaps, question generated narratives, recognize missing data, and maintain the documentary inventory. Public value remains conditional until these capabilities and real administrative uses are evaluated.
5.4. Responsible Use of Generative AI
The structured-context approach allowed MAPO to produce state-specific narratives without granting the language model access to the original files or authority over the calculations. The Guanajuato demonstration shows why this separation matters: an aggregate planted-harvested difference can be interpreted misleadingly without crop-level evidence, whereas disaggregation identified the role of a perennial crop and informed an explicit prompt restriction.
Grounding and prompt controls nevertheless do not eliminate hallucination, selective emphasis, or variation between responses. NIST guidance treats generative AI risk management as a continuing process of governance, measurement, documentation, and accountability (Autio et al., 2024; Tabassi, 2023), while the literature on foundation models and model cards underscores the need to document intended use, evaluation boundaries, and known limitations (Bommasani et al., 2021; Mitchell et al., 2019). The bounded audit reported in Section 4.7 supports this interpretation. The model frequently produced causal language and unsolicited policy prescriptions, while a direct count-to-impact equivalence appeared in one output. The results therefore support the feasibility of a constrained architecture while showing that prompt constraints remain insufficient without human review and continuing evaluation.
The appropriate role of GenAI in MAPO is interpretive mediation. It can reduce the distance between a complex analytical object and a user who does not work directly with databases or code, but it should not define the evidence, calculate official indicators, or make autonomous recommendations. The architecture therefore treats human review as part of the system rather than as an optional safeguard added after generation.
5.5. Limitations and Future Research
The study has seven principal limitations. First, the inventory depends on the accessibility and persistence of institutional sources, so missing records cannot be treated as proven absence of governmental action. Second, year and validity were not documented uniformly, and the inventory is not a synchronized annual census. Third, program counts do not incorporate budget, beneficiaries, municipal coverage, duration, or implementation intensity. Fourth, assigning a primary category simplifies instruments with multiple components. Fifth, the classification reliability checks produced substantial agreement (Cohen’s kappa = 0.737), although some category boundaries remain contested and should be refined in future rounds. Sixth, evaluation was primarily technical and heuristic. The GenAI audit adds bounded evidence about generated outputs, although it remains a first-pass technical audit rather than a full user study or expert review of policy usefulness. Seventh, the benchmarking proportions, state gaps, and thematic shares should be interpreted as a documented snapshot of the sources reviewed. They may change as institutional portals are updated, records are removed or added, or additional source documents become available.
Future development should normalize institutional names and operating periods, establish a recurring update and change-detection protocol, incorporate budgetary and coverage variables, and preserve versioned snapshots so that changes in benchmarking proportions, state gaps, and thematic shares can be distinguished from changes in source availability. The completed Cohen’s kappa test should be used to adjudicate disagreements and refine boundary rules, especially where instruments combine financing, input delivery, technification, infrastructure, or water-management components. The same audit trail should preserve any AI-proposed labels, human-reviewed labels, and change reasons so that the proportion of AI proposals modified during review can be reported. The completed GenAI audit should also be replicated periodically and, where possible, coded by two reviewers to strengthen reliability evidence for generated responses. Municipal-level analysis could add spatial precision, but only if reliable information is available on the territories in which statewide programs operate.
A subsequent user study should examine task completion, navigation, interpretation of gaps and ranks, perceived usefulness, trust, report clarity, and willingness to use the AI-assisted outputs. Sousa et al. (2024) demonstrate the relevance of perceived advantages, disadvantages, emotions, and privacy concerns to AI acceptance. Longitudinal implementation research could then assess whether the organizational capabilities identified by Babashahi et al. (2024) and the cultural and leadership conditions emphasized by Murire (2024) influence whether MAPO changes search costs, interagency dialogue, evidence use, or program design.
6. Conclusions
This study demonstrates the feasibility of transforming fragmented public records into a traceable digital observatory for comparative policy analysis. Its main contribution is the collection, classification, and visualization of dispersed Mexican agricultural and agri-food policy information at a scale that is not otherwise available in a single public repository. MAPO integrated a 429-record documentary inventory and used a 407-record analytical base with both recognized state and validated primary categories for national thematic shares, territorial comparisons, descriptive gaps, and the Guanajuato case.
The empirical results revealed a documented portfolio concentrated in input acquisition, financing, and technification, together with substantial territorial variation in program counts and thematic diversity. These patterns are useful as diagnostic signals and starting points for institutional inquiry, but they do not measure policy sufficiency, budget, beneficiary coverage, implementation quality, or impact.
The broader contribution is methodological and organizational. Public-sector observatories should prioritize traceability, explicit semantic rules, descriptive rather than normative comparisons, deterministic analytics, and human-supervised generative interpretation. The literature on AI adoption further indicates that such systems require strategic alignment, user trust, continuous learning, leadership, and cultural adaptation; technical implementation alone does not ensure institutional value.
MAPO currently functions as an infrastructure for exploration, communication, and agenda setting. Its consolidation as an institutional instrument will depend on periodic data governance, richer coverage variables, formal user-centered evaluation, systematic auditing of generated responses, and evidence that the platform improves real administrative practices without displacing human judgment.
Author Contributions
R.A.R.-O.: Conceptualization, Software, Data Curation, Visualization, Writing—Original Draft. J.A.R.-H.: Conceptualization, Investigation, Validation, Writing—Review and Editing. P.C.I.-L.: Conceptualization, Investigation, Supervision, Writing—Review and Editing. R.A.R.-C.: Investigation, Supervision, Methodology. L.M.O.C.: Formal Analysis, Resources, Visualization. O.T.P.: Funding Acquisition, Project Administration, Supervision, Writing—Original Draft. G.R.U.: Data Curation, Formal Analysis, Methodology. All authors have read and agreed to the published version of the manuscript.
Funding
This research was funded by the Secretariat of Science, Humanities, Technology, and Innovation, postdoctoral fellowship, grant number I1200/320/2022.
Institutional Review Board Statement
Not applicable.
Informed Consent Statement
Not applicable.
Data Availability Statement
The data presented in this study were compiled from publicly available information published by federal and state agricultural secretariats of Mexico, the National Institute of Statistics and Geography (INEGI), and the Agri-Food and Fisheries Information Service (SIAP). Data are available from the official websites of each institution and were accessed during January–August 2025. Further details are available upon request from the corresponding author.
Conflicts of Interest
The authors declare no conflicts of interest.
Note
| 1 | This article is an expanded and substantially revised version of a conference paper. The present study introduces an eight-category operational codebook, a complete audit of the program inventory, 2024 production data, state-level descriptive benchmarking, functional validation, and an implemented structured-context GenAI module. All descriptive results were recalculated using the final audited dataset and supersede the preliminary conference estimates. |
References
- Autio, C., Schwartz, R., Dunietz, J., Jain, S., Stanley, M., Tabassi, E., Hall, P., & Roberts, K. (2024). Artificial intelligence risk management framework: Generative artificial intelligence profile (NIST AI 600-1). National Institute of Standards and Technology. [CrossRef] [Scilit]
- Babashahi, L., Barbosa, C. E., Lima, Y., Lyra, A., Salazar, H., Argôlo, M., de Almeida, M. A., & de Souza, J. M. (2024). AI in the workplace: A systematic review of skill transformation in the industry. Administrative Sciences, 14(6), 127. [Google Scholar] [CrossRef] [Scilit]
- Behn, R. D. (2003). Why measure performance? Different purposes require different measures. Public Administration Review, 63(5), 586–606. [Google Scholar] [CrossRef] [Scilit]
- Bommasani, R., Hudson, D. A., Adeli, E., Altman, R., Arora, S., von Arx, S., Bernstein, M. S., Bohg, J., Bosselut, A., Brunskill, E., Brynjolfsson, E., Buch, S., Card, D., Castellon, R., Chatterji, N., Chen, A., Creel, K., Davis, J. Q., Demszky, D., … Liang, P. (2021). On the opportunities and risks of foundation models. arXiv. [Google Scholar] [CrossRef] [Scilit]
- Cejudo, G. M., & Michel, C. L. (2017). Addressing fragmented government action: Coordination, coherence, and integration. Policy Sciences, 50(4), 745–767. [Google Scholar] [CrossRef] [Scilit]
- Deligiannis, A. P., & Peristeras, V. (2025). Pioneering public sector innovation: The case of Greece’s e-government team. Administrative Sciences, 15(8), 306. [Google Scholar] [CrossRef] [Scilit]
- George, B., & Wooden, O. (2023). Managing the strategic transformation of higher education through artificial intelligence. Administrative Sciences, 13(9), 196. [Google Scholar] [CrossRef] [Scilit]
- Heer, J., & Shneiderman, B. (2012). Interactive dynamics for visual analysis. Communications of the ACM, 55(4), 45–54. [Google Scholar] [CrossRef] [Scilit]
- Hevner, A. R., March, S. T., Park, J., & Ram, S. (2004). Design science in information systems research. MIS Quarterly, 28(1), 75–105. [Google Scholar] [CrossRef] [Scilit]
- Howlett, M., & Rayner, J. (2007). Design principles for policy mixes: Cohesion and coherence in “new governance arrangements. Policy and Society, 26(4), 1–18. [Google Scholar] [CrossRef] [Scilit]
- Janssen, M., Brous, P., Estevez, E., Barbosa, L. S., & Janowski, T. (2020). Data governance: Organizing data for trustworthy artificial intelligence. Government Information Quarterly, 37(3), 101493. [Google Scholar] [CrossRef] [Scilit]
- Lewis, P., Perez, E., Piktus, A., Petroni, F., Karpukhin, V., Goyal, N., Küttler, H., Lewis, M., Yih, W.-t., Rocktäschel, T., Riedel, S., & Kiela, D. (2020). Retrieval-augmented generation for knowledge-intensive NLP tasks. Advances in Neural Information Processing Systems, 33, 9459–9474. [Google Scholar]
- Mergel, I., Edelmann, N., & Haug, N. (2019). Defining digital transformation: Results from expert interviews. Government Information Quarterly, 36(4), 101385. [Google Scholar] [CrossRef] [Scilit]
- Mitchell, M., Wu, S., Zaldivar, A., Barnes, P., Vasserman, L., Hutchinson, B., Spitzer, E., Raji, I. D., & Gebru, T. (2019, January 29–31). Model cards for model reporting [Conference session]. Proceedings of the Conference on Fairness, Accountability, and Transparency (pp. 220–229), Atlanta, GA, USA. [Google Scholar] [CrossRef] [Scilit]
- Murire, O. T. (2024). Artificial intelligence and its role in shaping organizational work practices and culture. Administrative Sciences, 14(12), 316. [Google Scholar] [CrossRef] [Scilit]
- OECD. (2019). The path to becoming a data-driven public sector. OECD Publishing. [Google Scholar] [CrossRef] [Scilit]
- OECD. (2020a). Building capacity for evidence-informed policy-making: Lessons from country experiences. OECD Publishing. [Google Scholar] [CrossRef] [Scilit]
- OECD. (2020b). The OECD digital government policy framework: Six dimensions of a digital government (OECD Public Governance Policy Papers No. 2). OECD Publishing. [Google Scholar] [CrossRef]
- OECD. (2024). Governing with artificial intelligence: Are governments ready? (OECD Artificial Intelligence Papers No. 20). OECD Publishing. [Google Scholar] [CrossRef] [Scilit]
- Pebesma, E. (2018). Simple features for R: Standardized support for spatial vector data. The R Journal, 10(1), 439–446. [Google Scholar] [CrossRef] [Scilit]
- Peffers, K., Tuunanen, T., Rothenberger, M. A., & Chatterjee, S. (2007). A design science research methodology for information systems research. Journal of Management Information Systems, 24(3), 45–77. [Google Scholar] [CrossRef] [Scilit]
- Phillips, L. (2018). Improving the performance of sub-national governments through benchmarking and performance reporting (OECD Working Papers on Fiscal Federalism No. 22). OECD Publishing. [Google Scholar] [CrossRef]
- R Core Team. (2025). R: A language and environment for statistical computing (Version 4.5.1) [Computer software]. R Foundation for Statistical Computing. Available online: https://www.R-project.org/ (accessed on 1 September 2025).
- Romero-Hidalgo, J. A., Rodríguez-Ojeda, R. A., Isiordia-Lachica, P. C., & Rodríguez-Carvajal, R. A. (2026). The Mexican Agricultural Policy Observatory (MAPO): A digital governance tool for evidence-based public policy. Proceedings, 140(1), 4. [Google Scholar] [CrossRef] [Scilit]
- Servicio de Información Agroalimentaria y Pesquera. n.d. Producción agrícola. Secretaría de Agricultura y Desarrollo Rural. Available online: https://www.gob.mx/agricultura/dgsiap/acciones-y-programas/produccion-agricola-404122 (accessed on 24 September 2026).
- Sievert, C. (2020). Interactive web-based data visualization with R, Plotly, and Shiny. CRC Press. [Google Scholar] [CrossRef] [Scilit]
- Soares, L. C., Ferneda, E., & do Prado, H. A. (2022). Transportation and logistics observatories: Guidelines for a conceptual model. Transportation Research Interdisciplinary Perspectives, 16, 100682. [Google Scholar] [CrossRef] [Scilit]
- Sousa, A. E., Cardoso, P., & Dias, F. (2024). The use of artificial intelligence systems in tourism and hospitality: The tourists’ perspective. Administrative Sciences, 14(8), 165. [Google Scholar] [CrossRef] [Scilit]
- Stankevičė, I., & Egerland, J. M. (2026). AI-augmented digital collaboration improvement framework for sustainable digital transformation. Administrative Sciences, 16(1), 15. [Google Scholar] [CrossRef] [Scilit]
- Tabassi, E. (2023). Artificial intelligence risk management framework (AI RMF 1.0) (NIST AI 100-1). National Institute of Standards and Technology. [CrossRef] [Scilit]
- Twizeyimana, J. D., & Andersson, A. (2019). The public value of e-government: A literature review. Government Information Quarterly, 36(2), 167–178. [Google Scholar] [CrossRef] [Scilit]
- Vatamanu, A. F., & Tofan, M. (2025). Integrating artificial intelligence into public administration: Challenges and vulnerabilities. Administrative Sciences, 15(4), 149. [Google Scholar] [CrossRef] [Scilit]
- Waara, Å. (2025). Examining digital government maturity models: Evaluating the inclusion of citizens. Administrative Sciences, 15(3), 73. [Google Scholar] [CrossRef] [Scilit]
- Wilkinson, M. D., Dumontier, M., Aalbersberg, I. J., Appleton, G., Axton, M., Baak, A., Blomberg, N., Boiten, J. W., da Silva Santos, L. B., Bourne, P. E., Bouwman, J., Brookes, A. J., Clark, T., Crosas, M., Dillo, I., Dumon, O., Edmunds, S., Evelo, C. T., Finkers, R., … Mons, B. (2016). The FAIR guiding principles for scientific data management and stewardship. Scientific Data, 3, 160018. [Google Scholar] [CrossRef] [Scilit] [PubMed]
- World Bank. (2021). World development report 2021: Data for better lives. World Bank. [Google Scholar] [CrossRef] [Scilit]

Disclaimer/Publisher’s Note: The statements, opinions and data contained in all publications are solely those of the individual author(s) and contributor(s) and not of MDPI and/or the editor(s). MDPI and/or the editor(s) disclaim responsibility for any injury to people or property resulting from any ideas, methods, instructions or products referred to in the content. |
© 2026 by the authors. Licensee MDPI, Basel, Switzerland. This article is an open access article distributed under the terms and conditions of the Creative Commons Attribution (CC BY) license.