


Abstract
Wastewater analysis has emerged as a powerful tool for wastewater-based epidemiology, environmental surveillance, and monitoring of emerging contaminants. While most studies rely on targeted approaches focusing on predefined compound lists, untargeted metabolomics offers potential to capture a broader and less biased chemical snapshot. However, the complexity of wastewater matrices and the chemical diversity of small molecules pose analytical challenges. In this study, we apply a multi-platform, untargeted metabolomics workflow to profile the influent wastewater metabolome of five wastewater treatment plants in Spain, differing in geographic context, population size, and industrial activity. Twenty-four-hour composite samples were collected in three seasons and analyzed using gas chromatography, reversed-phase liquid chromatography, and hydrophilic interaction liquid chromatography, all coupled to mass spectrometry. A total of 828 unique compounds were annotated across platforms, with minimal overlap, highlighting the complementarity of analytical approaches and extraction strategies. Multivariate analyses revealed reproducible site-associated chemical patterns consistent across seasons and platforms. Dominant contributors included lipids, organic acids, organic oxygen compounds, organoheterocyclic compounds, and benzenoids, reflecting differences in population and human activity. This work demonstrates the feasibility of a multi-platform untargeted workflow for generating complementary and reproducible comparative profiles of wastewater influent. The resulting public dataset is intended as a methodological and exploratory comparative resource, and broader spatial and longitudinal validation is required before generalization or use for source attribution.
1. Introduction
Wastewater contains a complex mixture of small molecules originating from human excreta, domestic product use, food consumption, industrial activities, and environmental inputs. As a result, wastewater analysis has gained increasing attention as a tool for wastewater-based epidemiology, environmental monitoring, and the detection of emerging contaminants [1,2]. Traditionally, most wastewater studies have relied on targeted analytical methods aimed at specific compound classes, such as pharmaceuticals [3,4], illicit drugs [5], pesticides [6], or industrial chemicals [7]. While these approaches offer high sensitivity and quantitative accuracy, they are inherently limited to predefined compound lists and may overlook unexpected or previously unrecognized constituents.
Untargeted metabolomics provides an alternative strategy by enabling the broad, hypothesis-free detection of small molecules in complex matrices. Advances in high-resolution mass spectrometry (HRMS), combined with improved chromatographic separations and data-processing tools, have made untargeted workflows increasingly accessible [8]. However, applying untargeted metabolomics to wastewater remains challenging due to extreme chemical complexity, wide concentration ranges, limited availability of reference standards, and difficulties in compound identification and interpretation.
One strategy to improve coverage and robustness in untargeted metabolomics is the use of multiple, complementary analytical platforms, because each separation and ionization strategy accesses a different region of chemical space [9]. Nontarget wastewater studies have demonstrated the value of HRMS for treatment-process evaluation and environmental profiling, and recent multichromatographic workflows have broadened the range of detectable wastewater contaminants [10,11]. Nevertheless, systematic application of GC-MS, RPLC-MS, and HILIC-MS to the same set of wastewater influent samples, followed by an integrated cross-platform comparison, remains limited. The novelty of the present study is therefore methodological and comparative rather than instrumental: the same samples were subjected to complementary extraction and separation workflows, conservative MSI-based annotation, and cross-platform statistical evaluation across multiple sites and seasons.
Multiplatform metabolomics has been shown to improve metabolome coverage and confidence because individual techniques capture only subsets of the chemical space [9]. In wastewater, nontarget HRMS has been used to evaluate treatment processes and transformation products [10,12]. More recently, LC, SFC, and GC×GC-HRMS have been combined to broaden contaminant coverage in wastewater effluents [11]. These studies demonstrate the value of orthogonal analyses, but they also highlight the continuing need for harmonized sample preparation, annotation confidence, and integrated comparison across platforms.
Beyond analytical considerations, the interpretation of untargeted wastewater metabolomics data depends strongly on the scientific objective. Such datasets can be used for diverse purposes, including the characterization of baseline chemical fingerprints, comparison of geographic regions, assessment of temporal or seasonal variability, and retrospective suspect screening [13,14]. Clearly defining the analytical aim is therefore essential to avoid overinterpretation, particularly when sample numbers are limited.
In this study, we apply a multi-platform, untargeted metabolomics approach to influent wastewater samples collected from five WWTPs located in Catalonia (Spain). The selected WWTPs serve populations of different sizes and are characterized by varying degrees of industrial influence. Samples were collected during three seasons (winter, spring, and summer) to evaluate temporal variability alongside spatial differences. The primary objective of this work is to assess whether combining GC-MS, RPLC-MS, and HILIC-MS enables the generation of reproducible, site-associated chemical fingerprints of wastewater influent, rather than exhaustive metabolite identification or definitive source attribution.
By systematically comparing analytical platforms and exploring spatial and seasonal patterns, this study aims to (i) demonstrate the complementarity and analytical reproducibility of multi-platform untargeted metabolomics in wastewater analysis, (ii) evaluate whether recurring site-associated patterns can be observed within the present dataset, and (iii) provide a public exploratory dataset that can support future targeted and suspect-screening investigations. The study is not intended to establish a universal wastewater metabolome or to provide definitive source attribution.
2. Materials and Methods
2.1. Sample Collection
Twenty-four-hour composite wastewater samples were collected from the inlets of five wastewater treatment plants located within the provinces of Barcelona and Girona, Catalonia. Sampling was conducted across three distinct campaigns (winter, spring, and summer), yielding one sample per site for each campaign. Samples were obtained via automatic water samplers and subsequently transported to the laboratory at 4 °C. These specific samples were utilized in a prior proteomic analysis by our research group [15]; however, the present metabolomics assessment constitutes an independent and complementary investigation.
Available contextual descriptors for the five WWTPs are summarized in Table 1. Detailed information on industrial sectors, campaign-specific influent flow, rainfall, transient population, and discharge composition was not available. Consequently, the categories ‘urban’, ‘industrialized’, and ‘urban + industrialized’ are used only as broad contextual descriptors and were not included as causal variables in the statistical model.
Table 1.
WWTP used in this study, province at which each belongs, and population and predominant industry characteristics referring to each them.
2.2. Sample Preparation
Each 24-h composite wastewater sample (up to 100 mL) was centrifuged at 4000× g and 10 °C for 20 min, and the supernatant was passed through 0.2-µm membrane filters (VWR, Radnor, PA, USA). To reduce sample volume, the filtrates were lyophilized, reconstituted in 1 mL of 50% methanol, and evaporated to dryness using a vacuum concentrator SpeedVac (SPD130DLX Vacuum Concentrator, Thermo Fisher Scientific, Waktham, MA, USA).
For analysis, a 25 mL aliquot of each sample from every campaign was thawed for 10 min and reconstituted in 1.5 mL of 50% methanol. Each sample was subsequently subdivided into 300 µL and 60 µL aliquots (5 mL and 1 mL in the original volume) in quadruplicate, evaporated to dryness using a vacuum concentrator (Labconco Corporation, Kansas City, MO, USA), and stored at −80 °C until extraction.
Compounds were extracted using a modified methyl-tert-butyl (MTBE) protocol based on the method described by Matyash et al. (2008) [16]. First, 975 µL of ice-cold 3:10 MeOH/MTBE with internal standard mix (see Supporting Information: Untargeted_Metabolomics_WWTP.pdf/Table S1) was added to each sample, followed by vortexing, shaking and sonication. Next, 188 µL of LC/MS grade water was added followed by a second round of vortexing and sonication. Last, samples were centrifuged at 14,000× g for 2 min, resulting in 3 distinct fractions: an upper organic phase, a bottom aqueous phase and a precipitated pellet. The organic phase was divided into two aliquots of 350 µL each for RPLC-MS analysis. Likewise, the aqueous phase was split into two 110 µL aliquots for GC-MS and HILIC-MS analyses. All extracts were subsequently dried using a CentriVap concentrator (Labcondo Corporation, Kansas City, MO, USA).
2.3. Mass Spectrometry Analysis
For RPLC-MS and HILIC-MS analyses, data were collected on Q-TOF and TripleTOF mass spectrometers operated in data-dependent acquisition (DDA) mode, allowing MS/MS spectra to be acquired for a selected subset of detected features. The resulting fragmentation spectra were subsequently compared with the public spectral libraries MoNA and NIST20 using MS-DIAL for metabolite annotation. GC-MS data were acquired using electron ionization (EI), which produces characteristic fragmentation spectra during MS1 acquisition. These spectra were then matched against established EI spectral libraries for compound identification.
The dataset generated in this study has been deposited in the NIH Common Fund’s National Metabolomics Data Repository (NMDR) website, the Metabolomics Workbench, under Study ID ST004671 and can be accessed through Project https://doi.org/10.21228/M8Q56D. The NMDR work is supported by NIH grant U2C-DK119886 and OT2-OD030544 grants [17].
2.3.1. Reversed-Phase Liquid Chromatography Coupled to Mass Spectrometry (RPLC-MS)
Dried extracts were reconstituted in 110 µL of a 90:10 (v/v) methanol solution containing 50 ng/mL 12-(cyclohexylcarbamoylamino)-dodecanoic acid (CUDA) as an internal standard. Chromatographic separation was performed using a Waters Acquity Premier BEH C18 VanGuard FIT column (2.1 × 50 mm, 1.7 µm; Waters Corporation, Milford, MA, USA) equipped with a matching VanGuard FIT pre-column (2.1 × 5 mm, 1.7 µm; Waters Corporation, Milford, MA, USA). The column temperature was maintained at 65 °C, and the flow rate was set to 0.8 mL/min.
For positive electrospray ionization (ESI), mobile phase A consisted of 60:40 (v/v) acetonitrile:water containing 10 mM ammonium formate and 0.1% formic acid, while mobile phase B comprised 90:10 (v/v) isopropanol:acetonitrile with the same additives. In negative ESI mode, both mobile phases contained 10 mM ammonium acetate as the sole additive, with no formic acid included. Injection volumes were 3 µL for positive ionization mode and 10 µL for negative ionization mode.
Mass spectrometric analysis was carried out using an Agilent 6546 Q-TOF mass spectrometer (MS; Agilent Technologies Inc., Santa Clara, CA, USA) coupled to an Agilent 1290 Infinity ultra-high-performance liquid chromatography (UHPLC; Agilent Technologies Inc., Santa Clara, CA, USA) system. Data were acquired in both positive and negative ESI (electrospray ionization modes using data-dependent acquisition (DDA).
2.3.2. Gas Chromatography Coupled to Mass Spectrometry (GC-MS)
Before GC-MS analysis, the samples underwent a derivatization procedure. Initially, they were reconstituted in 10 µL of MeOx (methoxyamine hydrochloride) and incubated for 1.5 h at 30 °C under agitation at 750 rpm. Subsequently, 90 µL of MSTFA (N-methyl-N-(trimethylsilyl)-trifluoroacetamide) containing a mixture of 13 fatty acid methyl ester (FAME) internal standards (see Supporting Information: Untargeted_Metabolomics_WWTP.pdf/Table S3) was added. The samples were then shaken for an additional 30 min at 37 °C and 750 rpm.
Chromatographic separation was carried out using a Restek RTX-5Sil MS column (30 m length, 0.25 mm i.d., and 0.25 μm 95% dimethyl 5% diphenyl polysiloxane film; Restek Corporation, Bellefonte, PA, USA) equipped with a 10 m guard column. An injection volume of 0.5 µL was used for each sample. Data acquisition was performed on a Leco Pegasus BT TOF-MS (LECO Corporation, St. Joseph, MI, USA) operating with electron ionization (EI), coupled to an Agilent 7890 B (Agilent Technologies Inc., Santa Clara, CA, USA) gas chromatograph fitted with an Agilent 7693 autosampler (Agilent Technologies Inc., Santa Clara, CA, USA).
2.3.3. Hydrophilic Interaction Liquid Chromatography Coupled to Mass Spectrometry (HILIC-MS)
The dried extracts were reconstituted in 200 µL of an 80:20 (v/v) CAN:H2O solution containing 42 internal standards (see Supporting Information: Untargeted_Metabolomics_WWTP.pdf/Table S4). Chromatographic separation was performed using a Waters Acquity Premier BEH Amide VanGuard FIT column (2.1 × 50 mm, 1.7 µm) coupled to a Waters Acquity Premier BEH Amide VanGuard FIT guard cartridge (2.1 × 5 mm, 1.7 µm). The analytical column was maintained at 45 °C, while the mobile phase was delivered at a flow rate of 0.8 mL/min.
The mobile phase consisted of solvent A, composed of H2O containing 10 mM ammonium formate and 0.125% formic acid, and solvent B, consisting of 95:5 (v/v) CAN:H2O supplemented with 10 mM ammonium formate and 0.125% formic acid. A volume of 5 µL (+/−) of each sample was injected for analysis. Mass spectrometric detection was carried out using a SCIEX 6600 TripleTOF MS (SCIEX, Framingham, MA, USA) coupled to an Agilent 1290 Infinity UHPLC system. Data acquisition was performed in both positive and negative electrospray ionization (ESI) modes using a data-dependent acquisition (DDA) workflow.
2.4. Compound Identification
The internal standards included in the analytical workflow were not used as reference compounds for the identification of endogenous metabolites, nor were they intended to represent the complete range of chemical classes present in wastewater samples. Instead, their primary purpose was to correct retention time shifts across the analyses (see Supporting Information: Untargeted_Metabolomics_WWTP.pdf/Tables S2 and S5). Raw GC-MS data files were converted to the Abf format using the Reifycs Abf Converter (https://www.reifycs.com/abfconverter/, accessed on 29 November 2023). Subsequently, data obtained from each analytical platform and ionization mode were processed independently with MS-DIAL software version 4.9 [18]. The specific processing parameters applied to each dataset are provided in the Supporting Information (Untargeted_Metabolomics_WWTP.xlsx/MS-DIAL GC-MS, MS-DIAL HILIC-MS_Pos, MS-DIAL HILIC-MS_Neg, MS-DIAL RPLC-MS_Pos and MS-DIAL RPLC-MS_Neg).
Metabolite annotation was carried out using the in-house mass-to-charge ratio and retention time (m/z-RT) libraries developed by Fiehn’s laboratory. In addition, MS/MS spectral matching was performed against publicly available spectral databases, including the MassBank of North America (MoNA) and the NIST20 MS/MS library. The resulting annotations generated by MS-DIAL were manually curated following modified Metabolomics Standards Initiative (MSI) confidence levels [19], whose detailed definitions are available in the Supporting Information (Untargeted_Metabolomics_WWTP.pdf/MSI levels).
For data preprocessing, zero values were substituted with one-tenth of the minimum peak height detected across all samples before exporting the results. Features obtained from both positive and negative ionization modes in the RPLC-MS and HILIC-MS datasets were filtered using the criteria Fold 2 > 5 and sample maximum > 1000. The filtered feature lists were subsequently processed with MS-Flo (https://msflo.fiehnlab.ucdavis.edu/#/, accessed on 21 February 2024) [20] to identify isotopic peaks, duplicate features and ion adducts. The parameters employed for the MS-Flo analyses are detailed in the Supporting Information (Untargeted_Metabolomics_WWTP.xlsx/MS-Flo HILIC-MS and MS-Flo RPLC-MS). GC-MS annotations were filtered according to Fold 2 > 3, total score > 70 and an average signal-to-noise ratio greater than 3.
2.5. Compound Classification
The annotated metabolites were classified based on their International Chemical Identifiers (InChIKeys). Initially, InChIKeys were retrieved through the Chemical Translation Service (CTS) batch conversion platform (https://cts.fiehnlab.ucdavis.edu, accessed on 12 March 2024) [21] and complemented with information obtained from PubChem (https://pubchem.ncbi.nlm.nih.gov/). Subsequently, the collected identifiers were submitted to either ClassyFire Batch (https://cfb.fiehnlab.ucdavis.edu/#/, accessed on 15 March 2024) [22] or Ref-Met (https://www.metabolomicsworkbench.org/databases/refmet/name_to_refmet_form.php, accessed on 15 March 2024) to assign the corresponding chemical classification.
2.6. Data Treatment
The metabolomics datasets generated by GC-MS, HILIC-MS and RPLC-MS were preprocessed and visualized in the R programming environment [23] using the Tidyverse package collection, mainly including “dplyr”, “tidyr”, “stringr”, “purr” and “ggplot2” (https://www.tidyverse.org/). Because RPLC-MS and HILIC-MS analyses were acquired in both positive and negative ionization modes, duplicated metabolite annotations were removed by retaining the feature corresponding to the ionization mode displaying either the highest signal intensity or the most comprehensive compound annotation. In contrast, all metabolites detected by GC-MS were preserved.
For each dataset, relative intensity values were transformed by first adding one unit to every measurement and subsequently applying a base-2 logarithmic transformation. This adjustment ensured that all values remained positive before logarithmic conversion. Afterwards, quantile normalization was applied to the corrected peak intensity matrices of the three metabolomics platforms [24].
Differential abundance analysis (DAA) at the metabolite level followed an approach commonly adopted in other omics disciplines, including genomics and proteomics [25]. Pairwise comparisons were performed between all five WWTPs, resulting in a total of ten comparisons. Statistical analyses were conducted using the “limma” R package (version 4.3.2) [26]. For each metabolomics dataset, a linear model was fitted considering “WWTP” (Banyoles, Besòs, Girona, Olot and Vic) and “Campaign” (Camp1, Camp2 and Camp3) as fixed-effect variables:
where I represents the metabolite intensity after data preprocessing, the βi are the regression coefficients for the metabolite, and the ε is the error term. Following model fitting, the “eBayes” function from the “limma” package was applied to estimate moderated t-statistics, F-statistics and log-odds of differential abundance through empirical Bayes moderation of the standard errors [27]. The resulting p-values were adjusted for multiple hypothesis testing using the Benjamini–Hochberg false discovery rate (FDR) correction [28]. Metabolites were considered significantly differentially abundant when they satisfied the thresholds |FC| > 1.5 and adjusted p-value (padj) < 0.05 for each of the ten pairwise WWTP comparisons.
After completing the DAA (see Supporting Information Untargeted_Metabolomics_WWTP.xlsx/DAA GC-MS, DAA HILIC-MS and DAA RPLC-MS), all metabolites identified as significant in at least one comparison were subjected to hierarchical clustering analysis for each analytical platform. Prior to visualization, the corresponding intensity matrices were corrected to remove the variability associated with the “Campaign” factor and subsequently standardized using z-scores before generating the heatmaps.
In parallel with the DAA workflow, Principal Component Analysis (PCA) was carried out for the complete metabolite datasets obtained from each analytical platform. PCA was performed using both the original processed data matrices and the matrices after correction for the variability attributable to the “Campaign” effect.
3. Results
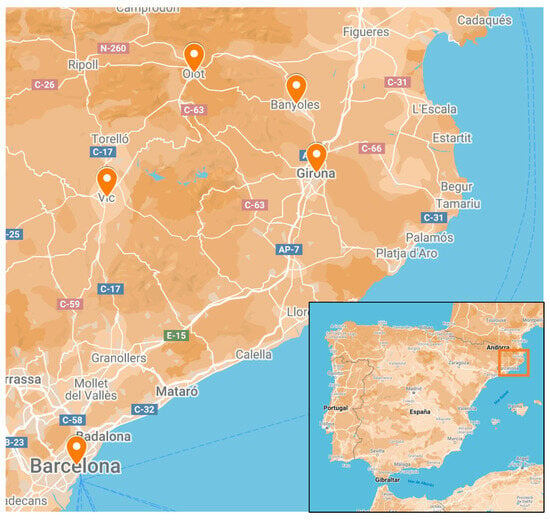
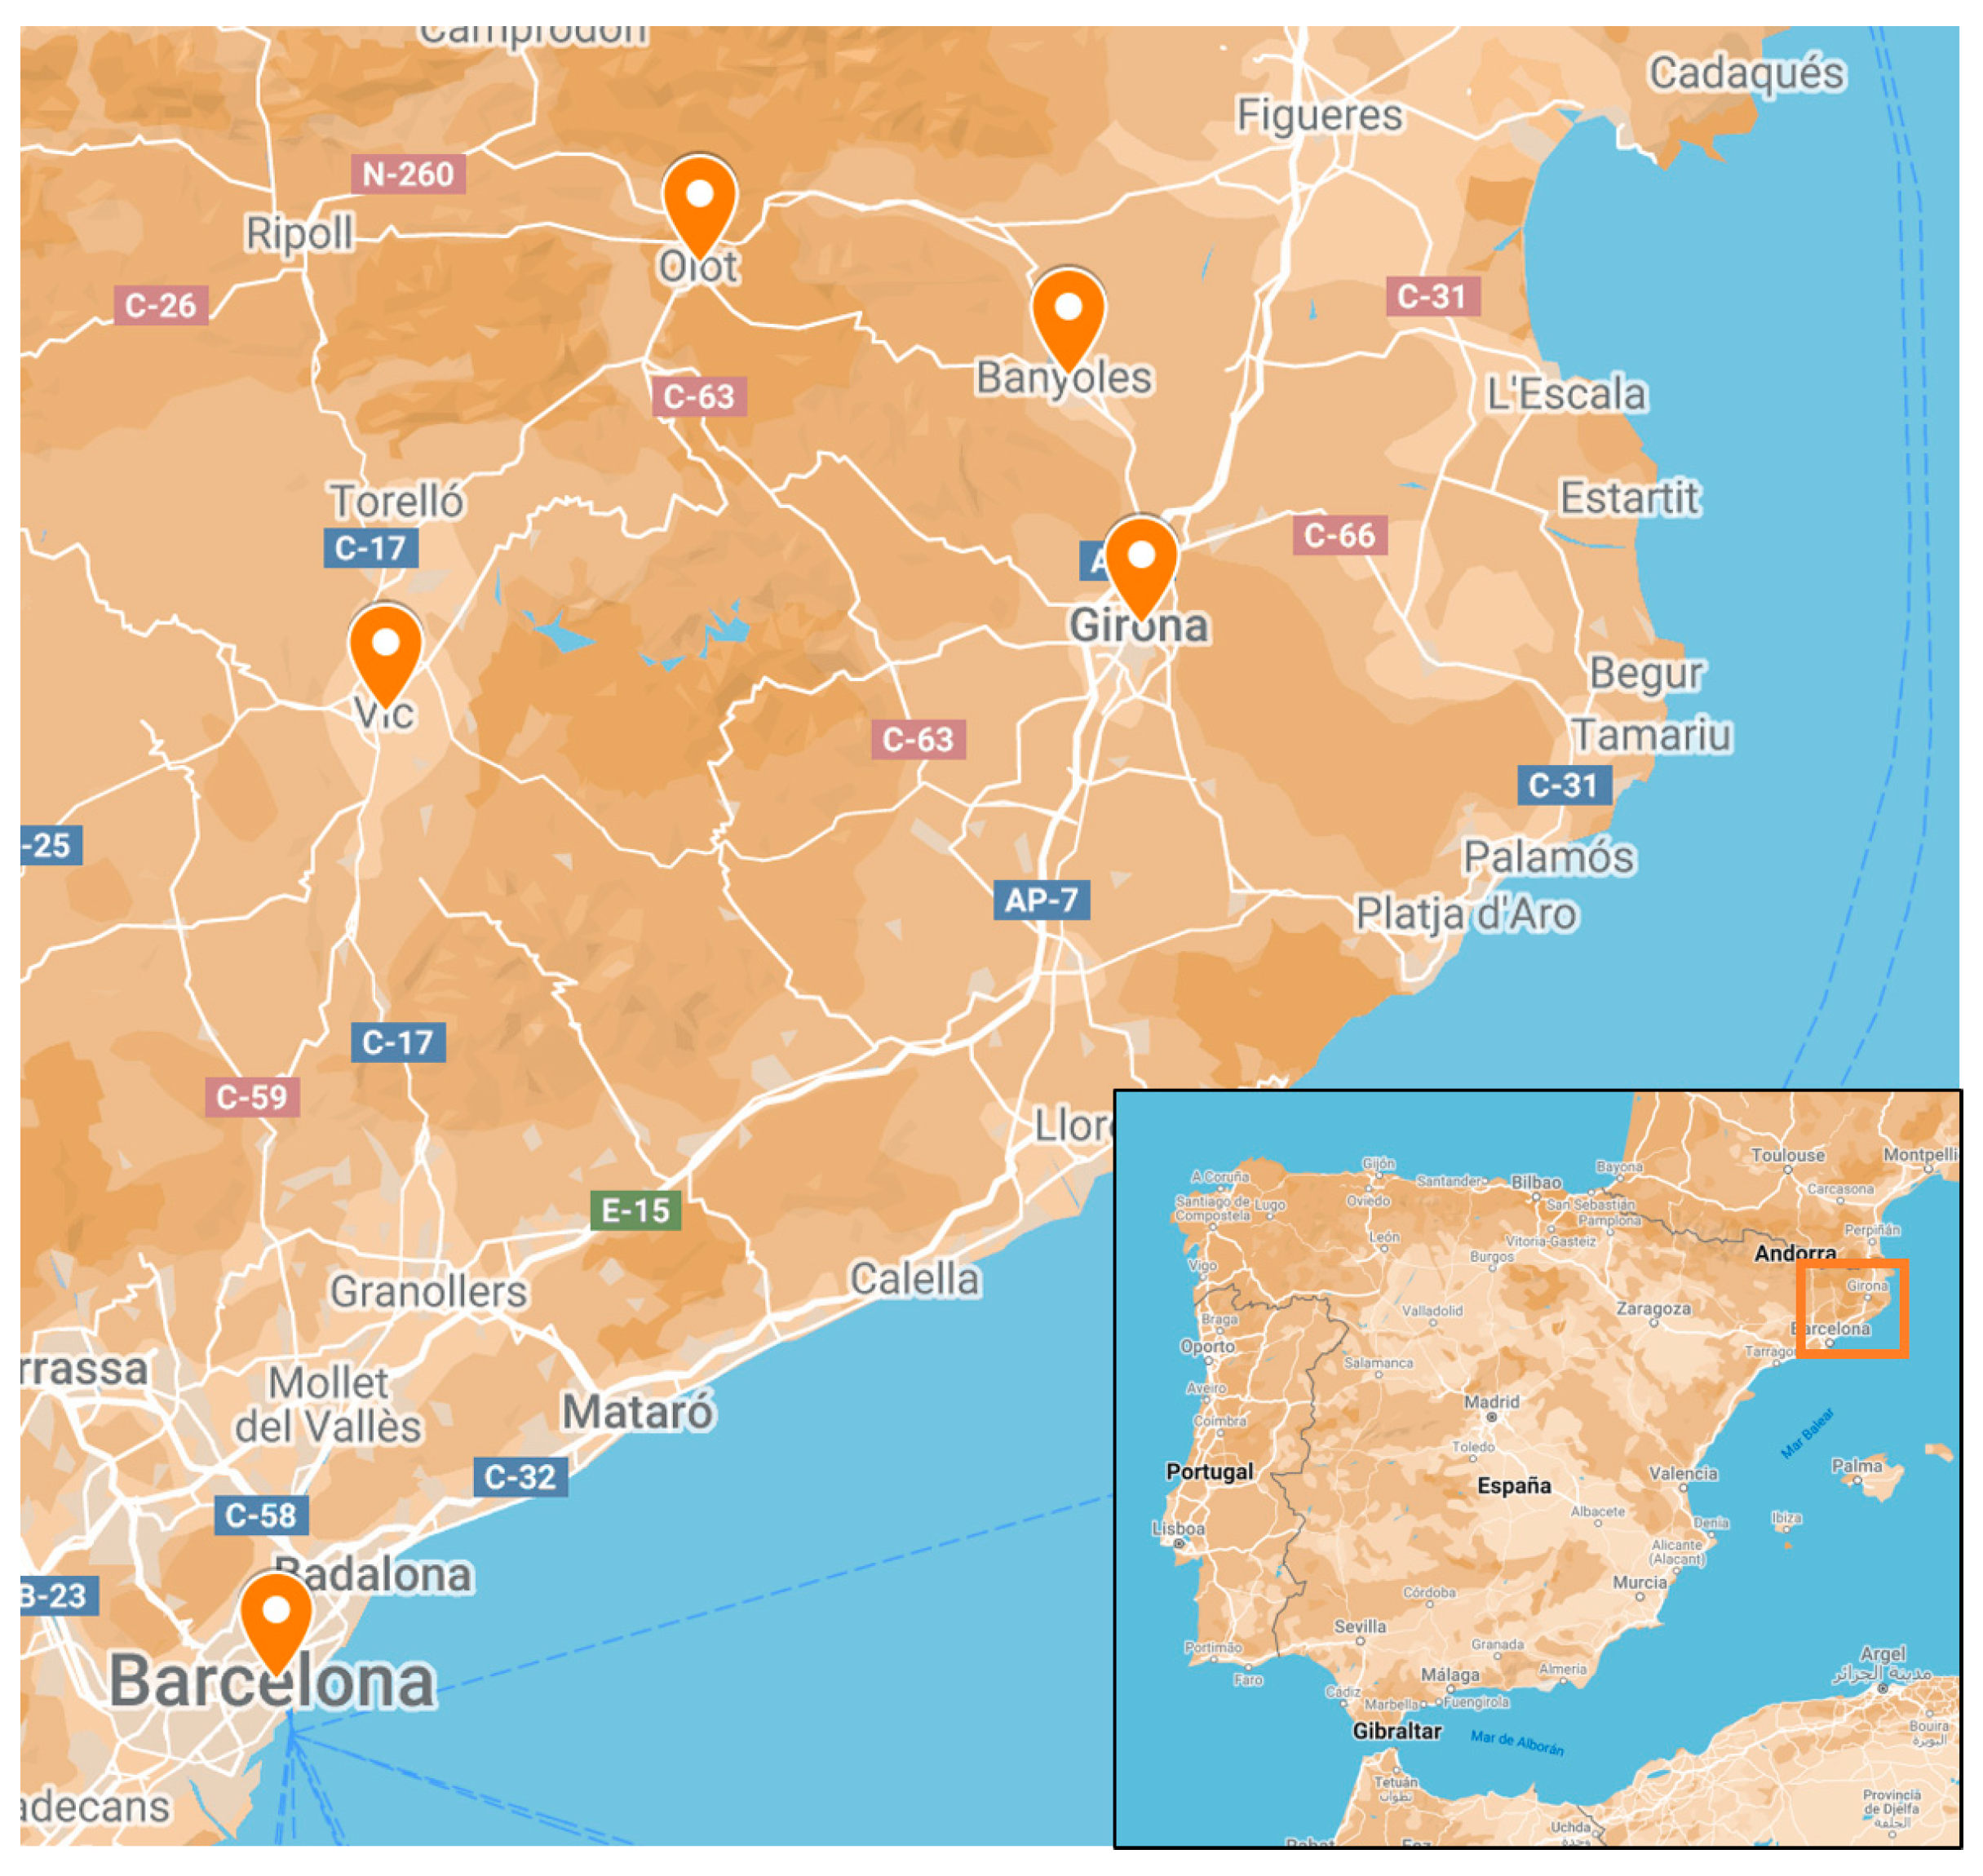
Samples were obtained from five WWTPs located in the provinces of Barcelona and Girona, Catalonia (Spain) (Figure 1), during three independent sampling campaigns carried out in winter, spring and summer. The main characteristics of each treatment plant are summarized in Table 1.
Figure 1.
Location of the wastewater treatment plants.
The extraction procedure generated two distinct fractions. The upper organic phase was analyzed by RPLC-MS, whereas the lower aqueous phase was processed using GC-MS and HILIC-MS, thereby maximizing the coverage of metabolite annotation.
3.1. Compound Annotations
MS-DIAL processing initially detected 23,824 features associated with 314 reference compounds in positive RPLC-MS mode, 7555 features with 209 references in negative RPLC-MS mode, 2102 features with 484 references by GC-MS, 6679 features with 503 references in positive HILIC-MS mode and 3025 features with 382 references in negative HILIC-MS mode. Following manual curation and classification according to the MSI confidence levels, the final distribution of annotated compounds is presented in Table 2.
Table 2.
Number of annotated compounds in each MSI level (described in Supporting Information: Untargeted_Metabolomics_WWTP.pdf/MSI levels) per platform and mode.
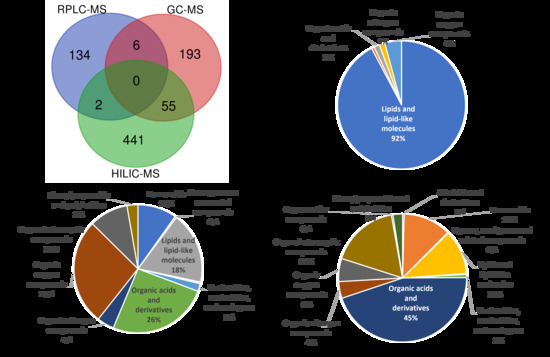
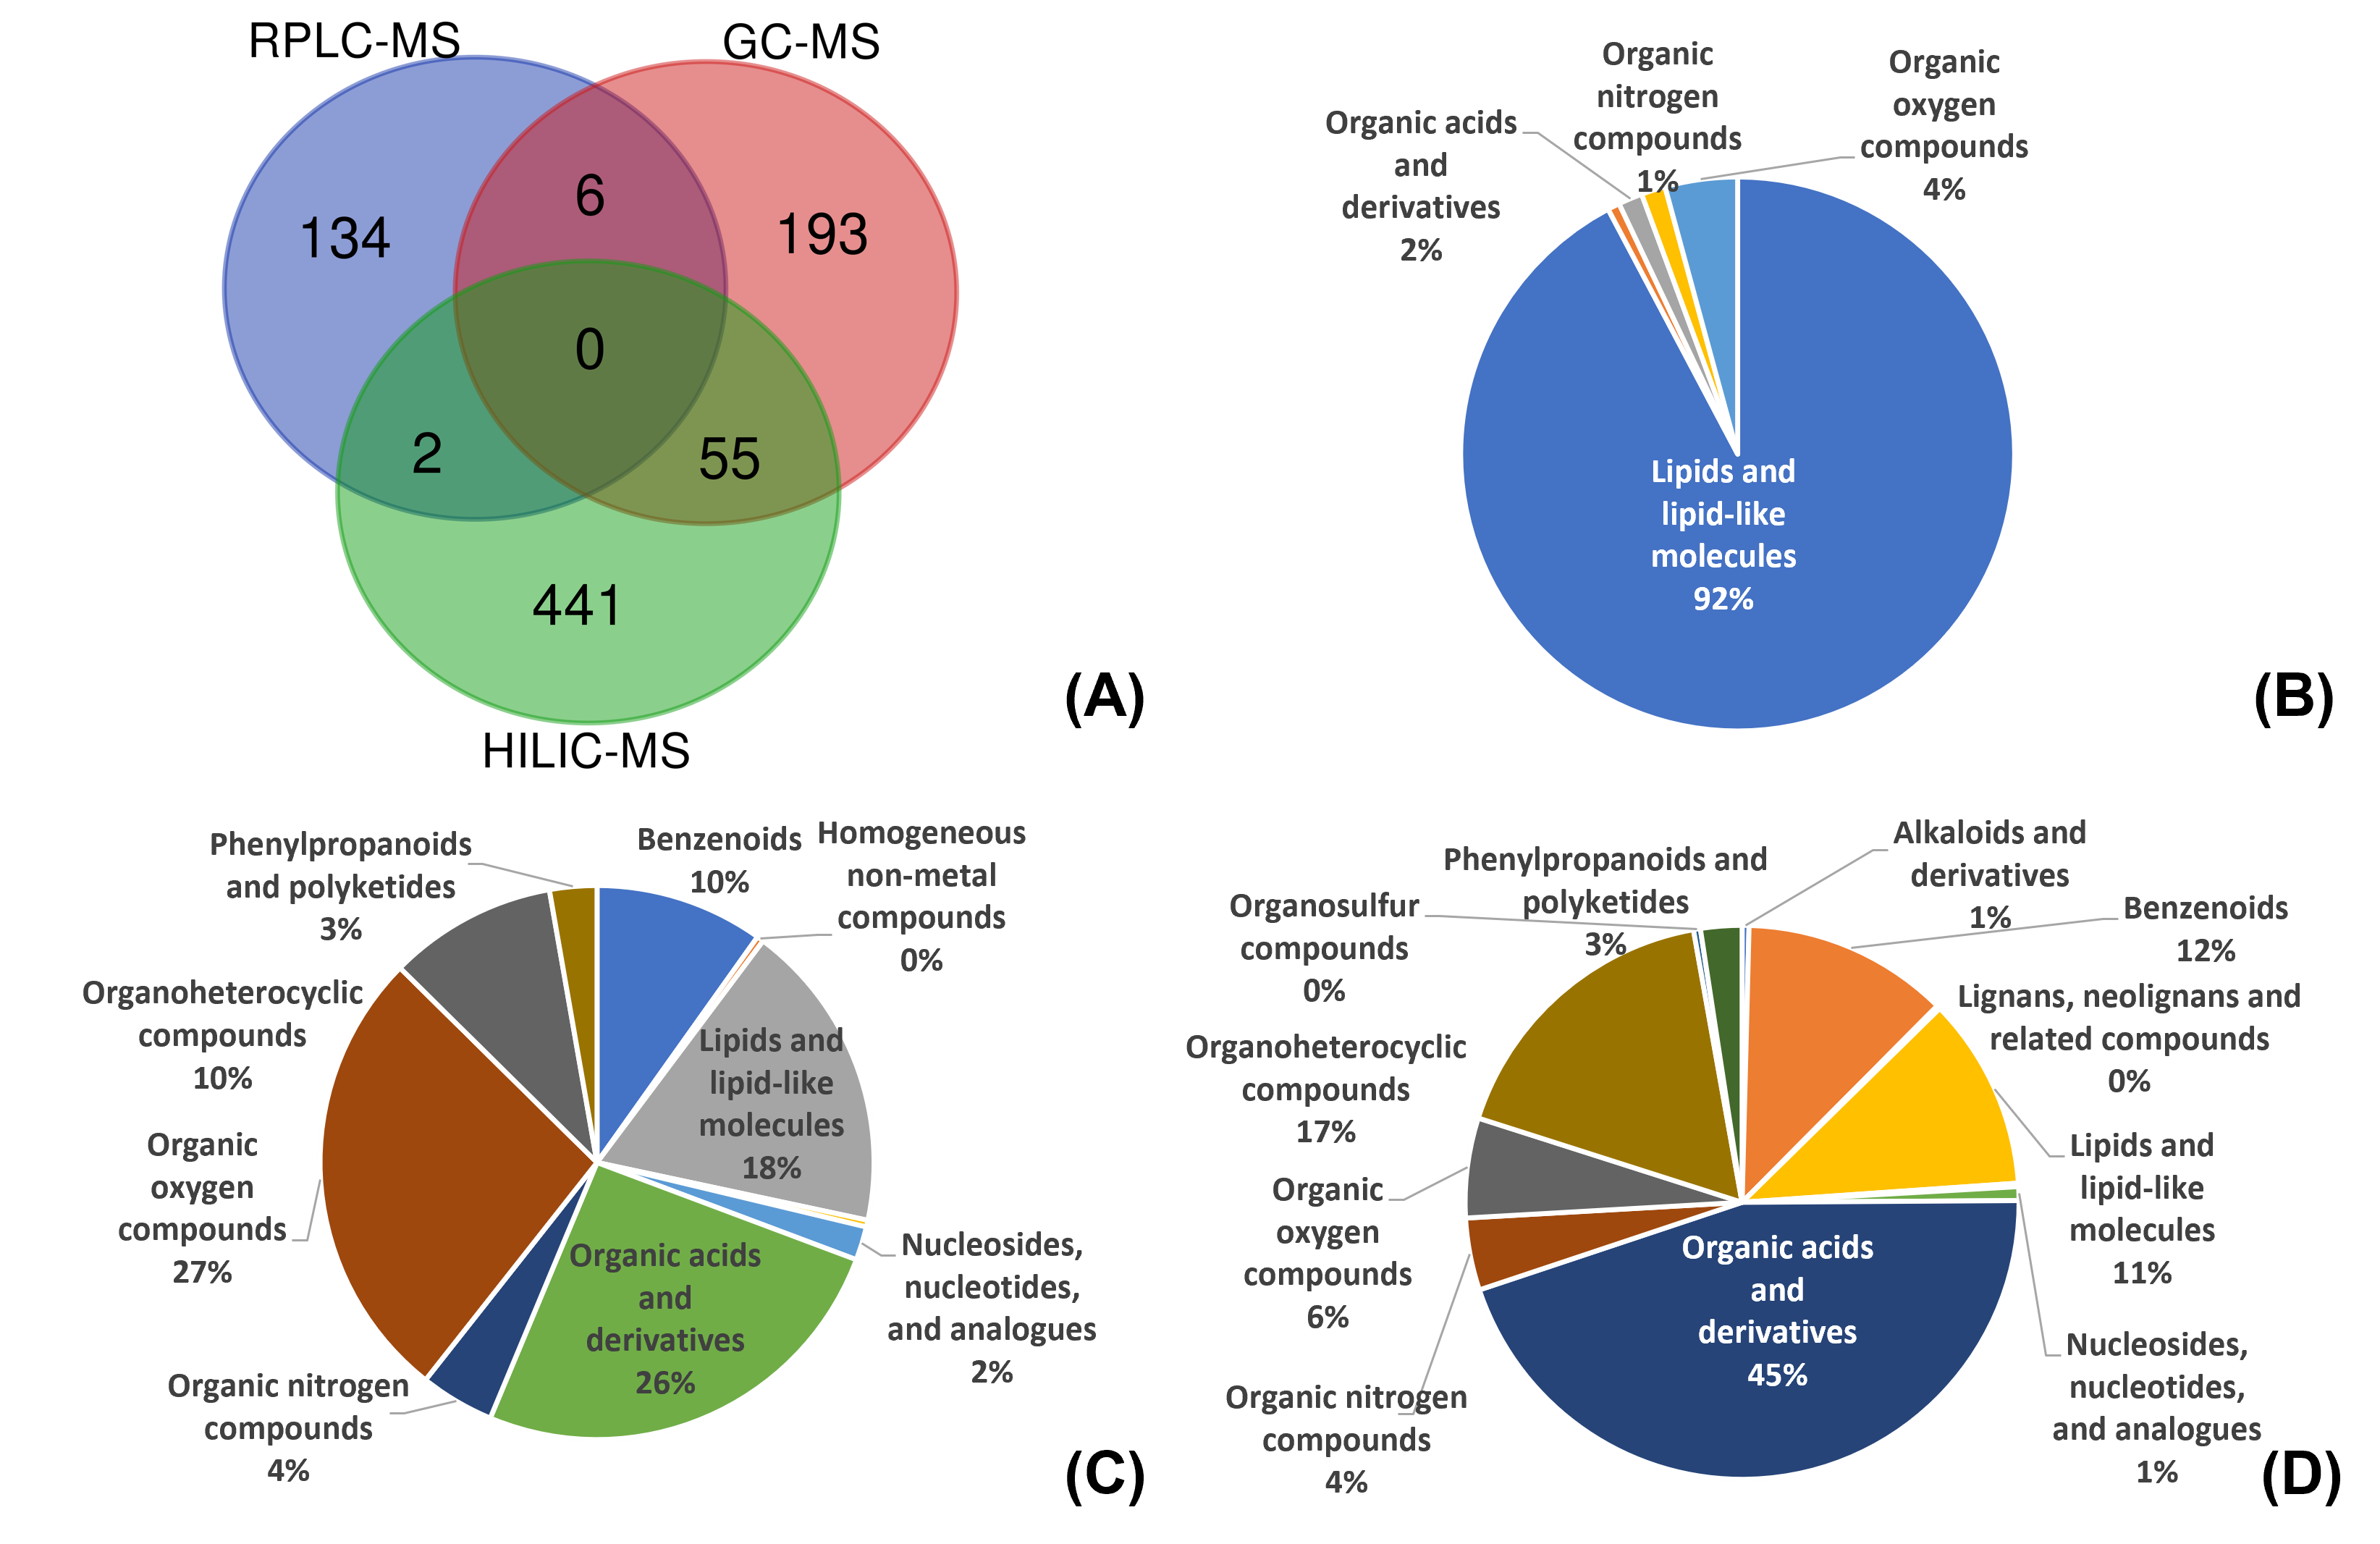
After applying the filtering criteria, merging the positive and negative ionization modes for both RPLC-MS and HILIC-MS, and removing duplicate annotations, the final datasets comprised 142 compounds for RPLC-MS, 254 for GC-MS and 498 for HILIC-MS. Across all platforms, 828 unique compounds were retained. The complete list of annotated metabolites, together with their chemical classifications and relative abundance values, is available in the Supporting Information (Untargeted_Metabolomics_WWTP.xlsx/Compound annotations). Comparison of the three analytical platforms revealed very limited overlap among the identified metabolites, highlighting the complementary nature of the analytical approaches employed (Figure 2A).
Figure 2.
Venn’s diagram of the identified compounds in each platform (A) and the corresponding classification of the annotations in RPLC-MS (B), GC-MS (C) and HILIC-MS (D).
3.2. Compound Classification
The chemical composition identified by each analytical platform reflected the selectivity of both the extraction procedure and the chromatographic separation employed. RPLC-MS (Figure 2B) was dominated by lipid-related metabolites, which represented approximately 92% of all annotated compounds, whereas only ten metabolites belonged to other chemical superclasses. The lipid fraction was mainly composed of fatty acyls (40%), followed by sphingolipids (31%), glycerolipids (18%), glycerophospholipids (8%) and steroids (3%). In contrast, lipids represented less than 20% of the compounds detected by GC-MS and HILIC-MS (18% and 11%, respectively). Although these platforms identified the same principal lipid classes observed in RPLC-MS, prenol lipids were additionally detected in both GC-MS and HILIC-MS datasets.
GC-MS (Figure 2C) displayed a more heterogeneous metabolite profile without a single dominant chemical superclass. Organic oxygen compounds (27%) and organic acids and their derivatives (26%) were the most abundant groups, followed by lipids. Additional metabolite classes included benzenoids, organoheterocyclic compounds, organic nitrogen compounds, phenylpropanoids and polyketides, as well as nucleosides, nucleotides and related analogues.
HILIC-MS (Figure 2D) was characterized by a predominance of organic acids and derivatives, accounting for approximately 45% of the annotated compounds. This platform also detected several chemical classes that were absent from the previous analytical approaches, including alkaloids and their derivatives, lignans, neolignans and related metabolites, together with organosulfur compounds. Although GC-MS and HILIC-MS shared several broad chemical classes, the specific metabolites differed considerably. Accordingly, only 55 compounds were common to both analytical platforms (Figure 2A).
3.3. Principal Component Analysis (PCA)
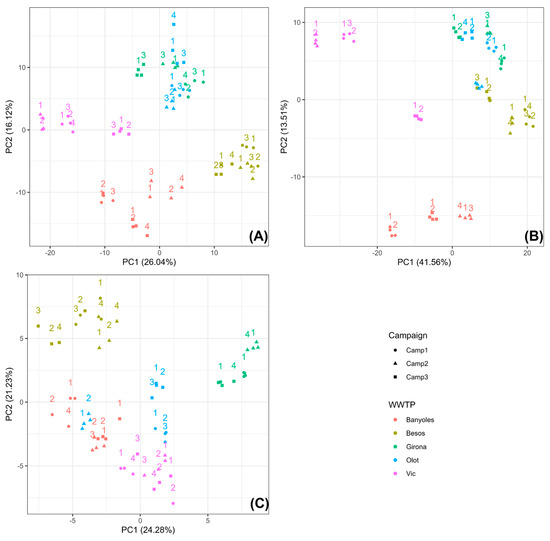
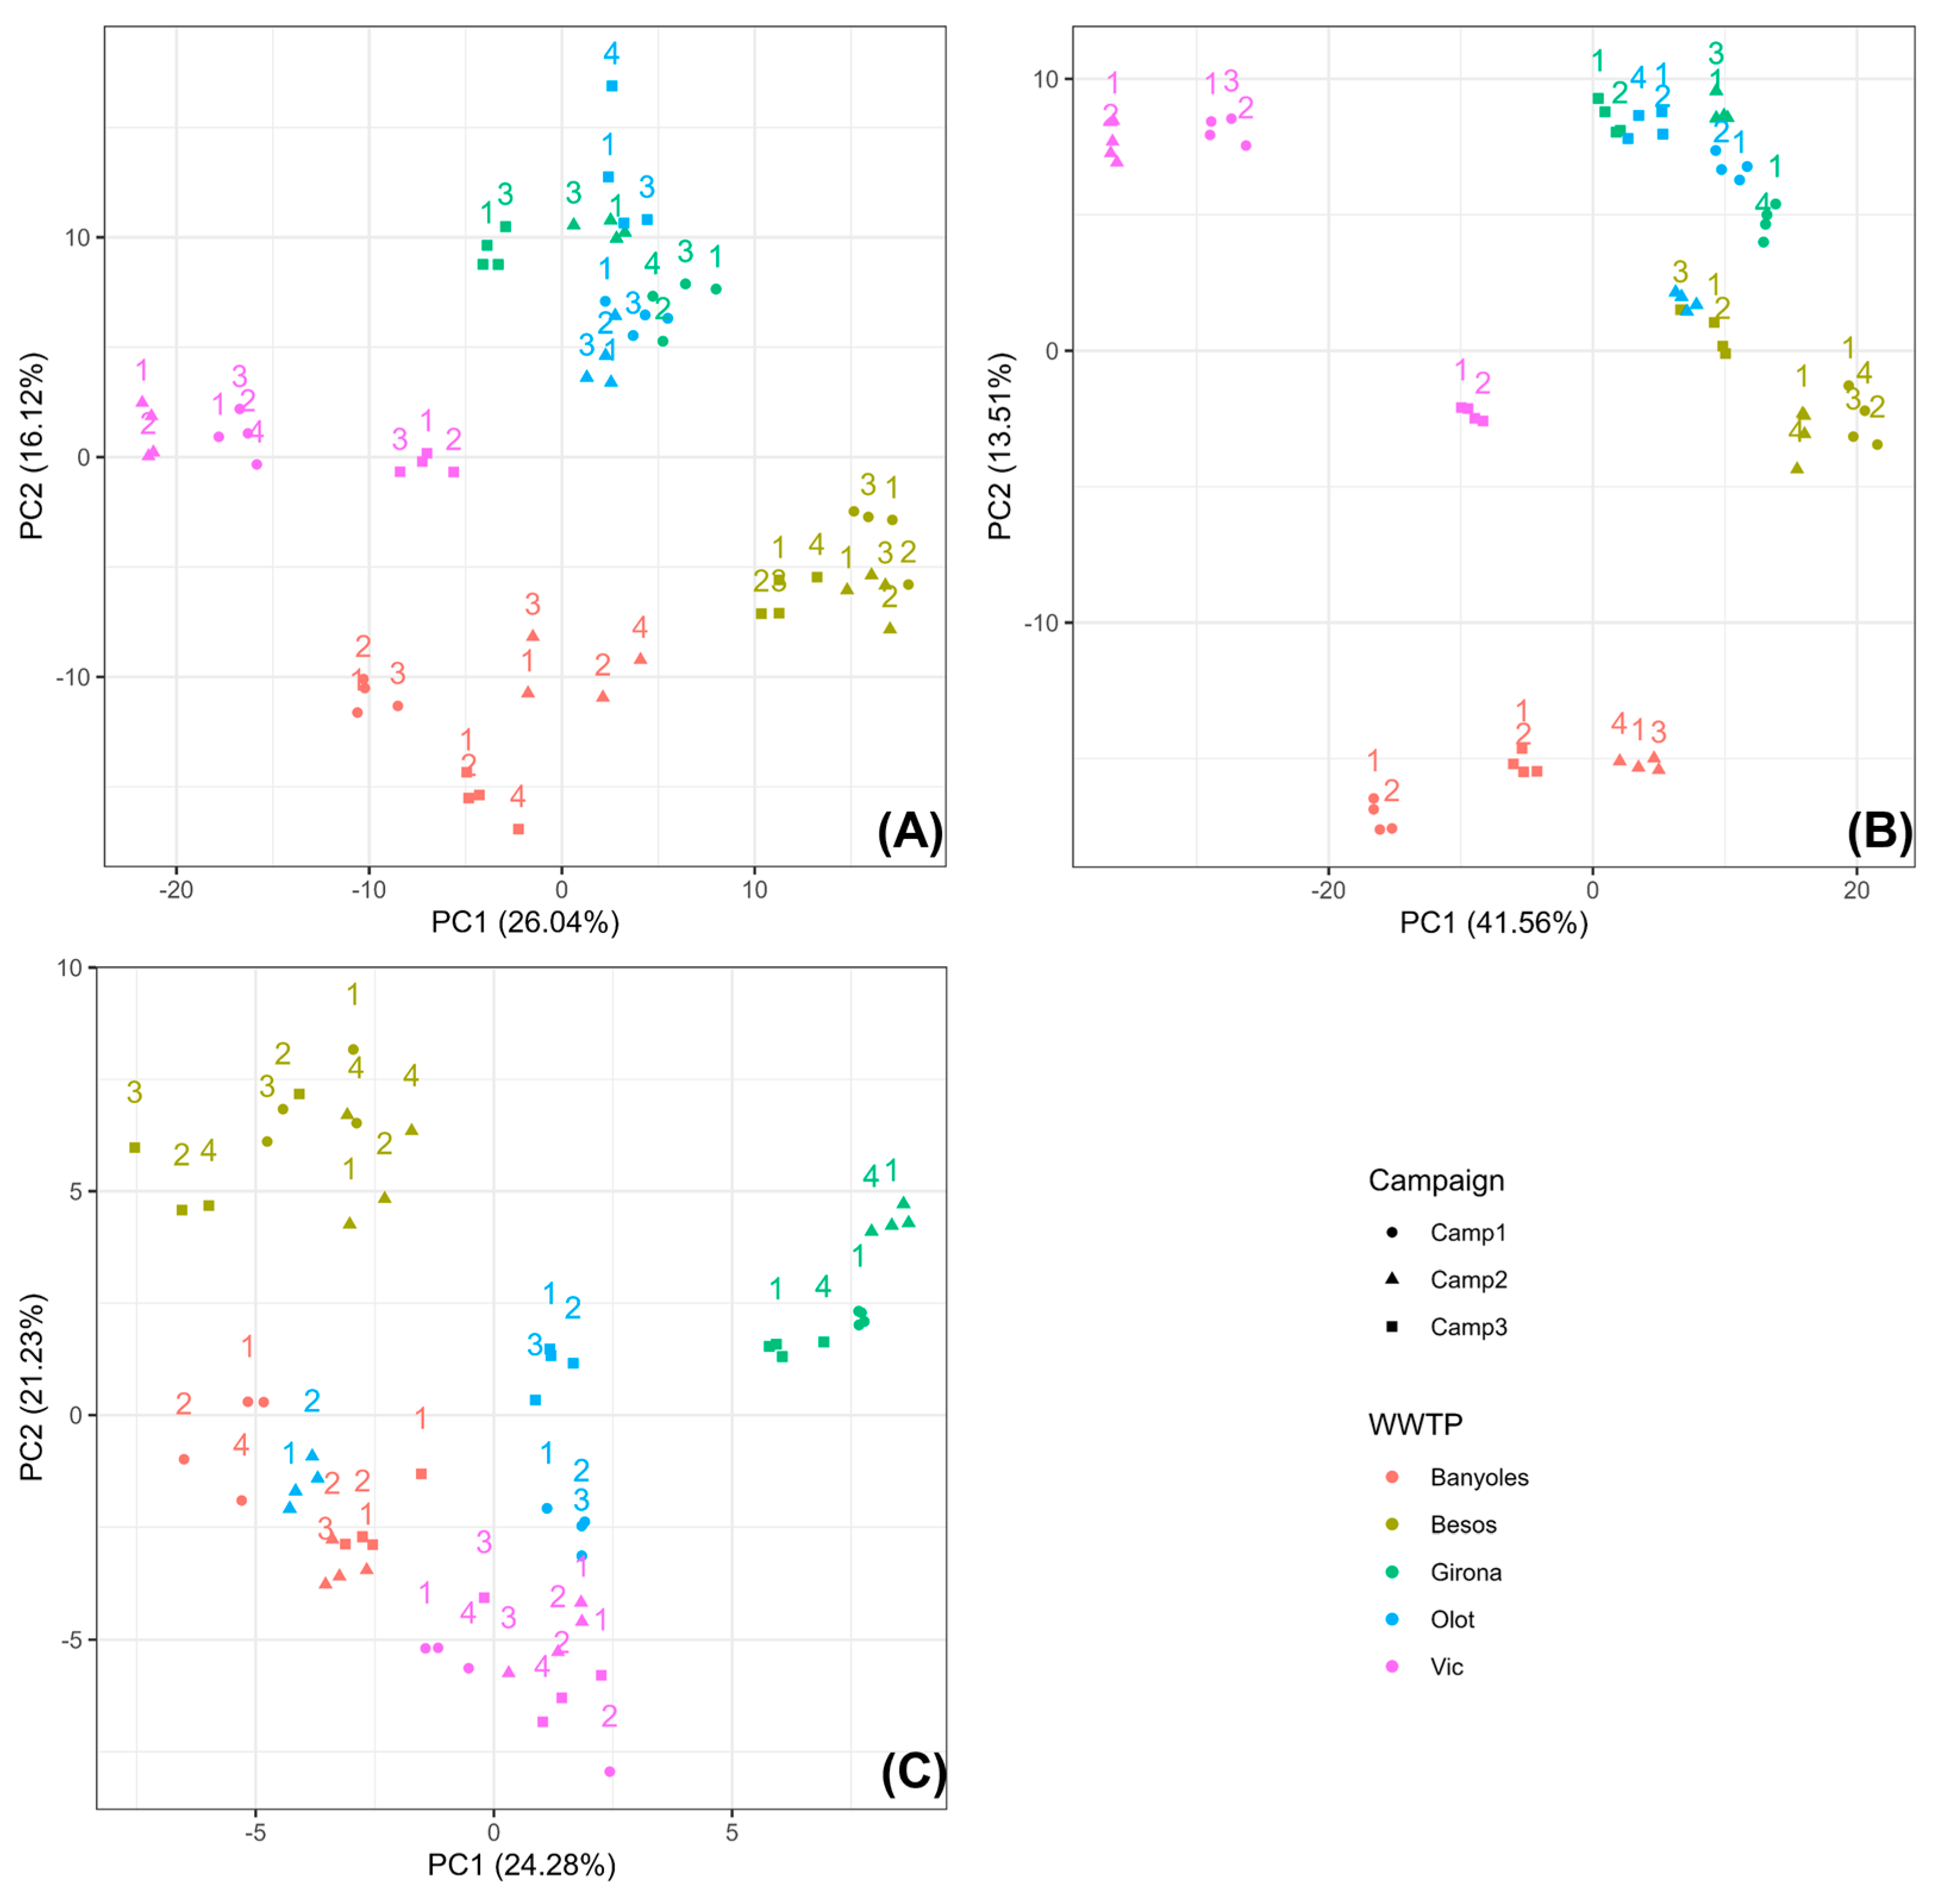
Principal Component Analysis (PCA) initially demonstrated a high degree of technical reproducibility across all sampling campaigns and WWTPs, regardless of the analytical platform employed. When each platform was evaluated independently, GC-MS data (Figure S1A and Figure 3A) exhibited a tendency for samples to cluster according to the sampling site. In most cases, the three sampling campaigns for each WWTP grouped closely together. However, the Banyoles samples formed three distinct clusters corresponding to each campaign, while the third campaign from Vic showed greater similarity to Banyoles than to the remaining Vic samples. Girona and Olot consistently clustered together, whereas Besòs occupied a more separated position. Overall, samples collected during campaign 3 displayed a greater degree of differentiation from those obtained during campaigns 1 and 2. After removing the variability associated with the sampling campaign (Figure 3A), the separation among WWTPs became more evident.
Figure 3.
Principal Component Analysis (PCA) of the compounds from GC-MS (A), HILIC-MS (B) and RPLC-MS (C) removing the campaign-associated variability. (Campaigns 1: winter, 2: spring, 3: summer).
A comparable clustering pattern was observed for the HILIC-MS dataset (Figure S1B and Figure 3B), which closely resembled the distribution obtained with GC-MS. The main difference was that Besòs appeared more closely associated with Girona and Olot. In contrast, the RPLC-MS dataset (Figure S1C and Figure 3C) displayed a distinct sample distribution. In this case, Besòs and Girona formed clearly differentiated groups, whereas Banyoles, Olot and Vic clustered together. Moreover, the influence of sampling campaign on sample variability was considerably lower than that observed for both GC-MS and HILIC-MS.
3.4. Differential Abundance and Hierarchical Clustering Analyses
Applying the significance thresholds of |FC| > 1.5 and padj < 0.05 resulted in the identification of 122 significant metabolites in the RPLC-MS dataset, 241 in GC-MS and 485 in HILIC-MS. Hierarchical clustering of these metabolites generated six major clusters for each analytical platform (see Untargeted_Metabolomics_WWTP.pdf/Heatmaps). Although each platform exhibited its own characteristic clustering profile, several common trends were identified. In particular, Besòs and Vic consistently represented the two most distinct WWTPs, each characterized by specific clusters of upregulated metabolites across all analytical platforms.
Interestingly, the third sampling campaign from Vic clustered more closely with Banyoles than with the other two Vic campaigns in both the GC-MS and HILIC-MS datasets, confirming the pattern previously observed in the PCA. To better understand the metabolic differences among treatment plants, the chemical composition of the upregulated clusters identified for each WWTP and analytical platform was further examined.
Across platforms, metabolites contributing to site-associated differences were dominated by five broad superclasses: lipids, organic acids, organic oxygen compounds, organoheterocyclic compounds, and benzenoids. Their contribution was strongly platform-dependent, reflecting extraction and chromatographic selectivity rather than a complete inventory of each site. RPLC-MS contributed predominantly lipid-related differences, whereas GC-MS and HILIC-MS captured broader derivatizable and polar chemical spaces. The detailed site- and campaign-level distributions are summarized in Table 3 and provided in the Supporting Information.
Table 3.
Types of compounds present in each treatment plant. The checkmark (√) indicates the presence of at least one annotated metabolite belonging to the specified class in any replicate and/or campaign for the corresponding WWTP. When campaign-specific occurrences are relevant, they are explicitly noted (e.g., “camp 1”, “camp 3”).
4. Discussion
Although wastewater small molecules have been investigated for many years, most previous studies have focused on predefined groups of target analytes. In the present work, influent samples collected from five WWTPs over three seasonal campaigns were analyzed using three complementary analytical platforms combined with an untargeted metabolomics workflow to obtain a broad characterization of the wastewater metabolome. Sampling during winter, spring and summer was designed to capture seasonal variation, whereas the selected WWTPs differed substantially in both population size and industrial activity. For instance, Besòs serves the largest human population (approximately 1.5 million inhabitants) with minimal industrial influence, whereas Banyoles and Vic are characterized by a much smaller resident population but a stronger industrial contribution. Nevertheless, because the study comprises five WWTPs and three sampling campaigns, with one 24-h composite sample collected per site and campaign, the environmental patterns observed should be regarded as exploratory. Technical replicates provide an assessment of analytical reproducibility but cannot substitute for independent environmental replication. Therefore, additional sampling campaigns, together with more detailed hydrological and catchment metadata and the inclusion of external WWTPs, will be required to assess the temporal stability and broader generalizability of the observed patterns.
Using established platform-specific workflows and conservative MSI-based curation, the combined approach annotated 828 unique compounds across largely non-overlapping chemical spaces. The three platforms produced complementary rather than redundant views of wastewater composition. RPLC-MS was strongly enriched in lipids, GC-MS broadened coverage of derivatizable organic oxygen compounds and organic acids, and HILIC-MS generated the largest polar-metabolite dataset. No compound was shared by all three platforms, and pairwise overlap was limited (six compounds between RPLC-MS and GC-MS, two between RPLC-MS and HILIC-MS, and 55 between GC-MS and HILIC-MS). Thus, the principal environmental insight is that the apparent wastewater metabolome depends strongly on analytical selectivity: reliance on a single platform would leave substantial chemical blind spots. The site-associated patterns observed after campaign correction indicate that comparative profiling is feasible within this dataset, but they should be interpreted as empirical fingerprints rather than evidence of specific domestic or industrial sources. Consistent site-level clustering was observed across GC-MS and HILIC-MS after removal of campaign-associated variability. In addition, very long-chain fatty acyls, benzenoids, and organoheterocyclic compounds were systematically enriched in WWTPs serving larger human populations (Besòs, Girona, Olot), whereas reduced chemical diversity was observed in sites with higher industrial contribution and smaller human populations (Vic, Banyoles).
It is difficult to assess whether this represents a large proportion of the wastewater metabolome, as its total chemical diversity remains unknown and depends strongly on the contributing sources. Additional analytical approaches such as NMR, analysis of particulate fractions, or inclusion of more diverse sampling sites would likely expand metabolite coverage.
Wastewater entering treatment plants represents a complex mixture of human biofluids (including urine, feces and blood), household chemicals, pharmaceuticals, food residues and industrial discharges originating from activities such as agriculture or slaughterhouses. Consequently, assigning individual metabolites to a specific source is challenging. Most wastewater studies target well-defined compound classes selected because of their relevance to human activities, including antibiotics, illicit drugs, dyes and flame retardants. Such source-oriented classification becomes considerably more difficult in untargeted metabolomics. Therefore, compounds in this study were classified according to their chemical structure and structural characteristics [22]. For simplicity, only the superclass, class and parent level 1 categories were considered (see Table 3). Under this classification, the dominant chemical groups were benzenoids, lipids, organic acids, organic oxygen compounds and organoheterocyclic compounds.
Amino acids were detected in all samples, consistent with the soluble protein fraction previously identified in the same wastewater samples by proteomic analysis [15]. Their ubiquitous occurrence is compatible with the mixed origin of influent wastewater, including human excreta, food residues, and microbial activity; however, the present data do not permit quantitative source attribution.
Another group of metabolites consistently detected in all samples was the monosaccharides, which belong to the organic oxygen superclass and represent the simplest form of carbohydrates. These compounds are commonly present in most human biofluids, with the exception of feces. Their occurrence in wastewater is expected because they play fundamental roles in human energy metabolism and are also abundant in many dietary products, including fruits, vegetables and honey, where they occur either as free sugars or as constituents of more complex carbohydrates [29].
Monosaccharides were detected across the wastewater samples and are consistent with mixed influent sources, including human metabolism and food residues [30,31,32]. Because these compounds are not source-specific, their occurrence cannot be used for quantitative source attribution. Most monosaccharides were detected predominantly by GC-MS, illustrating the complementarity of the analytical platforms and the broader chemical coverage achieved by the combined workflow.
Lipids represented another major class of metabolites identified throughout the study. Their high abundance was expected because the MTBE extraction protocol was specifically designed to improve lipid recovery [16]. When all analytical platforms were considered together, lipids constituted the second largest metabolite superclass. RPLC-MS contributed the broadest lipid coverage beyond fatty acyls and generated a clustering pattern distinct from those obtained with HILIC-MS and GC-MS. These compounds are naturally abundant in numerous human biofluids, including serum, urine and sweat, although additional sources such as pharmaceuticals, cosmetic formulations and other consumer products may also contribute to their presence in wastewater [33].
Fatty acyls were detected by all three analytical platforms and were present in samples from every WWTP. Nevertheless, differences were observed in the distribution of individual fatty acyl subclasses among sampling locations. Long-chain fatty acids (13–21 carbon atoms) occurred in all treatment plants, whereas very long-chain fatty acids (≥22 carbon atoms) were particularly abundant in Besòs, Girona and Olot. Because these WWTPs serve larger human populations relative to their industrial activity, this distribution suggests that very long-chain fatty acyls may predominantly originate from human sources.
Long-chain fatty acids are widely present in foods, biological residues, household products, oils, and fats [34,35]. Their occurrence in influent wastewater is therefore environmentally plausible, but the present data do not distinguish among these potential sources.
Numerous saturated very long-chain fatty acids (C22-C32) were identified. Their distribution differed among sites. These compounds can arise from multiple biological and product-related inputs. Triacylglycerols were detected in most samples and may derive from food residues, oils, fats, soaps, and biological material [33]. Their lower abundance in Girona should be interpreted cautiously because the study was not designed to distinguish a true site difference from temporal or analytical variability.
Organoheterocyclic compounds, characterized by cyclic structures containing at least one non-carbon atom, constitute an important class of molecules widely used in pharmaceuticals, agrochemicals and numerous industrial applications. Many members of this superclass are essential biological molecules, forming the structural basis of nucleobases, while others are employed in the treatment of cardiovascular, neurological and gastrointestinal disorders or as fungicides, insecticides, dyes and compounds with anti-inflammatory or anticancer properties [36]. Their broad range of applications explains why they were detected in nearly all sampling sites and campaigns. However, these compounds were markedly less abundant in Vic, which also exhibited the lowest diversity of organoheterocyclic metabolites, followed by Banyoles. Since both locations are characterized by a relatively small resident population and a stronger industrial contribution, the reduced abundance of these metabolites may reflect a lower proportion of wastewater originating from human sources. Nevertheless, no individual metabolite was identified that could conclusively confirm this hypothesis.
Several subclasses of organoheterocyclic compounds contributed to the observed metabolic patterns. Within the pyridine class, metabolites associated with nicotine degradation were identified, including 2-hydroxynicotinic acid [37], 3-trans-hydroxynorcotinine and 6-methylnicotinic acid [38], all of which are linked to tobacco consumption. Another notable pyridine derivative was 4-pyridoxic acid, the principal urinary metabolite of vitamin B6 metabolism [39].
The imidazopyrimidine subclass included several biologically relevant metabolites, such as caffeine and theophylline, two naturally occurring stimulants commonly consumed in coffee, tea, chocolate and other beverages [40]. Additional compounds comprised uric acid, a well-established biomarker of hyperuricaemia and gout [41], the purine metabolism intermediates hypoxanthine and xanthine [42], and the antiviral drug penciclovir [43].
Indole derivatives also represented an important subgroup. Among the identified metabolites were indole-3-acetic acid, a naturally occurring plant growth hormone, together with several related compounds, including (2-oxo-2,3-dihydro-1H-indol-3-yl)acetic acid, 5-hydroxy-3-indoleacetic acid, 5-methoxy-3-indoleacetic acid and indole-3-lactate, all involved in plant growth and developmental processes [44]. Other annotated indole compounds included melatonin, the hormone responsible for regulating circadian rhythms [45], and the essential amino acid tryptophan [46]. Within the phenylpyrrole class, atorvastatin, one of the most widely prescribed lipid-lowering medications, was also identified [47].
In addition to metabolites consistently detected across all WWTPs, we investigated compounds that were absent or substantially less abundant at specific sites, as these may provide useful markers for distinguishing treatment plants with contrasting demographic and industrial characteristics. Benzenoids, particularly compounds belonging to the benzene class, provided one of the clearest examples. These metabolites were predominantly detected in Besòs, Girona and Olot, whereas they were scarce in Banyoles and Vic. Benzene derivatives can arise from pharmaceuticals, household products, industrial processes, combustion-related inputs, and other sources. Because detailed industrial-discharge and catchment data were not available, the observed distribution cannot be assigned to a dominant source and is interpreted only as a site-associated pattern requiring targeted source-tracing studies.
Several pharmaceutical compounds belonging to this superclass were identified. These included 5-aminosalicylic acid, prescribed for inflammatory bowel diseases such as ulcerative colitis [48]; trimebutine, used in the treatment of irritable bowel syndrome [49]; the antipsychotic drug amisulpride [50]; the antidepressant bifemelane [51]; and the antihypertensive agents losartan and telmisartan [52]. Additional annotated compounds included 1-phenylethanol, commonly used as a food flavouring [53], as well as several compounds associated with industrial or anthropogenic sources. Finally, venlafaxine, one of the most frequently prescribed antidepressants [54], was identified; although structurally related to the compounds discussed above, it is classified within the phenol ether class rather than the benzene class.
Overall, this study represents an initial effort to characterize the small-molecule composition of wastewater influent using multi-platform untargeted metabolomics. The results highlight the complementarity of analytical platforms and the importance of comparative sampling across sites with different demographic and industrial characteristics. Expanding the number of analytical techniques and sampling locations will be necessary to further capture the chemical diversity of wastewater. Moreover, determining the precise origin of individual metabolites remains challenging, and comparative profiling across diverse environments may be the most practical strategy for identifying characteristic chemical signatures. This work is a start, but there is much more to be done.
From an operational perspective, simultaneous routine use of all three platforms for high-frequency WWTP monitoring would currently be resource-intensive because of instrument time, sample preparation, data processing, and annotation requirements. A more realistic implementation would be tiered: periodic multi-platform untargeted surveys could establish broad baselines, detect unexpected changes, support retrospective screening, and prioritize candidate markers, whereas validated targeted methods could then provide rapid, sensitive, and quantitative routine monitoring. Relative to targeted analysis, the principal advantage of the untargeted workflow is its broader and less assumption-dependent chemical coverage, including compounds not included in predefined panels. Its disadvantages are higher cost, lower throughput, more complex data interpretation, and lower identification and quantification certainty for many features. In WWTP management, such information could help identify anomalous influent profiles, prioritize compounds for confirmatory analysis, and evaluate treatment-process changes, but operational decisions would require targeted validation and site-specific performance criteria.
5. Conclusions
In this study, three complementary MS-based platforms were applied to influent samples from five WWTPs collected during three seasonal campaigns. The combined workflow substantially increased compound coverage relative to any single platform, and the limited overlap among GC-MS, RPLC-MS, and HILIC-MS demonstrated their orthogonal selectivity.
Within this dataset, technical replicates were reproducible and site-associated patterns were observed across campaigns after accounting for campaign-related variability. Thus, the study achieved its primary methodological aims of demonstrating platform complementarity and assessing the feasibility of comparative untargeted profiling.
Further longitudinal sampling, external validation, richer catchment metadata, and targeted confirmation of candidate markers are required before this approach can support routine source attribution or operational monitoring. The public dataset should therefore be regarded as an exploratory comparative resource and a basis for prioritizing future targeted and suspect-screening studies.
The proportion of the wastewater metabolome captured here is unknown, although it could likely be expanded using additional extraction strategies and analytical platforms. The main identified compound classes included organic oxygen compounds, organic acids, organoheterocyclic compounds, benzenoids, and lipids. While the exact origin of many compounds is difficult to determine, some likely sources can be inferred. For example, amino acids and dipeptides may derive from soluble proteins present in wastewater, whereas food waste likely contributes to the presence of monosaccharides.
Despite these uncertainties, distinct chemical profiles were observed among sites with different population sizes and industrial activities. Very long-chain fatty acyls, organoheterocyclic compounds, and benzenoids were more prevalent in sites with higher human population pressure.
Overall, this study provides a public exploratory dataset and demonstrates that combining GC-MS, RPLC-MS, and HILIC-MS substantially broadens chemical coverage and can generate reproducible comparative profiles within the present sampling design. The dataset should not be regarded as a universal reference wastewater metabolome. Validation across additional regions, WWTPs, hydrological conditions, and longitudinal sampling campaigns is required before broader generalization or operational application.
Supplementary Materials
The following supporting information can be downloaded at https://www.mdpi.com/article/10.3390/environments13090474/s1: SI_Untargeted_Metabolomics_WWTP.pdf (internal standards tables, PCA without removing the campaign-associated variability, MSI levels and heatmaps), SI_Untargeted_Metabolomics_WWTP.xlsx (MS-DIAL and MS-Flo parameters, compound annotations and differenctial abundance analysis).
Author Contributions
Conceptualization, M.C., D.B., A.G. and J.A.; methodology, M.C. and E.S.-J.; software, J.A. and E.S.-J.; resources, M.C. and D.B.; data curation, E.S.-J.; writing—original draft preparation, E.S.-J. and M.C.; writing—review and editing, M.C., J.A., A.G. and D.B. All authors have read and agreed to the published version of the manuscript.
Funding
This research was funded by the Spanish Ministry of Science and Innovation (MICINN, Spain), grant number PID2024-158804OB-I00. This study was accomplished through an internship in the University of California Davis with the iMOVE grant from the Spanish National Research Council (CSIC) with reference IMOVE23177.
Data Availability Statement
This study is available at the NIH Common Fund’s National Metabolomics Data Repository (NMDR) website, the Metabolomics Workbench, https://www.metabolomicsworkbench.org, where it has been assigned Study ID ST004671. The data can be accessed directly via its Project DOI: https://doi.org/10.21228/M8Q56D. This work is supported by NIH grant U2C-DK119886 and OT2-OD030544 grants.
Acknowledgments
We would like to thank Fiehn’ group at University of California Davis for their help in adapting their method to wastewater. We would also like to thank Gianluca Arauz at IRB Barcelona for doing the data treatment with R.
Conflicts of Interest
The authors declare no conflicts of interest.
Abbreviations
The following abbreviations are used in this manuscript:
| ACN | Acetonitrile |
| CSF | Cerebrospinal fluid |
| CTS | Chemical translation service |
| DAA | Differential abundance analysis |
| DDA | Data-dependent acquisition |
| EI | Electron ionization |
| ESI | Electrospray ionization |
| FAME | Fatty acid methyl ester |
| GC | Gas chromatography |
| H2O | Water |
| HILIC | Hydrophilic interaction liquid chromatography |
| InChIKeys | International chemical identifier |
| IPA | 2-propanol |
| LC | Liquid chromatography |
| MeOH | Methanol |
| MeOx | Methoxyamine hydrochloride |
| MoNA | Mass bank of North America |
| MS | Mass spectrometry |
| MSI | Metabolomics standards initiative |
| MTBE | Methyl-tert-butyl ether |
| NMR | Nuclear magnetic resonance |
| PCA | Principal component analysis |
| RP | Reversed-phase |
| UHPL | Ultra high-performance liquid chromatography |
References
- Daughton, C.G. Monitoring wastewater for assessing community health: Sewage Chemical-Information Mining (SCIM). Sci. Total Environ. 2018, 619–620, 748–764. [Google Scholar] [CrossRef] [Scilit] [PubMed]
- Zahedi, A.; Monis, P.; Deere, D.; Ryan, U. Wastewater-based epidemiology—Surveillance and early detection of waterborne pathogens with a focus on SARS-CoV-2, Cryptosporidium and Giardia. Parasitol. Res. 2021, 120, 4167–4188. [Google Scholar] [CrossRef] [Scilit] [PubMed]
- Baker, D.R.; Barron, L.; Kasprzyk-Hordern, B. Illicit and pharmaceutical drug consumption estimated via wastewater analysis. Part A: Chemical analysis and drug use estimates. Sci. Total Environ. 2014, 487, 629–641. [Google Scholar] [CrossRef] [Scilit] [PubMed]
- Subedi, B.; Balakrishna, K.; Joshua, D.I.; Kannan, K. Mass loading and removal of pharmaceuticals and personal care products including psychoactives, antihypertensives, and antibiotics in two sewage treatment plants in southern India. Chemosphere 2017, 167, 429–437. [Google Scholar] [CrossRef] [Scilit] [PubMed]
- Tscharke, B.J.; Chen, C.; Gerber, J.P.; White, J.M. Temporal trends in drug use in Adelaide, South Australia by wastewater analysis. Sci. Total Environ. 2016, 565, 384–391. [Google Scholar] [CrossRef] [Scilit] [PubMed]
- Rousis, N.I.; Gracia-Lor, E.; Reid, M.J.; Baz-Lomba, J.A.; Ryu, Y.; Zuccato, E.; Thomas, K.V.; Castiglioni, S. Assessment of human exposure to selected pesticides in Norway by wastewater analysis. Sci. Total Environ. 2020, 723, 138132. [Google Scholar] [CrossRef] [Scilit] [PubMed]
- González-Mariño, I.; Rodil, R.; Barrio, I.; Cela, R.; Quintana, J.B. Wastewater-Based Epidemiology as a New Tool for Estimating Population Exposure to Phthalate Plasticizers. Environ. Sci. Technol. 2017, 51, 3902–3910. [Google Scholar] [CrossRef] [Scilit] [PubMed]
- Bedia, C. Metabolomics in environmental toxicology: Applications and challenges. Trends Environ. Anal. Chem. 2022, 34, e00161. [Google Scholar] [CrossRef] [Scilit]
- Jeppesen, M.J.; Powers, R. Multiplatform untargeted metabolomics. Magn. Reson. Chem. 2023, 61, 628–653. [Google Scholar] [CrossRef] [Scilit] [PubMed]
- Pandey, A.; Kasuga, I.; Furumai, H.; Kurisu, F. Non-target liquid chromatography high-resolution mass spectrometry screening to prioritize unregulated micropollutants that persist through domestic wastewater treatment. Sci. Total Environ. 2024, 947, 174486. [Google Scholar] [CrossRef] [Scilit] [PubMed]
- Tisler, S.; Kilpinen, K.; Devers, J.; Castro, M.; Jørgensen, M.B.; Mandava, G.; Lundqvist, J.; Cedergreen, N.; Christensen, J.H. Mapping Emerging Contaminants in Wastewater Effluents through Multichromatographic Platform Analysis and Source Correlations. Environ. Sci. Technol. 2025, 59, 5766–5774. [Google Scholar] [CrossRef] [Scilit] [PubMed]
- Huidobro-López, B.; León, C.; López-Heras, I.; Martínez-Hernández, V.; Nozal, L.; Crego, A.L.; de Bustamante, I. Untargeted metabolomic analysis to explore the impact of soil amendments in a non-conventional wastewater treatment. Sci. Total Environ. 2023, 870, 161890. [Google Scholar] [CrossRef] [Scilit] [PubMed]
- Senta, I.; Rodríguez-Mozaz, S.; Corominas, L.; Petrovic, M. Wastewater-based epidemiology to assess human exposure to personal care and household products—A review of biomarkers, analytical methods, and applications. Trends Environ. Anal. Chem. 2020, 28, e00103. [Google Scholar] [CrossRef] [Scilit] [PubMed]
- Duan, L.; Zhang, Y.; Wang, B.; Yu, G.; Gao, J.; Cagnetta, G.; Huang, C.; Zhai, N. Wastewater surveillance for 168 pharmaceuticals and metabolites in a WWTP: Occurrence, temporal variations and feasibility of metabolic biomarkers for intake estimation. Water Res. 2022, 216, 118321. [Google Scholar] [CrossRef] [Scilit] [PubMed]
- Carrascal, M.; Sánchez-Jiménez, E.; Fang, J.; Pérez-López, C.; Ginebreda, A.; Barceló, D.; Abian, J. Sewage Protein Information Mining: Discovery of Large Biomolecules as Biomarkers of Population and Industrial Activities. Environ. Sci. Technol. 2023, 57, 10929–10939. [Google Scholar] [CrossRef] [Scilit] [PubMed]
- Matyash, V.; Liebisch, G.; Kurzchalia, T.V.; Shevchenko, A.; Schwudke, D. Lipid extraction by methyl-terf-butyl ether for high-throughput lipidomics. J. Lipid Res. 2008, 49, 1137–1146. [Google Scholar] [CrossRef] [Scilit] [PubMed]
- Sud, M.; Fahy, E.; Cotter, D.; Azam, K.; Vadivelu, I.; Burant, C.; Edison, A.; Fiehn, O.; Higashi, R.; Nair, K.S.; et al. Metabolomics Workbench: An international repository for metabolomics data and metadata, metabolite standards, protocols, tutorials and training, and analysis tools. Nucleic Acids Res. 2016, 44, D463–D470. [Google Scholar] [CrossRef] [Scilit] [PubMed]
- Tsugawa, H.; Cajka, T.; Kind, T.; Ma, Y.; Higgins, B.; Ikeda, K.; Kanazawa, M.; VanderGheynst, J.; Fiehn, O.; Arita, M. MS-DIAL: Data-independent MS/MS deconvolution for comprehensive metabolome analysis. Nat. Methods 2015, 12, 523–526. [Google Scholar] [CrossRef] [Scilit] [PubMed]
- Sumner, L.W.; Amberg, A.; Barrett, D.; Beale, M.H.; Beger, R.; Daykin, C.A.; Fan, T.W.-M.; Fiehn, O.; Goodacre, R.; Griffin, J.L.; et al. Proposed minimum reporting standards for chemical analysis: Chemical Analysis Working Group (CAWG) Metabolomics Standards Initiative (MSI). Metabolomics 2007, 3, 211–221. [Google Scholar] [CrossRef] [Scilit] [PubMed]
- DeFelice, B.C.; Mehta, S.S.; Samra, S.; Čajka, T.; Wancewicz, B.; Fahrmann, J.F.; Fiehn, O. Mass Spectral Feature List Optimizer (MS-FLO): A Tool to Minimize False Positive Peak Reports in Untargeted Liquid Chromatography-Mass Spectroscopy (LC-MS) Data Processing. Anal. Chem. 2017, 89, 3250–3255. [Google Scholar] [CrossRef] [Scilit] [PubMed]
- Wohlgemuth, G.; Haldiya, P.K.; Willighagen, E.; Kind, T.; Fiehn, O. The chemical translation service-a web-based tool to improve standardization of metabolomic reports. Bioinformatics 2010, 26, 2647–2648. [Google Scholar] [CrossRef] [Scilit] [PubMed]
- Djoumbou Feunang, Y.; Eisner, R.; Knox, C.; Chepelev, L.; Hastings, J.; Owen, G.; Wishart, D.S. ClassyFire: Automated chemical classification with a comprehensive, computable taxonomy. J. Cheminform. 2016, 8, 61. [Google Scholar] [CrossRef] [Scilit] [PubMed]
- Dessau, R.B.; Pipper, C.B. “R”--project for statistical computing. Ugeskr. Læg. 2008, 170, 328–330. [Google Scholar] [PubMed]
- Bolstad, B.M.; Irizarry, R.A.; Åstrand, M.; Speed, T.P. A comparison of normalization methods for high density oligonucleotide array data based on variance and bias. Bioinformatics 2003, 19, 185–193. [Google Scholar] [CrossRef] [Scilit] [PubMed]
- Rosati, D.; Palmieri, M.; Brunelli, G.; Morrione, A.; Iannelli, F.; Frullanti, E.; Giordano, A. Differential gene expression analysis pipelines and bioinformatic tools for the identification of specific biomarkers: A review. Comput. Struct. Biotechnol. J. 2024, 23, 1154–1168. [Google Scholar] [CrossRef] [Scilit] [PubMed]
- Ritchie, M.E.; Phipson, B.; Wu, D.; Hu, Y.; Law, C.W.; Shi, W.; Smyth, G.K. limma powers differential expression analyses for RNA-sequencing and microarray studies. Nucleic Acids Res. 2015, 43, e47. [Google Scholar] [CrossRef] [Scilit] [PubMed]
- Smyth, G.K. Linear Models and Empirical Bayes Methods for Assessing Differential Expression in Microarray Experiments. Stat. Appl. Genet. Mol. Biol. 2004, 3, 3. [Google Scholar] [CrossRef] [Scilit] [PubMed]
- Benjamini, Y.; Hochberg, Y. Controlling the False Discovery Rate: A Practical and Powerful Approach to Multiple Testing. J. R. Stat. Soc. Ser. B Methodol. 1995, 57, 289–300. [Google Scholar] [CrossRef] [Scilit]
- Varney, J.; Barrett, J.; Scarlata, K.; Catsos, P.; Gibson, P.R.; Muir, J.G. FODMAPs: Food composition, defining cutoff values and international application. J. Gastroenterol. Hepatol. 2017, 32, 53–61. [Google Scholar] [CrossRef] [Scilit] [PubMed]
- Li, K.; Guo, Z.; Bai, L. Digitoxose as powerful glycosyls for building multifarious glycoconjugates of natural products and un-natural products. Synth. Syst. Biotechnol. 2024, 9, 701–712. [Google Scholar] [CrossRef] [Scilit] [PubMed]
- Tai, Y.; Zhang, Z.; Liu, Z.; Li, X.; Yang, Z.; Wang, Z.; An, L.; Ma, Q.; Su, Y. D-ribose metabolic disorder and diabetes mellitus. Mol. Biol. Rep. 2024, 51, 220. [Google Scholar] [CrossRef] [Scilit] [PubMed]
- Siddiqui, H.; Sami, F.; Hayat, S. Glucose: Sweet or bitter effects in plants-a review on current and future perspective. Carbohydr. Res. 2020, 487, 107884. [Google Scholar] [CrossRef] [Scilit] [PubMed]
- Mohana, A.A.; Roddick, F.; Maniam, S.; Gao, L.; Pramanik, B.K. Component analysis of fat, oil and grease in wastewater: Challenges and opportunities. Anal. Methods 2023, 15, 5112–5128. [Google Scholar] [CrossRef] [Scilit] [PubMed]
- Abedi, E.; Sahari, M.A. Long-chain polyunsaturated fatty acid sources and evaluation of their nutritional and functional properties. Food Sci. Nutr. 2014, 2, 443–463. [Google Scholar] [CrossRef] [Scilit] [PubMed]
- Nakamura, M.T.; Yudell, B.E.; Loor, J.J. Regulation of energy metabolism by long-chain fatty acids. Prog. Lipid Res. 2014, 53, 124–144. [Google Scholar] [CrossRef] [Scilit] [PubMed]
- Tripathi, G.; Kumar, A.; Rajkhowa, S.; Tiwari, V.K. Synthesis of biologically relevant heterocyclic skeletons under solvent-free condition. In Green Synthetic Approaches for Biologically Relevant Heterocycles; Elsevier: Amsterdam, The Netherlands, 2021; Volume 1, pp. 421–459. [Google Scholar] [CrossRef] [Scilit]
- Tinschert, A.; Kiener, A.; Heinzmann, K.; Tschech, A. Isolation of new 6-methylnicotinic-acid-degrading bacteria, one of which catalyses the regioselective hydroxylation of nicotinic acid at position C2. Arch. Microbiol. 1997, 168, 355–361. [Google Scholar] [CrossRef] [Scilit] [PubMed]
- Jacob, P.; Yu, L.; Duan, M.; Ramos, L.; Yturralde, O.; Benowitz, N.L. Determination of the nicotine metabolites cotinine and trans-3′-hydroxycotinine in biologic fluids of smokers and non-smokers using liquid chromatography-tandem mass spectrometry: Biomarkers for tobacco smoke exposure and for phenotyping cytochrome P450 2A6 activity. J. Chromatogr. B 2011, 879, 267–276. [Google Scholar] [CrossRef] [Scilit] [PubMed]
- da Silva, V.R.; Gregory, J.F. Vitamin B6. In Present Knowledge in Nutrition; Elsevier: Amsterdam, The Netherlands, 2020; pp. 225–237. [Google Scholar] [CrossRef] [Scilit]
- Bispo, M.S.; Veloso, M.C.C.; Pinheiro, H.L.C.; De Oliveira, R.F.S.; Reis, J.O.N.; De Andrade, J.B. Simultaneous Determination of Caffeine, Theobromine, and Theophylline by High-Performance Liquid Chromatography. J. Chromatogr. Sci. 2002, 40, 45–48. [Google Scholar] [CrossRef] [Scilit] [PubMed]
- Heinig, M.; Johnson, R.J. Role of uric acid in hypertension, renal disease, and metabolic syndrome. Clevel. Clin. J. Med. 2006, 73, 1059–1064. [Google Scholar] [CrossRef] [Scilit] [PubMed]
- Kimiyoshi, I.; Yoshihiro, A.; Kumi, N.; Shinsei, M.; Tatsuo, H.; Osamu, S.; Nobuyoshi, S.; Takeshi, N. Cloning of the cDNA encoding human xanthine dehydrogenase (oxidase): Structural analysis of the protein and chromosomal location of the gene. Gene 1993, 133, 279–284. [Google Scholar] [CrossRef] [Scilit] [PubMed]
- Schmid-Wendtner, M.-H.; Korting, H.C. Penciclovir Cream—Improved Topical Treatment for Herpes simplex Infections. Skin. Pharmacol. Physiol. 2004, 17, 214–218. [Google Scholar] [CrossRef] [Scilit] [PubMed]
- Tang, J.; Li, Y.; Zhang, L.; Mu, J.; Jiang, Y.; Fu, H.; Zhang, Y.; Cui, H.; Yu, X.; Ye, Z. Biosynthetic Pathways and Functions of Indole-3-Acetic Acid in Microorganisms. Microorganisms 2023, 11, 2077. [Google Scholar] [CrossRef] [Scilit] [PubMed]
- Claustrat, B.; Leston, J. Melatonin: Physiological effects in humans. Neurochirurgie 2015, 61, 77–84. [Google Scholar] [CrossRef] [Scilit] [PubMed]
- Richard, D.M.; Dawes, M.A.; Mathias, C.W.; Acheson, A.; Hill-Kapturczak, N.; Dougherty, D.M. L-Tryptophan: Basic Metabolic Functions, Behavioral Research and Therapeutic Indications. Int. J. Tryptophan Res. 2009, 2, IJTR.S2129. [Google Scholar] [CrossRef] [Scilit] [PubMed]
- Kogawa, A.C.; Pires, A.E.D.T.; Salgado, H.R.N. Atorvastatin: A Review of Analytical Methods for Pharmaceutical Quality Control and Monitoring. J. AOAC Int. 2019, 102, 801–809. [Google Scholar] [CrossRef] [Scilit] [PubMed]
- Hauso, Ø.; Martinsen, T.C.; Waldum, H. 5-Aminosalicylic acid, a specific drug for ulcerative colitis. Scand. J. Gastroenterol. 2015, 50, 933–941. [Google Scholar] [CrossRef] [Scilit] [PubMed]
- Yu, Q.; Wang, D.; Dong, P.; Zheng, L. Probiotics Combined with Trimebutine for the Treatment of Irritable Bowel Syndrome Patients: A Systematic Review and Meta-Analysis. J. Gastroenterol. Hepatol. 2025, 40, 677–691. [Google Scholar] [CrossRef] [Scilit] [PubMed]
- Wang, M.; Peng, Y.; Yan, H.; Pan, Z.; Du, R.; Liu, G. Bioequivalence and Safety of Two Amisulpride Formulations in Healthy Chinese Subjects Under Fasting and Fed Conditions: A Randomized, Open-Label, Single-Dose, Crossover Study. Drugs R D. 2025, 25, 117–125. [Google Scholar] [CrossRef] [Scilit] [PubMed]
- Fasipe, O.J. The emergence of new antidepressants for clinical use: Agomelatine paradox versus other novel agents. IBRO Rep. 2019, 6, 95–110. [Google Scholar] [CrossRef] [Scilit] [PubMed]
- Ogura, T.; Shiraishi, C. Comparison of Adverse Events Among Angiotensin Receptor Blockers in Hypertension Using the United States Food and Drug Administration Adverse Event Reporting System. Cureus 2025, 17, e81912. [Google Scholar] [CrossRef] [Scilit] [PubMed]
- Dong, F.; Zhou, Y.; Zeng, L.; Watanabe, N.; Su, X.; Yang, Z. Optimization of the Production of 1-Phenylethanol Using Enzymes from Flowers of Tea (Camellia sinensis) Plants. Molecules 2017, 22, 131. [Google Scholar] [CrossRef] [Scilit] [PubMed]
- Suwała, J.; Machowska, M.; Wiela-Hojeńska, A. Venlafaxine Pharmacogenetics: A Comprehensive Review. Pharmacogenomics 2019, 20, 829–845. [Google Scholar] [CrossRef] [Scilit] [PubMed]

Disclaimer/Publisher’s Note: The statements, opinions and data contained in all publications are solely those of the individual author(s) and contributor(s) and not of MDPI and/or the editor(s). MDPI and/or the editor(s) disclaim responsibility for any injury to people or property resulting from any ideas, methods, instructions or products referred to in the content. |
© 2026 by the authors. Licensee MDPI, Basel, Switzerland. This article is an open access article distributed under the terms and conditions of the Creative Commons Attribution (CC BY) license.