1. Introduction
Air pollution remains one of the most important environmental challenges affecting public health worldwide. The World Health Organization estimates that ambient air pollution is responsible for millions of premature deaths each year, particularly in urban environments where population density, transport emissions and other anthropogenic sources are concentrated [
1,
2]. Among the pollutants of greatest concern, particulate matter (PM
10 and PM
2.5) and traffic-related pollutants such as nitrogen oxides (NO
x) and nitrogen dioxide (NO
2) have been associated with respiratory diseases, impaired lung function and asthma exacerbations [
3]. In addition, long- and short-term exposure to NO
2 and PM
2.5 have been linked to broader adverse health outcomes, including cardiovascular disorders and increased mortality [
4]. Growing evidence also suggests links between long-term exposure to air pollution and adverse neurological, cognitive and developmental outcomes, particularly during early life [
5].
Children constitute one of the most vulnerable population groups affected by environmental pollution. As highlighted by Muttoo et al. [
3], young children are particularly sensitive to air pollution exposure because their respiratory systems are still developing and because exposure assessment during early life is critical for understanding respiratory health effects. Particulate matter has been associated with respiratory symptoms and childhood respiratory disease, as summarized by Liu et al. [
6], while Connor and Zablotsky [
7] reported associations between ambient air pollution and childhood asthma. Beyond respiratory outcomes, Sunyer et al. [
5] showed that children attending schools with higher traffic-related air pollution had slower cognitive development.
The increasing availability of environmental monitoring systems, geographic information systems (GIS) and digital navigation technologies has created new opportunities to incorporate environmental information into route planning. Instead of optimizing exclusively for travel time or distance, modern routing systems can account for environmental exposures, enabling the identification of routes that minimize contact with harmful pollutants. Rafiepourgatabi et al. [
8] showed that route choice can influence children’s exposure while walking to school. Similarly, Mölter et al. [
9] demonstrated that alternative school walking routes can reduce cumulative NO
2 and PM
10 exposure compared with shortest-path routes.
From a technological perspective, exposure-aware routing approaches typically combine digital street networks with spatially resolved environmental information and graph-based routing algorithms. Previous solutions have incorporated air quality data into pedestrian and cycling route planning [
10], while more recent open-source platforms such as Green Paths integrate OpenStreetMap networks with multiple environmental exposure layers [
11]. Other approaches have similarly demonstrated the feasibility of incorporating pollution estimates into pedestrian routing while balancing environmental benefits against additional travel distance [
12]. These developments provide the technological basis for moving from conventional shortest-path navigation towards environmentally informed route recommendations.
Motivated by the need to reduce children’s exposure to urban air pollution, this work investigates whether environment-aware route optimization can provide meaningful exposure reductions during daily school commuting journeys. Using simulated school trajectories in Donostia-San Sebastián and Bilbao (which, hereafter, refers to the Greater Bilbao metropolitan area), we evaluate the potential of PM10- and NOx-aware routing and quantify the trade-off between exposure reduction and additional travel distance. By analyzing approximately 2000 simulated school commuting routes, the study aimed to determine when exposure-aware routing may provide practical benefits and how these opportunities vary across pollutants and urban environments.
3. Materials and Methods
3.1. Study Area
This study was conducted in two urban areas located in the Basque Country (northern Spain): Donostia-San Sebastián and Bilbao. These study areas were selected because they present markedly different urban and environmental characteristics, allowing the evaluation of pollutant-aware routing under distinct conditions.
Donostia-San Sebastián is a medium-sized coastal city characterized by a compact urban layout, an extensive pedestrian infrastructure and the influence of maritime air circulation. In contrast, the metropolitan area of Bilbao is larger and more densely populated, with a historically industrial environment, a more complex topography and higher traffic intensity. These differences are expected to influence both the spatial distribution of air pollutants and the opportunities for environmental route optimization. These urban characteristics were used only to contextualize the differences between the two study areas and were not introduced as explicit variables in the routing model. In particular, traffic density and the location of industrial facilities were not directly incorporated into the route calculations. The environmental information used by the model consisted of the measured PM10 and NOx concentrations obtained from the Basque Government monitoring network, which were spatially interpolated across the pedestrian street network as described below.
To quantify these urban contrasts, Donostia-San Sebastián’s compact urban core spans 60.89 km2 with roughly 190,000 inhabitants (density ≈ 3106 inhabitants/km2) and a cycling network of about 65–70 km, which is largely complete, given the flat topography of the city. Bilbao’s metropolitan area, by contrast, covers around 500.2 km2 and concentrates approximately 950,000 inhabitants (density ≈ 1900 inhabitants/km2, reflecting the inclusion of less dense industrial territory around a much denser urban core), with a regional cycling network still under development (162 of a planned 365 km were completed as of 2025) and a substantially more complex road system of tunnels, ring highways and high-traffic access corridors, which prompted the introduction of a Low Emission Zone in June 2024. At the demographic level, the core population of Bilbao is slightly younger (23.6% over 65 vs. 24.3% in Donostia) but has a lower average family income (€53,052 vs. €62,712 in Donostia, 2023 data).
The comparison between these two contrasting urban environments provides an opportunity to investigate whether the effectiveness of exposure-aware routing depends on the local urban morphology and pollutant distribution patterns.
3.2. Synthetic Population and School Commuting Generation
To evaluate exposure-aware routing under realistic school commuting conditions, a synthetic population of school-age children was generated for Donostia-San Sebastián and the Greater Bilbao metropolitan area using a probabilistic microsimulation framework. The simulated households reproduced the demographic and socioeconomic characteristics of both study areas, based on official census statistics. Variables including household composition, child age, socioeconomic status, educational level and occupational profiles were assigned according to publicly available demographic information.
Each synthetic child was assigned to a plausible educational institution through a gravity-based school allocation model that considered residential proximity, school type, linguistic model, religious affiliation, sibling continuity and household socioeconomic characteristics. Home and school locations were represented using geographic coordinates, allowing realistic origin–destination pairs to be generated throughout the study area. The resulting synthetic population was subsequently used to create approximately 2000 daily school commuting trajectories, which served as the basis for the exposure-aware routing experiments presented in this study.
3.3. Road Network Extraction
The street network used in this study was extracted from OpenStreetMap (OSM) [
18], one of the most widely used open geographic databases for urban and transportation research. OSM provides detailed and continuously updated information on roads, pedestrian pathways, cycling infrastructure, intersections and other geographic features, making it particularly suitable for routing applications.
The road networks for Donostia-San Sebastián and the Greater Bilbao metropolitan area were downloaded using the OSMnx Python library [
19] with Python version 3.11, which enables the retrieval and processing of OpenStreetMap data as graph structures suitable for network analysis.
All routes analyzed in this study represent walking school commutes; school buses and other motorized transport modes were not considered. Accordingly, only the pedestrian street network was considered, as the objective of the study was to evaluate daily walking routes between children’s residences and their assigned schools. The resulting network was represented as a directed graph in which intersections were modelled as nodes and street segments as edges. Each edge was associated with its geometric length, allowing shortest-path calculations and pollutant exposure estimation to be performed consistently throughout the network.
This graph representation constituted the spatial framework upon which pollutant concentrations were subsequently assigned and route optimization was carried out.
3.4. Air Quality Data Acquisition
Air quality data were obtained from the official Air Quality Monitoring Network of the Basque Government [
20,
21], which provides continuous measurements of atmospheric pollutants through a network of fixed monitoring stations distributed across the Basque Country. The data were accessed programmatically through the public REST API provided by the Basque Government [
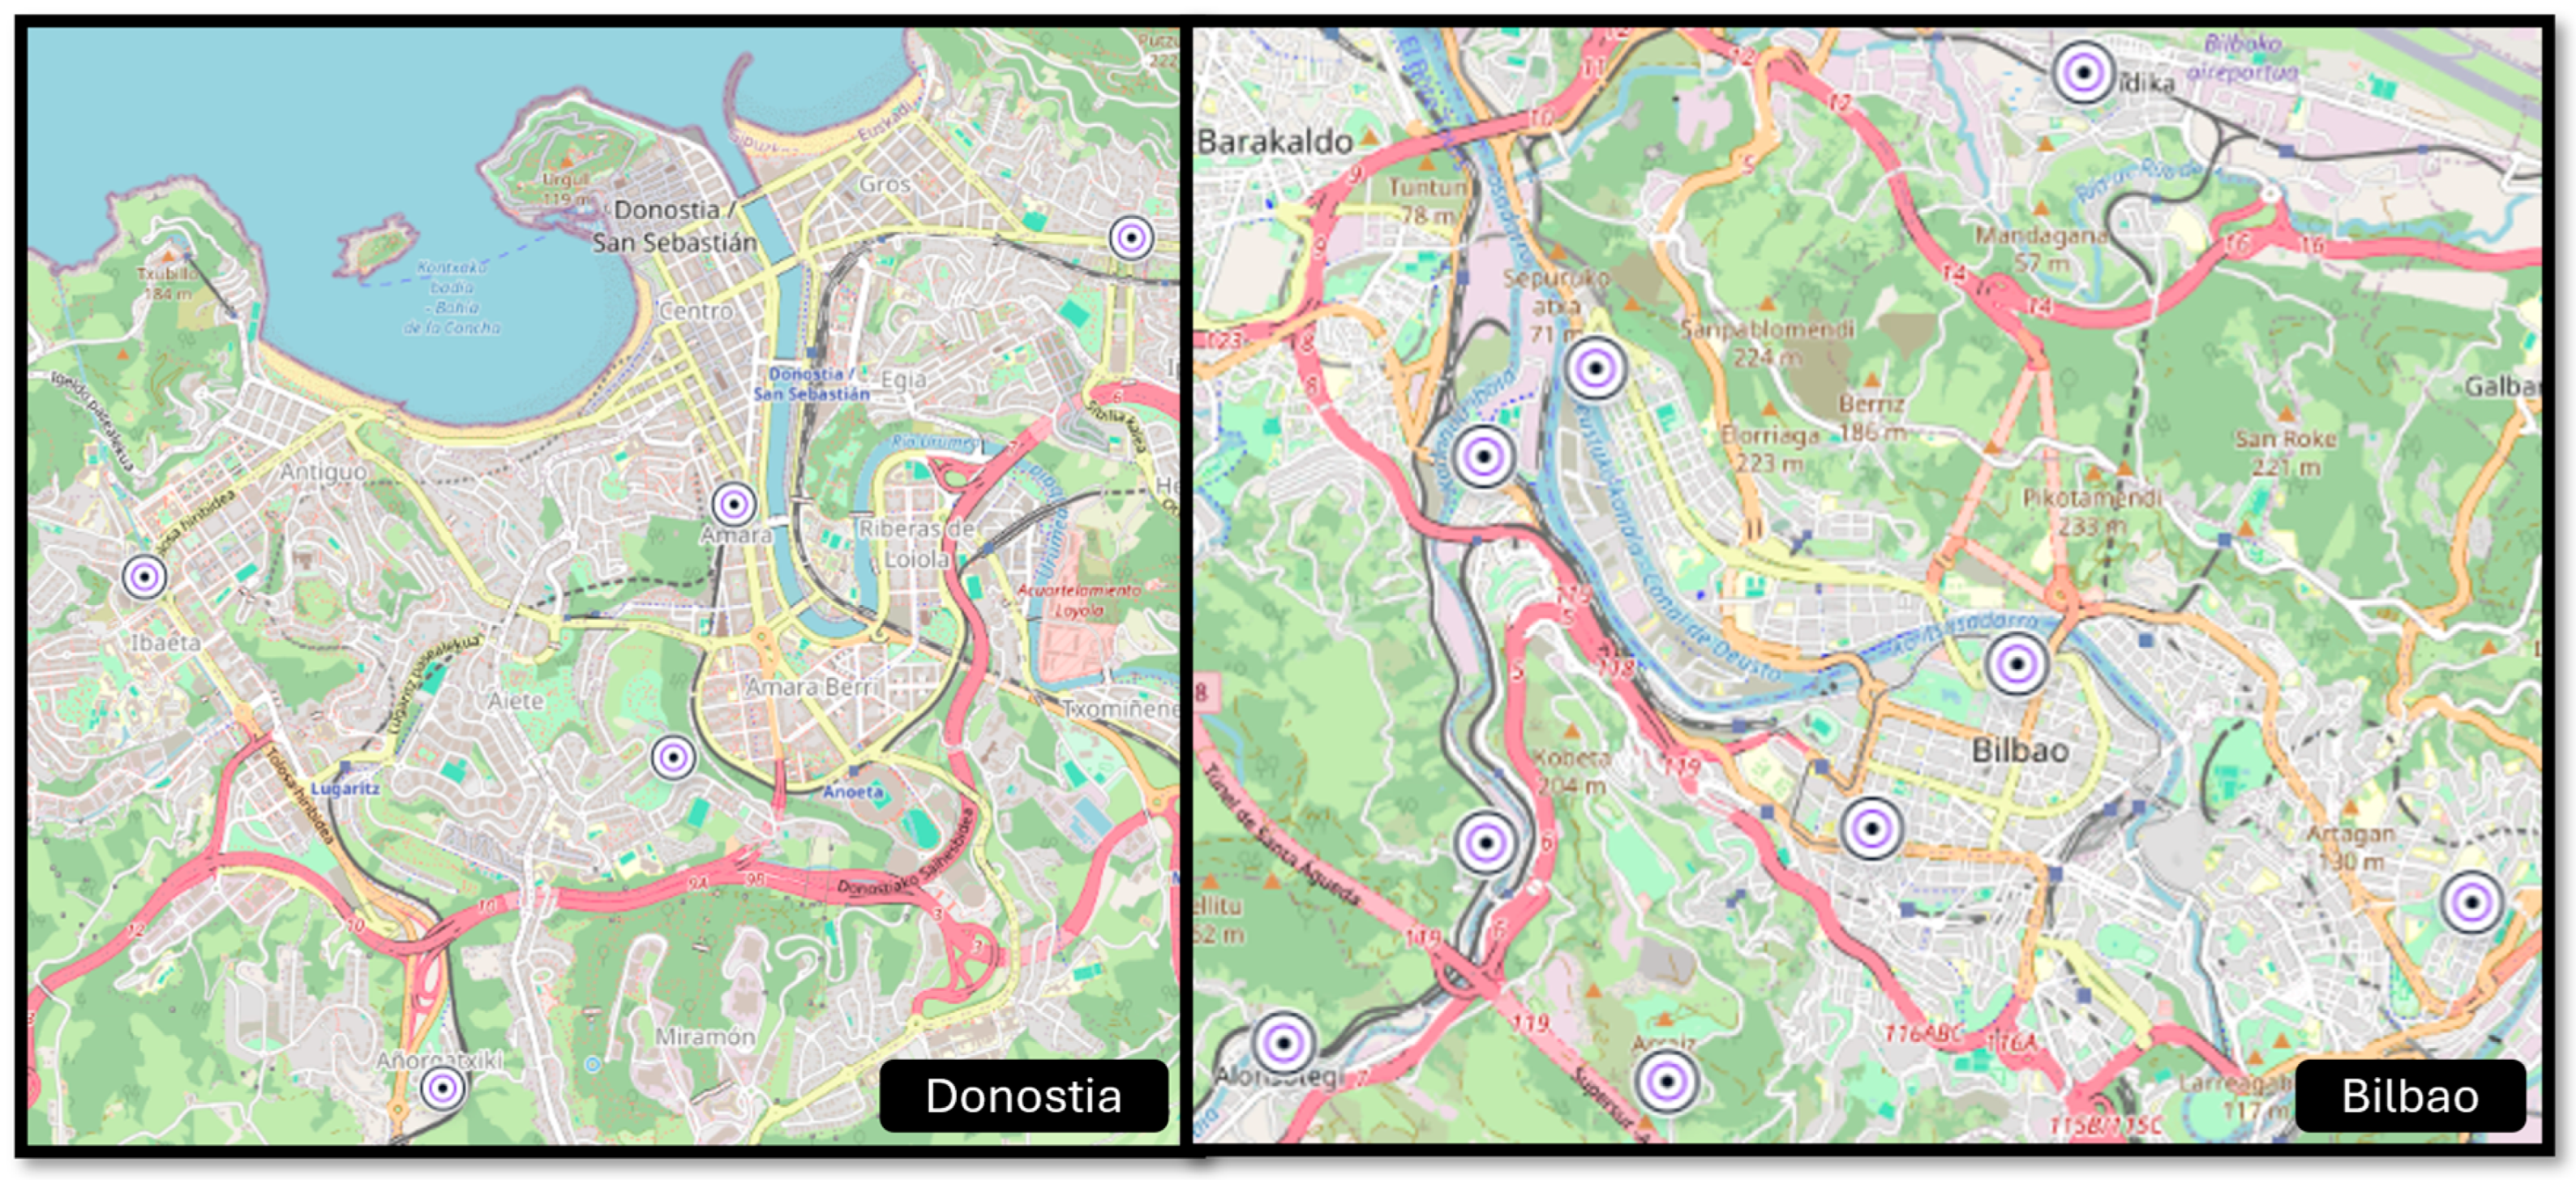
22], allowing automatic retrieval of pollutant measurements and stations’ metadata. The environmental snapshot used for the route calculations corresponded to 15 September 2025 at 09:00 local time. The monitoring stations used in the analysis are depicted in
Figure 1.
A total of five monitoring stations were considered in Donostia-San Sebastián and nine stations in the Greater Bilbao metropolitan area. All stations included measurements of both PM10 and NOx, ensuring the consistent availability of these pollutants across the monitoring stations in both study areas. In contrast, ozone (O3) measurements were available at only 2 of the 5 stations (40%) in Donostia-San Sebastián and 4 of the 9 stations (44%) in the Greater Bilbao metropolitan area. Consequently, PM10 and NOx were selected for the present study because they provided the most complete and comparable monitoring coverage, enabling reliable spatial interpolation across both study areas. Ozone was not considered because its incomplete spatial coverage would have reduced the reliability and comparability of the interpolated concentration surfaces.
3.5. Spatial Interpolation
Air quality measurements are only available at the discrete locations of the monitoring stations. Therefore, pollutant concentrations must be estimated throughout the street network before exposure-aware route optimization can be performed. To obtain a continuous representation of air pollution across each study area, spatial interpolation was applied to the measurements retrieved from the Basque Government Air Quality Monitoring Network.
Among the available interpolation techniques, Inverse Distance Weighting (IDW) [
23] was selected because of its simplicity, computational efficiency and widespread application in environmental sciences. IDW assumes that nearby observations have a greater influence on an unknown location than distant observations, producing continuous concentration surfaces while preserving the measured values at the monitoring stations. The method has been extensively applied for interpolating environmental variables, including air pollutant concentrations, particularly when observations are obtained from relatively sparse monitoring networks [
23]. The spatial sparsity of fixed monitoring networks is partly related to the substantial operational and maintenance costs associated with deploying dense networks of reference-grade stations. Parde et al. [
24] similarly highlighted the limited spatial resolution of conventional PM monitoring networks and explored remote-sensing approaches as a complementary source of particulate matter information. Future exposure-aware routing frameworks could benefit from integrating such complementary data sources to increase the spatial resolution of environmental exposure estimates.
Although geostatistical methods such as ordinary kriging may provide improved predictions under certain conditions, they require additional assumptions regarding spatial stationarity and variogram modelling. Given the limited number of monitoring stations available in the study areas, IDW provides a robust and computationally efficient alternative that has been widely adopted in similar environmental applications [
23,
25].
For each pollutant, the concentration at any location
was estimated as a weighted average of the surrounding monitoring stations according to the classical IDW formulation
where
denotes the concentration measured at monitoring station
j,
is the Haversine distance between location
and station
,
is the number of monitoring stations used for the interpolation and
is the distance-decay parameter controlling the influence of neighboring stations. In the present study,
To maintain spatial balance around each graph node, the nearest monitoring station in each geographical quadrant was considered within a maximum radius of 1.5 km; when no station was available within this radius, the nearest station in each quadrant was used.
The interpolation was performed independently for PM10 and NOx at each node of the pedestrian street network. For each street segment connecting two nodes, the pollutant concentration assigned to the segment was calculated as the arithmetic mean of the concentrations interpolated at its two endpoints. These segment-level values constituted the environmental cost layer used for cumulative exposure estimation and pollutant-aware route optimization.
3.6. Exposure Estimation
Once pollutant concentrations had been assigned to every street segment through the interpolation process, the cumulative pollutant exposure associated with each route was estimated. Rather than considering only the average pollutant concentration along a trajectory, exposure was modelled as the cumulative environmental burden experienced while traveling through the street network. This formulation has been adopted in previous exposure-aware routing studies because it captures both the pollutant concentration and the distance over which individuals are exposed [
9,
11,
17].
Under the assumption that the pollutant concentration remains constant along each street segment, the cumulative exposure of a route was approximated as the sum of the pollutant concentration multiplied by the length of every traversed segment
where
denotes the cumulative pollutant exposure;
is the interpolated pollutant concentration assigned to street segment
, calculated as the arithmetic mean of the concentrations interpolated at its two endpoint nodes;
is the corresponding segment length and
is the total number of street segments composing the route.
This discrete edge-based formulation can be interpreted as a numerical approximation of the line integral of pollutant concentration along the traveled path
where
denotes the route and
represents the pollutant concentration at each location along the trajectory.
Unlike conventional routing approaches, where edge costs are typically defined only by travel distance or travel time, the proposed framework assigns an environmental cost to every street segment, based on the cumulative pollutant burden experienced while traversing it [
11]. Consequently, a longer route is not necessarily associated with greater exposure if it passes through areas with substantially lower pollutant concentrations. Conversely, the shortest path may present higher cumulative exposure when crossing pollution hotspots.
Cumulative exposure was calculated independently for PM10 and NOx, generating two pollutant-specific exposure metrics that were subsequently incorporated into the routing algorithm to identify environmentally optimized school commuting routes.
3.7. Pollutant-Aware Route Optimization
The routing process was implemented in Python using the NetworkX library [
26]. The conventional shortest-path route was calculated using the A* algorithm, with the Haversine distance to the destination as the heuristic function [
27]. Pollutant-aware routes were obtained using a constrained graph-search procedure that minimized cumulative pollutant exposure while limiting the total route length to a maximum of 1.2 times the corresponding shortest-path distance.
The routing objective was defined through the edge cost assigned to each scenario. Three independent routing scenarios were evaluated for every origin–destination pair:
Shortest-path routing, where the cost of each edge corresponds to its geometric length;
PM10-aware routing, where the edge costs are proportional to the cumulative PM10 exposure estimated for each street segment;
NOx-aware routing, where the edge costs are derived from the estimated cumulative NOx exposure.
For the representative scenarios presented in
Section 4.3, additional NO
2- and elevation-optimized routes were generated for illustrative purposes; these objectives were not included in the population-level quantitative analysis.
This formulation allows the identification of routes minimizing either travel distance or cumulative pollutant exposure while preserving the topology and connectivity of the pedestrian street network.
The proposed optimization strategy follows the same conceptual framework adopted by previous exposure-aware routing studies, in which environmental information is incorporated into the routing graph by assigning pollutant-related costs to individual street segments [
9,
11].
For every simulated school commuting trajectory, three optimized routes were therefore generated: the conventional shortest path, the PM
10-optimal route and the NO
x-optimal route. These routes constituted the basis for the comparative analyses presented in
Section 4.
3.8. Evaluation Metrics
The proposed routing framework was evaluated using the complete synthetic school commuting population generated for both study areas. For every origin–destination pair, three alternative routes were computed: the conventional shortest path, the PM10-optimized route and the NOx-optimized route.
Although each optimized route minimized a specific objective function, the cumulative exposure to both pollutants (PM10 and NOx) was calculated for every generated route. Similarly, the total traveled distance was computed in all cases. This comprehensive evaluation enabled the environmental and spatial consequences of each optimization strategy to be assessed simultaneously.
To quantify the effectiveness of pollutant-aware routing, the percentage of variation in cumulative pollutant exposure was calculated with respect to the conventional shortest-path solution as
where
and
denote the cumulative exposure associated with the shortest-path and optimized routes, respectively.
Similarly, the percentage of increase in traveled distance was calculated as
where
and
represent the corresponding route lengths.
Finally, the results were aggregated independently for each study area and pollutant. Besides reporting the maximum exposure reduction achieved, the analysis quantified the proportion of school commuting routes achieving reductions greater than 5%, 10%, 15% and 25%, together with the corresponding increase in traveled distance. These summary metrics provide a population-level assessment of the practical benefits of pollutant-aware routing and enable direct comparisons between pollutants and urban environments.
4. Results
A total of 2000 simulated school commuting routes (1000 per city) were generated across the cities of Donostia-San Sebastián and Bilbao. These trajectories map the daily commutes of a synthetic population comprising 2000 unique households and 3253 school-age children (1628 in Donostia-San Sebastián and 1625 in Bilbao) aged between 2 and 18 years, distributed across public, state-funded (concertada) and private educational institutions. The resulting dataset reflects the contrasting geographic scales and urban configurations of both study areas; commuting distances average 1.47 km in Donostia-San Sebastián (with a maximum of 6.55 km) and 2.98 km in the more expansive Bilbao metropolitan area (extending up to 15.96 km). For each origin–destination pair, the shortest path was first computed and subsequently compared against alternative routes optimized for specific environmental variables. Due to differences in the environmental parameters monitored by the air quality stations in each city and the need to ensure comparability between study areas, the analysis focused on PM10 and NOx concentrations, evaluating the potential reduction in cumulative exposure that could be achieved through route optimization.
4.1. Exposure Reduction Potential
The results revealed substantial differences between cities and pollutants. The highest optimization potential was observed for NOx exposure in Donostia, whereas PM10 showed the greatest optimization potential in Bilbao.
In addition to quantifying the proportion of routes achieving a given exposure reduction threshold,
Table 1,
Table 2,
Table 3 and
Table 4 also report the average increase in route distance (mean ± standard deviation) associated with those routes. Specifically, for each reduction threshold, the distance increase was calculated only for the subset of routes that achieved at least that level of exposure reduction. This metric provides a direct estimate of the additional travel effort required to obtain the corresponding environmental benefit.
When comparing the pollutant-aware routes with the corresponding shortest-path baseline for the 1000 simulated school commuting trajectories in Donostia, 106 routes (10.65%) achieved a reduction in NOx exposure greater than 5%. Furthermore, 68 routes (6.83%) achieved reductions above 10%, while 55 routes (5.53%) exceeded a 15% reduction. For these routes, the additional walking distance averaged approximately 595 ± 284 m. Particularly noteworthy, 24 routes (2.41%) achieved reductions greater than 25%, with an average increase of 701 ± 253 m. The best-performing route reduced estimated NOx exposure by 54.87% with an additional walking distance of 855 m.
For PM10 in Donostia, the optimization potential was considerably lower. Only 10 routes (1.01%) achieved reductions greater than 5%, and only 3 routes (0.30%) exceeded 10%. These improvements required only modest increases in traveled distance, averaging 86 ± 64 m and 110 ± 44 m, respectively. No routes achieved reductions above 15%. The maximum reduction observed for PM10 in Donostia was 13.27%, requiring an additional walking distance of 142 m.
In Bilbao, the opposite pattern emerged. PM10 exposure exhibited a substantially higher optimization potential than NOx. A total of 45 routes (8.18%) achieved reductions greater than 5%, while 19 routes (3.45%) exceeded 10% reductions and 9 routes (1.64%) exceeded 15%. These routes required average additional walking distances of 93 ± 83 m, 114 ± 105 m and 141 ± 95 m, respectively. Four routes achieved reductions above 25%, with an average additional walking distance of 226 ± 45 m. The best-performing route achieved a 32.79% reduction with only 281 m of additional walking.
NOx optimization in Bilbao produced more modest improvements. Only 13 routes (2.36%) achieved reductions above 5%, while 5 routes (0.91%) exceeded 10% reductions and 3 routes (0.55%) exceeded 15%. These routes required average additional walking distances of 156 ± 136 m, 181 ± 134 m and 133 ± 164 m, respectively. Nevertheless, the best-performing route still achieved a 31.91% reduction with an additional walking distance of 317 m.
These findings indicate that the potential for environmental route optimization is highly dependent on both the pollutant considered and the spatial structure of the urban environment. While PM10 optimization opportunities in Donostia were scarce, NOx optimization yielded substantial benefits. Conversely, Bilbao exhibited a much greater optimization potential for PM10 than for NOx.
Overall, the results suggest that exposure-aware routing has the potential to substantially reduce cumulative pollutant exposure for a subset of daily commuting routes. The greatest benefits were observed for NOx optimization in Donostia-San Sebastián and PM10 optimization in Bilbao, where exposure reductions exceeded 50% and 30%, respectively. Importantly, these reductions were achieved with relatively modest additional walking distances, typically ranging from approximately 100 to 600 m, while even the largest observed detours remained below 1 km.
4.2. Trade-Off Between Exposure Reduction and Distance
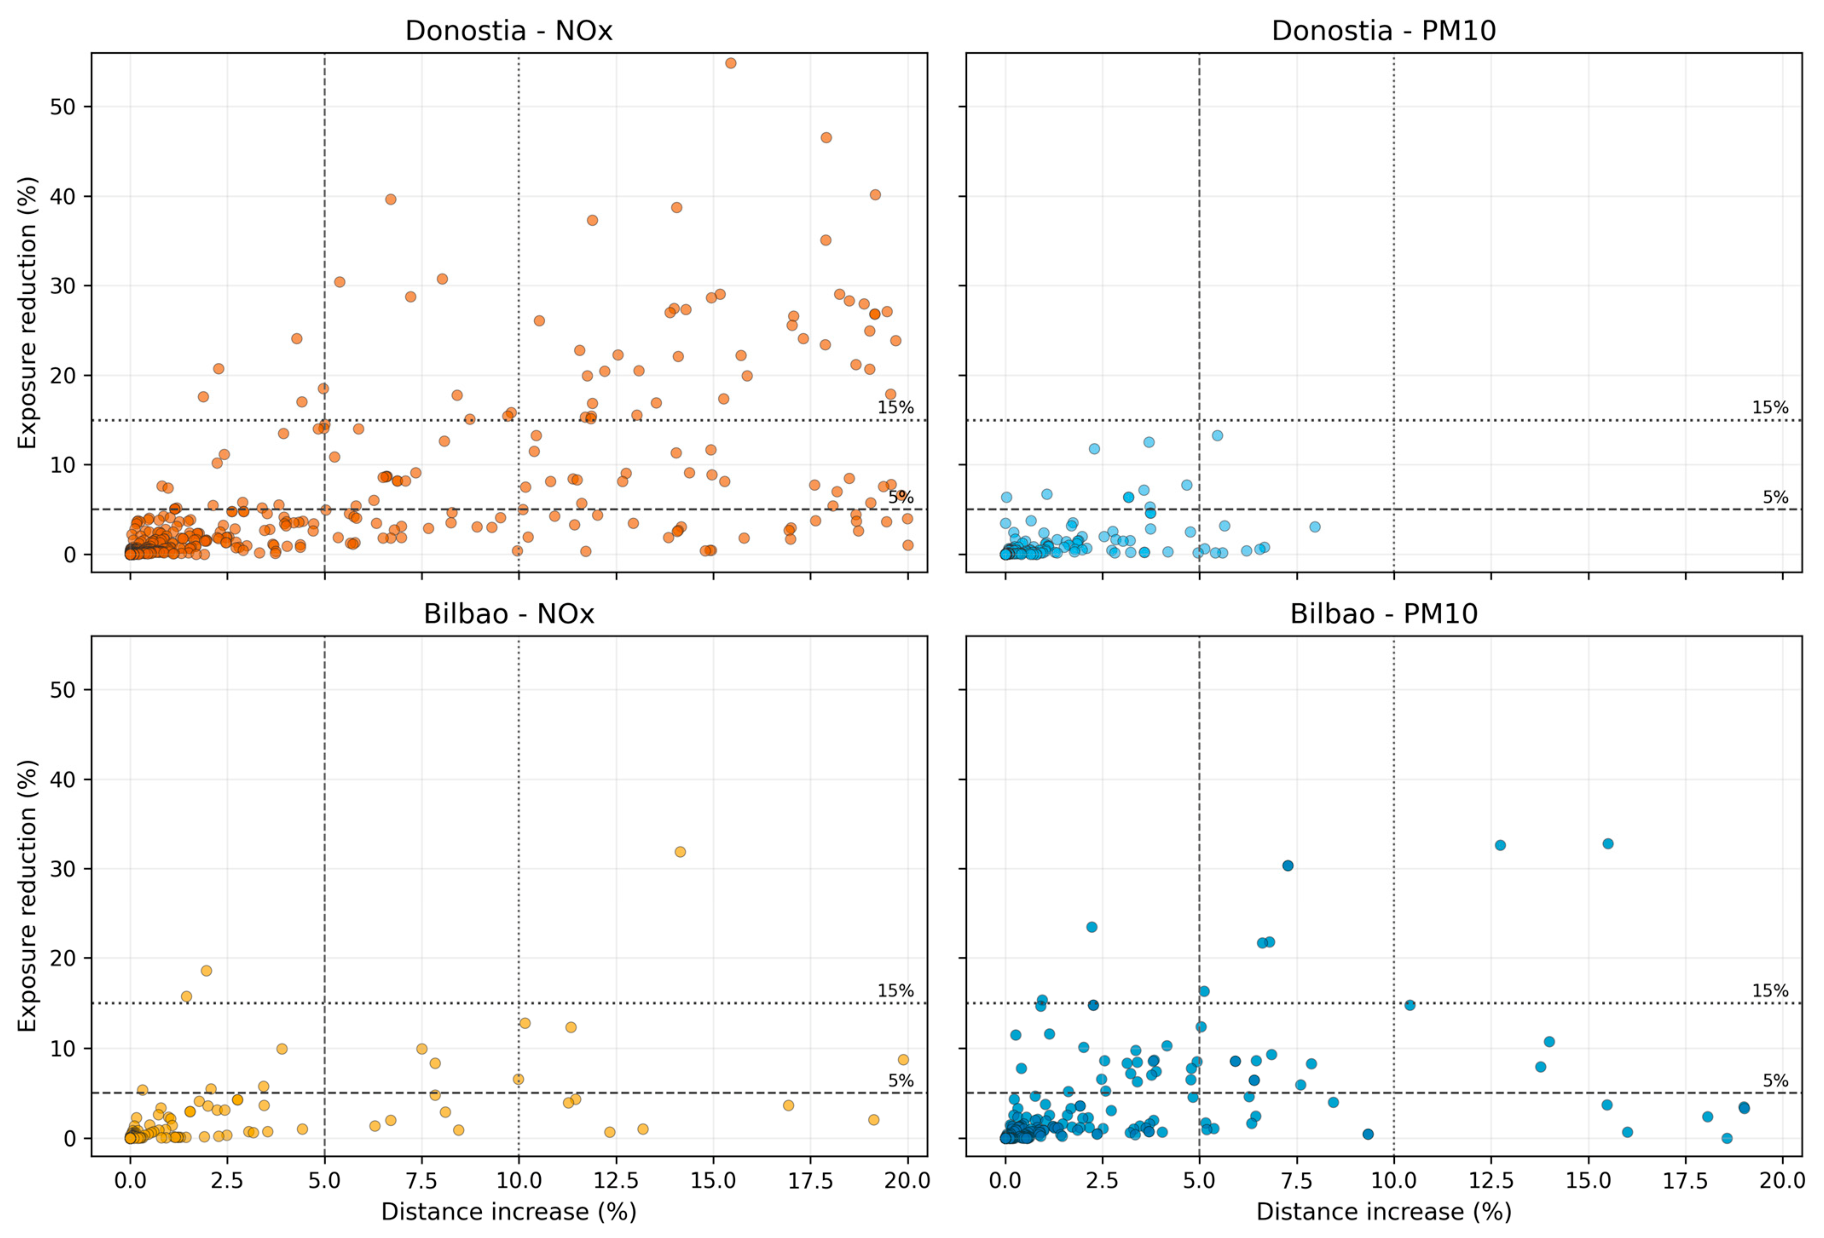
Figure 2 provides a population-level overview of the relationship between exposure reduction and additional traveled distance. Each point represents a simulated school commuting route. The x-axis indicates the percentage of increase in route length compared with the shortest-path alternative, while the y-axis represents the percentage of reduction in cumulative pollutant exposure achieved through route optimization. Dashed and dotted reference lines indicate the predefined exposure reduction and traveled distance thresholds. The results reveal substantial differences between pollutants and cities. Donostia exhibited the greatest optimization potential for NO
x exposure, with numerous routes achieving reductions above 15% and several exceeding 25%. In contrast, PM
10 optimization in Donostia produced only marginal improvements for most routes.
Bilbao displayed the opposite pattern. PM10 optimization generated a larger number of favorable routes, including several cases with exposure reductions above 25%, whereas NOx optimization produced meaningful improvements only in a limited number of trajectories.
Importantly, a considerable proportion of the beneficial routes were located in the region combining low distance increases (<10%) and meaningful exposure reductions (>5–15%). These routes represent the most attractive candidates for practical deployment, as they provide environmental benefits without substantially altering daily mobility patterns.
Table 5 summarizes the optimization potential observed across all evaluated scenarios. The highest optimization potential was observed for NO
x in Donostia-San Sebastián, where more than 10% of routes achieved reductions greater than 5% and the best-performing route reduced cumulative exposure by 54.9%. In contrast, PM
10 optimization in Donostia produced only limited improvements. In Bilbao, PM
10 exhibited the greatest optimization potential, with 8.18% of routes achieving reductions above 5% and maximum reductions reaching 32.8%. These findings indicate that the effectiveness of exposure-aware routing is highly dependent on the pollutant considered and the characteristics of the urban environment. Moreover, meaningful exposure reductions were generally achieved with moderate increases in traveled distance, typically ranging between 3% and 11% for routes achieving reductions above 5%.
Together,
Figure 2 and
Table 5 indicate that exposure-aware routing opportunities are not uniformly distributed across pollutants or urban environments. Instead, substantial improvements are concentrated in a relatively small subset of trajectories, suggesting that route recommendations should be targeted towards individuals and locations where meaningful reductions can actually be achieved.
4.3. Best-Performing Route Optimization Scenarios
The selected examples correspond to either the highest exposure reductions identified for each city–pollutant combination or particularly illustrative scenarios highlighting pollutant-specific routing behavior. By comparing routes optimized for different objectives, it is possible to identify situations where substantial reductions in pollutant exposure can be achieved with only minor increases in traveled distance, as well as cases where optimization objectives become conflicting. Together, these examples provide an intuitive understanding of the trade-offs underlying exposure-aware routing and the potential benefits of multi-objective optimization strategies.
Figure 3,
Figure 4,
Figure 5 and
Figure 6 additionally show, where visible within the displayed map extent, the environmental monitoring stations used to derive the pollutant exposure layers, allowing the spatial relationship between the monitoring network and the selected route alternatives to be visualized directly.
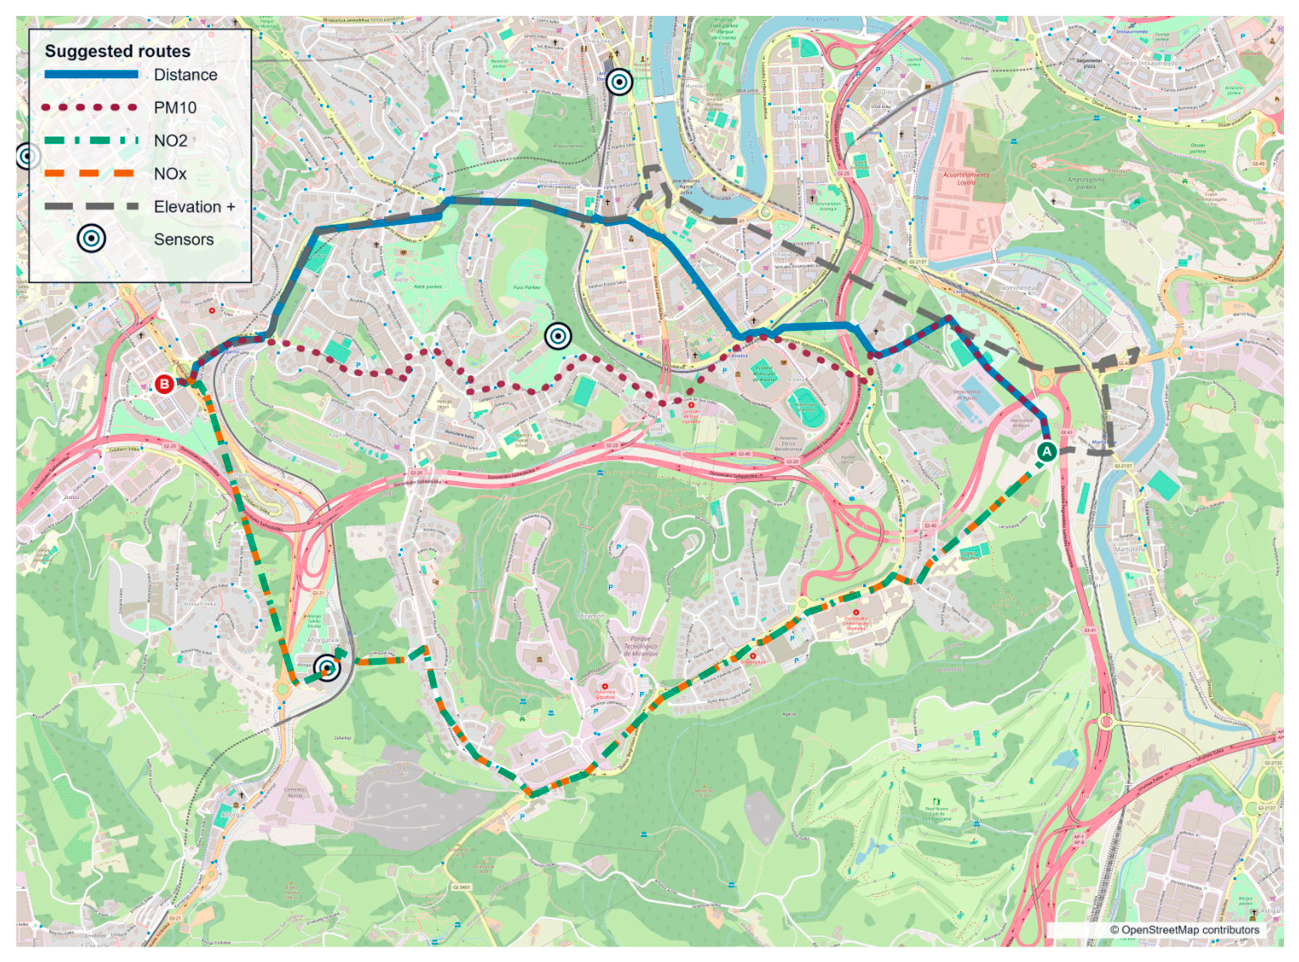
Figure 3 illustrates a representative route in Donostia-San Sebastián where optimization objectives lead to substantially different outcomes. The shortest-path route (2602 m) was used as the baseline for comparison.
When optimizing specifically for PM10 exposure, the route length increased by only 5.45%, while cumulative PM10 exposure decreased by 13.27%. This represents a favorable trade-off between environmental benefit and commuting effort.
Interestingly, optimizing for NOx produced a different route configuration. Although the traveled distance increased by 6.97%, cumulative PM10 exposure slightly increased compared with the shortest-path alternative. This observation highlights that pollutant-specific optimization objectives may be partially conflicting, and improvements for one pollutant do not necessarily translate into improvements for others.
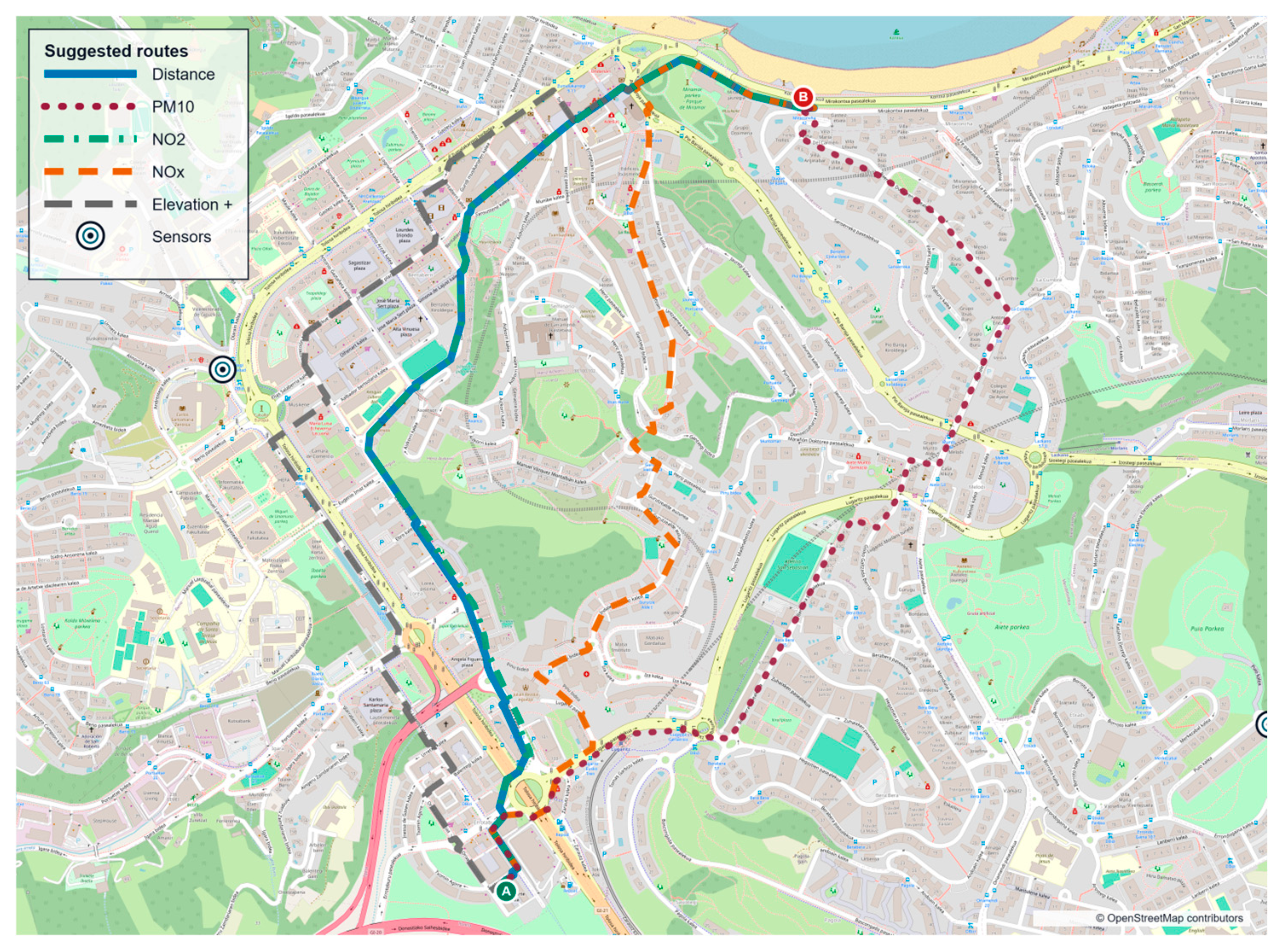
Figure 4 presents the most favorable NO
x optimization scenario identified in the study. The shortest path route traverses the central urban corridor connecting Lugaritz and Martutene, prioritizing travel efficiency while passing through areas associated with elevated pollutant concentrations. This route resulted in a cumulative NO
x exposure of 443,135 exposure units.
When optimizing specifically for NOx, the resulting route followed a substantially different trajectory, avoiding the central corridor and instead traversing less polluted areas located further south. This alternative route reduced cumulative NOx exposure to 199,991 exposure units, corresponding to a reduction of 54.9%. The environmental benefit was obtained at the cost of a 15.4% increase in traveled distance from 5.53 km to 6.39 km.
Interestingly, the routes optimized for PM10 and NOx were nearly identical in this scenario, suggesting that both pollutants exhibited similar spatial distributions along this section of the urban network. Consequently, the same low-exposure corridor provided benefits for both environmental objectives.
This example illustrates one of the key findings of the study: substantial reductions in cumulative exposure can be achieved when alternative low-pollution corridors exist within the street network. In such cases, relatively moderate increases in traveled distance may lead to disproportionately large environmental benefits.
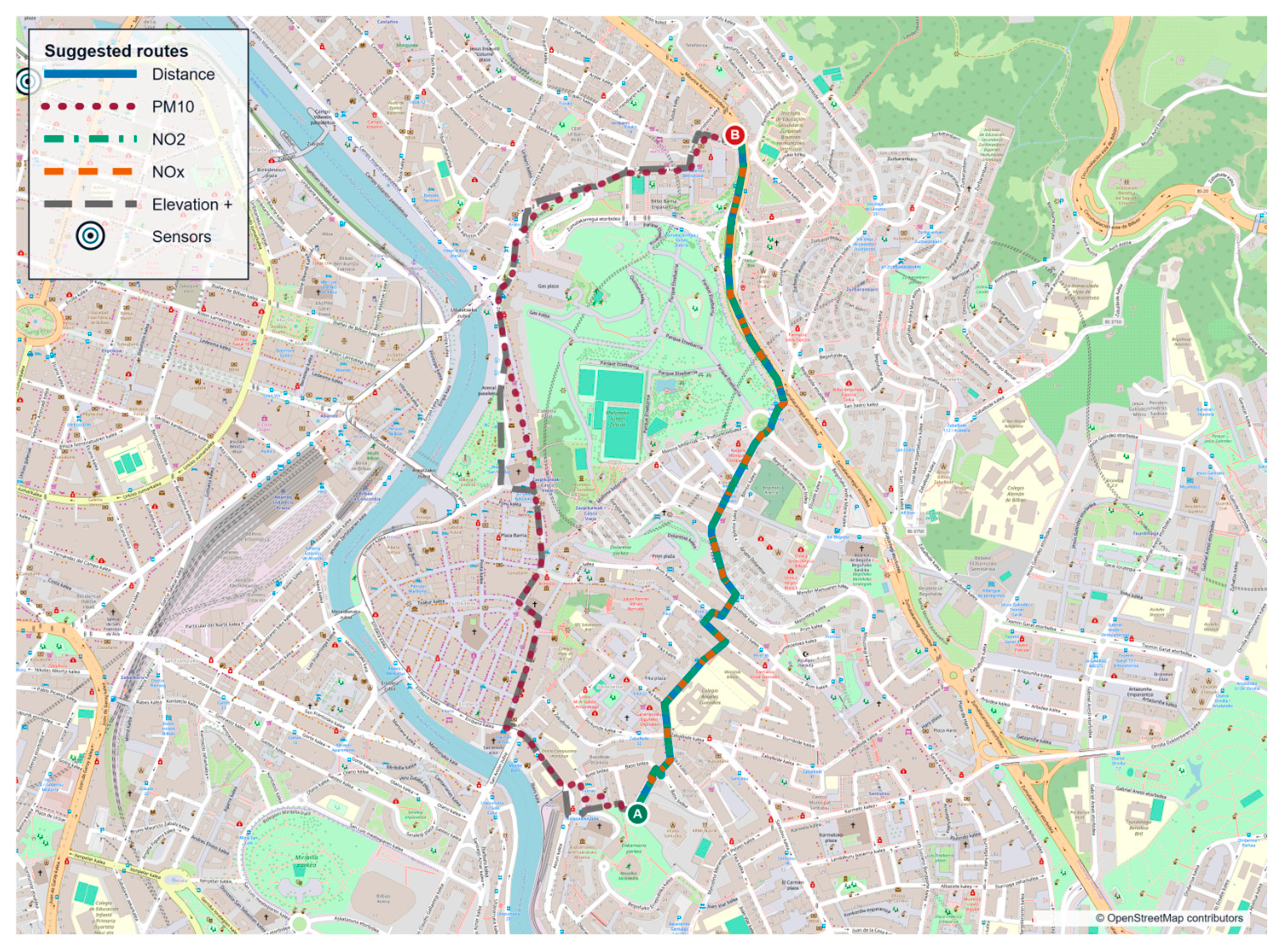
Figure 5 presents the most favorable PM
10 optimization scenario identified in Bilbao. Unlike the Donostia example, where pollutant-specific routes showed considerable overlap, the PM
10-optimized route in this case diverges substantially from the shortest-path solution. While the shortest-path route, as well as the NO
x- and NO
2-optimized routes, follow a common corridor, the PM
10-optimized route traverses an alternative urban pathway associated with lower particulate matter concentrations.
As a result, cumulative PM10 exposure decreases from 31,275 to 21,019 exposure units, corresponding to a reduction of 32.8%. This improvement is achieved with a 15.5% increase in traveled distance from 1.81 km to 2.09 km. Interestingly, optimization for NOx and NO2 does not alter the route in this scenario, suggesting that the shortest-path solution already represents the most favorable alternative for these pollutants. This example highlights that optimization opportunities are pollutant-specific and depend strongly on the spatial distribution of environmental conditions within the urban network.
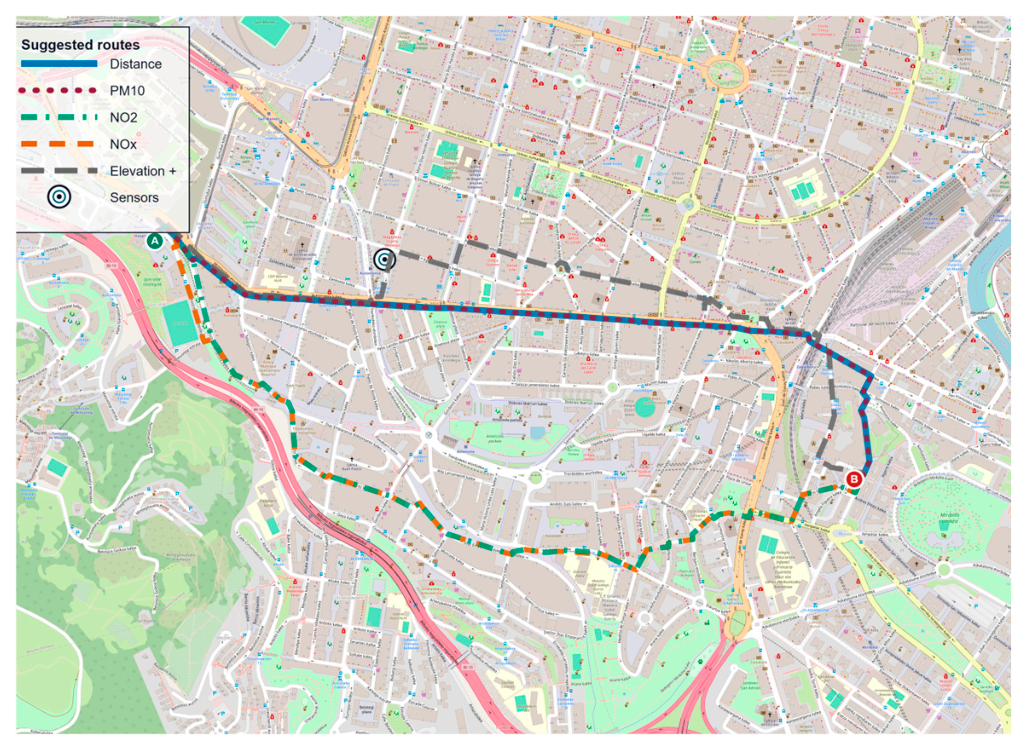
Figure 6 presents a representative NO
x optimization scenario identified in Bilbao. While the shortest-path and PM
10-optimized routes follow exactly the same trajectory, optimization for NO
x and NO
2 results in a substantially different route configuration. The optimized route avoids the central urban corridor and instead follows a southern alternative pathway characterized by lower concentrations of traffic-related pollutants.
This route modification increases the traveled distance from 2.24 km to 2.56 km, corresponding to a 14.1% increase. However, cumulative NOx exposure decreases from 150,709 to 102,621 exposure units, representing a reduction of 31.9%. Furthermore, NO2 exposure is simultaneously reduced by approximately 22.3%, suggesting that both pollutants share similar spatial patterns in this area.
Unlike the PM10 optimization examples presented previously, this case demonstrates that traffic-related pollutants may generate common low-exposure corridors that provide benefits across multiple environmental indicators. Such behavior highlights the importance of considering the spatial characteristics of individual pollutants when designing exposure-aware routing strategies.
Positive elevation gain was also examined for the representative routes shown in
Figure 3,
Figure 4,
Figure 5 and
Figure 6. In Bilbao, the PM
10-optimized route reduced elevation gain from 80.6 to 58.0 m, whereas the NO
x-optimized route increased it from 51.3 to 64.9 m. In Donostia-San Sebastián, elevation gain increased from 45.6 to 98.4 m for the representative PM
10 scenario and from 116.7 to 123.2 m for the NO
x scenario.
5. Discussion
The present study builds upon a growing body of research investigating exposure-aware routing as a strategy for reducing contact with environmental pollutants during daily mobility. Previous studies have demonstrated that route choice can influence personal exposure to air pollution and that alternative routes may reduce cumulative pollutant exposure. For example, Mölter et al. [
9] showed that school commuting routes optimized for air quality could reduce children’s exposure to NO
2 and PM
10 compared with conventional shortest-path routes. Similarly, Helle et al. [
11] demonstrated the feasibility of integrating environmental exposure layers into route planning systems for active mobility.
However, most previous studies focused on demonstrating the feasibility of environmental routing within a single city or for a limited set of trajectories. In contrast, the present work evaluates approximately 2000 school commuting routes distributed across two urban environments and explicitly quantifies the frequency with which meaningful exposure reductions can be achieved. Furthermore, the study compares optimization opportunities across different pollutants, showing that optimal routes may vary substantially, depending on the pollutant considered. This population-level perspective provides additional evidence regarding the practical applicability of exposure-aware routing beyond individual case studies.
Although the present study relies on simulated trajectories rather than observed mobility data, the generated cohort was designed to reproduce realistic school commuting scenarios based on the urban structure of Donostia-San Sebastián and Bilbao. The use of synthetic populations is common in urban simulation, transportation modelling and environmental exposure assessments, particularly when real mobility data are unavailable or are restricted by privacy considerations [
28,
29]. Importantly, the objective of this work was not to estimate the exact exposure experienced by specific individuals but rather to evaluate the potential of pollutant-aware routing under realistic urban conditions. Consequently, the results provide an approximation of the optimization opportunities that may exist within each city. A further limitation is that the estimated exposure reductions were not validated against personal exposure measurements collected along the analyzed routes. The present study was designed to compare the relative optimization potential of alternative routes using a common environmental modelling framework rather than to estimate the exact exposure experienced by individual children. Future work should validate the estimated route-level differences using observed mobility trajectories and portable or personal air quality sensors, which would also allow the influence of local and short-term variations in pollutant concentrations to be assessed.
The results also indicate that optimization opportunities were not uniformly distributed across pollutants or urban environments. Instead, substantial reductions were concentrated within a subset of trajectories. Although this pattern may appear to limit the overall applicability of pollutant-aware routing, it also highlights that the potential benefits are highly context-dependent. In public health and preventive medicine, interventions can still be valuable even when they primarily benefit specific population groups, particularly when the expected reduction in risk factors is meaningful. In the present study, exposure reductions greater than 15% were observed for a significant proportion of school routes, suggesting that targeted routing recommendations could provide environmental benefits for a subset of children.
The results obtained in Donostia-San Sebastián indicate that the greatest optimization potential was associated with NO
x exposure. More than 10% of the analyzed routes achieved reductions greater than 5%, while the most favorable trajectory reduced cumulative NO
x exposure by approximately 55%. These findings suggest the existence of alternative low-exposure corridors capable of avoiding traffic-related pollution hotspots. Given the well-established associations between traffic-related pollutants and respiratory health outcomes, such reductions may be particularly relevant. Reviews such as [
4,
30] have highlighted the relationship between NO
2 exposure and childhood asthma, respiratory symptoms and adverse health outcomes. Consequently, reducing repeated exposure during daily school commuting may contribute to lowering the cumulative environmental burden over time.
In contrast, PM10 optimization opportunities in Donostia-San Sebastián were considerably more limited. Only a small proportion of routes achieved reductions greater than 5%, and the maximum reduction observed was approximately 13%. This suggests a more homogeneous spatial distribution of particulate matter across the urban environment, limiting the ability of routing algorithms to identify substantially cleaner alternatives. Nevertheless, even modest reductions may be relevant, given the repeated nature of school commuting and the cumulative exposure accumulated throughout childhood.
Bilbao presented a markedly different pattern. In this case, PM
10 exhibited the highest optimization potential, with maximum reductions exceeding 30% and a substantially larger proportion of routes achieving meaningful improvements compared with Donostia-San Sebastián. This result may reflect differences in the urban morphology, traffic patterns and pollutant sources. Historically, Bilbao has been characterized by a stronger industrial influence and a more complex urban topography, potentially generating spatial gradients in particulate matter concentrations that can be exploited through route optimization. The observed reductions are particularly relevant, considering the evidence linking particulate matter exposure with respiratory symptoms, impaired lung development and childhood respiratory disease, as summarized in [
6].
Interestingly, the opposite pattern was observed for NOx optimization in Bilbao. Although some trajectories achieved substantial reductions, the proportion of routes benefiting from optimization was lower than in Donostia-San Sebastián. Together, these findings suggest that optimization opportunities depend strongly on the local environmental conditions and pollutant distributions. Consequently, routing strategies developed for one city cannot necessarily be transferred directly to another without local evaluation.
From a public health perspective, the results support the concept of targeted environmental routing rather than universal route recommendations based on minimum distance. The findings indicate that not all children would benefit equally from changing their commuting route. However, for the subset of trajectories where substantial reductions are achievable, the cumulative benefits could be meaningful. In practical terms, the additional walking effort required remained relatively limited. For example, the largest NO
x exposure reduction identified in Donostia-San Sebastián (54.9%) required approximately 855 m of additional walking, while the maximum NO
x reduction in Bilbao (31.9%) required only 317 m. Similarly, routes achieving meaningful PM
10 reductions in Bilbao generally required less than 250 m of additional walking. The relatively large standard deviations observed for some route groups also indicate substantial variability in the additional walking distance required. Although the largest detours observed in the study remained below 1 km, such increases may not be equally acceptable for all children, particularly for younger age groups. In practical applications, route recommendations should therefore consider age, baseline commuting distance and individual walking capabilities in addition to the potential reduction in pollutant exposure. Given that school commuting occurs repeatedly throughout childhood, even moderate reductions in daily exposure may accumulate over years of repeated travel. Previous studies, including [
5], have highlighted the potential consequences of long-term exposure during childhood, suggesting that reducing exposure during these critical developmental periods may contribute to improved health outcomes. In addition to traveled distance, topography may influence the practical acceptability of alternative walking routes, particularly in areas with complex terrain. However, no consistent trend between pollutant-exposure optimization and positive elevation gain was observed in the representative scenarios analyzed. As expected, differences in elevation depend on the specific alternative path selected, although the changes observed in these examples remained moderate. Therefore, elevation should be considered as an additional route-specific factor rather than as a systematic consequence of pollutant-aware optimization.
The comparison between Donostia-San Sebastián and Bilbao highlights the importance of local environmental characterization when designing exposure-aware routing systems. The pollutant for which optimization was most effective differed between cities, indicating that the local urban structure, traffic dynamics, meteorological conditions and pollutant sources may influence optimization potential. The exclusion of ozone should also be considered when interpreting the overall exposure profile of the recommended routes, as may exhibit spatial patterns that differ from and, in some cases, contrast with those of traffic-related pollutants such as NOx. Therefore, future exposure-aware routing systems should be calibrated using local environmental information rather than by assuming that optimization strategies are universally transferable between urban environments.
6. Conclusions
This study presented a GeoAI-based framework for estimating and optimizing pedestrian school commuting routes according to air pollution exposure. By combining publicly available environmental information, OpenStreetMap road networks, spatial interpolation techniques and route optimization algorithms, the proposed methodology enables the identification of alternative routes that reduce cumulative pollutant exposure while maintaining acceptable walking distances.
The results demonstrate that the effectiveness of exposure-aware routing strongly depends on both the pollutant considered and the characteristics of the urban environment. The greatest optimization potential was observed for NOx in Donostia-San Sebastián and for PM10 in Bilbao, where exposure reductions exceeded 50% and 30%, respectively. Importantly, these improvements were achieved with relatively modest additional walking distances, highlighting that meaningful exposure reductions are feasible for a subset of daily school commuting routes.
Beyond the specific case studies, one of the main strengths of the proposed framework is its scalability and transferability. Since it relies exclusively on openly available geographic and environmental data together with a synthetic commuting population, the methodology can be readily adapted to other cities without requiring access to sensitive mobility data. This makes it a practical tool for supporting urban planning, public health initiatives and personalized exposure-aware navigation systems.
Future research should focus on incorporating denser air quality sensing networks, pollution models with a higher spatiotemporal resolution, real mobility trajectories and additional environmental factors such as noise, thermal comfort and traffic safety. Evaluating long-term health impacts and user acceptance of exposure-aware route recommendations also represents an important direction for future work.