


Abstract
This study aims to spatially analyze the potential soil loss rates of the Özkonak Watershed, located within Nevşehir Province, using the Revised Universal Soil Loss Equation (RUSLE) integrated with Geographic Information Systems (GIS) and Remote Sensing (RS) technologies. In the 149.9 km2 watershed, the main parameters triggering erosion—rainfall erosivity (R), soil erodibility (K), slope length and steepness (LS), land cover and management (C), and support practices (P)—were modeled in a GIS environment. According to the spatial analysis results, 85.8% of the watershed area falls within the “very low” and “low” erosion susceptibility classes. Nevertheless, erosion increases markedly in the northern areas with high slope gradients and in areas where agricultural activities are concentrated. The mean soil loss across the watershed was calculated as 2.75 t ha−1 yr−1. The eroded and transported material was determined to constitute a threat to the dam. The findings indicate that conservation plans, including afforestation in the upper watershed, adjustment of land use to natural land capability, and construction of check dams, should be implemented to ensure sustainable management of the watershed. From a soil and sediment remediation perspective, the identification of erosion-source areas and sediment-transport pathways provides a scientific basis for source-control measures aimed at reducing sediment delivery and associated water-quality deterioration in the Bayramhacılı Dam reservoir.
1. Introduction
Soil is one of the most vital natural components supporting the functioning of terrestrial ecosystems, biodiversity, and global food and water security [1,2]. However, soil erosion, defined as the detachment and transport of the fertile soil layer by external agents and processes such as water, wind, and gravity, is among the major environmental problems threatening the functions of this invaluable resource at the global scale [3,4]. Anthropogenic pressures, inappropriate land use, and deforestation can disrupt the natural balance and increase erosion rates to 100–1000 times the geological rates [5]. Today, approximately one-sixth of the world’s arable land is affected by accelerated water erosion [6], and 20–75 billion tonnes of fertile topsoil are lost globally each year [7,8]. According to climate change projections, increases in the frequency and intensity of extreme precipitation events will raise future erosion risk to much more serious levels, particularly in fragile ecosystems with semi-arid characteristics [9,10,11]. This destructive process, which reduces the productivity of agricultural land, decreases biodiversity, and disrupts ecological cycles [12,13], constitutes a major obstacle to the Sustainable Development Goals. Accordingly, watershed-scale and integrated sustainable land-management practices are essential to prevent land degradation and secure limited freshwater resources [14,15].
Numerous empirical, conceptual, and physically based models have been developed to understand the dynamic character of erosion processes and to estimate watershed-scale soil losses quantitatively and with high accuracy [16,17,18]. At finer spatial scales, coupled Smoothed Particle Hydrodynamics–Discrete Element Method (SPH–DEM) frameworks constitute a complementary branch of physically based erosion modelling by explicitly resolving fluid–particle interactions, sediment detachment, transport, and local scour processes [19]. Such process-scale approaches complement watershed-scale empirical models by providing detailed insight into the physical mechanisms operating within critical erosion and sediment-transport zones identified through regional assessments. The Revised Universal Soil Loss Equation (RUSLE) is among the most widely preferred and standard methods worldwide [20,21]. Based on the Universal Soil Loss Equation (USLE), which was developed for agricultural land [22], this model has been successfully adapted, with advances in technology, to determine erosion dynamics in forests, rangelands, urban land uses, and large drainage basins with complex topography. In recent years, rapid advances in Geographic Information Systems (GIS) and Remote Sensing (RS) technologies have enabled the RUSLE model to be applied more effectively and precisely over large areas [23,24,25]. By integrating high-resolution satellite data and GIS algorithms, the principal model components—rainfall erosivity, soil erodibility, slope length and steepness, and vegetation-cover factors—can be analyzed spatially on a pixel basis [26,27]. In particular, calculating flow paths through three-dimensional approaches provides highly reliable scientific bases that save watershed managers time and cost in soil-conservation planning [9,28].
Hillslope erosion is not only a process of productivity loss occurring at the surface from which soil is detached; it is also a multidimensional problem in which transported material reaches streams, lakes, and dams at watershed outlets and causes serious environmental and economic damage [29,30]. The deposition in dam areas of organic-matter-rich topsoil detached and transported from slopes by accelerated water erosion, together with suspended sediment containing agricultural chemicals, disrupts the hydrological balance of freshwater ecosystems and substantially reduces water quality [31,32,33,34]. The planned service lives of dams depend on the time required for sedimentation to fill the dead-storage volumes of their reservoirs [35,36]. The literature emphasizes that a substantial proportion of existing reservoirs worldwide may lose their effective capacities within the next 25–50 years unless effective erosion-control measures are implemented [37,38]. Therefore, as demonstrated in the scientific studies of Lazzari et al. [39], Thiet et al. [40], Luo et al. [41], Ezzaouini et al. [42], and Bhatti et al. [43], periodic determination of watershed-wide soil-loss potential using GIS-supported erosion models has become a global and regional necessity for extending the design lives of dams and ensuring the sustainability of hydraulic structures.
In this context, the aim of this study is to quantitatively determine erosion dynamics and potential hillslope soil loss in the Özkonak Watershed, located in Avanos District of Nevşehir Province, using the RUSLE model integrated with GIS and RS technologies, and to reveal the possible hydrographic and geomorphological effects of these soil losses on the Bayramhacılı Dam reservoir located at the watershed outlet. By analyzing the topographic, pedological, climatological, and vegetation conditions specific to the Özkonak Watershed at a microscale, the study seeks to map the spatial distribution of the area’s erosion-susceptibility classes at high resolution. The findings are expected to provide an up-to-date, reliable, and evidence-based scientific basis for protective watershed-management policies to be implemented by decision makers.
The study is also directly relevant to soil and sediment remediation because it identifies the principal source areas, transport pathways, and depositional environments associated with erosion-derived sediment. In this context, watershed-scale erosion control can be regarded as a preventive remediation strategy that reduces sediment generation at its source before eroded material reaches the reservoir. Such an approach may also contribute indirectly to water-quality protection by limiting the transport of sediment-bound nutrients and agricultural contaminants into the aquatic environment.
2. Materials and Methods
2.1. Study Area Location and Boundaries
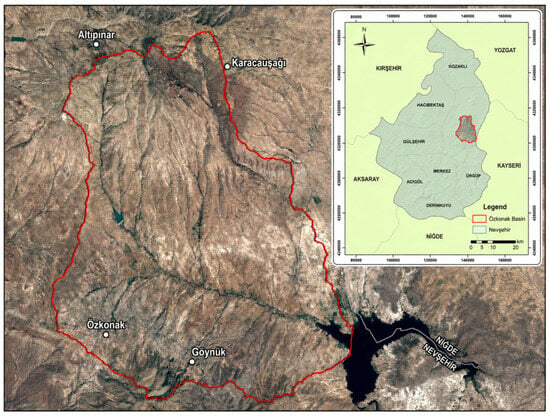
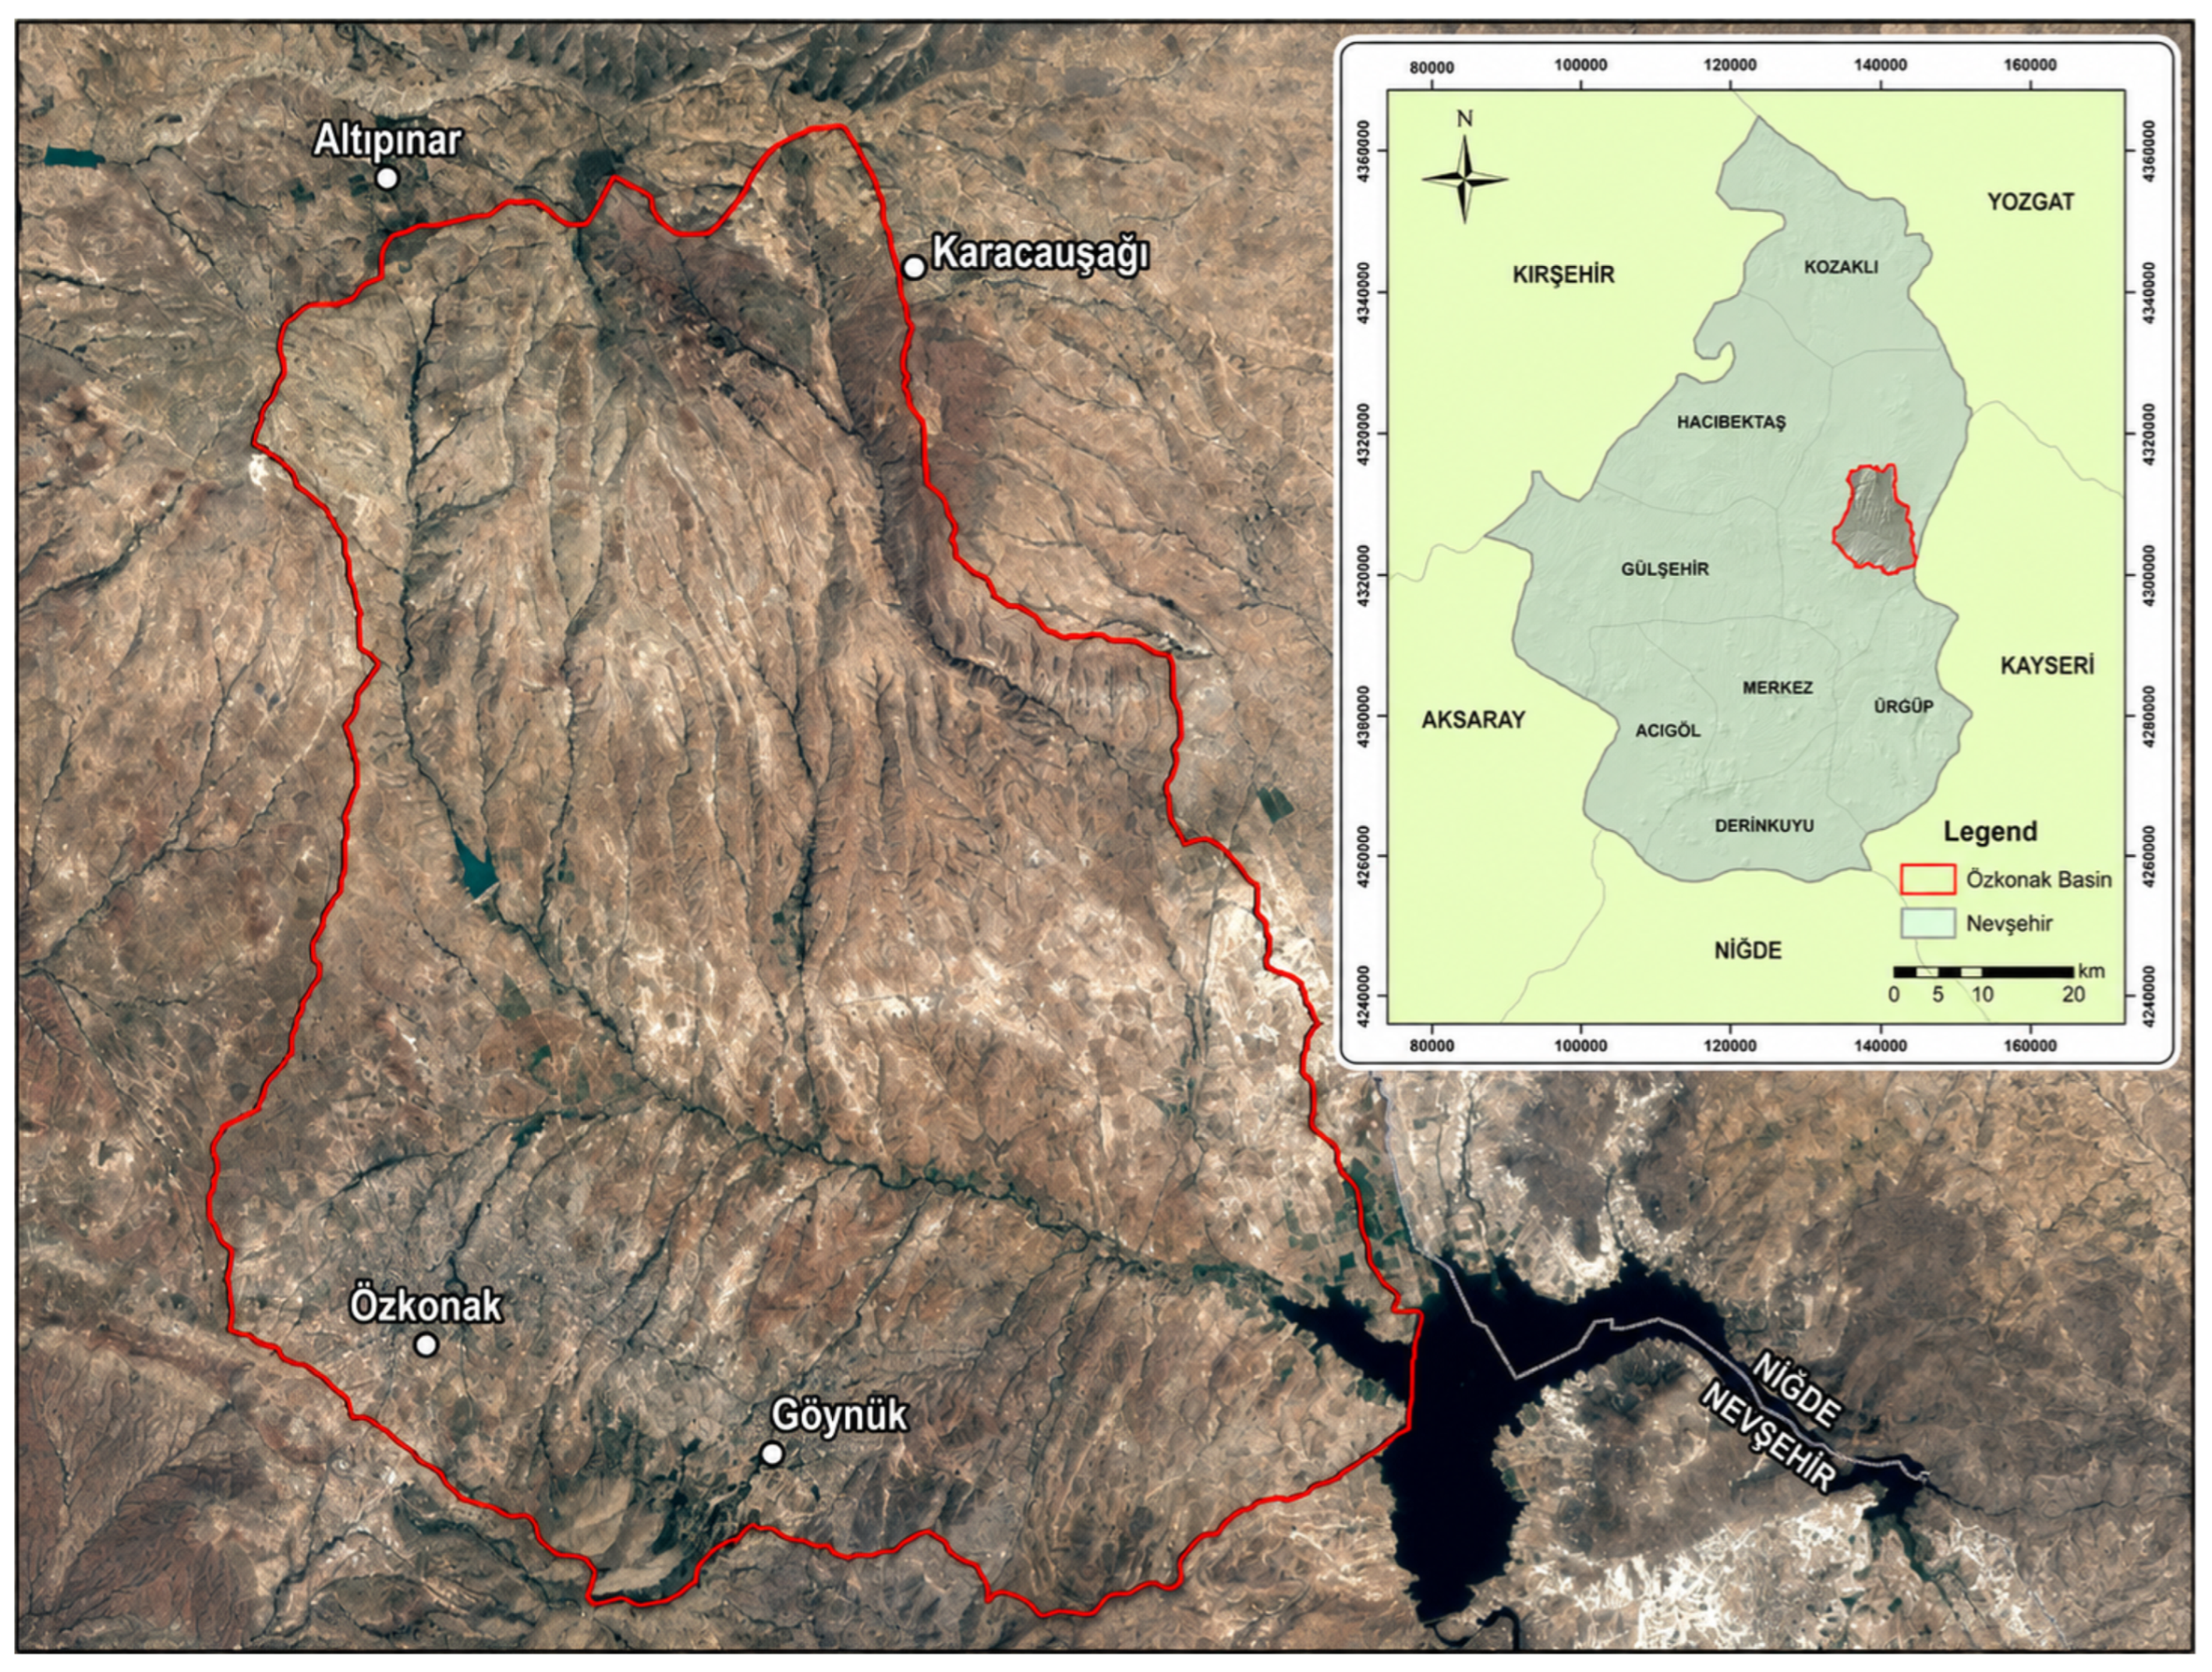
The study area is located within Nevşehir Province in the Middle Kızılırmak Section of the Central Anatolia Region (Figure 1). Özkonak and Göynük are important settlements within the study area. The study area was selected from among approximately ten sub-basins located within the boundaries of Avanos District in Nevşehir. The Bayramhacılı Dam, situated in the area where the waters collect, was a particularly important reason for selecting this watershed. The extensive distribution of agricultural land within the study area was also a determining factor. Özkonak occupies an important position in grape production in Nevşehir.
Figure 1.
Location of the study area.
The boundary of the study area follows the sub-basin divide and belongs to a tributary of the Kızılırmak River. This tributary, which collects the watershed’s water and discharges it into the Bayramhacılı Dam, is the Asarcık Stream. In the watershed, areas corresponding to different erosion surfaces of the Kızılırmak River, together with slope lands, plateau surfaces, and colluvial deposits, were observed as distinct units.
The study area covers approximately 150 km2. Its lowest elevation is approximately 950 m above sea level, and the mean elevation of the watershed is 1285 m. The highest point is Göz Hill (1621 m), located in the northern part of the area.
2.2. Method
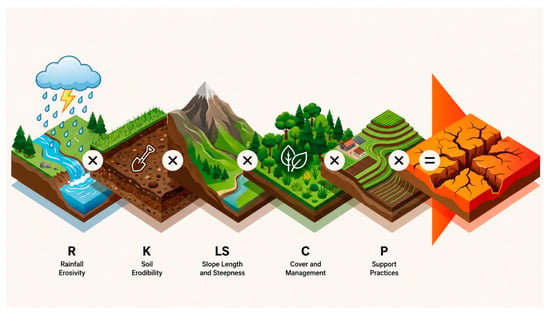
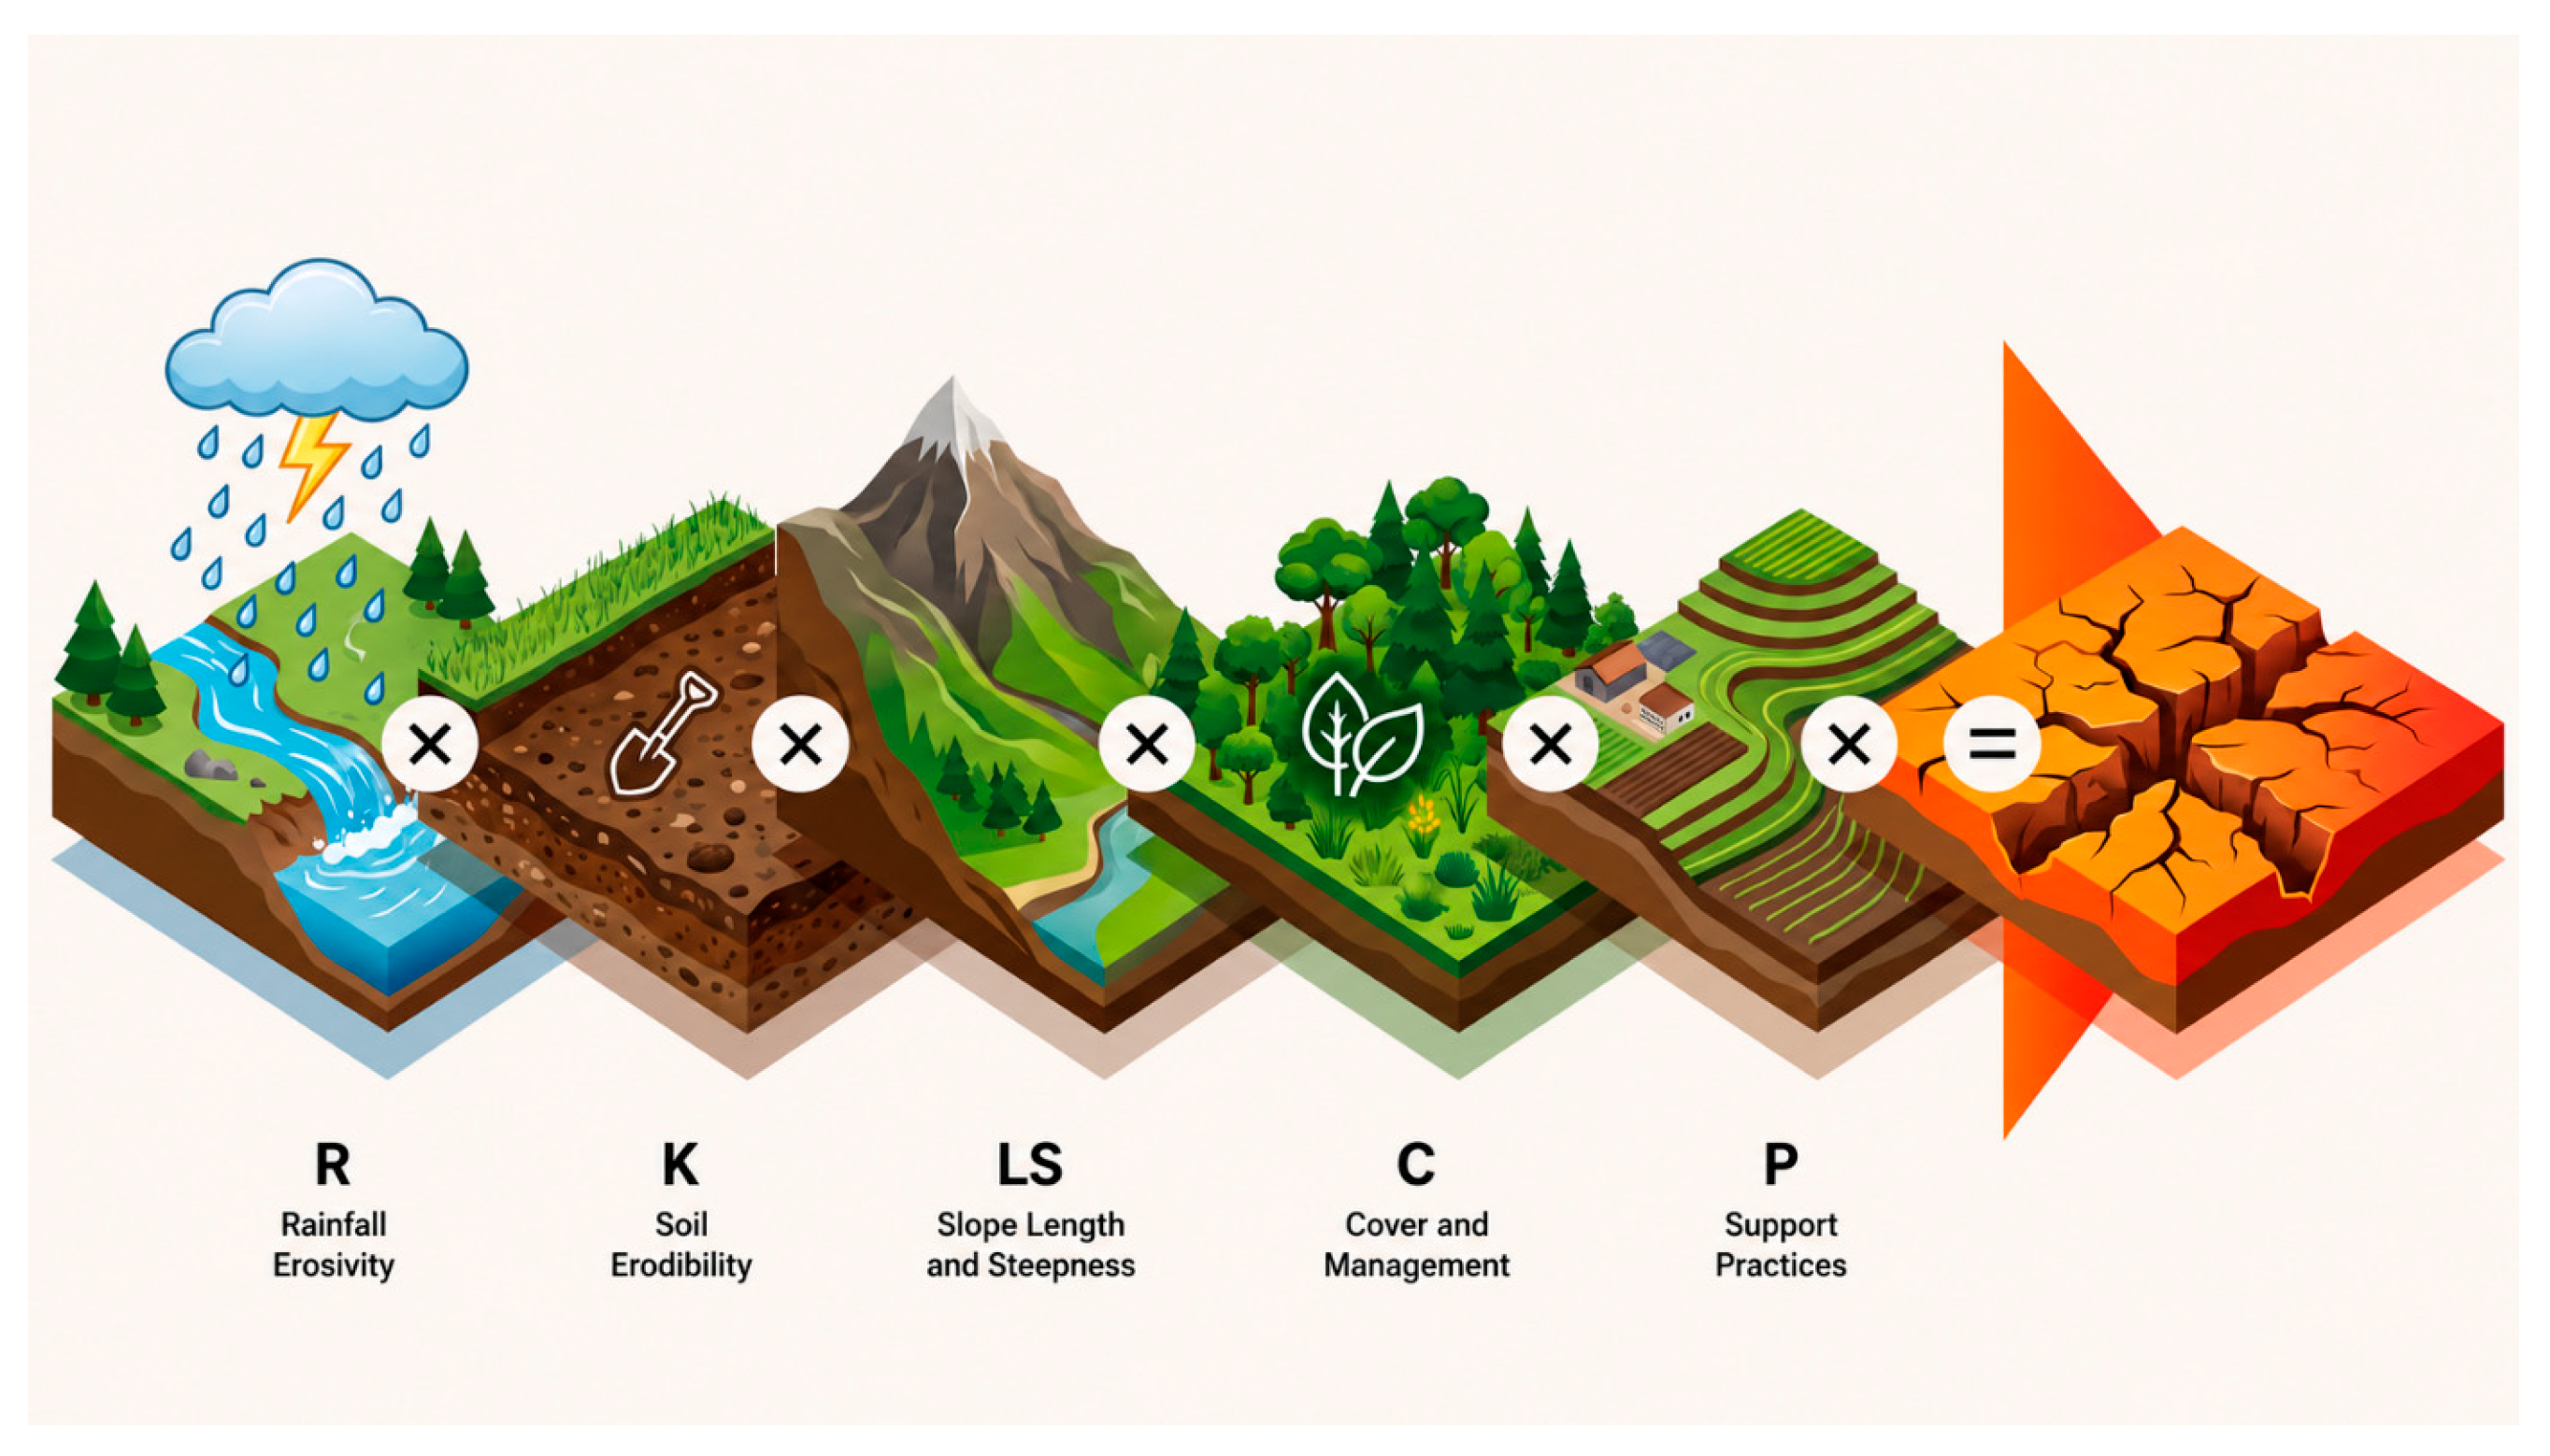
The RUSLE erosion model is used to calculate soil loss per unit area in t ha−1 yr−1. The RUSLE model, obtained by integrating the factors shown in Figure 2, is widely used for estimating long-term average potential soil loss and identifying the spatial distribution of erosion-prone areas at the watershed scale.
Figure 2.
Schematic representation of the RUSLE model.
Detailed consideration of each parameter in the method is necessary to obtain precise results. The calculation methods for these parameters are briefly described below.
2.2.1. Rainfall Erosivity Factor (R)
The RUSLE model assumes that, when the other factors remain constant, soil losses from cultivated areas are directly proportional to the rainfall parameter. The following equation is used to calculate the R factor:
R: rainfall erosivity factor (ha−1 yr−1 × mm h−1).
E: total energy of intense rainfall (ha−1 yr−1).
I30: maximum 30 min rainfall intensity (mm h−1).
Because the values included here are not measured at many meteorological stations, various methods have been developed. A widely used method is calculation of the Modified Fournier Index (MFI) [44,45,46]. Monthly and annual precipitation values are used to calculate this index.
MFI: MFI value for each meteorological station.
Pi: monthly precipitation amount (mm).
P: mean annual precipitation (mm).
The following equation was used to determine the R values of stations for which MFI values had been calculated [47].
In the study, R values from meteorological stations in Nevşehir and the surrounding provinces were used, and geostatistical distribution was performed in ArcGIS 10.2.2 (Esri, Redlands, CA, USA) to distribute the station values over the topography.
2.2.2. Soil Erodibility Factor (K)
The soil erodibility factor (K), as a soil characteristic, is a measure of the susceptibility of soil to detachment and transport by erosion forces [47]. Although various methods are available for calculating the K factor, where it cannot be determined experimentally, it is calculated using an equation based on soil organic matter, texture, structure, and permeability values.
When the K factor could not be determined experimentally, it was calculated using the equation of Wischmeier and Smith [22], based on soil organic matter, texture, structure, and permeability characteristics, as follows:
In this equation, K is the soil erodibility factor; OM is the organic matter content (%); S is the soil-structure class (1–6); P is the soil-water-permeability code; M is the particle-size parameter; and d is the metric-system conversion coefficient (d = 7.59). The M factor was calculated as follows [22]:
The K factor is determined on the basis of laboratory analyses conducted for each point soil sample [22]. To characterize the soil properties of the study area and determine the soil erodibility factor, a total of 30 surface soil samples were collected from a depth of 0–20 cm using a random sampling approach. The number and spatial distribution of the samples were selected to represent the major soil groups and different land-use types occurring within the watershed. Laboratory analyses were performed on the collected samples to determine relevant soil properties, including particle-size distribution (texture), organic matter content, and bulk density. Particle-size distribution, expressed as sand, silt, and clay fractions, was determined using the Bouyoucos hydrometer method [48]. Soil organic matter (OM) content was determined using the Walkley–Black wet oxidation method [49], whereas bulk density was determined from undisturbed core samples according to the method described by Blake and Hartge [50]. Based on the analytical results, representative K-factor values were determined for each major soil group and subsequently compared with K values reported in the relevant literature to assess their consistency. The resulting K values were then assigned to the corresponding soil units in the GIS environment to generate the spatial soil erodibility (K) factor map used in the RUSLE analysis. In some studies using the RUSLE erosion model, K values obtained from studies based on major soil groups have been used [51].
The K values determined for this factor comprise five classes (Table 1).
Table 1.
Soil erodibility (K) classes and values.
2.2.3. Slope Length and Steepness Factor (LS)
Slope length and slope steepness, two important complementary characteristics, are evaluated together in RUSLE. In GIS-based applications, the LS factor can be derived on a cell-by-cell basis by integrating upslope flow accumulation with slope steepness. In this study, the GIS-based formulation derived from the upslope contributing-area approach of Mitasova et al. [52], which builds upon the theoretical framework of Moore and Burch, was used as follows:
2.2.4. Land Use and Vegetation Cover Factor (C)
The C factor is used to represent the condition of land use and vegetation cover in relation to erosion. This factor indicates how a soil-conservation plan affects mean annual soil loss and how soil-loss potential changes and becomes distributed over time during construction activities, crop rotations, or other management programs [21]. In recent studies, satellite images have been used in ERDAS through RS methods to calculate the C factor. NDVI and CORINE images have been used in different studies [53,54,55]. In many studies conducted in Türkiye, C-factor values have been compiled from previous studies (Table 2) [56,57].
Table 2.
C values assigned to land-use classes according to EU institute standards.
2.2.5. Support Practice Factor (P)
The P factor represents agricultural practices implemented to reduce soil loss. Examples include the erosion-reducing effect of plowing fields perpendicular to the slope direction and the benefits of terracing. Where no conservation measure is present in the study area, the support-practice factor is accepted as 1.0 [22]. Field studies conducted in the Özkonak Watershed found no conservation measure; therefore, the P value was accepted as 1 in this study.
2.2.6. Model Reliability and Uncertainty
The RUSLE model applied in this study is a deterministic spatial modelling approach, and independent field-based erosion or sediment-yield measurements were not available for quantitative validation of the model outputs. Potential uncertainty may arise from the spatial representation and parameterization of the R, K, LS, and C factors. Recent comparative studies further illustrate these sources of uncertainty: Pantazis and Nastos [58] found broad consistency between field measurements and RUSLE estimates in a Mediterranean olive orchard, particularly when the model was calibrated with empirical data, whereas Subbarayan and Sankriti [59] reported noticeable differences in RUSLE soil-loss estimates obtained from gauge-based and ERA5-Land rainfall inputs, with the reanalysis data still exhibiting appreciable estimation errors. Therefore, the resulting soil-loss estimates were primarily interpreted as spatially comparative values for identifying relative erosion-risk patterns and priority areas within the watershed.
3. Results
3.1. Soil Properties of the Study Area
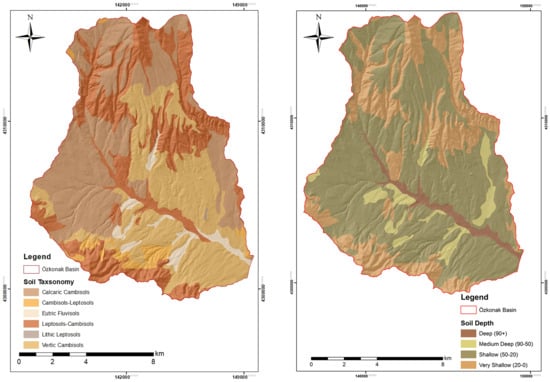
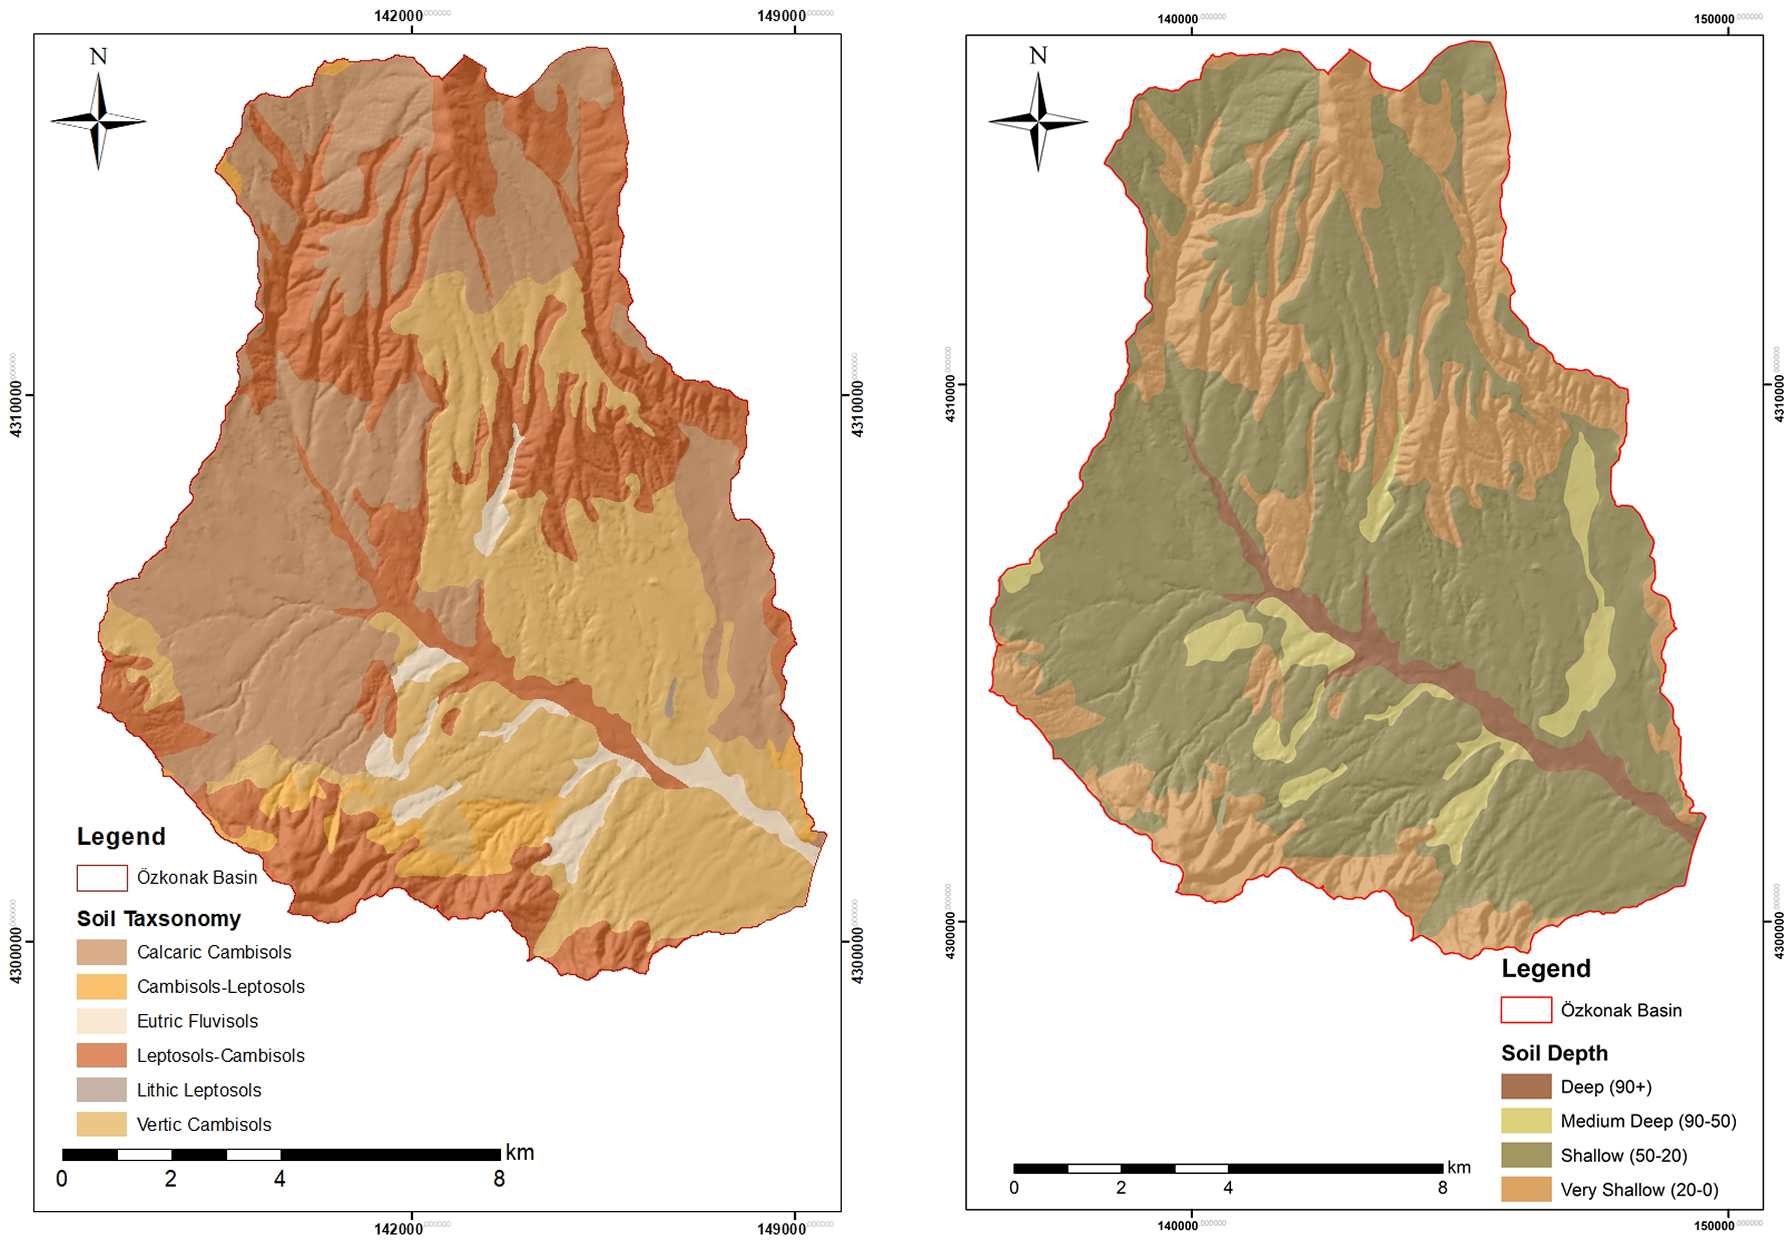
Soil distribution in the Özkonak Watershed clearly demonstrates the effects of geomorphological and topographic factors on pedogenic processes. Depending on the balance between watershed morphology and slope gradient, a geographical relationship exists between soil taxonomy and soil depth. In the highly rugged and steeply sloping areas forming the northern sector of the watershed, high slope gradients accelerate surface runoff, causing erosion to become more dominant than soil formation. As a result of these geomorphic processes, shallow (20–50 cm) and very shallow (0–20 cm) soil-depth classes occur in these areas. Taxonomically, these shallow areas are characterized by Lithic Leptosols and Leptosols–Cambisols transition zones that directly reflect the influence of parent material; these are weakly structured soils that show no profile development and occur directly over hard bedrock (Figure 3).
Figure 3.
Shallow soils in the upper reaches of the Özkonak Watershed.
On the undulating plateau surfaces and terraces in the central and southern parts, where slope gradients decrease and eroded material begins to accumulate, soil depth reaches the moderate level (50–90 cm). More developed soil units, such as Calcaric Cambisols and Vertic Cambisols, in which B-horizon development is observed, occur in these units (Figure 4). Particularly in relation to semi-arid climatic dynamics, where dry and humid periods alternate, clay accumulation and associated physical mechanisms become prominent in Vertic Cambisol units. The valley floors forming the principal drainage network of the watershed are active depositional areas where fine material transported from steep slopes continually accumulates. As a result of hydrological processes, deep-profiled (90+ cm) Eutric Fluvisols occur in these areas, and these units constitute the parts of the watershed with the highest water-holding capacity and nutrient richness (Figure 4). Consequently, the soil-depth and taxonomic-distribution patterns in the Özkonak Watershed indicate that the shallow and sensitive Leptosol cover on the upper slopes potentially involves high erosion risk, whereas the presence of Fluvisols and Cambisols in lower-watershed accumulation areas and valley floors confirms depositional dynamics.
Figure 4.
Soils and soil-depth conditions in the study area.
The selected physicochemical properties and representative K-factor values of the major soil groups in the Özkonak Watershed are summarized in Table 3.
Table 3.
Selected physicochemical properties and representative K-factor values of the major soil groups in the Özkonak Watershed.
3.2. Land Use in the Study Area
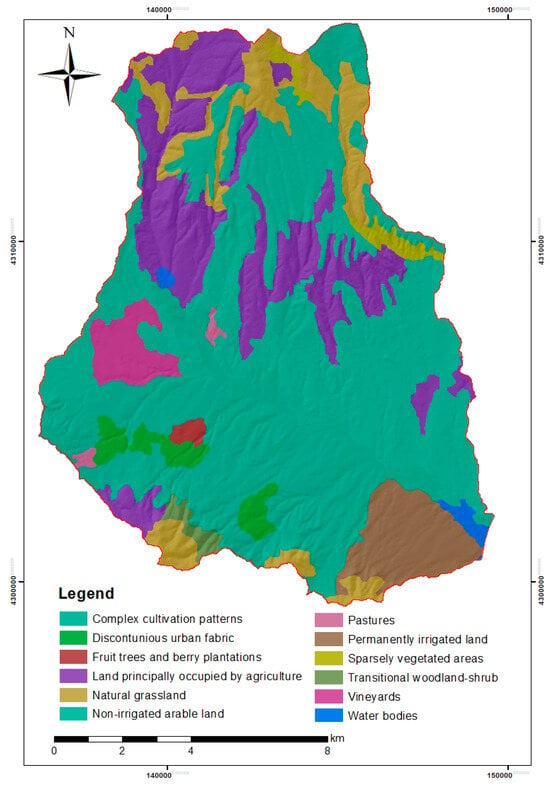
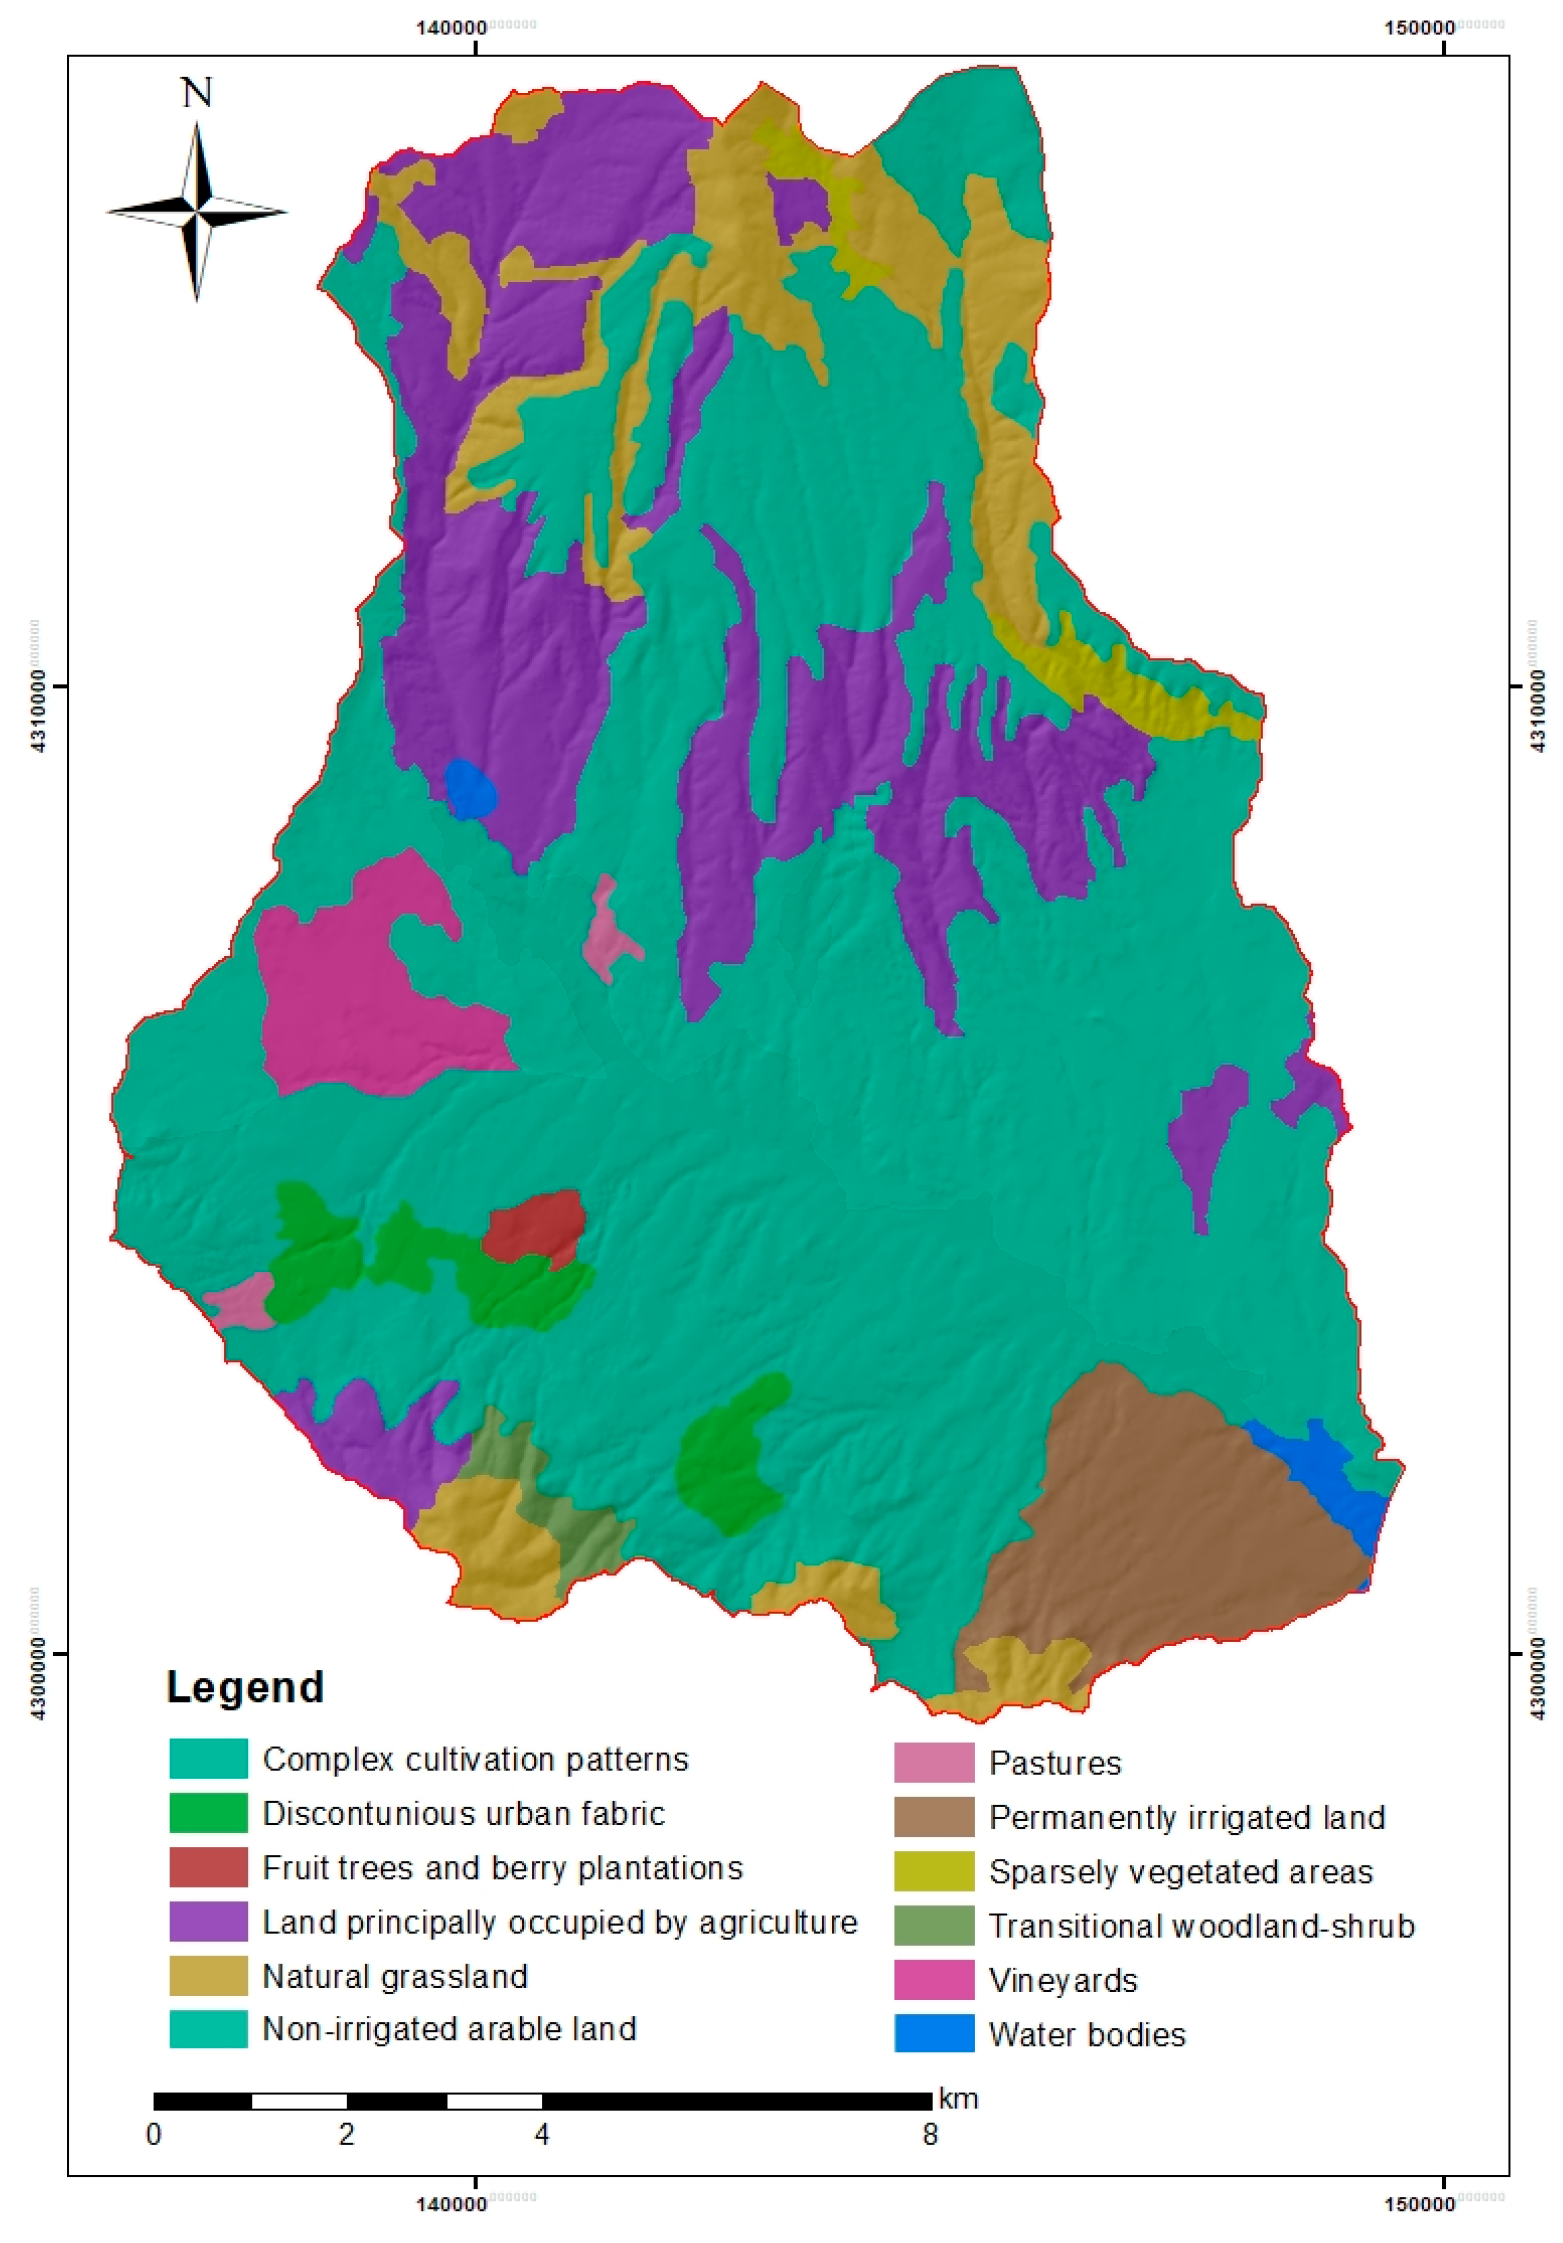
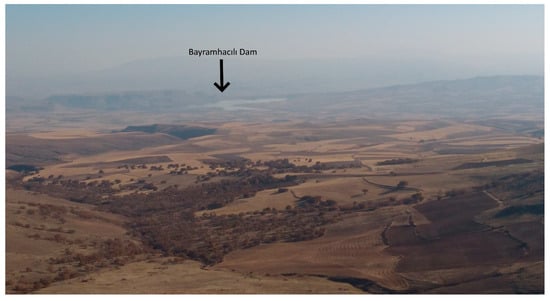
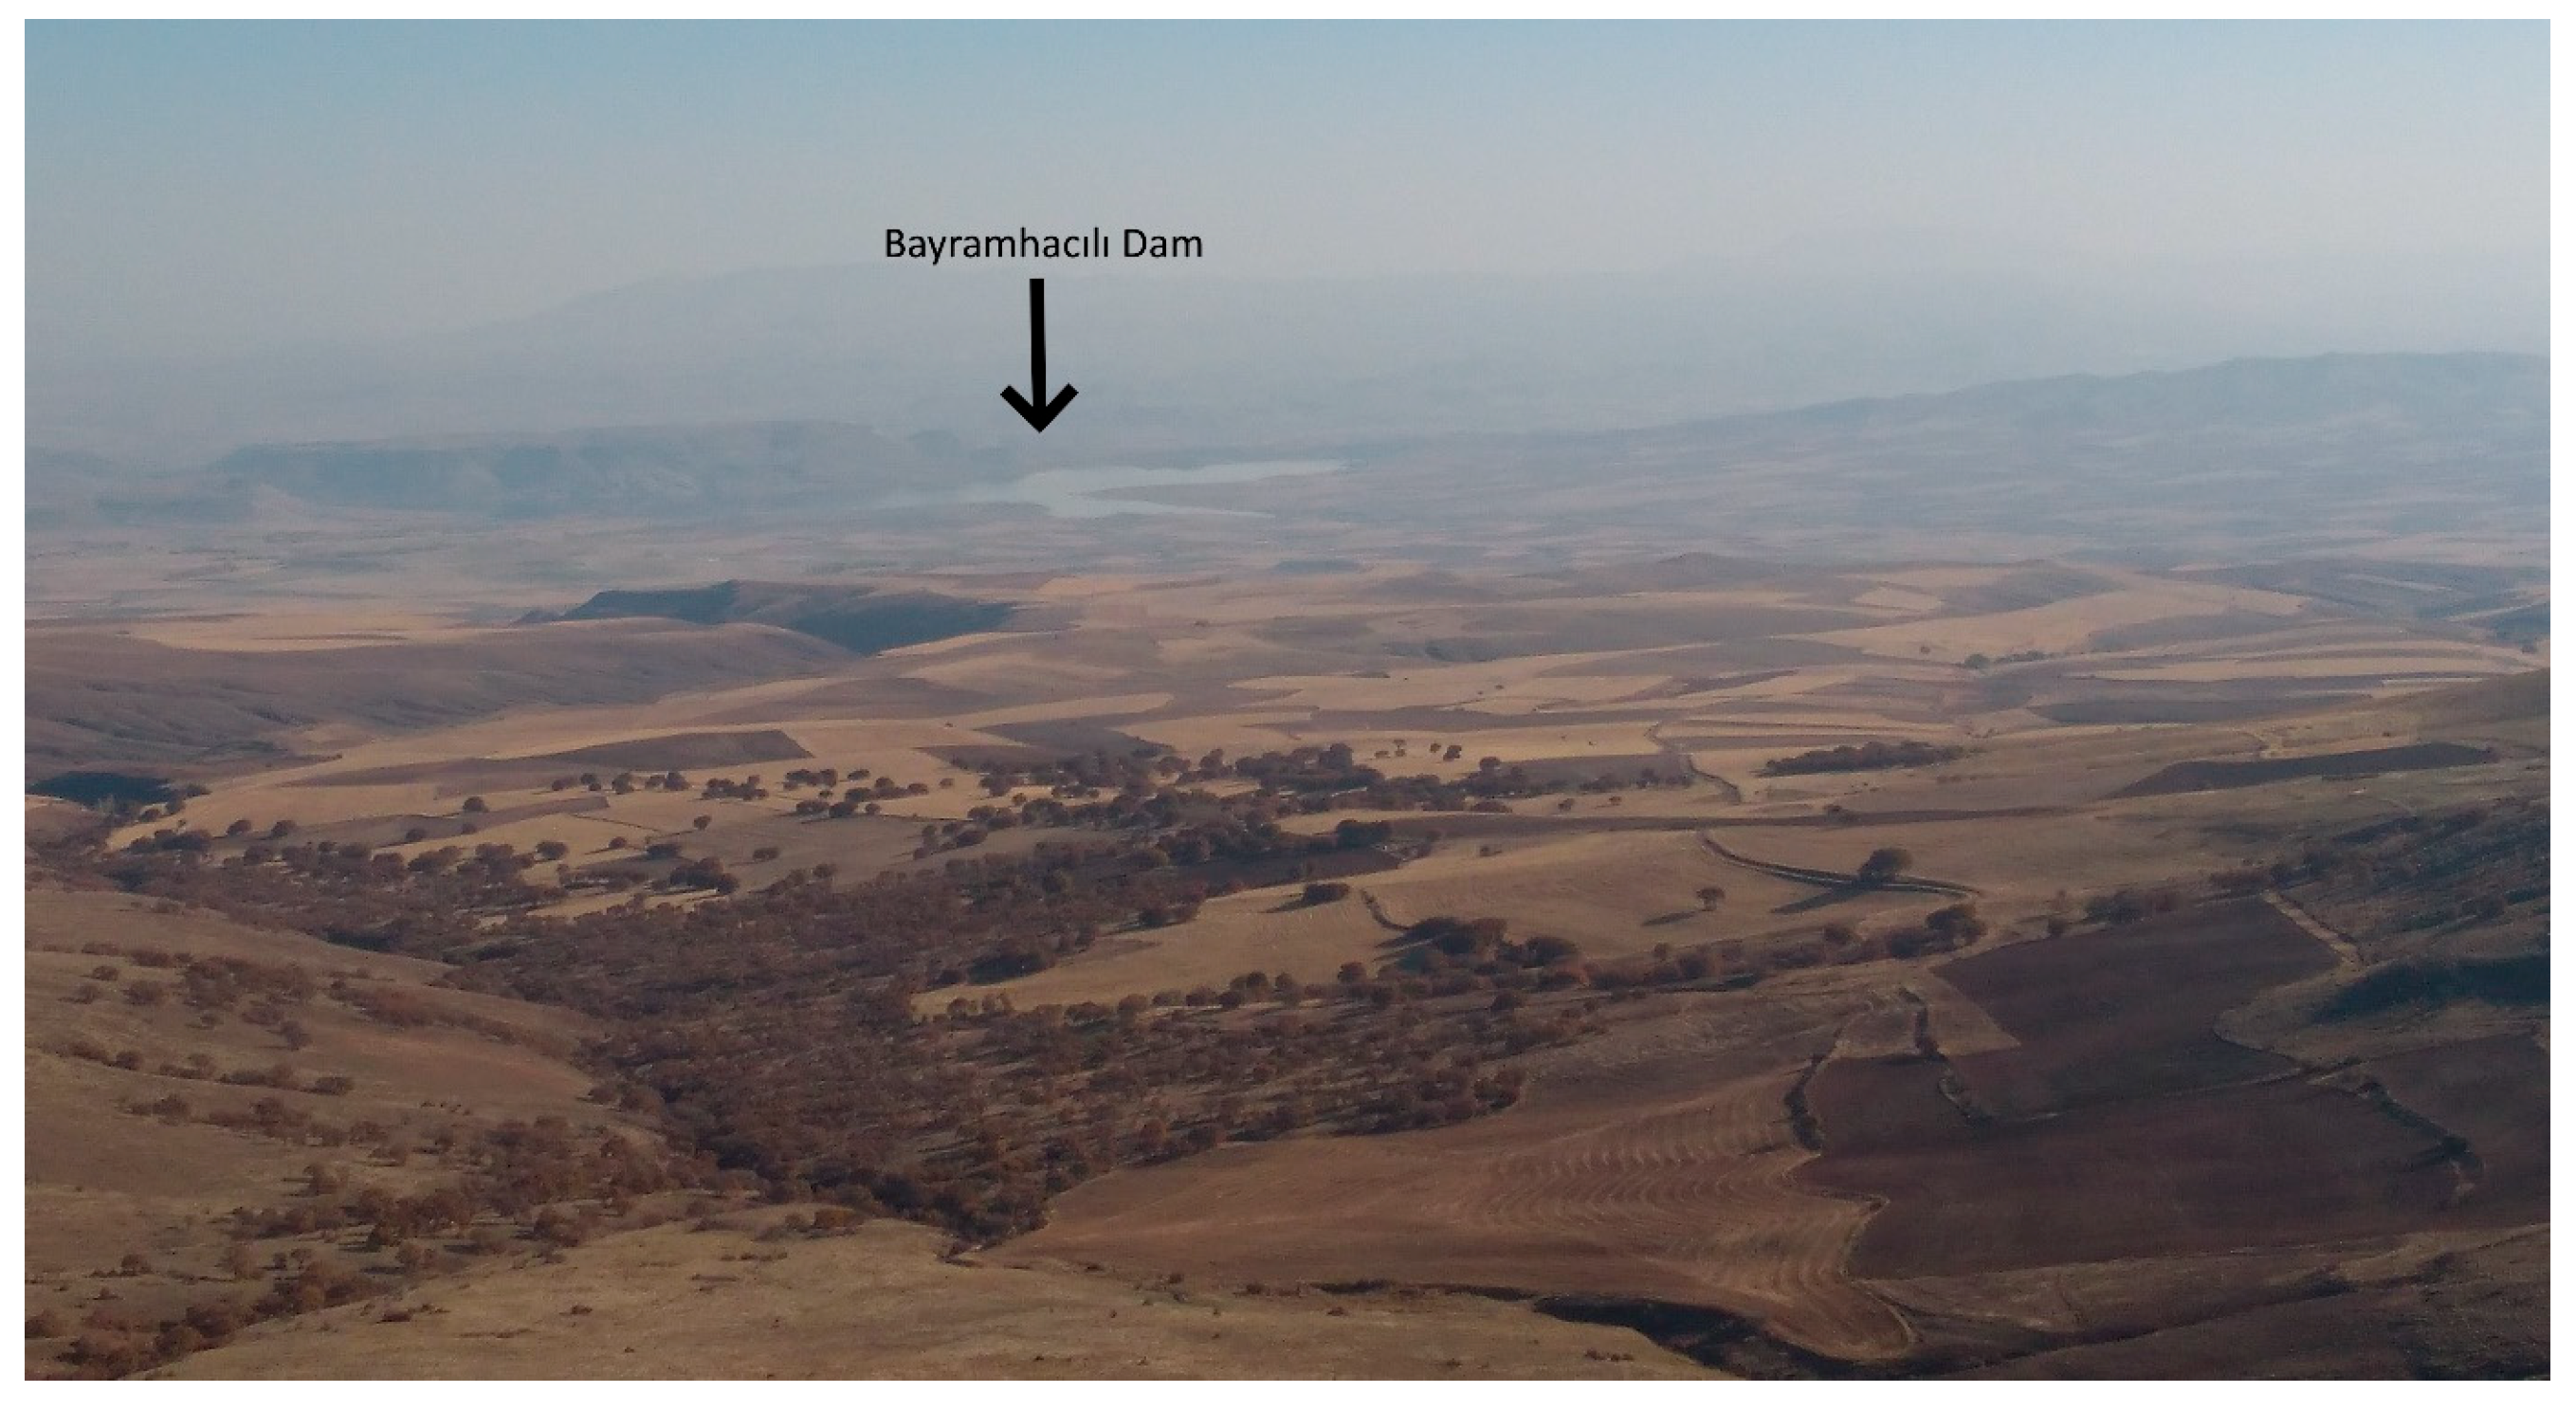
The 2018 CORINE land-cover and land-use map of the Özkonak Watershed was examined, and a relationship between topography and land use was observed. Agricultural activities covering extensive areas constitute the dominant land use throughout the watershed. In particular, “Complex cultivation patterns” and “Non-irrigated arable land,” distributed over gently sloping plains and plateau surfaces in the central, southern, and western parts of the watershed, clearly reveal the spatial dominance of anthropogenic intervention and agricultural activities. By contrast, in the northern parts, where morphologically rugged and sloping areas are concentrated, agricultural activities give way to natural and semi-natural cover classes such as “Land principally occupied by agriculture,” “Natural grassland,” “Sparsely vegetated areas,” and “Transitional woodland–shrub.” Other important agricultural activities in the area are represented by “Vineyards” and by “Permanently irrigated land” and “Fruit trees and berry plantations,” which are concentrated along streams and on valley-bottom land. “Water bodies” at the southeastern end of the watershed represent the reservoir boundary of the Bayramhacılı Dam located at the watershed outlet (Figure 5 and Figure 6).
Figure 5.
Land use in the study area based on the 2018 CORINE Land Cover dataset. The red line indicates the Özkonak Watershed boundary.
Figure 6.
View from the north of the study area toward the Bayramhacılı Dam.
The land-cover pattern has a direct determining role in the water quality, water budget, and sedimentation dynamics of the Bayramhacılı Dam located at the watershed outlet. Sparsely vegetated areas, natural grasslands, and dry-farming areas, particularly those distributed in the northern part of the watershed, transmit the kinetic energy of rainfall directly to the soil because they lack vegetation protection and have high slope gradients. This condition produces high values of the C (vegetation-cover) factor of the RUSLE model in these areas, increases the surface-runoff coefficient, and accelerates the transport of material eroded from slopes to the Bayramhacılı Dam reservoir at the watershed outlet. On the other hand, intensive agricultural land uses occupying extensive areas in the watershed (“Complex cultivation patterns” and “Permanently irrigated land”) have the potential to exert chemical pressure on water quality because of agricultural fertilization and pesticide applications. Agricultural nutrients entering the drainage network through runoff may trigger eutrophication risk in the Bayramhacılı Dam reservoir and degrade water quality. The application of conservation tillage methods on steep slopes and sustainable agricultural techniques throughout the Özkonak Watershed is of vital importance.
3.3. RUSLE
3.3.1. Distribution and Spatial Variability of the Rainfall Erosivity (R) Factor
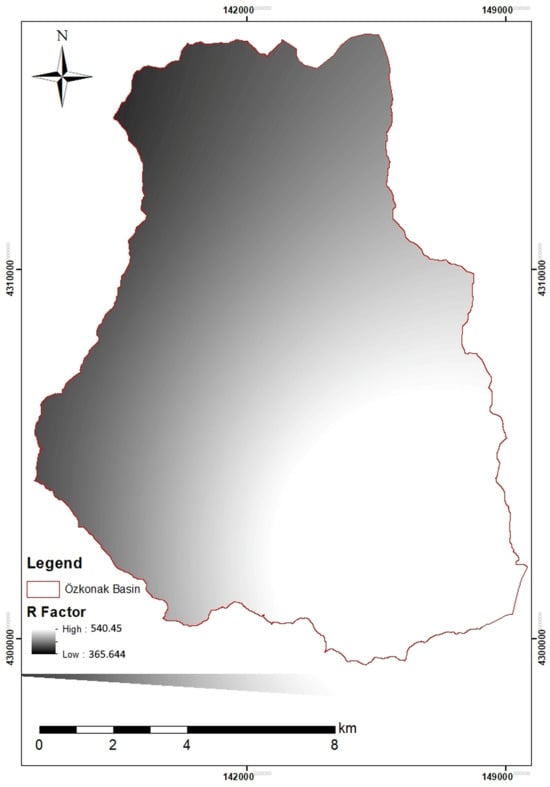
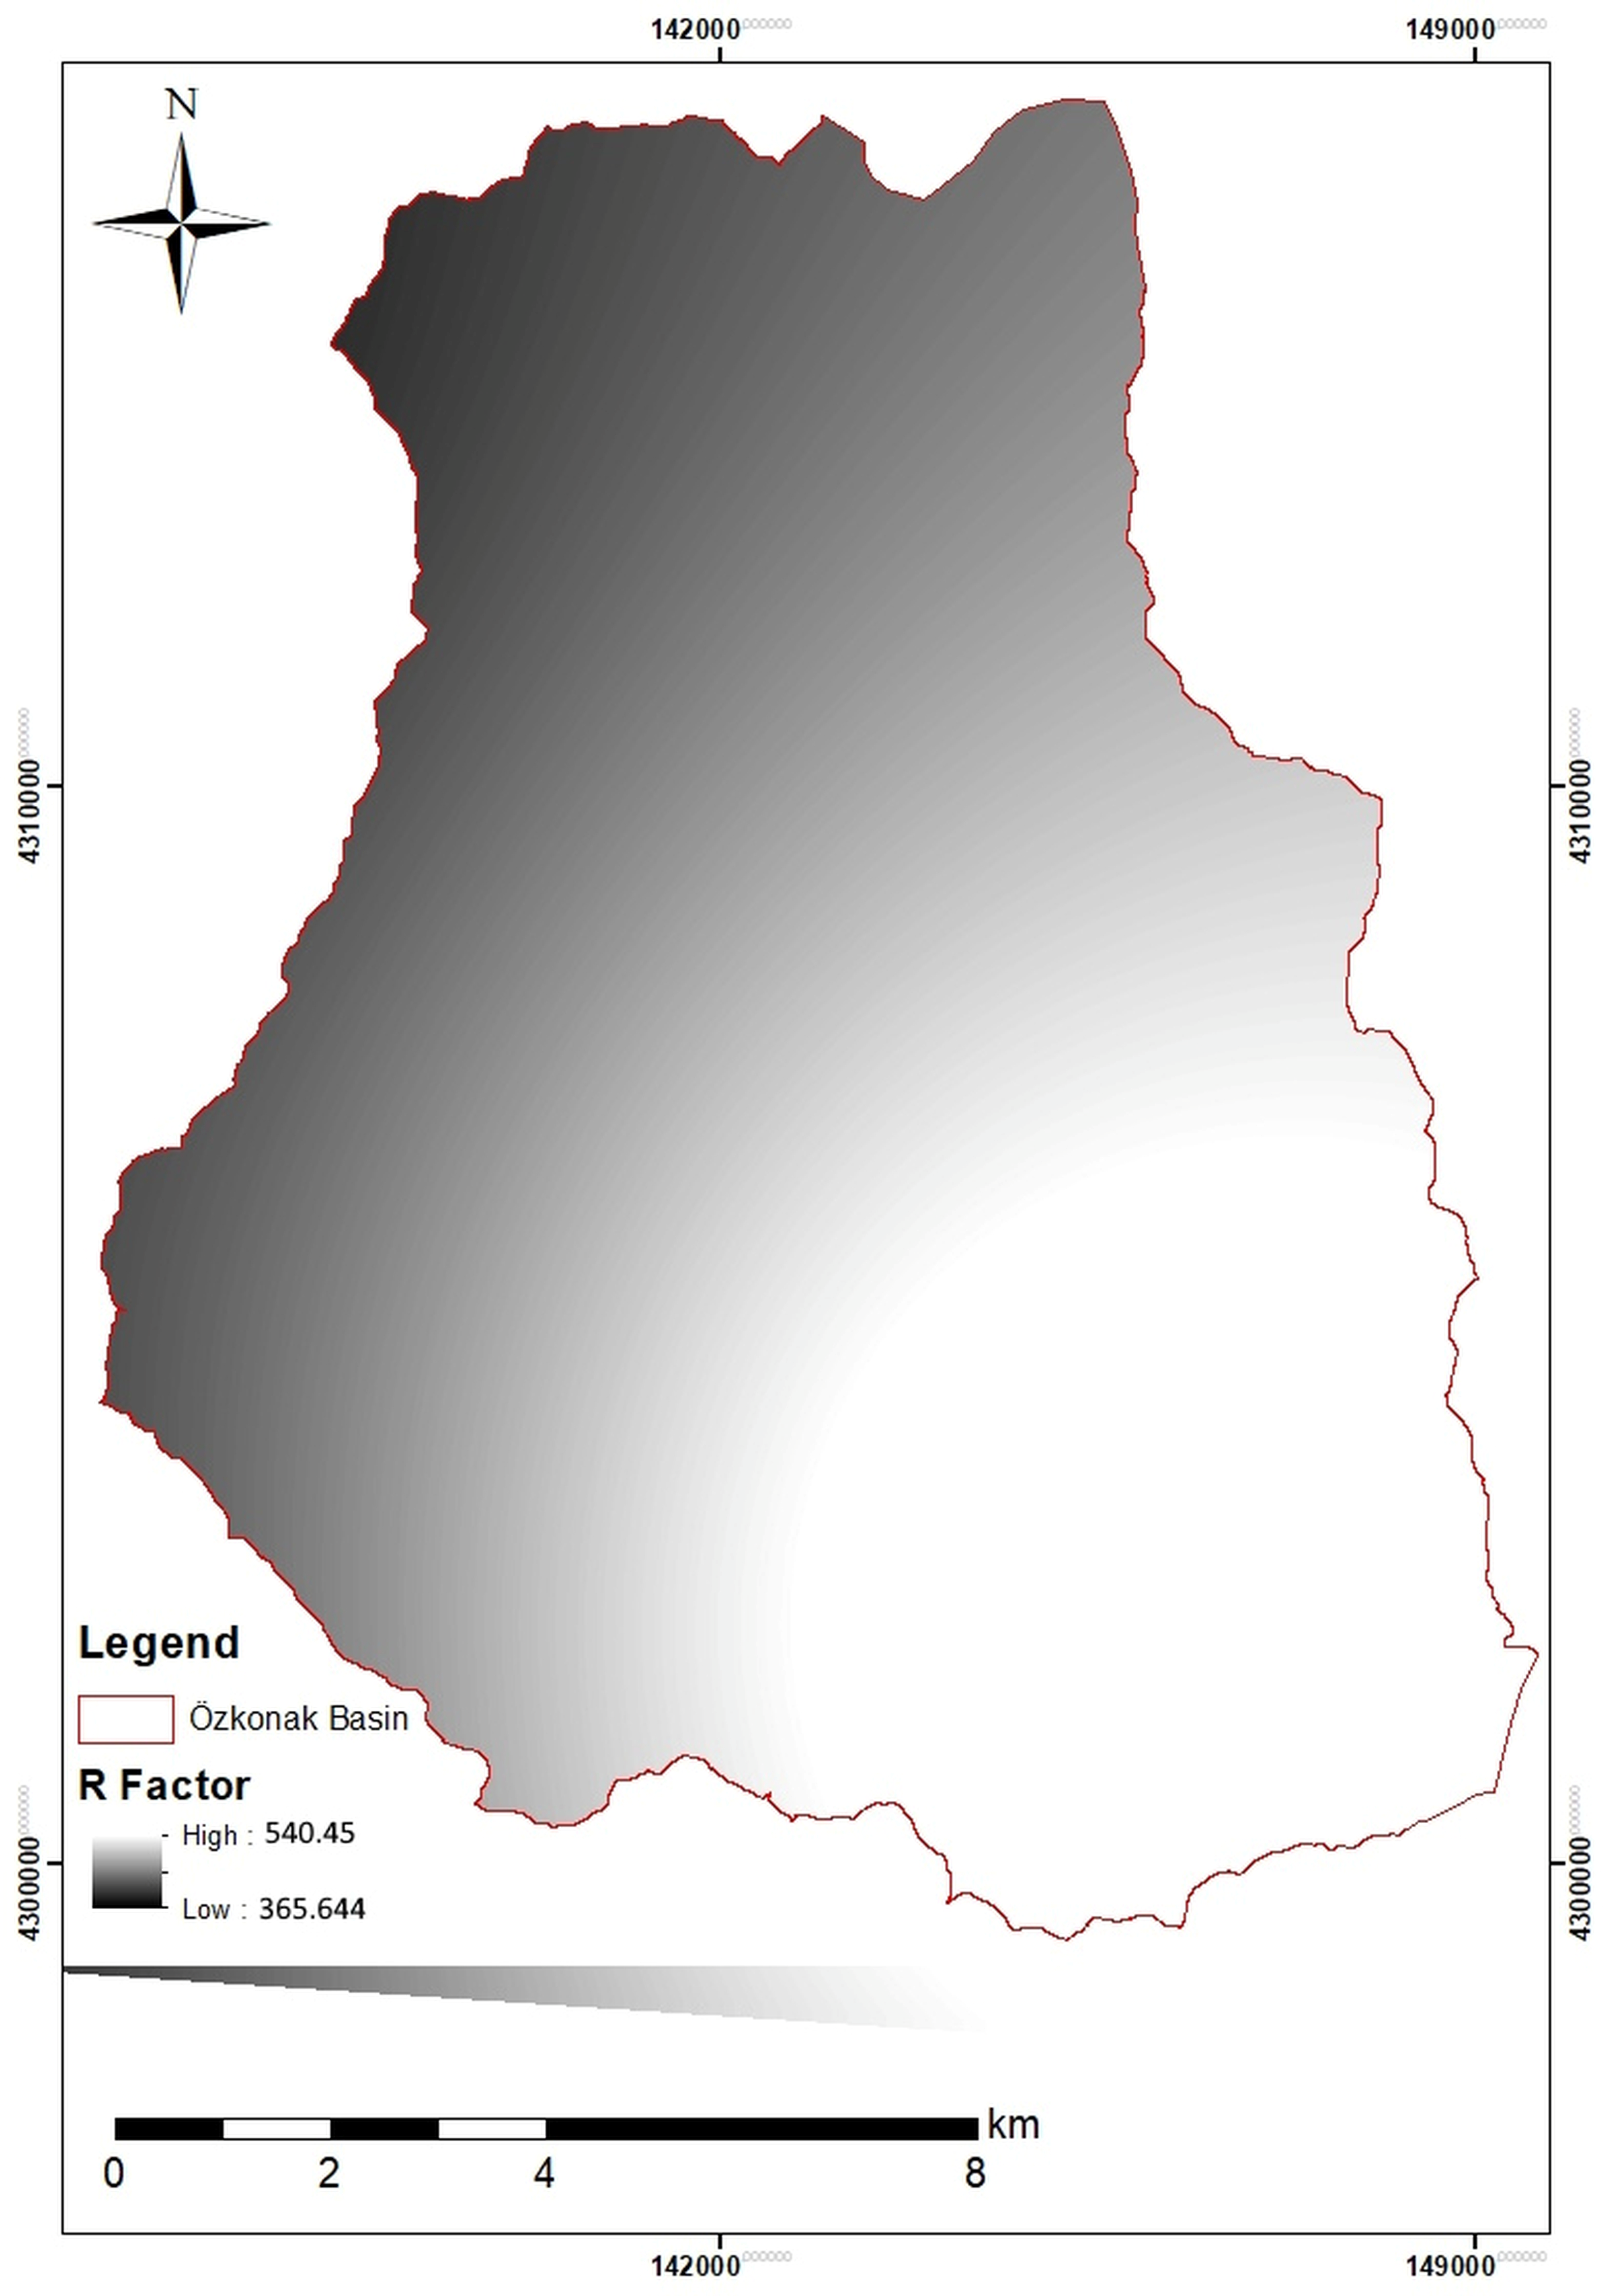
Rainfall, the principal kinetic driving force of water erosion, directly affects soil disintegration and its transport through surface runoff. Within the Revised Universal Soil Loss Equation (RUSLE), this parameter, defined as the Rainfall Erosivity Factor (R), expresses the erosion potential of rainfall as a function (EI30) of the total kinetic energy of raindrops at impact (E) and the maximum 30 min rainfall intensity of the storm (I30) [21,22]. When the other model conditions are held constant, gross soil losses from slopes are assumed to be directly proportional to this erosive force of rainfall [60]. Standard calculation of the R factor requires long-term, continuous, and high-resolution rainfall-intensity data based on pluviograph records [22]. However, alternative approaches have been developed for areas where continuous data are difficult to obtain or the pluviograph-station network is inadequate [44]. More recently, Torres-Cadena and Escalante-Sandoval [61] demonstrated that empirical transfer functions based on daily rainfall totals could reproduce a reference annual erosivity series more closely than regional annual precipitation equations, yielding a substantially lower standard error of fit at their validation station. To determine the R factor of the Özkonak Watershed, the Modified Fournier Index (MFI), which uses long-term monthly mean and annual mean total precipitation (P) data obtained from meteorological stations, is one of the most widely accepted methods [45,62]. Within the study, MFI values calculated using data from surrounding meteorological stations were converted into the R factor in light of regression equations demonstrated to have high accuracy under Turkish conditions and regional reference studies [63,64,65]. The distribution of R values obtained from point-station data across the watershed was based on the linear relationships between climatic elements and topography. Accordingly, erosive potential at different elevations was estimated using the Schreiber formula, which predicts a 54 mm increase in precipitation for each 100 m increase in elevation [66,67], and the relationship Rγ = Rβ × (Pγ/Pβ), which is based on elevation–precipitation variation [68]. The resulting data were converted into a continuous raster surface in a GIS environment by integrating a Digital Elevation Model (DEM) and applying the Inverse Distance Weighted (IDW) interpolation technique. Examination of the resulting Rainfall Erosivity (R) Factor map showed that erosivity values across the Özkonak Watershed varied spatially between 365.64 and 540.45 mm (Figure 7). The erosivity values are consistent with the physiographic and orographic characteristics of the watershed. In the high mountainous areas and steep slopes in the northern and northwestern parts of the watershed, the R factor reaches its maximum level (540.45), parallel to the elevation-related increase in orographic precipitation. This indicates that the kinetic energy of raindrops and the associated erosive potential of surface runoff are highest in the upper-watershed components. Toward the southeast, as the topography becomes flatter and elevation decreases, the R factor declines gradually and reaches its minimum value of 365.64 on valley floors and plains near the watershed outlet. Areas with high erosive potential in the northern part of the watershed are also sensitive zones where vegetation cover is weak and shallow soils are dominant. Fine material detached by the kinetic energy of rainfall in these areas is transported directly through the drainage network to the low-lying watershed floor in the southeast.
Figure 7.
R-factor map.
3.3.2. Spatial Analysis of the Soil Erodibility (K) Factor and Sediment Characterization
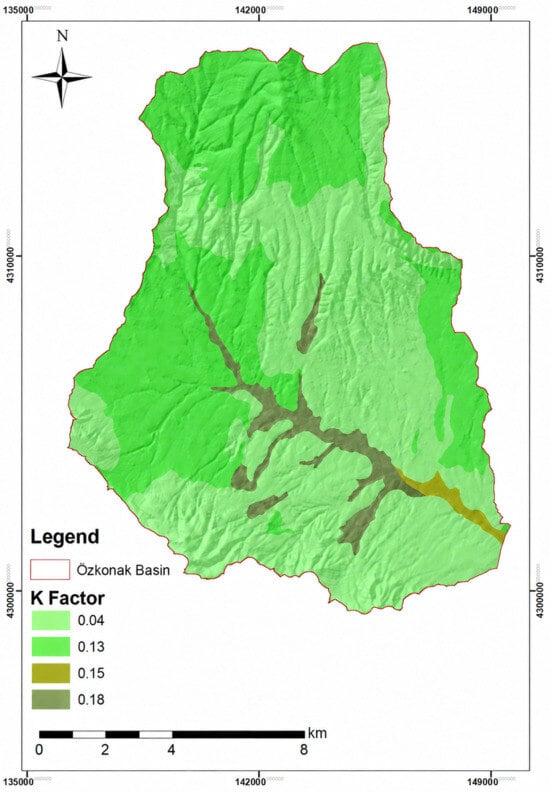
The soil erodibility factor (K) is a fundamental parameter expressing the inherent resistance of soil to detachment by erosion forces and transport by surface runoff [22]. Among the components of the RUSLE model, the K factor represents the rate of soil loss per unit rainfall-erosion index on a standard experimental plot (22.13 m slope length, 9% slope, and continuous fallow) [21]. Assuming that all other environmental factors are constant, differences in field erosion are directly based on these susceptibility values arising from the physical, chemical, and mineralogical properties of soils. Soil erodibility is largely shaped by interactions among texture (proportions of sand, fine sand, silt, and clay), organic-matter content, structural class, and hydraulic permeability [69,70]. Particle size is decisive for susceptibility; for example, high proportions of silt and very fine sand reduce soil resistance to erosion and increase the K factor. By contrast, although fine fractions such as clay are not resistant to transport, their high resistance to dispersion and dissolution reduces erodibility [71]. Similarly, organic matter, which performs a critical binding role in aggregate formation, creates stable structural units with clay particles, increases soil stability, and substantially reduces erosion susceptibility [72]. Coarse-textured sandy soils reduce surface-runoff volume because of their high infiltration capacity; however, owing to weak interparticle cohesion, they can be eroded readily under increasing slope conditions.
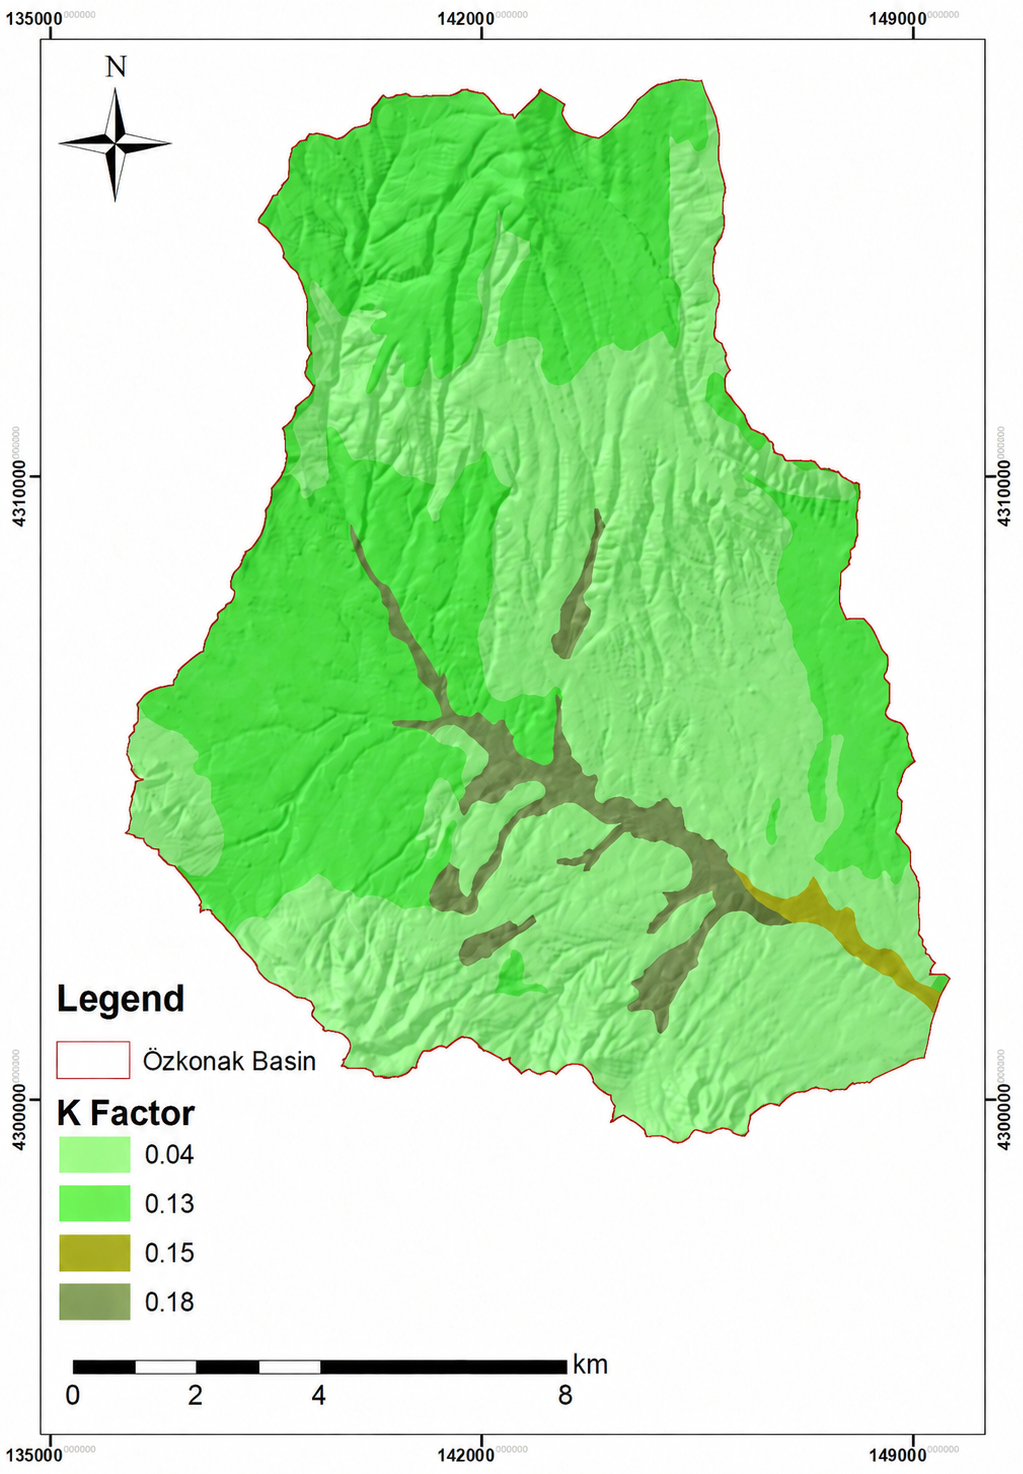
Examination of the K-factor map produced for the Özkonak Watershed (Figure 8) shows that the lowest susceptibility values (0.04) are concentrated on extensive plateau surfaces in the northern, western, and central parts of the watershed. These areas largely coincide with shallow Lithic Leptosols and Leptosols–Cambisols units having high stoniness. Coarse material in these soils acts as armor against the mechanical impact of raindrops, makes the detachment of soil particles more difficult, and consequently reduces the K factor to its minimum level. In the southern, southwestern, and eastern parts of the watershed, susceptibility values increase to moderate levels (0.13). These areas contain Vertic Cambisols and Calcaric Cambisols with high clay content and shrink–swell capacity and exhibit moderate erodibility because of cracks formed during seasonal dry periods and changes in aggregate stability. The most notable pedological finding of the watershed is that the highest K-factor values (0.18 and 0.15) extend along valley slopes forming the principal drainage network and across plains in the lower watershed. Young alluvial soils (Eutric Fluvisols) distributed in these areas contain high proportions of silt and very fine sand as a result of fluvial depositional processes. These loose soils, which have weak interparticle cohesion and incompletely developed structure, are extremely vulnerable to mechanical erosion when saturated with water.
Figure 8.
K-factor map.
The distribution pattern of the K factor in the watershed constitutes a threat to the Bayramhacılı Dam located at the watershed outlet. Under normal conditions, low erosion susceptibility (K = 0.04) in the steeply sloping northern parts could be viewed as favorable for the watershed as a whole. However, the direct occurrence of the most erosion-susceptible and highly erodible soils (K = 0.18) in streambeds and on valley slopes accelerates fluvial-transport processes. When sediment reaching the drainage line from slopes through gravity and surface runoff encounters high-energy channel flow, it rapidly erodes these sensitive fluvial deposits on the valley floor (K = 0.18) through bed and gully erosion and deepens the river channel. This condition scientifically demonstrates that stream channels must also be supported urgently by sediment-control structures, such as check dams and flood-retention structures, in watershed-rehabilitation works intended to protect the dam reservoir.
3.3.3. Topographic Control Shaping Rainfall-Erosion Potential: Slope Length and Steepness (LS) Factor
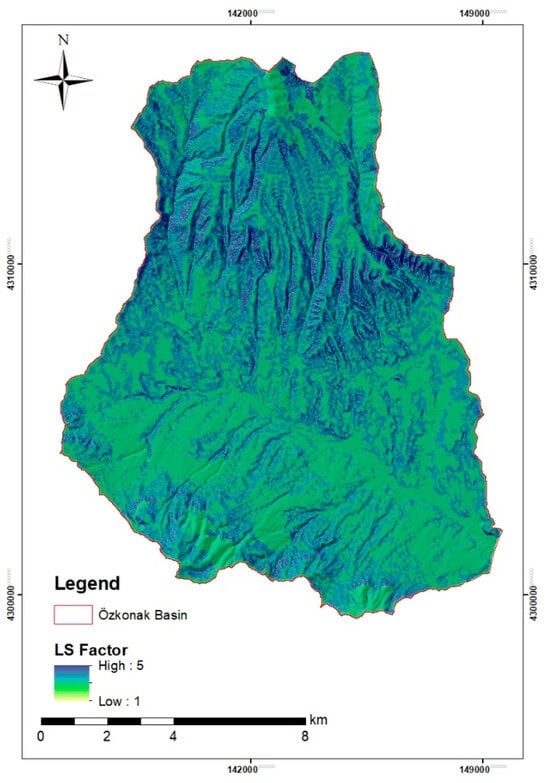
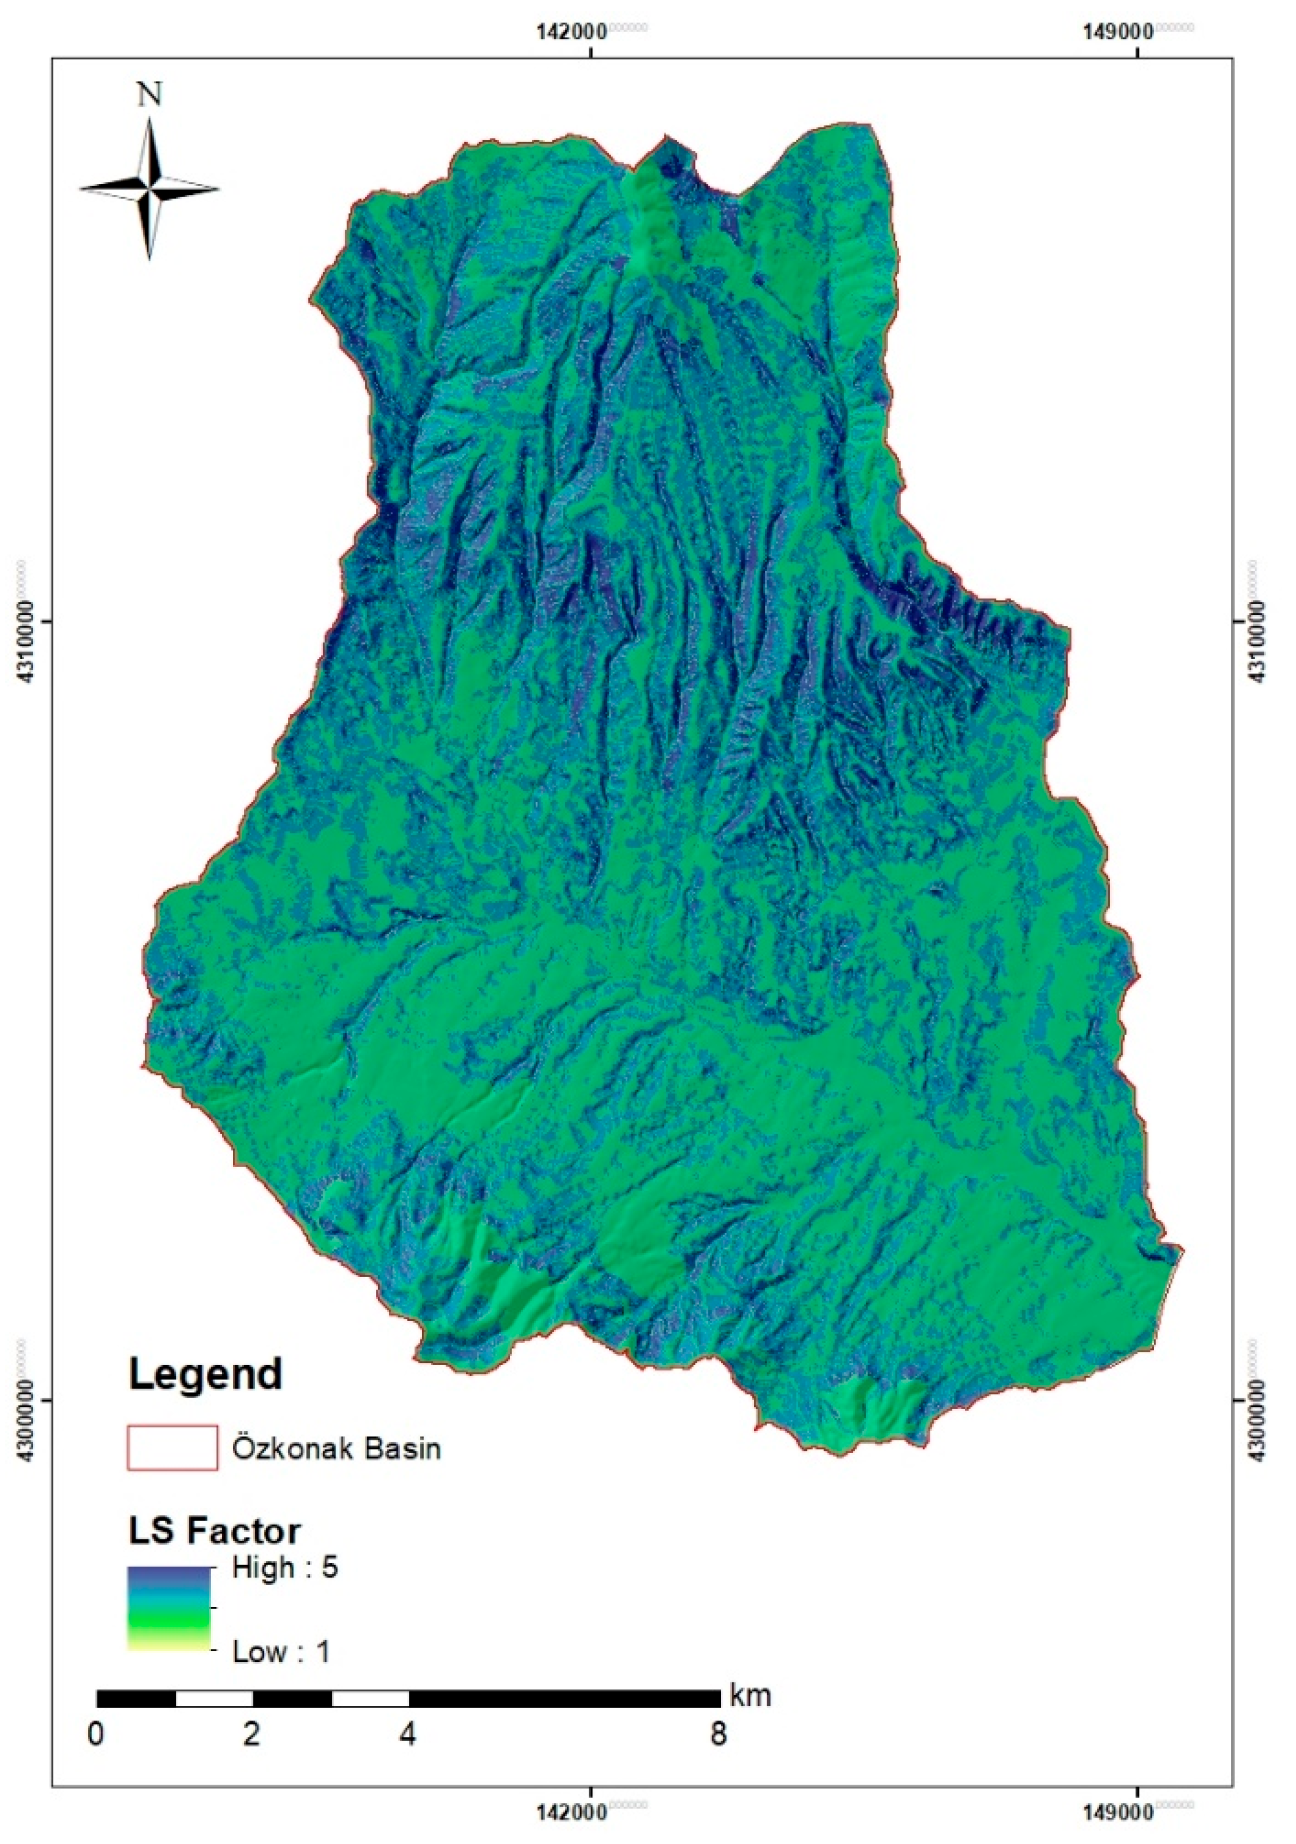
The most important topographic parameter determining the intensity, spatial distribution, and magnitude of water erosion is the LS factor, which combines the components of slope length and slope steepness [21,22]. In the model, the L factor denotes the horizontal distance from the point at which surface runoff begins to the point at which the slope decreases and sediment deposition occurs or the flow reaches a defined drainage channel; the S factor reflects the surface slope and determines the velocity, volume, and erosive power of surface runoff [73,74]. Assuming that other erosion conditions are constant or similar, increases in slope gradient and slope length reduce the infiltration of rainwater and increase the proportion entering surface runoff directly; this raises the kinetic energy of the flow and the shear force applied to soil particles, thereby intensifying erosion [75,76]. In the Revised Universal Soil Loss Equation (RUSLE) methodology, the LS factor is not an absolute value; it represents the ratio of soil loss from a standard experimental plot 22.13 m long with a 9% slope, and the LS value of the reference area under these standard conditions is accepted as 1 [22,77]. Because direct field measurement and calculation of the LS factor are very difficult in drainage basins with extensive and complex topography, current erosion-modeling studies conduct three-dimensional, cell-based calculations in a GIS environment using high-resolution Digital Elevation Models (DEMs) [78]. In this context, the pixel-based approach developed by Moore and Burch [73], which considers the upslope contributing area and analyzes the effects of microtopography precisely, was used. Examination of the Özkonak Watershed LS-factor map produced in the GIS environment (Figure 9) shows that factor values vary spatially between 1 and 5 and directly reflect the heterogeneous topography. Areas represented by green tones, where values approach the minimum level (1), include gently sloping plateau surfaces and plains along streams in the central and southern parts of the watershed. In these areas, lower topographic gradients reduce surface-runoff velocity and increase the tendency of eroded material to accumulate. By contrast, LS values reach the maximum level (5) on valley slopes, steep ridges, and particularly the deeply dissected rugged mountainous areas in the north, represented by blue and dark-blue tones on the map. The combination of high slope steepness and length maximizes the mechanical erosive power of accumulated runoff energy in these areas. This situation exerts direct pressure on the Bayramhacılı Dam at the hydrographic outlet of the watershed.
Figure 9.
LS-factor map of the study area.
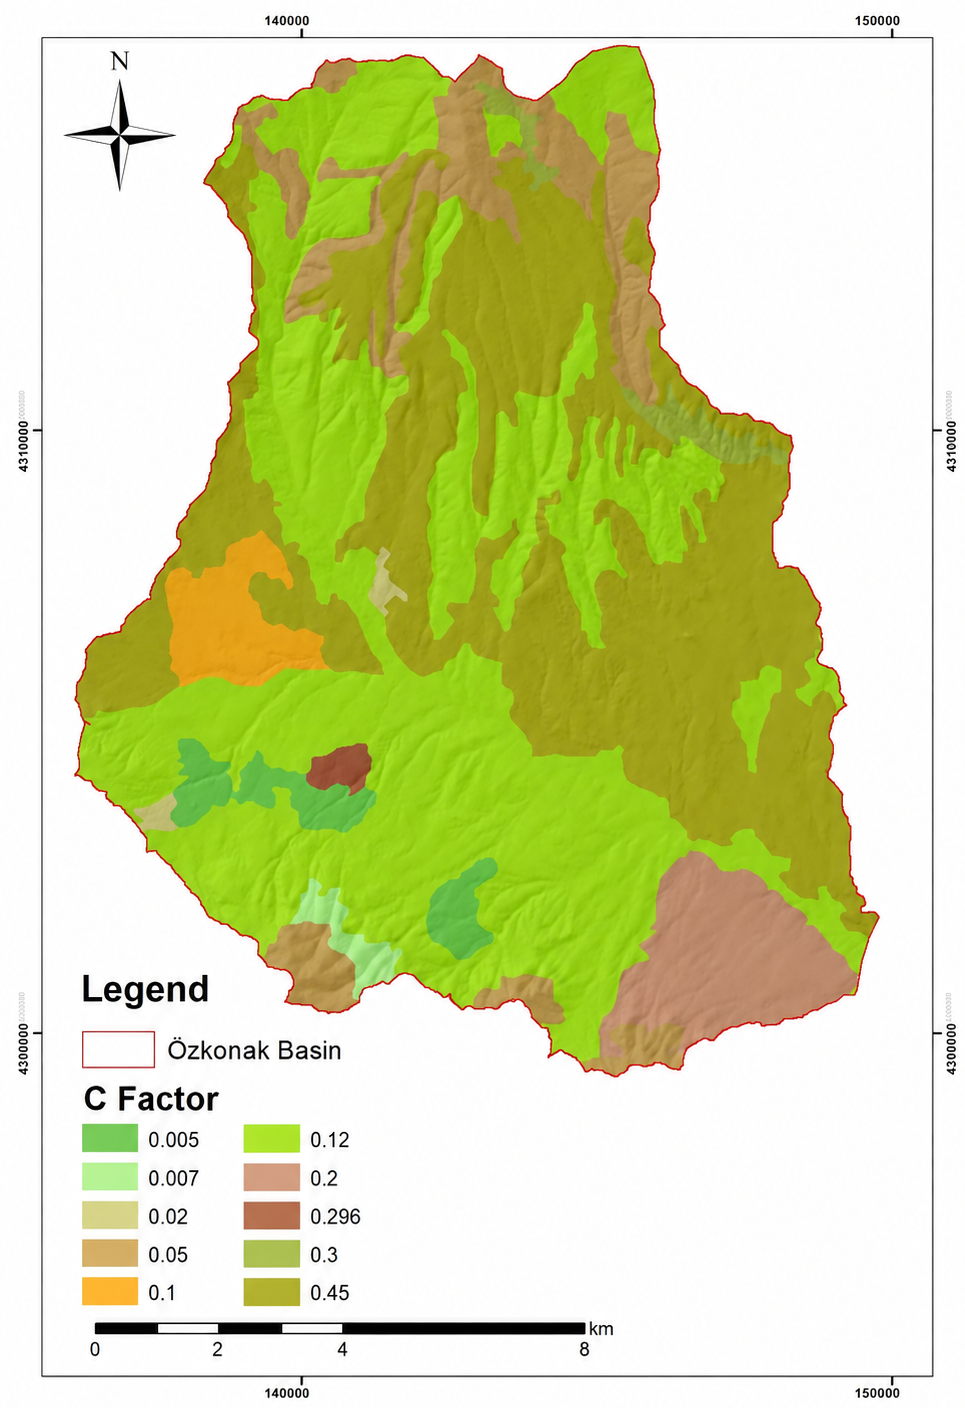
3.3.4. Distribution and Spatial Analysis of the Cover and Management (C) Factor
The Cover and Management (C) factor is the most important parameter quantitatively expressing the extent to which the soil surface is protected by vegetation cover and land-management practices during water-erosion processes [21,22]. As a dimensionless coefficient, the C factor primarily reflects the ability of vegetation to reduce the kinetic energy of raindrops immediately before they strike the soil surface and to slow surface runoff, thereby preventing soil detachment and transport [79]. Within the model, the C factor generally ranges from 0 to 1. In forested areas with dense and healthy vegetation, the C value approaches 0 and represents high protection against erosion, whereas on bare land without vegetation cover that has been tilled or left fallow for agricultural activities, it approaches 1 and indicates that the soil is highly susceptible to erosion [80,81]. As a natural buffer mechanism regulating erosion intensity, vegetation directly reduces erodibility by improving the physical, chemical, and biological properties of soil. Surface vegetation and organic residues cover the soil and form a protective barrier; plant root systems increase the mechanical resistance and stability of the soil; and increased hydraulic roughness maximizes infiltration capacity and consequently minimizes surface-runoff volume. Even when the erosive pressure of all other climatic, soil, and topographic parameters is assumed to remain constant, increasing vegetation density is the principal factor that reduces erosion risk and can be most readily modified by human intervention in sustainable watershed management [3,20]. Because land cover, agricultural cropping patterns, and plant-development stages show seasonal and anthropogenic variation during the year, direct field calculation of the C factor using conventional methods is very difficult; therefore, current modeling studies make extensive use of GIS and RS technologies. Allataifeh et al. [82] found that the performance of NDVI-based C-factor models varied systematically with crop type, tillage practice, and temporal scale, while monthly estimates captured intra-seasonal variability without altering the broader seasonal patterns. In the study, CORINE (2018) land-cover data were integrated with current imagery, and current land-use classes were identified with high accuracy [80,83]. Standard C-factor coefficients accepted in the literature were assigned to the identified classes to create a continuous raster surface [81,84,85].
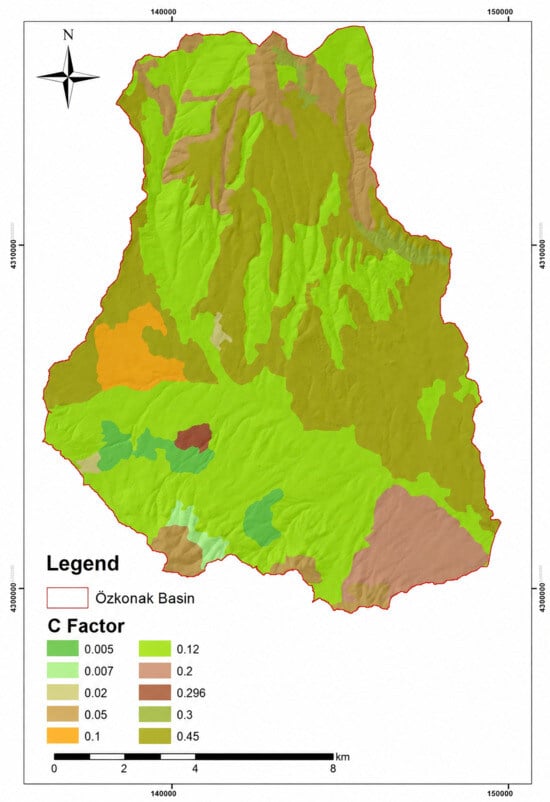
Examination of the Cover and Management (C) Factor map (Figure 10) showed that C values varied spatially from 0.005 to 0.45. Low C values (0.005–0.02), represented by dark- and light-green tones on the map, are distributed in local areas in the southeastern, southwestern, and northern parts of the watershed. These areas largely contain natural grasslands, transitional woodland–shrub areas, and relatively stable vegetation cover. Dense vegetation in these areas maintains the C factor at its minimum level. By contrast, in areas occupying large portions of the central, eastern, and western parts of the watershed and represented by brown and green tones on the map, the C factor reaches its highest values, between 0.30 and 0.45. These high values are directly associated with complex cultivation patterns, dry-farming land, and open areas with sparse vegetation that occupy extensive parts of the watershed. Periodic tillage, bare-soil conditions, and the lack of vegetation protection resulting from agricultural activities minimize the resistance of these areas to external erosive forces.
Figure 10.
C-factor map of the study area.
High C values (0.30–0.45), which are widespread in the middle and upper reaches of the watershed, allow rainwater to contact the soil directly and without obstruction during rainy seasons, particularly during the convective spring rains of Central Anatolia. Rainfall that is not intercepted by plants rapidly becomes surface runoff across these extensive, poorly protected agricultural areas. Owing to the high runoff coefficient, the load of fine sediment detached from slopes is transported continuously through the watershed drainage network toward the Bayramhacılı Dam reservoir. In addition, sediments transported by surface runoff from these agricultural areas with high C-factor values probably carry agricultural chemicals into the reservoir.
3.3.5. Distribution of Potential Erosion-Risk Areas in the Özkonak Watershed (RUSLE)
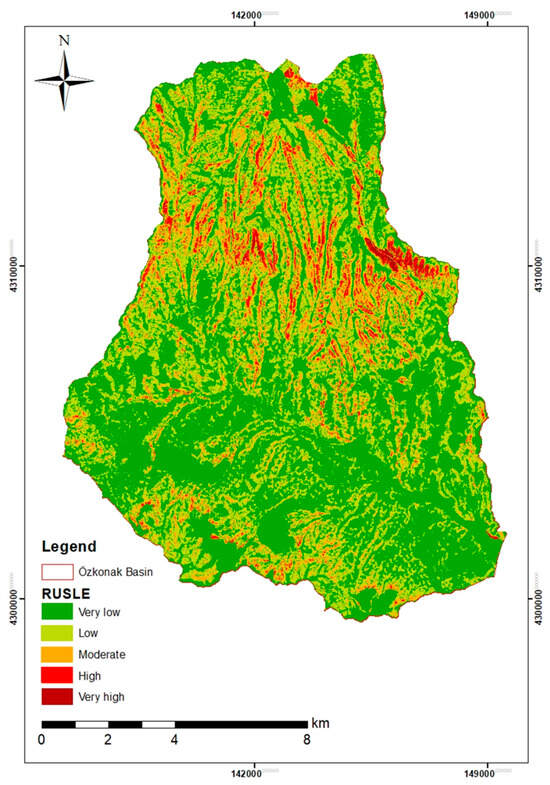
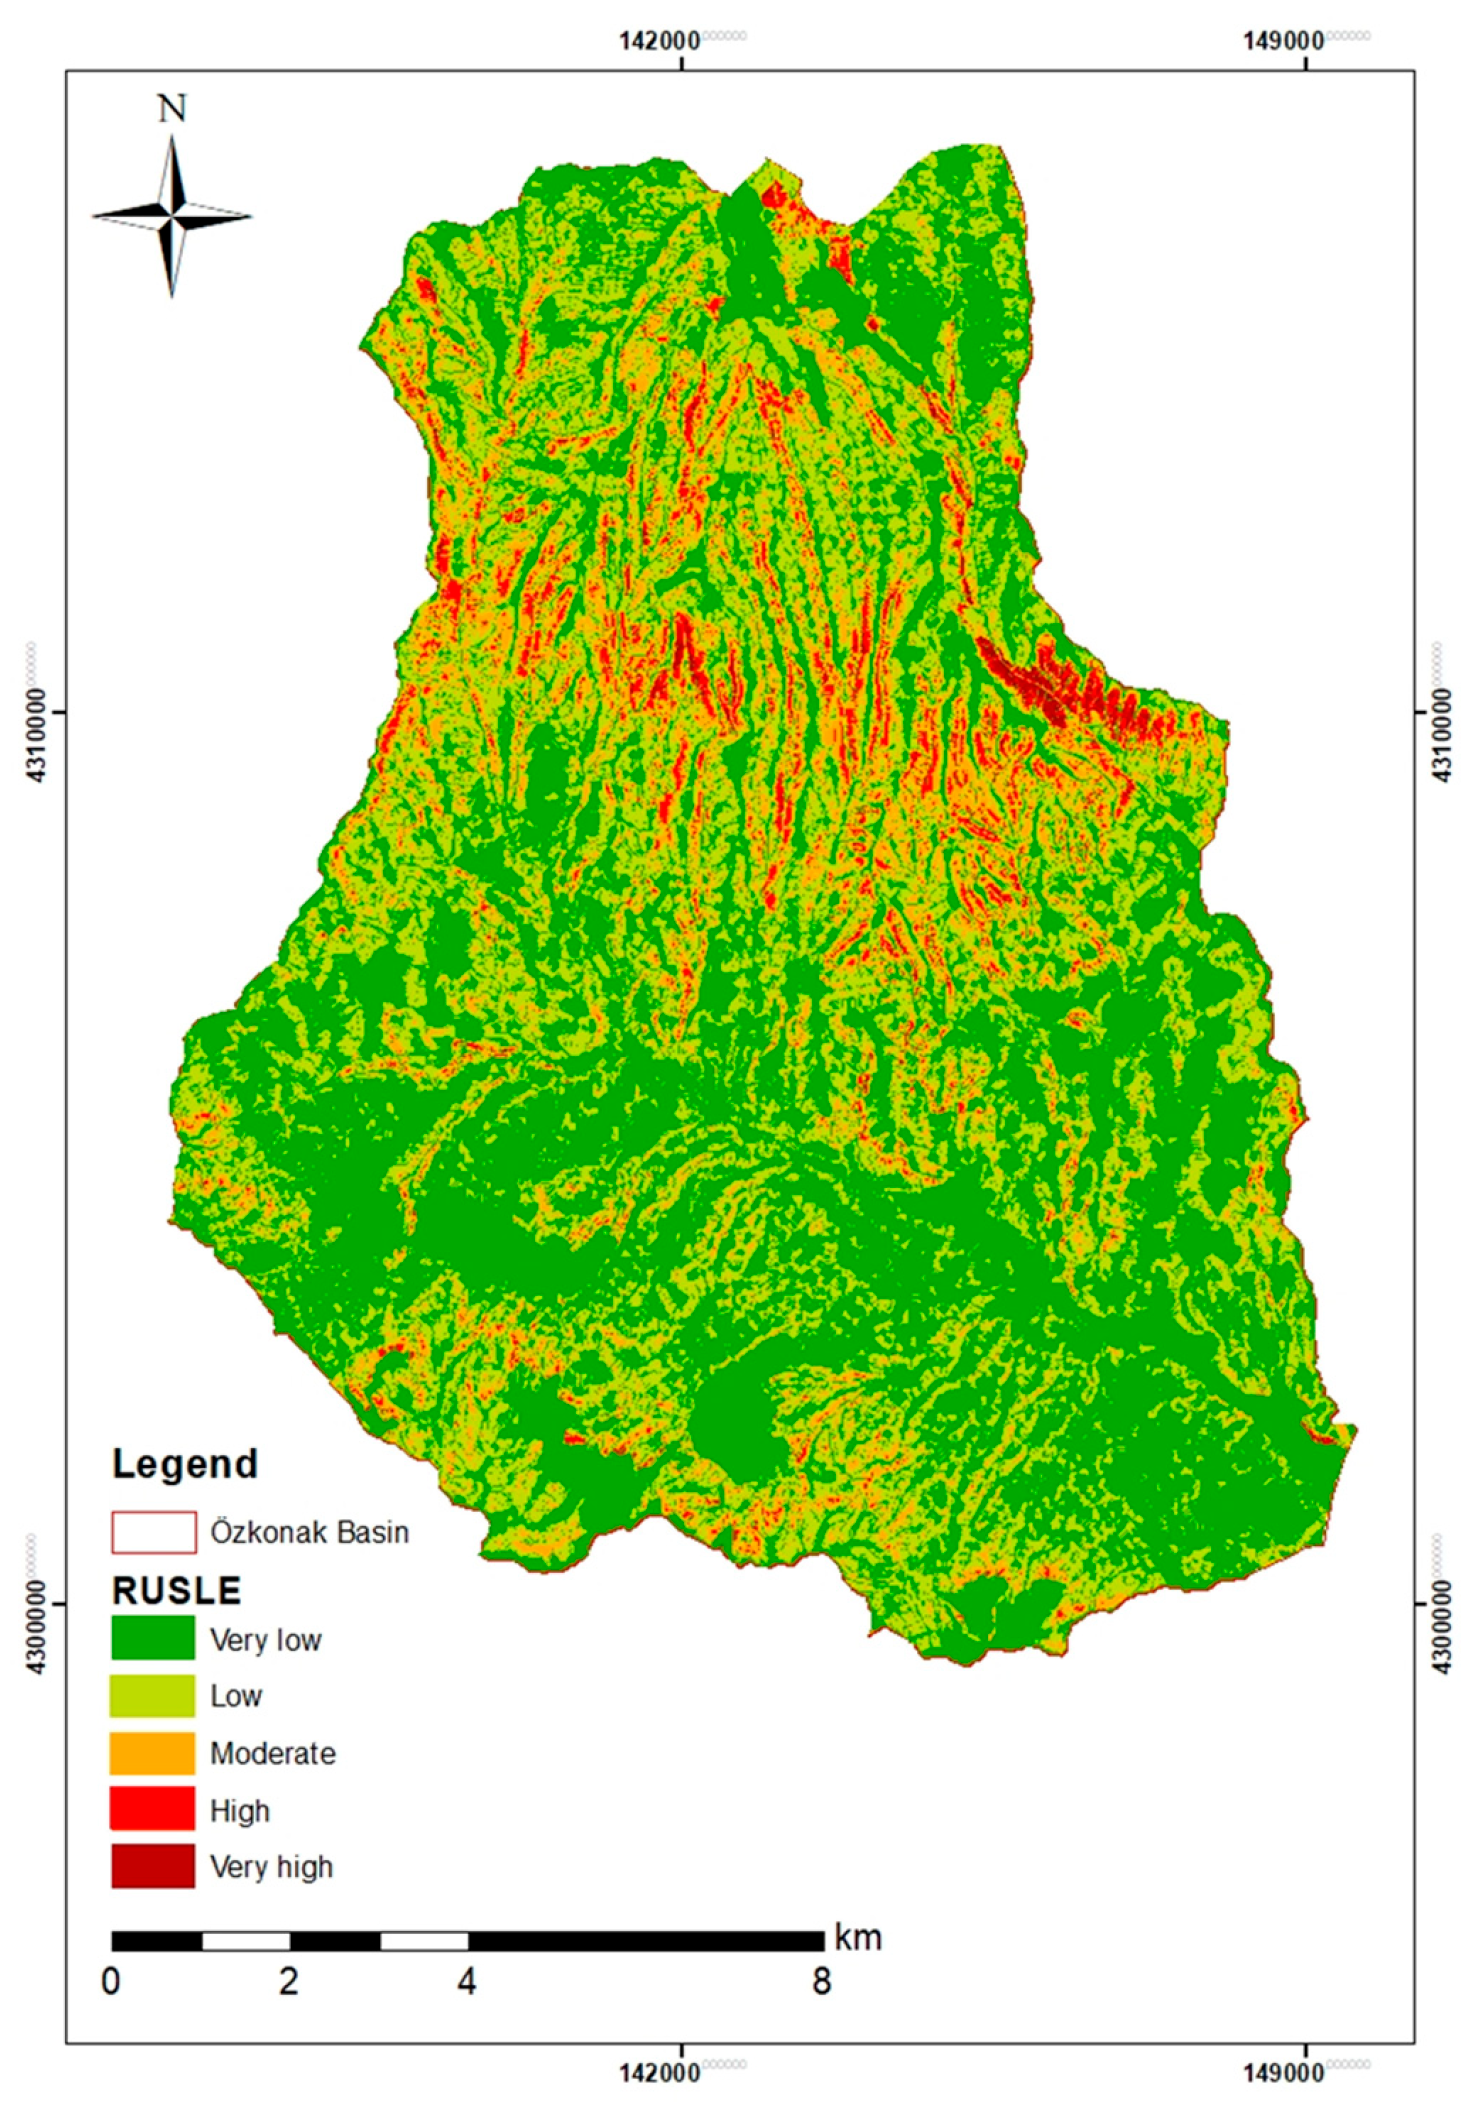
Annual potential soil-loss amounts obtained from RUSLE-based modeling in the Özkonak Watershed indicate that erosion has a spatially highly heterogeneous distribution that is nevertheless strongly consistent with topographic and anthropogenic factors (Figure 11). Annual potential soil-loss values across the watershed range from 0 to 51 t ha−1 yr−1; these values were classified and analyzed in five erosion-severity classes in accordance with FAO and literature criteria (Table 4).
Figure 11.
RUSLE erosion model of the Özkonak Watershed.
Table 4.
Area and proportional distribution of potential erosion classes in the Özkonak Watershed.
High slope gradients in the highly rugged and steeply sloping areas in the northern part of the watershed accelerate surface runoff. These areas contain weakly structured Lithic Leptosols and Leptosols–Cambisols with no profile development, very shallow (0–20 cm) to shallow (20–50 cm) soil depth, and direct occurrence over hard bedrock. In areas where slope gradients decrease and accumulation increases, more developed soil units such as Calcaric Cambisols and Vertic Cambisols occur. Valley floors are active depositional areas where fine material transported from steep slopes continually accumulates, and deep, young alluvial soils occur there. When this pedological structure is combined with the distribution of the K factor expressing erosion susceptibility, erodibility values in the area are shown to range from 0.04 to 0.18 t ha−1 yr−1. In the shallow Leptosol areas of the north with high stoniness, the coarse fraction acts as armor against raindrops and keeps the K factor at its minimum level (0.04), whereas the highest erosion-susceptibility values (0.18 and 0.15) are concentrated in Eutric Fluvisol units in valleys that contain high proportions of silt as a result of fluvial depositional processes.
The areal mean annual soil loss in the Özkonak Watershed was found to be 2.75 t ha−1 yr−1. This value is substantially below Türkiye’s national mean of 8.24 t ha−1 yr−1 [86]. Although this relatively low soil-loss value for the watershed as a whole is a positive indicator contributing to sustainability in terms of erosion dynamics in dam watersheds, not all material eroded from slopes reaches the dam reservoir directly through the fluvial system.
4. Discussion
The data produced by this study show that the areas most sensitive to erosion in the watershed are slopes where gradient and surface runoff increase while protective vegetation is absent. Comparison with recent RUSLE-based studies conducted for different dam watersheds in Türkiye indicates that erosion dynamics in the Özkonak Watershed are parallel to those of other areas with similar characteristics. Recent studies in the literature show that mean annual soil-loss values vary over a wide range, including 11.7 t ha−1 yr−1 in the Atikhisar Dam Watershed [54], 16.13 t ha−1 yr−1 in the Yuvacık Dam Watershed [87], and 0.31 t ha−1 yr−1 in the Naip Dam Watershed [88]. More recently, Aykır et al. [89] estimated a mean annual soil loss of 13 t ha−1 yr−1 in the Güzelhisar Dam Basin, with 37.8% of the basin classified within the very severe erosion-susceptibility class. In the semi-arid Tafna watershed, Hachemi et al. [90] reported a long-term mean annual soil loss of 14.9 t ha−1 yr−1 for 1983–2023, with erosion rates reaching 23–27 t ha−1 yr−1 in steep and sparsely vegetated areas. Considering the mean soil-loss threshold of 12.6 t ha−1 yr−1 calculated in global-scale modeling assessments [91], high-risk areas within the watershed should be monitored carefully in terms of sustainable ecosystem management.
The most critical environmental and economic consequence of hillslope erosion in the watershed is the siltation pressure on the Bayramhacılı Dam reservoir located at the watershed outlet. As emphasized in the literature, the economic life and water-storage capacity of dams are directly related to the amount of material transported from watersheds and delivered to reservoirs [37,92]. In the Özkonak Watershed, material detached particularly from erodible areas with high K-factor values and from dry-farming areas with weak C-factor protection enters the drainage network directly under the effects of high slope (LS) and rainfall erosivity (R). When material transported by streams reaches the reservoir, a standing water body, it is deposited and reduces the active storage capacity of the dam [88,93]. Studies in different watersheds have demonstrated that failure to provide effective erosion control threatens dams [42,43,94]. Using hydrological sedimentation modelling supported by ground-survey and geophysical observations, Arebu et al. [95] estimated an average sediment rise of approximately 7.5 m in the Wadi Fatimah Dam between 1985 and 2008, together with a progressive reduction in reservoir capacity.
RUSLE-derived estimates represent gross hillslope soil loss rather than the sediment yield actually delivered to the reservoir; therefore, the spatial erosion pattern should be interpreted in conjunction with a spatially variable sediment delivery ratio (SDR). In the Özkonak Watershed, erosion-source areas that are more directly connected to the Asarcık Stream through short and continuous flow pathways would be expected to have a relatively greater contribution to sediment delivery toward the Bayramhacılı Dam, whereas sediment generated on less connected hillslopes may be partly retained on gentler footslopes, terraces, or valley-floor depositional zones before reaching the channel network. Thus, the RUSLE map provides the spatial distribution of sediment-source intensity, while source-to-channel connectivity, transport distance, and intermediate depositional opportunities conceptually determine the delivery component of a spatially partitioned SDR along the source–channel–reservoir pathway. Because an explicit SDR model was not implemented in the present study, future work coupling the RUSLE outputs with a spatially distributed SDR or sediment-connectivity approach would allow the actual sediment yield reaching the Bayramhacılı Dam to be quantified more directly.
From the perspective of soil and sediment remediation, the results indicate that intervention should focus primarily on source control rather than only on the removal of accumulated reservoir sediment. Afforestation, revegetation, contour tillage, terracing, vegetated buffer strips, and check dams can reduce soil detachment, interrupt sediment-transport pathways, and retain eroded material before it reaches the reservoir. These measures represent preventive and nature-based remediation practices for degraded soil and sediment systems. By decreasing the delivery of fine sediment and sediment-associated agricultural pollutants, they may also reduce the treatment burden associated with the protection and potential use of reservoir water.
Inappropriate land use plays a major role in increasing erosion intensity. Recent studies clearly demonstrate how anthropogenic pressures and land-cover changes in watersheds increase erosion susceptibility [96,97]. In the Çaybağı watershed, Mutlu and Matpay [98] identified the highest erosion susceptibility on steep, sparsely vegetated slopes and along the main drainage system, where grazing pressure and vegetation degradation were among the principal local factors intensifying erosion. In the Özkonak Watershed, overgrazing of rangelands, tillage in the direction of the slope on agricultural land without vegetation cover, and degradation of forest–shrub areas reduce soil infiltration capacity and maximize surface runoff. These anthropogenic disturbances not only cause productivity losses on land but also damage the dam reservoir [99,100].
5. Conclusions
This study, conducted in the Özkonak Watershed using the RUSLE model supported by GIS and RS techniques, presents an integrated assessment of potential soil-loss dynamics in the area and the environmental effects of these losses on the Bayramhacılı Dam reservoir. The mean annual soil loss across the 149.9 km2 watershed was determined as 2.75 t ha−1 yr−1. The fact that this mean soil-loss value is below Türkiye’s national average of 8.24 t ha−1 yr−1 [86] indicates that erosion across the watershed largely remains within tolerable limits, with 85.8% of the area in the very low- and low-risk groups.
However, while rainfall erosivity (R) and topography (LS) factors reach their maximum values in the steeply sloping Leptosol areas in the northern part of the watershed, Eutric Fluvisol (young alluvial) soils in the valleys constitute the watershed’s most sensitive units in terms of erodibility (K) because of their weak structural characteristics. In addition, the high C-factor values in dry-farming areas that occupy extensive parts of the watershed and lack protective cover allow the kinetic energy of rainfall to act directly on the soil and accelerate surface runoff.
Consequently, the urgent planning of management strategies is necessary to protect the Bayramhacılı Dam and ensure sustainability in the watershed. As stated by Ünüştü and Ülke Zengin [101], the most fundamental and permanent strategy for sediment management in dam reservoirs is the principle of “reducing sediment accumulation from the watershed at its source” through upper-watershed works. In this context, revegetation (afforestation) and terracing should be prioritized urgently in watershed areas identified by the RUSLE maps as having very high and severe erosion risk. Farmers should be encouraged to adopt conservation tillage and contour-plowing practices on agricultural land, and check dams and thresholds should be constructed along stream channels to slow material transport [39]. This set of scientific measures can succeed only when current models, including RUSLE, are continuously monitored through geographic information systems and incorporated by decision makers into an integrated watershed management plan. In addition, the raster-based RUSLE outputs generated in this study can serve as a spatial screening tool for selecting critical erosion hotspots and defining representative site conditions for subsequent high-resolution process-based investigations. In particular, high-risk hillslopes and erosion-prone zones connected to the drainage network could be prioritized for targeted coupled SPH–DEM simulations to investigate local soil–water interactions, sediment detachment, and transport processes at finer spatial scales.
Funding
This research received no external funding.
Institutional Review Board Statement
Not applicable.
Informed Consent Statement
Not applicable.
Data Availability Statement
The data presented in this study are available from the corresponding author upon reasonable request.
Conflicts of Interest
The author declares no conflicts of interest.
References
- Koch, A.; McBratney, A.; Adams, M.; Field, D.; Hill, R.; Crawford, J.; Minasny, B.; Lal, R.; Abbott, L.; O’Donnell, A.; et al. Soil security: Solving the global soil crisis. Glob. Policy 2013, 4, 434–441. [Google Scholar] [CrossRef] [Scilit]
- McBratney, A.; Field, D.J.; Koch, A. The dimensions of soil security. Geoderma 2014, 213, 203–213. [Google Scholar] [CrossRef] [Scilit]
- Morgan, R.P.C. Soil Erosion and Conservation, 3rd ed.; Blackwell Publishing: Oxford, UK, 2005. [Google Scholar]
- Montanarella, L.; Pennock, D.J.; McKenzie, N.; Badraoui, M.; Chude, V.; Baptista, I.; Mamo, T.; Yemefack, M.; Singh Aulakh, M.; Yagi, K.; et al. World’s soils are under threat. Soil 2016, 2, 79–82. [Google Scholar] [CrossRef] [Scilit]
- Julien, P. Erosion and Sedimentation, 2nd ed.; Cambridge University Press: Cambridge, UK, 2010. [Google Scholar]
- Schröter, D.; Cramer, W.; Leemans, R.; Prentice, I.C.; Araujo, M.B.; Arnell, N.W.; Bondeau, A.; Bugmann, H.; Carter, T.R.; Gracia, C.A.; et al. Ecosystem service supply and vulnerability to global change in Europe. Science 2005, 310, 1333–1337. [Google Scholar] [CrossRef] [Scilit] [PubMed]
- FAO. Status of the World’s Soil Resources (SWSR): Main Report—Global Soil Status, Processes and Trends; Food and Agriculture Organization of the United Nations: New York, NY, USA, 2015. [Google Scholar]
- Dissanayake, D.M.S.L.B.; Morimoto, T.; Ranagalage, M. Accessing the soil erosion rate based on RUSLE model for sustainable land use management: A case study of the Kotmale watershed, Sri Lanka. Model. Earth Syst. Environ. 2019, 5, 291–306. [Google Scholar] [CrossRef] [Scilit]
- Borrelli, P.; Robinson, D.A.; Panagos, P.; Lugato, E.; Yang, J.E.; Alewell, C.; Wuepper, D.; Montanarella, L.; Ballabio, C. Land use and climate change impacts on global soil erosion by water (2015–2070). Proc. Natl. Acad. Sci. USA 2020, 117, 21994–22001. [Google Scholar] [CrossRef] [Scilit] [PubMed]
- Eekhout, J.P.C.; Nunes, J.P.; Tramblay, Y.; de Vente, J. Severe Impacts on Water Resources Projected for the Mediterranean Basin. Wiley Interdiscip. Rev. Water 2025, 12, e70012. [Google Scholar] [CrossRef] [Scilit]
- Yin, C.; Bai, C.; Zhu, Y.; Shao, M.; Han, X.; Qiao, J. Future Soil Erosion Risk in China: Differences in Erosion Driven by General and Extreme Precipitation Under Climate Change. Earth’s Future 2025, 13, e2024EF005390. [Google Scholar] [CrossRef] [Scilit]
- Berhe, A.A.; Barnes, R.T.; Six, J.; Marín-Spiotta, E. Role of Soil Erosion in Biogeochemical Cycling of Essential Elements: Carbon, Nitrogen, and Phosphorus. Annu. Rev. Earth Planet. Sci. 2018, 46, 521–548. [Google Scholar] [CrossRef] [Scilit]
- Quinton, J.N.; Fiener, P. Soil Erosion on Arable Land: An Unresolved Global Environmental Threat. Prog. Phys. Geogr. 2024, 48, 136–161. [Google Scholar]
- Cowie, A.L.; Orr, B.J.; Castillo Sanchez, V.M.; Chasek, P.; Crossman, N.D.; Erlewein, A.; Louwagie, G.; Maron, M.; Metternicht, G.I.; Minelli, S.; et al. Land in balance: The scientific conceptual framework for land degradation neutrality. Environ. Sci. Policy 2018, 79, 25–35. [Google Scholar] [CrossRef] [Scilit]
- Poesen, J. Soil erosion in the Anthropocene: Research needs. Earth Surf. Process. Landf. 2018, 43, 64–84. [Google Scholar]
- Aksoy, H.; Kavvas, M.L. A Review of Hillslope and Watershed Scale Erosion and Sediment Transport Models. Catena 2005, 64, 247–271. [Google Scholar] [CrossRef] [Scilit]
- Kinnell, P.I.A. Event Soil Loss, Runoff and the Universal Soil Loss Equation Family of Models: A review. J. Hydrol. 2010, 385, 384–397. [Google Scholar] [CrossRef] [Scilit]
- Chuenchum, P.; Xu, M.; Tang, W. Estimation of Soil Erosion and Sediment Yield in the Lancang–Mekong River Using the Modified Revised Universal Soil Loss Equation and GIS Techniques. Water 2020, 12, 135. [Google Scholar] [CrossRef] [Scilit]
- Peng, Y.; Wang, G.; Li, D.; Ding, X. Micromechanical analysis of local scour around monopiles in steady flow using SPH–DEM: Effects of cross-sectional shape and orientation. Comput. Geotech. 2026, 196, 108150. [Google Scholar] [CrossRef] [Scilit]
- Renard, K.G.; Foster, G.R.; Weesies, G.A.; Porter, J.P. RUSLE: Revised universal soil loss equation. J. Soil Water Conserv. 1991, 46, 30–33. [Google Scholar] [CrossRef] [Scilit]
- Renard, K.G.; Foster, G.R.; Weesies, G.A.; McCool, D.K.; Yoder, D.C. Predicting Soil Erosion by Water: A Guide to Conservation Planning with the Revised Universal Soil Loss Equation (RUSLE) (Agriculture Handbook No. 703); U.S. Department of Agriculture: Washington, DC, USA, 1997.
- Wischmeier, W.H.; Smith, D.D. Predicting Rainfall Erosion Losses: A Guide to Conservation Planning (Agriculture Handbook No. 537); U.S. Department of Agriculture: Washington, DC, USA, 1978.
- Gitas, I.Z.; Douros, K.; Minakou, C.S.; Karydas, C.G. Multi-Temporal Soil Erosion Risk Assessment in N. Chalkidiki Using a Modified USLE Raster Model. EARSeL eProc. 2009, 8, 40–52. [Google Scholar]
- Terranova, O.; Antronico, L.; Coscarelli, R.; Iaquinta, P. Soil erosion risk scenarios in the Mediterranean environment using RUSLE and GIS: An application model for Calabria (southern Italy). Geomorphology 2009, 112, 228–245. [Google Scholar] [CrossRef] [Scilit]
- Chen, T.; Niu, R.Q.; Li, P.X.; Zhang, L.P.; Du, B. Regional soil erosion risk mapping using RUSLE, GIS, and remote sensing: A case study in Miyun Watershed, North China. Environ. Earth Sci. 2011, 63, 533–541. [Google Scholar]
- Cyr, L.; Bonn, F.; Pesant, A. Vegetation Indices Derived from Remote Sensing for an Estimation of Soil Protection Against Soil Erosion. Ecol. Model. 1995, 79, 277–285. [Google Scholar] [CrossRef] [Scilit]
- Panagos, P.; Borrelli, P.; Poesen, J.; Ballabio, C.; Lugato, E.; Meusburger, K.; Montanarella, L.; Alewell, C. The new assessment of soil loss by water erosion in Europe. Environ. Sci. Policy 2015, 54, 438–447. [Google Scholar] [CrossRef] [Scilit]
- Zare, M.; Samani, A.N.; Mohammady, M.; Salmani, H.; Bazrafshan, J. Investigating effects of land use change scenarios on soil erosion using CLUE-s and RUSLE models. Int. J. Environ. Sci. Technol. 2017, 14, 1905–1918. [Google Scholar] [CrossRef] [Scilit]
- Xiong, Y.; Wang, G.; Teng, Y.; Otsuki, K. Modeling the Impacts of Land Use Changes on Soil Erosion at the River. J. Fac. Agric. 2013, 58, 377–387. [Google Scholar] [CrossRef] [Scilit] [PubMed]
- Prostocimini, M.; Tarolli, P.; Cerda, A. Mulching practices for reducing soil water erosion: A review. Earth-Sci. Rev. 2016, 161, 191–203. [Google Scholar] [CrossRef] [Scilit]
- Brown, L.R. The Global Loss of Topsoil. J. Soil Water Conserv. 1984, 39, 162–165. [Google Scholar] [CrossRef] [Scilit]
- Bhargava, D.; Mariam, D.W. Spectral Relationships to Turbidity Generated by Different Clay Materials. Photogramm. Eng. Remote Sens. 1990, 56, 225–229. [Google Scholar]
- Han, L.; Rundquist, D.C.; Liu, L.L.; Fraser, R.N. The Spectral Responses of Algal Chlorophyll in Water with Varying Levels of Suspended Sediment. Int. J. Remote Sens. 1994, 15, 3707–3718. [Google Scholar] [CrossRef] [Scilit]
- Issaka, S.; Ashraf, M.A. Impact of Soil Erosion and Degradation on Water Quality: A Review. Geol. Ecol. Landsc. 2017, 1, 1–11. [Google Scholar] [CrossRef] [Scilit]
- Palmieri, A.; Shah, F.; Dinar, A. Economics of reservoir sedimentation and sustainable management of dams. J. Environ. Manag. 2001, 61, 149–163. [Google Scholar] [CrossRef] [Scilit] [PubMed]
- Snyder, N.P.; Rubin, D.M.; Alpers, C.N.; Childs, J.R.; Curtis, J.A.; Flint, L.E.; Wright, S.A. Estimating accumulation rates and physical properties of sediment behind a dam: Englebright Lake, Yuba River, northern California. Water Resour. Res. 2004, 40, W11301. [Google Scholar] [CrossRef] [Scilit]
- Dutta, S. Soil erosion, sediment yield and sedimentation of reservoir: A review. Model. Earth Syst. Environ. 2016, 2, 123. [Google Scholar] [CrossRef] [Scilit]
- Malavoi, B.; Abderrezzak, K.E.K. Reservoir sedimentation, dam safety and hydropower production: Hazards, risks and issues. Hydrolink 2019, 2, 50–53. [Google Scholar]
- Lazzari, M.; Gioia, D.; Piccarreta, M.; Danese, M.; Lanorte, A. Sediment yield and erosion rate estimation in the mountain catchments of the Camastra artificial reservoir (Southern Italy): A comparison between different empirical methods. Catena 2015, 127, 323–339. [Google Scholar] [CrossRef] [Scilit]
- Thiet, N.V.; Orange, D.; Laffy, D.; Cu, P.V. Consequences of Large Hydropower Dams on Erosion Budget within Hilly Agricultural Catchments in Northern Vietnam by RUSLE Modeling. In Proceedings of the International Conference Sediment Transport Modeling in Hydrological Watersheds and Rivers, İstanbul, Turkey, 14–16 November 2012; IRD: Hanoi, Vietnam, 2012; p. 8. [Google Scholar]
- Luo, Y.; Lu, M.; Wang, H.; Qiu, A. Recent soil erosion in the Hongfeng catchment on the Guizhou Plateau, SW China revealed by analysis of reservoir sediments and soil loss modeling. J. Paleolimnol. 2019, 61, 17–35. [Google Scholar] [CrossRef] [Scilit]
- Ezzaouini, M.A.; Mahé, G.; Kacimi, I.; Zerouali, A. Comparison of the MUSLE Model and Two Years of Solid Transport Measurement, in the Bouregreg Basin, and Impact on the Sedimentation in the Sidi Mohamed Ben Abdellah Reservoir, Morocco. Water 2020, 12, 1882. [Google Scholar] [CrossRef] [Scilit]
- Bhatti, M.T.; Ashraf, M.; Anwar, A.A. Soil Erosion and Sediment Load Management Strategies for Sustainable Irrigation in Arid Regions. Sustainability 2021, 13, 3547. [Google Scholar] [CrossRef] [Scilit]
- Arnoldus, H.; Jackson, M. Methodology Used to Determine the Maximum Potential Average Annual Soil Loss Due to Sheet and Rill Erosion in Morocco. FAO Soils Bull. 1977, 34, 39–51. [Google Scholar]
- Arnoldus, H.M.J. An Approximation of the Rainfall Factor in the Universal Soil Loss Equation. In Assessment of Erosion; De Boodt, M., Gabriels, D., Eds.; John Wiley & Sons: Hoboken, NJ, USA, 1980; pp. 127–132. [Google Scholar]
- Lu, H.; Yu, B. Spatial and seasonal distribution of rainfall erosivity in Australia. Aust. J. Soil Res. 2002, 40, 887–901. [Google Scholar] [CrossRef] [Scilit]
- Özsoy, G. Uzaktan Algılama (UA) ve Coğrafi Bilgi Sistemi (CBS) Teknikleri Kullanılarak Erozyon Riskinin Belirlenmesi. Ph.D. Thesis, Uludağ University, Bursa, Türkiye, 2007; p. 154. [Google Scholar]
- Bouyoucos, G.J. Hydrometer method improved for making particle size analyses of soils. Agron. J. 1962, 54, 464–465. [Google Scholar] [CrossRef] [Scilit]
- Nelson, D.W.; Sommers, L.E. Total carbon, organic carbon, and organic matter. In Methods of Soil Analysis, Part 3: Chemical Methods; Sparks, D.L., Page, A.L., Helmke, P.A., Loeppert, R.H., Soltanpour, P.N., Tabatabai, M.A., Johnston, C.T., Sumner, M.E., Eds.; Soil Science Society of America: Madison, WI, USA, 1996; pp. 961–1010. [Google Scholar]
- Blake, G.R.; Hartge, K.H. Bulk density. In Methods of Soil Analysis, Part 1: Physical and Mineralogical Methods; Klute, A., Ed.; American Society of Agronomy and Soil Science Society of America: Madison, WI, USA, 1986; pp. 363–375. [Google Scholar]
- Değerliyurt, M. Antakya şehri ve yakın çevresinde meydana gelen erozyonun coğrafi dağılışı ve analizi. Turk. Stud.—Int. Period. Lang. Lit. Hist. Turk. Turk. 2013, 8, 1745–1764. [Google Scholar] [CrossRef] [Scilit]
- Mitasova, H.; Hofierka, J.; Zlocha, M.; Iverson, L.R. Modelling topographic potential for erosion and deposition using GIS. Int. J. Geogr. Inf. Syst. 1996, 10, 629–641. [Google Scholar] [CrossRef] [Scilit]
- İmamoğlu, A.; Dengiz, O. Determination of Soil Erosion Risk Using RUSLE Model and Soil Organic Carbon Loss in Alaca Catchment (Central Black Sea Region, Turkey). Rend. Lincei 2017, 28, 11–23. [Google Scholar] [CrossRef] [Scilit]
- Durak, M.; Cürebal, İ. RUSLE (3D) Modeli Kullanılarak Toprak Erozyonu Tahmini; Atikhisar Barajı Havzası Örneği (Çanakkale). MEMBA Su Bilim. Derg. 2025, 11, 138–151. [Google Scholar] [CrossRef] [Scilit]
- Ünver, A.; Karakoca, E. RUSLE Yöntemi Kullanılarak Porsuk Çayı Havzası’nda Erozyon Duyarlılığının ve Toprak Kayıplarının Belirlenmesi. Türk Uzak. Algılama CBS Derg. 2025, 6, 230–251. [Google Scholar] [CrossRef] [Scilit]
- Doğan, O.; Güçer, C. Su Erozyonunun Nedenleri, Oluşumu ve Üniversal Denklem ile Toprak Kayıplarının Saptanması; Publication No. 41; T.C. Köy İşleri Bakanlığı Topraksu Genel Müdürlüğü, Topraksu Araştırma Enstitüsü Müdürlüğü: Ankara, Turkey, 1976; p. 159.
- İrvem, A.; Tülücü, K. Coğrafi Bilgi Sistemi ile Toprak Kaybı ve Sediment Verimi Tahmin Modelinin (EST) Oluşturulması ve Seyhan–Körkün Alt Havzasına Uygulanması. Çukurova Üniv. Fen Bilim. Enst. Derg. 2004, 13. [Google Scholar]
- Pantazis, C.; Nastos, P.T. Land Degradation Assessment in an Olive Orchard Using Different Soil Erosion Estimation Methods. Land 2026, 15, 794. [Google Scholar] [CrossRef] [Scilit]
- Subbarayan, S.; Sankriti, R. Mapping of Spatially Distributed Soil Erosion over the Tungabhadra River Sub-Basin (TRB) Using Satellite-Based Precipitation Products (SPPs) and RUSLE Modelling. Hydrology 2026, 13, 148. [Google Scholar] [CrossRef] [Scilit]
- Tağıl, Ş. Tuzla Çayı Havzası’nda (Biga Yarımadası) CBS-tabanlı RUSLE modeli kullanarak arazi degradasyonu risk değerlendirmesi. Ekoloji 2007, 17, 11–20. [Google Scholar]
- Torres-Cadena, J.; Escalante-Sandoval, C. A National-Scale Method for Estimating the Rainfall Erosivity Factor (R) from Daily Rainfall Totals in Mexico. Sustainability 2026, 18, 4577. [Google Scholar] [CrossRef] [Scilit]
- Renard, K.G.; Freimund, J.R. Using monthly precipitation data to estimate the R-factor in the revised USLE. J. Hydrol. 1994, 157, 287–306. [Google Scholar] [CrossRef] [Scilit]
- Doğan, O. Türkiye Yağışlarının Erosiv Potansiyelleri; T.C. Tarım Orman ve Köyişleri Bakanlığı, Köy Hizmetleri Genel Müdürlüğü: Ankara, Turkey, 1987.
- Doğan, O. Türkiye Yağışlarının Erozyon Oluşturma Gücü ve Üniversal Toprak Kaybı Eşitliğinin Yağış Erozyon İndeks Değerleri (Genel Yayın No. 220, Rapor Yayın No. R-120); Köy Hizmetleri Genel Müdürlüğü Ankara Araştırma Enstitüsü Müdürlüğü: Ankara, Turkey, 2002.
- İrvem, A.; Topaloğlu, F.; Uygur, V. Estimating spatial distribution of soil loss over Seyhan River Basin in Turkey. J. Hydrol. 2007, 336, 30–37. [Google Scholar] [CrossRef] [Scilit]
- Ardel, A.; Kurter, A.; Dönmez, Y. Klimatoloji Tatbikatı; Publication No.1123; İstanbul Üniversitesi Edebiyat Fakültesi Coğrafya Enstitüsü: Istanbul, Turkey, 1969. [Google Scholar]
- Dönmez, Y. Umumi Klimatoloji ve İklim Çalışmaları; Publication No. 102; İstanbul Üniversitesi Edebiyat Fakültesi Yayınları, No. 2506; Coğrafya Enstitüsü; Güray Matbaacılık: İstanbul, Turkey, 1979. [Google Scholar]
- Toy, T.J.; Foster, G.R. Introduction. In Guidelines for the Revised Universal Soil Loss Equation (RUSLE), Version 1.06, on Mined Lands, Construction Sites, and Reclaimed Lands; Galetevic, J.R., Ed.; Publication No. 102; USDA ARS: Washington, DC, USA, 1998. [Google Scholar][Green Version]
- Wischmeier, W.H.; Johnson, C.B.; Cross, B.V. A soil erodibility nomograph for farmland and construction sites. J. Soil Water Conserv. 1971, 26, 189–193. [Google Scholar]
- Thapa, P. Spatial estimation of soil erosion using RUSLE modeling: A case study of Dolakha district, Nepal. Environ. Syst. Res. 2020, 9, 15. [Google Scholar] [CrossRef] [Scilit]
- Başkan, O.; Dengiz, O. Comparison of Traditional and Geostatistical Methods to Estimate Soil Erodibility Factor. Arid. Land Res. Manag. 2008, 22, 29–45. [Google Scholar] [CrossRef] [Scilit]
- Haynes, R.J.; Naidu, R. Influence of lime, fertilizer and manure applications on soil organic matter content and soil physical conditions: A review. Nutr. Cycl. Agroecosyst. 1998, 51, 123–137. [Google Scholar] [CrossRef] [Scilit]
- Moore, I.D.; Burch, G.J. Physical basis of the length-slope factor in the Universal Soil Loss Equation. Soil Sci. Soc. Am. J. 1986, 50, 1294–1298. [Google Scholar] [CrossRef] [Scilit]
- Lu, D.; Li, G.; Valladares, G.; Batistella, M. Mapping soil erosion risk in Rondonia, Brazilian Amazonia: Using RUSLE, remote sensing and GIS. Land Degrad. Dev. 2004, 15, 499–512. [Google Scholar] [CrossRef] [Scilit]
- Mutlu, Y.E.; Soykan, A. RUSLE (3d) modeli kullanılarak toprak erozyonu tahmini: Havran Çayı örneği. Jeomorfol. Araştırmalar Derg. 2018, 1, 50–66. [Google Scholar]
- Cürebal, İ.; Ekinci, D. Kızılkeçili Deresi Havzasında CBS tabanlı RUSLE (3d) yöntemiyle erozyon analizi. Türk Coğraf. Derg. 2006, 47, 115–130. [Google Scholar]
- Desmet, P.J.J.; Govers, G. A GIS procedure for automatically calculating the USLE LS factor on topographically complex landscape units. J. Soil Water Conserv. 1996, 51, 427–433. [Google Scholar] [CrossRef] [Scilit]
- Hickey, R. Slope angle and slope length solutions for GIS. Cartography 2000, 29, 1–8. [Google Scholar] [CrossRef] [Scilit]
- Blanco-Canqui, H.; Lal, R. Principles of Soil Conservation and Management; Springer: Berlin/Heidelberg, Germany, 2008. [Google Scholar]
- Panagos, P.; Borrelli, P.; Meusburger, K.; Alewell, C.; Lugato, E.; Montanarella, L. Estimating the soil erosion cover-management factor at the European scale. Land Use Policy 2015, 48, 38–50. [Google Scholar] [CrossRef] [Scilit]
- Van der Knijff, J.M.; Jones, R.J.A.; Montanarella, L. Soil Erosion Risk Assessment in Europe (EUR 19044 EN); Office for Official Publications of the European Communities: Brussels, Belgium, 2000. [Google Scholar]
- Allataifeh, N.; Rudra, R.; Daggupati, P.; Goel, P.; Prasher, S.; Shukla, R. Spatiotemporal Variability in the C-Factor: Validation and Comparative Evaluation of NDVI and RUSLE2 C-Factor Estimation Approaches. Hydrology 2026, 13, 125. [Google Scholar] [CrossRef] [Scilit]
- Biddoccu, M.; Ferraris, S.; Opsi, F.; Cavallo, E. Long-term monitoring of soil management effects on runoff and soil erosion in sloping vineyards in Alto Monferrato (North–West Italy). Soil Tillage Res. 2016, 155, 176–189. [Google Scholar] [CrossRef] [Scilit]
- Durigon, V.L.; Carvalho, D.F.; Antunes, M.A.H.; Oliveira, P.T.S.; Fernandes, M.M. NDVI time series for monitoring RUSLE cover management factor in a tropical watershed. Int. J. Remote Sens. 2014, 35, 441–453. [Google Scholar] [CrossRef] [Scilit]
- Schmidt, S.; Alewell, C.; Meusburger, K. Mapping spatio-temporal dynamics of the cover and management factor (C-factor) for grasslands in Switzerland. Remote Sens. Environ. 2018, 211, 89–104. [Google Scholar] [CrossRef] [Scilit]
- Erpul, G.; Şahin, S.; İnce, K.; Küçümen, A.; Akdağ, M.A.; Demirtaş, İ.; Çetin, E. Türkiye Su Erozyonu Atlası; Çölleşme ve Erozyonla Mücadele Genel Müdürlüğü Yayınları: Ankara, Turkey, 2018.
- Atalay Dutucu, A.; Mutlu, Y.E. Yuvacık Barajı Havzası’nda Erozyon Risk Analizi. Ege Coğraf. Derg. 2022, 31, 289–303. [Google Scholar] [CrossRef] [Scilit]
- Özşahin, E. An Example for Determining River Sedimentation Amount Based on Different Erosion Prediction Models: The Naip Dam Basin (Tekirdağ, Türkiye). J. Geomorphol. Res. 2023, 10, 1–19. [Google Scholar]
- Aykır, D.; Durak, M.; Cürebal, İ. RUSLE (3D) Modeli Kullanılarak Toprak Erozyonu Tahmini: Güzelhisar Barajı Havzası Örneği (İzmir–Manisa). Jeomorfol. Araştırmalar Derg. 2026, 16, 43–63. [Google Scholar] [CrossRef] [Scilit]
- Hachemi, S.M.; Megnounif, A.; Bessedik, M.; Kumar, N. Spatio-Temporal Analysis of Water Erosion in the Tafna Watershed (Algeria) Using the RUSLE Model and Bias-Corrected Rainfall Data (1983–2023). Land 2026, 15, 217. [Google Scholar] [CrossRef] [Scilit]
- Borrelli, P.; Alewell, C.; Alvarez, P.; Anache, J.A.A.; Baartman, J.; Ballabio, C.; Bezak, N.; Biddoccu, M.; Cerdà, A.; Chalise, D.; et al. Soil Erosion Modelling: A Global Review and Statistical Analysis. Sci. Total Environ. 2021, 780, 146494. [Google Scholar] [CrossRef] [Scilit] [PubMed]
- Miranda, M.N.; Rosa, C.; Peres, A.; Maia, R. Sedimentation assessment and effects in Venda Nova dam reservoir (Portugal). Sci. Total Environ. 2021, 766, 144261. [Google Scholar] [CrossRef] [Scilit] [PubMed]
- Pınar, M.Ö.; Şahin, S.; Madenoğlu, S.; Erpul, G. Derinöz Baraj Havzasında Şiddetli Erozyon Alanlarının Belirlenmesi ve Rezervuar Sediment Yükünün Hesaplanması. Su Kaynakları 2020, 5, 24–33. [Google Scholar]
- Fıçıcı, M.; Soykan, A. MPSIAC & RUSLE yöntemleriyle karşılaştırmalı erozyon analizi: Madra Barajı Havzası. Jeomorfol. Araştırmalar Derg. 2022, 8, 28–47. [Google Scholar] [CrossRef] [Scilit]
- Arebu, B.A.; Alamri, N.; Elfeki, A. Hydrological Modeling of Reservoir Sedimentation and Evolution of Elevation–Capacity Curve of the Dam Reservoir. Hydrology 2026, 13, 93. [Google Scholar] [CrossRef] [Scilit]
- Özşahin, E. Spatiotemporal Changes of Soil Erosion Rate in the Pre- and Post-Dam Construction Periods (1990–2018) Determined through RUSLE and GIS: The Case of the Kavak River Basin, East Thrace, Türkiye. Environ. Dev. Sustain. 2024, 28, 9909–9933. [Google Scholar] [CrossRef] [Scilit]
- Uzun, S.M. Antropojenik baskı yoğunluğu ile erozyon duyarlılığı ilişkisinin alt havza kapsamında analizi: Uluabat Gölü Havzası örneği. J. Anatol. Geogr. 2025, 2, 48–62. [Google Scholar]
- Mutlu, S.; Matpay, B. Çaybağı (Kotur) Havzası’nda (Saray-Van) Erozyona Duyarlı Alanların Belirlenmesi. MTA Yerbilim. Madencilik Derg. 2026, 9, 54–74. [Google Scholar]
- Danacıoğlu, Ş.; Tağıl, Ş. Bakırçay Havzası’nda RUSLE modeli kullanarak erozyon riskinin değerlendirmesi. Balıkesir Üniv. Sos. Bilim. Enst. Derg. 2017, 20, 1–18. [Google Scholar] [CrossRef] [Scilit]
- Mutlu, Y.E.; Soykan, A.; Fıçıcı, M. Kille Çayı Havzası’nda (Balıkesir) Erozyon Risk Analizi. Jeomorfol. Araştırmalar Derg. 2021, 6, 98–111. [Google Scholar] [CrossRef] [Scilit]
- Ünüştü, A.; Ülke Zengin, A. Baraj Rezervuarlarında Sedimantasyon ile Mücadele Yöntemleri. Sürdürülebilir Mühendis. Uygulamaları Teknol. Gelişmeler Derg. 2024, 7, 47–59. [Google Scholar] [CrossRef] [Scilit]



Disclaimer/Publisher’s Note: The statements, opinions and data contained in all publications are solely those of the individual author(s) and contributor(s) and not of MDPI and/or the editor(s). MDPI and/or the editor(s) disclaim responsibility for any injury to people or property resulting from any ideas, methods, instructions or products referred to in the content. |
© 2026 by the author. Licensee MDPI, Basel, Switzerland. This article is an open access article distributed under the terms and conditions of the Creative Commons Attribution (CC BY) license.