Article

Wastewater Treatment with Constructed Wetlands and Banana Fibre Filtration

by
J. Chrisostome Ufitinema
1,2,*,
Valens Habimana
1,2,
Antoine Nsabimana
1 and
Gunaratna Kuttuva Rajarao
2
1
School of Science, College of Science and Technology, University of Rwanda, Kigali 3900, Rwanda
2
Department of Industrial Biotechnology, School of Engineering Sciences in Chemistry, Biotechnology and Health, KTH Royal Institute of Technology, SE-100 44 Stockholm, Sweden
*
Author to whom correspondence should be addressed.
Environments 2026, 13(7), 406; https://doi.org/10.3390/environments13070406
Submission received: 21 June 2026 / Revised: 16 July 2026 / Accepted: 16 July 2026 / Published: 19 July 2026

Abstract

Increasing water scarcity and pollution have intensified the need for low-cost wastewater treatment in developing regions. Constructed wetlands (CWs) offer a nature-based solution for pollutant removal but often fail, on their own, to meet discharge and reuse standards. This study evaluated four CW systems planted with Cyperus latifolius, Juncus effusus, Phragmites mauritianus, and Pennisetum purpureum, integrated with banana fibre filtration as a polishing step. The CWs alone achieved ammonium removal of 74–83%, nitrate 78–85%, phosphorus 86–91%, and COD 78–83%. Banana fibre filtration enhanced overall removal efficiencies to 93–96%, 94–96%, 81–88%, and 82–87% for ammonium, phosphorus, nitrate, and COD, respectively. Pennisetum purpureum had the highest aboveground nitrogen accumulation (74.4 g N/m2), with its coupled system achieving the highest nitrate removal, whereas Juncus effusus had the highest phosphorus accumulation (93.1 g P/m2), with its coupled system showing the best overall removal of ammonium, phosphorus, and COD. The integrated system reduced fecal coliforms and Escherichia coli by 6–8 log and eliminated detectable Salmonella and Shigella. Treated effluent met FAO irrigation, Rwanda discharge, and European Union (EU) standards for all evaluated parameters except phosphorus, which remained above the stricter EU limit. Despite bench-scale operation over four months, these findings demonstrate a low-cost, nature-based treatment approach suitable for decentralized wastewater treatment and reuse, with harvested wetland biomass offering additional potential for animal feed, energy, or fibre valorization.

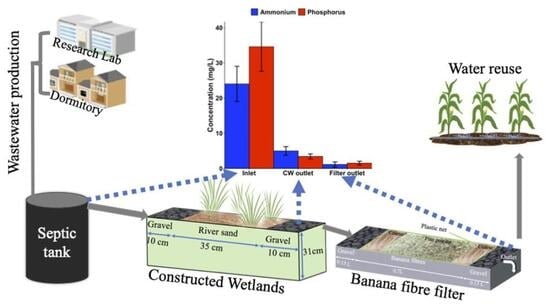
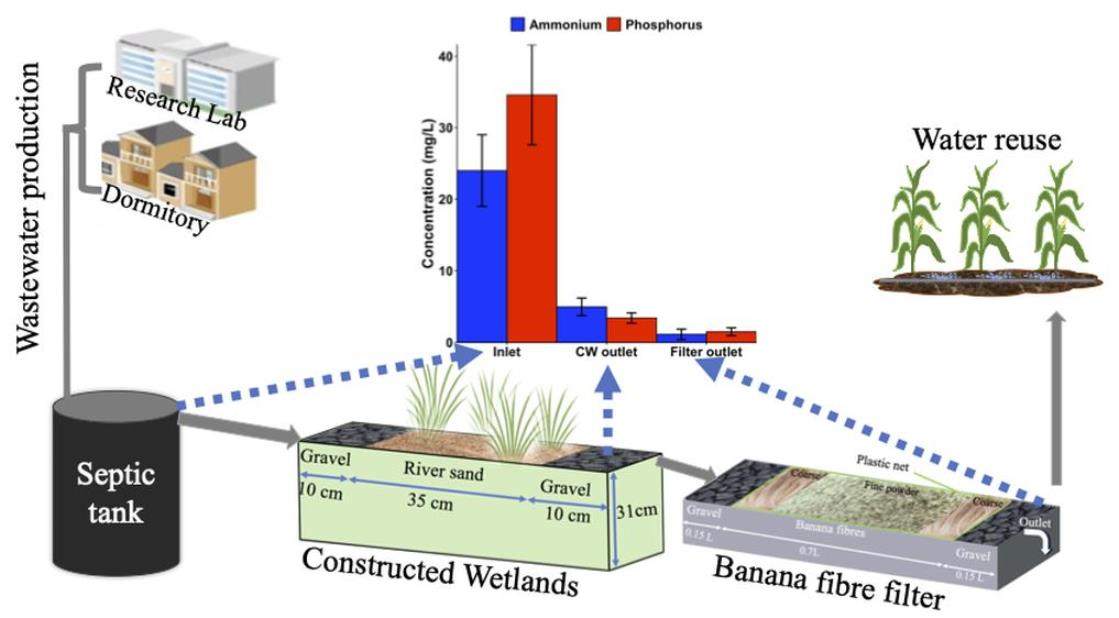
Graphical Abstract

1. Introduction

Access to clean water remains a critical challenge across Sub-Saharan Africa, where rapid urbanization, population growth, and climate variability are intensifying pressure on freshwater resources. Inadequate wastewater treatment infrastructure has led to widespread discharge of untreated effluents into natural water bodies, driving eutrophication, biodiversity loss, and outbreaks of waterborne disease [1]. Effective wastewater treatment is therefore central to sustainable water management, enabling water recycling, resource recovery, and protection of aquatic ecosystems. Within integrated water resources management frameworks, treated wastewater constitutes a reliable alternative source for non-potable applications, including irrigation, landscaping, and industrial processes, reducing dependence on freshwater and strengthening water security [2].
In Rwanda, increasing domestic, agricultural, and institutional water demand is placing growing strain on available water resources. Agriculture is predominantly rainfed and highly sensitive to climate variability, with projected warming of 1.4–2.3 °C by 2050, erratic rainfall, and prolonged dry spells, particularly in the Eastern Province, threatening both food security and water availability [3]. Although Rwanda holds an estimated irrigation potential of 600,000 ha, only approximately 3% has been developed, and many existing schemes operate below capacity. Wastewater reuse remains limited, constrained by the absence of a centralized sewerage network, the poor performance of many decentralized treatment facilities, the lack of dedicated reuse policies, and prevailing perceptions of water abundance [3]. As a result, untreated or partially treated wastewater is often discharged into receiving water bodies, causing nutrient pollution, public health risks, and foregone opportunities for water reuse [4].
Overcoming these constraints could unlock substantial benefits. Treated wastewater could supply a dry-season irrigation source largely independent of erratic rainfall, supporting crop production in areas where freshwater allocation is already limited. Non-potable reuse in landscaping, livestock watering, and institutional settings could further offset freshwater demand in urban and peri-urban areas, while reducing the volume of untreated effluent discharged into surface waters. Realizing these benefits depends on treatment systems that are affordable to build and operate within a largely decentralized setting, and that reliably meet the water quality thresholds required for safe agricultural and non-potable use. These conditions highlight the urgent need for affordable, low-maintenance decentralized treatment technologies suited to resource-limited settings.
Constructed wetlands (CWs) are nature-based treatment systems that remove contaminants through the combined physical, chemical, and biological processes associated with vegetation, porous media, and microbial biofilms [5]. In horizontal subsurface flow (HSSF) CWs, wastewater percolates through saturated media under anaerobic and anoxic conditions, where treatment performance depends on biofilm activity, rhizosphere dynamics, and substrate properties. Media selection, including materials such as gravel and sand, influences hydraulic conductivity, clogging susceptibility, microbial colonization, and the retention of nutrients and suspended solids [6]. The incorporation of wetland plant species further enhances treatment through oxygen transfer to the root zone, support of biofilm communities, nutrient uptake, and physical stabilization of the media [7]. These treatment systems are widely recognized for their low energy demand, minimal operational costs, and capacity to remove organic matter, suspended solids, and nutrients. However, their effluents frequently require additional treatment to meet stringent standards for discharge or non-potable reuse [8].
Tertiary filtration using agricultural by-products offers a promising and sustainable complement to CW treatment. Banana production generates substantial quantities of underutilized biomass residues globally [9], and Rwanda, with annual banana production of 2–2.5 million tonnes, has a ready supply of such material [10].
Banana fibres are characterized by high porosity and lignocellulosic composition, properties that support the adsorption and filtration of nutrients and pathogens, including ammonium and phosphorus [11]. Their integration as a low-cost polishing filter could enhance effluent quality to levels suitable for safe agricultural reuse, while simultaneously valorizing an agricultural waste stream, an approach consistent with circular economy principles and sustainable resource management.
Despite growing interest in nature-based and low-cost treatment systems, limited research has examined the performance of integrated systems combining CWs and agro-based filtration materials under sub-Saharan African conditions, and no studies have evaluated such systems in the Rwandan context. This gap is particularly significant because CW-only systems, as noted above, often fall short of discharge and reuse standards, while Rwanda’s abundant banana residue represents an underutilized, locally available resource with considerable potential as a low-cost polishing filtration medium.
This study addresses that gap by evaluating a hybrid treatment system consisting of HSSF CWs followed by banana fibre filtration for wastewater reclamation at the University of Rwanda, College of Science and Technology. Specific objectives were to: (i) assess the removal of nutrients, organic matter, and microbial indicators across the treatment systems; (ii) compare the performance of CW units filled with river sand and volcanic gravel and planted with Cyperus latifolius, Juncus effusus, Phragmites mauritianus, and Pennisetum purpureum; (iii) evaluate the contribution of banana fibre filtration as a polishing step; (iv) examine potential uses of harvested plant biomass; and (v) compare final effluent quality against national and international standards for discharge and non-potable reuse, including agricultural irrigation.
Scientifically, this study provides comparative evidence on how plant species and substrate selection govern nutrient, organic matter, and pathogen removal in HSSF CWs, and provides insight into the likely adsorption mechanisms of banana fibre as a polishing material. Practically, it delivers a low-cost, locally sourced treatment configuration that can improve effluent quality to levels suitable for safe irrigation and non-potable reuse in decentralized settings across Rwanda and comparable sub-Saharan African contexts, while identifying viable pathways for reusing the harvested plant biomass.

2. Materials and Methods

2.1. Wastewater Characteristics

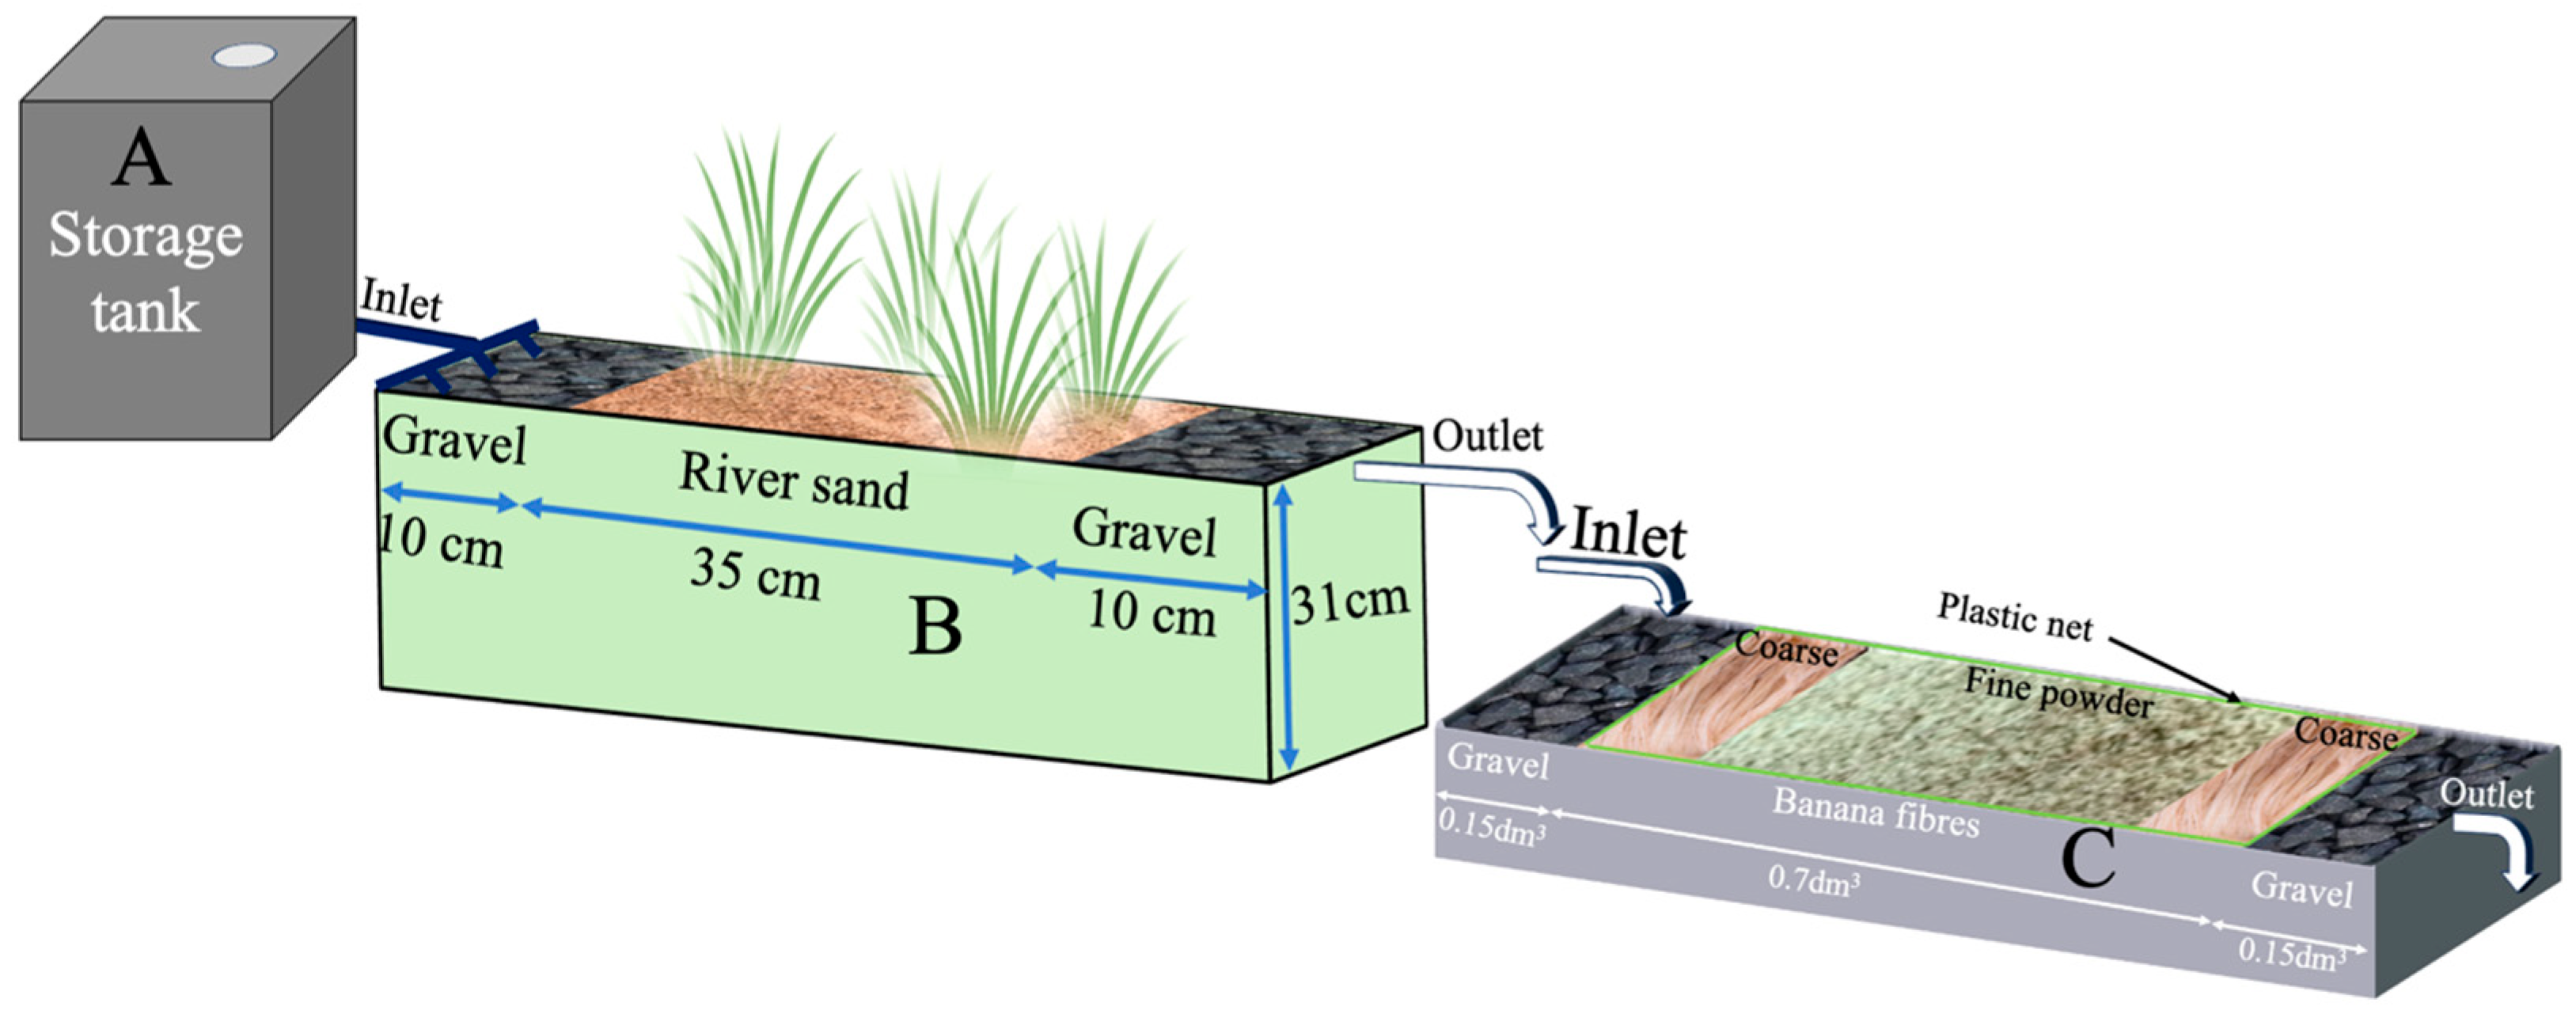
Wastewater was collected from a septic tank serving a student dormitory and research laboratory at the University of Rwanda, College of Science and Technology, Kigali, Rwanda. The influent was transferred to a 1 m3 storage tank, which served as a storage reservoir for controlled and uniform distribution of wastewater to all constructed wetland units throughout the experiment (Figure 1A). Its physicochemical and biological characteristics are presented in Table 1.

2.2. Characterization of Substrate and Filter Media

2.2.1. Wetland Substrate

River sand and volcanic gravel were used as substrates based on their suitability for subsurface flow constructed wetlands, including high permeability, hydraulic conductivity, porosity, clogging resistance, nutrient adsorption capacity, plant support, and local availability [12]. Both materials were collected in Musanze District, Rwanda, with sand sourced from the Mukungwa River. Their chemical composition was determined by X-ray fluorescence (XRF) spectroscopy using a Bruker S2 PUMA instrument (Bruker, Billerica, MA, USA). Samples were air-dried, homogenized, ground, and analyzed in duplicate. Elemental data were acquired in air mode and processed using SPECTRA.ELEMENTS software (version 3).

2.2.2. Banana Fibres

Fibres were extracted from pseudo stems of banana plantation (Musa acuminata), grown in Ngoma district, Rwanda, and prepared following the protocol reported by [11]. Surface functional groups were characterized by Fourier Transform Infrared (FTIR) spectroscopy using an Alpha II spectrometer equipped with an ATR module (Bruker Optik GmbH, Ettlingen, Germany) following procedures established by [13]. Finely ground samples were analyzed in duplicate over a wavenumber range of 4000 to 400 cm−1 at a resolution of 4 cm−1 and 64 scans per run, with spectra averaged after background correction.
The crystalline structure of the fibres was determined by X-ray diffraction (XRD) using a D2 PHASER diffractometer (Bruker AXS GmbH, Karlsruhe, Germany) with Cu Kα radiation (λ = 1.54184 Å) and a LynxEye detector (Bruker AXS GmbH, Karlsruhe, Germany), following [14]. Measurements were conducted at 30 kV and 10 mA over a 2θ range of 5° to 40° with a step size of 0.02°. Diffraction patterns were analyzed using DIFFRAC.EVA software version 4x and identified using the Crystallography Open Database.
Elemental composition was determined by X-ray fluorescence (XRF) using an S2 PUMA spectrometer (Bruker, Billerica, MA, USA) operated at 40 kV [15]. Approximately 0.2 g of powdered sample was analyzed, and instrument calibration was verified using certified NIST reference materials.

2.3. Wetland Vegetation

Four macrophyte species, Cyperus latifolius, Juncus effusus, Phragmites mauritianus, and Pennisetum purpureum, were collected from the Mukungwa wetland in Musanze District, Rwanda, based on their reported performance in constructed wetlands, local availability, ecological adaptability, and socio-economic relevance.
Potential uses of harvested biomass were assessed through a literature review and field surveys. The review examined documented applications of wetland macrophytes for animal feed, bioenergy, and organic fertilizer production using peer-reviewed articles, technical reports, and regional studies. Semi-structured interviews with wetland users and craft producers in Rutsiro, Rubavu, and Huye districts were conducted to identify artisanal uses. Responses were analyzed thematically and compared with findings from the literature.

2.4. Experimental Design

2.4.1. Constructed Wetlands

Ten bench-scale horizontal subsurface flow constructed wetland (CW) units (55 × 40 × 31 cm) were established using plastic containers. This configuration was selected for its continuously saturated bed, which promotes denitrification, enables simple gravity-driven operation, and reduces clogging risk. The dimensions were selected to provide sufficient hydraulic retention time while enabling replicated laboratory-scale evaluation of plant species and substrate combinations under available space and resource conditions prior to scale-up. Each unit was filled to a depth of 29 cm with river sand in the central section (35 cm) and crushed volcanic gravel at both inlet and outlet zones (10 cm each) (Figure 1B). Units were arranged in pairs and planted with Cyperus latifolius (CW_CL1, CW_CL2), Juncus effusus (CW_JE1, CW_JE2), Phragmites mauritianus (CW_PM1, CW_PM2), or Pennisetum purpureum (CW_PP1, CW_PP2). Two unplanted units served as controls (CWC1 and CWC2). Each treatment, therefore, consisted of two independent wetland units that were operated in parallel and considered biological replicates throughout the experiment.
Following a two-month adaptation period with 20 L of tap water per week, the systems operated for four months under continuous loading with septic tank effluent stored in a 1 m3 tank. Wastewater was distributed through flexible pipes, and each unit was installed at a 1% slope to maintain gravity-driven flow and facilitate effluent collection.
Substrate void volume was determined separately for sand and gravel using water displacement. The measured porosity was 0.43 for river sand and 0.56 for volcanic gravel, giving an effective pore volume of approximately 20 L per wetland unit. Based on this void volume and a target hydraulic retention time of four days reported by Ufitinema et al. [16], the flow rate was initially set at 5 L day−1 and subsequently adjusted to 6.5 L day−1 to compensate for evapotranspiration losses determined from outlet flow measurements. Influent flow was supplied continuously throughout the experimental period, and the adjusted loading rate was maintained to preserve the target HRT. The hydraulic loading rate (HLR) was 30 mm/day with corresponding mass loading rates (MLR) of 18.2 ± 0.7 g/m2/day for COD, 0.7 ± 0.2 g/m2/day for ammonium, 0.4 ± 0.1 g/m2/day for nitrate, and 1.02 ± 0.2 g/m2/day for phosphorus.

2.4.2. Advanced Treatment with Banana Fibre Filter

To improve effluent quality for water reuse, particularly for irrigation, a horizontal flow, gravity-driven banana fibre filter was installed downstream of the CW units (Figure 1C). Banana fibres were selected as a polishing material due to their adsorption potential for ammonium and phosphate removal, with their adsorption characteristics and removal capacity evaluated in detail in our previous study [11]. In the present study, banana fibres were applied as a post-treatment filter following CW treatment, and their performance was assessed based on additional pollutant removal and operational stability during continuous operation.
The filter consisted of a 2 L plastic container containing a removable fibre pack enclosed in plastic mesh. The fibre pack comprised a powdered banana fibre core surrounded by coarsely crushed fibres to enhance adsorption while maintaining permeability and reducing clogging. Crushed volcanic gravel was placed at the inlet and outlet to improve hydraulic distribution and structural stability.
To optimize the filter, three fibre-to-gravel volume ratios (7:3, 5:5, and 3:7) were evaluated. Void volumes were estimated using porosity values of 0.77 for banana fibres [11] and 0.56 for volcanic gravel [16]. At a flow rate of 6.5 L day−1, the HRT was approximately 5 h. The configurations were operated for one week using influent containing 6.8 ± 1.4 mg L−1 ammonium and 5.1 ± 1.1 mg L−1 phosphorus. The 7:3 fibre-to-gravel ratio achieved the highest treatment efficiency and was therefore selected for integration with the planted CW units during the final two months of operation.

2.5. Analytical Methods

2.5.1. Physico-Chemical Analysis

Wastewater samples were collected every four days, corresponding to the HRT, over four months from the common influent and the effluent of each CW unit (Figure 1A,B). For the banana fibre filter, samples were collected every four days during the final two months from both the filter influent (CW effluent) and filter effluent (Figure 1C).
Samples were collected in pre-cleaned polyethylene bottles, transported under cooled conditions, and stored at 4 °C until analysis. Physicochemical parameters were analyzed within 24 to 48 h. pH, temperature, and total dissolved solids (TDS) were measured in situ using a calibrated HQ440D multiparameter meter (Hach, Loveland, CO, USA). Chemical oxygen demand (COD), ammonium, nitrate, phosphorus, total nitrogen (TN), and total phosphorus (TP) were analyzed according to [17].

2.5.2. Microbiological Analysis

Microbial removal efficiency was assessed using samples collected from influent and effluent points of each treatment stage twice monthly during the final two months of operation. Target organisms included fecal coliforms (FC), E. coli, Salmonella spp., and Shigella spp.
Samples were collected in sterile polyethylene bottles and processed immediately under aseptic conditions. Serial dilutions were prepared in sterile peptone water up to 10−6. From each dilution, including the undiluted sample (100), 0.1 mL aliquots were plated in duplicate using the spread plate method. Selective media included lactose agar for fecal coliforms, Tryptone Bile X-glucuronide (TBX) agar for E. coli, and Salmonella-Shigella agar (SSA) for Salmonella spp. and Shigella spp. Plates were incubated at 44 °C for 24 to 48 h for faecal coliforms and E. coli, and at 37 °C for 24 to 48 h for SSA. Colonies were counted and expressed as CFU per 100 mL and used to determine removal efficiency. All media were prepared from dehydrated formulations (Accumix®, Microxpress®, Tulip Diagnostics Pvt. Ltd., Verna, Goa, India) according to the manufacturer’s instructions.

2.5.3. Plant Biomass and Nutrient Uptake

Plant biomass and nutrient uptake were quantified using a standardized protocol [18]. At the end of the experiment, two representative plants were harvested from each CW unit. Plants were separated into aboveground and belowground parts, rinsed to remove attached particles, and cut into small segments. Fresh biomass was recorded after wrapping samples in aluminum foil. Samples were then oven-dried at 70 °C for 24 h to a constant weight, and dry biomass was measured.
Dried samples were ground into a fine powder for nutrient analysis. Subsamples of 0.5 g were digested for chemical analysis. Total nitrogen (TN) was determined using the Kjeldahl method, and total phosphorus (TP) was measured after acid digestion. Concentrations were analyzed using a UV-visible spectrophotometer. Biomass production and nutrient accumulation was calculated following [18].

2.6. Statistical Data Analysis

All statistical analyses and data visualization were performed in the RStudio environment using R software (version 4.4.3). Prior to analysis, the dataset was reorganized into long format, and descriptive statistics were calculated for each treatment and water quality parameter. Temporal changes in pollutant removal were evaluated using linear mixed-effects models, with treatment, operational time (day), and their interaction included as fixed effects, while sampling day was treated as a random effect to account for repeated observations. Estimated marginal means were calculated, and pairwise comparisons among treatments were performed using Tukey’s honestly significant difference (HSD) adjustment for multiple testing. Effect sizes were estimated using partial eta-squared (η2). Linear regression analyses were conducted separately for each treatment to quantify temporal trends in removal efficiency, and the coefficient of determination (R2), together with regression slope significance, was reported. As a non-parametric sensitivity analysis, Kruskal–Wallis tests followed by Dunn’s multiple comparison tests with Benjamini–Hochberg correction were performed to evaluate treatment differences. Relationships among treatment performances were further explored using Spearman rank correlation analysis, while principal component analysis (PCA) was applied to investigate multivariate relationships among the measured water quality parameters. Statistical significance was considered at p < 0.05.

3. Results and Discussion

3.1. Characteristics of Substrates and Filter Media

3.1.1. Sand and Volcanic Gravel Used in Constructed Wetlands

Table 2 presents the XRF composition of volcanic gravel and river sand used in the constructed wetland experiment. River sand is dominated by SiO2 (77.51%), with lower Al2O3 (8.92%), Fe2O3 (2.19%), and CaO (2.87%). Volcanic gravel shows lower SiO2 (54.19%) but higher Al2O3 (18.68%), Fe2O3 (9.49%), CaO (7.12%), and TiO2 (2.20%). Trace oxides such as SrO, BaO, ZrO2, Nb2O5, ZnO, Ta2O5, and Bi2O3 appear mainly in volcanic gravel.
These differences influence treatment performance. Volcanic gravel provides reactive mineral phases from aluminum, iron, and calcium oxides, supporting nutrient adsorption and precipitation. Its coarse structure increases hydraulic conductivity and maintains flow and contact with reactive surfaces. River sand has lower chemical reactivity but a finer texture, increasing surface area for suspended solids capture and improving physical filtration. It also supports biofilm development and plant root establishment for species such as Phragmites mauritianus and Pennisetum purpureum, which perform poorly in coarse media alone [16].

3.1.2. Banana Fibres Used in Advanced Treatment Stage

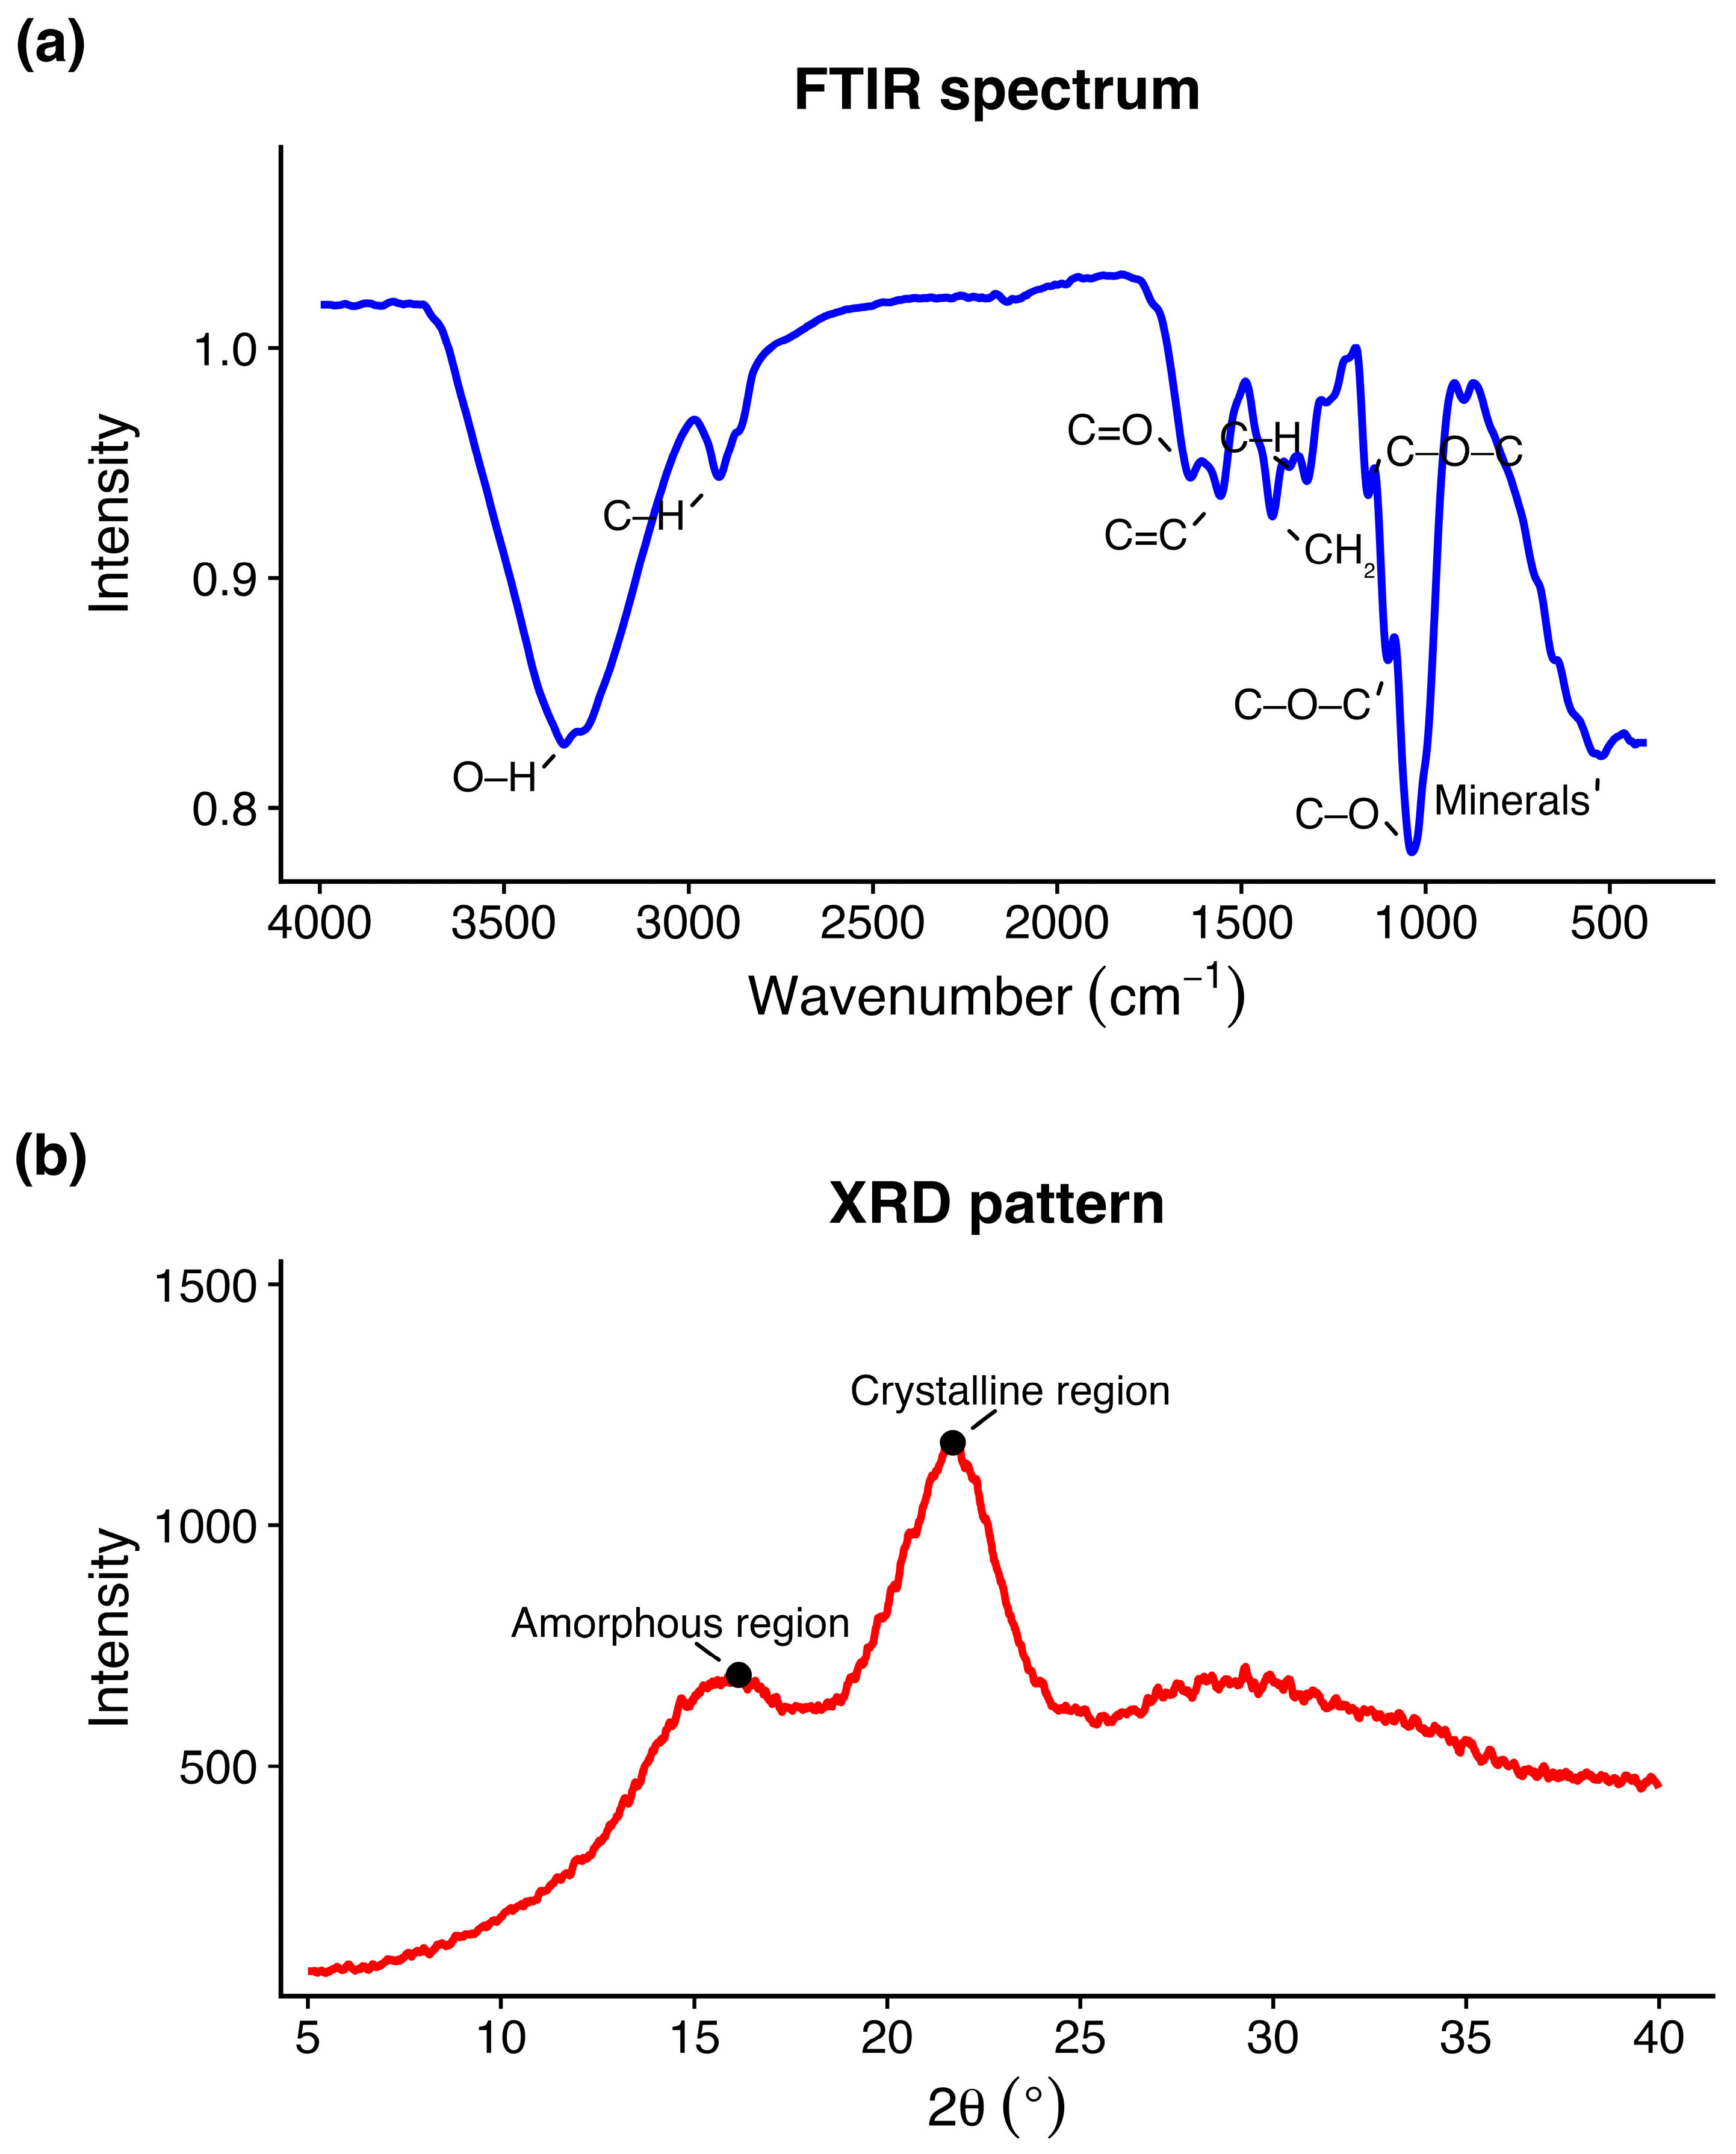
FTIR analysis of banana fibre revealed key features linked to nutrient removal performance. A broad band at 3320 cm−1 indicated hydroxyl (–OH) groups, while peaks at 1650–1556 cm−1 reflected carbonyl and aromatic structures from lignin. Bands at 1155–1035 cm−1 corresponded to C–O–C and C–O groups of cellulose and hemicellulose (Figure 2a).
XRD results confirmed a semi-crystalline structure. A broad halo at 12–18° (2θ) indicated amorphous cellulose, hemicellulose, and lignin, while sharper peaks at 18–30° (2θ) indicated crystalline cellulose I microfibrils (Figure 2b). This agrees with FTIR evidence distinguishing crystalline (1155 cm−1) and amorphous (1100 cm−1) cellulose regions. Together, both analyses show a semi-crystalline banana fibre structure that controls functional group accessibility and nutrient adsorption performance [14].

3.2. Treatment Performance of Constructed Wetland Units

3.2.1. Organic Matter Removal

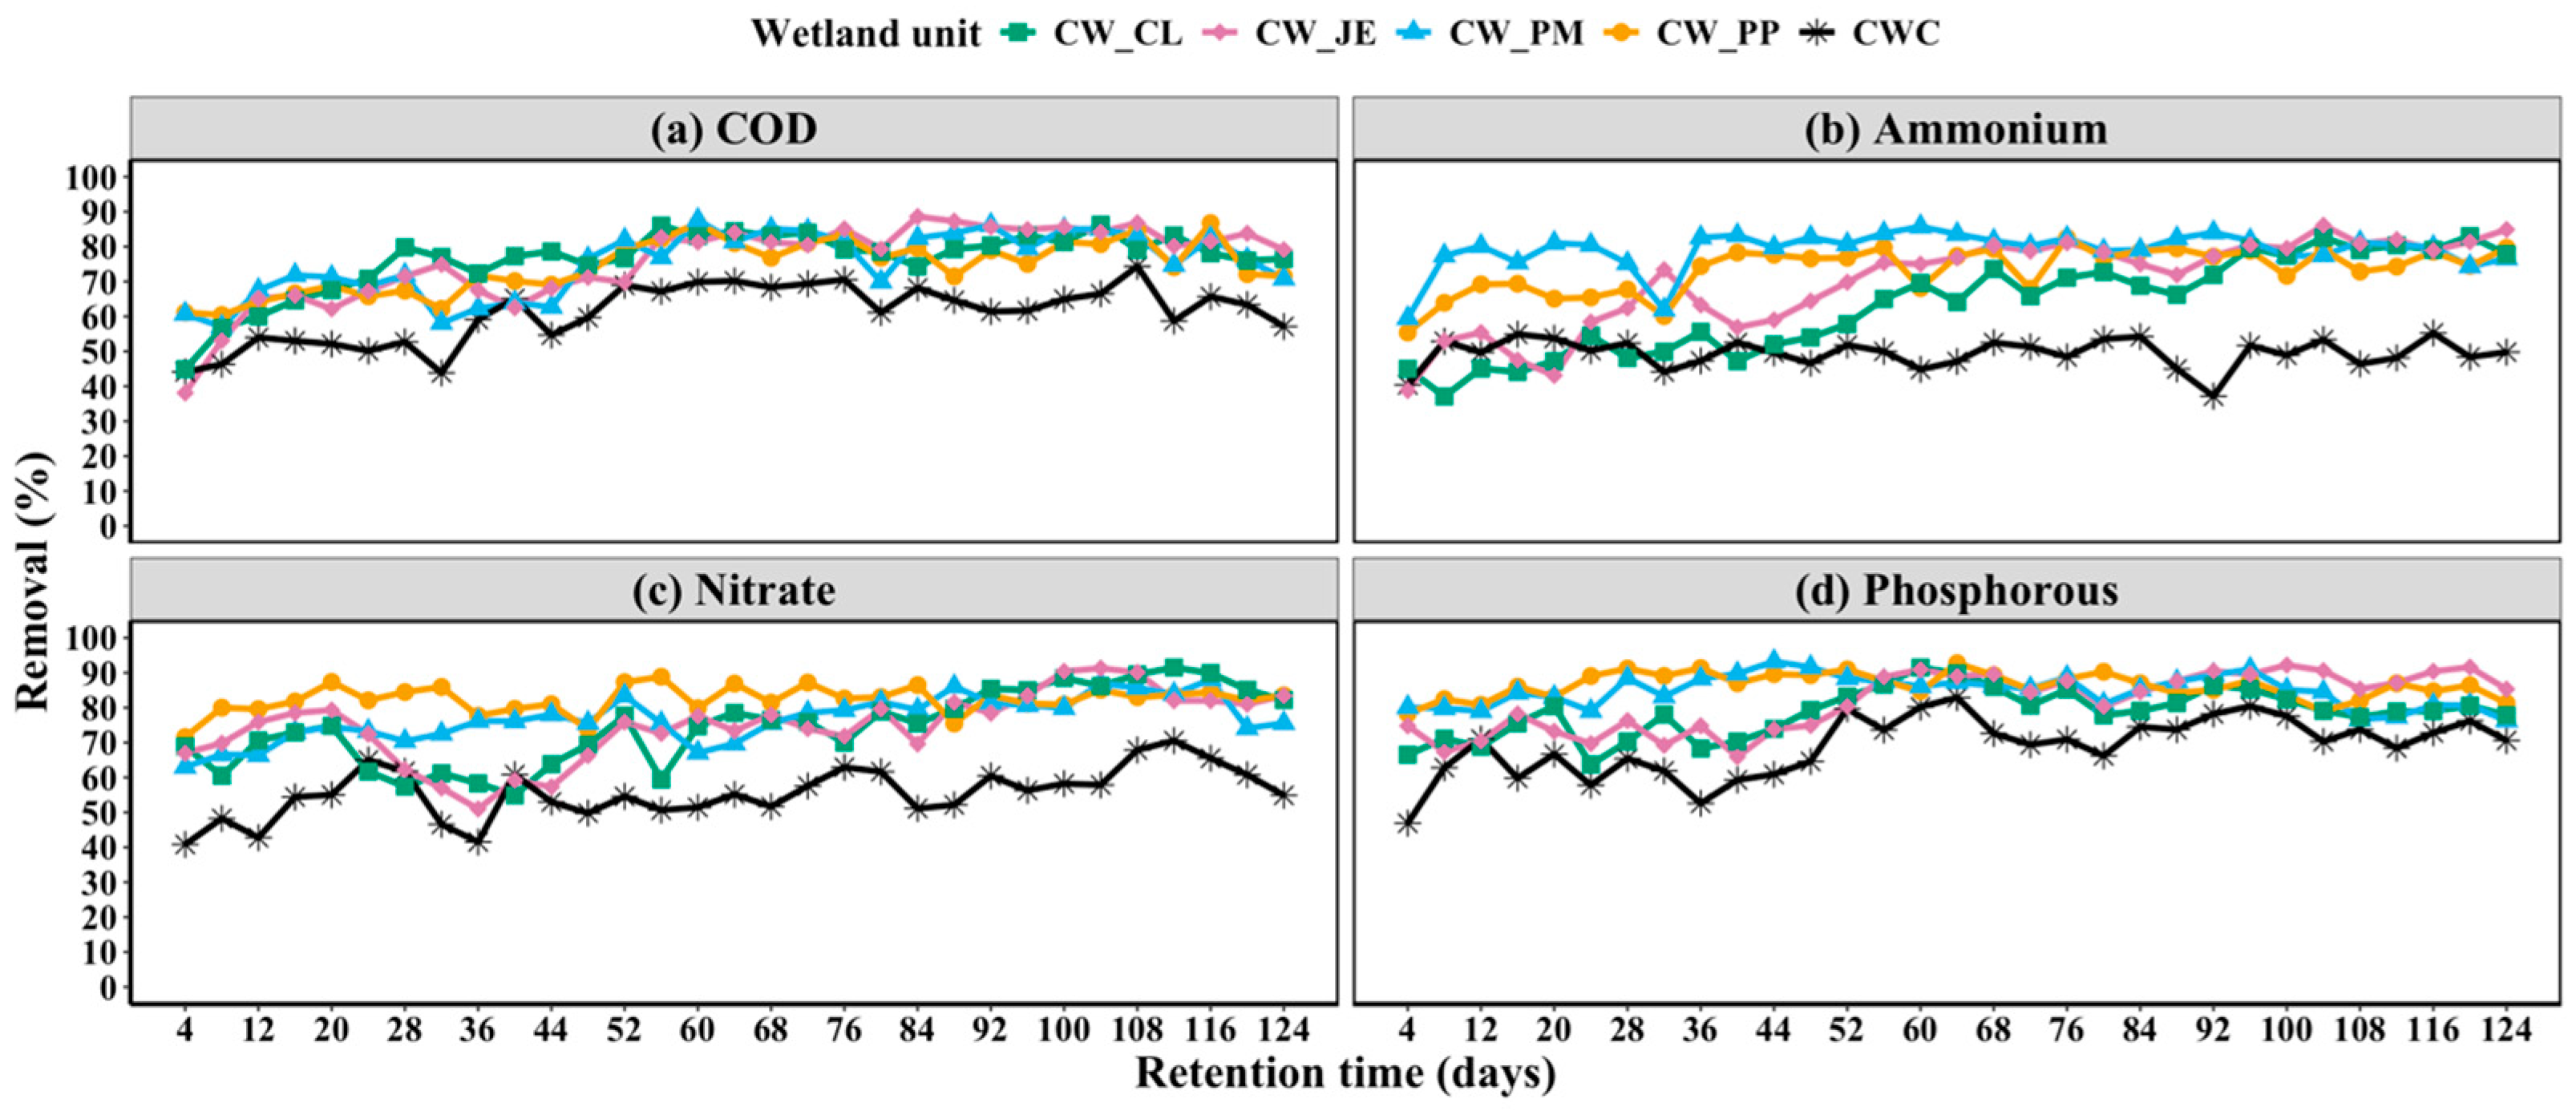
Figure 3a shows COD removal efficiency evolving from start-up to steady state, reflecting progressive biofilm development and rhizosphere stabilization in the constructed wetlands. During start-up, removal remained moderate and variable (40–70%) due to incomplete microbial establishment. After 40–60 days, efficiency increased to 70–90%, indicating mature microbial communities and stable redox gradients supporting aerobic and anaerobic degradation pathways [19]. A stable bed temperature (~23 °C) likely enhanced mesophilic microbial activity and COD removal [20].
Planted systems consistently outperformed controls, achieving 70–90% COD removal compared with 55–70% in unplanted units, with lower variability. The average COD removal efficiencies were 60.9 ± 8.3% in the unplanted control and ranged from 74.3 ± 7.6% to 76.0 ± 9.1% in planted wetlands, with CW_CL showing the highest mean removal (76.0 ± 9.1%), followed by CW_JE (75.5 ± 11.5%), CW_PM (75.2 ± 9.1%), and CW_PP (74.3 ± 7.6%).
The exploratory mixed-effects model provided statistical support for these treatment differences, showing that COD removal was significantly affected by treatment (F = 13.82, p < 0.001), operational time (F = 39.50, p < 0.001), and the treatment × time interaction (F = 4.65, p = 0.0016). These results indicate that COD removal was influenced by both vegetation presence and progressive development of the wetland systems during operation. Pairwise comparisons showed that planted wetlands differed from the unplanted control, whereas differences among planted species were relatively limited, suggesting that vegetation was more important than species identity for enhancing organic matter removal.
This improvement is consistent with the enhanced microbial activity, improved hydraulics, biofilm support, oxygen transfer, and particulate trapping widely attributed to macrophytes in constructed wetlands [21]. These specific mechanisms were not isolated or independently measured in this study. Therefore, macrophytes likely contributed indirectly to COD removal by promoting favourable conditions for microbial degradation rather than acting as the main removal pathway themselves.
Temporal regression analysis further confirmed continuous improvement of COD removal throughout the operational period. Positive removal slopes were observed for all treatments, with the highest increase rate occurring in CW_JE (0.255% day−1), followed by CW_CL (0.163% day−1), CW_PM (0.161% day−1), the unplanted control (0.142% day−1), and CW_PP (0.140% day−1). These trends indicate progressive establishment of microbial biofilms, root system development, and stabilization of rhizosphere conditions during wetland maturation.
Previous studies have reported that influent COD concentration strongly influences removal performance, with higher removals at lower loads, such as 91.6% at 346 mg/L and 76.9–83% at 481.3 ± 89.4 mg/L [22], while lower removals occur at higher loads [23]. In the current study, influent COD was 614.7 ± 22.3 mg/L and decreased to 124 ± 20 mg/L (CW_CL), 105 ± 19 mg/L (CW_JE), 126 ± 22 mg/L (CW_PM), and 135 ± 28 mg/L (CW_PP), corresponding to removal efficiencies of 79.8–82.9% across systems. These values are consistent with the load-dependent trend reported in [22,23].

3.2.2. Nutrient Removal

Figure 3b–d shows clear differences in ammonium, nitrate, and phosphorus removal across treatments, with all planted units outperforming the control (CWC). CWC maintained lower but stable removal, indicating that the sand and volcanic gravel matrix provides effective physicochemical and biological attenuation. The gradual stabilization of nitrogen removal is likely associated with biofilm development within the porous media, where aerobic microzones are thought to support nitrification and anaerobic zones to enable denitrification. This is consistent with the reported role of substrates as the main microbial support matrix driving nitrogen transformation [24]. In addition to supporting microbial processes, the substrate matrix also plays a key role in phosphorus retention through physicochemical mechanisms. Phosphorus removal in the control is therefore likely governed, at least in part, by substrate mineralogy (Table 2). Based on the measured substrate composition, SiO2-rich river sand may enhance filtration and microbial colonization, while Fe2O3-, Al2O2-, and CaO-rich volcanic gravel could provide reactive sites for phosphorus adsorption and precipitation through ligand exchange and insoluble complex formation, mechanisms reported for comparable mineral substrates [25]. The specific phosphorus retention pathway was not directly verified in this study, for example through sequential phosphorus fractionation.
Planted systems achieved greater nutrient removal than the control, demonstrating the contribution of vegetation to nutrient transformation processes. The mixed-effects model confirmed that treatment significantly affected ammonium removal (F = 71.95, p < 0.001), while operational time also had a significant influence (F = 114.03, p < 0.001), indicating that both plant establishment and wetland maturation contributed to improved nitrogen removal. Similarly, the Kruskal–Wallis test showed significant differences among treatments for ammonium (χ2 = 78.20, p < 0.001), nitrate (χ2 = 75.50, p < 0.001), and phosphorus (χ2 = 65.08, p < 0.001), confirming that the observed treatment variations were statistically significant. These enhanced removal efficiencies in planted systems were further supported by their higher biomass production and nutrient accumulation in harvested plant tissues (Table 3), highlighting the role of plant uptake as an additional pathway for nutrient removal in constructed wetlands.
CW_CL (Cyperus latifolius) showed an initial lag in ammonium and nitrate removal similar to the control, followed by a strong increase after one month, linked to plant establishment and biofilm development [26]. Its large belowground biomass (2.24 kg/m2) (Table 3) likely increased root surface area and supported nitrogen transformations. Despite the slower initial nitrogen removal, CW_CL achieved high phosphorus removal (>85%) during the later stages of the monitoring period, which was supported by phosphorus accumulation in both aboveground (68.8 g/m2) and belowground biomass (17.7 g/m2).
CW_JE (Juncus effusus) showed a similar lag phase in nitrogen removal, followed by improved performance after establishment, supported by belowground biomass development (1.54 kg/m2), which likely enhanced rhizosphere processes. After system maturation, CW_JE achieved consistently high phosphorus removal (>85%), with the highest phosphorus accumulation among the tested plants (93.1 g/m2 in aboveground biomass and 7.5 g/m2 in belowground tissues) (Table 3), indicating strong uptake and translocation capacity and highlighting its contribution to nutrient sequestration. This finding aligns with previous reports of Juncus effusus performance in gravel-based CW systems [16].
CW_PM (Phragmites mauritianus) achieved the highest ammonium removal efficiency among the planted systems (79.1 ± 5.6%), despite having lower aboveground biomass (5.48 kg/m2) and nitrogen accumulation (23.1 g/m2). This highlights a dominant contribution from rhizosphere-associated processes rather than direct plant uptake. Its substantial belowground biomass (0.96 kg/m2) (Table 3) is consistent with the capacity for oxygen transfer via aerenchyma and radial oxygen loss reported for this species, which has been linked to coupled nitrification-denitrification in root-zone biofilms [27]. Root-zone oxygen flux and biofilm nitrifier/denitrifier activity were not measured directly in this study. Phosphorus removal was also high but slightly lower than Pennisetum purpureum, consistent with its lower phosphorus accumulation in plant biomass (9.3 g/m2 aboveground and 1.7 g/m2 belowground), suggesting stronger dependence on substrate-mediated phosphorus retention. Reported nitrogen removal of 69% and 86% for Phragmites-based systems supports these observations [23,28].
CW_PP (Pennisetum purpureum) showed rapid stabilization and consistently high nutrient removal performance. Ammonium removal exceeded 70%, while nitrate removal was the highest among all treatments (82.3 ± 4.0%). These values are consistent with previous studies reporting ammonium removal efficiencies between 76% and 84% [29] and up to 85.97% [30], as well as nitrate removal efficiencies of approximately 66.8% [29]. The high nitrogen removal capacity of CW_PP was associated with strong aboveground biomass production (12.82 kg/m2) and nitrogen accumulation (74.4 g/m2) (Table 3) in plant tissues, highlighting an important contribution of plant uptake [31]. CW_PP also achieved the highest phosphorus removal efficiency (86.3 ± 3.7%), likely due to high root development and enhanced plant–substrate interactions.
Temporal trend analysis showed positive nutrient removal trends across all planted systems, indicating progressive maturation of nitrogen transformation pathways and phosphorus retention mechanisms. These improvements are consistent with increasing microbial colonization, root development, and stabilization of plant–substrate interactions during wetland operation.

3.2.3. Plant Biomass Production and Nutrient Uptake

Species-specific differences in biomass and nutrient uptake influenced treatment performance, consistent with field-scale studies linking biomass production to nutrient removal efficiency [32]. As shown in Table 3, aboveground biomass served as the main nutrient reservoir. Nitrogen uptake correlated strongly with biomass, especially in Pennisetum purpureum, while phosphorus uptake varied across species, with Juncus effusus showing high accumulation despite moderate biomass. These patterns reflect physiological and morphological differences among wetland plants [33].
Cyperus latifolius produced high biomass (10.4 kg m−2) and substantial phosphorus accumulation (86.5 g m−2). Previous work reported about 3.3 kg m−2 aboveground biomass after six months in volcanic gravel [16]. Phosphorus accumulation (17.7 g m−2 belowground and 68.8 g m−2 aboveground) exceeded typical values for many wetland macrophytes, indicating efficient uptake.
Juncus effusus showed moderate biomass (6.8 kg m−2) but the highest phosphorus uptake (100.6 g m−2), highlighting its high nutrient concentration per unit biomass. A previous study reported 5.2 kg m−2 aboveground dry matter with similar nitrogen and phosphorus accumulation [16]. These results support its use in systems targeting phosphorus removal rather than maximum biomass production.
Phragmites mauritianus showed lower biomass (6.4 kg m−2) with reduced nutrient uptake, including aboveground nitrogen and phosphorus of 18.3 g m−2 and 9.3 g m−2. One study reported lower biomass (1.9 kg m−2) with TN of 33.7 g m−2 and TP of 6 g m−2 [34]. Another study reported higher TN (164.5 g m−2) and TP (29.3 g m−2) at similar biomass (6.5 kg m−2) [35], indicating variability linked to environmental conditions, design, and nutrient loading.
Pennisetum purpureum produced the highest biomass (13.6 kg m−2) and nitrogen accumulation (78.4 g m−2), confirming strong nitrogen assimilation and harvest potential. Reported biomass of 12.5 to 14.7 kg m−2 matches this study [36]. Nitrogen accumulation ranges of 104 g m−2 and 144 g m−2 reported in other systems align with these findings [37]. This confirms its role as a high-biomass and high-nitrogen-uptake species.

3.2.4. Plant Biomass Valorization Potential

Six-month biomass and nutrient results indicate potential for resource recovery when scaled to one year. Estimates combine dry matter and nutrient content measured in this study with literature-derived feed intake, calorific, and market-price parameters. Pennisetum purpureum produced 12.82 kg m−2 dry matter (DM) per cycle, equal to 128,200 kg DM ha−1 and about 256,000 kg DM ha−1 yr−1 under continuous regrowth.
Using a reported daily intake of 9 kg dry matter per cow [38], one animal would require 3285 kg yr−1, giving an estimated carrying capacity of about 78 cows per hectare per year. At 23% dry matter, production equals about 1,100,000 kg fresh biomass ha−1 yr−1 or 34.4 kg fresh feed per cow per day. At a reported local market price of 0.05 USD kg−1 fresh Napier grass [39], the indicative feed value reaches about 56,470 USD ha−1 yr−1. Since these feed value estimates rely on literature-reported composition and market data rather than direct analysis of the harvested biomass, future studies should directly assess forage quality parameters, such as crude protein, fibre fractions, and nitrate content, in wastewater-grown biomass to validate its suitability as animal feed.
Energy recovery follows the same basis. Using a literature higher heating value (HHV) of 18 MJ kg−1 dry biomass [40], Pennisetum purpureum would yield about 460 MJ m−2 yr−1 (~4.6 × 10³ GJ m−2 yr−1) under direct combustion. Lower values occur for Cyperus latifolius (290 MJ m−2 yr−1) and Juncus effusus (187 MJ m−2 yr−1). For comparison, Arundo donax has been reported to yield about 110 MJ m−2 or 1660 L CH4 via digestion [40].
At the community scale (200 people, 280 GJ yr−1 cooking demand), the estimated biomass supply of 12–150 GJ yr−1 could meet 4–55% of demand. Using reported methane yields of 170–360 L CH4 kg−1 dry biomass [41], an estimated 4350–9200 L CH4 m−2 yr−1 could be obtained from Pennisetum purpureum.
Nutrient recovery based on measured tissue nitrogen and phosphorus content is more directly supported: Pennisetum purpureum stores 74.4 g N m−2 (744 kg N ha−1). Phosphorus reaches 93.1 g m−2 (931 kg ha−1) in Juncus effusus and 68.8 g m−2 (688 kg ha−1) in Cyperus latifolius (Table 3). These exceed FAO fertilizer rates of 54–68 kg N ha−1 and 22–26 kg P ha−1 [42], indicating potential for fertilizer substitution via compost or digestate.
Cyperus latifolius and Juncus effusus also present potential fibre income. Juncus effusus yields 10.4 kg m−2 yr−1 (104 t ha−1 yr−1). Based on a survey of local mat producers, approximately 350 stems (~1 kg dry biomass) are needed to produce 1 m2 of mat. At 3 USD kg−1 for the local market, estimated revenue would reach 30 USD m−2 yr−1 (300,000 USD ha−1 yr−1), rising to 50 USD m−2 yr−1 (500,000 USD ha−1 yr−1). These findings highlight the multifunctional potential of constructed wetlands, with harvested biomass adding economic value beyond wastewater treatment.

3.3. Banana Fibre Filtration of Constructed Wetland Effluent

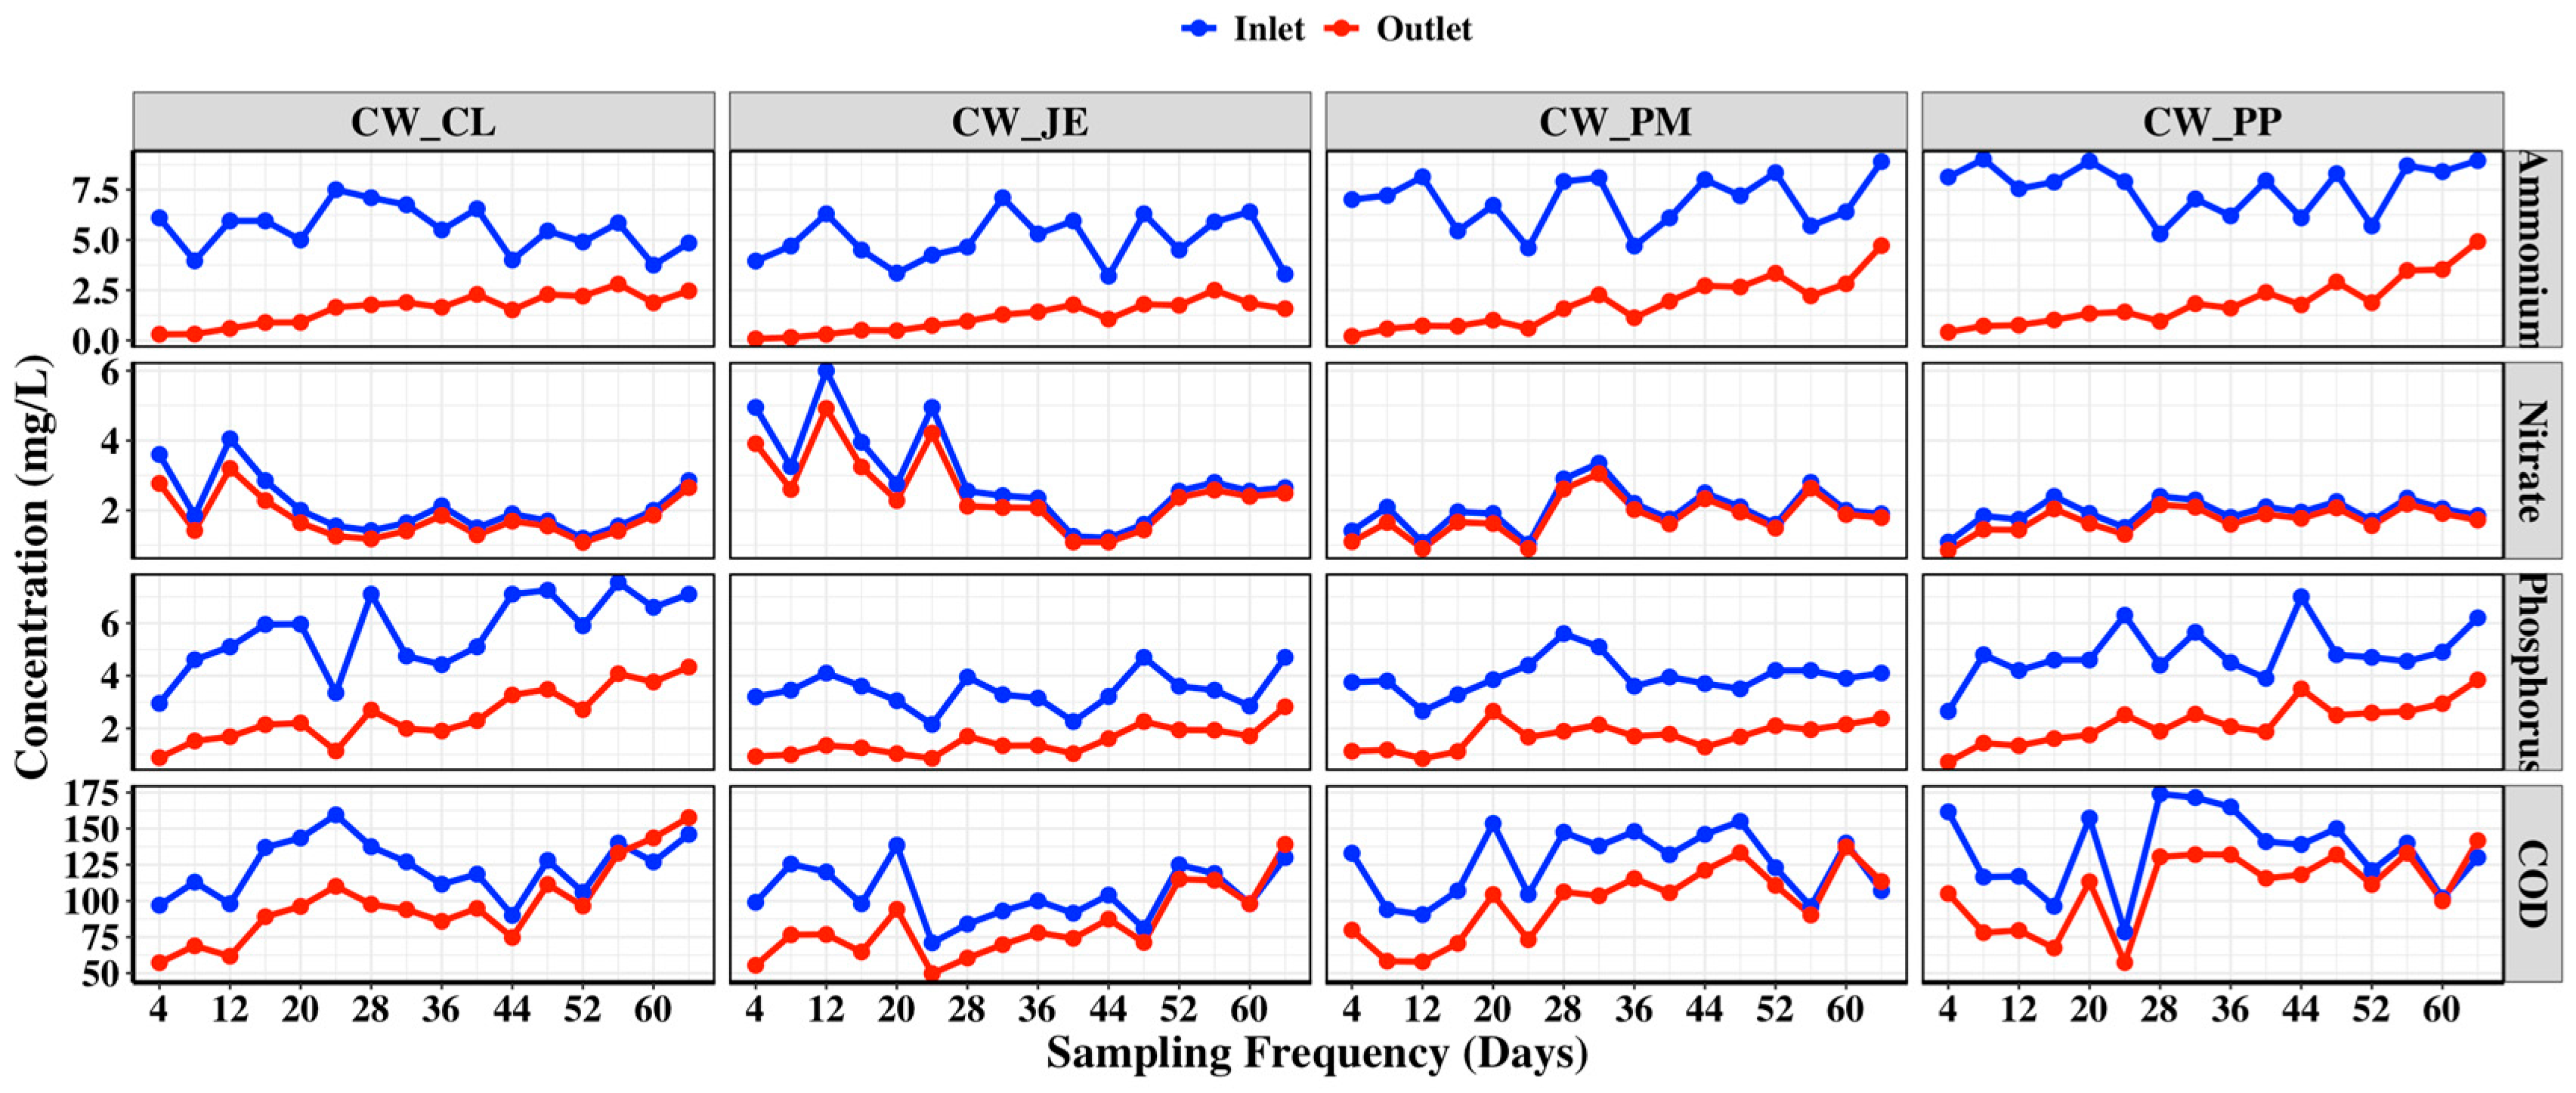
Of the three fibre-to-gravel ratios (7:3, 5:5, 3:7) tested to optimize the filter and polish the CW effluents, the 7:3 ratio achieved the best performance, with ammonium below 0.75 mg L−1 and phosphorus at 1.38–3.17 mg L−1. The filter was installed downstream of CW units planted with Cyperus latifolius (CW_CL), Juncus effusus (CW_JE), Phragmites mauritianus (CW_PM), and Pennisetum purpureum (CW_PP) after two months of stable CW operation and was run for an additional two months. It consistently improved nutrient removal, reducing ammonium from 5 to 8 mg L−1 to 1–2 mg L−1 (71–77% removal) and phosphorus from 3 to 6 mg L−1 to 1.5–2.5 mg L−1.
FTIR results (Figure 2), obtained directly from the fibre material used in this study, identified hydroxyl and carbonyl functional groups consistent with a negatively charged surface. This finding is consistent with ammonium removal through electrostatic attraction and ion exchange with NH4+, mechanisms reported for similar lignocellulosic adsorbents [11], although they were not independently verified in this study, for example, by zeta potential measurements. In contrast, phosphorus removal remained lower, consistent with the weak affinity of negatively charged fibre surfaces for PO43−, the limited availability of ligand exchange sites, and the absence of metal oxygen functional groups reported for comparable untreated lignocellulosic materials. These mechanisms were inferred from the FTIR results and previous studies but were not directly confirmed. Modified lignocellulosic adsorbents have been shown to substantially improve phosphate removal compared with untreated fibres [43].
As shown in Figure 4, a decline in removal over time was observed, stronger in high-load systems (CW_PM, CW_PP), where ammonium removal dropped from 97 to 47% and from 95 to 45%. Lower load systems (CW_CL, CW_JE) declined more slowly, from 95 to 49% and 98 to 52%. Phosphorus showed a similar decline, likely reflecting progressive site saturation and biomass accumulation, consistent with biofilter behaviour [44] and plant-based adsorbents [11]. Fibre replacement every six to eight weeks would likely improve nutrient polishing.
Nitrate removal remained low, decreasing from 2 to 3 mg L−1 to 1.7–2.6 mg L−1 (10–15%), consistent with the limited availability of positively charged sites for NO3 adsorption reported for similar lignocellulosic materials [45,46]. COD removal was also limited, decreasing from 105 to 136 mg L−1 to 83–109 mg L−1 (19–22%). FTIR analysis indicated a cellulose- and lignin-dominated structure, generally associated with low surface area and limited adsorption capacity, which may explain the relatively low COD removal observed. Improved COD removal has been reported for activated banana fibre with a higher surface area and additional functional groups [47].
Although the banana fibre filter showed effective short-term polishing performance, its long-term behaviour under continuous operation requires further investigation. The present study evaluated performance for only two months after installation, limiting the assessment of long-term fibre stability, adsorption capacity, biofilm development, and structural degradation. The observed decline in ammonium and phosphorus removal suggests progressive site saturation and biomass accumulation, which may become more pronounced during extended operation. Therefore, the proposed six-to-eight-week replacement interval should be considered an operational estimate based on short-term trends rather than a validated maintenance schedule. Longer-term studies are needed to assess fibre durability, physicochemical changes, microbial development, and replacement requirements.

3.4. Microbial Removal

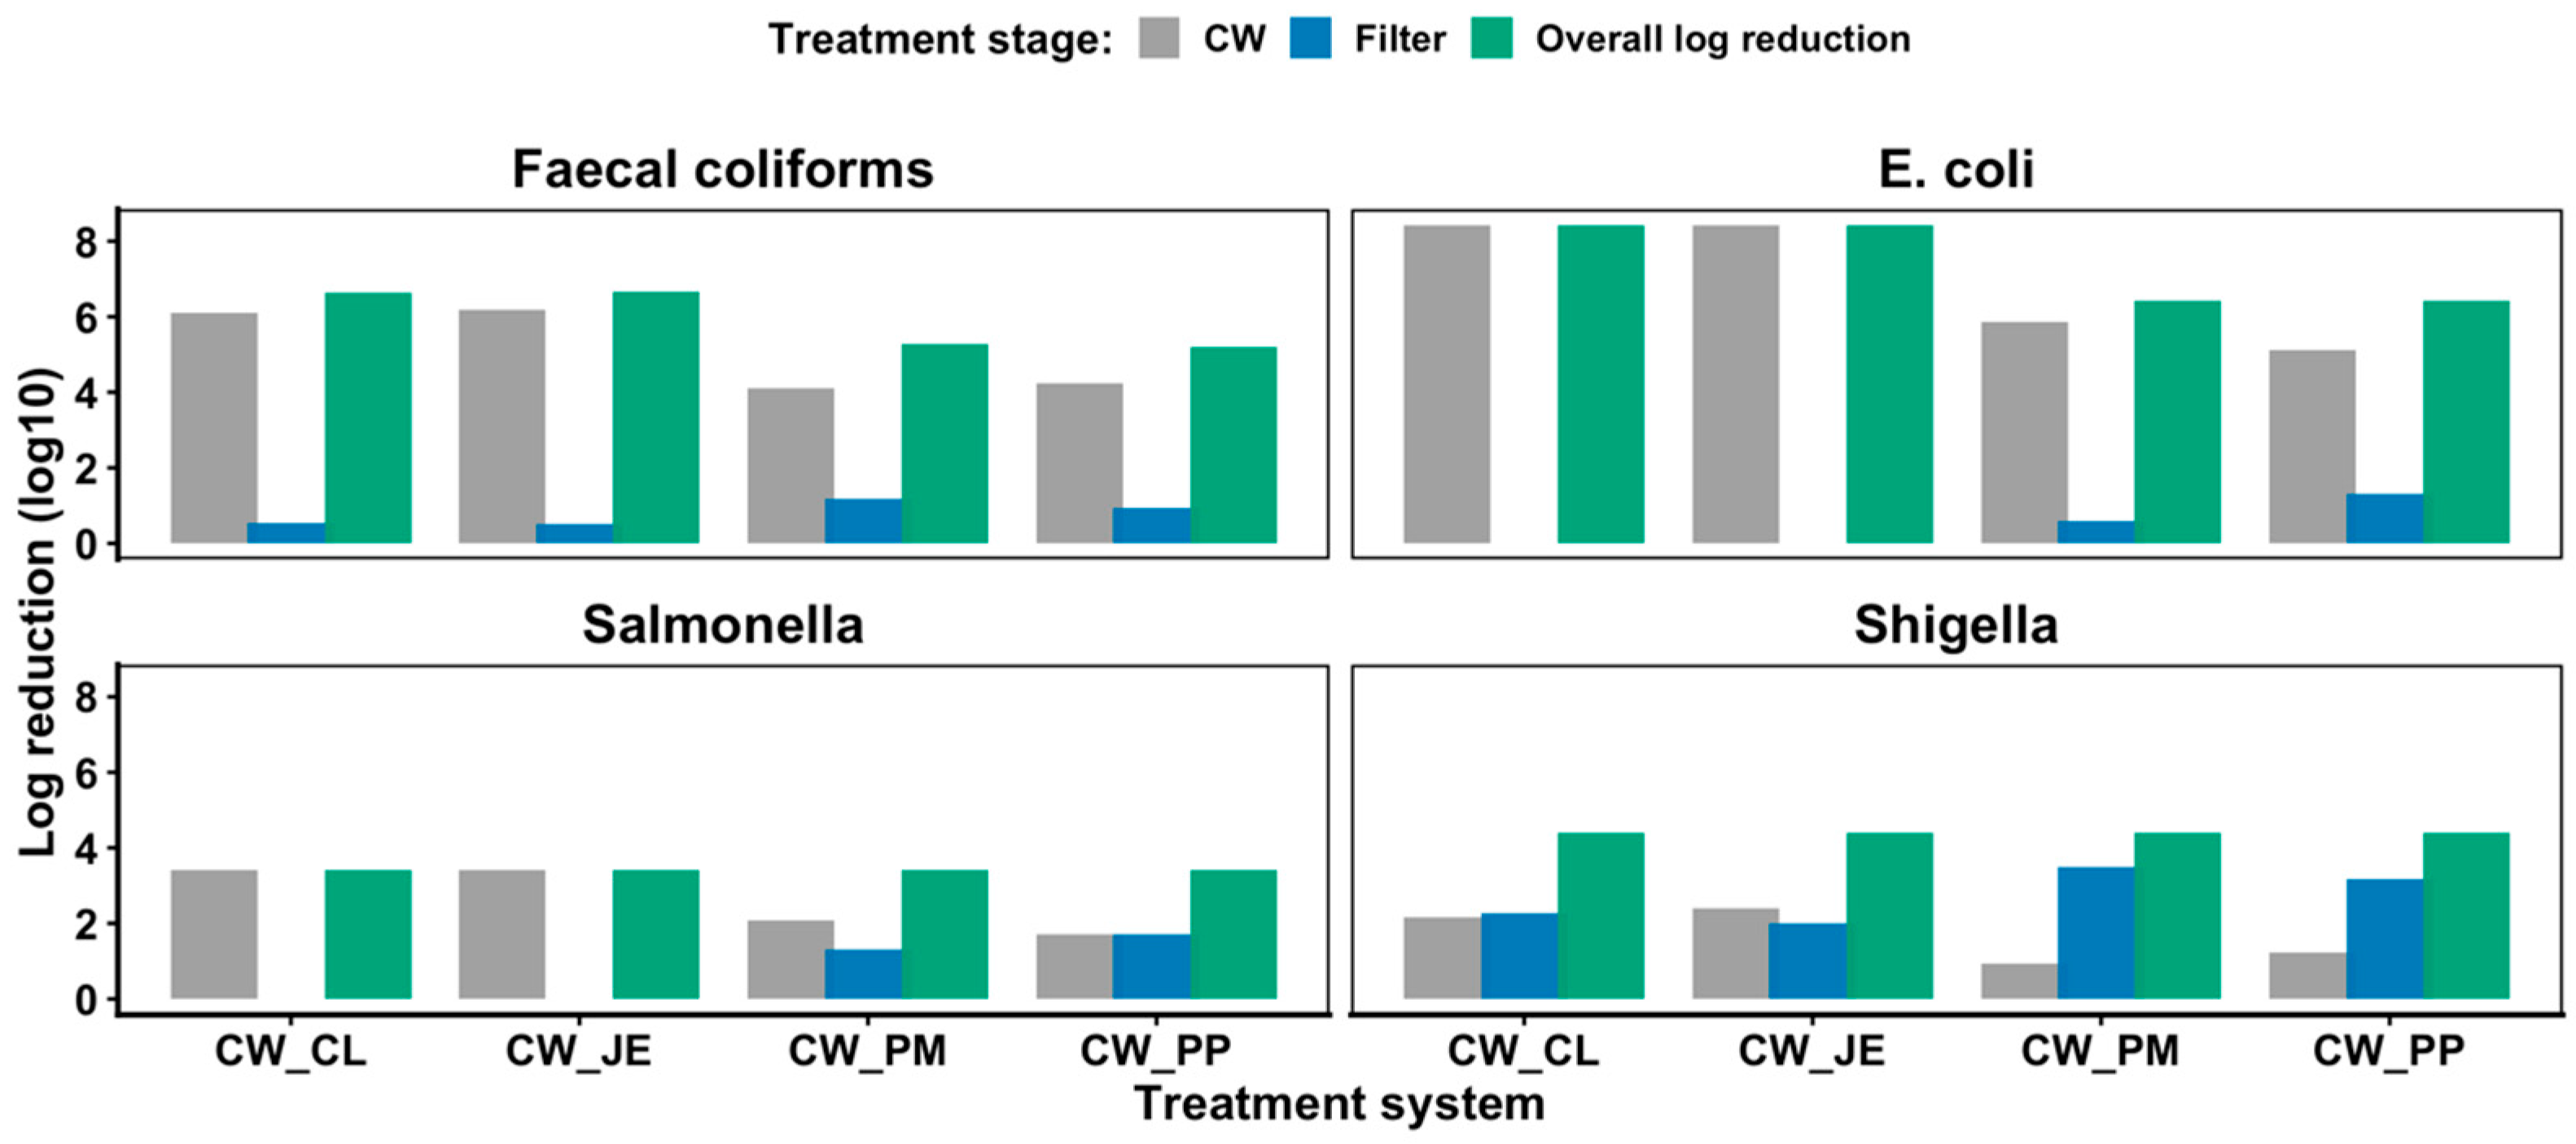
Figure 5 shows microbial removal by CW units and banana fibre filtration. Influent concentrations of fecal coliforms (FC) and Escherichia coli were about 108 CFU/100 mL, while Salmonella and Shigella ranged from 103 to 104 CFU/100 mL.
The unplanted control (CWC) reduced FC and E. coli, but concentrations remained above FAO/WHO limits for unrestricted irrigation, indicating that physical processes alone provide only partial pathogen removal [48]. Similar findings have been reported in CW systems [49]. Planted CWs achieved substantially higher removal. CW_CL and CW_JE exceeded 6 log removal for FC and 8 log removal for E. coli, meeting FAO/WHO requirements for unrestricted irrigation [48]. CW_PM and CW_PP achieved lower removals but remained suitable for restricted irrigation, including fodder, fibre, and industrial crops [48].
Salmonella and Shigella removals were lower, ranging from 1.7 to 3.4 logs and 0.9–2.4 logs, respectively. Since FAO/WHO guidelines require non-detectable pathogen levels for unrestricted irrigation [48], additional treatment was necessary. Greater persistence of some enteric bacteria in CW systems has also been reported elsewhere [49].
The banana fibre filter provided important additional treatment. FC and E. coli reductions were modest (≤1.2 logs) because CWs had already removed most organisms. In contrast, Salmonella and Shigella removal increased by up to 1.7 and 3.5 logs, respectively. This improvement is consistent with the adsorption capacity, rough surface structure, and high amorphous content reported for banana fibres, which are thought to enhance bacterial attachment, and with reported antimicrobial compounds in banana fibre that may reduce bacterial survival after retention [50]. These specific mechanisms were not directly tested in this study.

3.5. Overall Performance and Compliance with Discharge and Reuse Standards

The hybrid CW and banana fibre filtration system achieved high removal of nutrients, organic matter, and microbial contaminants. CW_JE-Banana fibre filter showed the best overall performance for ammonium, phosphorus, and COD, while CW_PP-Banana fibre filter achieved the highest nitrate removal.
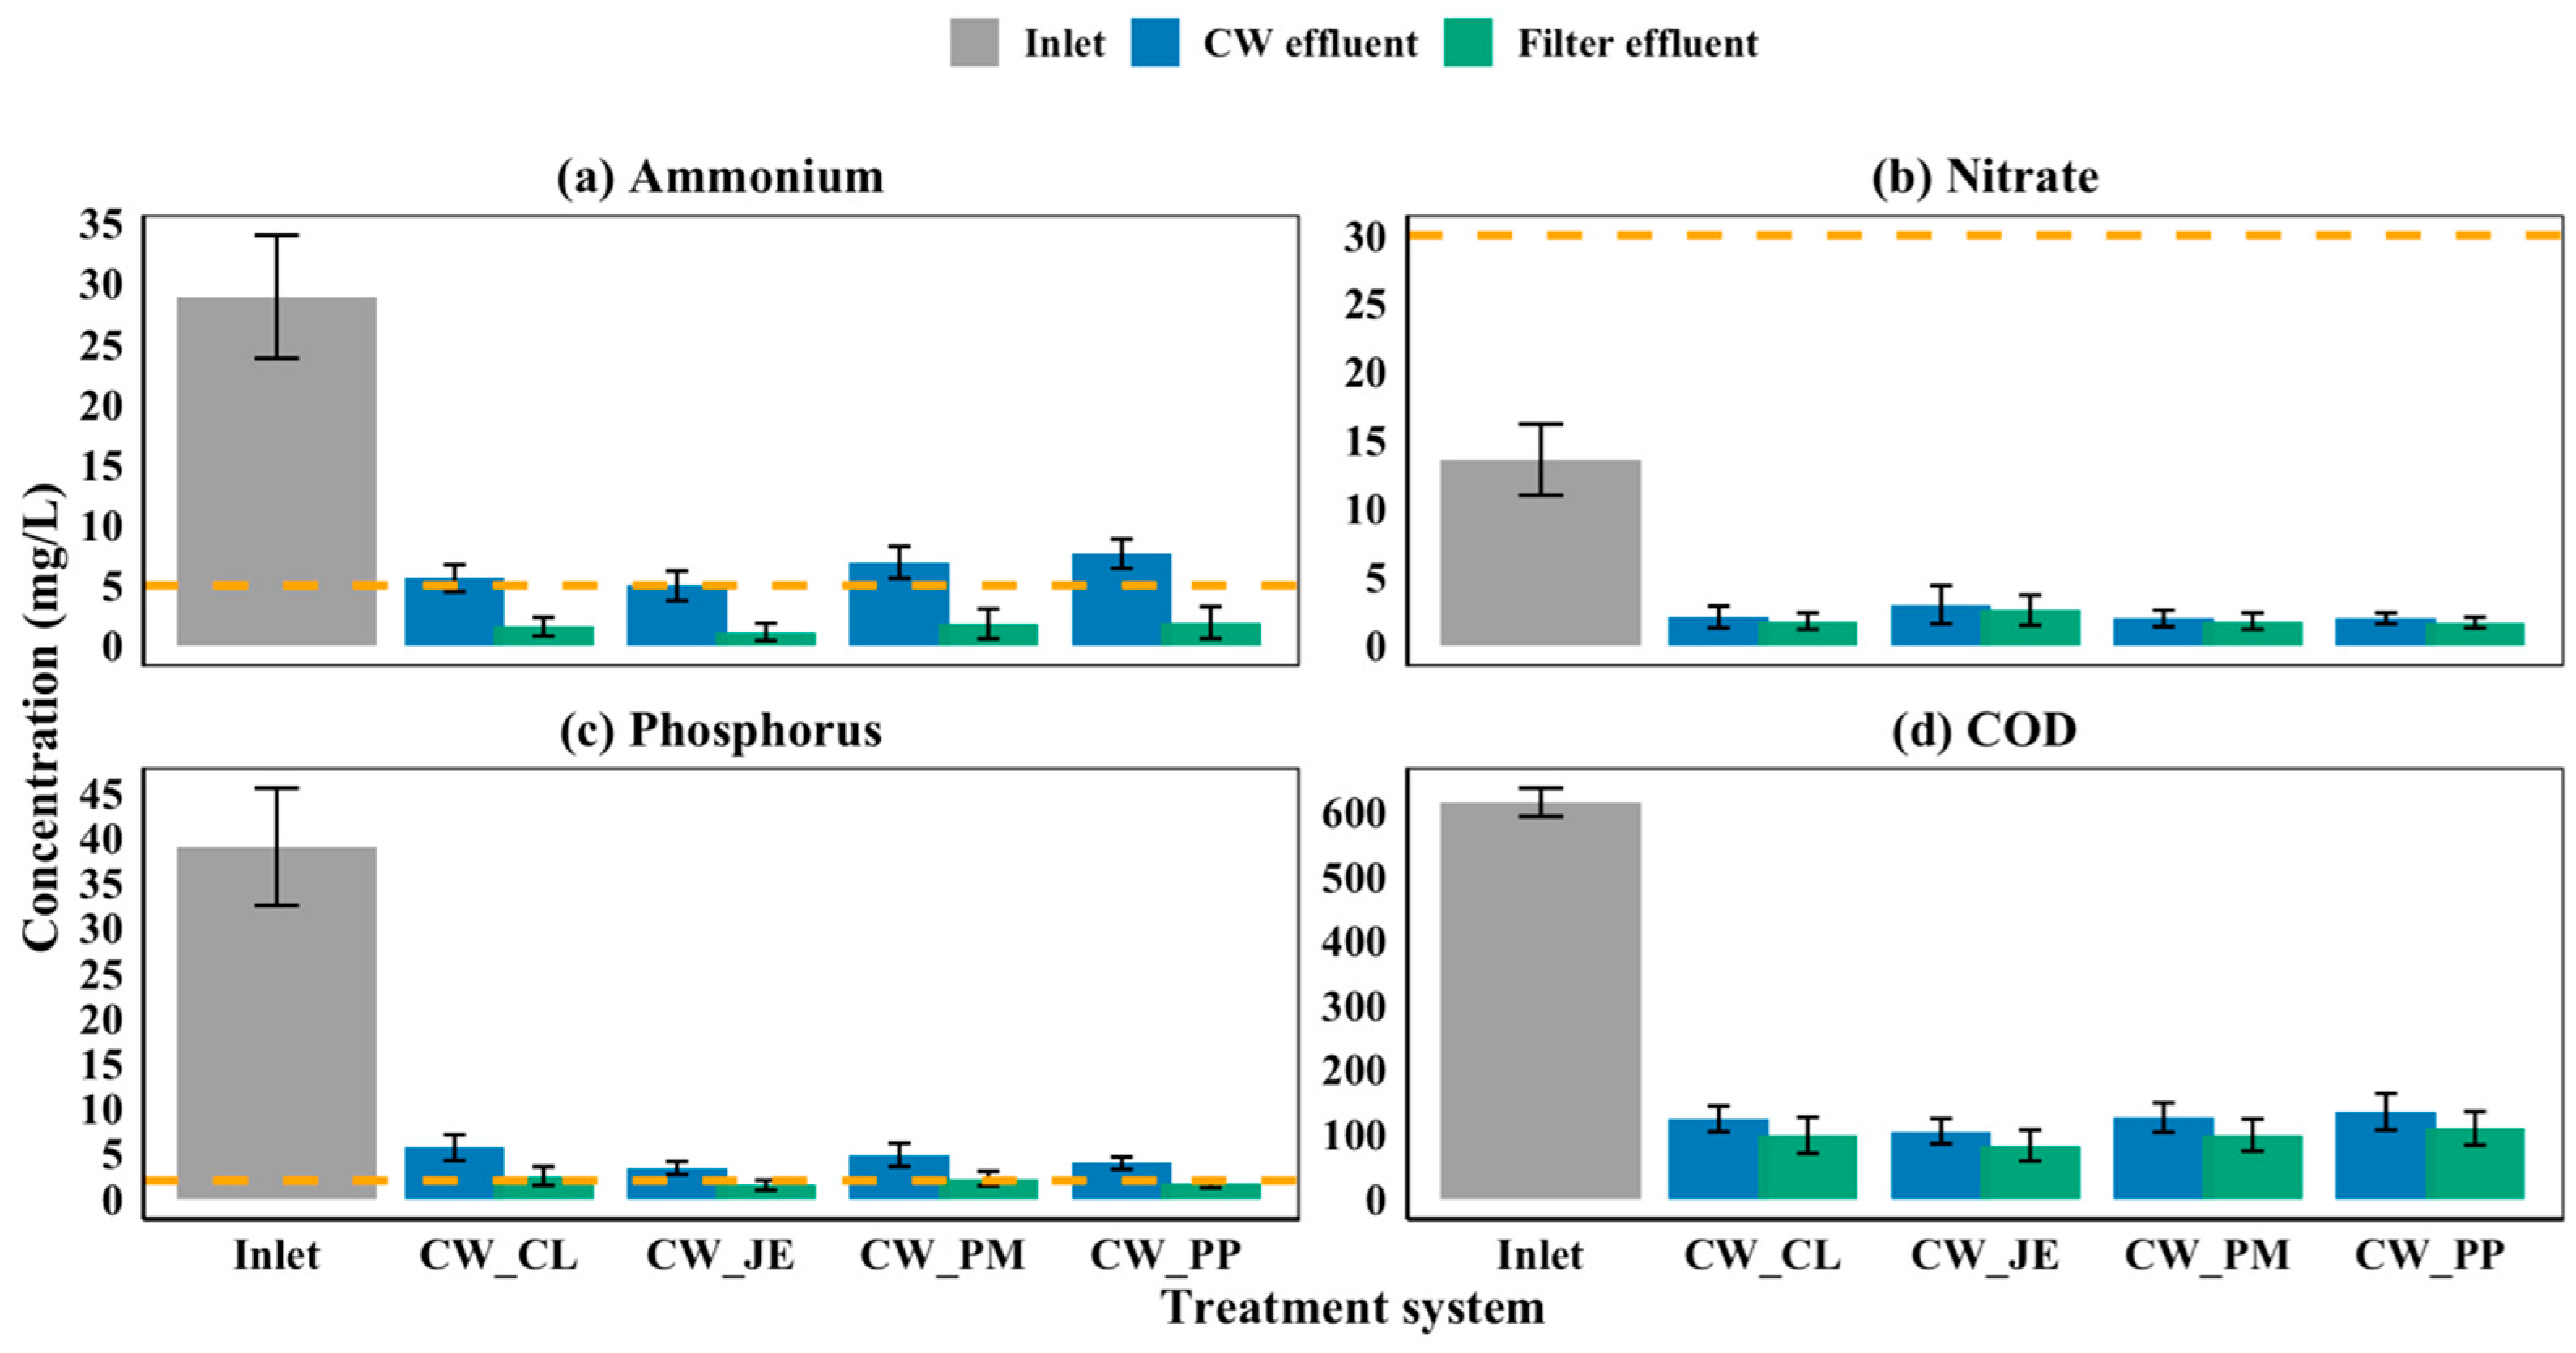
As shown in Figure 6, the average influent concentrations of 24, 14, 35, and 614 mg L−1 for ammonium, nitrate, phosphorus, and COD were reduced to 1–2, 1.7–2.6, 1.5–2.5, and <120 mg L−1, respectively. Overall removal efficiencies reached 93–96% for ammonium and phosphorus and 81–87% for nitrate and COD, exceeding values commonly reported for standalone subsurface flow CWs.
Table 4 compares the treatment performance of the present system with comparable constructed wetland studies using similar plant species. Despite differences in wastewater type, scale, design, substrate, and operating conditions, the efficiencies achieved here match or exceed those reported elsewhere. Adding banana fibre filtration to the wetland consistently improved the removal of all evaluated parameters over the wetland alone, with ammonium showing the strongest gain. This highlights the filter as a particularly effective addition for ammonium treatment.
The final effluent met FAO irrigation guidelines [51], and both Rwanda national discharge and irrigation standards [52], and EU discharge standards, except for phosphorus and European Union (EU) discharge standards for all parameters, except phosphorus under EU limits [53]. Ammonium remained below the FAO limit of 5 mg L−1 throughout the filtration period, whereas phosphorus approached the 2 mg L−1 limit after six weeks, indicating the need for periodic fibre replacement (Figure 6).
CW_CL and CW_JE-Banana fibre filter achieved >6 log removal of fecal coliforms and ~8 log removal of E. coli, with no detection of Salmonella or Shigella, meeting unrestricted irrigation guidelines [48].

4. Long-Term Sustainability and Scalability of the Hybrid Treatment System

Although the hybrid constructed wetland and banana fibre filtration system achieved effective treatment during the experimental period, long-term application depends on maintaining hydraulic stability, substrate functionality, vegetation productivity, and filter media performance. In subsurface flow CWs, gradual clogging from suspended solids, microbial growth, and organic matter deposition reduces hydraulic conductivity and treatment efficiency over extended operation [12,25]. River sand and volcanic gravel provided structural support and promoted flow distribution. Long-term monitoring is required to assess clogging progression and define maintenance schedules.
The nutrient removal capacity of wetland substrates decreases as adsorption sites become occupied, particularly for phosphorus retention. Phosphorus removal in CWs occurs through adsorption, precipitation, and ion exchange, depending on substrate characteristics and operating conditions [12,25,45]. Volcanic gravel, plant uptake, and microbial activity likely contributed to phosphorus removal. Future studies should evaluate substrate longevity and determine whether replacement or regeneration strategies are required during extended operation.
The banana fibre filter provided additional polishing of ammonium and phosphorus due to the adsorption properties of its cellulose structure and functional groups [11,47]. During operation, its treatment contribution declined, likely because of adsorption site saturation and biomass accumulation within the fibre matrix, which are common limitations of organic filter media used in wastewater treatment [44]. Under the tested conditions, replacing the banana fibre medium approximately every six to eight weeks would help maintain polishing performance. However, this replacement interval requires further validation under different wastewater compositions and hydraulic loading conditions.
Sustained wetland performance also requires appropriate vegetation management. Plant harvesting removes accumulated nutrients, supports continued biomass production, and limits excessive organic matter accumulation [32,33]. In this study, Pennisetum purpureum, Cyperus latifolius, and Juncus effusus produced substantial biomass and accumulated nutrients, indicating potential for nutrient recovery. Harvested wetland biomass has also been linked with resource recovery options, including energy production and other beneficial uses [35,40]. Under typical operating conditions, weekly inspection of inlet and outlet structures and vegetation harvesting twice annually would likely support stable operation.
Long-term performance may also be affected by climatic conditions, including rainfall, temperature, and evapotranspiration. High rainfall events may increase hydraulic loading and reduce hydraulic retention time, while dry periods may alter water balance and flow distribution. Temperature fluctuations influence microbial processes responsible for nitrogen transformation [19,20,31]. Field-scale studies are required to evaluate system performance under variable climatic conditions.
For scale-up assessment, the applied hydraulic loading rate of 30 mm/day and an assumed wastewater generation rate of 50 to 100 L/person/day result in an estimated wetland requirement of approximately 1.67 to 3.33 m2 per population equivalent (PE). For a facility serving approximately 400 PE, the estimated flow ranges from 20 to 40 m3/day, requiring a wetland area of approximately 0.07 to 0.13 ha. This land requirement aligns with decentralized CW applications in rural and institutional settings where available land and low operational complexity support implementation [4,5,8].
The system is expected to have low operational costs due to gravity-driven flow, which eliminates the need for external energy input. Comparable CWs treating municipal wastewater have reported annual operation costs of 6.5–13.9 Euro/PE. These costs are roughly 60% lower than conventional treatment plants of similar capacity and are driven mainly by pumping electricity and operator labour [55]. Since the proposed system requires no pumping, costs are expected to fall at or below this range. Main expenses would include vegetation harvesting, replacement of the banana fibre medium, and maintenance of hydraulic structures. Banana fibre is an inexpensive, locally available byproduct, so this is expected to remain economically feasible. Pilot-scale implementation is needed to confirm actual costs under Rwandan field conditions.
The hybrid system shows potential as a decentralized wastewater treatment option because of its low energy demand, gravity-driven operation, and use of locally available materials. The engineering estimates provide an initial basis for evaluating land requirements, maintenance activities, filter media management, and operational costs for decentralized wastewater treatment applications in institutional settings. Further pilot-scale studies are required to confirm long-term reliability, performance under variable loading conditions, and life cycle economic feasibility before broader implementation.

5. Conclusions

This study evaluated the performance of constructed wetlands (CWs) planted with Cyperus latifolius, Juncus effusus, Phragmites mauritianus, and Pennisetum purpureum, integrated with banana fibre filtration for wastewater treatment and reuse potential under bench-scale conditions over a four-month operational period. The CWs achieved substantial pollutant removal, with ammonium, nitrate, phosphorus, and COD removal efficiencies of 74–83%, 78–85%, 86–91%, and 78–83%, respectively. The subsequent banana fibre filtration further enhanced treatment performance, with greater polishing effects observed for ammonium and phosphorus than for nitrate and COD. Overall removal efficiencies increased to 93–96% for ammonium, 94–96% for phosphorus, 81–88% for nitrate, and 82–87% for COD.
Differences among planted configurations highlighted the influence of plant characteristics on treatment outcomes. Pennisetum purpureum produced high biomass and nitrogen accumulation (74.4 g N/m2), which corresponded with the highest nitrate removal (87.5%) after filtration. In contrast, Juncus effusus, despite producing lower biomass, showed the highest phosphorus accumulation (93.1 g P/m2), and its integrated configuration achieved the best overall performance for ammonium, phosphorus, and COD removal. Both configurations are therefore recommended for further pilot-scale evaluation.
The integrated system also demonstrated effective microbial reduction, achieving 6–8 log removal of fecal coliforms and E. coli, with no detectable Salmonella or Shigella in the final effluent. The treated effluent complied with FAO irrigation guidelines, as well as European Union (EU) and Rwanda discharge standards for the evaluated parameters, although phosphorus concentrations exceeded more stringent EU limits.
The present study has several limitations. The experiments were conducted at laboratory scale using a single wastewater source and a controlled hydraulic regime, which may not represent full-scale operating conditions. The four-month operational period was insufficient to assess long-term clogging development, substrate durability, and changes in filter performance. In addition, the absence of direct microbial characterization limited understanding of microbial contributions to treatment mechanisms. Further pilot-scale validation, extended monitoring, and microbial analysis are required to confirm system reliability and scalability under variable field conditions.
Despite these limitations, the findings demonstrate the potential of a low-cost, nature-based treatment approach that combines constructed wetlands with locally available banana fibre filtration for decentralized wastewater reuse. The system also offers opportunities for resource recovery through wetland biomass production and nutrient accumulation. Future research should assess economic feasibility, life cycle costs, suitability for community-scale applications, and the removal of additional contaminants, including emerging contaminants such as pharmaceuticals and hormones, as well as inorganic pollutants such as heavy metals. Further evaluation is also required to identify safe and sustainable uses of harvested wetland biomass, particularly for applications involving animal feed.

Author Contributions

Conceptualization, J.C.U., V.H., A.N. and G.K.R.; Data curation, J.C.U. and V.H.; Formal analysis, J.C.U.; Funding acquisition, A.N. and G.K.R.; Investigation, J.C.U.; methodology, J.C.U., V.H., A.N. and G.K.R.; Project administration, A.N. and G.K.R.; resources, A.N. and G.K.R.; Software, J.C.U.; Supervision, A.N. and G.K.R.; Validation, J.C.U. and V.H.; Visualization, J.C.U.; Writing—original draft preparation, J.C.U.; Writing—review and editing, J.C.U., V.H., A.N. and G.K.R. All authors have read and agreed to the published version of the manuscript.

Funding

This work was supported through the Sweden-Rwanda cooperation programme between the KTH Royal Institute of Technology and the University of Rwanda (grant number FP1924_11), funded by Sida.

Data Availability Statement

Data will be made available on request.

Acknowledgments

The authors gratefully acknowledge the financial support of the Swedish International Development Cooperation Agency (Sida), which made this research possible. The authors also thank the University of Rwanda for providing laboratory facilities and technical support throughout the study.

Conflicts of Interest

The authors declare no conflicts of interest.

References

  1. Omohwovo, E.J. Wastewater Management in Africa: Challenges and Recommendations. Environ. Health Insights 2024, 18, 11786302241289681. [Google Scholar] [CrossRef] [PubMed]
  2. Luo, B.; Liu, Y.; Huang, Y.; Huang, W.; Chen, Q.; Yan, Y.; He, H.; Zhou, X.; Yu, J. Study on high-concentration activated sludge system for energy-efficient nitrogen removal in wastewater. Sustain. Environ. Res. 2025, 35, 16. [Google Scholar] [CrossRef]
  3. Mabhaudhi, T.; Chimonyo, V.G.P.; Senzanje, A.; Chivenge, P.P. (Eds.) Enhancing Water and Food Security Through Improved Agricultural Water Productivity: New Knowledge, Innovations and Applications; Springer Nature: Singapore, 2025. [Google Scholar] [CrossRef]
  4. Kazora, A.S.; Mourad, K.A. Assessing the Sustainability of Decentralized Wastewater Treatment Systems in Rwanda. Sustainability 2018, 10, 4617. [Google Scholar] [CrossRef]
  5. Shukla, R.; Gupta, D.; Singh, G.; Mishra, V.K. Performance of horizontal flow constructed wetland for secondary treatment of domestic wastewater in a remote tribal area of Central India. Sustain. Environ. Res. 2021, 31, 13. [Google Scholar] [CrossRef]
  6. ElMeligy, A.; Gaber, R.M.; Mostafa, H.; Haron, A.; Ismaeel, W.S.E. Assessment of constructed wetland projects as a multifunction landscape: A case study in Egypt. Sustain. Environ. Res. 2025, 35, 1. [Google Scholar] [CrossRef]
  7. Chauhan, A.; Prajapati, S.K. Role of plant-specific microbial communities and functional genes in wastewater treatment via vertical flow constructed wetlands. J. Environ. Chem. Eng. 2025, 13, 117269. [Google Scholar] [CrossRef]
  8. Monzón-Reyes, B.L.; González-Moreno, H.R.; Month, A.E.Á.; Peralta Vega, A.J.; Ballut-Dajud, G.; Sandoval Herazo, L.C. Wastewater Management Strategies in Rural Communities Using Constructed Wetlands: The Role of Community Participation. Earth 2025, 6, 18. [Google Scholar] [CrossRef]
  9. Zou, D.; Jiang, C.; Fan, Q. Present Situation of World Banana Production and Trade and Its Industrial Prospect. Asian Agric. Res. 2022, 14, 1–6+15. [Google Scholar] [CrossRef]
  10. Ndayambaje, A.; Ngango, J. Predicting banana crop yield in Eastern Rwanda using machine learning models: Insights from agricultural and meteorological data. Cogent Food Agric. 2025, 11, 2578320. [Google Scholar] [CrossRef]
  11. Habimana, V.; Rodríguez, P.P.I.; Ufitinema, J.C.; Okeke, A.I.; Hakkarainen, M.; Nsabimana, A.; Rajarao, G.K. Banana fibres as adsorbents for ammonium and phosphate in slaughterhouse wastewater. Water Res. X 2025, 29, 100451. [Google Scholar] [CrossRef]
  12. Ji, Z.; Tang, W.; Pei, Y. Constructed wetland substrates: A review on development, function mechanisms, and application in contaminants removal. Chemosphere 2022, 286, 131564. [Google Scholar] [CrossRef] [PubMed]
  13. Žepič, V.; Poljanšek, I.; Oven, P.; Škapin, A.S.; Hančič, A. Effect of drying pretreatment on the acetylation of nanofibrillated cellulose. BioRes 2015, 10, 8148–8167. [Google Scholar] [CrossRef]
  14. Stanciu, M.-C.; Tanasă, F.; Teacă, C.-A. Crystallinity Changes in Modified Cellulose Substrates Evidenced by Spectral and X-Ray Diffraction Data. Polysaccharides 2025, 6, 30. [Google Scholar] [CrossRef]
  15. Pereira, L.D.O.; Gama Filho, H.S.; Luiz, L.D.C.; Batista, R.T.; Ferreira, D.S.R.; Gonçalves, E.A.D.S.; Dutra, R.D.S.; Felix, V.D.S.; Freitas, R.P.D.; Pimenta, A.R. Elementary analysis in banana samples using X-Ray Fluorescence. Res. Soc. Dev. 2021, 10, e565101119667. [Google Scholar] [CrossRef]
  16. Ufitinema, J.C.; Habimana, V.; Habimana, E.; Nsabimana, A.; Rajarao, G.K. Characterization and Treatment of Academic Wastewater Using Volcanic-Gravel-Constructed Wetlands: A Study in Rwanda. Water 2025, 17, 3200. [Google Scholar] [CrossRef]
  17. APHA. Standard Methods for the Examination of Water and Wastewater, 24th ed.; APHA: Washington, DC, USA, 2022. [Google Scholar]
  18. Gupta, P.K. Soil, Plant, Water and Fertilizer Analysis, 2nd ed.; Agrobios (India): Jodhpur, India, 2017. [Google Scholar]
  19. Gao, D.; Xu, A.; Zhou, Q.; Gong, X.; Liang, H. New insights into biofilm formation and microbial communities in hybrid constructed wetlands with functional substrates for treating contaminated surface water. Bioresour. Technol. 2025, 416, 131741. [Google Scholar] [CrossRef] [PubMed]
  20. Wang, H.; Xu, Y.; Chai, B. Effect of Temperature on Microorganisms and Nitrogen Removal in a Multi-Stage Surface Flow Constructed Wetland. Water 2023, 15, 1256. [Google Scholar] [CrossRef]
  21. Wu, W.; Mairemu, M.; Zheng, X.; Xiong, Y.; Xu, S.; Jiang, C.; Zhang, X.; Wang, J.; Liu, X.; Zhuang, X. Efficient Pollutant Removal and Low-Carbon Emission Mechanisms in Constructed Wetlands Synergistically Driven by Low COD/N Ratio and Coastal Location. Sustainability 2025, 17, 4168. [Google Scholar] [CrossRef]
  22. Kim, L.; Truong, T.N.; Van Toan, P.; Minh, H.V.T.; Downes, N.K.; Van Ty, T.; Kumar, P.; Meraj, G.; Zhang, F. Optimizing pollutant removal in constructed wetlands: The role of napier grass (Pennisetum purpureum) and honeycomb charcoal slag medium in enhancing domestic wastewater treatment in Vietnam. Wetl. Ecol. Manag. 2025, 33, 87. [Google Scholar] [CrossRef]
  23. Panwar, R.S.; Makvana, K.S. Reed- Phragmitis Karka based constructed wetland for the treatment of domestic wastewater in Ujjain city of central India. Int. J. Sci. Res. Biol. Sci. 2017, 4, 1–5. [Google Scholar] [CrossRef][Green Version]
  24. Parde, D.; Patwa, A.; Shukla, A.; Vijay, R.; Killedar, D.J.; Kumar, R. A review of constructed wetland on type, treatment and technology of wastewater. Environ. Technol. Innov. 2021, 21, 101261. [Google Scholar] [CrossRef]
  25. Wang, L.; Ma, L.; Wang, J.; Zhao, X.; Jing, Y.; Liu, C.; Xiao, Y.; Li, C.; Jiao, C.; Xu, M. Research Progress on the Removal of Contaminants from Wastewater by Constructed Wetland Substrate: A Review. Water 2024, 16, 1848. [Google Scholar] [CrossRef]
  26. Pandey, D.; Singh, S.V.; Savio, N.; Bhutto, J.K.; Srivastava, R.K.; Yadav, K.K.; Sharma, R.; Nandipamu, T.M.K.; Sarkar, B. Biochar application in constructed wetlands for wastewater treatment: A critical review. J. Water Process Eng. 2025, 69, 106713. [Google Scholar] [CrossRef]
  27. Okabe, S.; Nakamura, Y.; Satoh, H. Community Structure and In Situ Activity of Nitrifying Bacteria in Phragmites Root-Associated Biofilms. Microb. Environ. 2012, 27, 242–249. [Google Scholar] [CrossRef] [PubMed]
  28. Angassa, K.; Leta, S.; Mulat, W.; Kloos, H.; Meers, E. Organic Matter and Nutrient Removal Performance of Horizontal Subsurface Flow Constructed Wetlands Planted with Phragmite karka and Vetiveria zizanioide for Treating Municipal Wastewater. Environ. Process. 2018, 5, 115–130. [Google Scholar] [CrossRef]
  29. Zahui, F.M.; Ouattara, J.-M.P.; Kamagaté, M.; Coulibaly, L.; Stefanakis, A.I. Effect of Plant Species on the Performance and Bacteria Density Profile in Vertical Flow Constructed Wetlands for Domestic Wastewater Treatment in a Tropical Climate. Water 2021, 13, 3485. [Google Scholar] [CrossRef]
  30. Ujang, F.A.; Osman, N.A.; Idris, J.; Halmi, M.I.E.; Hassan, M.A.; Roslan, A.M. Start-up treatment of palm oil mill effluent (POME) final discharge using Napier Grass in wetland system. IOP Conf. Ser. Mater. Sci. Eng. 2018, 368, 012008. [Google Scholar] [CrossRef]
  31. Vymazal, J. Nitrogen removal in constructed wetlands. Curr. Opin. Environ. Sci. Health 2025, 48, 100668. [Google Scholar] [CrossRef]
  32. Ruan, W.; Cai, H.; Xu, X.; Man, Y.; Wang, R.; Tai, Y.; Chen, Z.; Vymazal, J.; Chen, J.; Yang, Y.; et al. Efficiency and plant indication of nitrogen and phosphorus removal in constructed wetlands: A field-scale study in a frost-free area. Sci. Total Environ. 2021, 799, 149301. [Google Scholar] [CrossRef] [PubMed]
  33. Rycewicz-Borecki, M.; McLean, J.E.; Dupont, R.R. Nitrogen and phosphorus mass balance, retention and uptake in six plant species grown in stormwater bioretention microcosms. Ecol. Eng. 2017, 99, 409–416. [Google Scholar] [CrossRef]
  34. Qadiri, R.Z.Z.; Gani, K.M.; Zaid, A.; Aalam, T.; Kazmi, A.A.; Khalil, N. Comparative evaluation of the macrophytes in the constructed wetlands for the treatment of combined wastewater (greywater and septic tank effluent) in a sub-tropical region. Environ. Chall. 2021, 5, 100265. [Google Scholar] [CrossRef]
  35. Angassa, K.; Leta, S.; Mulat, W.; Kloos, H.; Meers, E. Evaluation of Pilot-Scale Constructed Wetlands with Phragmites karka for Phytoremediation of Municipal Wastewater and Biomass Production in Ethiopia. Environ. Process. 2019, 6, 65–84. [Google Scholar] [CrossRef]
  36. Fatim Traoré, N.; Pétémanagnan Ouattara, J.-M.; Michaël Zahui, F.; Cyrille Beda, A.J.; Messou, A. Assessment of secondary metabolites in Pennisetum purpureum planted into constructed wetlands using shale and laterite as substrate for wastewater treatment. Heliyon 2024, 10, e33284. [Google Scholar] [CrossRef] [PubMed]
  37. Xu, Q.; Hunag, Z.; Wang, X.; Cui, L. Pennisetum sinese Roxb and Pennisetum purpureum Schum. as vertical-flow constructed wetland vegetation for removal of N and P from domestic sewage. Ecol. Eng. 2015, 83, 120–124. [Google Scholar] [CrossRef]
  38. Umunezero, O.; Gachuiri, C.K.; Mutimura, M. Energy, protein, dry matter, and water gap analysis in dairy cows kept under cut and carry fodder-based feeding systems. Anim.-Open Space 2025, 4, 100097. [Google Scholar] [CrossRef]
  39. Government of Rwanfa; UNDP. Hydroponics Cost Benefit Analysis Report; UNDP: New York, NY, USA, 2025. Available online: https://www.undp.org/sites/g/files/zskgke326/files/2025-10/hydroponics_cost_benefit_analysis_final_report_3_1.pdf# (accessed on 15 July 2026).
  40. Rasool, S.; Rasool, T.; Gani, K.M. Unlocking the potential of wetland biomass: Treatment approaches and sustainable resource management for enhanced utilization. Bioresour. Technol. Rep. 2023, 23, 101553. [Google Scholar] [CrossRef]
  41. Avellán, T.; Gremillion, P. Constructed wetlands for resource recovery in developing countries. Renew. Sustain. Energy Rev. 2019, 99, 42–57. [Google Scholar] [CrossRef]
  42. FAO. Inorganic Fertilizers—2002–2023; FAOSTAT Analytical Briefs, No. 108; FAO: Rome, Italy, 2025. [Google Scholar] [CrossRef]
  43. Kumari, S.; Dong, Y.; Safferman, S.I. Phosphorus adsorption and recovery from waste streams using biochar: Review of mechanisms, modifications, and agricultural applications. Appl. Water Sci. 2025, 15, 162. [Google Scholar] [CrossRef]
  44. Loh, Z.Z.; Zaidi, N.S.; Syafiuddin, A.; Yong, E.L.; Boopathy, R.; Hong Kueh, A.B.; Prastyo, D.D. Shifting from Conventional to Organic Filter Media in Wastewater Biofiltration Treatment: A Review. Appl. Sci. 2021, 11, 8650. [Google Scholar] [CrossRef]
  45. Priya, E.; Kumar, S.; Verma, C.; Sarkar, S.; Maji, P.K. A comprehensive review on technological advances of adsorption for removing nitrate and phosphate from waste water. J. Water Process Eng. 2022, 49, 103159. [Google Scholar] [CrossRef]
  46. Karthikeyan, P.; Vigneshwaran, S.; Meenakshi, S. Removal of phosphate and nitrate ions from water by amine crosslinked magnetic banana bract activated carbon and its physicochemical performance. Environ. Nanotechnol. Monit. Manag. 2020, 13, 100294. [Google Scholar] [CrossRef]
  47. Suhani, N.; Radin Mohamed, R.M.S.; Abdul Latiff, A.A.; Nasir, N.; Ahmad, B.; Oyekanmi, A.A.; Awang, H.; Daud, Z. Removal of COD and ammoniacal nitrogen by banana trunk fiber with chitosan adsorbent. Mal. J. Fund. Appl. Sci. 2020, 16, 243–247. [Google Scholar] [CrossRef]
  48. World Health Organization. Guidelines for the Safe Use of Wastewater, Excreta and Greywater in Agriculture and Aquaculture. 2006. Available online: https://iris.who.int/handle/10665/78265 (accessed on 15 July 2026).
  49. Yang, Z.; Zou, Y.; Zhu, X.; Yu, X. Promoting Aquatic Health in Constructed Wetlands: Removal of Pathogens and Nitrogen. Water 2024, 16, 917. [Google Scholar] [CrossRef]
  50. Thandavamoorthy, R.; Devarajan, Y.; Kaliappan, N. Antimicrobial, function, and crystalline analysis on the cellulose fibre extracted from the banana tree trunks. Sci. Rep. 2023, 13, 15301. [Google Scholar] [CrossRef] [PubMed]
  51. Drechsel, P.; Marjani Zadeh, S.; Salcedo, F.P. Water Quality in Agriculture: Risks and Risk Mitigation; FAO: Rome, Italy; IWMI: Colombo, Sri Lanka, 2023. [Google Scholar] [CrossRef]
  52. ICS 13.060.30; Wastewater Discharged on Land and Into Water Bodies—Specification. Rwanda Bureau of Standards: Kigali, Rwanda, 2023.
  53. Directive (EU) 2024/3019 of the European Parliament and of the Council of 27 November 2024 Concerning Urban Wastewater Treatment (Recast) (Text with EEA Relevance). Official Journal of the European Union, L, 2024/3019. 2024. Available online: https://eur-lex.europa.eu/eli/dir/2024/3019/oj (accessed on 15 July 2026).
  54. Bebba, A.A.; Labed, I.; Zeghdi, S.; Messaitfa, A. Purification Performance of Typha Latifolia, Juncus Effusus and Papyrus Cyperus in Arid Climate: Influence of Seasonal Variation. J. Water Chem. Technol. 2019, 41, 396–401. [Google Scholar] [CrossRef]
  55. Gkika, D.; Gikas, G.D.; Tsihrintzis, V.A. Construction and operation costs of constructed wetlands treating wastewater. Water Sci. Technol. 2014, 70, 803–810. [Google Scholar] [CrossRef] [PubMed]
Figure 1. Schematic representation of the constructed wetland unit and banana fibre filter. (A) Wastewater storage tank. (B) Horizontal-flow subsurface constructed wetland unit. (C) Banana fibre filter unit. Coarse banana fibres: Large-sized fibres that retain their fibrous strand structure.
Environments 13 00406 g001
Figure 2. FTIR spectra and XRD pattern of banana fibre. The FTIR spectra show characteristic vibrational bands corresponding to functional groups present in cellulose-based biomass. The labels represent O–H (hydroxyl stretching), C–Hs (C–H stretching vibrations), C=O (carbonyl groups), C=C (aromatic bonds), CH2d (CH2 deformation), C–O-Cc (C–O–C stretching in crystalline cellulose regions), C–O-Ca (C–O–C stretching in amorphous cellulose regions), C–O (general ether/alcohol groups). The XRD pattern highlights the structural organization of banana fibre cellulose. The amorphous region (12–18° 2θ) corresponds to disordered cellulose, hemicellulose, and lignin contributions, while the crystalline region (18–30° 2θ) corresponds to ordered cellulose I microfibrils.
Environments 13 00406 g002
Figure 3. Removal trends for COD (a), Ammonium (b), Nitrate (c), and Phosphorus (d). The system operated continuously for four months at a 4-day HRT. CW_CL denotes the unit planted with Cyperus latifolius, CW_JE with Juncus effusus, CW_PM with Phragmites mauritianus, CW_PP with Pennisetum purpureum, and CWC the unplanted control unit.
Environments 13 00406 g003
Figure 4. Advanced treatment of constructed wetland effluents using a banana fibre filter. Effluents from planted CW units served as inlets to the respective banana fibre filters. The filters operated for two months at a flow rate of 6.5 L per day and HRT of 5 h. Inlet: CW effluent. Outlet: banana fibre filter effluent. CW_CL: unit planted with Cyperus latifolius. CW_JE: unit planted with Juncus effusus. CW_PM: unit planted with Phragmites mauritianus. CW_PP: unit planted with Pennisetum purpureum.
Environments 13 00406 g004
Figure 5. Log reductions for indicator and pathogenic bacteria in the treatment system. Bars represent microbial removal achieved in the constructed wetland (CW), filtration unit, and overall system performance. Absence of the blue bar indicates complete microbial removal in the wetland prior to banana fibre filtration. CW_CL denotes the unit planted with Cyperus latifolius, CW_JE with Juncus effusus, CW_PM with Phragmites mauritianus, and CW_PP with Pennisetum purpureum.
Environments 13 00406 g005
Figure 6. Overall treatment system performance for nutrient and organic matter. Bars represent mean values, and error bars indicate standard deviations. The dashed orange line indicates the FAO irrigation guideline limits [51]. For reference, Rwanda discharge limits are 5 mg/L for ammonium, 10 mg/L for nitrate, 5 mg/L for phosphorus, and 100 mg/L for COD [52]; EU discharge limits are 8–10 mg/L total nitrogen, 0.5–0.7 mg/L for phosphorus, and 125 mg/L for COD [53]. CW_CL denotes the unit planted with Cyperus latifolius, CW_JE with Juncus effusus, CW_PM with Phragmites mauritianus, and CW_PP with Pennisetum purpureum.
Environments 13 00406 g006
Table 1. Inlet wastewater quality parameters measured over the 4-month treatment period, prior to constructed wetland treatment.
ParametersAverage ± SD
pH7.9–8.4 (range)
Temperature (°C)23.4 ± 0.4
Total dissolved solids (TDS mg/L)1135 ± 125
Total suspended solids (TSS mg/L)804 ± 60
Chemical oxygen demand (COD mg/L)614.7 ± 22.3
Ammonium (NH4+-N mg/L)23.95 ± 5.1
Nitrate (NO3-N mg/L)13.6 ± 2.6
Phosphorus (PO43−-P mg/L)34.6 ± 5.3
Fecal coliforms (CFU/100 mL)(4.7 ± 0.7) × 108
Escherichia coli (CFU/100 mL)(2.7 ± 0.4) × 108
Salmonella spp. (CFU/100 mL)(2.6 ± 0.9) × 103
Shigella spp. (CFU/100 mL)(2.6 ± 0.6) × 104
Table 2. Chemical composition (wt%) of river sand and volcanic gravel substrates, determined by X-ray fluorescence (XRF) spectroscopy.
OxidesComposition (%)
River SandVolcanic Gravel
SiO277.5154.19
Al2O38.9218.68
Fe2O32.099.49
CaO2.877.12
K2O6.476.43
P2O51.030.90
TiO20.382.20
SO30.310.13
Cl0.170.03
V2O50.040.01
BaO0.040.21
Rb2O0.040.03
MnO0.100.19
SrO0.020.23
ZrO2-0.08
Nb2O5-0.03
ZnO-0.02
Ta2O5 0.01
Bi2O3 0.01
Table 3. Wetland plant growth and nutrient uptake.
Plant SpeciesTissuesAverage Wet
Weight (g)
Average Dry
Weight (g)
Dry Matter
Production (kg/m2)
TN Content
(g/m2)
TP Content
(g/m2)
Pennisetum purpureumBelowground40.760.7742.8
Aboveground43010012.8274.414.4
Phragmites mauritianusBelowground4870.964.81.7
Aboveground160405.4818.39.3
Cyperus latifoliusBelowground69162.245.717.7
Aboveground10058.58.1325.568.8
Juncus effususBelowground7120.31.543.57.5
Aboveground26768.95.2215.893.1
Table 4. Comparison of treatment performance of the present study with selected constructed wetland systems using similar plant species.
SystemWastewaterSubstratePlant SpeciesInlet (mg/L)Performance (%)Reference
Pilot-scale VF (0.16 m2 × 0.6 m)DomesticLateritePennisetum
purpureum
COD (481.3), TKN (143.6), TP (11.8)COD (76.9), TKN (55.5), TP (58.4)[36]
Pilot-scale VF (40.5 × 57.5 × 38.5 cm)Palm oil mill
effluent
Gravel + SandPennisetum
purpureum
COD (308.5–957.3)
NH4+-N (3.7–14.3)
COD (62.2 ± 14.3), NH4+-N (62.3 ± 24.8)[30]
Pilot-scale HF (3.5 × 1 × 0.6 m)MunicipalGravelPhragmites karkaCOD (480), TN (88), TP (44)COD (90.4), TN (86.8), TP (88.5)[35]
Full-scale HSSF 900 m2DomesticGravelPhragmites karkaCOD (122.8), TKN (26), NH4+-N (14.3)COD (78.64), TKN (69.53), NH4+-N (69.2)[23]
Pilot-scale VF (130 L barrels)DomesticGravel and SandTypha latifolia, Juncus effusus, Cyperus papyrusCOD (410), NO3-N (27), PO43−-P (47)COD (89), NO3-N: 94%; PO43−-P (95)[54]
Box-type HF (46 × 32 × 27 cm)(Lab + dormitories)Volcanic gravelJuncus effusus, Cyperus latifoliusCOD 573.7 NH4+-N (25.8), NO3-N (16.5) PO43−-P (44.1)COD (78–81) NH4+-N (76.6–86.8) NO3-N, (83.5–90.2) PO43−-P (>90)[16]
Bench-scale HF (55 × 40 × 31 cm)(Lab + dormitories)Volcanic gravel + SandC. latifolius,
J. effusus,
P. mauritianus,
P. purpureum
COD (614), NH4+-N (24) NO3-N, (13.6)
PO43−-P (34)
COD (78–83), NH4+-N (74–83) NO3-N, (78–85) PO43−-P (86–91)This study (CW alone)
Bench-scale HF (55 × 40 × 31 cm)(Lab + dormitories)Volcanic gravel + SandC. latifolius,
J. effusus,
P. mauritianus,
P. purpureum
COD (614), NH4+-N (24) NO3-N, (13.6)
PO43−-P (34)
COD (82–87), NH4+-N (93–96) NO3-N, (81–88) PO43−-P (94–96)This study (CW + banana fibre filter)
Note: NH4+-N removal in the CW + banana fibre filter system (93–96%) was consistently higher than in the CW-alone (74–83%) and than in the comparative studies listed above, indicating that the banana fibre filter provided the greatest enhancement for ammonium removal among the measured parameters. COD: chemical oxygen demand; TKN: total Kjeldahl nitrogen; TN: total nitrogen; TP: total phosphorus; NH4+-N: ammonium nitrogen; NO3-N: nitrate nitrogen; PO43−-P: phosphate phosphorus; VF: vertical-flow; HF: horizontal-flow; CW: constructed wetland.
Disclaimer/Publisher’s Note: The statements, opinions and data contained in all publications are solely those of the individual author(s) and contributor(s) and not of MDPI and/or the editor(s). MDPI and/or the editor(s) disclaim responsibility for any injury to people or property resulting from any ideas, methods, instructions or products referred to in the content.