


Abstract
The dewatering of cyanobacteria-laden sludge remains a challenge. Extracellular polymeric substances (EPS) mainly consist of polysaccharides and proteins, which form a stable gel network with water through hydrogen bonding and other interactions. To address this bottleneck, a low-voltage (5 V) electrochlorination system was constructed, employing a Ti/IrO2/RuO2 electrode as the anode, iron as the cathode, and calcium chloride dihydrate (CaCl2·2H2O) as the electrolyte. The results showed that the active chlorine generated during electrolysis degraded the highly water-retentive loosely bound EPS (LB-EPS) and tightly bound EPS (TB-EPS), converting them into low-viscosity, easily removable soluble EPS (S-EPS). Moreover, the total contents of polysaccharides and proteins in EPS decreased. Three-dimensional excitation-emission matrix fluorescence spectroscopy revealed that in the EPS of the algal sludge, the relative proportion of humic-like substances increased, while that of protein-like products decreased. At a CaCl2·2H2O dosage of 1 g/L, the dewatering performance of the algal sludge was significantly improved: the capillary suction time (CST) of the algal suspension decreased from 10.30 ± 0.1 s to 4.1 ± 0.05 s, the proportion of bound water decreased from 43.5% to 9.8%, and the cake solids content increased to 9.48%. The residual water quality of this process was also favorable, with total phosphorus (TP) and total nitrogen (TN) concentrations stabilized at 0.166 ± 0.040 mg/L and 9.0 ± 1.1 mg/L, respectively. Therefore, this study provides an efficient, low-energy electrochemical pretreatment strategy to overcome the dewatering bottleneck in cyanobacteria-laden sludge, thereby reducing the treatment load and cost of downstream mechanical dewatering.
1. Introduction
Cyanobacterial blooms represent a critical global challenge in aquatic ecosystems, posing multidimensional risks to ecological stability, drinking water safety, and sustainable water resource management [1]. In China, over 60% of lakes are eutrophic, with severe blooms frequently occurring in key water bodies such as Tai Lake, where dense cyanobacterial mats inhibit light penetration, leading to large-scale loss of submerged vegetation and ecosystem degradation [2,3]. The traditional management strategy mainly relies on collecting algae-rich water and dewatering sludge, but the dewatering process poses significant challenges [4]. Because the gel-like matrix formed by extracellular polymeric substances (EPS) strongly binds water through hydrogen bonding and electrostatic interactions, a stable, high-water-holding structure is formed [5], rendering the conventional dehydration method inefficient.
Currently, cyanobacterial dehydration methods are mainly divided into mechanical dewatering techniques and chemical conditioning technologies [6]. Mechanical approaches, such as centrifugation, employ physical force to remove water without altering biomass chemistry, reducing cake moisture to 85% [7]. However, its ability to break down the EPS colloidal barrier of Microcystis aeruginosa is limited, and it cannot effectively disrupt the hydrogen bond network formed between EPS and bound water. The water release rate of bound cells is limited, which is only kept below 30% [8]. Moreover, the mechanical dewatering process damages algal cell structure, leading to a large release of intracellular substances, such as microcystin, and making subsequent treatment more difficult. Chemical conditioning improves algal aggregation and sedimentation by adding flocculants that neutralize surface charges and destabilize colloids. Common inorganic salt flocculants, such as aluminum salts (e.g., alum) and ferric salts (e.g., ferric chloride), function primarily through charge neutralization. However, it has drawbacks, including the need for high doses and the risk of secondary pollution [9]. Moreover, excessive iron salts (15~45 ppm) can increase the rate of algal cell disruption to 68%, leading to microcystin release of up to 2.3 μg/L [10]. Although bio-flocculants offer environmental benefits, they remain in the research and development phase, facing challenges such as high costs and incompatibility with high-salinity aquatic environments. Crucially, traditional chemical conditioning induces algal aggregation without breaking down the EPS gel structure, resulting in less than a 20% improvement in the efficiency of bound water release [11]. Therefore, the development of new dehydration technology capable of effectively disrupting EPS gel structure is key to solving the problem of cyanobacterial sludge dehydration.
Electrochemical advanced oxidation processes, particularly electrochlorination, have emerged as promising alternatives due to their capability to generate potent oxidants in situ under mild conditions. Electrochlorination has proven effective in inactivating algae and controlling disinfection by-products [12]. In recent years, its potential for sludge conditioning has gained recognition. Studies demonstrate that electrochemically generated active chlorine species (e.g., Cl2, HOCl, ClO−) can oxidize organic components and alter sludge properties [12,13]. However, compared to soluble EPS (S-EPS) and loosely bound EPS (LB-EPS), the more densely structured tightly bound EPS (TB-EPS) generally exhibits greater resistance to various degradation processes. For example, a recent study noted that during an ultraviolet/peracetic acid advanced oxidation process, the degradation efficiency of TB-EPS (~47.5%) was significantly lower than that of S-EPS (~70.5%) and LB-EPS (~57.1%), highlighting the challenge its compact structure poses to degradation [14]. Current research has primarily focused on overall dewatering performance or disinfection efficacy. There is still a lack of systematic and in-depth investigation into: (1) how active chlorine selectively targets and degrades different EPS fractions in cyanobacteria-laden sludge (especially the more recalcitrant TB-EPS); (2) the quantitative relationships between the hierarchical degradation of EPS (S-EPS, LB-EPS, TB-EPS), the subsequent transformation of bound water to free water, and the overall enhancement of dewaterability; and (3) the kinetics of these combined degradation and conversion processes [15]. This knowledge gap hinders the rational design of targeted dewatering strategies by electrochlorination.
To further explore the effect of electrochlorination on the degradation of layered EPS during dehydration, this study employs an electrochlorination approach, using a Ti/IrO2/RuO2 anode and an iron cathode, with calcium chloride dihydrate (CaCl2·2H2O) as the electrolyte at a low voltage (5 V). This is intended to leverage the multifunctional roles of Ca2+ ions. Beyond serving as the chloride source for electrochlorination, Ca2+ ions also function as a flocculating agent, neutralizing the negative surface charges on algal cells and EPS, thereby promoting aggregation, an effect anticipated to synergize with dewatering performance. This study specifically aims to: (1) systematically elucidate the degradation efficiency and transformation pathways of active chlorine toward different EPS fractions (S-EPS, LB-EPS, and TB-EPS) in M. aeruginosa sludge; (2) clarify the intrinsic correlations among EPS degradation, transformation of water forms (e.g., bound water and interstitial water), and enhancement of dewaterability indicators (e.g., capillary suction time and vacuum filtration time); and (3) optimize operational parameters to achieve efficient dewatering while evaluating residual water quality risks, e.g., total phosphorus (TP), total nitrogen (TN), and chemical oxygen demand (COD). Ultimately, this work seeks to provide a low-energy, easily controlled technical strategy to reduce cyanobacterial sludge water volume and improve resource utilization.
2. Methods and Materials
2.1. Cultures and Materials of M. aeruginosa
The M. aeruginosa strain (FACHB-526) used in this study was obtained from the Institute of Aquatic Biology, Chinese Academy of Sciences, and originated from Wuhan East Lake. After receiving the algae, the samples were transferred to BG-11 medium and placed in a light incubator. The cultures were grown at 25 °C with a light intensity of 2000 Lux and a 12 h light:12 h dark cycle for about 2 weeks. The basic physical and chemical properties of the algal liquid are shown in Table S1. The algal solution used in the experiment was in a stable phase and was washed with pure water before use (Figure S1).
2.2. Electrochlorination Reaction Device and Operation
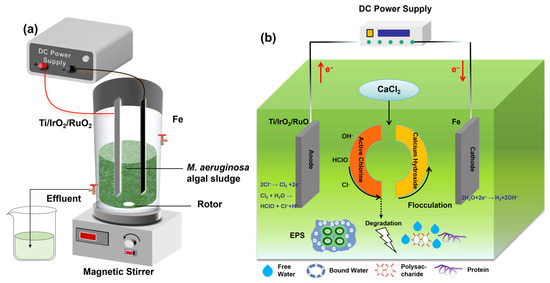
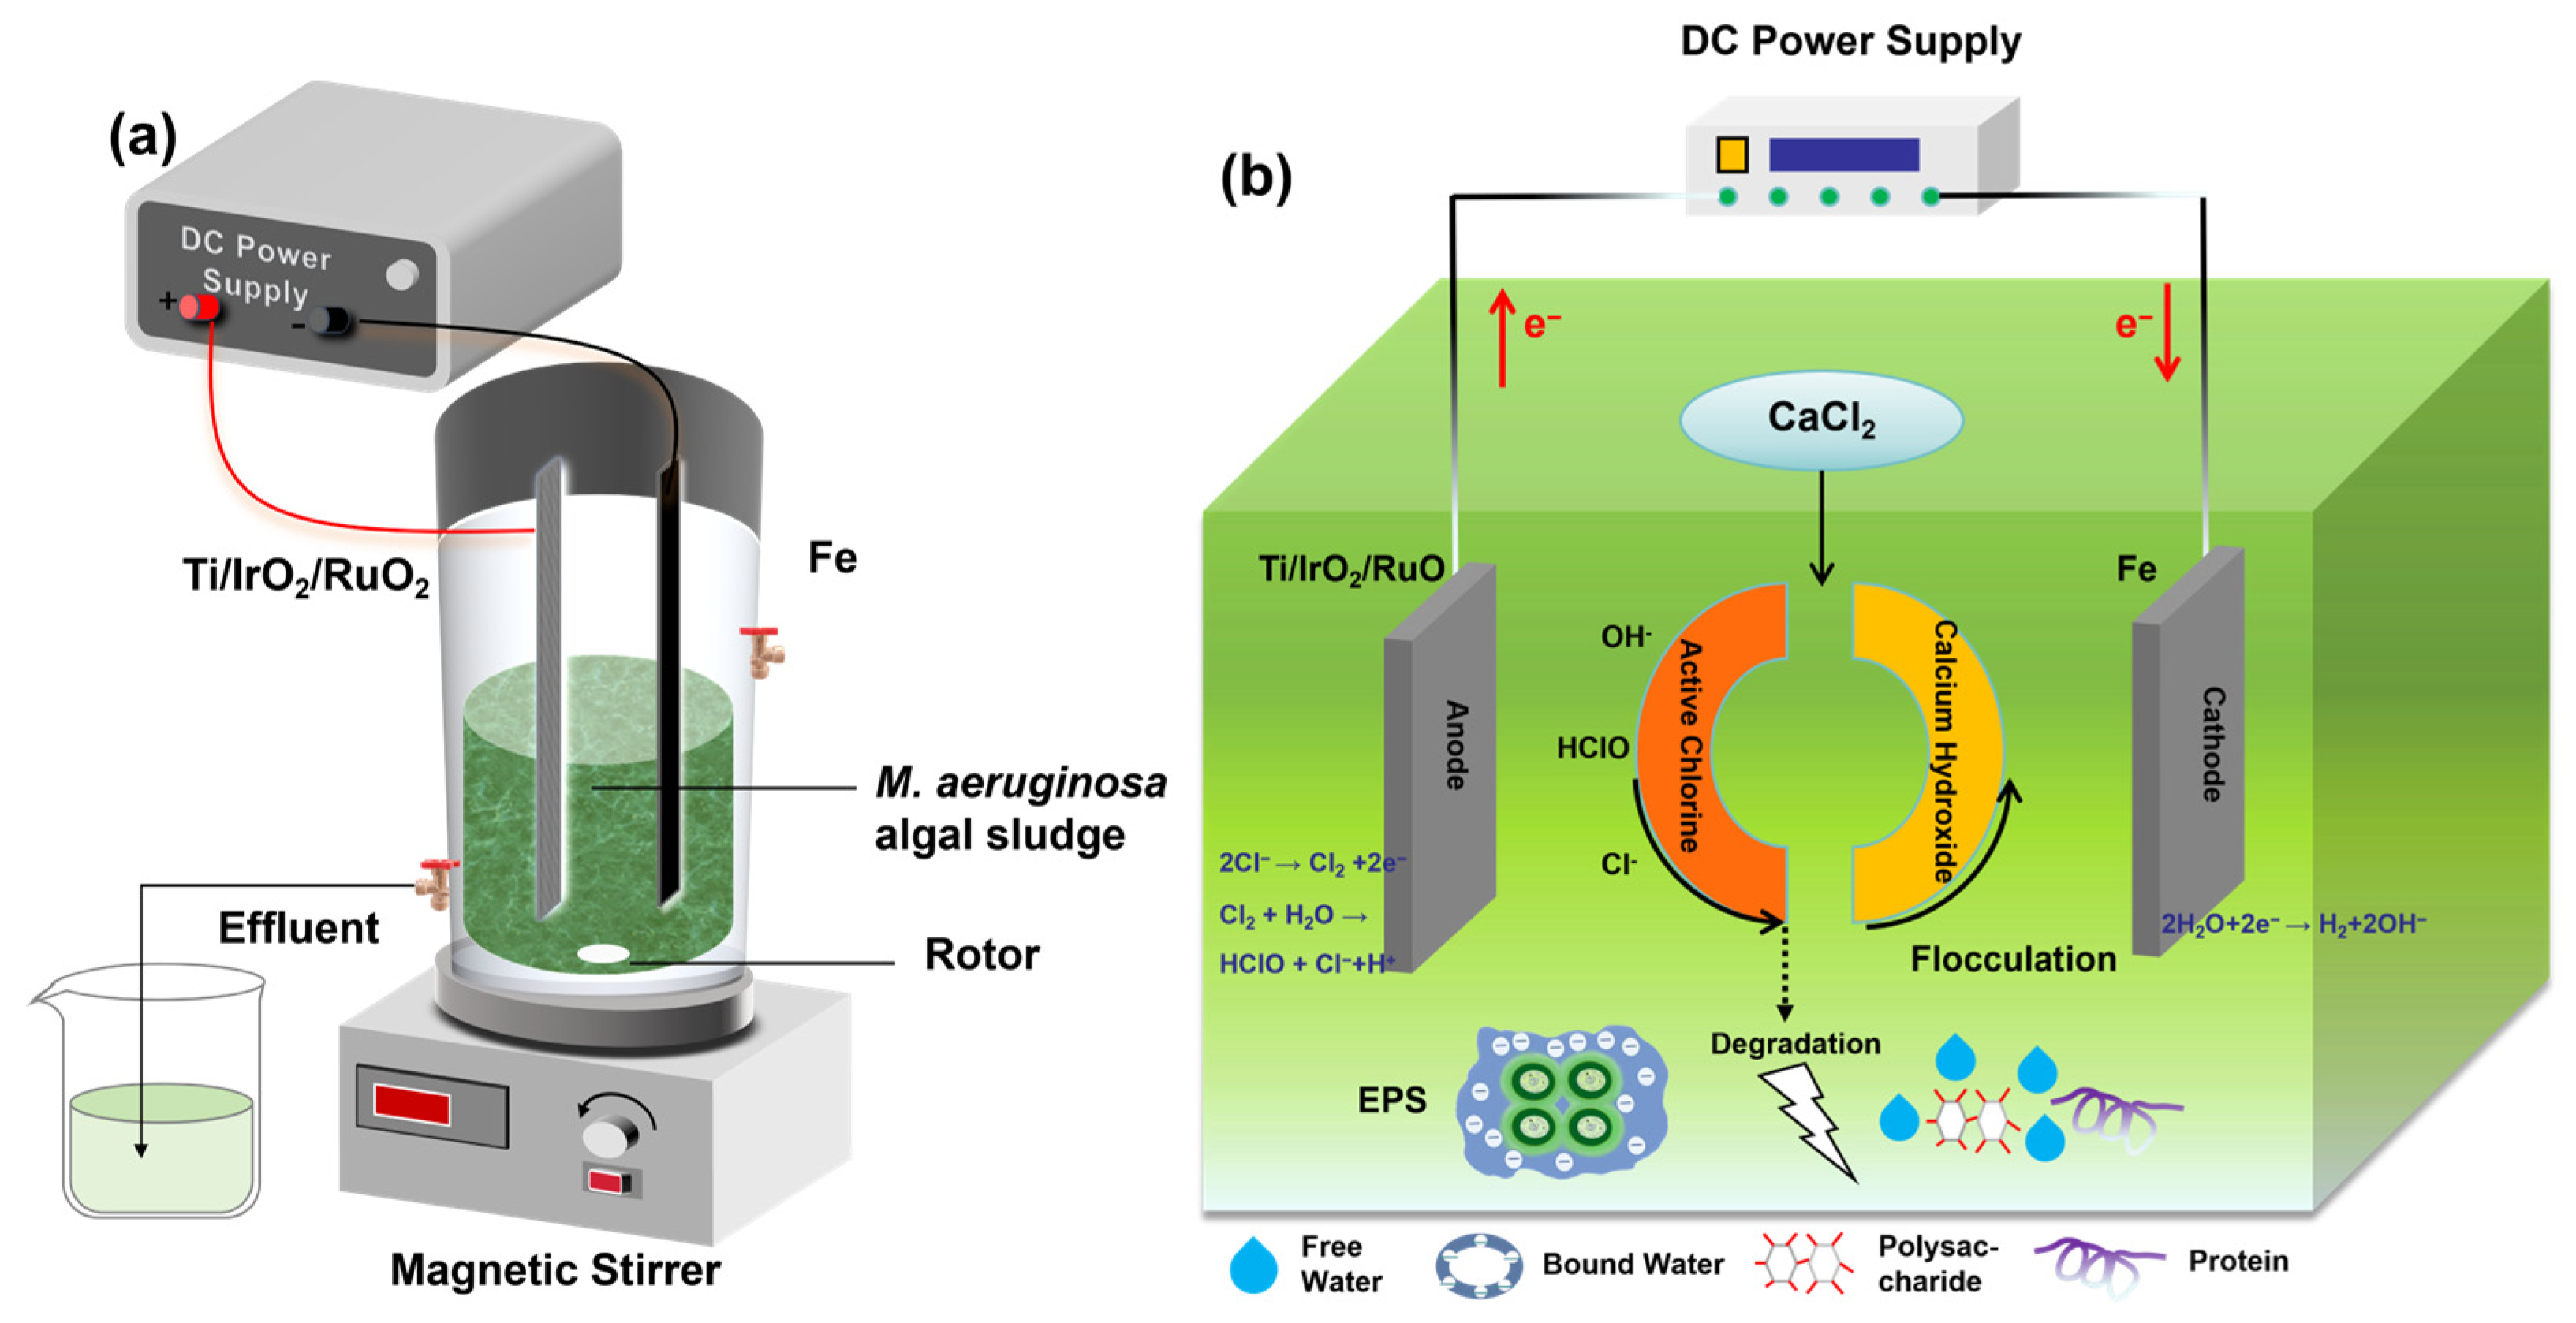
The experimental setup for the electrochlorination system includes a reaction vessel, a magnetic stirrer, a direct current (DC) power supply (MS-305DS, Maisheng, Shenzhen, China), and a mesh pole plate. The reaction vessel was a 500 mL cylindrical vessel. Each iteration of the experiment involved adding 200 mL of M. aeruginosa solution during the stabilization period, at a density of 1.5–2.0 × 10⁷ cells/mL. The anode of the device was a Ti/IrO2/RuO2 mesh; this anode preferentially triggered the chlorine ion oxidation reaction: 2Cl− → Cl2 + 2e−, and the generated Cl2 was rapidly converted into hypochlorous acid (HOCl) in the water. The cathode was composed of pure iron. The effective contact area between the algal liquid and the electrode plates was 16 cm2, and the electrode distance was maintained at 2.0 cm throughout all experiments (Figure 1).
Figure 1.
(a) Diagram of the reaction setup for the experimental M. aeruginosa inactivation by electrochlorination; (b) mechanism of dewatering of electrochlorinated M. aeruginosa suspension.
Four groups investigated the effects of electrochlorination on EPS degradation and dehydration in M. aeruginosa. R1: Raw algal sludge; R2: Calcium chloride system (with 0.6 g/L CaCl2·2H2O added); R3: Electrochemical system (voltage: 5 V); R4: Electrochlorination system (0.6 g/L CaCl2·2H2O, 5 V). Different concentrations of CaCl2·2H2O electrolyte (0.4, 0.6, 0.8, 1.0, and 1.2 g/L) were set to analyze the dehydration effect of electrochlorination on M. aeruginosa-laden sludge.
2.3. EPS Hierarchical Extraction and Analysis
The EPS of the algal sludge was extracted by a thermal extraction method and fractionated into S-EPS, LB-EPS, and TB-EPS. The initial centrifugation of M. aeruginosa-laden sludge samples at 2500× g for 15 min yielded the S-EPS fraction. The residue was then dissolved in a 0.05% NaCl solution, and the mixture was adjusted to the original volume before being subjected to high-speed shearing for two minutes using a cyclone mixer. Afterward, the samples were centrifuged at 5000× g for 15 min. The collected liquid was used to quantify LB-EPS. The harvested algal samples were resuspended in a 0.05% NaCl solution, heated at 60 °C for 30 min, and then centrifuged at 11,000× g for 10 min. The liquid collected during this process was designated as the TB-EPS fraction [11].
The composition and relative content of EPS in different layers were characterized by three-dimensional excitation-emission matrix fluorescence spectrometry (3D-EEM). A fluorescence spectrophotometer (model F-7000, Hitachi, Tokyo, Japan) was utilized for the determination, employing a 1 cm fluorescence cuvette with specific parameters: excitation wavelength 200–450 nm, emission 200–550 nm, excitation slit 5 nm, emission slit 1 nm, photomultiplier voltage 725 V, and scanning rate of 12,000 nm/min. Prior to the determination, an ultrapure water blank control was utilized. By scanning the fluorescence intensity of different excitation/emission wavelengths, the three-dimensional fluorescence spectra were obtained. When combined with the fractional regional integration (FRI) method, the proportions of different components, such as protein-like, humic acid-like, and fulvic acid-like, can be quantitatively determined [16].
EPS and its main components were quantitatively graded using a stepwise chemical method. The content of polysaccharide was determined by the anthrone sulfuric acid method, and the content of protein was determined by the Coomassie brilliant blue G250 method. All measurements were performed in triplicate, and the results were calculated based on the corresponding standard curves [17]. The EPS content (mg/g dry weight of M. aeruginosa sludge) was calculated as the ratio of the measured polysaccharide or protein content (mg) to the dry weight of the algal sludge (g).
The total EPS in the raw algal sludge and the algal sludge samples treated by electrochlorination with 1.0 g/L CaCl2·2H2O were characterized using Fourier Transform Infrared Spectroscopy (FTIR, Thermo Fisher Scientific Nicolet iS20, Waltham, MA, USA). In a dry environment, a small amount of the sample visible to the naked eye and an appropriate quantity of dry potassium bromide powder were placed in a mortar and ground multiple times. The mixture was then transferred to a tablet press and compressed into a transparent thin pellet. During testing, the background spectrum was collected first, followed by the sample’s infrared spectrum. The resolution was set at 4 cm−1, the number of scans was 32, and the wavenumber range tested was 400/600–4000 cm−1.
2.4. Dewaterability Performance Analysis
CST measurements were performed on algal suspensions treated with different methods and on those treated with electrochlorination at different concentrations. CST is typically used as an indicator of cyanobacteria dewaterability. The instrument employed for determination is the Model 304M CST Tester (Triton Electronics, Mansfield, UK). During sample testing, a syringe is used to draw a 7 mL sample, which is then injected into the sample-measuring bucket. The measured value refers to the time it takes for the sample to infiltrate between the two circles on the instrument’s filter paper. To ensure reproducibility, each sludge sample was homogenized by magnetic stirring at 200 rpm for 2 min prior to measurement, and the filter paper was replaced after each measurement.
The water fractions of the raw algal sludge and the algal sludge treated by electrochlorination with 1.0 g/L CaCl2·2H2O were determined. The moisture content of algal cakes was determined using a rapid moisture analyzer (Model: HC-155, Benlong, Shandong, China) at 105 °C and 30% relative humidity. Each sludge sample (approximately 10 g) was evenly placed in a weighing dish, and the sample mass was recorded at 30 s intervals during the drying test until the mass remained constant. After the moisture test was completed, the algal cake samples were heated and dried at 105 °C for 24 h, and the final dry mass was recorded. The drying curve was then converted into a drying rate curve. Based on the slope changes in the drying rate curve and the water fraction classification reported in the literature, the transition points of free water, interstitial water, surface water, and bound water were determined [18]. These thresholds corresponded to the identifiable slope change points in the drying rate curve (Figure S2).
The vacuum filtration time of the algal solution treated by electrochlorination at different concentrations was determined by pipetting 10 mL of the algal solution into a filtration apparatus (GM-0.33A, Jinteng, Tianjin, China), adjusting the pressure to 0.08 MPa, and recording the duration from time zero to the moment when a pressure change was observed as the vacuum filtration time.
The cake solids content of algal sludge treated with electrochlorination at different concentrations was measured to evaluate dewatering efficiency. The solids content (%) was calculated as follows:
where Md is the mass of dried solids (g), and Mw is the initial wet sample mass (g). All measurements were performed in triplicate, and results are expressed as mean ± standard deviation [19].
2.5. Water Quality Analysis
An appropriate volume of the supernatant of algal suspensions treated by electrochlorination at different concentrations, along with a pure water sample spiked with 1.2 g/L CaCl2·2H2O, was filtered through a 0.45 μm membrane filter. Subsequently, the concentration of active chlorine (including chlorine gas, HClO, and ClO−) was determined using the N,N-diethyl-1,4-phenylenediamine (DPD) spectrophotometric method (HJ 586-2010) [20].
The raw algal suspension and the algal suspensions after filtration by electrochlorination at different concentrations were collected separately, and the relevant indicators were determined immediately. COD was determined by the dichromate method (HJ 827-2017) [21]. The determination method for residual chlorine is the same as that for active chlorine. TP was determined by the alkaline potassium persulfate digestion-ultraviolet spectrophotometry method. TN was determined by the potassium persulfate digestion-molybdenum-antimony anti-spectrophotometric method using a spectrophotometer. pH was determined by using a pH meter (HS-3C, Leici, Shanghai, China). The content of humic acid was determined by UV-Vis spectrophotometry based on its absorption intensity at a specific wavelength (254 nm) [22].
2.6. Calculation and Statistical Analysis
Significant differences in changes in CST of algal suspensions following different treatments were analyzed using an independent-samples t-test. The three-dimensional fluorescence spectra of total EPS in algal sludge treated with electrochlorination at different concentrations were divided into five regions based on the excitation (Ex) and emission (Em) wavelength ranges. Some large peaks were split into several distinct parts, and the relative contents were described using MATLAB software (v2025) (100% stacked bar chart). Spearman’s rank correlation analysis was used to evaluate the relationship between the fluorescence intensity ratio of Region V to Region IV (V/IV) from the three-dimensional fluorescence spectra of total EPS in algal sludge and dewatering performance. A p-value < 0.05 was considered statistically significant [16]. The kinetic parameters were obtained by fitting the experimental data to a pseudo-first-order kinetic model: ln(C0/Ct) = kt, where C0 is the initial value of the measured parameter (active chlorine concentration, protein content, polysaccharide content, SCOD, or CST), Ct is the value at time t, and k is the pseudo-first-order rate constant. For active chlorine generation, the concentration increase was fitted using the integrated form of the rate equation. For degradation processes (protein, polysaccharide) and CST reduction, the decrease in the measured parameter was fitted accordingly. Linear regression of ln(C0/Ct) versus t yielded the k values, with all R2 values exceeding 0.95, indicating a good fit to the pseudo-first-order model. The data were all plotted using Origin 2021 software.
3. Results and Discussion
3.1. Effect of Algal Sludge Dewaterability
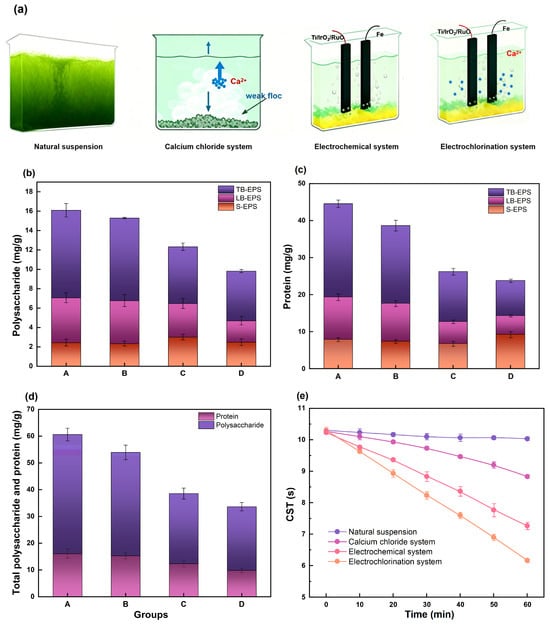
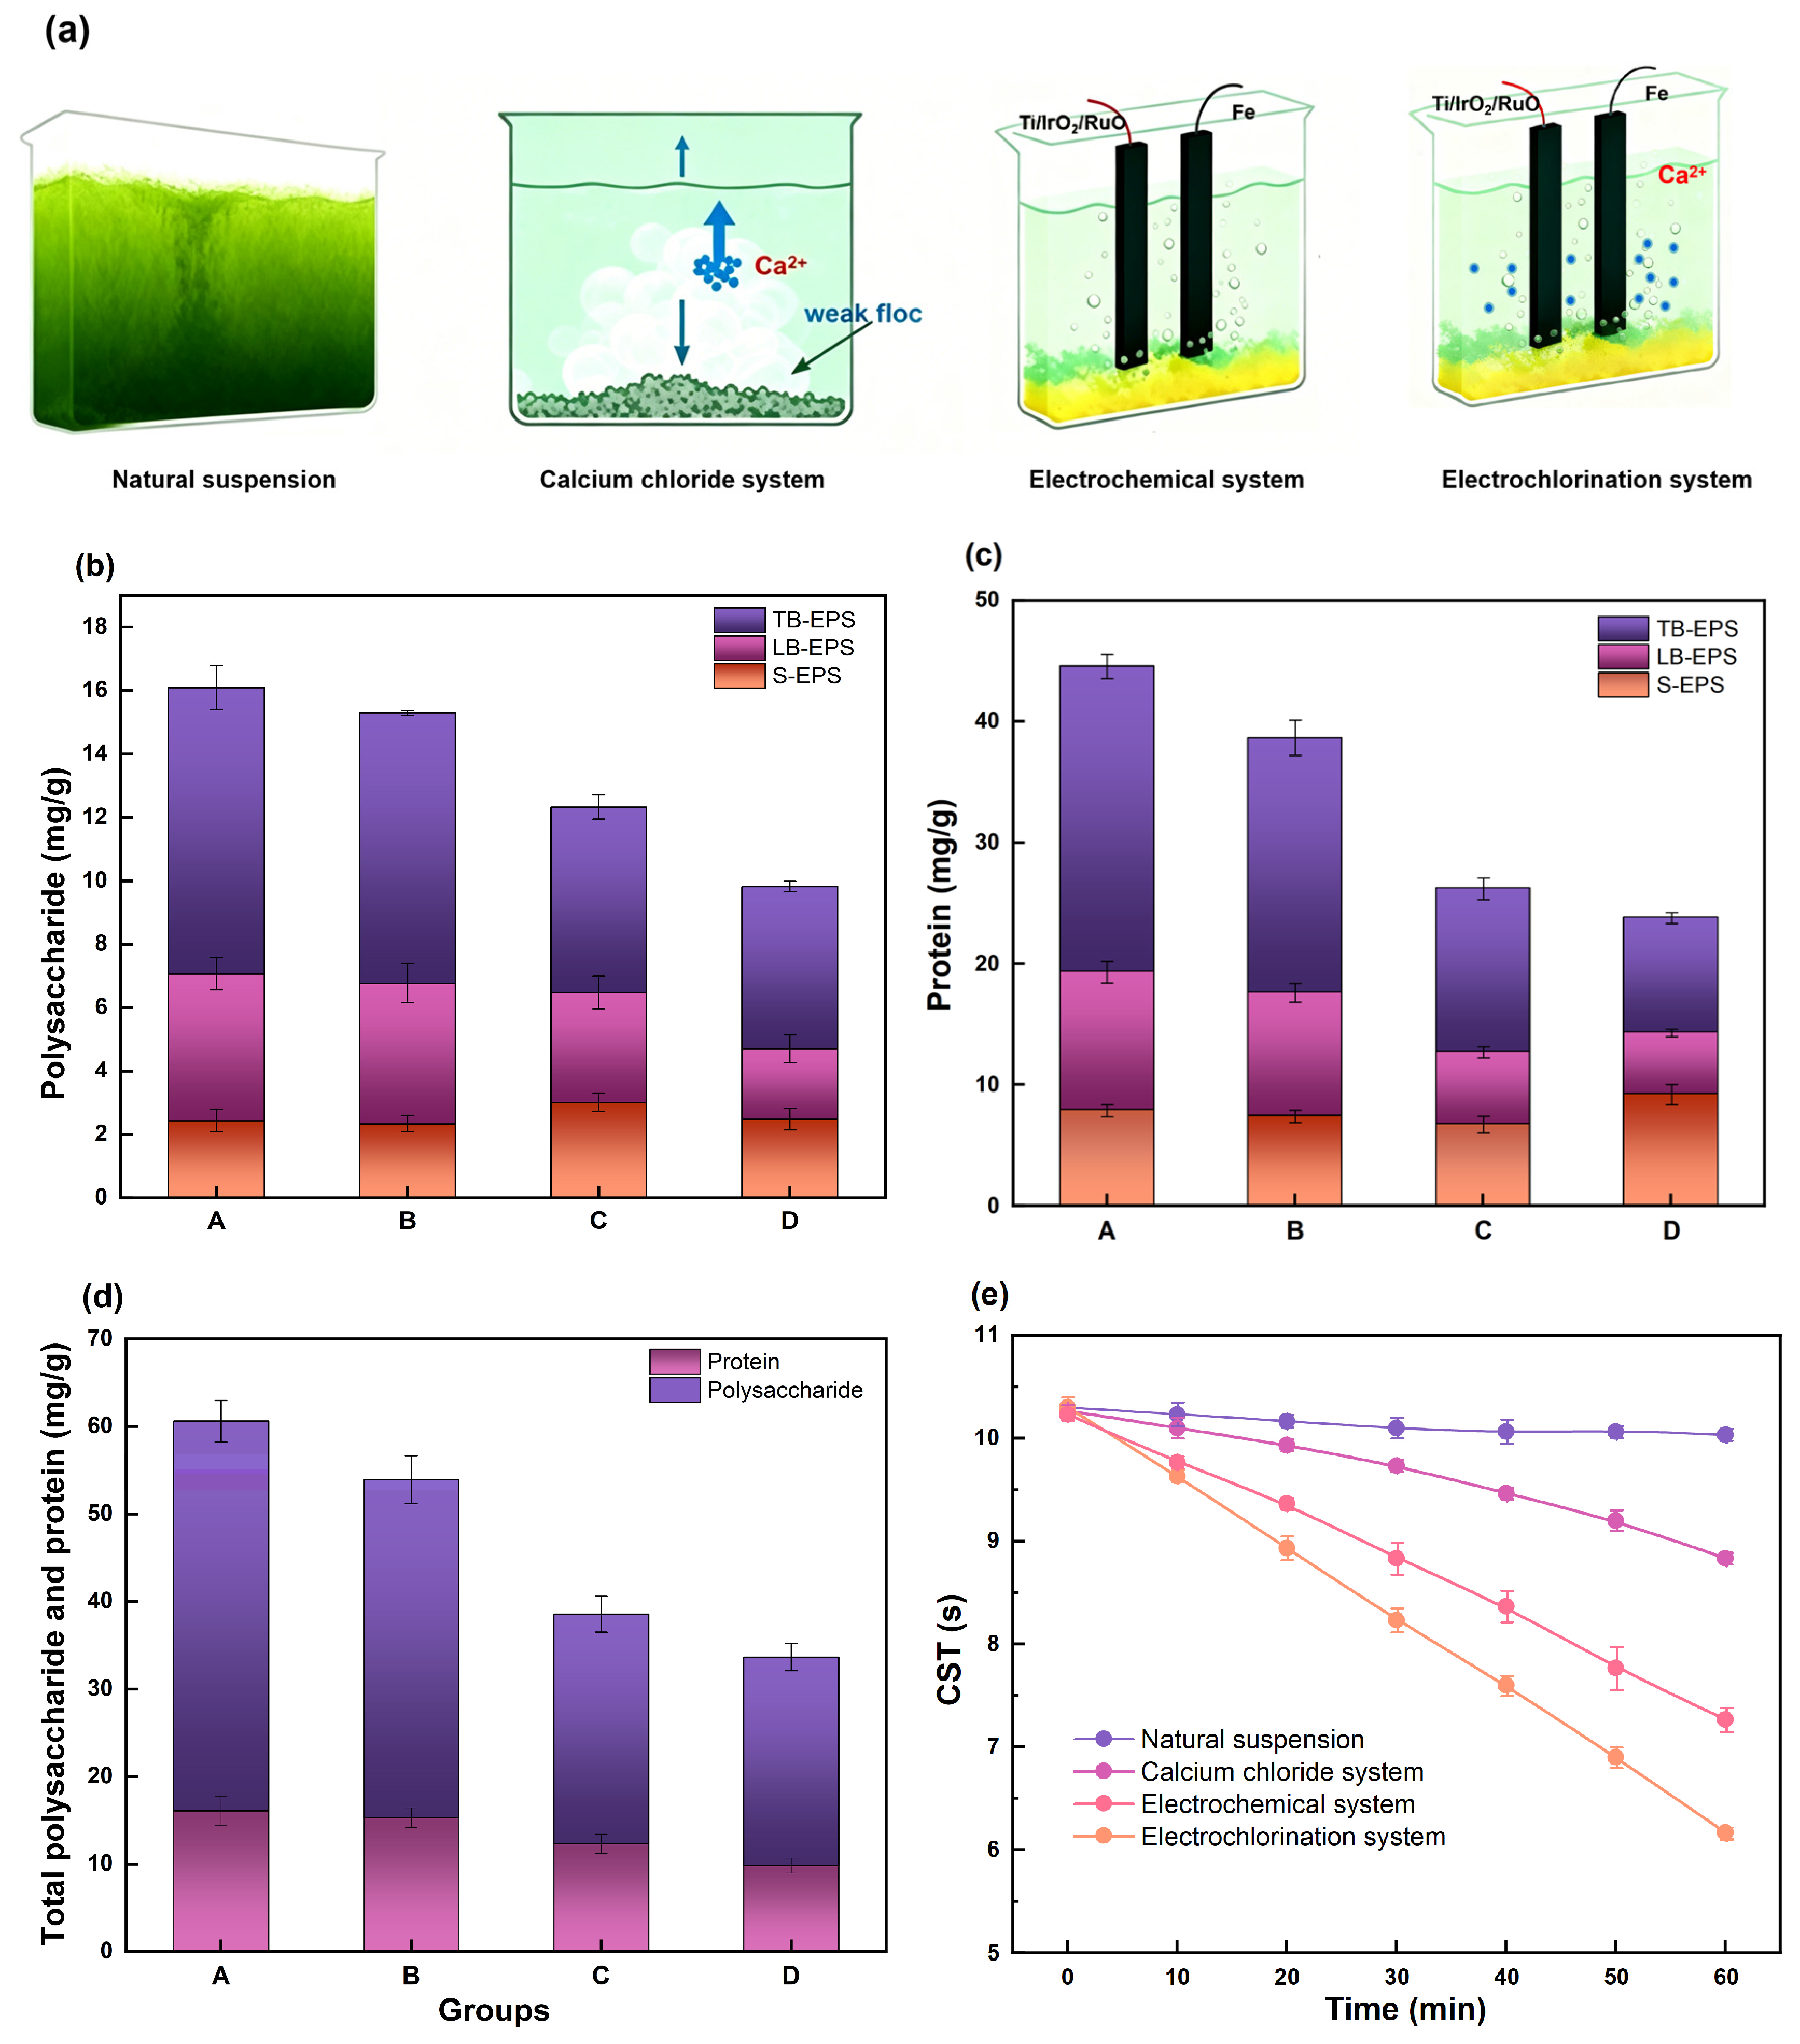
The dewatering performance of algal sludge may be related to EPS properties. The physicochemical properties and spatial distribution of EPS influence the rheological characteristics of algal sludge. In this study, four different groups were set up to compare the changes in EPS during the dewatering process of algal sludge (Figure 2a). As shown in Figure 2d, the total EPS content of the algal sludge decreased from an initial value of 60.59 ± 1.7 mg/g to 33.63 ± 1.2 mg/g after electrochlorination treatment, which was the lowest among all treatment groups. This indicates that the electrochlorination system has a strong oxidizing capacity, enabling the degradation of more EPS in algal sludge and thereby altering its physicochemical properties. As shown in Figure 2b,c, the protein and polysaccharide contents in different EPS layers of the algal sludge changed after treatment with the electrochlorination system. Specifically, the content of proteins and polysaccharides in S-EPS reached 9.25 ± 0.8 mg/g and 2.48 ± 0.3 mg/g, respectively (Figure 2d), which were higher than those in the calcium chloride-only treatment group (0.6 g/L). However, the protein and polysaccharide contents in TB-EPS and LB-EPS both decreased. Data analysis indicated that electrochlorination treatment altered the distribution of EPS layers in algal sludge, promoting the transformation of TB-EPS and LB-EPS into S-EPS and thereby changing its hierarchical structure. A study by Chen [22] et al. showed that a similar change pattern of EPS in electro-Fenton treatment improved the dewatering performance of sludge.
Figure 2.
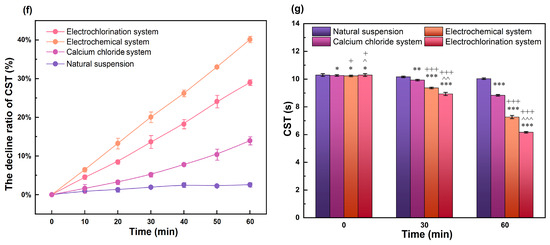
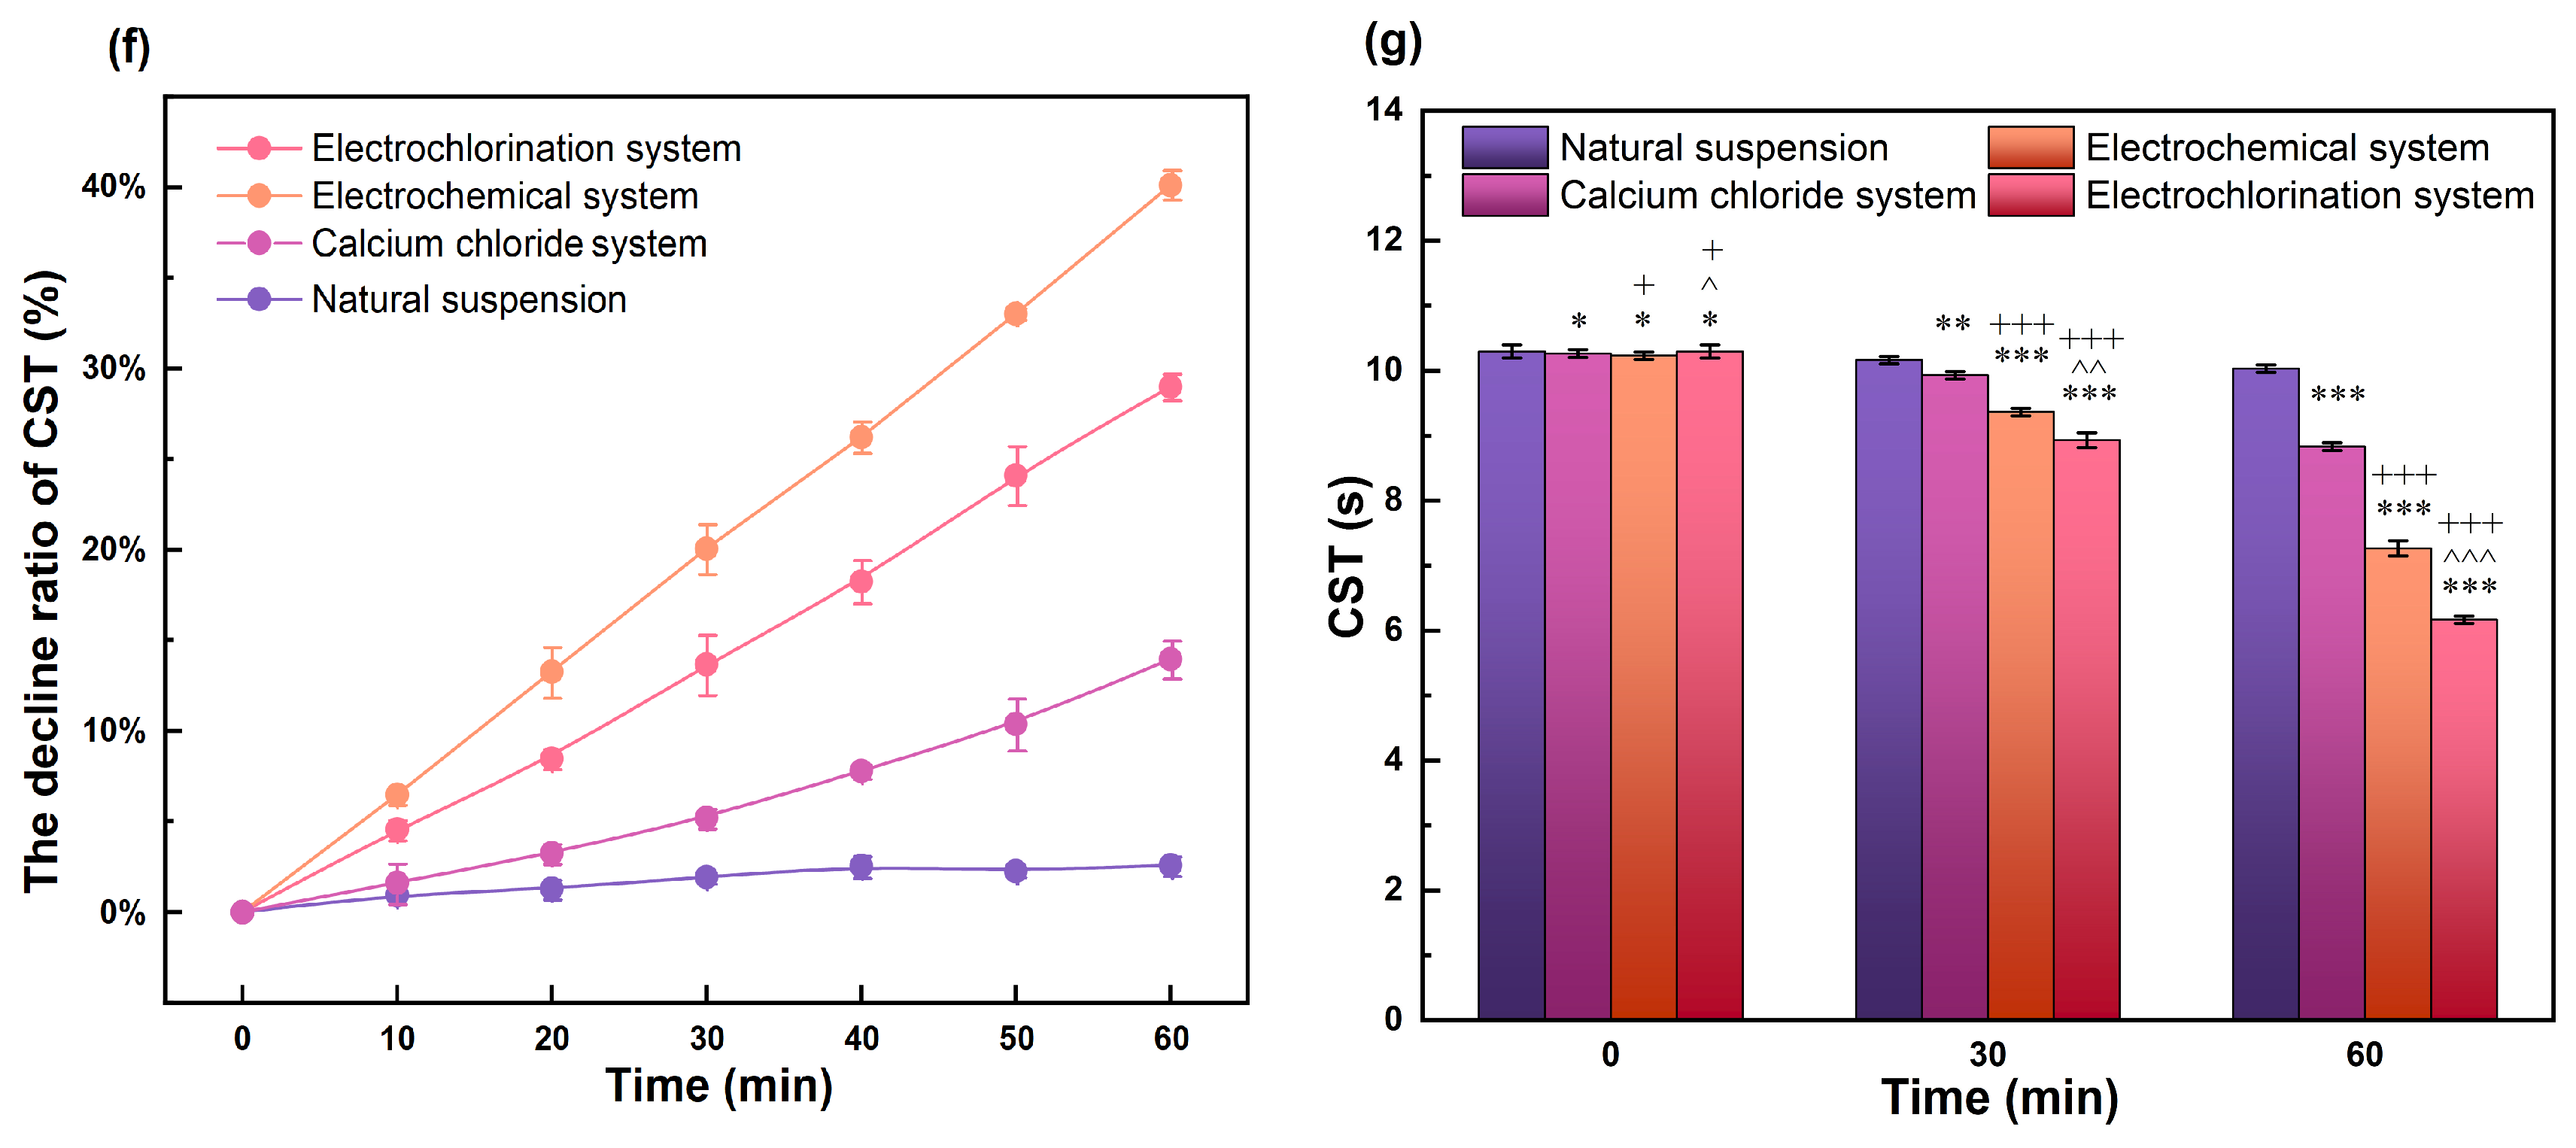
(a) Schematic diagram of the experimental process; (b) the change in polysaccharide in different forms of EPS; (c) the change in protein in different forms of EPS; (d) total polysaccharide and protein (A: Natural suspension; B: Calcium chloride system; C: Electrochemical system; D: Electrochlorination system); (e) the change in CST of M. aeruginosa-laden sludge during the electrochlorination treatment with a CaCl2·2H2O concentration of 0.6 g/L; (f) the decline ratio of CST; (g) significance analysis of the dewatering performance of M. aeruginosa-laden sludge (* denotes comparison with the natural suspension, + denotes comparison with the electrochlorination system, and ^ denotes comparison with the electrochemical system. 0.01 < p < 0.5, denoted by one symbol; 0.001 < p < 0.01, denoted by two symbols; and p < 0.001, denoted by three symbols).
The CST is a direct indicator reflecting the rheological properties and dewaterability of M. aeruginosa-laden sludge. In the four groups of control experiments, the CST of the original algal slurry was 10.3 ± 0.1 s, and it decreased to 6.1 ± 0.1 s after treatment with the electrochlorination system (Figure 2e). Further analysis of the CST reduction rate showed that the electrochlorination system achieved a CST reduction rate of 40.1%, which was higher than that of the electrochemical system alone (28.9%) and that of the calcium chloride system alone (13.9%) (Figure 2f). Significance analysis of the results from the four groups revealed that the electrochlorination system exhibited the most significant efficacy in improving the dewaterability of the algal slurry and reducing its filtration resistance, showing significant differences compared with the other groups (Figure 2g). This result confirms that under the electrochlorination system, the cyanobacterial sludge achieves superior dewatering performance. This finding aligns with the changes in EPS discussed above, further illustrating EPS’s impact on the dewatering performance of cyanobacteria.
A horizontal comparison revealed that the calcium chloride-only system primarily promotes flocculation via charge neutralization, with limited capacity to degrade the EPS structure, thus resulting in a relatively modest enhancement of dewaterability. In contrast, although the electrochemical system exhibits some oxidative capacity, its efficiency in disrupting TB-EPS is inferior to that of the electrochlorination system. The electrochlorination system can significantly reduce polysaccharide and protein levels in EPS fractions across all layers, particularly in TB-EPS. This process is crucial for improving dewaterability because polysaccharides form a hydrated film that hinders water release through their polar functional groups (e.g., -OH), while proteins also contribute to bound water formation via hydrogen bonding and electrostatic interactions [23,24]. The substantial reduction in filtration resistance, as reflected in the CST values, is highly consistent with the significant decrease in the EPS gel matrix. This preliminary study indicates that the electrochlorination system effectively improves its dewaterability, and the underlying mechanism may lie in the fact that the system degrades LB-EPS and TB-EPS, which possess porous structures and strong water-retention capacities, and disrupts the internal structure of EPS and microbial cells through intracellular and extracellular oxidation processes, thereby releasing organic matter and dissociating bound water [25].
3.2. EPS Degradation and Compositional Changes
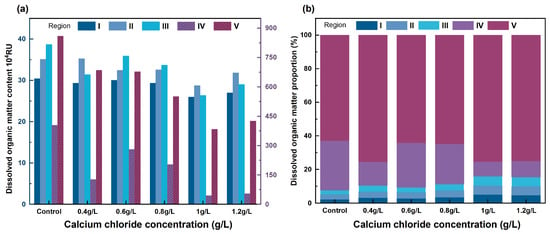
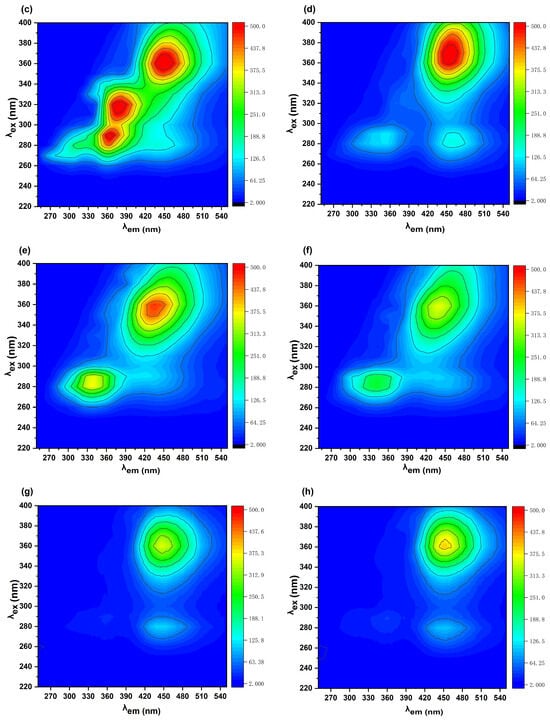
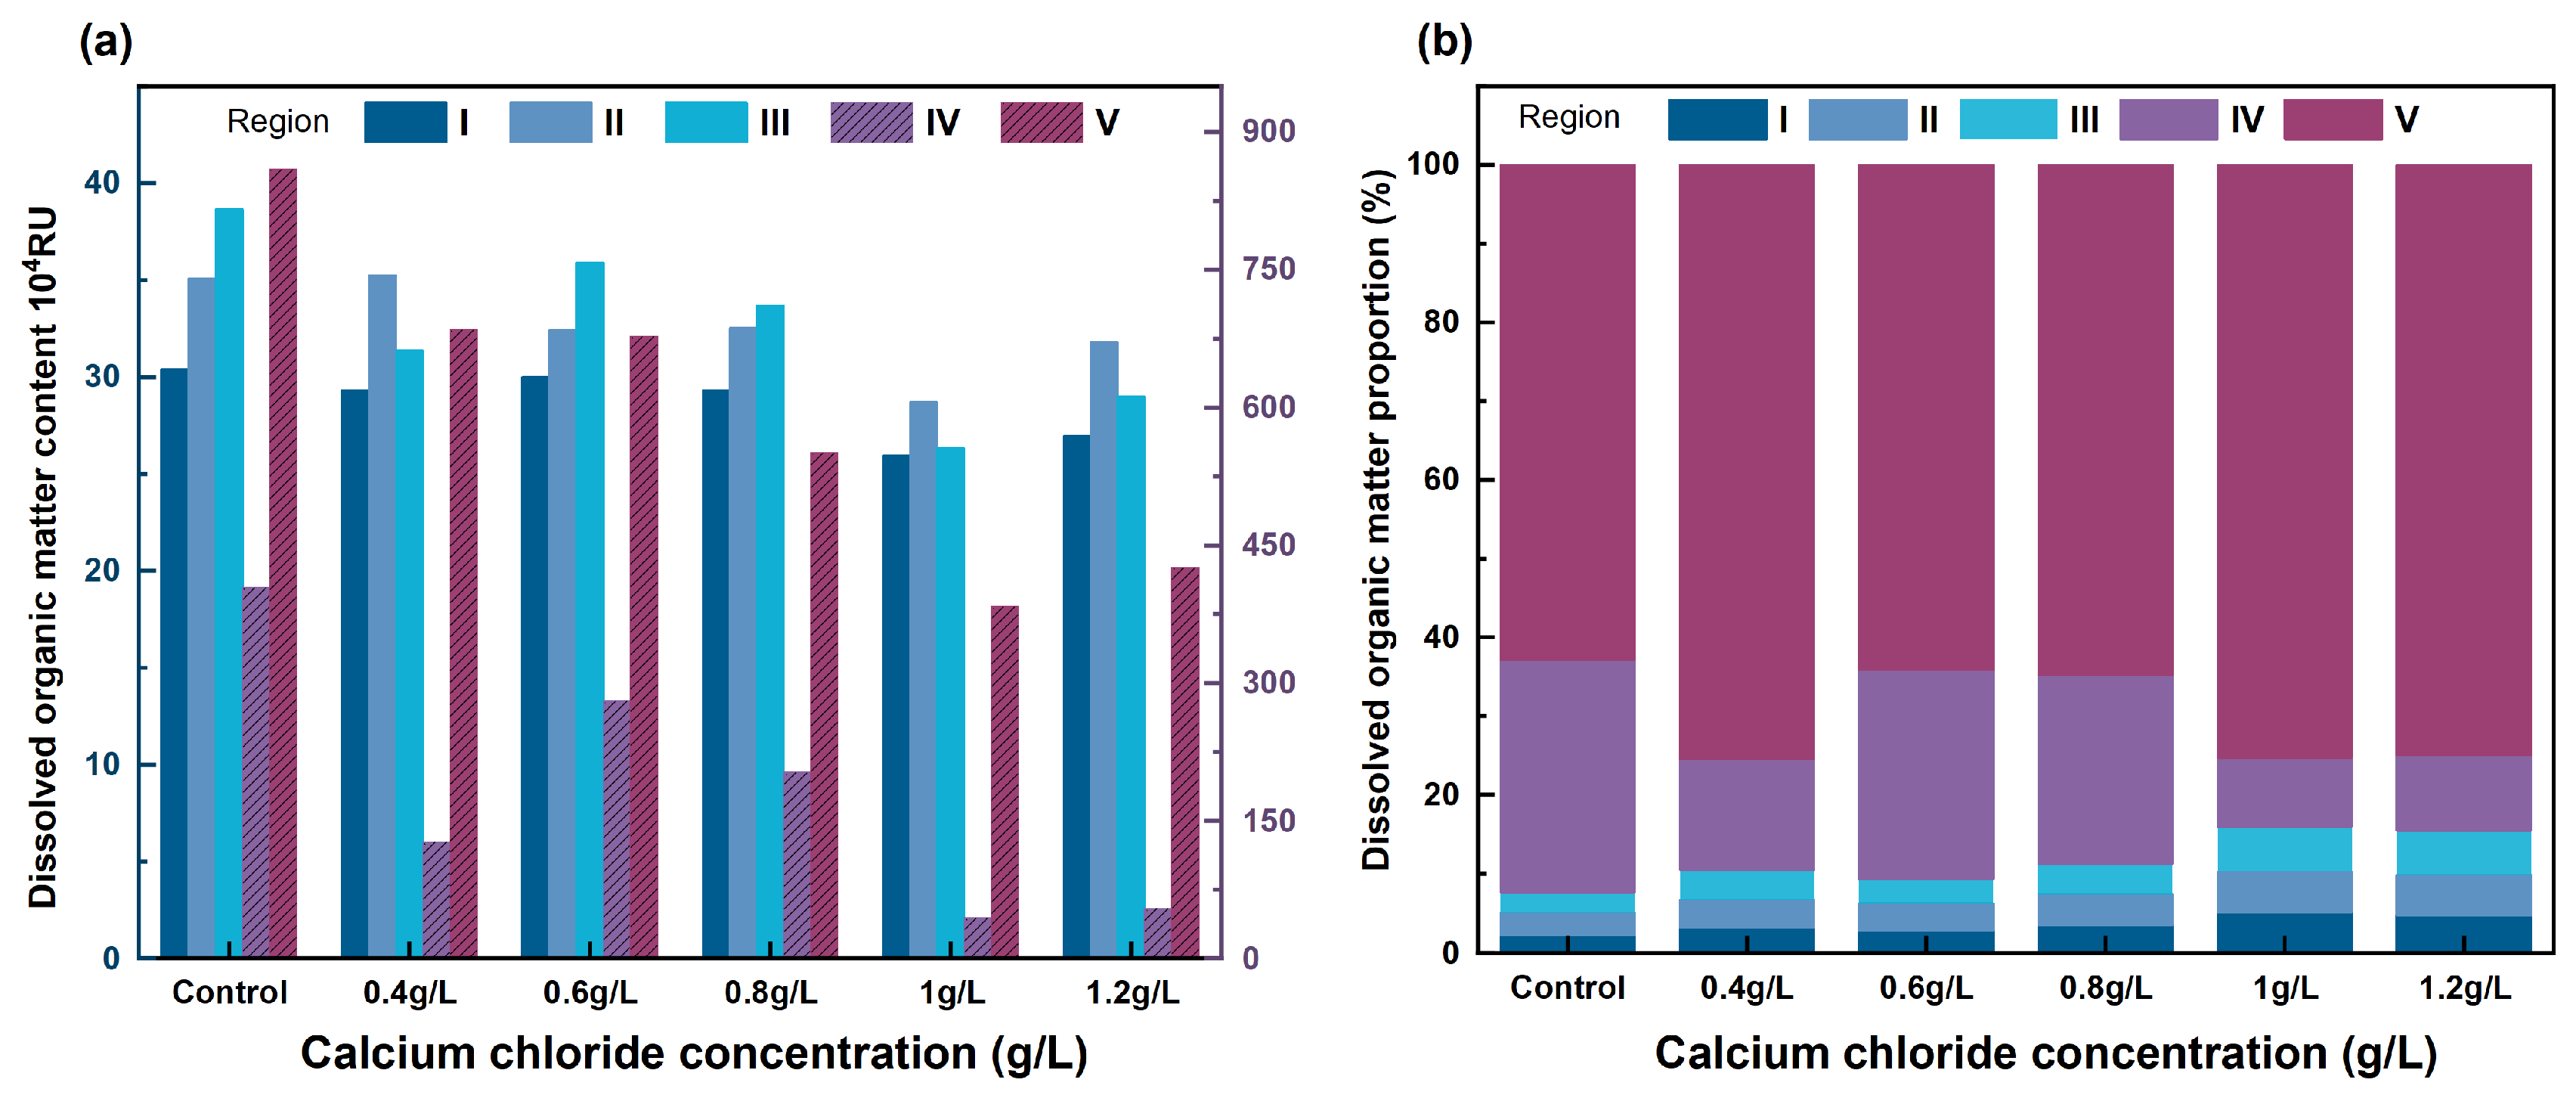
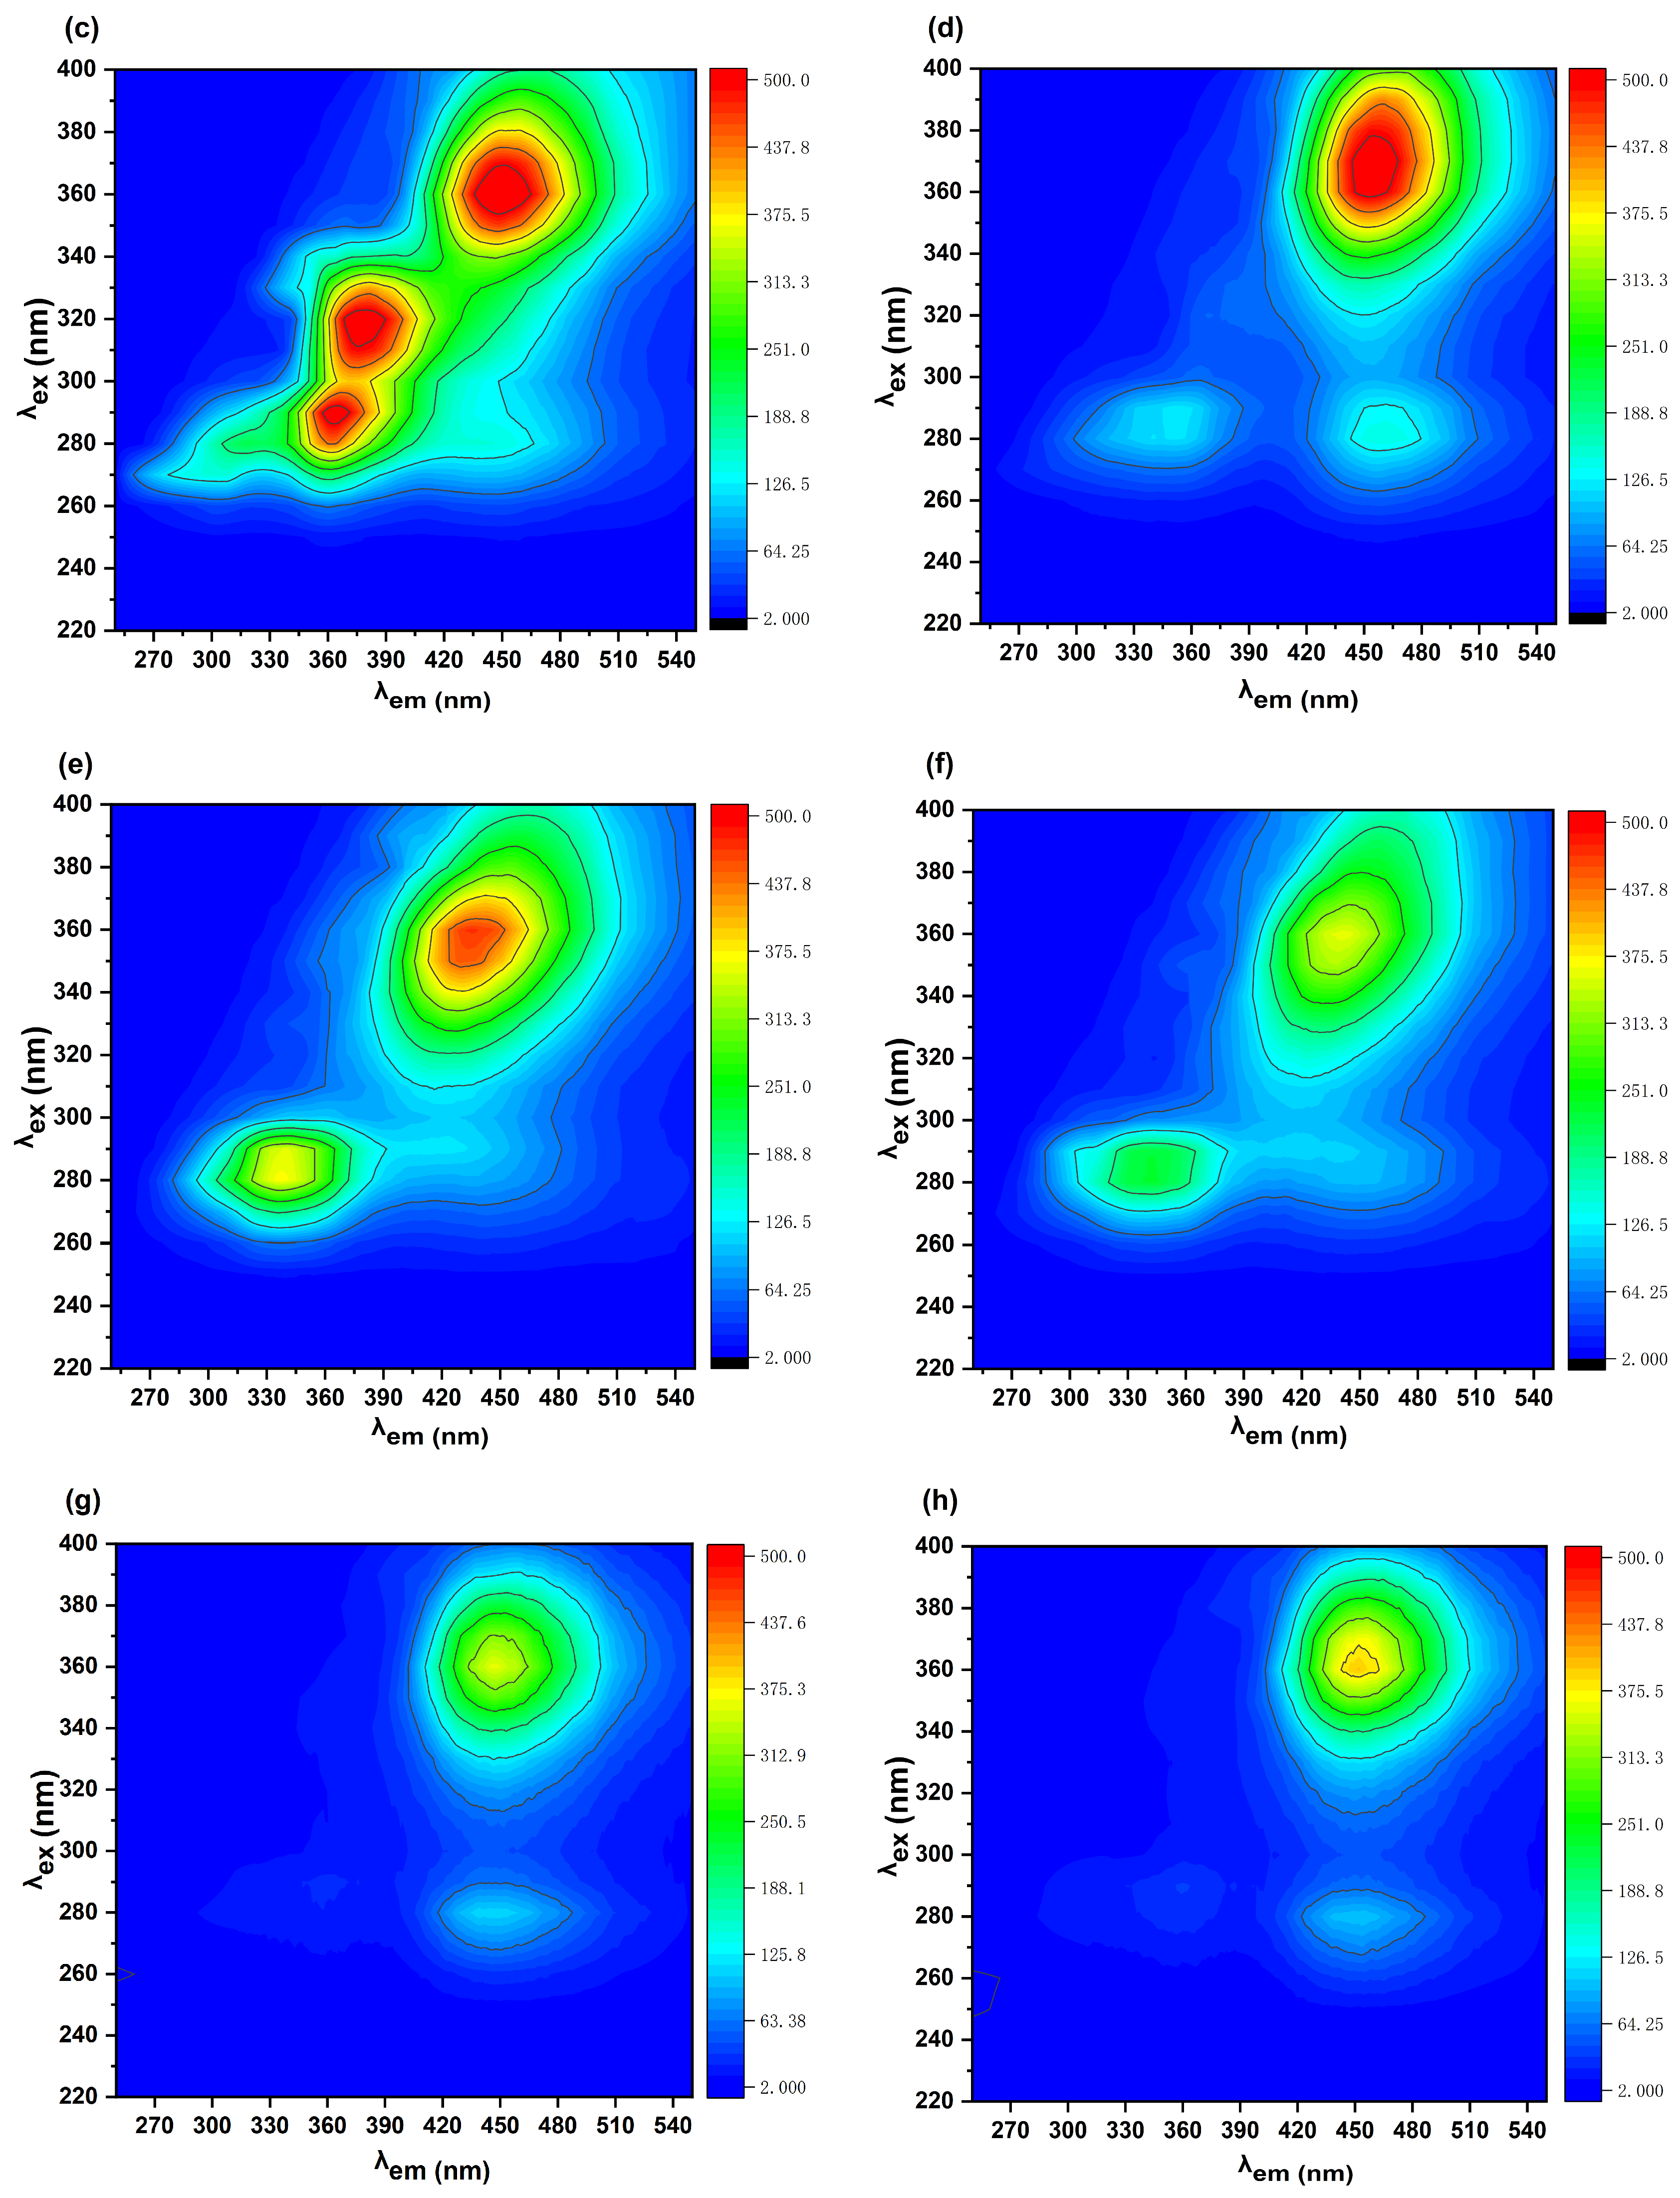
The relative content partition used by 3D-EEM to analyze changes in the organic composition of EPS is shown in Table S2 [26]. Comparative analysis found that the spectrogram of the 1.0 g/L group exhibited the following proportion distribution characteristics: the humic-like region (Region V) accounted for a relatively high proportion of 75.30%, while the microbial byproduct region (Region IV) accounted for 8.80% (Figure 3a,b), which was the lowest among all groups. Substances in Region IV are primarily derived from hydrophilic colloidal components released by cell disruption, which tend to form a hydrated film that increases filter cake resistance. The decrease in Region IV content indicates that under the 1.0 g/L electrochlorination condition, an appropriate amount of active chlorine effectively inhibited excessive cell disruption and promoted the degradation or transformation of organic matter in EPS, thereby eliminating a key obstacle to dewatering. In addition, the reduction in the relative signal intensities in Regions I and II may indicate oxidative decomposition of macromolecular proteins into small-molecule products.
Figure 3.
(a) EPS fluorescence intensity; (b) EPS regional integration percentage; (c–h) three-dimensional fluorescence analysis of M. aeruginosa solution after electrochlorination treatment with different CaCl2·2H2O electrolyte concentrations (raw algal, 0.4, 0.6, 0.8, 1.0, and 1.2 g/L).
In systems containing different concentrations of CaCl2·2H2O electrolyte, the EPS content of M. aeruginosa decreased in all cases, and the optimal effect was observed at a dosage of 1.0 g/L. In the M. aeruginosa-laden sludge solution, the total polysaccharide and protein contents in EPS were 16 ± 1.3 mg/g and 44 ± 3.2 mg/g, respectively. After electrochlorination treatment with 1.0 g/L CaCl2·2H2O, these values decreased to 4 ± 0.4 mg/g (polysaccharides) and 12 ± 1.2 mg/g (proteins), respectively. However, when the CaCl2·2H2O dosage was excessive, the total polysaccharide and protein contents rose again to 6.6 ± 0.5 mg/g and 17 ± 1.2 mg/g, respectively (Figure S3), thus confirming that there may be an optimal range for the advanced oxidation effect of electrochlorination. In conclusion, the characterization results from 3D-EEM show a correlation between dehydration performance and the relative content of different types of organic compounds in EPS (Figure 3c–h).
3.3. Optimization of Electrochlorination and Enhanced Dewatering Mechanism
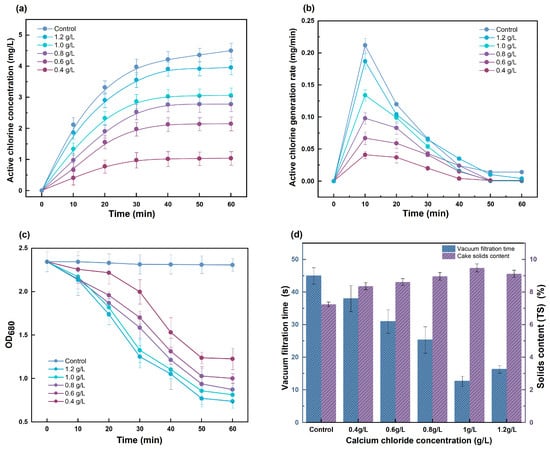
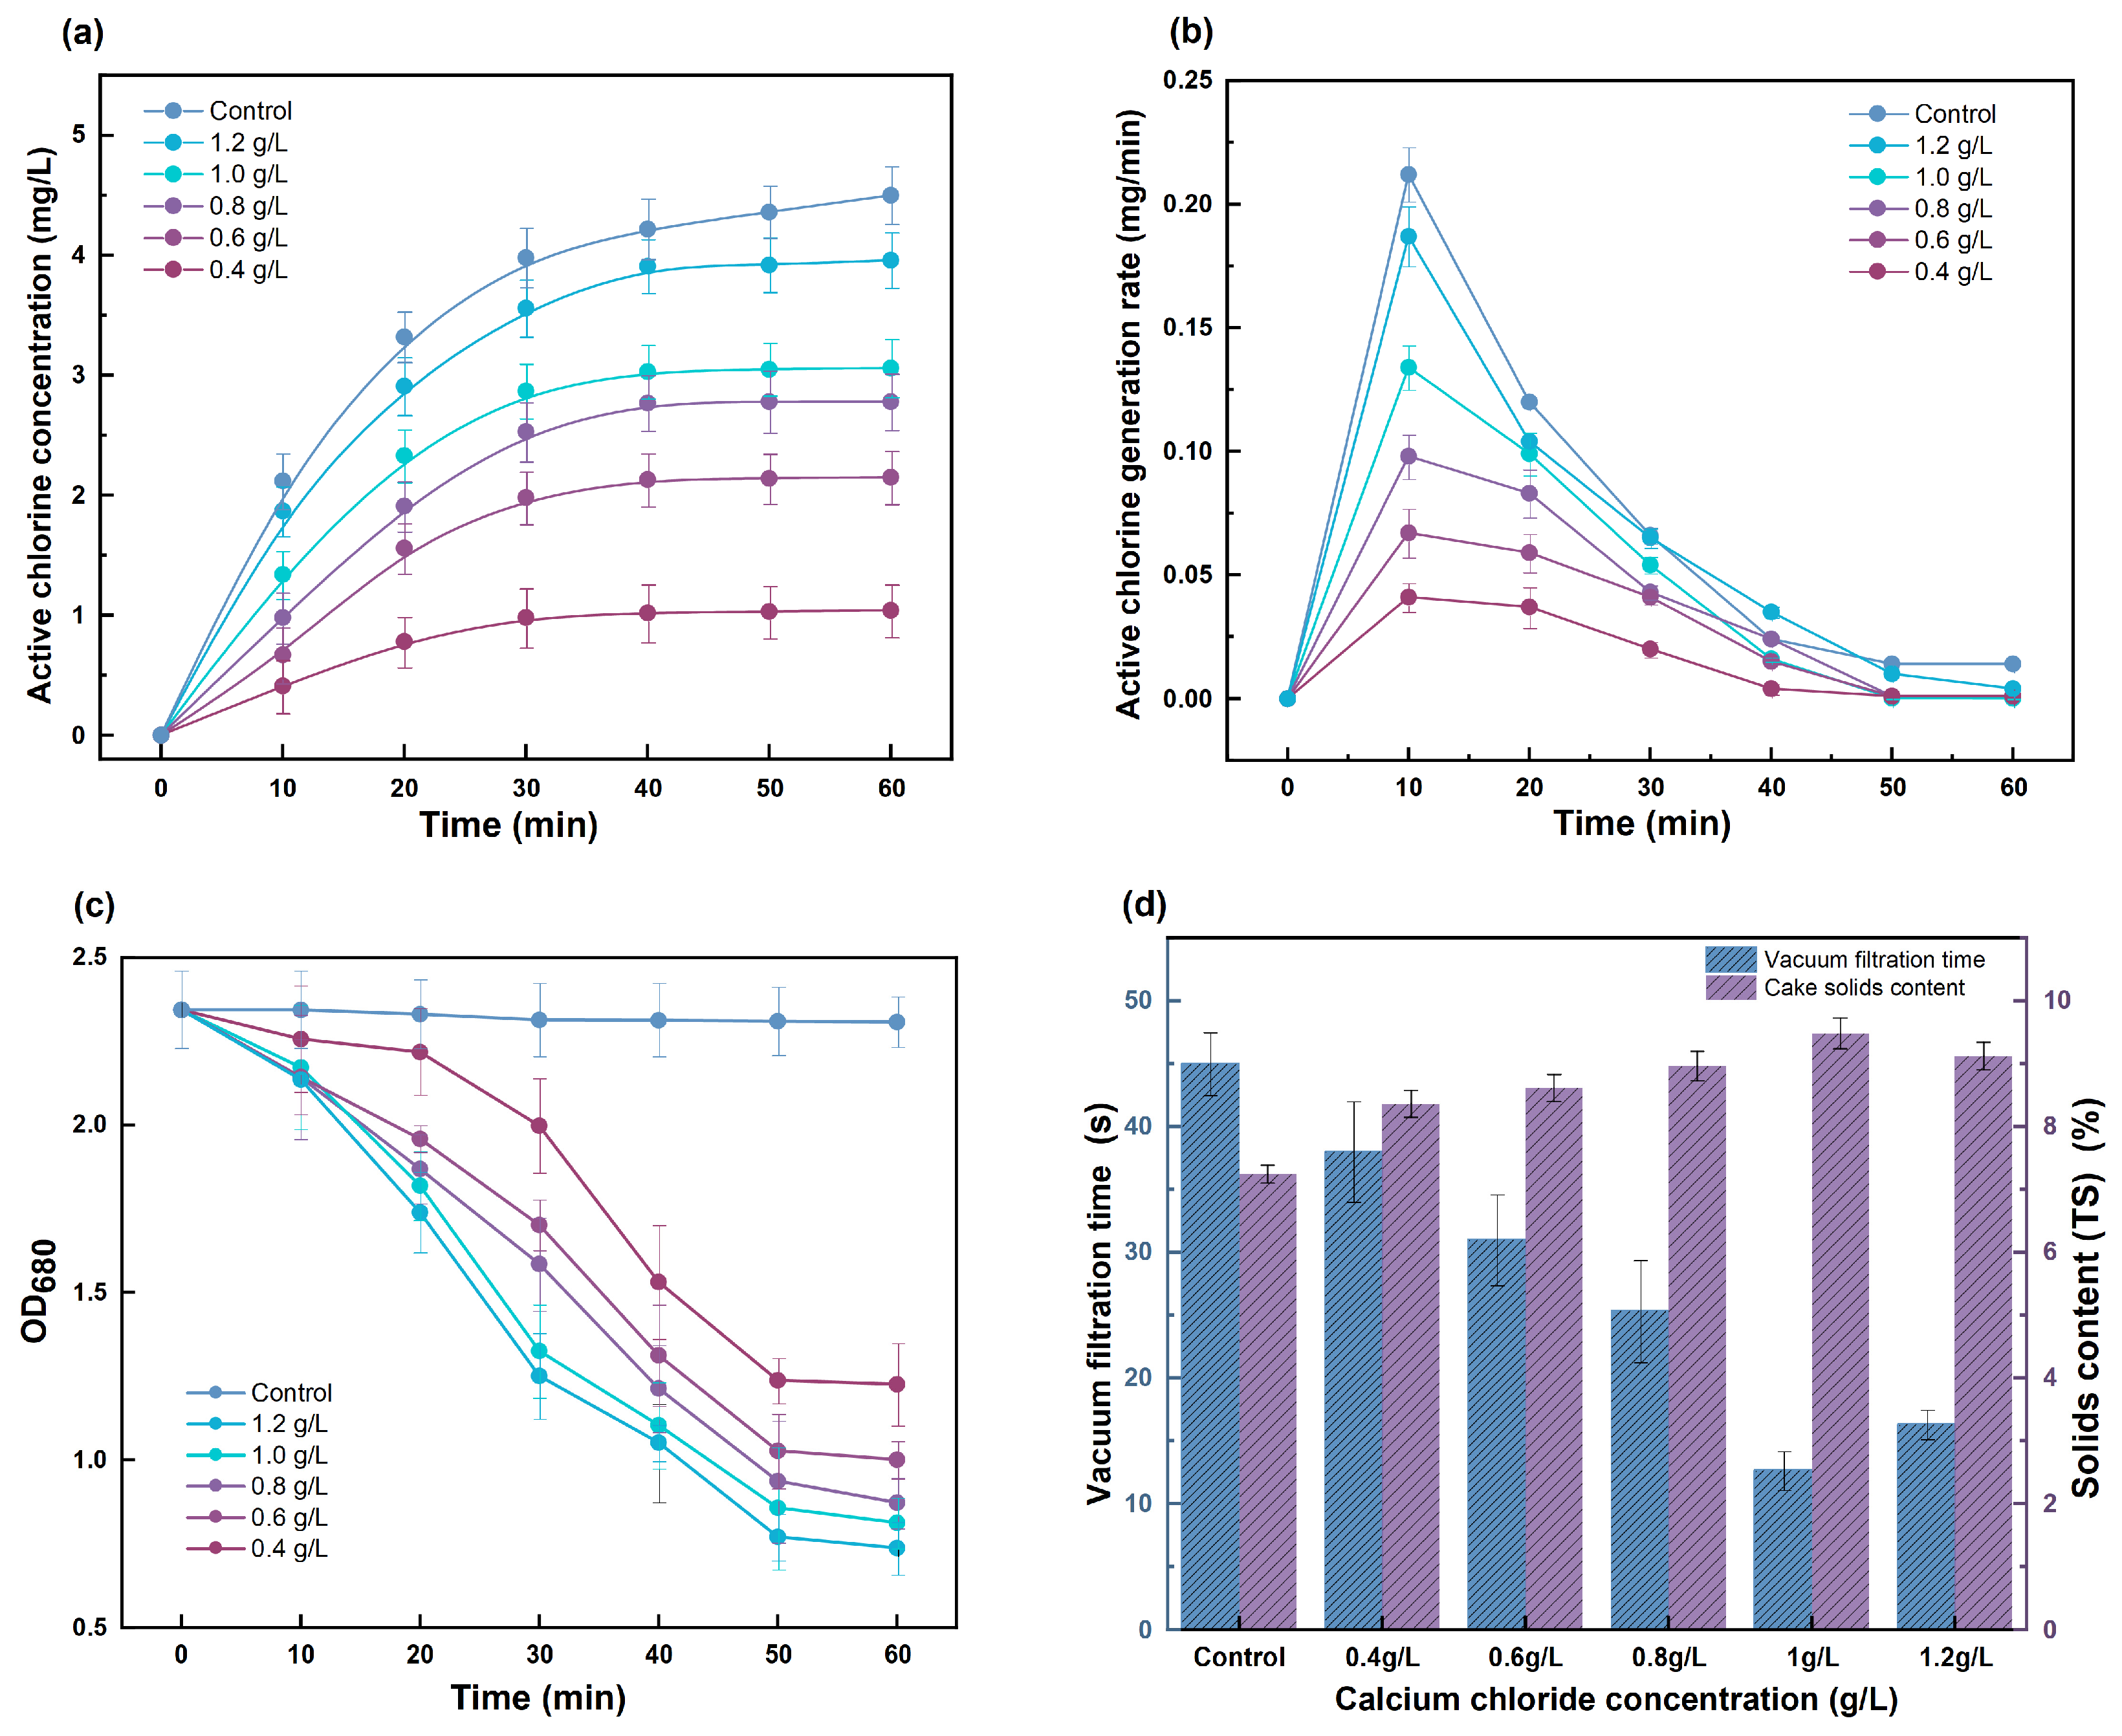
The core of the aforementioned EPS degradation process is the oxidation effect of active chlorine during electrochlorination. Therefore, in this study, the variation in active chlorine concentration during electrochlorination dehydration at different active chlorine concentrations was investigated experimentally [27]. The active chlorine concentration increased with electrolysis reaction time (Figure 4a), and a higher calcium chloride concentration corresponded to a faster initial generation rate of active chlorine (Figure 4b). Systems with CaCl2·2H2O concentrations of 1.0 g/L and 1.2 g/L achieved higher active chlorine concentrations, which can be attributed to the fact that a higher Cl− concentration promotes the anodic oxidation reaction [28]. After approximately 30–40 min, the generation rate of active chlorine decreased significantly and approached equilibrium across all treated groups. The control group (without algal sludge) exhibited the highest active chlorine concentration and the fastest initial generation rate. It is speculated that, in the absence of algae or EPS, there is no organic matter to consume the active chlorine generated. In contrast, all treated groups containing algal sludge showed lower active chlorine levels due to simultaneous consumption by the oxidation of EPS, algal cells, and dissolved organic matter. This observation indirectly confirms that active chlorine is consumed during EPS degradation and algal cell disruption.
Figure 4.
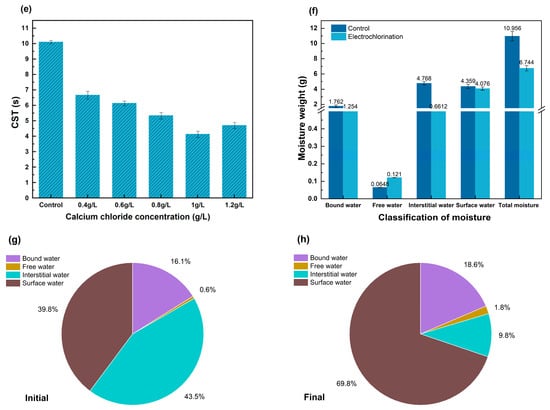
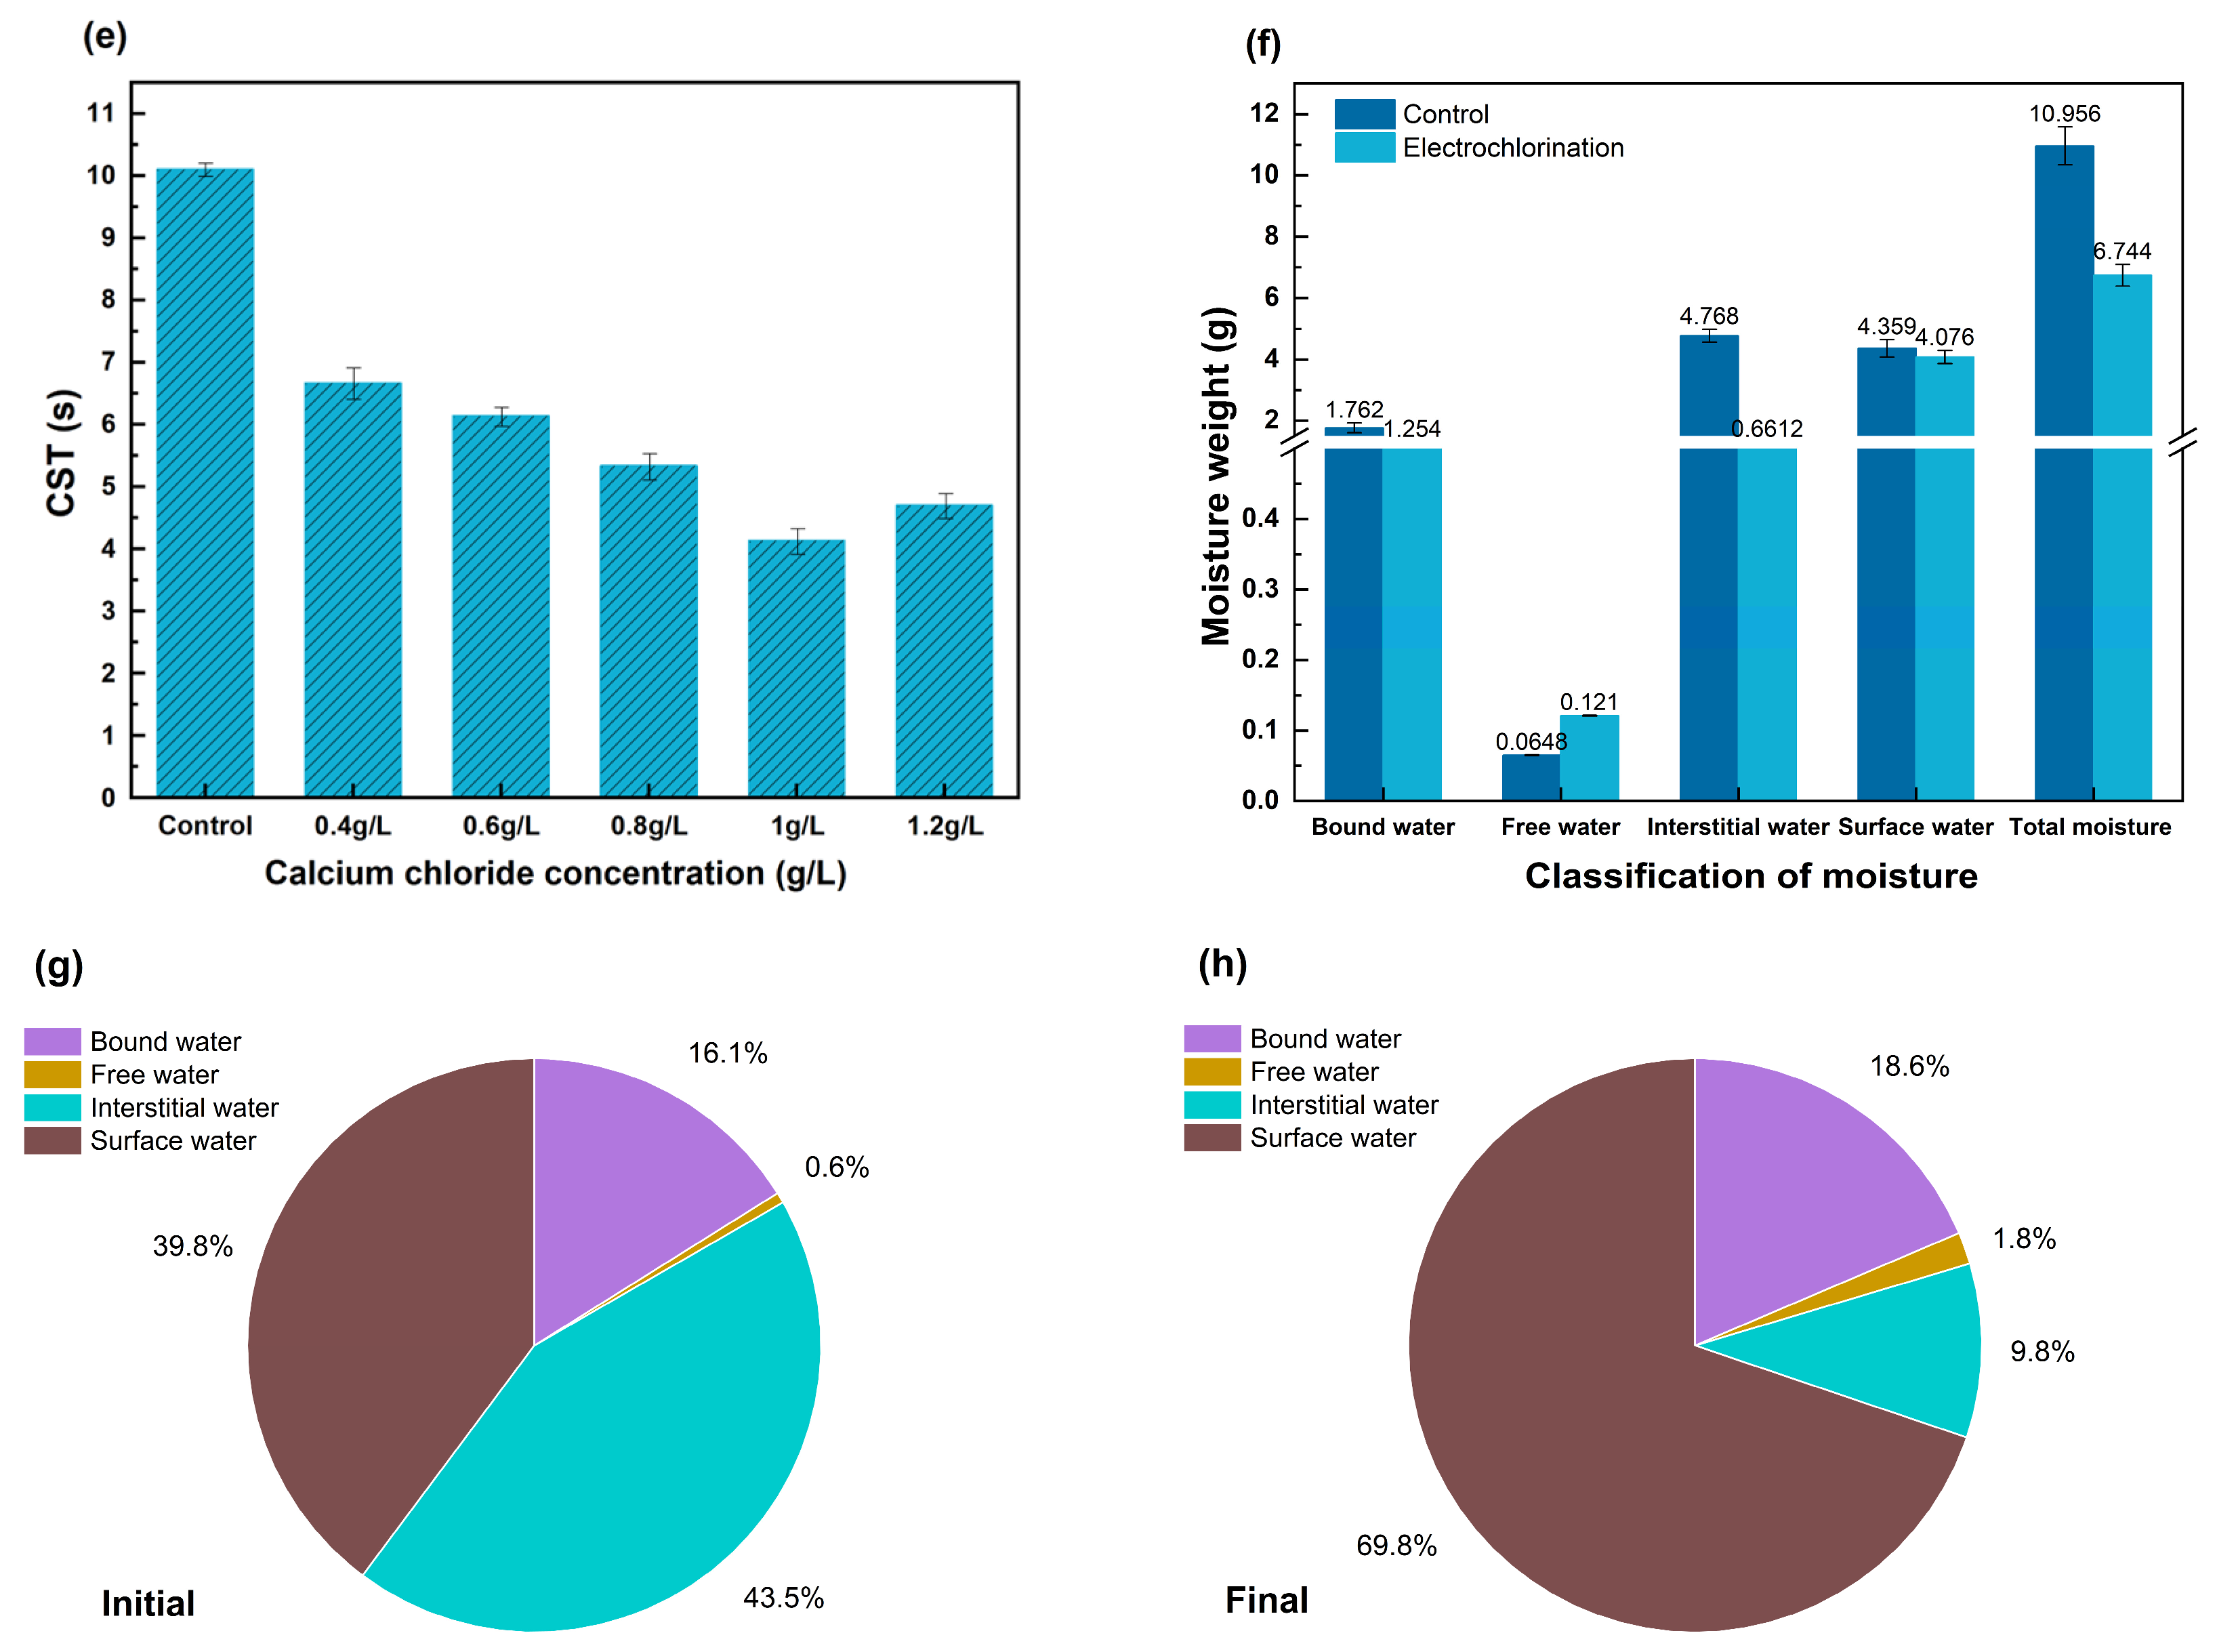
(a) Active chlorine production rate; (b) the variation in active chlorine production rate; (c) algal density of M. aeruginosa-laden sludge; (d) vacuum filtration time and algal cake solid content after electrochlorination treatment with different concentrations of CaCl2·2H2O (0.4, 0.6, 0.8, 1.0, and 1.2 g/L); (e) CST of M. aeruginosa-laden sludge; (f) moisture content; (g) moisture distribution of samples before electrochlorination treatment; (h) moisture distribution of samples after electrochlorination treatment.
At the optimal CaCl2·2H2O concentration (1.0 g/L), the initial current was approximately 56 ± 1.5 mA, corresponding to a current density of 3.5 ± 0.1 mA/cm2. As electrolysis progressed, the current steadily increased, reaching a maximum of approximately 81 ± 1.8 mA at 30–40 min (current density: 5.1 ± 0.1 mA/cm2), after which no significant variation was observed. Throughout the entire electrolysis period (60 min), the current remained stable, indicating the absence of appreciable electrode passivation during the experiments.
The active chlorine concentration increased with electrolysis time. Higher CaCl2 concentrations corresponded to faster initial active chlorine generation rates, which may be attributed to the higher current intensity resulting from increased solution conductivity, thereby promoting the anodic oxidation of Cl−. The systems with CaCl2·2H2O concentrations of 1.0 g/L and 1.2 g/L achieved higher active chlorine concentrations and faster initial generation rates. After approximately 30–40 min, the active chlorine concentration in all treatment groups reached relatively high values and gradually leveled off, which was consistent with the observed trend in current variation.
At a CaCl2·2H2O concentration of 1.0 g/L, the disruption and dewatering effect of electrochlorination on M. aeruginosa is shown in Figure S4. During electrolysis, the M. aeruginosa-laden sludge gradually changed from dark green to light green and finally to pale yellow, accompanied by a decrease in algal concentration (Figure 4c). This observation directly reflects the disruptive effect of active chlorine on algal cells. The dewaterability data directly confirmed the above effects: at the optimal dosage of 1.0 g/L, the CST decreased to 4.1 ± 0.2 s, the suction filtration time reached a minimum of 12.6 ± 1.5 s, and the cake solid content increased to 9.48 ± 0.24% (Figure 4d,e). However, when the dosage was increased to 1.2 g/L, dewaterability deteriorated. This may be attributed to excessive compression of the electric double layer by high Ca2+ concentrations, which induces over-aggregation of algal cells into dense flocs, thereby blocking water flow channels. Therefore, to balance oxidation efficiency and dewatering efficacy, the CaCl2·2H2O dosage should be controlled at approximately 1.0 g/L. Combining the results for organic matter content in EPS presented earlier, the Region V-to-Region IV (V/IV) ratio of 3D-EEM exhibited a correlation with dewatering indicators. Spearman rank correlation analysis (n = 6) revealed that the V/IV ratio was significantly negatively correlated with CST (ρ = −0.829, p < 0.05) and significantly positively correlated with cake solid content (ρ = +0.829, p < 0.05). These results indicate a shift in the organic composition of EPS toward higher hydrophobicity, rather than merely a reduction in total organic content [29].
As shown in Figure S5, the FTIR spectra of EPS extracted from raw and treated sludge provide qualitative evidence of compositional changes. The most notable change is the increase in transmittance of the characteristic polysaccharide peak at 1020 cm−1 (C-O-C stretching) from 49.41% to 64.12%, which is consistent with the reduction in EPS polysaccharide content measured by the anthrone-sulfuric acid method; changes in the amide I band at approximately 1640 cm−1 indicate protein degradation, which is consistent with the decrease in EPS protein content determined by the Coomassie Brilliant Blue G250 method; and variations in the 1400–1450 cm−1 region (C-H bending) suggest modifications to aliphatic compounds. These spectral data provide some evidence that electrochlorination can degrade the main organic components of EPS. The masses of water with different binding forms in the algal sludge changed before and after treatment (Figure 4f). The total moisture content of the raw algal sludge was 91.3 ± 1.3%, with interstitial water as the dominant component at 39.74 ± 0.3% (43.5% of the total). This was followed by surface water at 36.33 ± 0.3% (39.8% of the total) (Table 1). Bound water was 14.69 ± 0.2% (16.1% of the total), while free water had the lowest content at 0.54 ± 0.1% (only 0.6% of the total) (Figure 4g,h). This distribution is related to the microstructure of the algal sludge: the surfaces of M. aeruginosa cells are encapsulated by abundant EPS. The gel network formed by EPS traps a large amount of moisture in the intercellular spaces, resulting in a high proportion of interstitial water [30]. Meanwhile, the algal cells carry negative charges on their surfaces and adsorb water molecules through hydrogen bonding and van der Waals forces, forming a stable surface water layer. However, bound water remains relatively stable in content and is difficult to remove due to its tight binding to EPS (such as proteins and nucleic acids) and to the intact structure of natural algal cell membranes. In contrast, free water, lacking strong binding forces, is partially lost during natural standing or mild filtration, resulting in its low proportion. In addition, during dehydration, the presence of Ca2+ may promote the aggregation of algal cells into loose flocs, thereby increasing the permeability of the floc structure and promoting the removal of free and interstitial water [31].
Table 1.
Moisture analysis results of M. aeruginosa-laden sludge.
In summary, active chlorine can partially cleave glycosidic bonds in polysaccharides and peptide bonds in proteins, thereby disintegrating the hydrophilic EPS gel network while largely preserving aliphatic C-H groups. At a CaCl2·2H2O dosage of 1.0 g/L, Ca2+ moderately compresses the electric double layer, favoring the formation of loose and permeable flocs. Consequently, the interstitial water originally trapped within the EPS network is extensively released and converted into surface water and free water, reducing the total moisture content. However, excessive CaCl2·2H2O (1.2 g/L) will lead to overcompression of the electric double layer and overaggregation of dense flocs, thereby blocking the water channel and reducing dehydration performance.
3.4. Kinetic Analysis of the Dewatering Process
Comparison of the rate constants for each step reveals the following order: kACS > kPN > kPS > kSCOD > kCST (Table 2), which indicates the following key insights. Oxidant generation is not the rate-limiting step; the production rate of active chlorine species is highest, enabling rapid meeting of reaction requirements. The chemical oxidation of EPS constitutes the primary chemical resistance. The degradation rates of proteins and polysaccharides are significantly slower than the rate of active chlorine generation, suggesting that the breakdown of the macromolecular structure of EPS itself requires time and constitutes a critical chemical process. Among them, the degradation rate of polysaccharides is lower than that of proteins, implying that the structure of algal-derived polysaccharides may be more resistant [32]. Organic matter leaching precedes dewatering improvement: The rate constant for the increase in soluble chemical oxygen demand, kSCOD, lies between the degradation of EPS and the decrease in CST. This indicates that the process by which organics produced via oxidative breakdown rapidly dissolve into the liquid phase occurs before the full manifestation of dewatering effects, marking a transition from chemical oxidation to physical dewatering. The improvement in dewatering performance is the overall rate-limiting step: the smallest value of kCST indicates that the decrease in capillary suction time (i.e., the substantial improvement in dewatering performance) is the slowest step. This reveals a final kinetic bottleneck between organic matter leaching and physical water removal.
Table 2.
Kinetics data of the dewatering process.
3.5. Residual Water Quality of M. aeruginosa-Laden Sludge
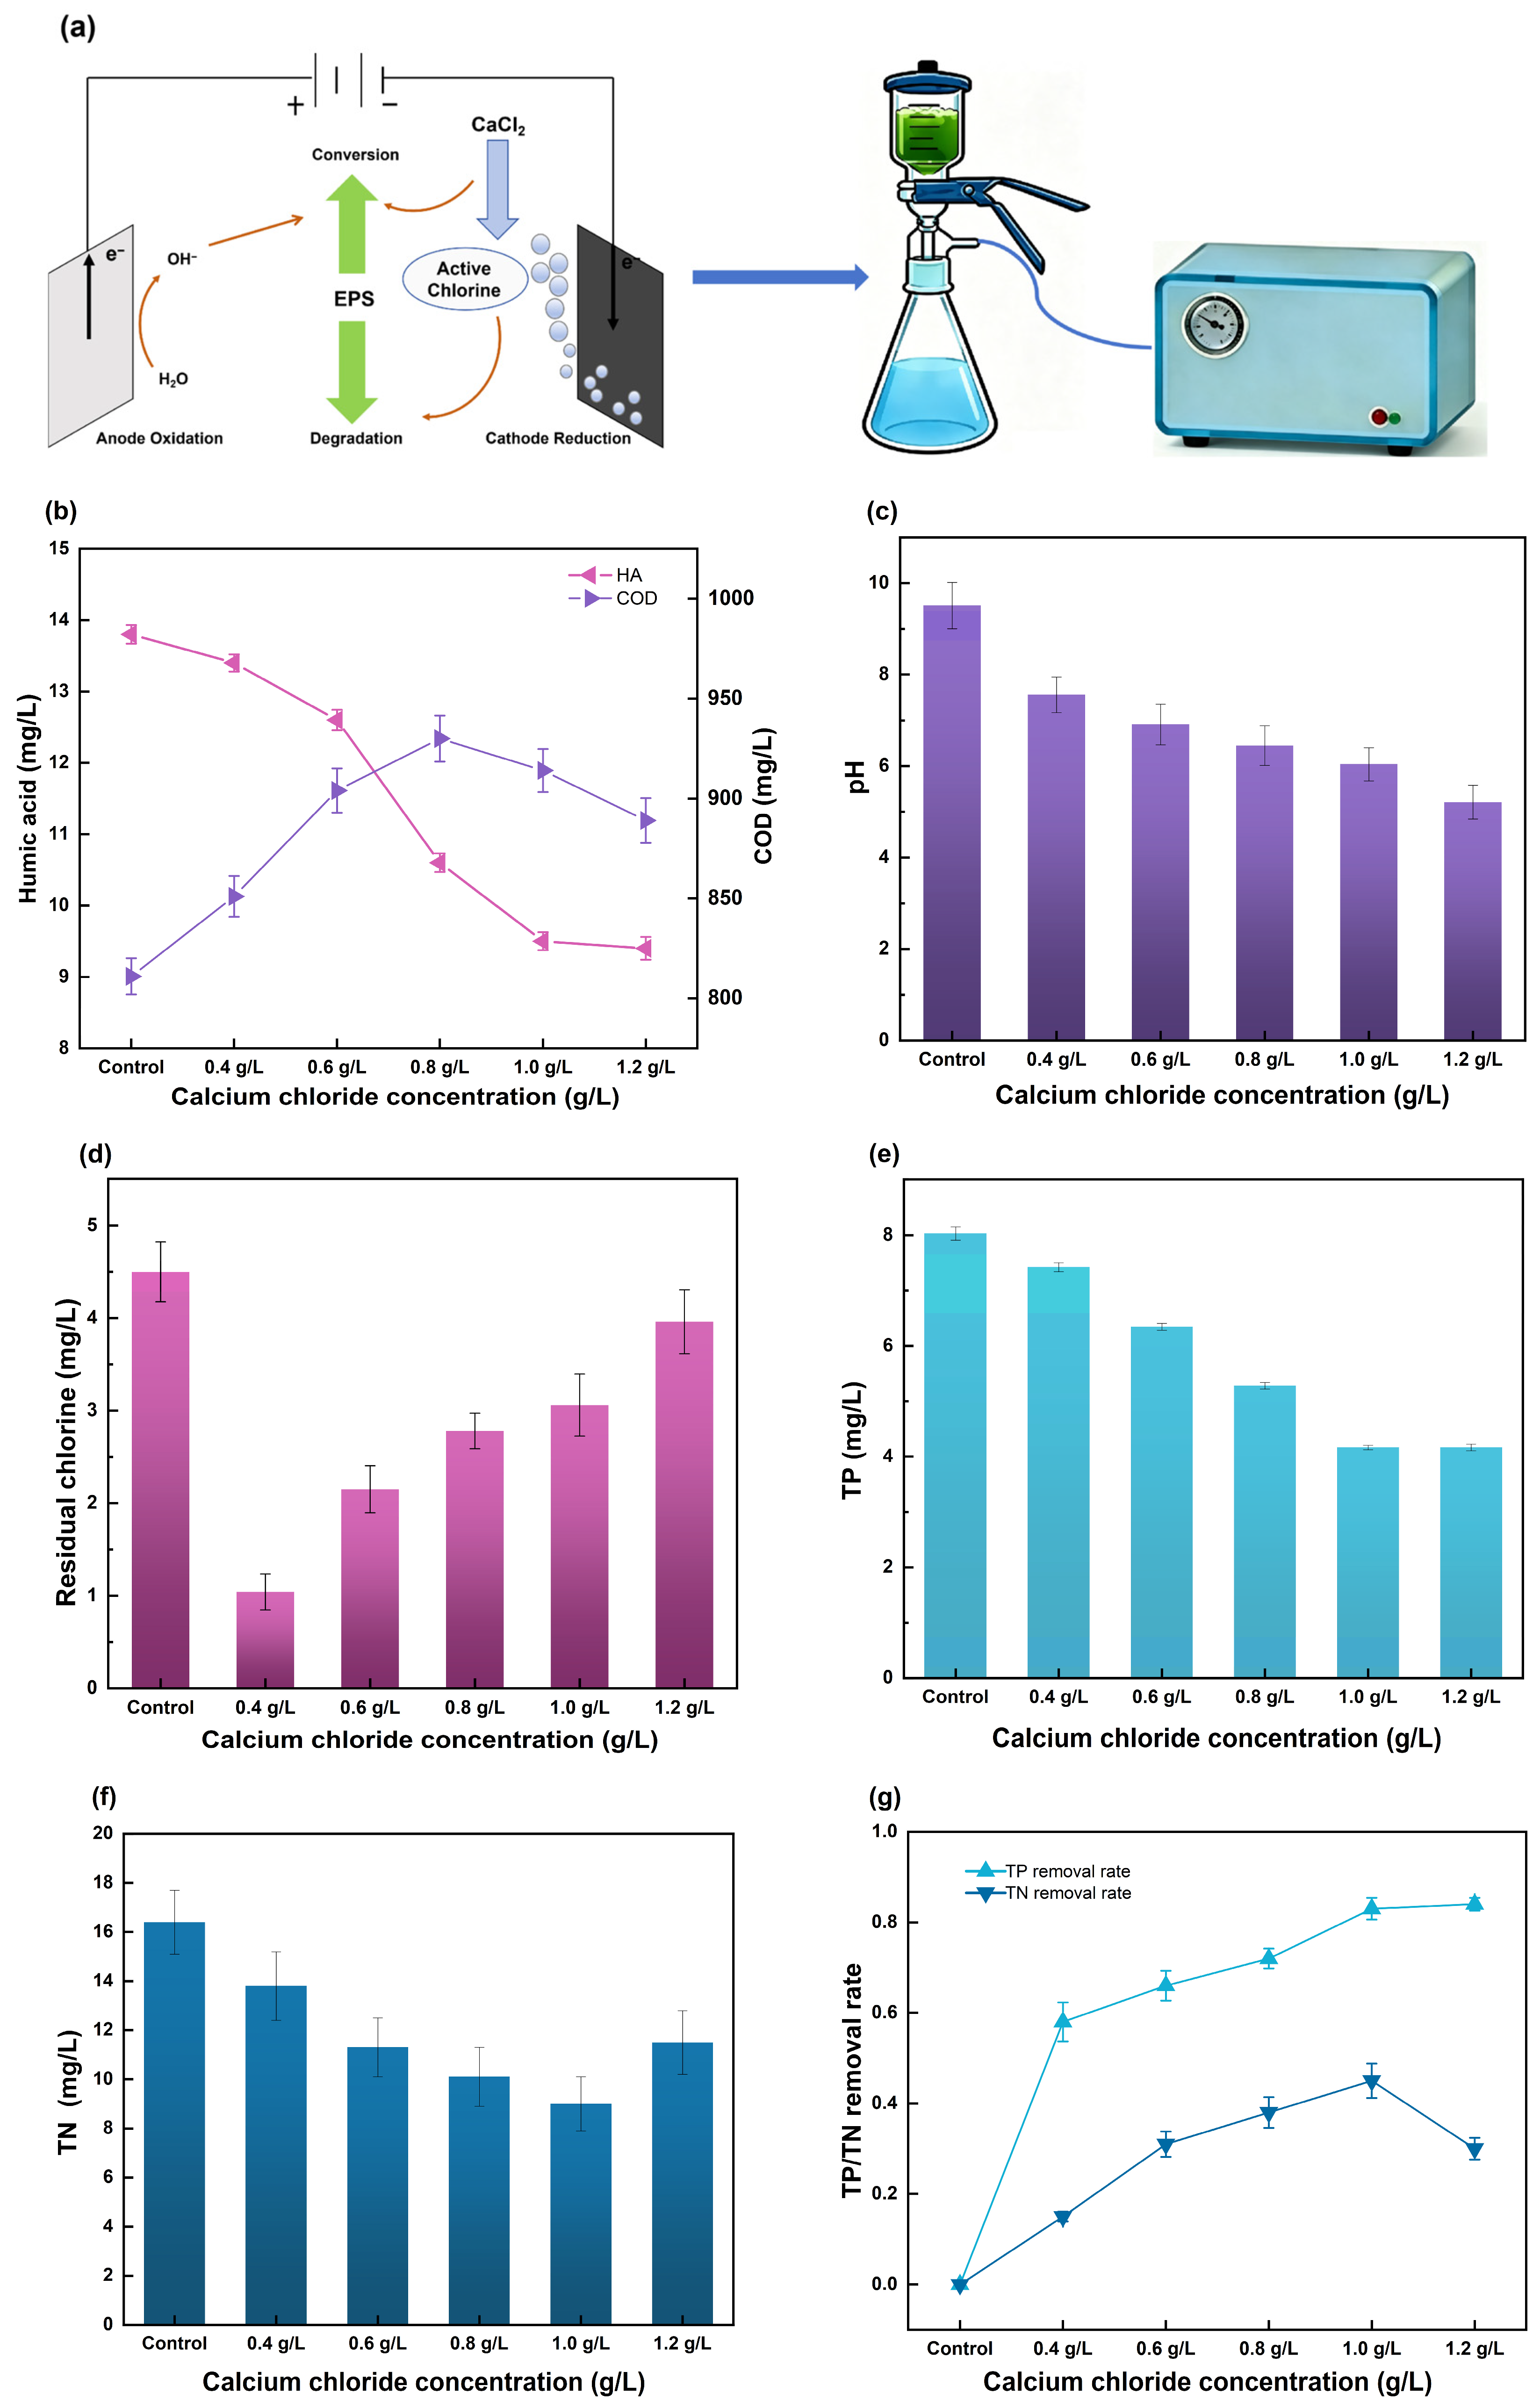
As the dosage of CaCl2·2H2O increased from 0.4 g/L to 1.0 g/L, the humic acid content in the residual water gradually decreased, but rose slightly at 1.2 g/L (Figure 5a). An appropriate amount of active chlorine can degrade humic acid, whereas excessive dosage induces algal cell disruption, leading to the release and rebound of humic substances. Similarly, COD showed an initial increase followed by a decrease and then gradually stabilized as the dosage increased (Figure 5b). The pH of the residual water remained stable at approximately 6.0 (Figure 5c), eliminating the need for acidification and subsequent neutralization steps required by traditional electro-Fenton/Fenton processes [33]. Although the cathodic reaction continuously produces OH−, which would theoretically drive the pH toward alkaline values, the final pH is likely the net outcome of multiple concurrent reactions. The hydrolysis of chlorine gas generated at the anode (Cl2 + H2O ⇌ HOCl + H+ + Cl−) liberates H+ ions. In addition, the oxidation of organic matter by active chlorine may generate small quantities of organic acids. These acidification processes may counterbalance the OH− produced at the cathode, thereby stabilizing the final pH in the weakly acidic range. TP and TN reached their minimum levels at a CaCl2·2H2O concentration of 1 g/L, whereas excessive dosage increased residual chlorine. The reduction in TP may be attributed to the release of intracellular phosphorus as orthophosphate via oxidation by active chlorine (Figure 5d,e), followed by chemical precipitation with cations such as Ca2+ from CaCl2·2H2O [34]. The decrease in TN may be due to the oxidation of nitrogen-containing organic matter and ammonia by active chlorine, converting them into nitrogen gas (N2) that escapes from the solution (Figure 5g).
Figure 5.
(a) Residual water treatment effect diagram; (b) the concentration of humic acid (mg/L) and COD (mg/L) of residual water of M. aeruginosa-laden sludge after electrochlorination under different concentrations of CaCl2·2H2O (0.4, 0.6, 0.8, 1.0, and 1.2 g/L); (c) pH; (d) residual chlorine (mg/L); (e) TP (mg/L); (f) TN (mg/L); (g) the removal rate of TN, TP.
At the optimal CaCl2·2H2O dosage of 1.0 g/L, the effluent TP concentration was 0.166 ± 0.040 mg/L. This value is lower than the Class A standard (0.5 mg/L) of China’s Discharge Standard of Pollutants for Municipal Wastewater Treatment Plant (GB18918-2002) [35] and even meets the more stringent Class III surface water quality standard (0.2 mg/L, GB3838-2002) [36], indicating that the electrochlorination system can effectively remove phosphorus from the liquid phase. The effluent TN concentration was 9.0 ± 1.1 mg/L, which is below the Class A limit of 15 mg/L (GB18918-2002), indicating satisfactory nitrogen removal performance. These byproduct indicators of dewatering suggest that the electrochlorination system simultaneously enhances dewatering and nutrient removal without additional post-treatment steps, a distinct advantage over conventional conditioning methods that often cause secondary pollution [37].
4. Conclusions
The 5 V low-voltage electrochlorination system (Ti/IrO2/RuO2 anode, iron cathode, CaCl2·2H2O electrolyte) constructed in this study can effectively disrupt the EPS water-retaining network structure of cyanobacterial sludge. As a result, the organic matter content in EPS, such as polysaccharides and proteins, decreased. The active chlorine produced by electrolysis can freely penetrate the negatively charged EPS matrix, break the glycosidic bonds of polysaccharides and peptide bonds of proteins, thus degrading the dense water-retaining network formed by EPS, releasing a large amount of interstitial water intercepted by EPS, which is converted into free water that is easier to remove, and the bound water ratio is reduced to 9.8%. When the dosage of CaCl2·2H2O was 1.0 g/L, the system achieved good solid–liquid separation: the CST was reduced from 10.30 s to 4.1 s, the solid content of the filter cake was increased to 9.48%, and the effluent TP (0.17 mg/L) and TN (9.0 mg/L) reached the grade III water quality standard and the grade A discharge standard, respectively. In the future, high-resolution mass spectrometry (such as FT-ICR-MS) can be used to track the transformation pathway of dissolved organic matter at the molecular level, evaluate the long-term stability of the Ti/IrO2/RuO2 anode under continuous operation (such as an accelerated life test), and explore a more corrosion-resistant, size-stable anode. At the same time, the risk of forming disinfection by-products (such as trihalomethanes and haloacetic acids) should be quantified, and mitigation strategies, such as activated carbon adsorption, should be formulated (Figure S6). While the Ti/IrO2/RuO2 anode was employed in this proof-of-concept study, its high cost may present a barrier for large-scale implementation. Future work should focus on cost-reduction strategies, such as reducing precious metal loading, developing alternative non-precious metal oxide coatings (e.g., MnO2 or PbO2), or exploring carbon-based electrodes, alongside optimizing operating parameters (e.g., current density) to minimize the required electrode area.
Supplementary Materials
The following supporting information can be downloaded at https://www.mdpi.com/article/10.3390/environments13070399/s1. Table S1: Basic properties of M. aeruginosa algal fluid; Table S2: Analysis of Substances Corresponding to Each Fluorescence Peak and Their Characteristics; Figure S1: Growth curve of M. aeruginosa; Figure S2: Drying rate curve of M. aeruginosa-laden sludge; Figure S3: The changes in polysaccharide and protein in M. aeruginosa EPS; Figure S4: The changes in algae over time in the electrochlorination system (from left to right, 0 min to 60 min); Figure S5: Spectrum Algae liquid’ FTIR before and after electrochlorination treatment; Figure S6: Schematic diagram of EPS degradation and transformation.
Author Contributions
X.W.: Conceptualization, Methodology, Investigation, Data Curation, Writing—Original Draft Preparation, Writing—Review & Editing. W.Z.: Software, Validation, Formal Analysis, Visualization, Writing—Review & Editing. Y.W.: Resources, Writing—Review & Editing. Y.G.: Conceptualization, Supervision, Project Administration, Funding Acquisition, Writing-Review & Editing. All authors have read and agreed to the published version of the manuscript.
Funding
This research was supported by the Natural Science Foundation of Jiangsu Province (Grant No. BK20190320, Department of Science and Technology of Jiangsu Province), the National Natural Science Foundation of China (Grant No. 51908277, NSFC), and the Young Scientists Fund of the National Natural Science Foundation of China (Grant No. 22407062, NSFC). The APC was covered by the authors.
Data Availability Statement
The original contributions presented in this study are included in the article/Supplementary Material. Further inquiries can be directed to the corresponding author.
Acknowledgments
During the preparation of this manuscript, the authors used DeepSeek-V3 for the purposes of English language polishing and discussion section wording optimization. The authors have reviewed and edited the output and take full responsibility for the content of this publication.
Conflicts of Interest
The authors declare no conflict of interest.
References
- Bashir, I.; Hakeem, K.R.; Bhat, R.A. Bioremediation and Biotechnology: Sustainable Approaches to Pollution Degradation; Springer International Publishing: Cham, Switzerland, 2020; pp. 1–26. [Google Scholar]
- Zuo, Y.T.; Cheng, S.; Jiang, H.-H.; Han, Y.-Z.; Ji, W.-X.; Wang, Z.; Zhou, Q.; Li, A.-M.; Li, W.-T. Release and removal of algal organic matter during perchlorating and coagulation treatment of cyanobacteria-laden water: Are we on track? Sci. Total Environ. 2022, 824, 153793. [Google Scholar] [CrossRef] [Scilit]
- Cao, B.D.; Zhang, Y.; Shi, Y.; Ren, R.; Wu, H.; Zhang, W.; Wang, D.; Zhang, T.; Xiong, J. Extracellular organic matter (EOM) distribution characteristic in algae electro-dewatering process. J. Environ. Manag. 2020, 265, 110541. [Google Scholar] [CrossRef] [Scilit]
- Lin, J.-L.; Sidik, F. Effect of extracellular organic matter (EOM) accumulation on algal proliferation and disinfection by-product precursors during cyclic cultivation. Environ. Sci. Water Res. Technol. 2024, 10, 3024–3034. [Google Scholar] [CrossRef] [Scilit]
- Zhou, Z.; Sun, T.; Li, X.; Ren, J.; Lu, Z.; Liu, Y.; Li, K.; Qu, F. Reliable assessment and prediction of moderate preoxidation of sodium hypochlorite for algae-laden water treatment. Water Res. 2024, 266, 122398. [Google Scholar] [CrossRef] [Scilit] [PubMed]
- Li, Z.; Wang, C.; Zhu, W.; Mu, B.; Chen, S.; Sun, J. A Study of Salvaged Cyanobacteria Slurry Treatment Using Liquefied Dimethyl Ether: Dehydration and Organic Matter Extraction. ACS Sustain. Chem. Eng. 2021, 9, 14644–14652. [Google Scholar] [CrossRef] [Scilit]
- Yang, R.M.; Zhang, Z.N.; Zheng, T.L.; Cheng, X.Y. Vacuum Dewatering Behaviours of Municipal Sewage Sludge. Iran. J. Sci. Technol. Trans. Civ. Eng. 2025, 49, 719–731. [Google Scholar]
- Sun, X.; Yuan, T.; Ni, H.; Li, Y.; Hu, Y. Variation in assimilable organic carbon formation during chlorination of M. aeruginosa extracellular organic matter solutions. J. Environ. Sci. 2016, 45, 1–6. [Google Scholar] [CrossRef] [Scilit]
- Ding, W.; Lin, Z.; Wu, X.; Zhang, X.; Zhang, H. Study on the breakage mechanism of algal floc in coagulation flow field. Sep. Purif. Technol. 2025, 365, 132655. [Google Scholar] [CrossRef] [Scilit]
- Yang, S.; Wu, M.; Hou, L.; Yu, S.; Tang, Y. Evaluation of ferrate (VI) for enhanced coagulation of algae-rich water: Mechanisms of M. aeruginosa cell dehydration. Sep. Purif. Technol. 2023, 308, 122960. [Google Scholar] [CrossRef] [Scilit]
- Zhang, X.; Wang, Z.; Luo, Z.; Chen, Y.; Huang, X. Insights into the conversion of dissolved organic phosphorus favors algal bloom, arsenate biotransformation and microcystins release of M. aeruginosa. J. Environ. Sci. 2023, 125, 205–214. [Google Scholar] [CrossRef] [Scilit]
- Liu, W.-H.; Zhang, H.; Zhang, Y.-L.; Sun, P.; Zeng, Y.-P.; Gao, Y.-Y.; Wang, H.-F.; Zeng, R.J. Beyond filterability: Understanding the complexities of sludge dewatering through typical coagulation and advanced oxidation. J. Clean. Prod. 2023, 429, 139520. [Google Scholar] [CrossRef] [Scilit]
- Baranwal, P.; Kang, D.W.; Seo, Y. Impacts of algal organic matter and humic substances on microcystin-LR removal and their biotransformation during the biodegradation process. Sci. Total Environ. 2022, 852, 157993. [Google Scholar] [CrossRef] [Scilit] [PubMed]
- Ding, W.; Lin, Z.; Wu, X. Tracking the transformation of extracellular polymeric substances during the ultraviolet/peracetic acid disinfection process: Insights into membrane fouling mitigation and underlying mechanisms. Water Res. 2024, 248, 120852. [Google Scholar]
- De Souza, A.O.; Teramoto, K.K.; de Freitas, P.N.N.; de Almeida, É.C.; Ferreira Filho, S.S.; Pinto, E. Effect of pre-chlorination on M. aeruginosa cell integrity and microcystins removal. Urban Water J. 2023, 20, 968–978. [Google Scholar] [CrossRef] [Scilit]
- Sun, L.; Tian, Y.; Li, H.; Wang, Q. Fouling potentials and properties of foulants in an innovative algal-sludge membrane bioreactor. Environ. Int. 2021, 151, 106439. [Google Scholar] [CrossRef] [Scilit] [PubMed]
- Jiang, X.; Xie, Y.; Liu, M.; Bin, S.; Liu, Y.; Huan, C.; Ji, G.; Wang, X.; Yan, Z.; Lyu, Q. Study on anaerobic co-digestion of municipal sewage sludge and fruit and vegetable wastes: Methane production, microbial community and three-dimension fluorescence excitation-emission matrix analysis. Bioresour. Technol. 2022, 347, 126748. [Google Scholar] [CrossRef] [Scilit] [PubMed]
- Vaxelaire, J.; Cézac, P. Moisture distribution in activated sludges: A review. Water Res. 2004, 38, 2215–2230. [Google Scholar] [CrossRef] [Scilit]
- Ahmadi Barshahi, P.; Hasani Zonoozi, M.; Saeedi, M. Rifampin removal using electrocoagulation: Optimizing the process and improving the floated sludge dewaterability. Int. J. Environ. Sci. Technol. 2023, 20, 6275–6290. [Google Scholar] [CrossRef] [Scilit]
- HJ 586-2010; Water Quality—Determination of Free Chlorine and Total Chlorine-Spectrophotometric Method Using N,N-diethyl-1,4-phenylenediamine. Ministry of Environmental Protection of the People’s Republic of China: Beijing, China, 2010.
- HJ 828-2017; Water Quality—Determination of Chemical Oxygen Demand—Dichromate Method. Ministry of Environmental Protection of the People’s Republic of China: Beijing, China, 2017.
- Zheng, G.Y.; Huo, M.B.; Zhou, L.X. Extracellular Polymeric Substances Level Determines the Sludge Dewaterability in Bioleaching Process. J. Environ. Eng. 2016, 142, 04015060. [Google Scholar] [CrossRef] [Scilit]
- Chen, Y.; Chen, H.; Li, J.; Xiao, L. Rapid and efficient activated sludge treatment by electro-Fenton oxidation. Water Res. 2019, 152, 181–190. [Google Scholar] [CrossRef] [Scilit] [PubMed]
- Zhang, Y.; Cao, B.; Ren, R.; Shi, Y.; Xiong, J.; Zhang, W.; Wang, D. Correlation and mechanism of extracellular polymeric substances (EPS) on the effect of sewage sludge electro-dewatering. Sci. Total Environ. 2021, 801, 149753. [Google Scholar] [CrossRef] [Scilit] [PubMed]
- He, S.; Feng, L.; Zhao, W.; Li, J.; Zhao, Q.; Wei, L. Composition and molecular structure analysis of hydrophilic/hydrophobic extracellular polymeric substances (EPS) with impacts on sludge dewaterability. Chem. Eng. J. 2023, 462, 142234. [Google Scholar] [CrossRef] [Scilit]
- Shafiqu, M.U.; Islam, A.T.M.K.; Islam, M.S. Characterization of Dissolved Organic Matter (DOM) in Water by Fluorescence Spectroscopy. Environ. Monit. Assess. 2019, 191, 462. [Google Scholar]
- Zhang, H.; Lu, X.; Song, L.; Zhang, L. Effects of Loosely Bound EPS Release and Floc Reconstruction on Sludge Dewaterability. Water Air Soil Pollut. 2018, 229, 27. [Google Scholar] [CrossRef] [Scilit]
- Mao, H.; Chi, Y.; Wang, F.; Mao, F.; Liang, F.; Lu, S.; Cen, K. Effect of Ultrasonic Pre-treatment on Dewaterability and Moisture Distribution in Sewage Sludge. Waste Biomass Valorization 2018, 9, 247–253. [Google Scholar]
- Zhang, W.; Dong, B.; Dai, X. Mechanism analysis to improve sludge dewaterability during anaerobic digestion based on moisture distribution. Chemosphere 2019, 227, 247–255. [Google Scholar] [CrossRef] [Scilit] [PubMed]
- He, S.; Zhao, L.; Liu, Y.; Feng, L.; Hu, T.; Gao, Z.; Zhao, Q.; Wei, L.; You, S. Multiple drivers and mechanisms of solid-water interfacial interactions in sludge dewatering: Roles of polarity and molecular structure of extracellular polymeric substances. Water Res. 2024, 263, 122180. [Google Scholar] [CrossRef] [Scilit] [PubMed]
- Rozenberg, M.; Lansky, S.; Shoham, Y.; Shoham, G. Spectroscopic FTIR and NMR study of the interactions of sugars with proteins. Spectrochim. Acta A Mol. Biomol. Spectrosc. 2019, 222, 116861. [Google Scholar] [CrossRef] [Scilit] [PubMed]
- Cheng, Q.L.; Liu, Z.Y.; Xu, M. Regulation and role of extracellular polymeric substances in the defensive responses of Dictyosphaerium sp. to enrofloxacin stress. Sci. Total Environ. 2023, 896, 165302. [Google Scholar] [CrossRef] [Scilit] [PubMed]
- Kong, Y.; Kang, J.; Shen, J.; Chen, Z.; Fan, L. Influence of humic acid on the removal of arsenate and arsenic by ferric chloride: Effects of pH, As/Fe ratio, initial as concentration, and co-existing solutes. Environ. Sci. Pollut. Res. 2017, 24, 2381–2393. [Google Scholar]
- Zhang, H.; Lin, H.; Li, Q.; Cheng, C.; Shen, H.; Zhang, Z.; Zhang, Z.; Wang, H. Removal of refractory organics in wastewater by coagulation/flocculation with green chlorine-free coagulants. Sci. Total Environ. 2021, 787, 147654. [Google Scholar] [CrossRef] [Scilit] [PubMed]
- GB 18918-2002; Discharge Standard of Pollutants for Municipal Wastewater Treatment Plant. Ministry of Ecology and Environment of China: Beijing, China, 2002.
- GB 3838-2002; Environmental Quality Standards for Surface Water. Ministry of Ecology and Environment of China: Beijing, China, 2002.
- Zhang, H.; Liu, W.-H.; Gao, Y.-Y.; Sun, P.; Zeng, Y.-P.; Ma, L.-L.; Wu, J.-N.; Zhou, S.-G.; Cui, X.-Q.; Zeng, R.J.; et al. A novel approach for sludge deep-dewatering via flowing-out enhancement but not relying on cell lysis and bound water release. Water Res. 2024, 257, 121743. [Google Scholar] [CrossRef] [Scilit] [PubMed]

Disclaimer/Publisher’s Note: The statements, opinions and data contained in all publications are solely those of the individual author(s) and contributor(s) and not of MDPI and/or the editor(s). MDPI and/or the editor(s) disclaim responsibility for any injury to people or property resulting from any ideas, methods, instructions or products referred to in the content. |
© 2026 by the authors. Licensee MDPI, Basel, Switzerland. This article is an open access article distributed under the terms and conditions of the Creative Commons Attribution (CC BY) license.