


Abstract
Land-use change from natural vegetation to agricultural systems significantly affects watershed hydrology and water quality. This study assesses the long-term effects of historical land-use change on hydrologic processes and nitrogen transport in the Straight River watershed, Minnesota, USA, using the Soil and Water Assessment Tool Plus (SWAT+) model. Three land-use scenarios were created to assess changes in water balance and nitrate levels. These scenarios represent the reconstructed pre-settlement conditions from 1855, established agricultural development from 2006, and current conditions from 2022. Results show a significant increase in water percolation and groundwater recharge. Percolation more than doubled, increasing from about 118 mm under reconstructed pre-colonial conditions to over 256 mm in 2022. Streamflow increased to 2.1 m3s−1 in 2022, indicating improved hydrologic connectivity and groundwater contributions. Nitrate leaching increased from about 1.14 kg N ha−1 to more than 32 kg N ha−1 (1850s–2022), and nitrate export increased by >2000%, indicating strong nitrate loading. The significant increase in nitrate compared to water fluxes points to agriculture as the primary source of groundwater pollution and downstream nutrient loading. These findings highlight the importance of land-use change in affecting water balance and nutrient behavior. They also point out the need to include a historical baseline in watershed assessments. The results show the importance of better land and nutrient management strategies to reduce nitrate losses and protect water resources in intensively managed agricultural areas.
1. Introduction
Land use and land cover (LULC) change from forested watersheds to agriculture is a major driver in changing watershed hydrology and water quality [1,2,3,4]. Global large-scale transitions from forests and wetlands to agricultural land over the past three centuries have significantly altered the structure and functioning of terrestrial ecosystems, mainly driven by a rapid increase in the area under agricultural land and pastureland since the 1700s [5,6]. The natural water balance has been altered due to these changes, and this has also increased the nutrient losses from the watersheds and resulted in lower water quality [7,8].
Changes in vegetation cover have affected various hydrological processes [9]. Transition from deep-rooted vegetation, such as forests, shrubs, and wetlands, to annual crops with shallow roots results in lower evapotranspiration, which ultimately increases the amount of water infiltrating and percolating through the soil profile [10,11,12]. Recent research has shown that an increase in intensive agriculture can increase the groundwater recharge and subsurface flow pathways. The main reason behind it could be increased irrigation and deep percolation [13,14]. Soil disturbances from various farming practices, including tillage, change soil structure and pore connectivity. They disrupt the soil aggregates and change the size, distribution, and connectivity of soil pores. These disturbances can create larger and more connected flow pathways, known as macropores, allowing water and dissolved nutrients to move more rapidly through the soil profile. As a result, hydrologic connectivity increases, enhancing the rapid movement of water and nutrients through the soil profile [15].
Land-use change also has major impacts on nitrogen cycling. The high dependence of modern agriculture on synthetic fertilizers results in high nitrogen inputs. Because crops do not take up all of the applied nitrogen, the remaining nitrogen is instead lost to the environment through processes such as leaching, runoff, volatilization, and denitrification [16,17]. Global assessments show that the major source of nitrate pollution in both groundwater and surface water is agricultural activities, which result in increased fertilizer application and, as a result, high nitrogen losses [18], whereas forests and wetlands typically act as nutrient sinks, reducing nitrogen losses through plant uptake and microbial processes such as denitrification, which results in improved downstream water quality [19,20].
The interaction between the availability of nitrogen and hydrologic changes is a key factor in controlling nitrate transport. Increased percolation and groundwater recharge increase the downward movement of nitrate beyond the root zone, which results in increased accumulation in the subsurface reservoirs and ultimately results in groundwater contamination [21,22]. At the same time, increased streamflow and runoff lead to increased nitrate export in surface waters. Elevated nitrogen levels lead to eutrophication and hypoxic conditions in downstream water bodies [21,23].
A similar land-use transition occurred in Minnesota as well, which shows a long-term history of deforestation and agricultural expansion. Before Euro-American settlement, Minnesota’s landscape was fully covered with coniferous forests in the north, deciduous forests in central and southeastern regions, and prairie grasslands and wetlands in the western parts of the state [24,25,26]. Around 61% of Minnesota’s land area (31.5 million acres) was covered by forests [25]. Before settlement, there was a mixture of prairie grasslands, savannas, wetlands, and forests that formed a transition zone between the Great Plains and eastern forests in the Midwestern United States. But at the time of Euro-American settlement, logging, agricultural expansion, and land clearing resulted in an extreme transformation of these landscapes [24]. After the land cession treaties, the Homestead Act, and the expansion of railroad networks, Minnesota experienced large-scale agricultural expansion during the nineteenth century, leading to settlement and cultivation across the state [26]. Southeastern Minnesota experienced early agricultural development near river transportation systems, which then expanded westward due to railroad construction and settlement pressure [26]. During this time, Minnesota experienced a rapid increase in agricultural land, particularly for large-scale wheat production. By the late nineteenth century, wheat became the main crop, making up around 70% of total farmland by 1878 [26]. In recent years, agriculture has become more intensive, with row-crops, particularly corn cultivation, becoming increasingly prevalent throughout Minnesota’s landscapes [27].
The Straight River watershed in Minnesota is a clear example of a vulnerable agricultural area in which increased agricultural intensification could significantly impact the hydrology and water quality. Over the past three decades, farmers have begun growing irrigated row crops such as corn, soybeans, and potatoes. These changes have raised concerns about groundwater quality, nitrate leaching, and nutrient runoff in surface water in the watershed [28]. The watershed is particularly important because it supports one of Minnesota’s premier cold-water trout fisheries while simultaneously undergoing increasing agricultural intensification and groundwater-supported irrigation. Because streamflow is strongly dependent on groundwater discharge, increases in nitrate leaching from agricultural lands may affect both groundwater quality and the aquatic ecosystem that depends on clean cold groundwater inputs. In addition to its ecological importance, the watershed is located within a region where aquatic resources have long-standing cultural significance for Tribal Nations and local communities. Concerns have been raised regarding how historical land-use change may have altered the environmental conditions that support resources associated with treaty-reserved hunting, fishing, and gathering rights. Establishing a historical baseline and evaluating how watershed processes have changed since the mid-nineteenth century can improve understanding of the long-term consequences of agricultural development on hydrology and water quality. Understanding how historical land-use change has altered hydrologic and nitrogen transport processes is therefore important for informing management strategies that support both agricultural productivity and protection of water resources.
Most studies looking at how changes in land use affect watershed hydrology and nitrogen transport have focused on recent decades and do not account for long-term changes in comparison to reconstructed pre-colonial conditions. The lack of a historical land-use baseline limits our ability to look at the entire spectrum of how human activities have impacted the watershed over time. There are a few studies that reconstructed pre-settlement landscapes and assessed hydrologic and nitrogen responses over a 100-year period, especially in watersheds or regions with dominant agricultural practices in North America [21,29].
To address this gap, this study compares the pre-settlement (1850s), established agriculture (2006), and modern agriculture (2022) land-use scenarios to investigate the long-term impacts of land-use change on hydrology and nitrogen transport in the Straight River watershed. Changes in hydrologic and nitrogen-dynamic components, such as water percolation, groundwater recharge, streamflow, nitrate leaching, groundwater transport, and nitrate runoff, were quantified using the SWAT+ modeling framework. This study integrates historical land-use reconstruction with process-based modeling [30,31] to provide a holistic view of how watershed processes have changed over time under increasing intensive agriculture.
The specific objectives of this study are to: (1) quantify changes in water percolation and groundwater recharge linked to land-use change, (2) evaluate the magnitude and spatial distribution of nitrate leaching, and (3) assess the combined effects of hydrological changes and intensive agriculture on nitrate transport to groundwater and surface waters.
2. Study Area
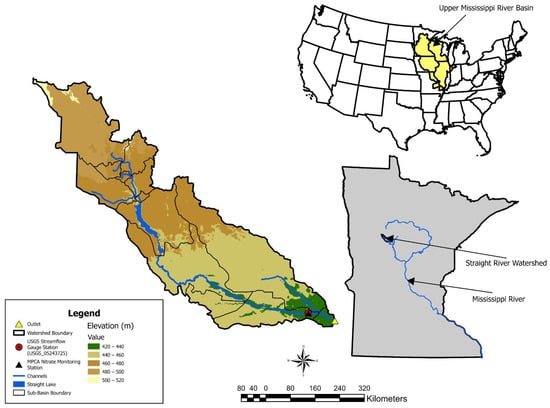
The Straight River is one of the top cold-water trout streams in Minnesota, and includes Straight Lake, a natural lake located in the middle reach of the watershed, with a total watershed area of 21,352.41 hectares. It is located just west of Park Rapids, in Hubbard County, Minnesota, USA, and is part of the Upper Mississippi River Basin, as shown in Figure 1. Groundwater discharge is the dominant source of streamflow in the Straight River, and it plays an important role in maintaining the cold-water conditions that support trout populations [28,32].
Figure 1.
Location of the Straight River watershed.
The Straight River watershed is underlain by Quaternary glacial outwash deposits, which are composed of sand and gravel and form the Pineland Sands aquifer system [28,32]. These deposits commonly extend 6–12 m below the land surface and exceed 30 m in some locations [28]. The watershed is dominated by coarse-textured sandy soils derived from glacial outwash deposits, which are characterized by high hydraulic conductivity, rapid infiltration, and strong groundwater connectivity. These soil properties promote groundwater recharge and stream-aquifer interactions but also increase susceptibility to nitrate leaching from agricultural lands. Spatial variations in sediment texture and depositional layering influence groundwater flow velocities and stream-aquifer connectivity [28,32]. Groundwater contributes greatly to this river, making it an ideal habitat for trout [32].
The climate in this region is characterized by cold winters with snowfall and warmer, wetter summers with significant precipitation. Mean annual precipitation in the watershed is approximately 702 mm, with most precipitation occurring during the growing season (May–September). Mean annual potential evapotranspiration is approximately 560 mm [32]. Snow accumulation and spring snowmelt are important contributors to annual groundwater recharge and streamflow generation.
The majority of the watershed is covered by agricultural land (47.701%), followed by forests (25.668%). Additionally, the region includes shrubs and wetlands. Since the early 1990s, farmers have shifted to growing more crops and using shallow aquifers to irrigate them [28]. Irrigation within the watershed is primarily applied using center-pivot sprinkler systems that withdraw water from the surficial aquifer. This shift towards row cropping resulted in higher nitrate levels in the groundwater aquifer surrounding the Park Rapids area, which in some areas exceeded the Minnesota drinking water standard of 10 mg L−1 [28]. Unlike many agricultural watersheds in the Midwestern United States, where subsurface tile drainage strongly affects hydrologic response, the Straight River watershed is dominated by naturally well-drained sandy soils, and extensive artificial drainage systems are not a major watershed feature [28,32]. Detailed crop management schedules, fertilizer applications, and irrigation operations used in the SWAT+ simulations are provided in Tables S1 and S2.
Given these characteristics, the Straight River watershed provides an ideal setting for evaluating the long-term impacts of land-use change on hydrology and nitrogen transport.
3. Methodology
3.1. SWAT+ Model
The Soil and Water Assessment Tool Plus (SWAT+) version 61.0.02.61 (released 16 January 2026) was implemented through SWAT+ Editor version 3.2.1 to simulate hydrologic and nitrogen transport processes in the Straight River watershed [31,33]. SWAT+ is a widely used process-based watershed model for evaluating water quantity, water quality, and the impacts of climate change, land-use and management practices on watershed systems. This model divides the drainage basin into sub-basins, which are further subdivided into Hydrological Response Units (HRUs) (homogeneous areas in terms of soil, land use, and slope) [31]. Variations among HRUs in the model give us the spatial variations in water dynamics. The water balance equation (Equation (1)) serves as the fundamental basis for the model’s hydrology and is shown below:
where and is the final soil water content (mm) and the initial soil water content in day i (mm), is precipitation in day i (mm), is the surface runoff in day i (mm), is the amount of ET in day i (mm), is the amount of water entering the vadose zone from soil profile on day i (mm), and is the groundwater discharge in day i (mm) [34].
3.2. Model Inputs
SWAT+ requires accurate, high-resolution data on LULC, soils, and climate records. The key inputs of SWAT+ are listed in Table 1 and can be classified as spatial and temporal data [30]. Spatial datasets such as soil, land-use, and digital elevation data (DEMs) are used to define the basic unit of this model, known as a hydrological response unit (HRU). Temporal input data includes precipitation, maximum and minimum temperatures, relative humidity, wind speed, and solar radiation. In this study, weather parameters were sourced from Daymet (Oak Ridge National Laboratory, Oak Ridge, TN, USA), NASA POWER (National Aeronautics and Space Administration, Greenbelt, MD, USA), and the local airport from 1985 to 2022. Additional descriptions of the climate and soil datasets used in the SWAT+ simulations are provided in the Supplementary Materials (Tables S3 and S4).
Table 1.
Inputs of the SWAT+ model setup and data used for calibration.
In this study, monthly streamflow records were gathered from the USGS (United States Geological Survey) gauge station near the outlet of the Straight River watershed (USGS-05243725) for the period 1986–2022, and Stream nitrate concentration data were obtained from the Minnesota Pollution Control Agency (MPCA) surface water monitoring database for the period of 2015–2016 and 2020 to 2022. The nitrate observations were collected at MPCA monitoring station S002-960, as shown in Table 1. Nitrate concentrations were available as approximately monthly discrete samples. We obtained daily streamflow data from the USGS gauge station and then aggregated to monthly mean streamflow values. These calculated monthly values were then paired with the corresponding monthly nitrate concentration measurements collected during the same month. After that, we calculated the monthly nitrate loads using a simple concentration–discharge approach by multiplying the observed nitrate concentration by the corresponding monthly mean streamflow and applying the necessary unit conversions to get nitrate loads (kg/month). Nitrate concentrations were treated as discrete observations and not temporally interpolated between sampling dates. We did not apply flow-weighted averaging because nitrate concentrations were not available at the same temporal frequency as the continuous streamflow records. Therefore, monthly load estimates were calculated only for months in which nitrate concentration observations were available.
3.3. Land-Use Scenarios
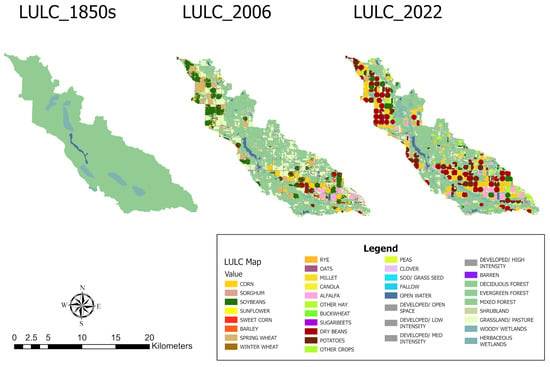
Three land-use scenarios were developed to evaluate the long-term effects of watershed development on hydrologic and nitrogen dynamics. The reconstructed 1855 scenario represents conditions prior to widespread agricultural development and was characterized by extensive forest, grassland, and wetland cover. The established agriculture scenario (2006) shows an intermediate stage of agricultural development within the watershed, whereas the modern agricultural scenario (2022) highlights the current land-use conditions, including expanded row-crop agriculture and irrigation. We used these three scenarios to evaluate the effects of historical land-use change on watershed hydrology and nitrate dynamics. The spatial distribution of land-use and land cover for three scenarios is shown in Figure 2.
Figure 2.
Spatial distribution of land use and land cover (LULC) across three different scenarios.
3.4. Model Setup
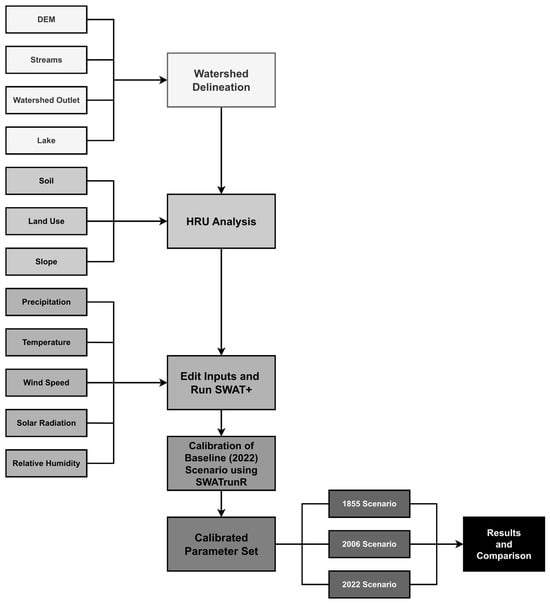
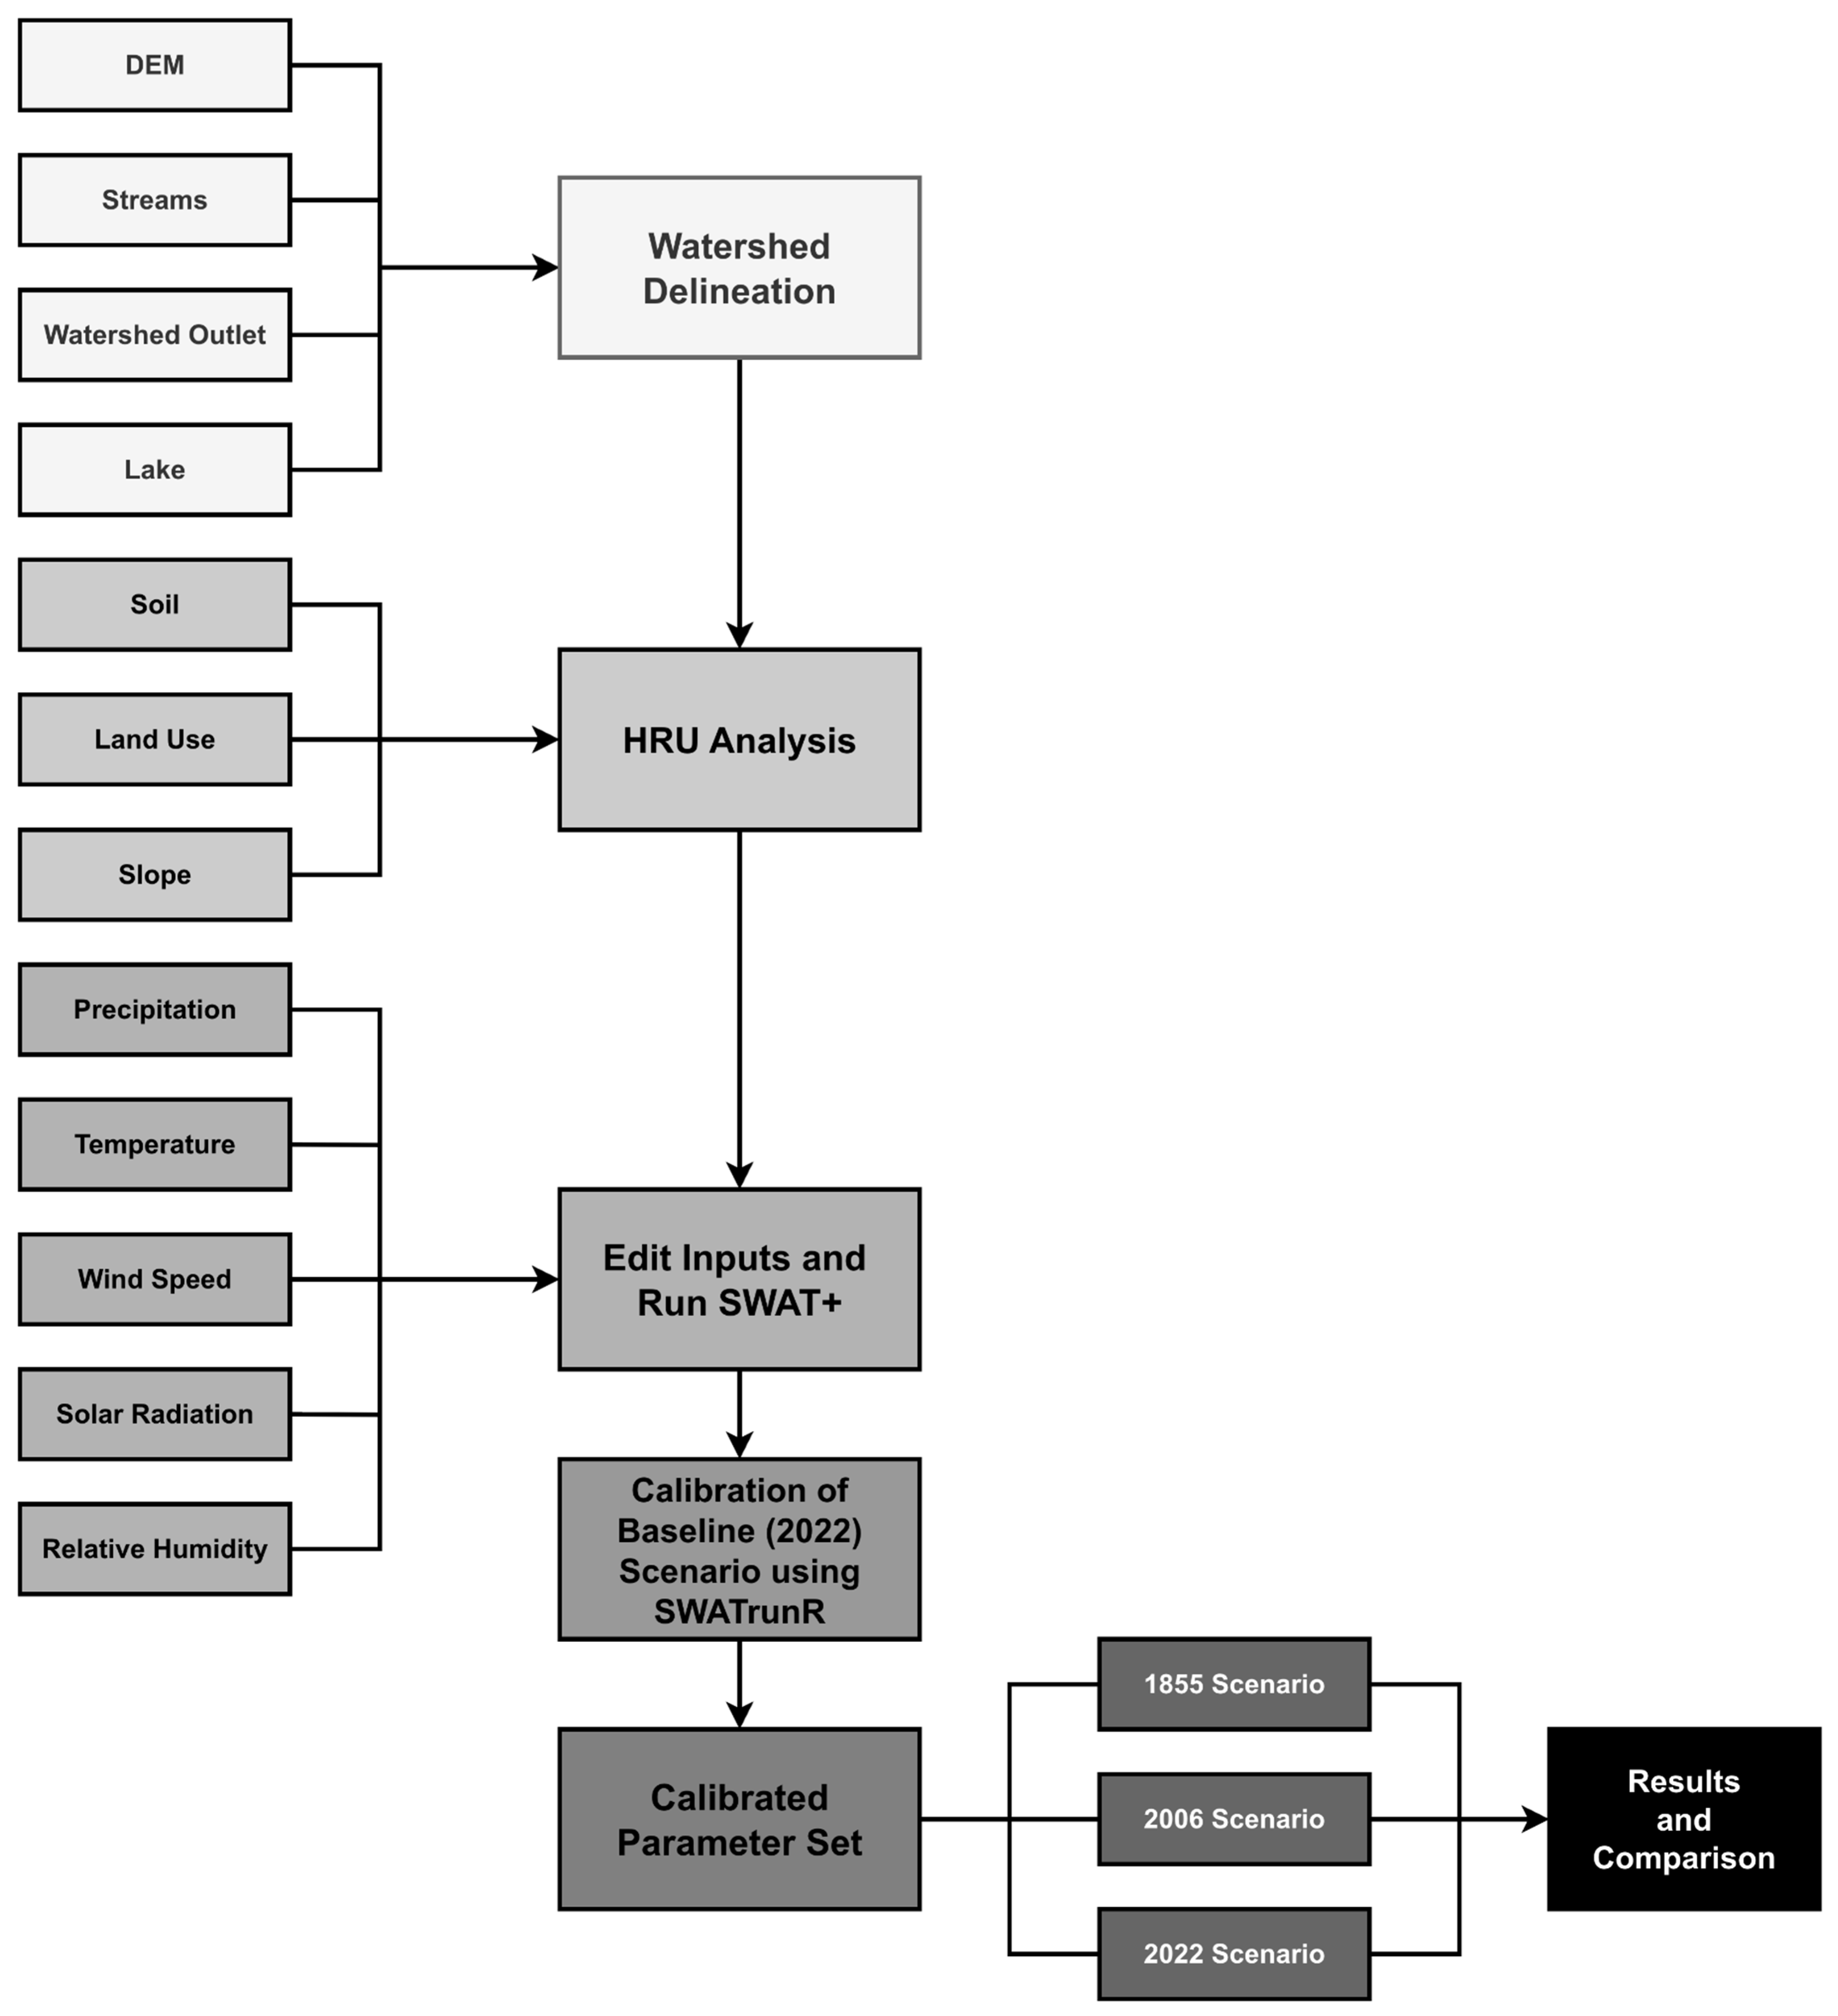
The model setup used in this study is shown in Figure 3. Key steps include watershed delineation, HRU definition, and the incorporation of weather station data. Watershed delineation based on 30-m DEM and stream network resulted in 13 sub-basins representing the major drainage units within the Straight River watershed (Figure 1), and each sub-basin was then divided into HRUs, which represent a unique combination of land use, soil type, and slope. Soil information was obtained from the SSURGO database and incorporated into SWAT+ using the built in SSURGO soil database available within QSWAT+. Soil map units (MUKEYs) were used to define soil spatial variability across the watershed, and associated soil physical and hydraulic properties such as texture, bulk density, available water capacity, saturated hydraulic conductivity, and soil layer characteristics, which SWAT+ uses to simulate hydrologic and nutrient processes. Land-use information for the 2006 and 2022 scenarios was derived from the USDA Cropland Data Layer (CDL), while the 1850s scenario was reconstructed using historical land-cover information. Land-use classes were used to define vegetation characteristics, crop growth, management operations, evapotranspiration, and nutrient cycling processes for each HRU in SWAT+. Each land-use category was linked to the corresponding SWAT+ land-use code, which determines the vegetation and crop characteristics represented in the model. Agricultural land uses were assigned crop-specific management operations, including planting, fertilization, irrigation, and harvest schedules, but forest, wetland, and grassland classes were represented using natural vegetation parametrizations with minimal anthropogenic management inputs. Irrigation was simulated using groundwater from the shallow aquifer through sprinkler systems. Irrigation events were triggered when plant water stress fell below 0.8, with a maximum application depth of 25 mm per event and up to 20 applications per year. To represent the historical expansion of irrigation within the watershed, year-specific decision tables were assigned according to the period when irrigation was introduced in each HRU. HRUs not classified as irrigated were simulated under rainfed conditions without irrigation management operations. A summary of the land-use classifications and corresponding SWAT+ land-use codes is provided in Table S5, along with irrigation operations and detailed crop management schedules used in the simulations, which are shown in Tables S1 and S2, respectively.
Figure 3.
Flow chart of methodology for the SWAT+ model.
Slope was incorporated at the time of HRU delineation using three slope classes (0–2%, 2–5%, and >5%). In this study, during HRU delineation, threshold values of 2% for land use, 10% for soil, and 10% for slope were applied to reduce model complexity while preserving watershed heterogeneity. As a result, the model generated 724 HRUs. HRU areas ranged from 0.09 to 382.59 ha, with a mean of 20.8 ha and a median of 5.67 ha (Figure S1), indicating that the model retained fine-scale spatial variability while maintaining computational efficiency.
3.5. Calibration and Validation
Calibration is the most important step in hydrological modeling because it determines the model’s accuracy. In this study, the SWAT+ model was calibrated and validated using observed monthly streamflow and nitrate runoff data from the USGS gauging station USGS-05243725 and the MPCA monitoring station S002-960, respectively. The simulation period for this study ranges from 1990 to 2022, with a 5-year warm-up period from 1990 to 1995, a calibration period from 1995 to 2010, and a validation period from 2011 to 2022 using the streamflow data. Due to a lack of nitrate runoff data, calibration for nitrate was performed from 2015 to 2017, and validation from 2020 to 2022.
To identify the most sensitive parameters for streamflow and nitrate runoff, sensitivity analysis was performed. The Sobol global sensitivity analysis method was applied in R version 4.5.3 (R Foundation for Statistical Computing, Vienna, Austria) using the SWATrunR package version 0.9.4 to assess parameter sensitivity [35]. Sensitivity analysis, automatic calibration, and statistical evaluations were performed in R version 4.5.3 (R Foundation for Statistical Computing, Vienna, Austria) using the SWATrunR package version 0.9.4. The most sensitive parameters were used to calibrate the streamflow and nitrate runoff. The calibration was conducted using both automatic and manual adjustment methods.
The HydroPSO package version 0.5.1 optimization algorithm in R via the SWATrunR interface was used to perform automatic calibration. HydroPSO is a particle swarm optimization (PSO)-based algorithm widely used for calibrating hydrologic models due to its efficiency in exploring the parameter space and identifying parameter sets [36,37]. During the calibration process, model parameters were adjusted repeatedly until satisfactory agreement between observed and simulated streamflow was achieved. Automatic calibration was complemented with manual calibration, in which key parameters (Table 2) were adjusted individually to assess their influence on the model performance. Then, combined parameter adjustments were analyzed to further refine the model [38,39,40]. After calibrating streamflow, calibrated parameters were kept constant, and then the same procedure was followed to calibrate nitrate runoff at the watershed outlet (Table 3).
Table 2.
Best parameter set for streamflow calibration.
Table 3.
Best parameter set for nitrate calibration.
To determine the goodness of fit for calibration and validation, we assessed the performance using the four statistical metrics, which include the Nash–Sutcliffe efficiency (NSE), the Kling–Gupta efficiency (KGE), the coefficient of determination (R2), and the percent bias (PBIAS) [41,42,43,44]. The equations for NSE, KGE, R2, and PBIAS are given as follows:
In Equations (2)–(5), , are the observed and simulated values, and are the average values of observed and simulated data, n is the total number of data points, and and are the standard deviations of observed and simulated values, respectively, and is the Pearson correlation coefficient between observed and simulated values.
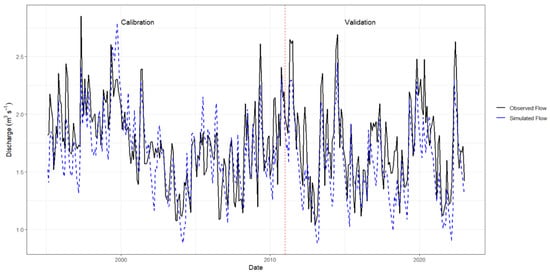
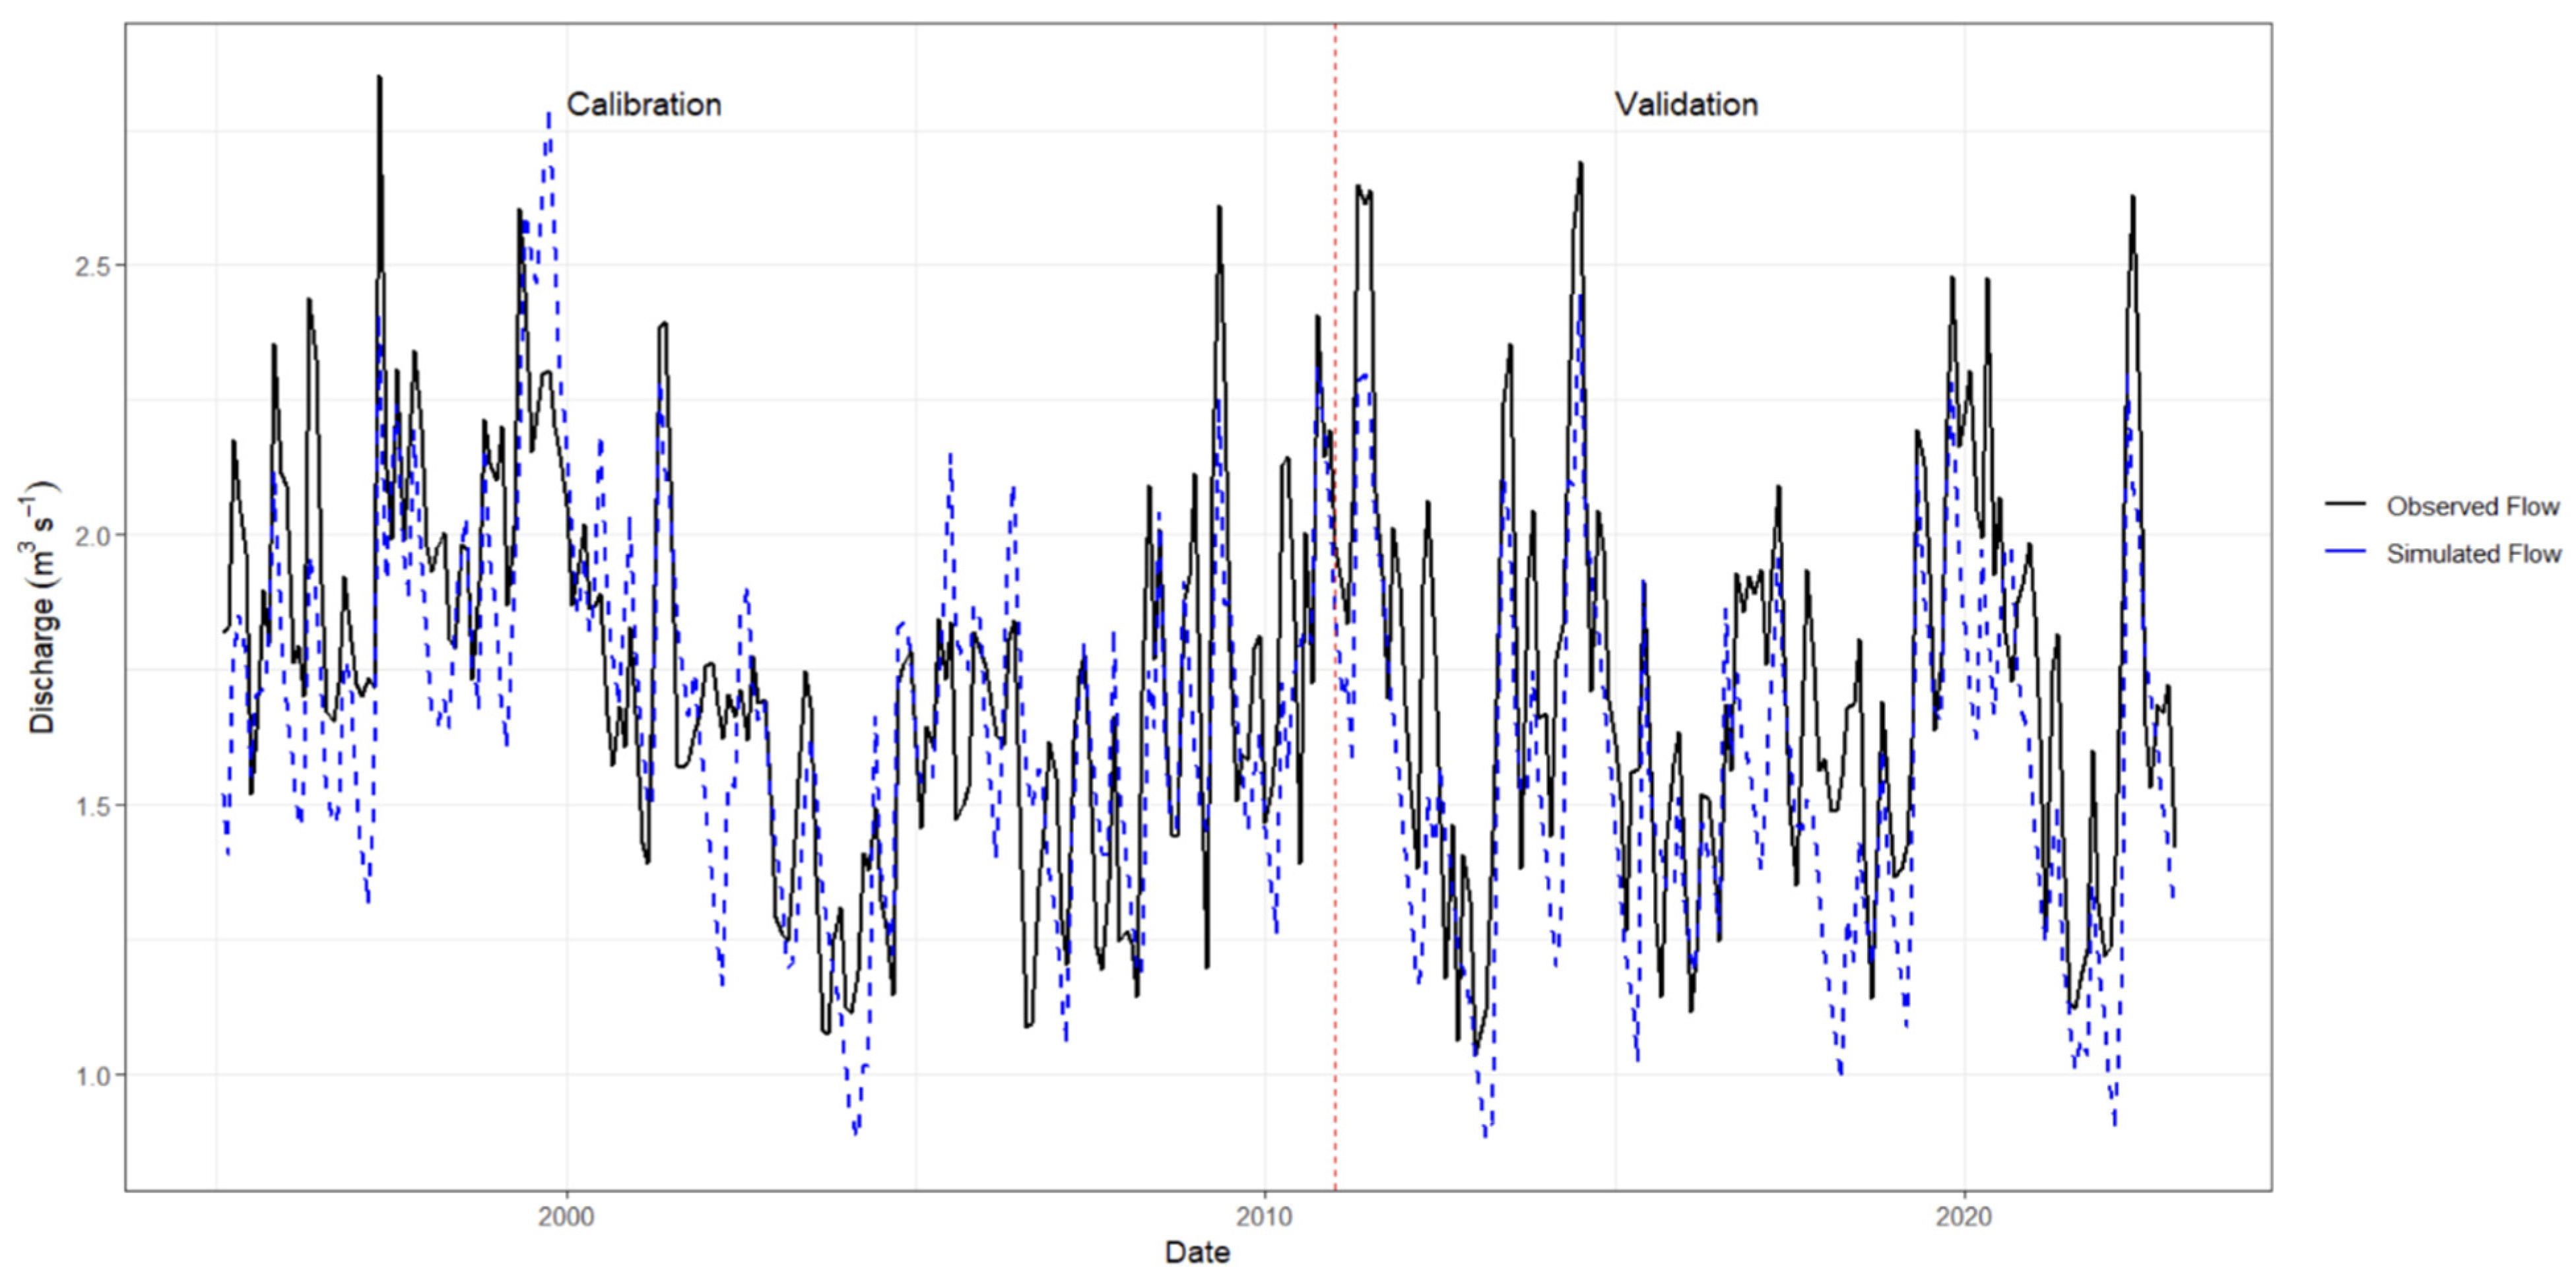
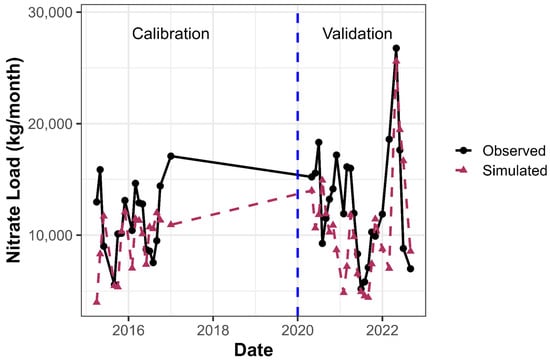
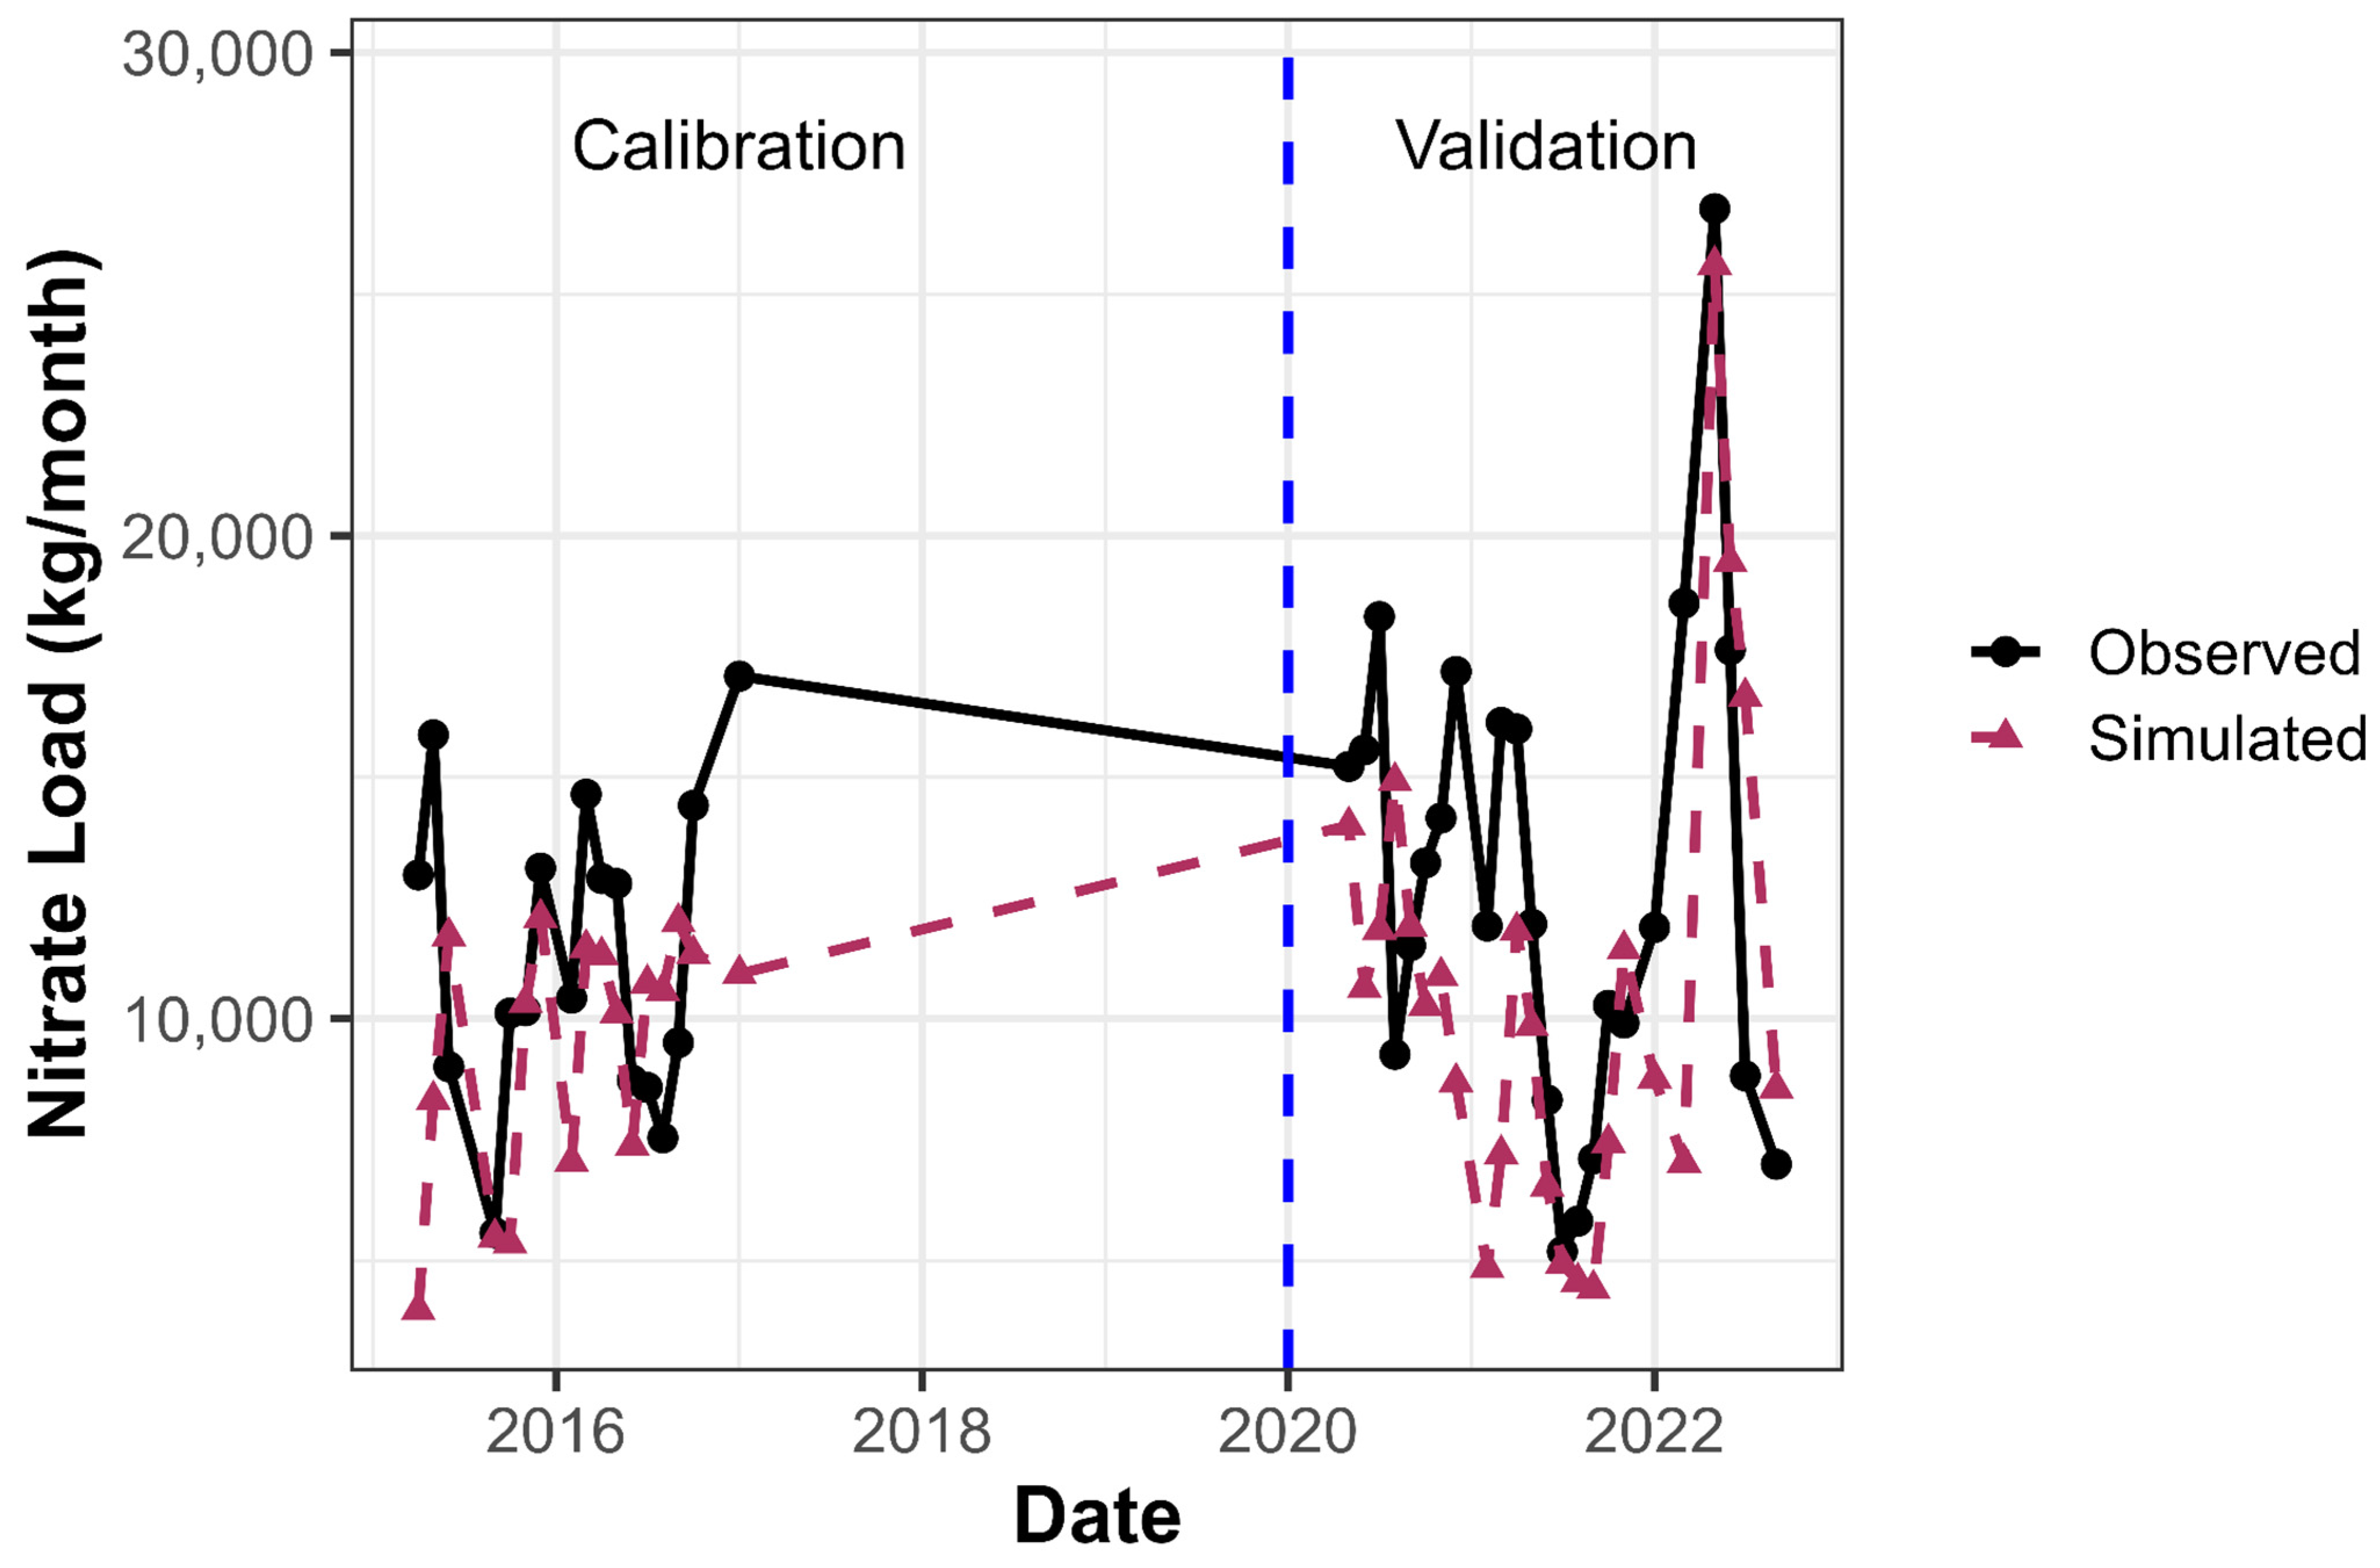
The calibration process was conducted using land cover in 2022. Model parameters were adjusted iteratively using both automatic calibration and manual refinement until satisfactory agreement between observed and simulated values was achieved. The comparison of observed and simulated streamflow and nitrate runoff during calibration and validation periods is shown in Figure 4 and Figure 5, and the related performance statistics are summarized in Table 4.
Figure 4.
Comparison of the observed and simulated monthly streamflow for the Straight River watershed. The red dashed vertical line indicates the separation between the calibration period (1995–2010) and validation period (2011–2022).
Figure 5.
Comparison of the observed and simulated monthly nitrate load for the Straight River watershed. The blue dashed vertical line indicates the beginning of the nitrate validation period (2020–2022). Nitrate calibration was conducted using data from 2015–2017, while no nitrate observations were available for 2018–2019.
Table 4.
Performance of simulated streamflow and nitrate load during calibration and validation periods on a monthly basis.
Overall, the streamflow calibration and validation results showed satisfactory-to-good performance based on the chosen evaluation metrics, indicating that it is suitable for simulating watershed hydrologic processes. Nitrate calibration performance was lower than streamflow calibration because there was not enough long-term observed data. Although the NSE values for nitrate load were low (−0.118 during calibration and −0.09 during validation), the KGE values were 0.40 during calibration and 0.516 during validation. This shows reasonable agreement between observed and simulated nitrate loads. Also, PBIAS values for nitrate load (−17.7% during calibration and −15% during validation) stayed within an acceptable range for water-quality simulations. These results suggest that the calibrated nitrogen model reproduced the overall magnitude of nitrate loads reasonably well, even though it had limitations in capturing temporal variability. Therefore, the nitrogen model was considered suitable for comparing relative differences among land-use scenarios, rather than for the precise prediction of individual nitrate-loading events. Additional uncertainty may be due to crop management practices and groundwater–surface water interactions within the watershed.
The calibrated parameter set from the 2022 scenario was then applied to the historical land-use scenarios from 2006 and the 1850s without change. This method made sure that any differences in model outputs between scenarios came from land-use changes and associated management practices represented by each land-use class, rather than changes in calibrated model parameters. Climatic conditions were kept similar for all three scenarios to focus on the effects of land-use change on hydrologic and nitrogen dynamics. Under the reconstructed 1855 scenario, natural vegetation classes were simulated without any fertilizer application or irrigation, but agricultural HRUs in the 2006 and 2022 scenarios were assigned crop-specific management operations, fertilizer applications, and irrigation schedules as explained in Tables S1 and S2.
4. Results and Discussion
4.1. Land Use Change
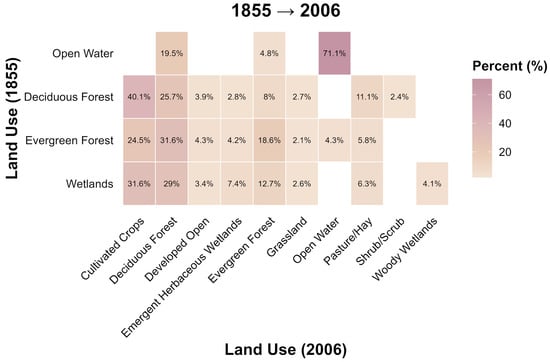
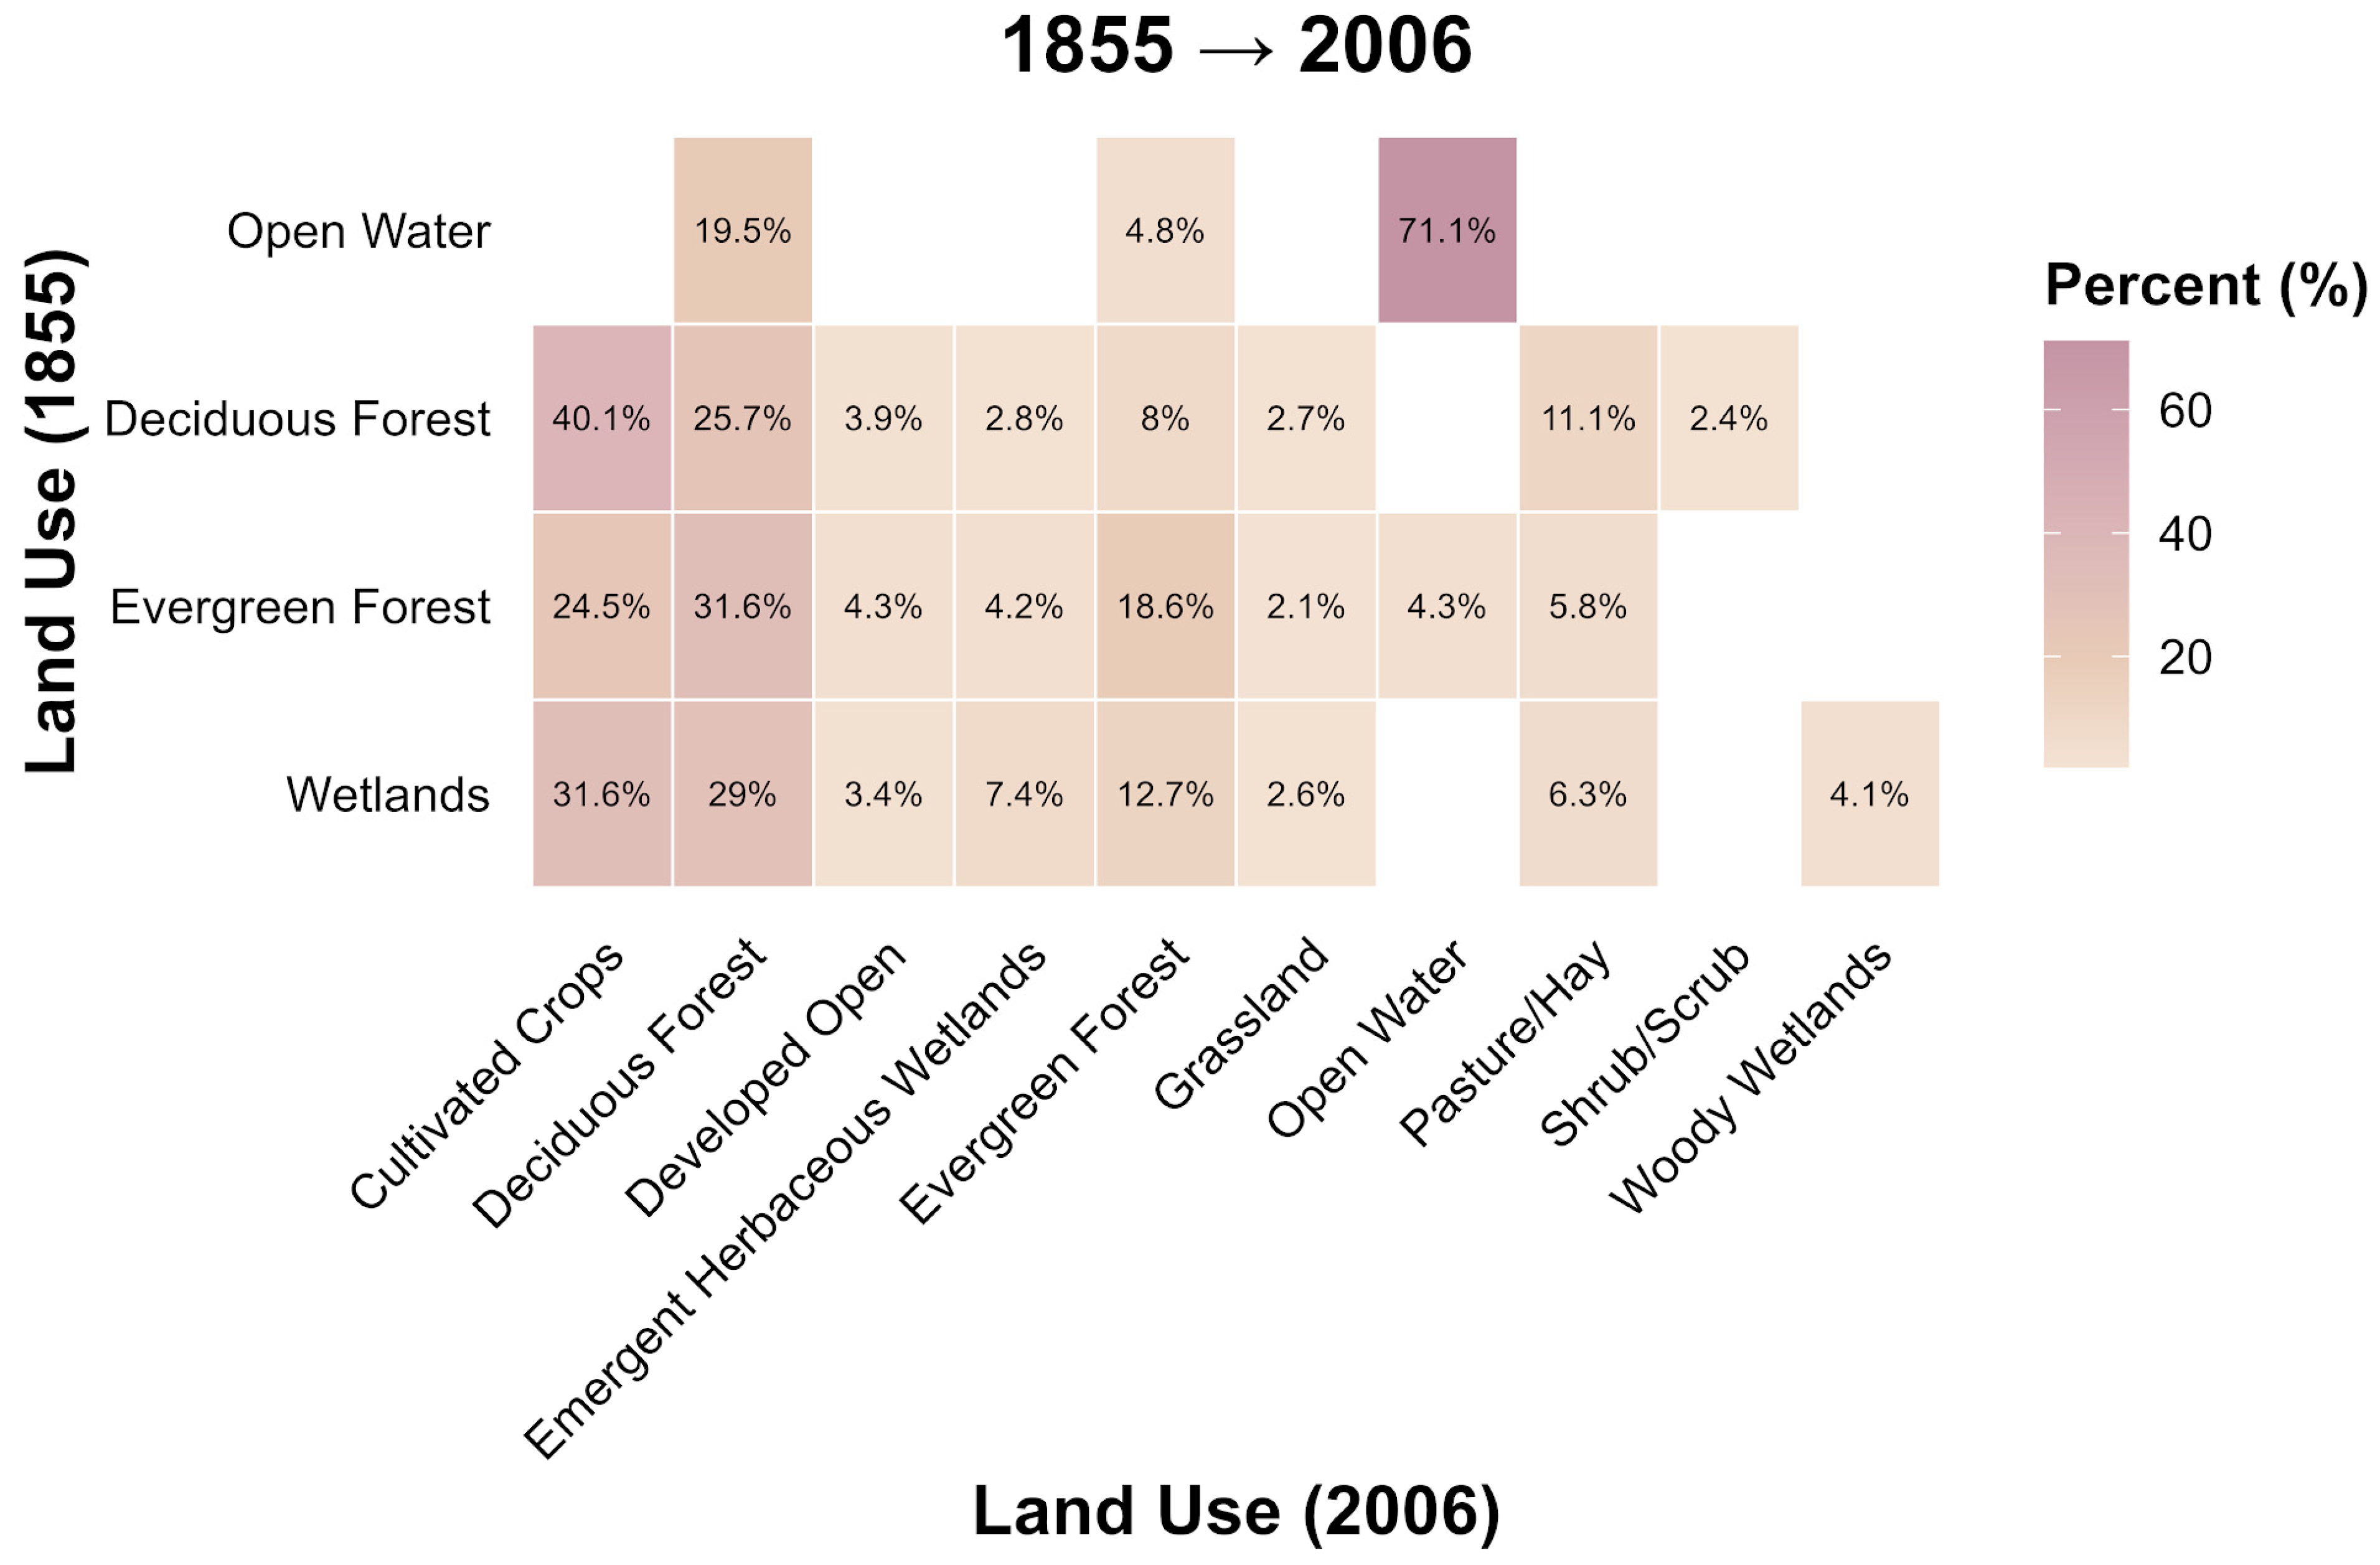
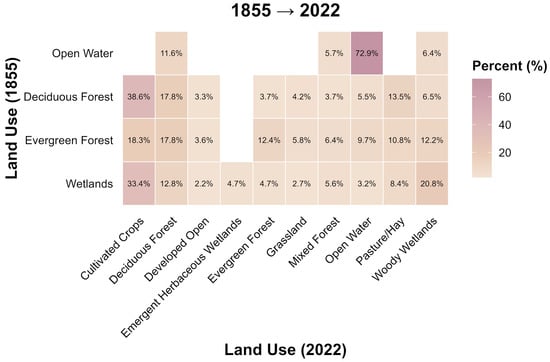
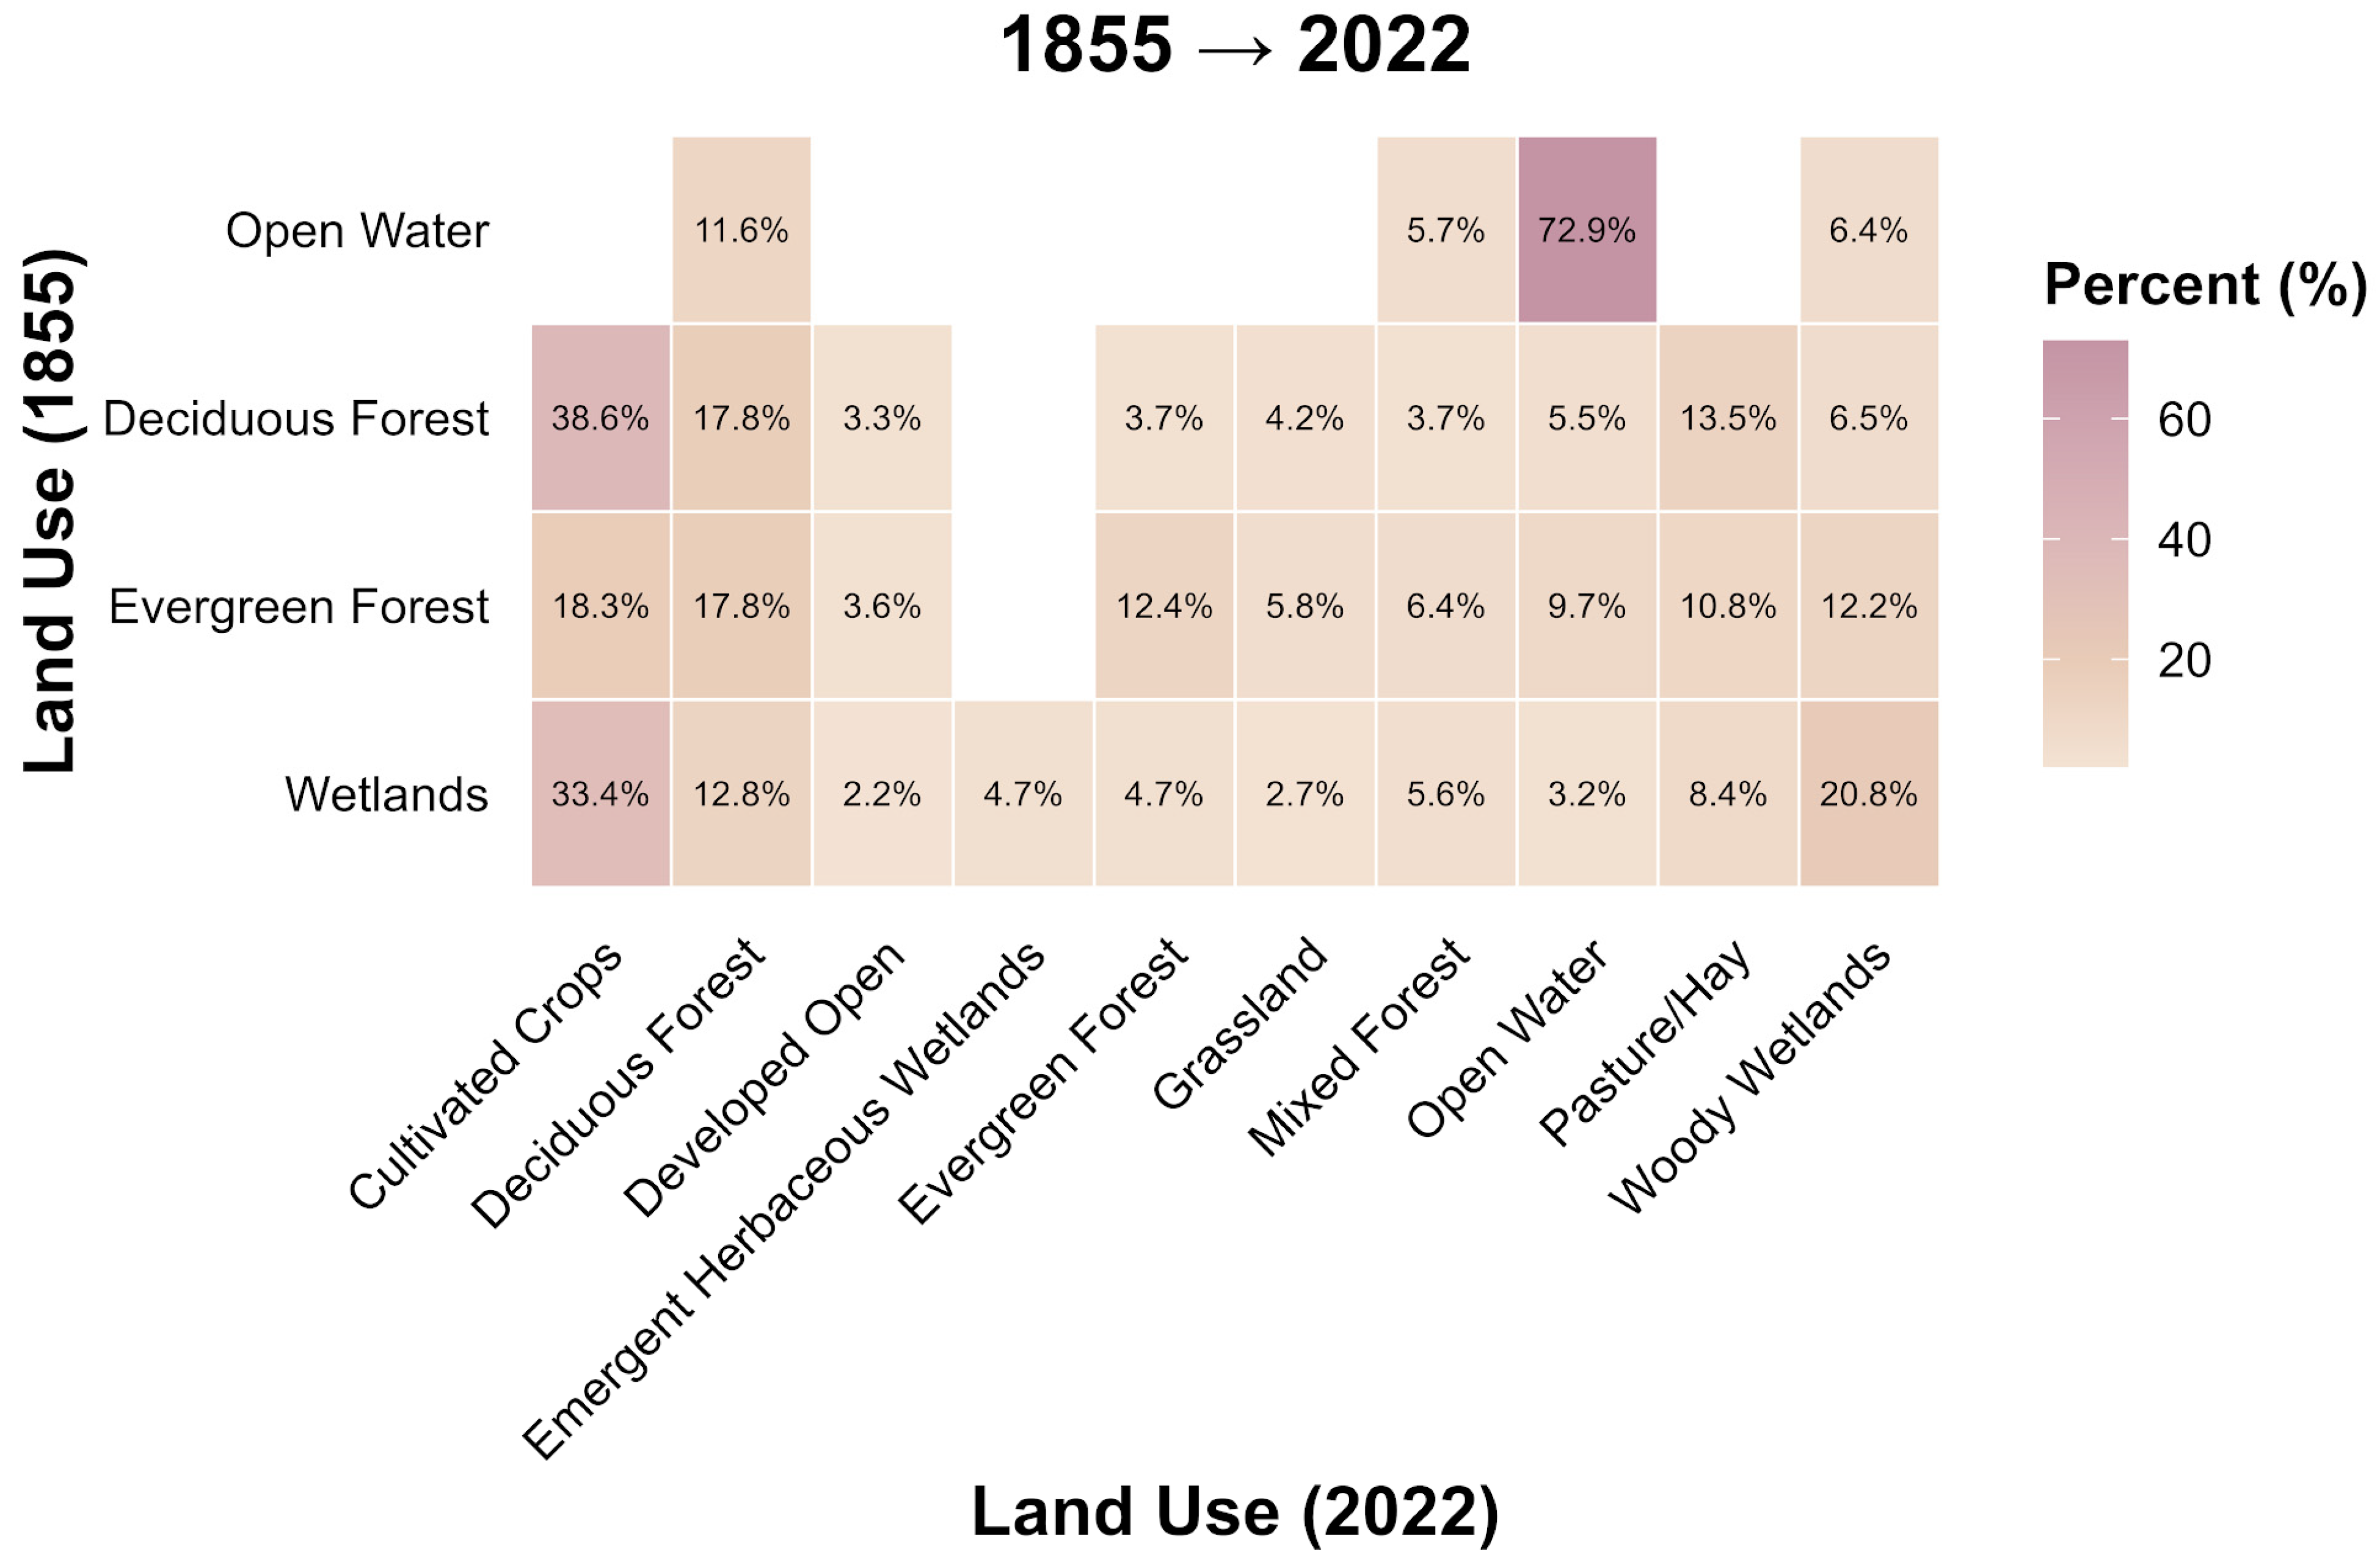
Land use within the Straight River watershed has changed drastically from the pre-colonial period (1855) to modern conditions (2006 and 2022), with a shift from natural vegetation to agricultural and developed land uses, as shown in Figure 6 and Figure 7.
Figure 6.
Land-Use transition from 1855 to 2006.
Figure 7.
Land-use transition from 1855 to 2022.
The watershed was dominated by forests and wetlands during pre-colonial times. These land-use transitions provide the foundation for understanding the changes in water percolation, groundwater recharge, nitrate leaching, streamflow, and nitrate export explained in the following sections.
Figure 6 shows the land-use transition from the reconstructed 1855 scenario to the 2006 scenario. Conversion shows that a large area under natural vegetation was converted to cultivated land by 2006. Approximately 64.6% of forested land and 31.6% of wetland area were converted to agricultural land, along with 24.3% forested area converted to pasture land and other managed classes. Similarly, reductions in areas of woody and herbaceous wetlands have been seen due to conversions to agricultural land and open-water classes. These results highlight that agricultural expansion was the dominant land-use conversion between 1855 and the established agricultural landscape.
This transition reflects broader land-use changes observed throughout Minnesota and the Upper Mississippi River Basin. In these areas, forest clearing, wetland drainage, and agricultural expansion have converted large sections of natural vegetation into cropland and pasture [5,24,25,26,27,29]. Similar studies in agricultural watersheds have shown that the transition from forests and wetlands to cropland can alter hydrologic pathways, reduce nutrient retention, and increase the potential for nutrient export [5,29]. Recent studies in the Mississippi River Basin also confirm that corn–soybean agriculture remains strongly associated with nitrate losses and downstream water-quality impacts [45,46].
Figure 7 shows that this transition became more intense by 2022. There was a continuous decline in forest cover, with only 38.6% of the original forest remaining in the cultivated systems, and more transitions to pastureland (around 13.5%). 33.4% of the wetland area transitioned to agricultural land.
The continued expansion and presence of agricultural land are important. Annual row-crop systems have different impacts on water and nitrogen cycling compared to forests and wetlands. Forests and wetlands typically have higher evapotranspiration, greater water storage, and stronger nutrient retention through plant uptake and microbial processes like denitrification [12,19], whereas cultivated crops use nitrogen fertilizer inputs and often have periods of reduced plant uptake outside the growing season. This can increase the amount of water and nitrogen available to move down through the soil [12,47]. Recent studies have also shown that simply increasing corn yield does not always lower nitrate export when nitrogen inputs stay high [48].
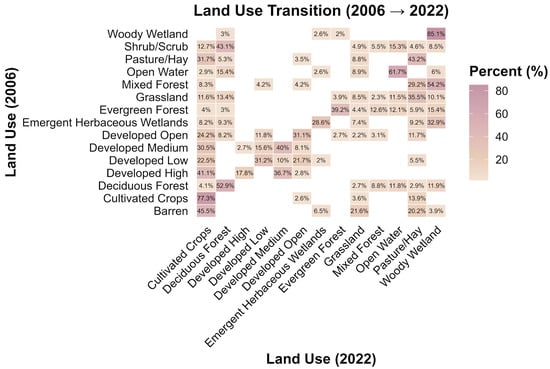
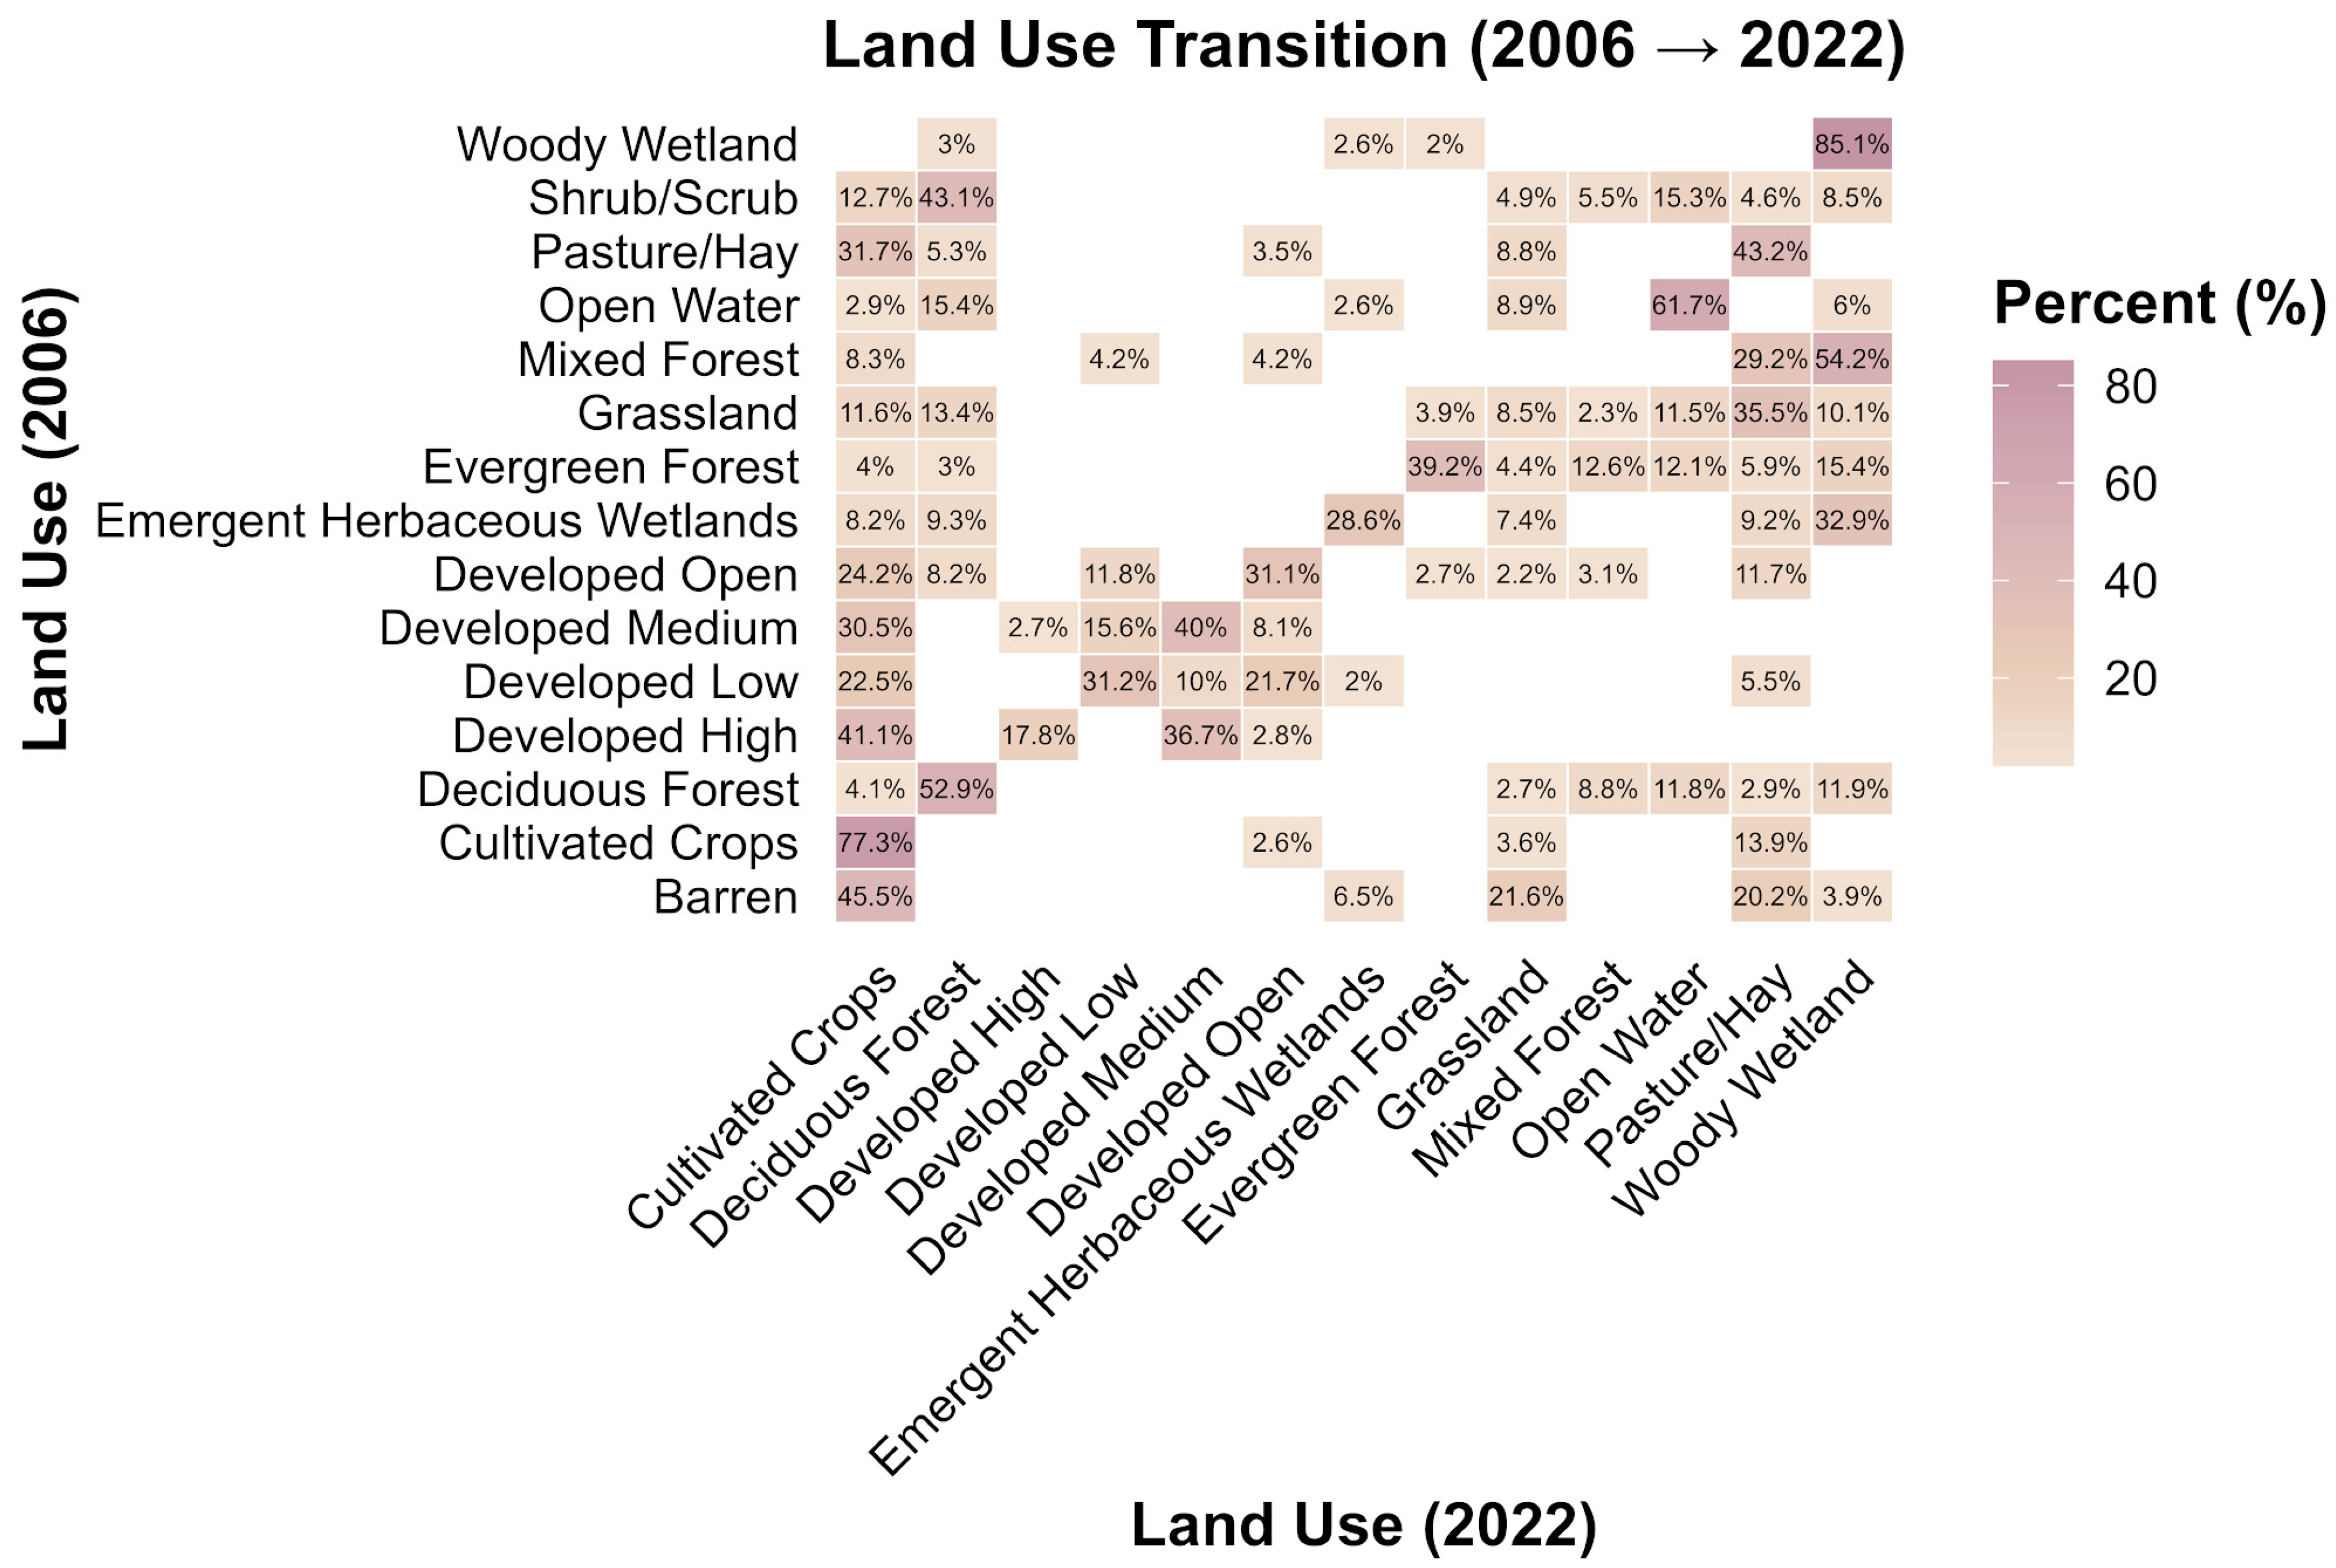
The transition from 2006 to 2022, as shown in Figure 8, shows the continuous intensification and diversification of land use. The most common class is agricultural land, with a retention rate of 77.3%, and there was also a conversion from developed and forested land to cultivated land. Developed land also showed a good retention rate with some conversions from forests.
Figure 8.
Land-use transition from 2006 to 2022.
It is clear from the results that there has been a shift from a natural landscape in 1855 to an agricultural land-dominated system by 2022. This huge conversion from forests and wetlands to agricultural land uses provides the context for the increased water fluxes and nitrogen export across the watershed.
4.1.1. Hydrologic Response to Land-Use Change
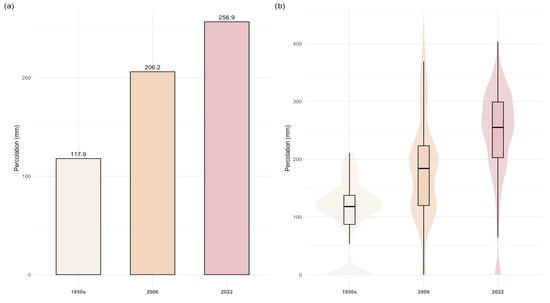
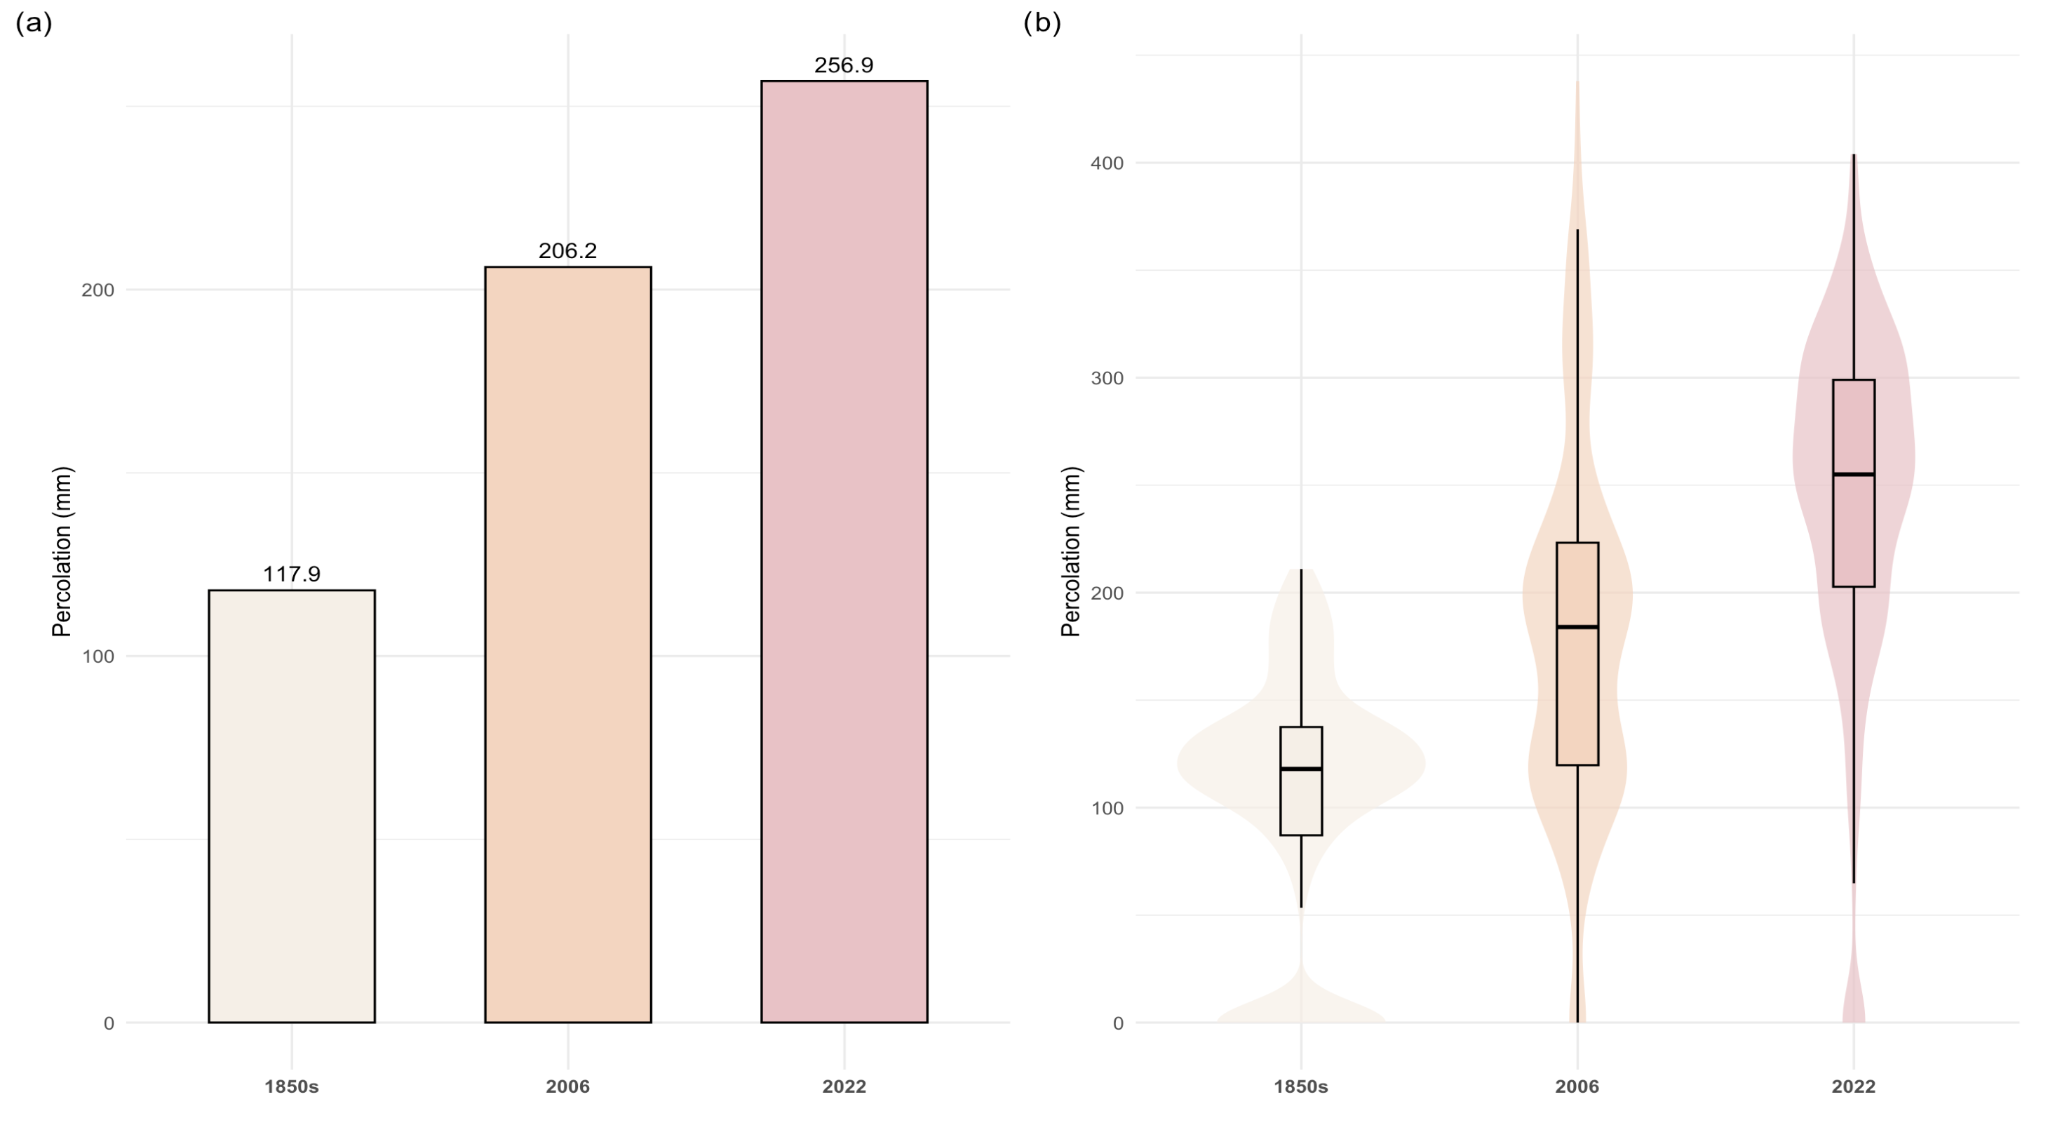
Model simulations showed higher water percolation under the agricultural land-use scenarios than under the reconstructed 1855 scenario, as shown in Figure 9. Under the reconstructed 1855 scenario, the mean annual percolation was 117.9 mm, which then increased to 206.2 mm in 2006, and further to 256.9 mm in 2022, as shown in Figure 9a. This shows an increase of approximately 75% between the reconstructed 1855 and 2006 scenarios and more than 118% between the reconstructed 1855 and 2022 scenarios. These model simulations suggest significantly greater vertical water movement through the soil profile under agricultural land-use scenarios relative to the reconstructed 1855 scenario.
Figure 9.
(a) Mean water percolation across land-use scenarios (1850s, 2006, and 2022). (b) Distribution of water percolation.
Figure 9b shows that the distribution of percolation changed considerably. Percolation values were low and tightly clustered under the reconstructed 1855 scenario, with most values falling between 100 and 130 mm, whereas in 2006 and 2022, there was a broader distribution, higher median values, and greater variability, with some areas exceeding 300 mm. This highlights that modern land use not only increased average percolation but also increased spatial variability in hydrologic response across HRUs.
These changes are consistent with the replacement of deep-perennial vegetation with annual crops. Previous studies show that replacing the deep-rooted perennial vegetation with annual crops reduces the evapotranspiration and results in more water available for downward movement to percolate and ultimately increases the groundwater recharge [12]. Recharge could increase one or twofold because of low plant uptake during fallow land periods, due to which there will be a break in continuous water extraction from the soil [12,49]. Under native vegetation conditions, groundwater recharge in northern Midwestern regions mainly takes place during snowmelt and early spring (March–April), before vegetation is fully active. The increased water uptake by plants results in a significant decrease in groundwater recharge once perennial plants develop leaves and transpiration increases in late spring. Whereas annual row crops such as corn and soybeans are in the early growth phases during this period, they do not reach their peak transpiration until later in the season. That is why agricultural fields remain hydrologically active for a longer period, allowing recharge and percolation to continue into spring and early summer [12,49].
The sandy, coarse-textured soils of the Straight River watershed likely increase this response. Because these soils have high hydraulic conductivity and rapid infiltration capacity, more water available at the soil surface can quickly lead to more percolation and groundwater recharge. Recent research also supports the importance of soil properties and management in controlling agricultural runoff and nitrate transport [45,50,51].
4.1.2. Nitrate Leaching and Spatial Patterns
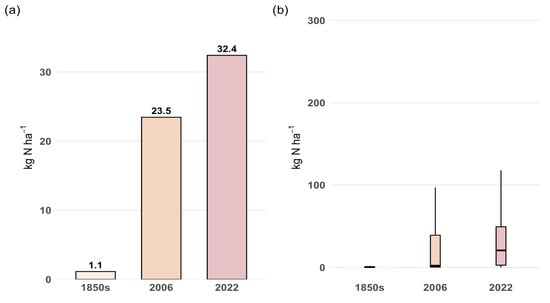
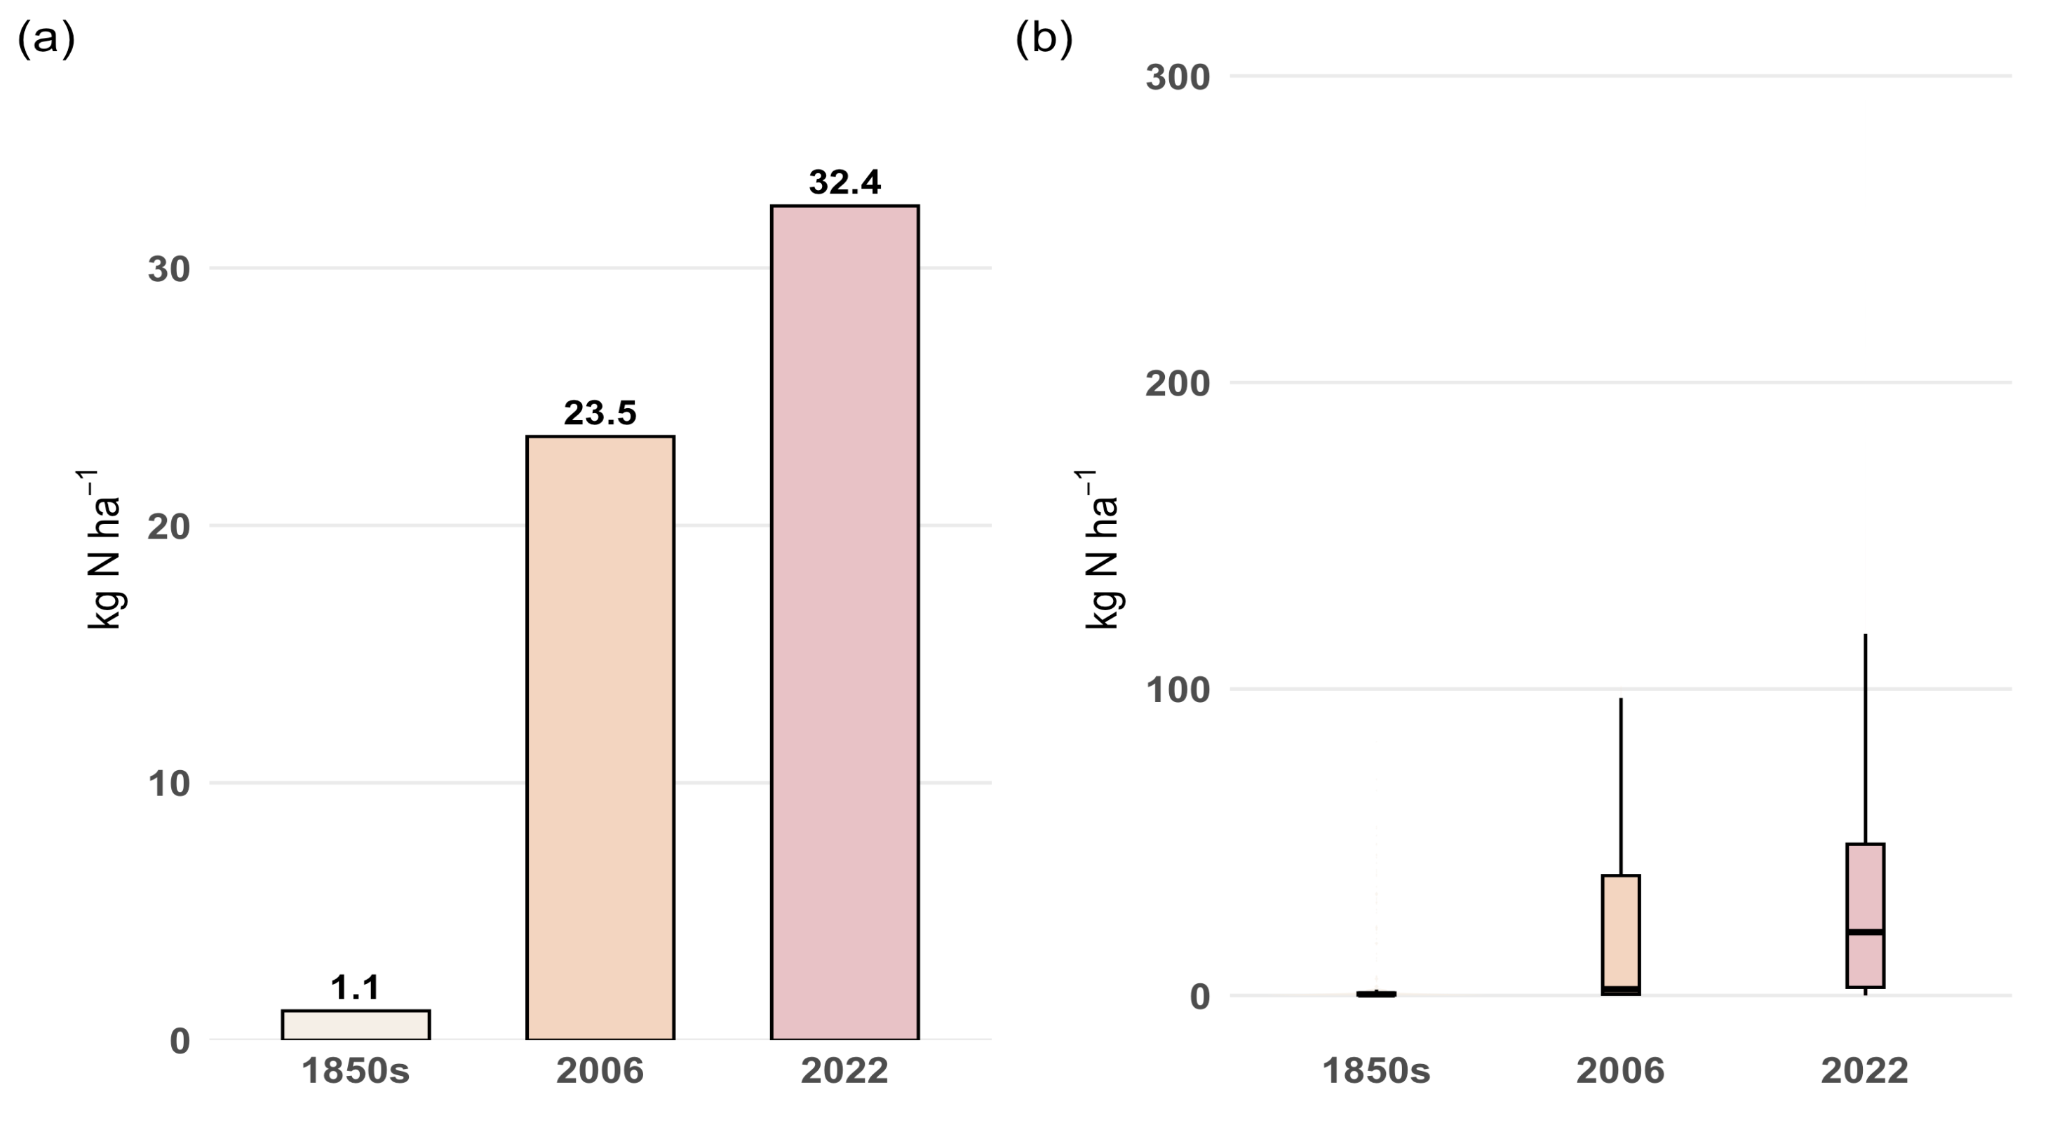
A drastic increase in nitrate leaching has been seen across all land-use scenarios, as shown in Figure 10.
Figure 10.
(a) Mean nitrate leaching across land-use scenarios (1850s, 2006, and 2022). (b) Distribution of N percolation across different land-use scenarios.
Conditions in the 1850s showed a mean N leaching of 1.14 kg N ha−1, which increased to 23.45 kg N ha−1, and further to 32.4 kg N ha−1, in 2022 (Figure 10a). This highlights a 1960% increase between the 1850s and 2006, more than 2740% by 2022, indicating a significant increase in N losses from the soil profile.
Around 24,351 kg of nitrogen was leached at the watershed scale under the reconstructed 1855 scenario, increasing to 500,765 kg in 2006 and further to over 692,047 kg in 2022, reflecting a significant increase in nitrogen losses in overall nitrogen export.
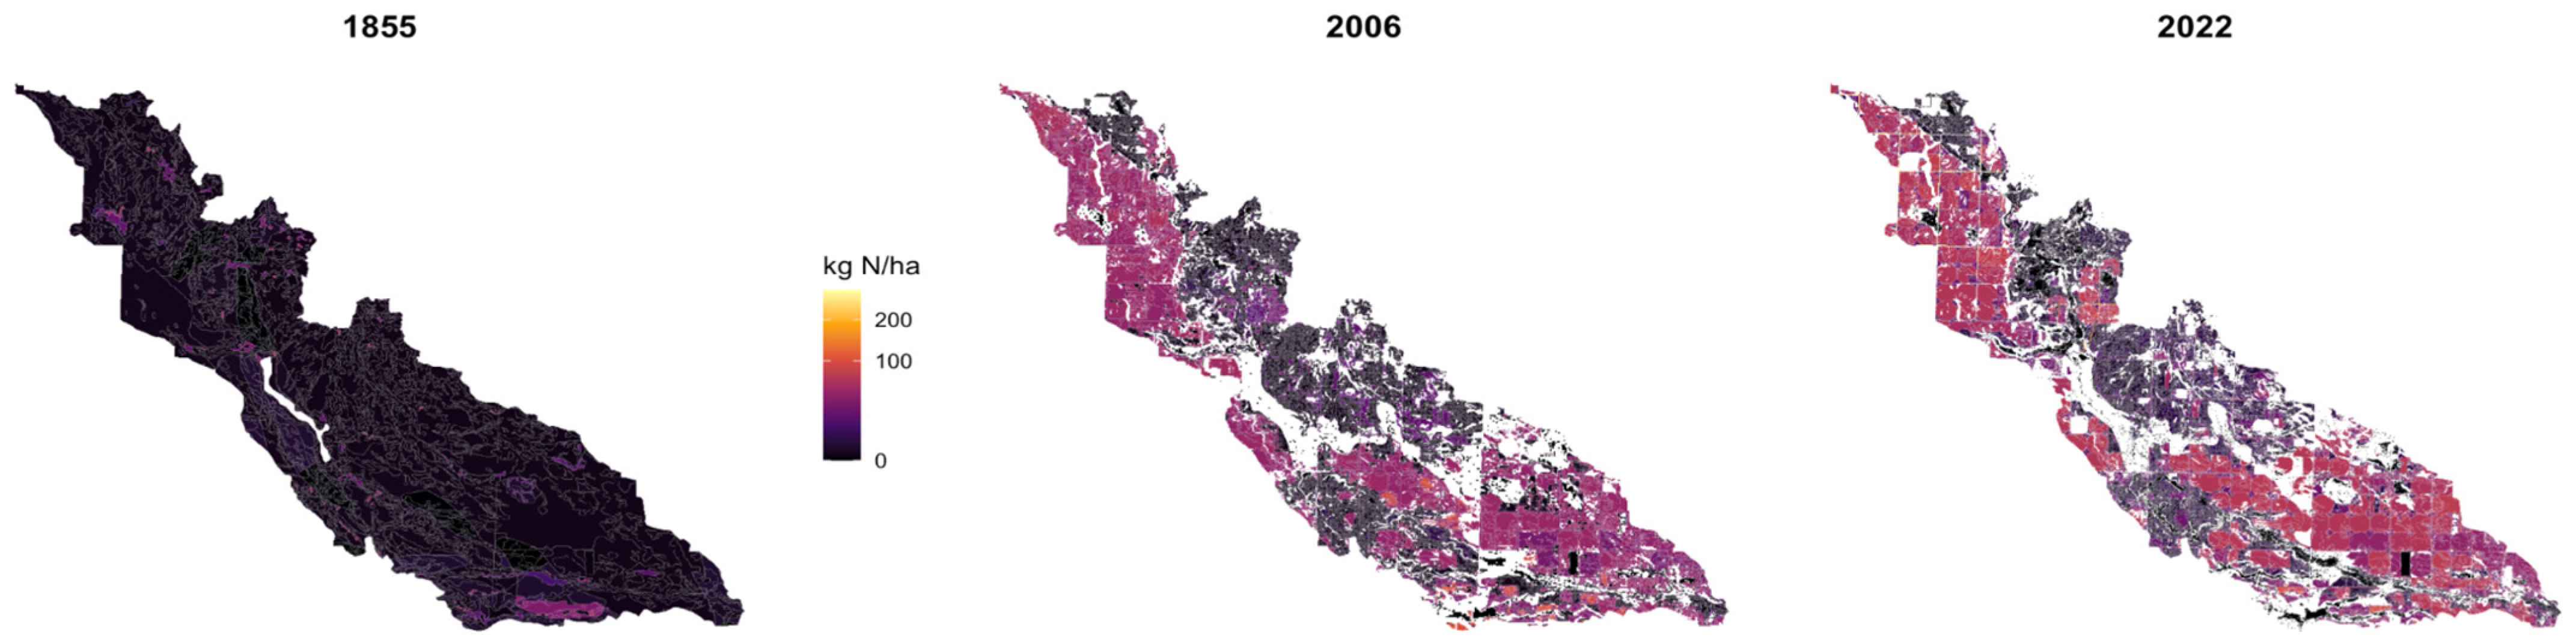
Figure 10b shows that nitrate leaching also became more variable across HRUs. Under the reconstructed 1855 scenario, nitrate leaching was very low, with little variation in distribution. The 2006 and 2022 scenarios, however, showed significantly high median values and huge amounts of widespread leaching, with many HRUs showing elevated leaching rates of more than 100 kg N ha−1. This highlights that agricultural land use created both higher average nitrate losses and localized high leaching areas.
The increase in nitrate leaching is much larger than the increase in water percolation. This shows that nitrogen availability, not only hydrologic change, was the main cause of nitrate loss. This sharp increase is strongly linked to intensive agriculture, especially the increased application of nitrogen fertilizers, and also the removal of nitrogen sinks. Previous studies show that an increase in nitrate leaching globally is primarily due to intensive agricultural activities [47]. Forests and wetlands, on the other hand, act as nutrient buffers, which promote nitrogen uptake and denitrification and ultimately lower nitrogen losses [19]. Therefore, the conversion of forests and wetlands to cultivated agriculture likely reduced natural nutrient-buffering capacity while increasing nitrogen inputs.
These findings align with research from the Upper Mississippi River Basin and the larger Corn Belt. In these areas, corn and soybean systems are major contributors to nitrate leaching and nitrate export. A study from this region discovered that increasing corn yields did not reduce drainage nitrate export when nitrogen fertilizer inputs were still high. This suggests that simply improving yields is not enough to address nitrate pollution issues [48]. Another study revealed that cutting back on fertilizer use in corn production areas of the Mississippi River Basin can lower nitrate leaching and nitrate export [46].
Figure 11 shows that nitrate leaching became increasingly heterogeneous across the watershed. Under the reconstructed 1855 scenario, most HRUs showed that very low nitrate leaching was uniformly distributed spatially, whereas the 2006 and 2022 scenarios showed clear areas with increased nitrate leaching with higher values across multiple parts of the watershed. The 2022 scenario showed a greater extent of high-leaching zones compared to other scenarios. A clear shift from a uniformly distributed to a more diverse distribution has been demonstrated using this spatial analysis, with greater variation and the development of localized high-leaching areas over time.
Figure 11.
Spatial distribution of nitrate leaching across the watershed under different land-use scenarios.
Previous studies show that nitrate losses are strongly affected by various factors such as soil properties, land management activities, and hydrologic connectivity [52]. Increased nitrate leaching and significant nitrate export due to increased water percolation and low nitrate retention capacity are very common in areas with intensive agriculture and coarse-textured soils with high permeability, where increased drainage restricts plant uptake and nutrient retention. Targeted, landscape-specific management practices are important for these types of conditions where spatial heterogeneity exists instead of uniform interventions [53]. Practices such as fertilizer optimization, cover crops, buffer strips, and wetland restoration should be prioritized in areas where high nitrate leaching overlaps with strong subsurface connectivity.
4.1.3. Groundwater Recharge and Nitrate Transport
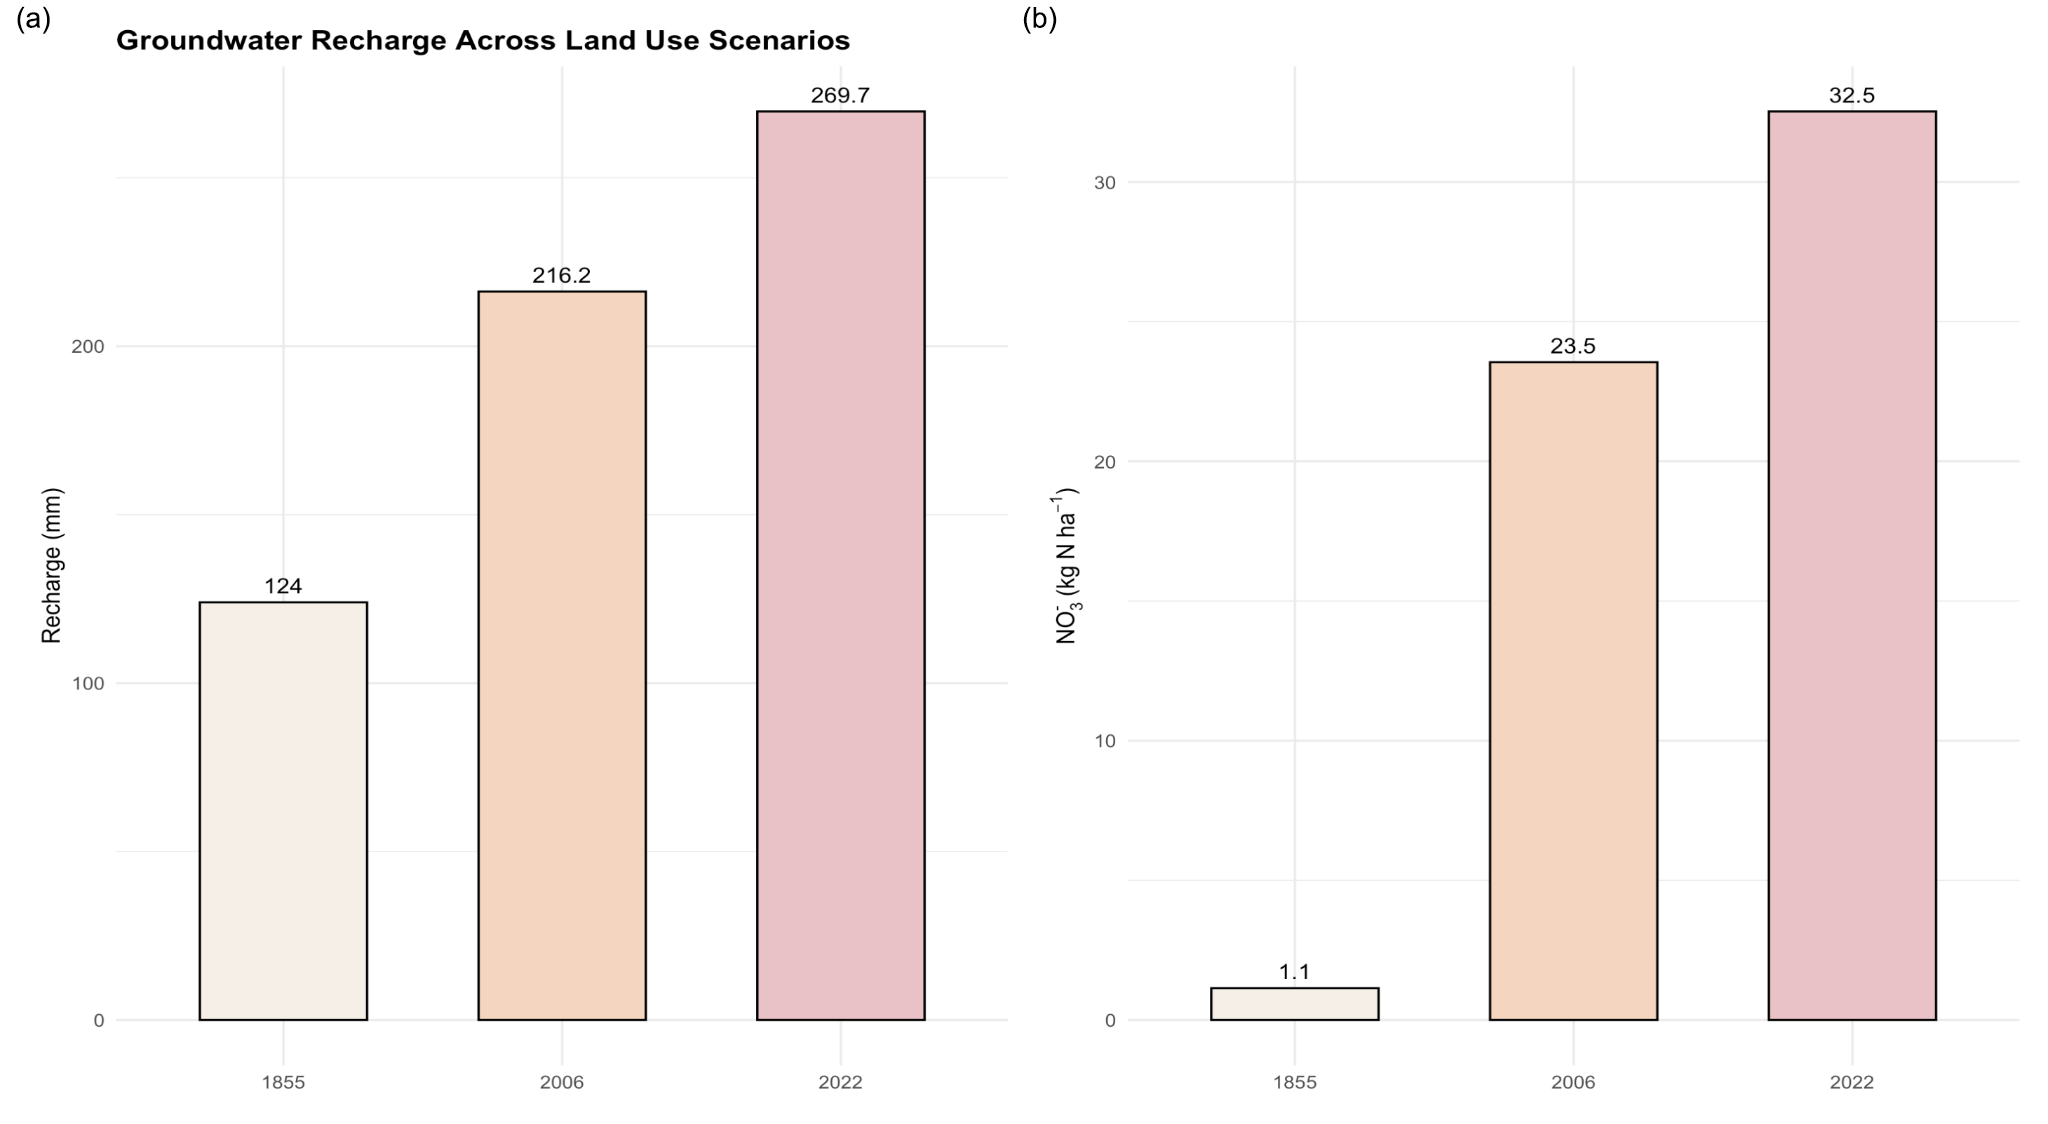
All land-use scenarios have shown a steady increase in groundwater recharge, as shown in Figure 12a. The reconstructed 1855 scenario had a mean annual recharge of 124 mm, which increased to 216 mm in 2006 and to 269 mm in 2022 (Figure 12a).
Figure 12.
(a) Groundwater recharge across land-use scenarios (1850s, 2006, and 2022). (b) Nitrate recharge to groundwater across different land-use scenarios.
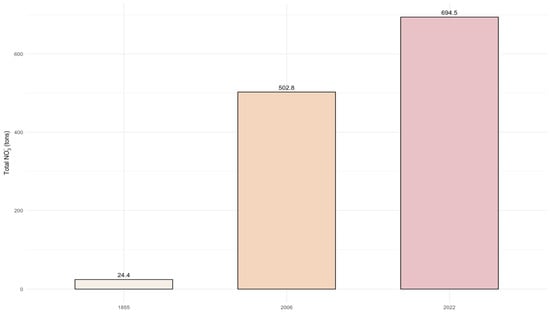
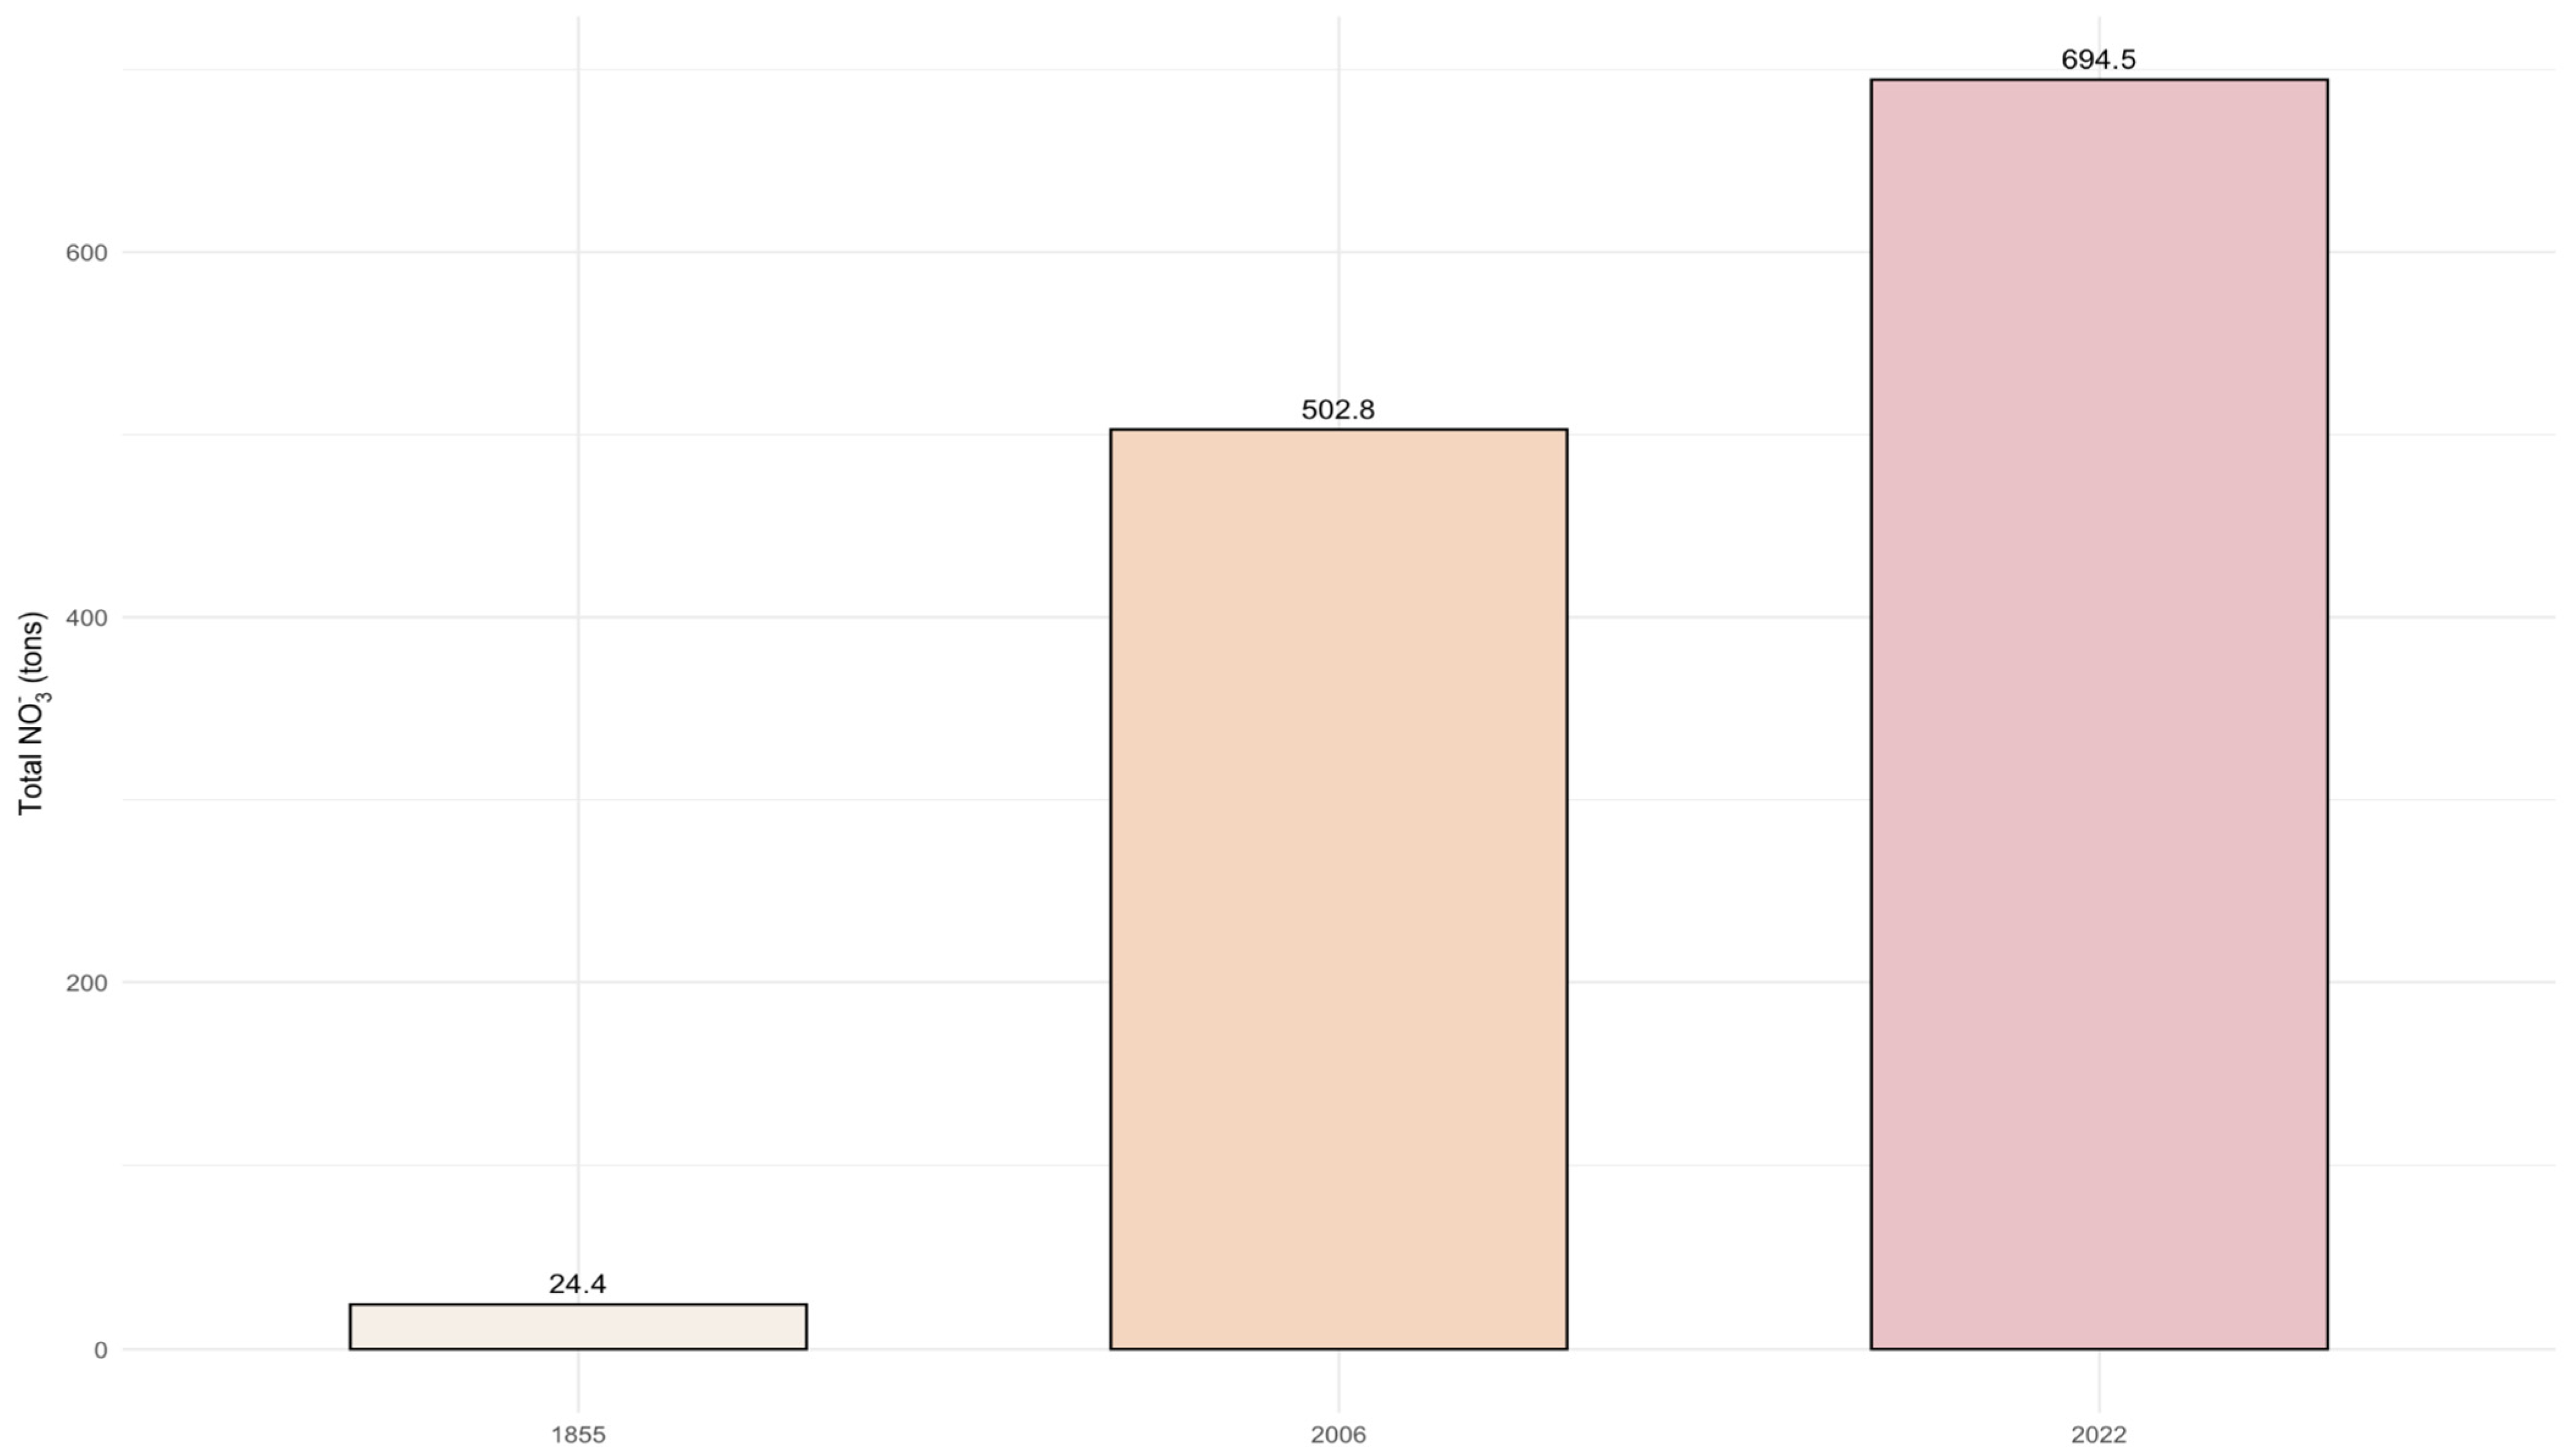
Nitrate transport to groundwater showed a significantly higher increase than recharge, as shown in Figure 12b. Conditions in the 1850s exhibited 1.14 kg N ha−1, which then increased to 23.55 kg N ha−1 in 2006 and to 32.5 kg N ha−1 in 2022, indicating a sharp increase in nitrogen inputs to the subsurface system. Total nitrate input to groundwater had increased from 24.4 tons in the 1850s to 503 tons in 2006 and further to over 694.5 tons in 2022 at the watershed scale, as shown in Figure 13.
Figure 13.
Total nitrate input to the groundwater across land-use scenarios (1850s, 2006, and 2022).
The larger increase in nitrate transport, compared to groundwater recharge, shows that land-use change not only increased water movement but also nitrogen loading to the subsurface system. This is an important distinction. If only hydrology were at play, we would expect nitrate transport to rise at a rate close to recharge. But, nitrate transport increased much more sharply, indicating that fertilizer-derived nitrogen inputs and reduced nitrogen retention were major drivers of groundwater nitrate loading.
This finding is especially important for the Straight River watershed. The watershed has sandy glacial outwash deposits and strong groundwater and surface water connectivity. These conditions make the watershed vulnerable to nitrate movement from agricultural fields into groundwater and then into streams. Previous research has accounted for agricultural areas with permeable soils where high nitrate contamination of groundwater is a major issue [54,55]. Recent Upper Mississippi River Basin studies also show that nitrate leaching and subsurface nitrogen transport are strongly influenced by agricultural management practices [45].
4.1.4. Streamflow and Nitrate Export
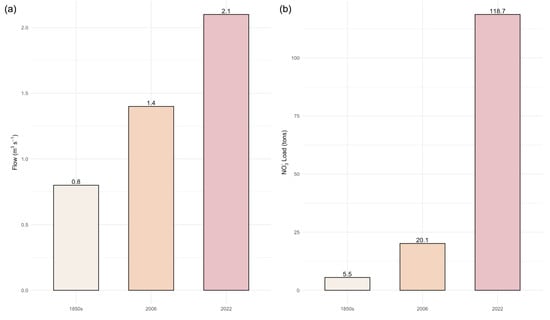
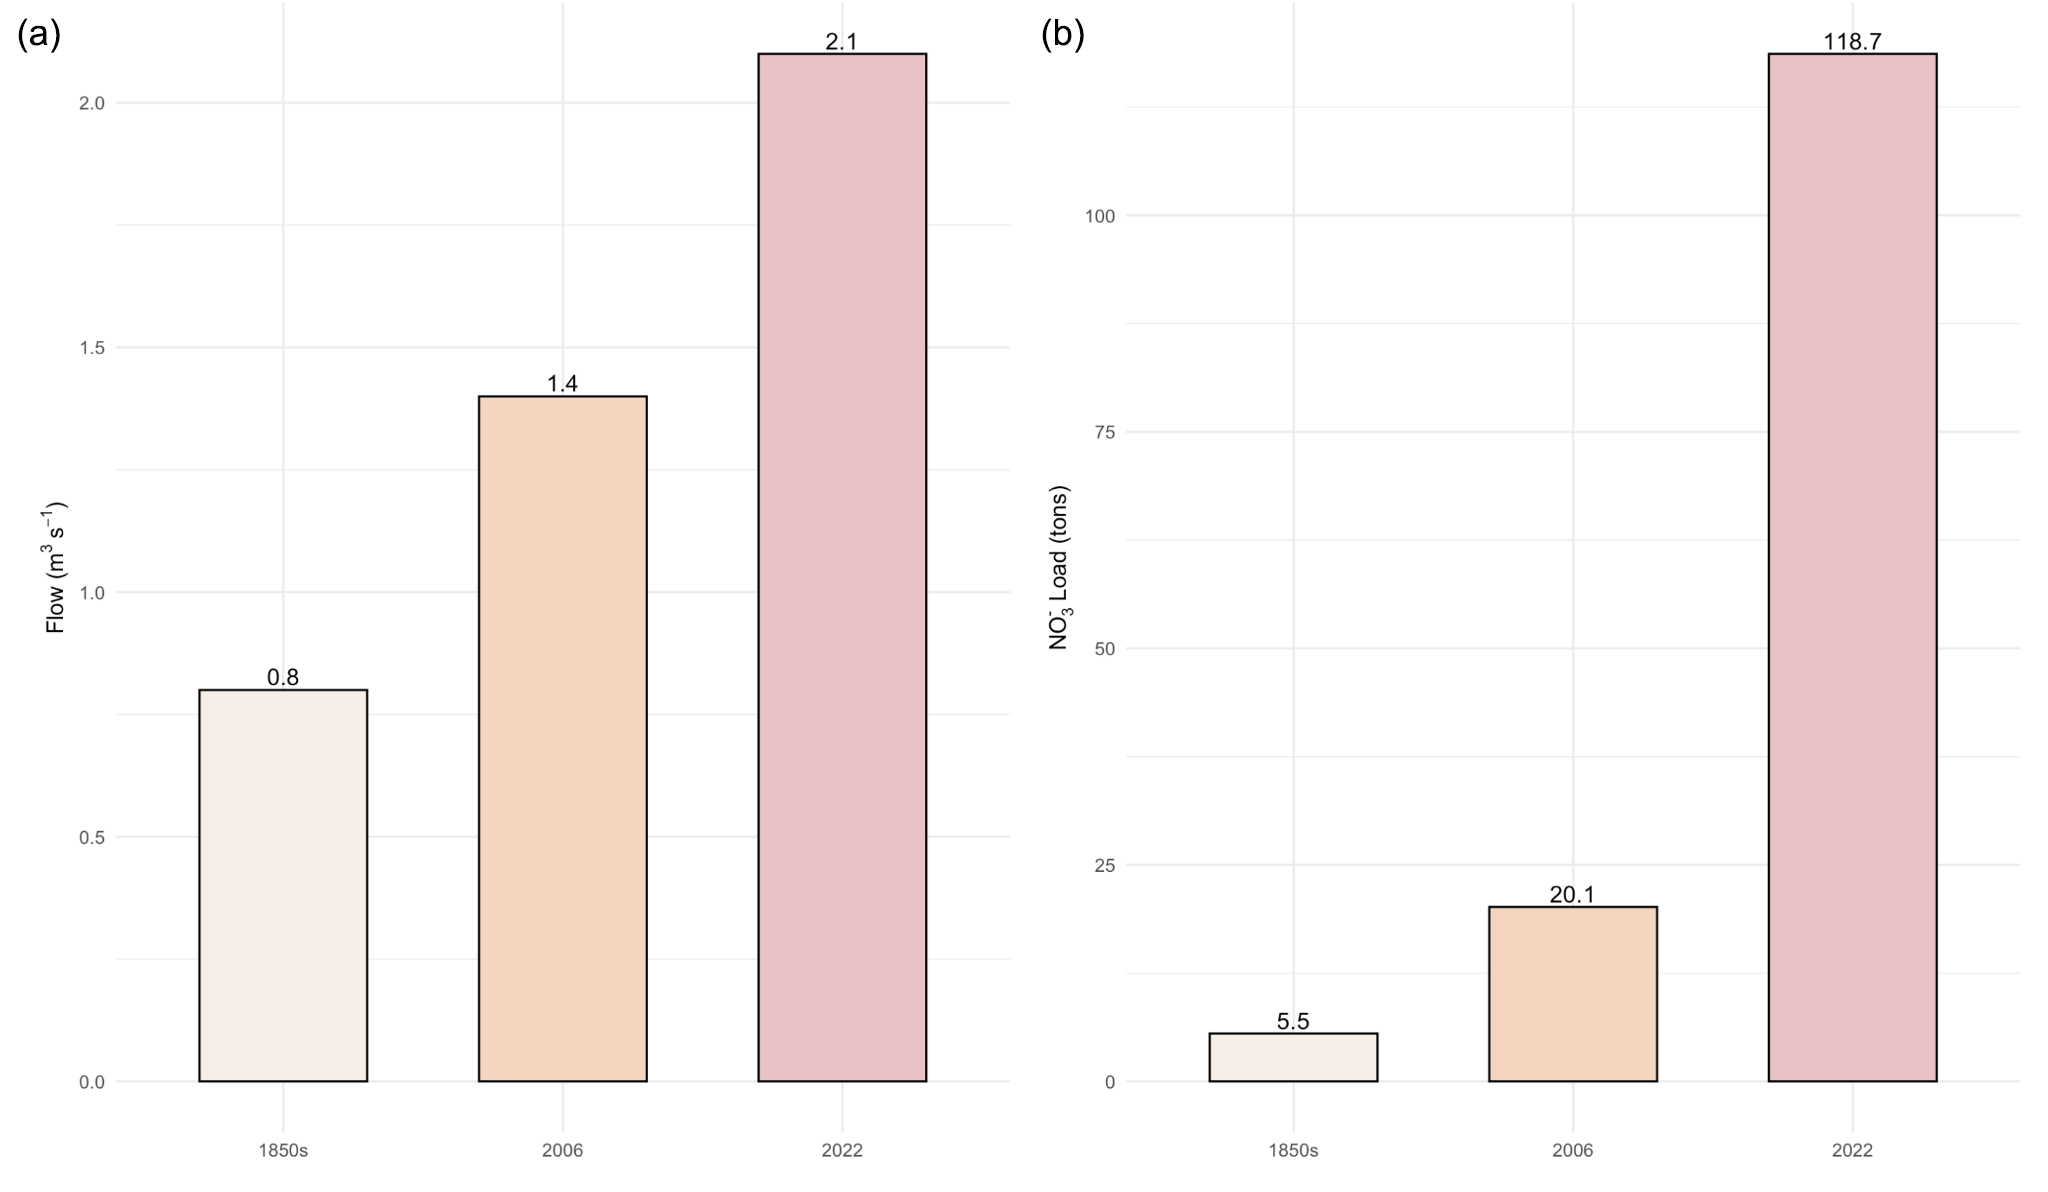
Streamflow at the watershed outlet has increased across land-use scenarios, as shown in Figure 14a. Mean annual streamflow increased from about 0.85 m3s−1 under the reconstructed 1855 scenario to 1.43 m3s−1 in 2006, and further to 2.1 m3s−1 in 2022, as shown in Figure 14a. That means the transition from the 1850s to 2006 experienced a 68% increase in streamflow, whereas about 147% by 2022, showing a clear increase in hydrologic response of the watershed over time.
Figure 14.
(a) Mean annual streamflow at watershed outlet across land-use scenarios (1850s, 2006, and 2022). (b) Total nitrate export at the watershed outlet across different land-use scenarios.
Agricultural watersheds often experience increased streamflow compared to forested watersheds. This happens because conversion from deep-rooted perennial vegetation to an annual cropping system can lower evapotranspiration and increase recharge and subsurface flow [12,49].
In parallel, a drastic increase in nitrate export has been seen across scenarios (Figure 14b). In the reconstructed 1855 scenario, the total nitrate load at the watershed outlet was 5.5 tons, which increased to 20.1 tons in 2006, and further to 118.7 tons in 2022, which shows an increase of over 265% between the modeled 1855 and 2006 scenario and more than 2058% by the 2022 scenario, highlighting a significant increase in nitrate export from the watershed due to more intensification in agriculture.
The increase in nitrate export is significantly larger than the increase in streamflow, indicating that higher nitrogen availability and transport, which means it is not just changes in hydrologic patterns alone that are the main drivers of elevated nitrate loads at the watershed outlet. The expansion of cultivated land and the increase in fertilizer use likely increased the amount of nitrate reaching the stream network. Similar relationships between agricultural intensification and nitrate export have been seen across the Mississippi River Basin. In this region, nitrogen inputs from row-crop agriculture significantly add to riverine nitrate loads and downstream water-quality degradation [21,23,56]. Other studies have also shown that nitrate transport in major Mississippi River tributaries is strongly influenced by agricultural nutrient availability and hydrologic connectivity [57].
One of the most important findings of this study is the difference between the magnitude of streamflow and nitrate export responses. While streamflow increased by approximately 147% between 1855 and 2022 scenarios, nitrate export increased by about 2058%. This shows that changes in nitrogen inputs and transport pathways had a greater impact than changes in water quantity when explaining the observed nitrate response. Similar conclusions have been reported in recent Mississippi River Basin studies, where fertilizer application rates, crop production systems, and water hydrologic processes were identified as key drivers influencing nitrate leaching and export [46,58].
The nitrate simulations should be interpreted with consideration of some limitations. Nitrate calibration was limited by the availability of observed nitrate data, which were available only as approximately monthly discrete samples over a relatively short monitoring period. Also, watershed-scale models require generalized representations of fertilizer management, irrigation practices, and crop production systems, which may vary spatially and temporally across the watershed. Despite these limitations, the model effectively captured the overall direction and magnitude of nitrate responses across the different land-use scenarios. It provides a useful framework for assessing the relative impacts of land-use change on watershed nitrogen dynamics.
The findings highlight a strong connection between land-use change, hydrologic intensification, and nitrate transport. Model simulations suggest that watershed-scale water and nutrient retention was lower under the agricultural scenarios than under the reconstructed 1855 scenario. This results in enhanced contamination of groundwater and also increases the nitrate export and loading to the downstream. Global assessments also support these results, showing that intensive agriculture significantly impacts the biogeochemical cycles and also reduces the water quality [5,59]. Integrated land management practices will be required to effectively mitigate, which includes optimization of fertilizer application, wetlands restoration, and implementing conservation practices like buffer strips and cover crops to reduce the nitrogen losses and restore hydrologic balance.
5. Conclusions
This study shows that conversion of natural vegetation to intensive agriculture has significantly affected the hydrologic processes and nitrogen dynamics in the Straight River watershed. We compared three land-use scenarios, such as pre-settlement conditions (1850s), established agricultural (2006), and modern agricultural (2022) conditions, using the SWAT+ model. The results showed that there is a significant increase in water percolation, groundwater recharge, streamflow, nitrate leaching, and nitrate export with changes in land-use over time. Nitrate leaching and export also showed significant increases, reflecting the direct impact of agricultural intensification on nitrate movement.
We have seen a reduction in the watershed’s natural capacity to hold water and nutrients, resulting in increased hydrologic connectivity and enhanced nitrate movement through both surface and groundwater pathways due to conversion from forested vegetation to row-crop agriculture. Spatial analysis also revealed the development of hotspots with high-leaching zones under modern agricultural conditions, which means that the heterogeneity of the landscape plays an important role in nutrient transport processes.
Using the same parameters for all land-use scenarios helped to ensure that the differences in results were caused by land-use change only. The results emphasize the importance of including historical baseline conditions when evaluating watershed change and its impacts on water quality. This study shows a clear link between land-use change, increased water flow, and degraded water quality, which underscores the need for sustainable land and nutrient management practices, such as optimized fertilizer application, wetland restoration, cover crops, and buffer systems, to reduce nitrate losses and protect both groundwater and surface water in intensively managed agricultural watersheds.
Supplementary Materials
The following supporting information can be downloaded at: https://www.mdpi.com/article/10.3390/environments13070361/s1, Figure S1: Distribution of Hydrologic Response Unit (HRU) areas across the Straight River Watershed; Table S1: Irrigation management schedules; Table S2: Summary of crop management schedules used in the SWAT+ simulations; Table S3: Summary of climate datasets used in the SWAT+ simulations; Table S4: Summary of Soil data used in the SWAT+ simulations; Table S5: Land-use and land-cover (LULC) classes and corresponding SWAT+ representations used in the model.
Author Contributions
H.K.D.—SWAT+ model setup, calibration and validation, data analysis, interpretation of results, visualization, manuscript writing, and editing; L.L.—SWAT+ model setup, writing—review, and editing; J.N.—Supervision, funding acquisition, resources, writing—review and editing; J.M.—Supervision, funding acquisition, resources, writing—review and editing. All authors have read and agreed to the published version of the manuscript.
Funding
The authors declare that this study was financially supported by the Legislative Citizen Commission on Minnesota Resources (LCCMR) grant number CON000000106728. (No. CON000000106728).
Data Availability Statement
The raw data supporting the conclusions of this article will be made available by the authors on request.
Acknowledgments
We would like to thank our partners at the White Earth Band of Minnesota Chippewa Tribe.
Conflicts of Interest
The authors declare no conflicts of interest.
References
- Locke, K.A. Modelling relationships between land use and water quality using statistical methods: A critical and applied review. J. Environ. Manag. 2024, 362, 121290. [Google Scholar] [CrossRef] [Scilit] [PubMed]
- Yohannes, A.W.; Cotter, M.; Kelboro, G.; Dessalegn, W. Land use and land cover changes and their effects on the landscape of Abaya-Chamo basin, Southern Ethiopia. Land 2018, 7, 2. [Google Scholar] [CrossRef] [Scilit]
- Onstad, C.A.; Jamieson, D.G. Modeling the Effect of Land Use Modifications on Runoff. Water Resour. Res. 1970, 6, 1287–1295. [Google Scholar] [CrossRef] [Scilit]
- Lacher, I.L.; Ahmadisharaf, E.; Fergus, C.; Akre, T.; Mcshea, W.J.; Benham, B.L.; Kline, K.S. Scale-dependent impacts of urban and agricultural land use on nutrients, sediment, and runoff. Sci. Total Environ. 2019, 652, 611–622. [Google Scholar] [CrossRef] [Scilit]
- Foley, J.A.; DeFries, R.; Asner, G.P.; Barford, C.; Bonan, G.; Carpenter, S.R.; Stuart Chapin, F.; Coe, M.T.; Daily, G.C.; Gibbs, H.K.; et al. Global Consequences of Land Use. Science 2005, 309, 570–574. [Google Scholar] [CrossRef] [Scilit] [PubMed]
- Ramankutty, N.; Mehrabi, Z.; Waha, K.; Jarvis, L.; Kremen, C.; Herrero, M.; Rieseberg, L.H. Annual Review of Plant Biology Trends in Global Agricultural Land Use: Implications for Environmental Health and Food Security. Annu. Rev. Plant Biol. 2018, 69, 789–815. [Google Scholar] [CrossRef] [Scilit] [PubMed]
- Wan, R.; Cai, S.; Li, H.; Yang, G.; Li, Z.; Nie, X. Inferring land use and land cover impact on stream water quality using a Bayesian hierarchical modeling approach in the Xitiaoxi River Watershed, China. J. Environ. Manag. 2014, 133, 1–11. [Google Scholar] [CrossRef] [Scilit] [PubMed]
- Namugize, J.N.; Jewitt, G.; Graham, M. Effects of land use and land cover changes on water quality in the uMngeni river catchment, South Africa. Phys. Chem. Earth 2018, 105, 247–264. [Google Scholar] [CrossRef] [Scilit]
- Zhang, L.; Dawes, W.R.; Walker, G.R. Response of mean annual evapotranspiration to vegetation changes at catchment scale. Water Resour. Res. 2001, 37, 701–708. [Google Scholar] [CrossRef] [Scilit]
- Li, H.; Si, B.C.; Zhang, Z.; Miao, C. Deep soil water storage and drainage following conversion of deep rooted to shallow rooted vegetation. Agric. Water Manag. 2022, 261, 107359. [Google Scholar] [CrossRef] [Scilit]
- Zhang, P.; Cai, Y.; He, Y.; Xie, Y.; Zhang, X.; Li, Z. Changes of vegetational cover and the induced impacts on hydrological processes under climate change for a high-diversity watershed of south China. J. Environ. Manag. 2022, 322, 115963. [Google Scholar] [CrossRef] [Scilit] [PubMed]
- Scanlon, B.R.; Jolly, I.; Sophocleous, M.; Zhang, L. Global impacts of conversions from natural to agricultural ecosystems on water resources: Quantity versus quality. Water Resour. Res. 2007, 43, W03437. [Google Scholar] [CrossRef] [Scilit]
- González Perea, R.; Daccache, A.; Rodríguez Díaz, J.A.; Camacho Poyato, E.; Knox, J.W. Modelling impacts of precision irrigation on crop yield and in-field water management. Precis. Agric. 2018, 19, 497–512. [Google Scholar] [CrossRef] [Scilit]
- Jasechko, S. Global cases of groundwater recovery after interventions. Science 2026, 391, 1218–1228. [Google Scholar] [CrossRef] [Scilit] [PubMed]
- Nascimento Pessoa, T.; Martineli Batista, A.; Nogueira de Sousa, R.; Leonel Libardi, P. Movement of Water and Solutes in Agricultural Soils. In Strategic Tillage and Soil Management–New Perspectives; IntechOpen: London, UK, 2024. [Google Scholar] [CrossRef] [Scilit]
- Ali, A.; Jabeen, N.; Farruhbek, R.; Chachar, Z.; Laghari, A.A.; Chachar, S.; Ahmed, N.; Ahmed, S.; Yang, Z. Enhancing nitrogen use efficiency in agriculture by integrating agronomic practices and genetic advances. Front. Plant Sci. 2025, 16, 1543714. [Google Scholar] [CrossRef] [Scilit] [PubMed]
- Xu, A.; Khan, K.S.; Zhang, Y.; Liu, N.; Liu, P.; Chen, Y.; Wei, X.; Sun, C.; Effah, Z.; Li, L. Effects of nitrogen fertilizer rates on nutrient uptake, vertical nutrient distribution, and nitrogen balance in dryland spring wheat. Front. Plant Sci. 2026, 17, 1745172. [Google Scholar] [CrossRef] [Scilit] [PubMed]
- Sebilo, M.; Mayer, B.; Nicolardot, B.; Pinay, G.; Mariotti, A. Long-term fate of nitrate fertilizer in agricultural soils. Proc. Natl. Acad. Sci. USA 2013, 110, 18185–18189. [Google Scholar] [CrossRef] [Scilit] [PubMed]
- Yousaf, A.; Khalid, N.; Aqeel, M.; Noman, A.; Naeem, N.; Sarfraz, W.; Ejaz, U.; Qaiser, Z.; Khalid, A. Nitrogen Dynamics in Wetland Systems and Its Impact on Biodiversity. Nitrogen 2021, 2, 196–217. [Google Scholar] [CrossRef] [Scilit]
- Bertassello, L.E.; Basu, N.B.; Maes, J.; Grizzetti, B.; la Notte, A.; Feyen, L. The important role of wetland conservation and restoration in nitrogen removal across European river basins. Nat. Water 2025, 3, 867–880. [Google Scholar] [CrossRef] [Scilit]
- Van Meter, K.J.; Basu, N.B.; Veenstra, J.J.; Burras, C.L. The nitrogen legacy: Emerging evidence of nitrogen accumulation in anthropogenic landscapes. Environ. Res. Lett. 2016, 11, 035014. [Google Scholar] [CrossRef] [Scilit]
- Jasechko, S.; Perrone, D.; Befus, K.M.; Bayani Cardenas, M.; Ferguson, G.; Gleeson, T.; Luijendijk, E.; McDonnell, J.J.; Taylor, R.G.; Wada, Y.; et al. Global aquifers dominated by fossil groundwaters but wells vulnerable to modern contamination. Nat. Geosci. 2017, 10, 425–429. [Google Scholar] [CrossRef] [Scilit]
- Diaz, R.J.; Rosenberg, R. Spreading dead zones and consequences for marine ecosystems. Science 2008, 321, 926–929. [Google Scholar] [CrossRef] [Scilit] [PubMed]
- Paciorek, C.J.; Cogbill, C.V.; Peters, J.A.; Williams, J.W.; Mladenoff, D.J.; Dawson, A.; McLachlan, J.S. The forests of the midwestern United States at Euro-American settlement: Spatial and physical structure based on contemporaneous survey data. PLoS ONE 2021, 16, e0246473. [Google Scholar] [CrossRef] [Scilit] [PubMed]
- MNDNR-Division. Settlement Chapter Three: Forests before Settlement (pre-1800s). In All About Minnesota’s Forests and Trees: A Primer; Minnesota Department of Natural Resources: Saint Paul, MN, USA, 2008. [Google Scholar]
- Granger, S.; Kelly, S. Minnesota Farms Historic Context Vol 1. 2005. Available online: https://www.dot.state.mn.us/culturalresources/docs/crunit/vol1.pdf (accessed on 10 April 2026).
- Cardwell, V.B. Corn Production in Minnesota, 1866–2016; Minnesota Historical Society: Saint Paul, MN, USA, 2018; Available online: https://www.mnhs.org/mnopedia/search/index/corn-production-minnesota-1866-2016 (accessed on 26 January 2018).
- Stroom, K.; Newkirk, J.; Johnson, C.; Matteson, S. Straight River (Hubbard County, Minnesota) Nutrient Study; MPCA: Saint Paul, MN, USA, 2024. [Google Scholar]
- Allan, J.D. Landscapes and riverscapes: The influence of land use on stream ecosystems. Annu. Rev. Ecol. Evol. Syst. 2004, 35, 257–284. [Google Scholar] [CrossRef] [Scilit]
- Arnold, J.G.; Srinivasan, R.; Muttiah, R.S.; Williams, J.R. Large Area Hydrologic Modeling and Assessment Part I: Model Development. J. Am. Water Resour. Assoc. 1998, 34, 73–89. [Google Scholar] [CrossRef] [Scilit]
- Arnold, J.G.; Moriasi, D.N.; Gassman, P.W.; Abbaspour, K.C.; White, M.J.; Srinivasan, R.; Santhi, C.; Harmel, R.D.; van Griensven, A.; van Liew, M.W.; et al. Swat: Model Use, Calibration, and Validation. Trans. ASABE 2012, 55, 1491–1508. [Google Scholar] [CrossRef] [Scilit]
- Stark, J.R.; Armstrong, D.S.; Zwilling, D.R. Stream-Aquifer Interactions in the Straight River Area, Becker and Hubbard Counties; Minnesota Water-Resources Investigations Report 94-4009; U.S. Geological Survey: Reston, VA, USA; Minnesota Department of Natural Resources: Saint Paul, MN, USA, 1994.
- Bieger, K.; Arnold, J.G.; Rathjens, H.; White, M.J.; Bosch, D.D.; Allen, P.M.; Volk, M.; Srinivasan, R. Introduction to SWAT+, A Completely Restructured Version of the Soil and Water Assessment Tool. J. Am. Water Resour. Assoc. 2017, 53, 115–130. [Google Scholar] [CrossRef] [Scilit]
- Neitsch, S.L.; Arnold, J.G.; Kiniry, J.R.; Williams, J.R. College of Agriculture and Life Sciences Soil and Water Assessment Tool Theoretical Documentation Version 2009; Texas Water Resources Institute: College Station, TX, USA, 2011. [Google Scholar]
- Sobol, I.M. Global sensitivity indices for nonlinear mathematical models and their Monte Carlo estimates. Math. Comput. Simul. 2001, 55, 271–280. [Google Scholar] [CrossRef] [Scilit]
- Zambrano-Bigiarini, M.; Rojas, R. A model-independent Particle Swarm Optimisation software for model calibration. Environ. Model. Softw. 2013, 43, 5–25. [Google Scholar] [CrossRef] [Scilit]
- Zambrano-Bigiarini, M.; Rojas, R. hydroPSO: A Versatile Particle Swarm Optimisation R Package for Calibration of Environmental Models. In Proceedings of the European Geosciences Union (EGU), Vienna, Austria, 22–27 April 2012; Volume 14. [Google Scholar]
- Gupta, H.V.; Sorooshian, S.; Yapo, P.O. Status of Automatic Calibration for Hydrologic Models: Comparison with Multilevel Expert Calibration. J. Hydrol. Eng. 1999, 4, 135–143. [Google Scholar] [CrossRef] [Scilit]
- Gupta, H.V.; Kling, H.; Yilmaz, K.K.; Martinez, G.F. Decomposition of the mean squared error and NSE performance criteria: Implications for improving hydrological modelling. J. Hydrol. 2009, 377, 80–91. [Google Scholar] [CrossRef] [Scilit]
- Schürz, C.; Čerkasova, N.; Farkas, C.; Nemes, A.; Plunge, S.; Strauch, M.; Szabó, B.; Piniewski, M. SWAT+ Modeling Protocol for the Assessment of Water and Nutrient Retention Measures in Small Agricultural Catchments; Zenodo: Geneva, Switzerland, 2022. [Google Scholar] [CrossRef] [Scilit]
- Moriasi, D.N.; Arnold, J.G.; van Liew, M.W.; Bingner, R.L.; Harmel, R.D.; Veith, T.L. Model Evaluation Guidelines for Systematic Quantification of Accuracy in Watershed Simulations. Trans. ASABE 2007, 50, 885–900. [Google Scholar] [CrossRef] [Scilit]
- Moriasi, D.N.; Gitau, M.W.; Pai, N.; Daggupati, P. Hydrologic and water quality models: Performance measures and evaluation criteria. Trans. ASABE 2015, 58, 1763–1785. [Google Scholar] [CrossRef] [Scilit]
- Thiemig, V.; Rojas, R.; Zambrano-Bigiarini, M.; de Roo, A. Hydrological evaluation of satellite-based rainfall estimates over the Volta and Baro-Akobo Basin. J. Hydrol. 2013, 499, 324–338. [Google Scholar] [CrossRef] [Scilit]
- Kouchi, D.H.; Esmaili, K.; Faridhosseini, A.; Sanaeinejad, S.H.; Khalili, D.; Abbaspour, K.C. Sensitivity of calibrated parameters and water resource estimates on different objective functions and optimization algorithms. Water 2017, 9, 384. [Google Scholar] [CrossRef] [Scilit]
- Dalzell, B.J.; Baker, J.M.; Venterea, R.T.; Spokas, K.A.; Feyereisen, G.W.; Rice, P.J.; Alexander, J.R. The LTAR Cropland Common Experiment at Upper Mississippi River Basin–St. Paul. J. Environ. Qual. 2024, 53, 1008–1016. [Google Scholar] [CrossRef] [Scilit] [PubMed]
- Zuidema, S.; Liu, J.; Chepeliev, M.G.; Johnson, D.R.; Baldos, U.L.C.; Frolking, S.; Kucharik, C.J.; Wollheim, W.M.; Hertel, T.W. US climate policy yields water quality cobenefits in the Mississippi Basin and Gulf of Mexico. Proc. Natl. Acad. Sci. USA 2023, 120, e2302087120. [Google Scholar] [CrossRef] [Scilit] [PubMed]
- Di, H.J.; Cameron, K.C. Nitrate leaching in temperate agroecosystems: Sources, factors and mitigating strategies. Nutr. Cycl. Agroecosystems 2002, 46, 237–256. [Google Scholar] [CrossRef] [Scilit]
- Clifford, C.C.; Waring, E.R.; Pederson, C.H.; Helmers, M.J. Corn Yield Increase Under Constant Fertilizer Did Not Reduce Nitrate Export. J. ASABE 2023, 66, 1153–1161. [Google Scholar] [CrossRef] [Scilit]
- Schilling, K.E.; Jha, M.K.; Zhang, Y.K.; Gassman, P.W.; Wolter, C.F. Impact of land use and land cover change on the water balance of a large agricultural watershed: Historical effects and future directions. Water Resour. Res. 2008, 45, W00A09. [Google Scholar] [CrossRef] [Scilit]
- Tamagno, S.; Eagle, A.J.; McLellan, E.L.; van Kessel, C.; Linquist, B.A.; Ladha, J.K.; Lundy, M.E.; Pittelkow, C.M. Predicting nitrate leaching loss in temperate rainfed cereal crops: Relative importance of management and environmental drivers. Environ. Res. Lett. 2022, 17, 064043. [Google Scholar] [CrossRef] [Scilit]
- Cheng, F.Y.; van Meter, K.J.; Byrnes, D.K.; Basu, N.B. Maximizing US nitrate removal through wetland protection and restoration. Nature 2020, 588, 625–630. [Google Scholar] [CrossRef] [Scilit] [PubMed]
- Geisseler, D.; Horwath, W.R. Factors Affecting Soil Nitrate Concentrations in Spring. 2016. Available online: https://apps1.cdfa.ca.gov/FertilizerResearch/docs/Soil_Nitrate.pdf (accessed on 10 April 2026).
- Manono, B.O.; Kimiti, J.M.; Musyoka, D.K. Landscape Determinants of Nitrogen Leaching Risk: Mechanisms, Impacts, and Mitigation Strategies. Nitrogen 2026, 7, 20. [Google Scholar] [CrossRef] [Scilit]
- Nolan, B.T.; Ruddy, B.C.; Hitt, K.J.; Helsel, D.R. Risk of Nitrate in Groundwaters of the United StatessA National Perspective. Environ. Sci. Technol. 1997, 31, 2229–2236. [Google Scholar] [CrossRef] [Scilit]
- Spalding, R.F.; Exner, M.E. Occurrence of Nitrate in Groundwater—A Review. J. Environ. Qual. 1993, 22, 392–402. [Google Scholar] [CrossRef] [Scilit]
- Turner, R.E.; Rabalais, N.N.; Justic, D. Predicting summer hypoxia in the northern Gulf of Mexico: Riverine N, P, and Si loading. Mar. Pollut. Bull. 2006, 52, 139–148. [Google Scholar] [CrossRef] [Scilit] [PubMed]
- Gerlitz, M.; Fox, J.; Ford, W.; Husic, A.; Mahoney, T.; Armstead, M.; Hendricks, S.; Crain, A.; Backus, J.; Pollock, E.; et al. Instream sensor results suggest soil–plant processes produce three distinct seasonal patterns of nitrate concentrations in the Ohio River Basin. J. Am. Water Resour. Assoc. 2023, 59, 635–651. [Google Scholar] [CrossRef] [Scilit]
- Ferin, K.M.; Chen, L.; Zhong, J.; Acquah, S.; Heaton, E.A.; Khanna, M.; Vanloocke, A. Water Quality Effects of Economically Viable Land Use Change in the Mississippi River Basin under the Renewable Fuel Standard. Environ. Sci. Technol. 2021, 55, 1566–1575. [Google Scholar] [CrossRef] [Scilit] [PubMed]
- Carpenter, S.R.; Caraco, N.F.; Correll, D.L.; Howarth, R.W.; Sharpley, A.N.; Smith, V.H. Nonpoint Pollution of Surface Waters with Phosphorus and Nitrogen. Ecol. Appl. 1998, 8, 559–568. [Google Scholar] [CrossRef]

Disclaimer/Publisher’s Note: The statements, opinions and data contained in all publications are solely those of the individual author(s) and contributor(s) and not of MDPI and/or the editor(s). MDPI and/or the editor(s) disclaim responsibility for any injury to people or property resulting from any ideas, methods, instructions or products referred to in the content. |
© 2026 by the authors. Licensee MDPI, Basel, Switzerland. This article is an open access article distributed under the terms and conditions of the Creative Commons Attribution (CC BY) license.