


Abstract
As an important port in the Beibu Gulf of the South China Sea, Tieshangang Bay is potentially at risk of PTE pollution, yet systematic research integrating multi-hydrological period data remains limited. By applying pollution indices (Cf, WQI, Igeo, RI) combined with PCA, and PMF, we investigated PTE distribution characteristics, risk assessment, and source apportionment across different hydrological seasons. The results indicate that average PTE concentrations in surface seawater meet Class II standards of the Sea Water Quality Standard, with Zn and As showing relatively high concentrations compared to other PTEs. High-concentration areas were mainly located in the inner and middle bay. In sediments, concentrations of Zn and Cr were relatively high, with values generally higher inside the bay than outside. Both Cf and WQI values for seawater PTEs were below 1, indicating an overall low pollution risk. However, Cd and Hg in sediments presented a moderate potential ecological risk. Source apportionment revealed that seawater PTEs primarily originated from an industrial–aquaculture composite source (44.60%), while sediment PTEs were mainly attributed to composite terrestrial inputs (53.16%). These findings provide a scientific basis for PTE pollution management and sustainable development in Tieshangang Bay.
1. Introduction
Potentially toxic elements (PTEs) are globally prevalent persistent marine contaminants, owing to their inherent toxicity, bioaccumulation potential, and long-term environmental retention capacity [1,2,3]. Intensified anthropogenic activities, including industrial discharge, agricultural runoff, and domestic sewage discharge in coastal zones, have substantially increased exogenous PTE inputs to marine ecosystems over recent decades [4,5,6]. After entering seawater, PTEs undergo adsorption, complexation, and sedimentation, and ultimately accumulate in surface sediments. As both crucial pollution sinks and potential secondary pollution sources under variable environmental conditions, coastal sediments play a vital role in regulating the biogeochemical cycling of PTEs in marine environments [7,8]. Accordingly, PTE contamination has long been a core research focus in marine environmental science. Investigating the spatial distribution, seasonal dynamics, and source apportionment of PTEs in coastal water and sediments is critical for formulating targeted pollution control strategies and protecting coastal ecological health [9,10].
Tieshangang Bay is an important industrial and port coastal zone in the northern Beibu Gulf, facing increasing PTE pollution pressure alongside rapid socioeconomic development. Nevertheless, existing local studies suffer from obvious limitations in research comprehensiveness. Current investigations are mostly restricted to single-season sampling. For example, Su et al. [11] only reported the general pollution status of Guangxi coastal bays without exploring seasonal variations in PTE pollution, while Qu et al. [12] merely evaluated pollution levels in the limited port adjacent waters, lacking full-bay scale analysis and in-depth exploration of pollution driving mechanisms. No study has integrated multi-hydrological period seawater monitoring with sediment analysis to reveal the spatiotemporal evolution and quantitative source contributions of PTEs in this region.
This regional research gap also leads to insufficient international generality of relevant studies. Globally, most existing PTE pollution studies concentrate on well-developed temperate coastal bays such as the Baltic Sea, Persian Gulf, and Mediterranean Sea, with relatively mature pollution assessment systems and source identification frameworks [13,14,15]. In contrast, tropical and subtropical semi-enclosed bays undergoing rapid industrialization remain understudied, despite their unique monsoon-driven hydrological characteristics, high biodiversity, and fragile ecological environment [16]. As a typical tropical transboundary semi-enclosed bay connecting China and Vietnam, the Beibu Gulf sustains shared fishery resources for Southeast Asian countries and participates in regional marine ecological regulation. Continuous industrial expansion including petrochemical, thermal power, and papermaking industries along the coast has further exacerbated potential PTE contamination risks in this region [17].
Against this backdrop, we collected seawater and sediment samples from Tieshangang Bay over multiple hydrological periods and measured PTE concentrations. Using statistical tools and receptor models (PCA/PMF), we analyzed the spatiotemporal variations of PTEs and quantitatively apportioned their sources. This study aims to (1) reveal PTE distribution patterns and their driving factors; (2) assess pollution levels and potential ecological risks using conventional indices; and (3) identify major pollution sources and their contribution rates. Addressing the research gap in tropical rapidly industrializing coastal bays, this work provides fundamental data for local environmental governance and a transferable assessment framework for similar coastal zones across South and Southeast Asia, thereby supporting transboundary marine environmental management. The findings will support pollution prevention and ecological protection in the study area, as well as safeguard regional marine ecological security and public health.
2. Materials and Methods
2.1. Study Area
Tieshangang Bay is located in the northeastern part of the Beibu Gulf, Guangxi, China. It is a semi-enclosed bay with a sea area of approximately 394 km2, encompassing the waters between Yingpan and Yingluo Port in Hepu County. The bay generally trends northwest–southeast, with a coastline of about 40 km and an average width ranging from 3 to 4 km. The inner bay exhibits a unique antler-like morphology, while the bay mouth opens southward into the South China Sea in a trumpet shape. In recent years, several industrial projects—including petrochemical refining, coal-fired power generation, papermaking, and wastewater treatment—have been established along the coast of Tieshangang Port. Pollutants enter the bay via inflow rivers (e.g., Tieshan River, Zhakou River) and coastal direct discharge outlets, exacerbating the environmental pressure in this sea area.
2.2. Sampling Site Layout and Sample Collection
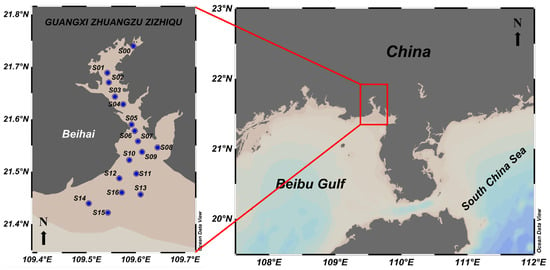
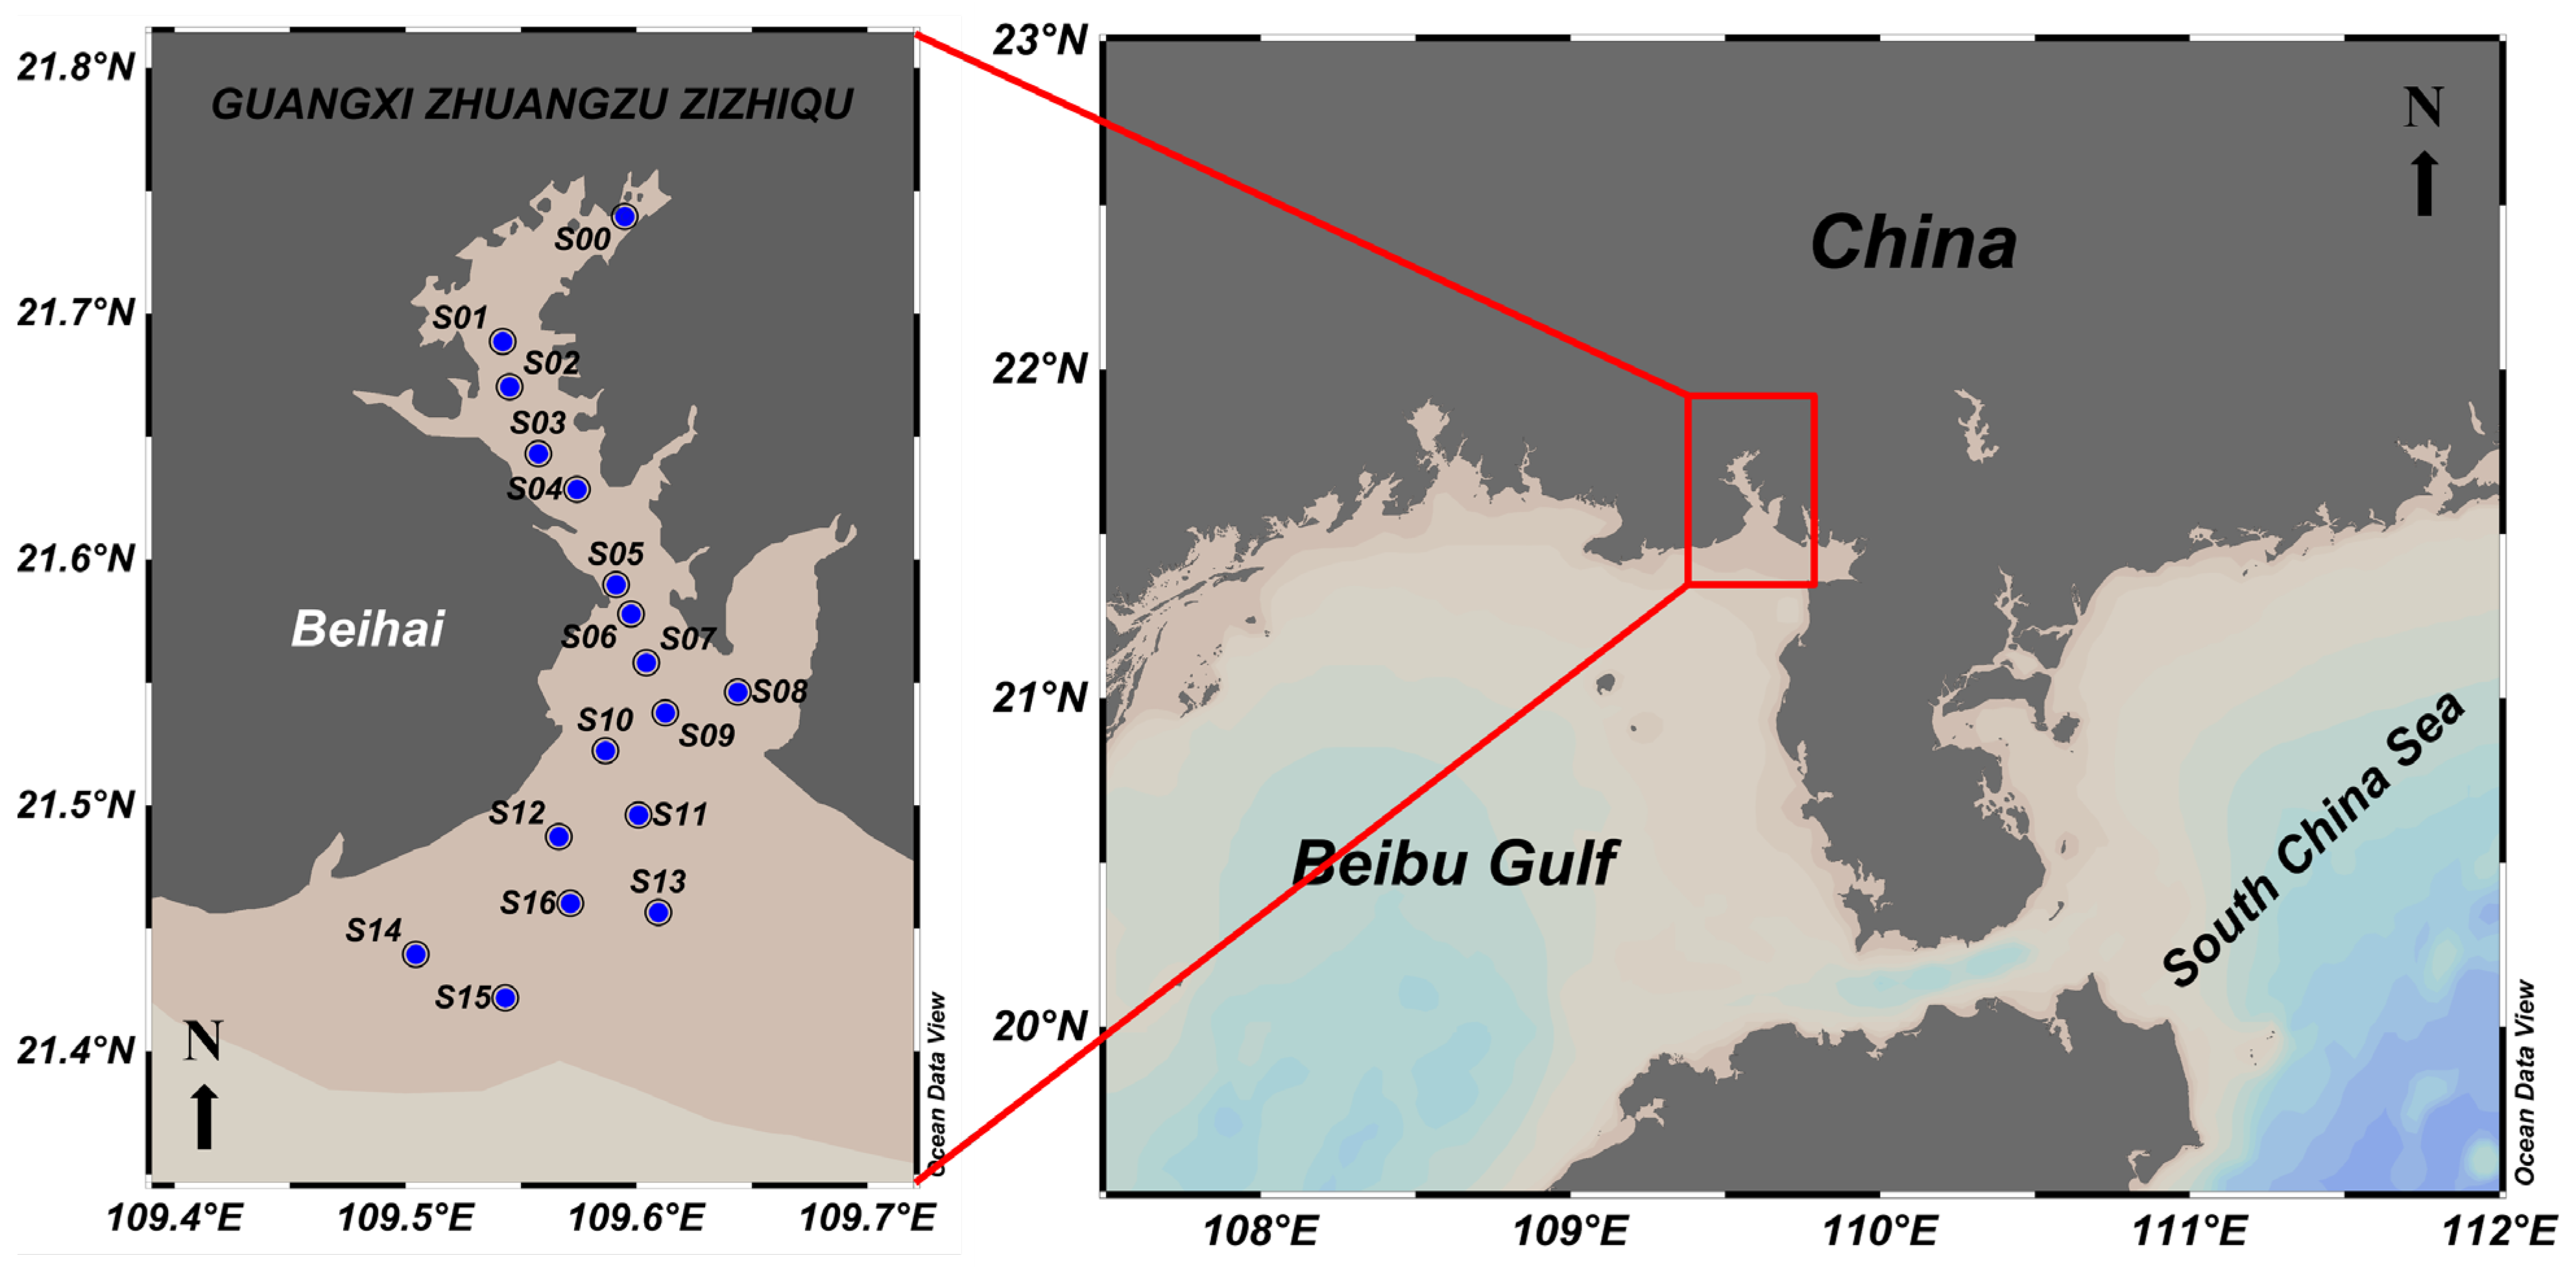
A total of 17 sampling points were established along the coast of Tieshangang Bay from north to south (Figure 1). These points were categorized into three functional zones: the terrestrial input zone in the inner bay (S00–S04), the port and shipping area in the central bay (S05–S10), and the industrial and offshore transition area in the outer bay (S11–S16), to systematically represent the spatial distribution characteristics of PTEs. Seawater samples were collected in November 2022 (normal water period), February 2023 (dry water period), and August 2023 (wet water period). Considering the relatively minor short-term variations in sediments, sediment sampling was conducted only once in November 2022. Surface water samples were collected at a depth of 0.1–1 m below the water surface using an organic polymer water sampler. At the same stations, surface sediment samples (0–10 cm depth) were collected using a grab sampler. The water samples were filtered through 0.45 μm cellulose acetate membranes, transferred into pre-cleaned polyethylene bottles, and acidified with HNO3 to pH < 2. Sediment samples were sealed in clean wide-mouth glass bottles, labeled, and stored at 0–4 °C. All procedures pertaining to sample collection, preservation, and transportation strictly followed the relevant standard protocols [18] to ensure the reliability of subsequent laboratory analyses.
Figure 1.
Layout of sampling sites in Tieshangang Bay. Color gradient indicates water depth: light blue for shallow waters in the Beibu Gulf and dark blue for deeper waters in the South China Sea.
2.3. Sample Analysis
In this study, “PTEs” refers to eight elements: Zn, Cu, As, Ni, Cd, Cr, Pb, and Hg (seven heavy metals and one metalloid, As). Sample pretreatment followed the relevant standard protocols [19,20]. Zn, Cu, Ni, Cd, Cr, and Pb were quantified using inductively coupled plasma mass spectrometry (iCAP RQ, Thermo Fisher Scientific, Waltham, MA, USA), while As and Hg were determined by atomic fluorescence spectrometry (AFS–9700/HGF-V4, Beijing Haiguang Instrument Co., Ltd., Beijing, China). Detailed ICP–MS operating conditions are provided in Table S1 [21]. All chemical reagents used in this study (including HNO3, HCl, HClO4, H2SO4, K2S2O8, NH2OH·HCl, thiourea, ascorbic acid, KMnO4, and oxalic acid) were of guaranteed grade and obtained from Sinopharm Chemical Reagent Co., Ltd. (Shanghai, China). Standard stock solutions for PTEs were purchased from Guobiao (Beijing) Testing & Certification Co., Ltd. (Beijing, China).
For seawater samples, aliquots for Zn, Cu, Ni, Cd, and Pb were preconcentrated using a chelation column and eluted with 10% HNO3. For Cr, matrix-matched dilution was applied. The digested solutions were then analyzed by ICP–MS. For As, 25 mL of acidified seawater was mixed with 2.5 mL HCl and 0.5 mL thiourea–ascorbic acid solution, reacted for 20 min, and measured by AFS–9700. For Hg, 25 mL of seawater was digested with 0.5 mL H2SO4 and 1.25 mL K2S2O8 at room temperature for 24 h, followed by the addition of 0.5 mL NH2OH·HCl before HGF-V4 analysis.
For sediment samples, visible impurities were manually removed. Samples were freeze-dried for 72 h until constant weight, ground to pass a 160-mesh sieve, and stored in sealed containers. For Zn, Cu, Ni, Cd, Cr, and Pb, 0.1000 g of dry sediment was placed in a PTFE digestion vessel pre-cleaned by soaking in 10% HNO3 for 48 h. Subsequently, 6 mL HNO3 and 3 mL HCl were added. The vessel was sealed and subjected to microwave digestion (1200 W, 120 °C for 6 min, then 180 °C for 15 min). After cooling, a few drops of HClO4 were added, and the solution was evaporated to dryness on a hot plate. The residue was redissolved in 1 mL HNO3, diluted to 25 mL with ultrapure water, and analyzed by ICP–MS. For As, 0.1–0.2 g of sediment was digested with 10 mL aqua regia in a boiling water bath for 1 h. A 2 mL aliquot of the digest was mixed with 10 mL HCl and 5 mL thiourea–ascorbic acid solution, diluted to 100 mL, and analyzed by AFS–9700 after 20 min of reduction. For Hg, 1–5 g of wet sediment was digested with 2 mL HNO3 and 6 mL HCl in a boiling water bath for 1 h. After cooling, 1 mL KMnO4 was added, followed by dilution to 50 mL with oxalic acid, and analyzed by HGF-V4.
2.4. Seawater PTE Pollution Assessment Methods
Ultrapure water and analytical-grade reagents were used throughout. Procedural blanks, certified reference materials (CRMs), and duplicate analyses were employed for quality assurance and quality control (QA/QC). For seawater, CRMs included GBW(E) 080040 (Cu, Pb, Zn, Cd, Ni) and GSB 07-3171-2014 (As), with recoveries of 80–115%. For sediments, CRM GBW07314 was used to ensure analytical accuracy. All samples were analyzed in triplicate (RSD < 20%). Detection limits are listed in Table S2.
The pollution level of PTEs in seawater was evaluated using the single-factor pollution index (Cif) method and the comprehensive pollution index (WQI). The calculation formulas are as follows [22,23]:
where Cf is the single-factor pollution index for a given element, reflecting its pollution level; Cs is the measured concentration of the element (μg/L); and Cn is the standard limit for the element under Class II seawater quality as specified in the Seawater Quality Standard (GB 3097-1997) [24] (μg/L) (Table S6). If Cf ≤ 1, the indicator meets the water quality standard; if Cf > 1, it exceeds the standard. WQI is the comprehensive pollution index, reflecting the overall pollution level of PTEs at each sampling site. The evaluation criteria refer to existing studies [25,26], with specific standards shown in Table S3.
2.5. Sediment PTE Pollution Assessment Methods
2.5.1. Geo-Accumulation Index Method
The geo-accumulation index (Igeo) was used to assess the cumulative pollution degree of PTEs in sediments [27,28]. The calculation formula is as follows:
where Ci is the measured concentration of element i (mg/kg); Bi is the environmental background value of element i (mg/kg). This study adopts the average values from surveys conducted in the Beibu Gulf in the 1980s as the background reference [29,30] (Table 1); k is a correction coefficient (set as 1.5) used to account for variations in the geochemical background of sediments [31]. The evaluation criteria for the geo-accumulation index are provided in Table S4.
Table 1.
Background values (Bi) and toxicity response coefficients (Tri) of PTEs in sediments.
2.5.2. Potential Ecological Risk Index Method
The potential ecological risk index method comprehensively considers PTE concentrations, background values, and toxic effects, and is widely used for the ecological risk assessment of PTEs in sediments [32,33]. The calculation formulas are as follows:
where Ci is the measured concentration of element i (mg/kg); Bi is the background value of element i (mg/kg); Tri is the toxicity response coefficient of element i (Table 1); Eri is the single-factor potential ecological risk index of element i; and RI is the comprehensive potential ecological risk index of multiple PTEs. The corresponding evaluation criteria [34,35,36] are shown in Table S5.
2.6. Source Apportionment Methods
2.6.1. Principal Component Analysis (PCA) for Source Identification
Principal component analysis (PCA) was applied for data dimensionality reduction. Through orthogonal transformation, a few uncorrelated principal components were extracted to identify potential combinations of PTE sources. Prior to analysis, the Kaiser–Meyer–Olkin (KMO) measure and Bartlett’s test of sphericity were performed using Origin 2021 software to verify the suitability of the dataset for factor analysis. PCA was performed for both seawater and sediment samples. Note that Pb and Hg were excluded from subsequent source apportionment analysis due to their extremely low detection rates (9.80% and 7%, respectively) and negligible pollution levels in seawater, which could introduce bias to multivariate statistical models.
2.6.2. Positive Matrix Factorization (PMF) Receptor Model
Positive Matrix Factorization (PMF) is a receptor model based on a least-squares iterative algorithm, widely used for pollution source apportionment in environmental media [37,38,39]. The model decomposes the concentration matrix (X) into a source contribution matrix (G), a source composition profile matrix (F), and a residual matrix (E). The fundamental formula is as follows:
where Xij is the concentration of the j-th element in the i-th sample (mg/kg); p is the preset number of pollution sources; Gik represents the contribution rate of the k-th source to the i-th sample; Fkj represents the concentration characteristic of the j-th element in the k-th source (mg/kg); and Eij is the residual of the j-th element in the i-th sample.
The PMF model determines the optimal factor solution by iteratively minimizing the objective function Q, defined as:
The uncertainty Uij is estimated as follows:
where Q is the objective function; n is the number of samples; m is the number of element species; Uij is the uncertainty value, representing the uncertainty of the j-th element in the i-th sample; δ is the measurement error fraction, taken as an empirical value of 10% according to the literature [39]; c is the measured concentration of the element (mg/kg); and MDL is the method detection limit for the j-th element (mg/kg).
2.7. Data Processing
PCA was used for macroscopic source identification, while PMF was used for quantitative source apportionment. These two methods are functionally complementary. PCA effectively reduces data dimensionality and identifies collinearity among elements, but suffers from rotational ambiguity and sensitivity to the input dataset [40,41]. PMF imposes non-negativity constraints, generating more physically meaningful source profiles and resolving mixed sources that PCA fails to distinguish [42]. Thus, for sediment samples, PCA and PMF together form a complete evidence chain from qualitative identification to quantitative allocation. In this study, PMF was applied only to sediment samples.
All statistical analyses were performed using SPSS 27.0. Spatial distribution maps were generated using OCEAN DATA VIEW (version 5.8.2). Concentrations below the method detection limit were substituted with MDL/2, a common practice in environmental data analysis for handling such values [43]. All basic data processing was performed using Microsoft Excel 2021. Principal component analysis (PCA) was conducted using Origin 2021. Source apportionment was carried out using the EPA PMF 5.0 model released by the United States Environmental Protection Agency.
3. Results and Discussion
3.1. PTE Concentrations and Spatial Characteristics in Seawater
3.1.1. PTE Concentration in Seawater
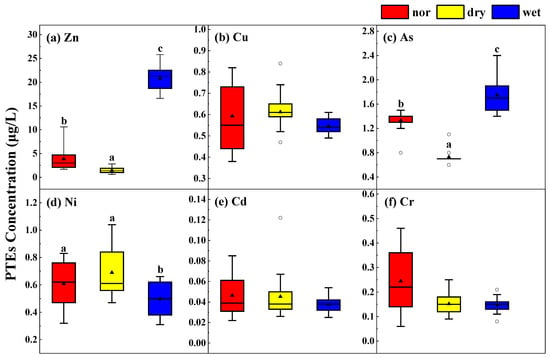
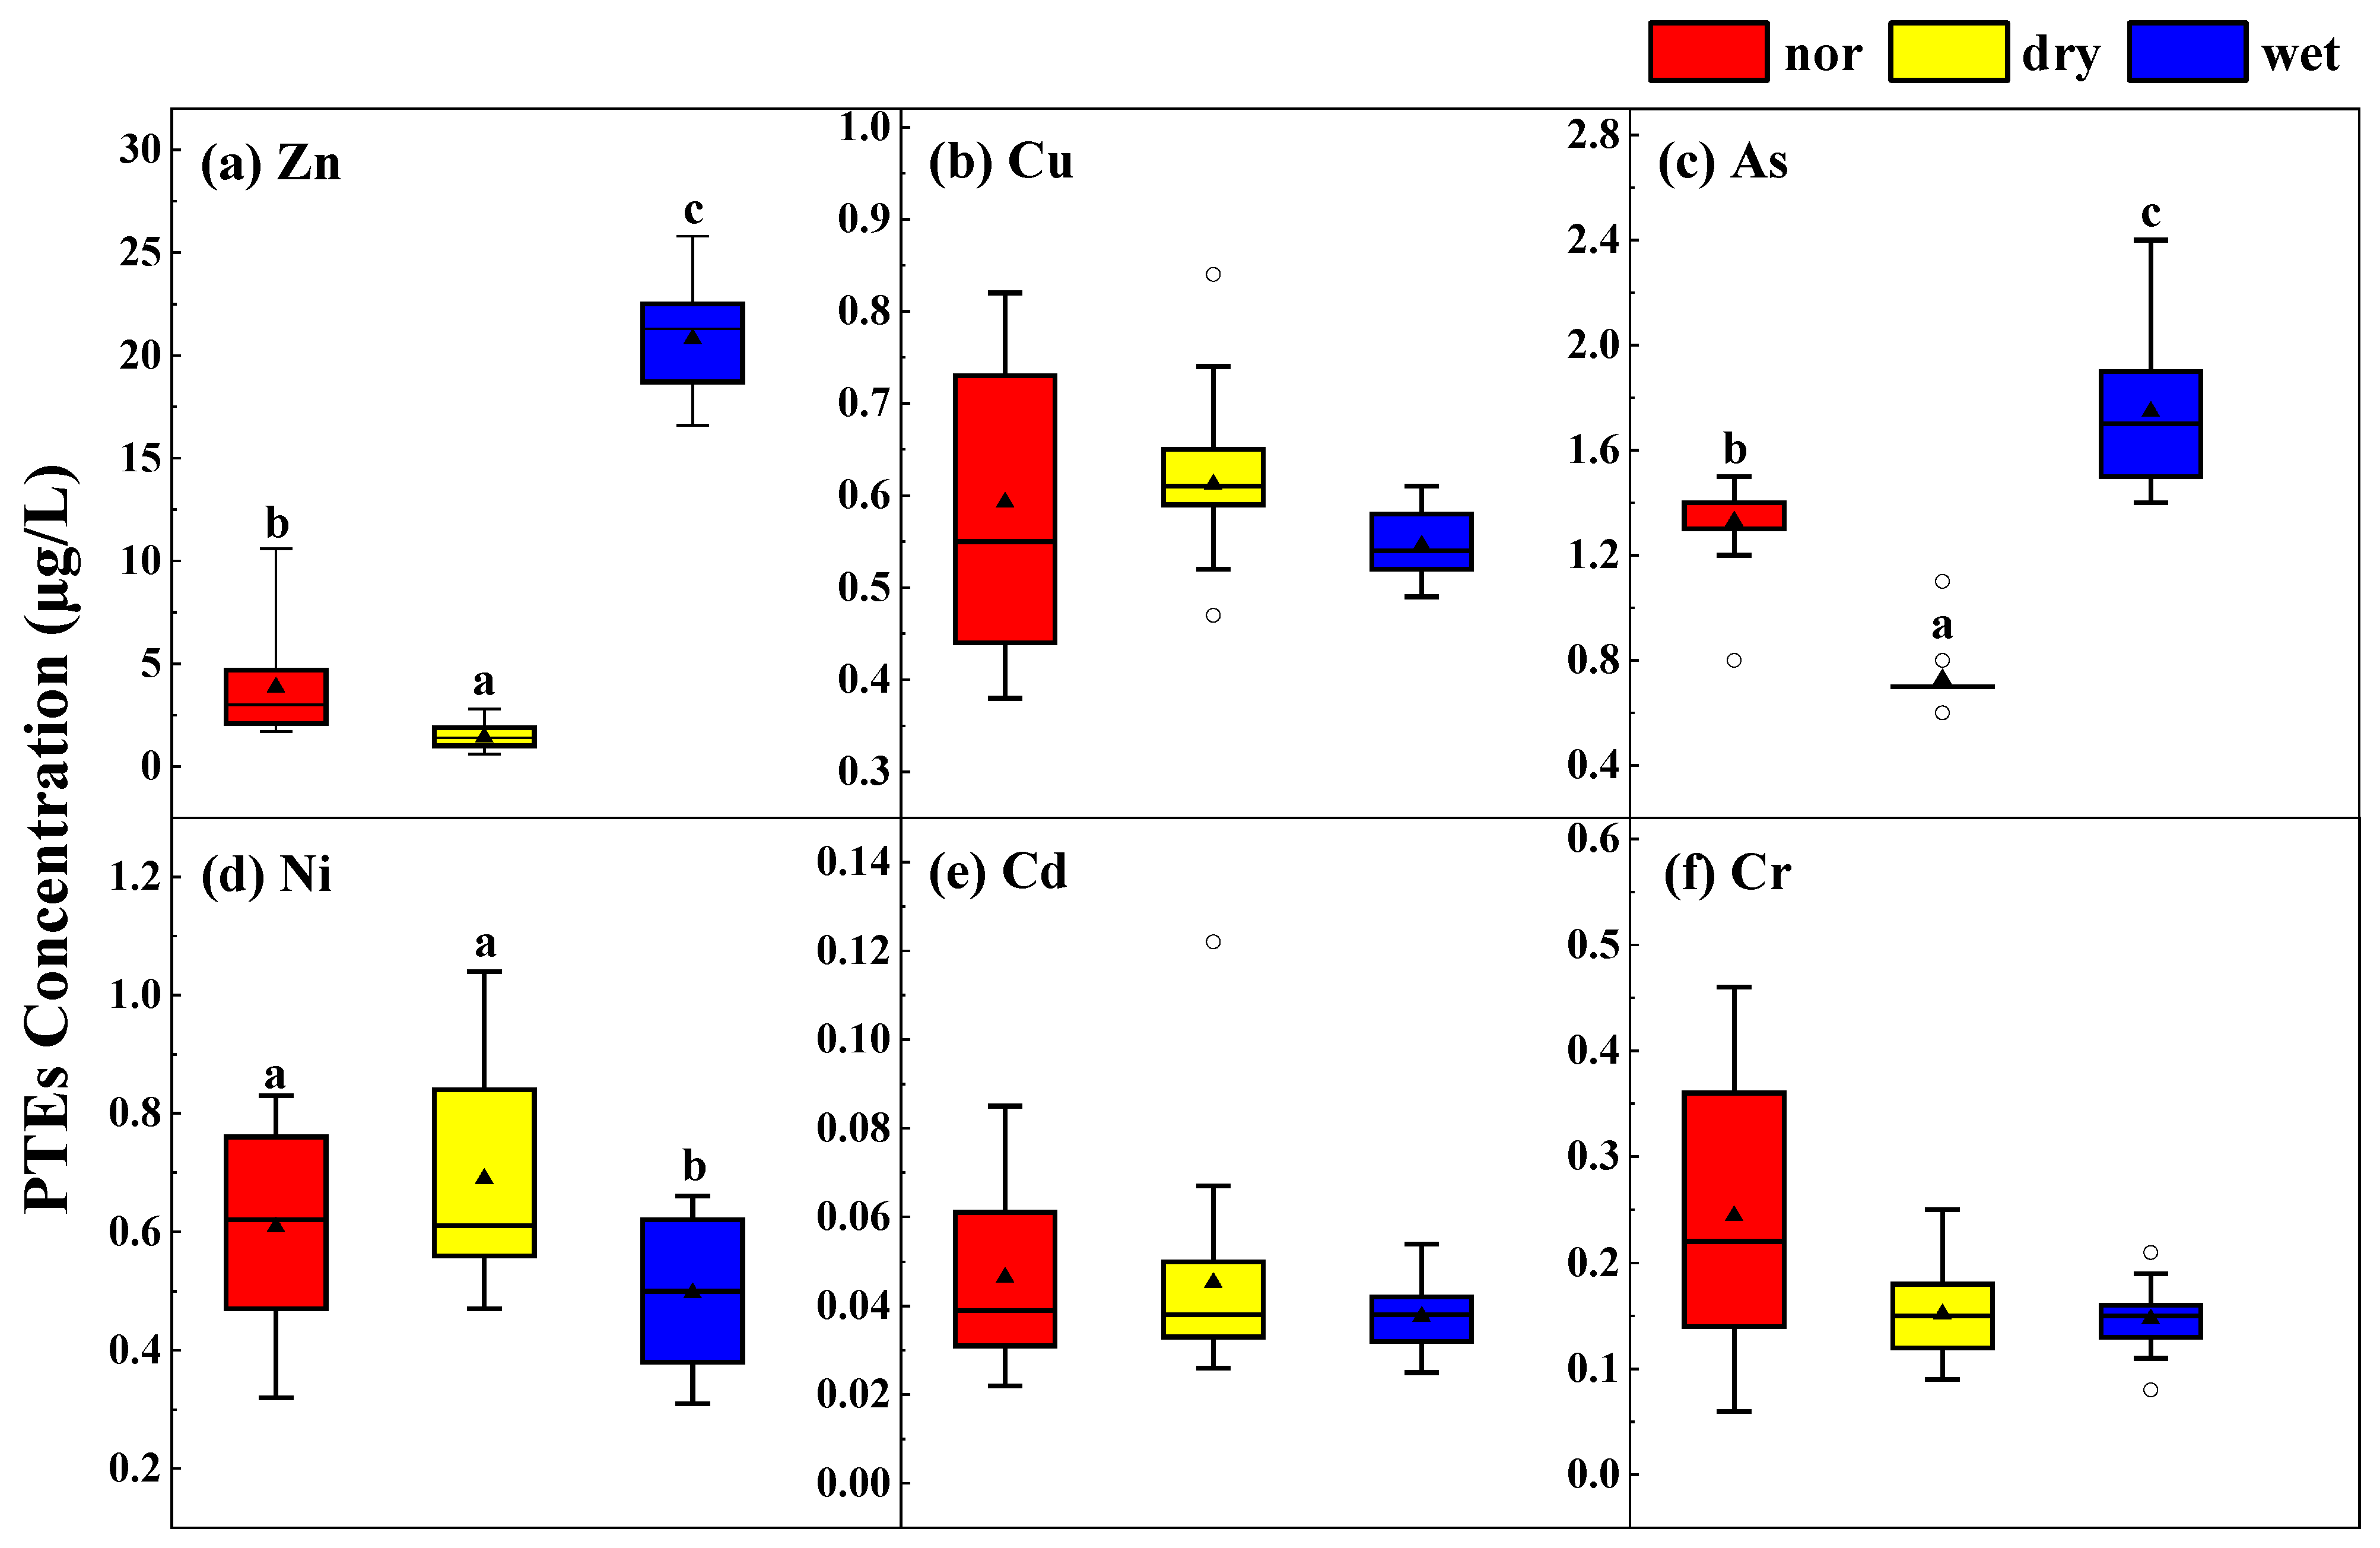
The concentrations of PTEs in seawater collected from Tieshangang Bay during different hydrological seasons (normal, dry, and wet) are summarized in Table S6. Among the eight PTEs analyzed (Zn, Cu, As, Ni, Cd, Cr, Pb, and Hg), Zn exhibited the highest annual mean concentration (8.70 μg/L), followed by As (1.27 μg/L), while Hg was below the detection limit in all samples. The highest mean Zn concentration (20.81 μg/L) was observed in the wet season, which was approximately 5.4-fold and 14.7-fold higher than those recorded in the normal (3.86 μg/L) and dry (1.42 μg/L) seasons, respectively. Similarly, As levels were elevated during the wet season (1.75 μg/L) compared to the normal (1.33 μg/L) and dry (0.73 μg/L) seasons. In contrast, Cu and Ni exhibited relatively stable mean concentrations across all seasons, ranging from 0.55–0.61 μg/L and 0.50–0.69 μg/L, respectively. All measured PTE concentrations were below the Chinese Seawater Quality Standard Class II limits (GB 3097-1997), with zero exceedances, indicating that seawater quality in Tieshangang Bay met national standards for aquatic environments during the study period.
Domestically, in the adjacent Tieshan Port, Qu et al. [12] reported seawater concentrations of Cu (1.66 μg/L), Pb (0.47 μg/L), Zn (2.91 μg/L), Cr (0.33 μg/L), As (1.97 μg/L), and Hg (0.026 μg/L), with higher levels observed in autumn than in spring, and identified Hg and Pb as posing higher potential ecological risks. In Quanzhou Bay, a subtropical bay in southeastern China, Zn was identified as the most abundant PTE in seawater, and sediment Cd reached 3.93 times the background value, with industrial and agricultural activities identified as major sources [44]. On a broader scale, the contamination status of Tieshangang Bay is also favorable compared to many international coastal systems. In the Bay of Bengal along the Cuddalore coast of India, assessed trace metal distributions in surface waters and found slightly elevated levels of hazardous elements including Ni and Cd, with Ni concentrations 4–6 times higher than regional averages and extreme Cd enrichment in certain locations [45]. In Kuwait Bay and its territorial seawaters, Al-Kandari et al. [46] documented elevated concentrations of multiple metals, with contamination levels higher in open territorial waters than within the bay itself. In contrast, the low PTE concentrations and zero exceedance rates observed in this study indicate that Tieshangang Bay seawater currently meets national quality standards, though continued monitoring is warranted to detect potential future changes.
To evaluate seasonal differences in PTE concentrations, a repeated-measures ANOVA was conducted with hydrological period (normal, dry, and wet) as the within-subject factor, followed by Bonferroni post hoc correction for multiple comparisons. As shown in Figure 2, Zn and As exhibited statistically significant seasonal variations (p < 0.05), with wet season concentrations significantly exceeding those in both normal and dry seasons (p < 0.05). This pronounced seasonal pattern strongly suggests that land-based runoff is a major pathway for these two elements. In contrast, Cu and Cd concentrations remained stable across seasons (p > 0.05), pointing to continuous sources such as steady industrial discharges or sediment resuspension. Cr showed high variability during the normal period but remained relatively stable in other seasons, hinting at intermittent point sources or seasonal hydrodynamic effects.
Figure 2.
Statistical comparison of PTE concentrations across three hydrological periods (normal, dry, wet). Different lowercase letters (a, b, c) above the boxes indicate significant differences among periods (repeated-measures ANOVA with Bonferroni post hoc correction, p < 0.05). No letters indicate no significant difference (p > 0.05). Triangles represent mean values, and hollow circles represent outliers.
3.1.2. Spatial Distribution Characteristics of PTEs in Seawater
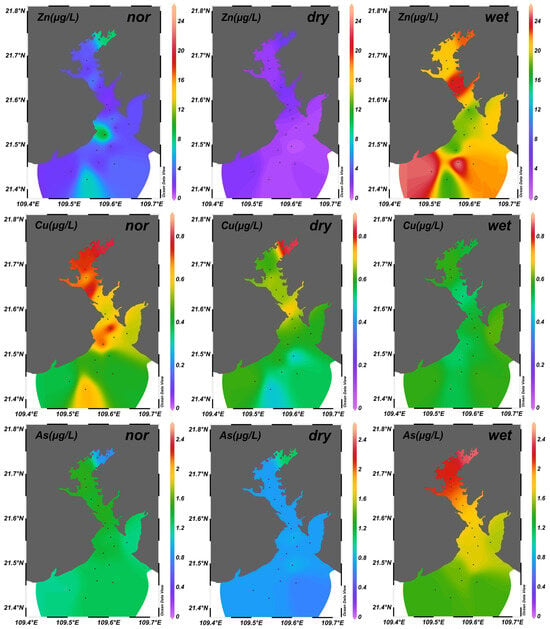
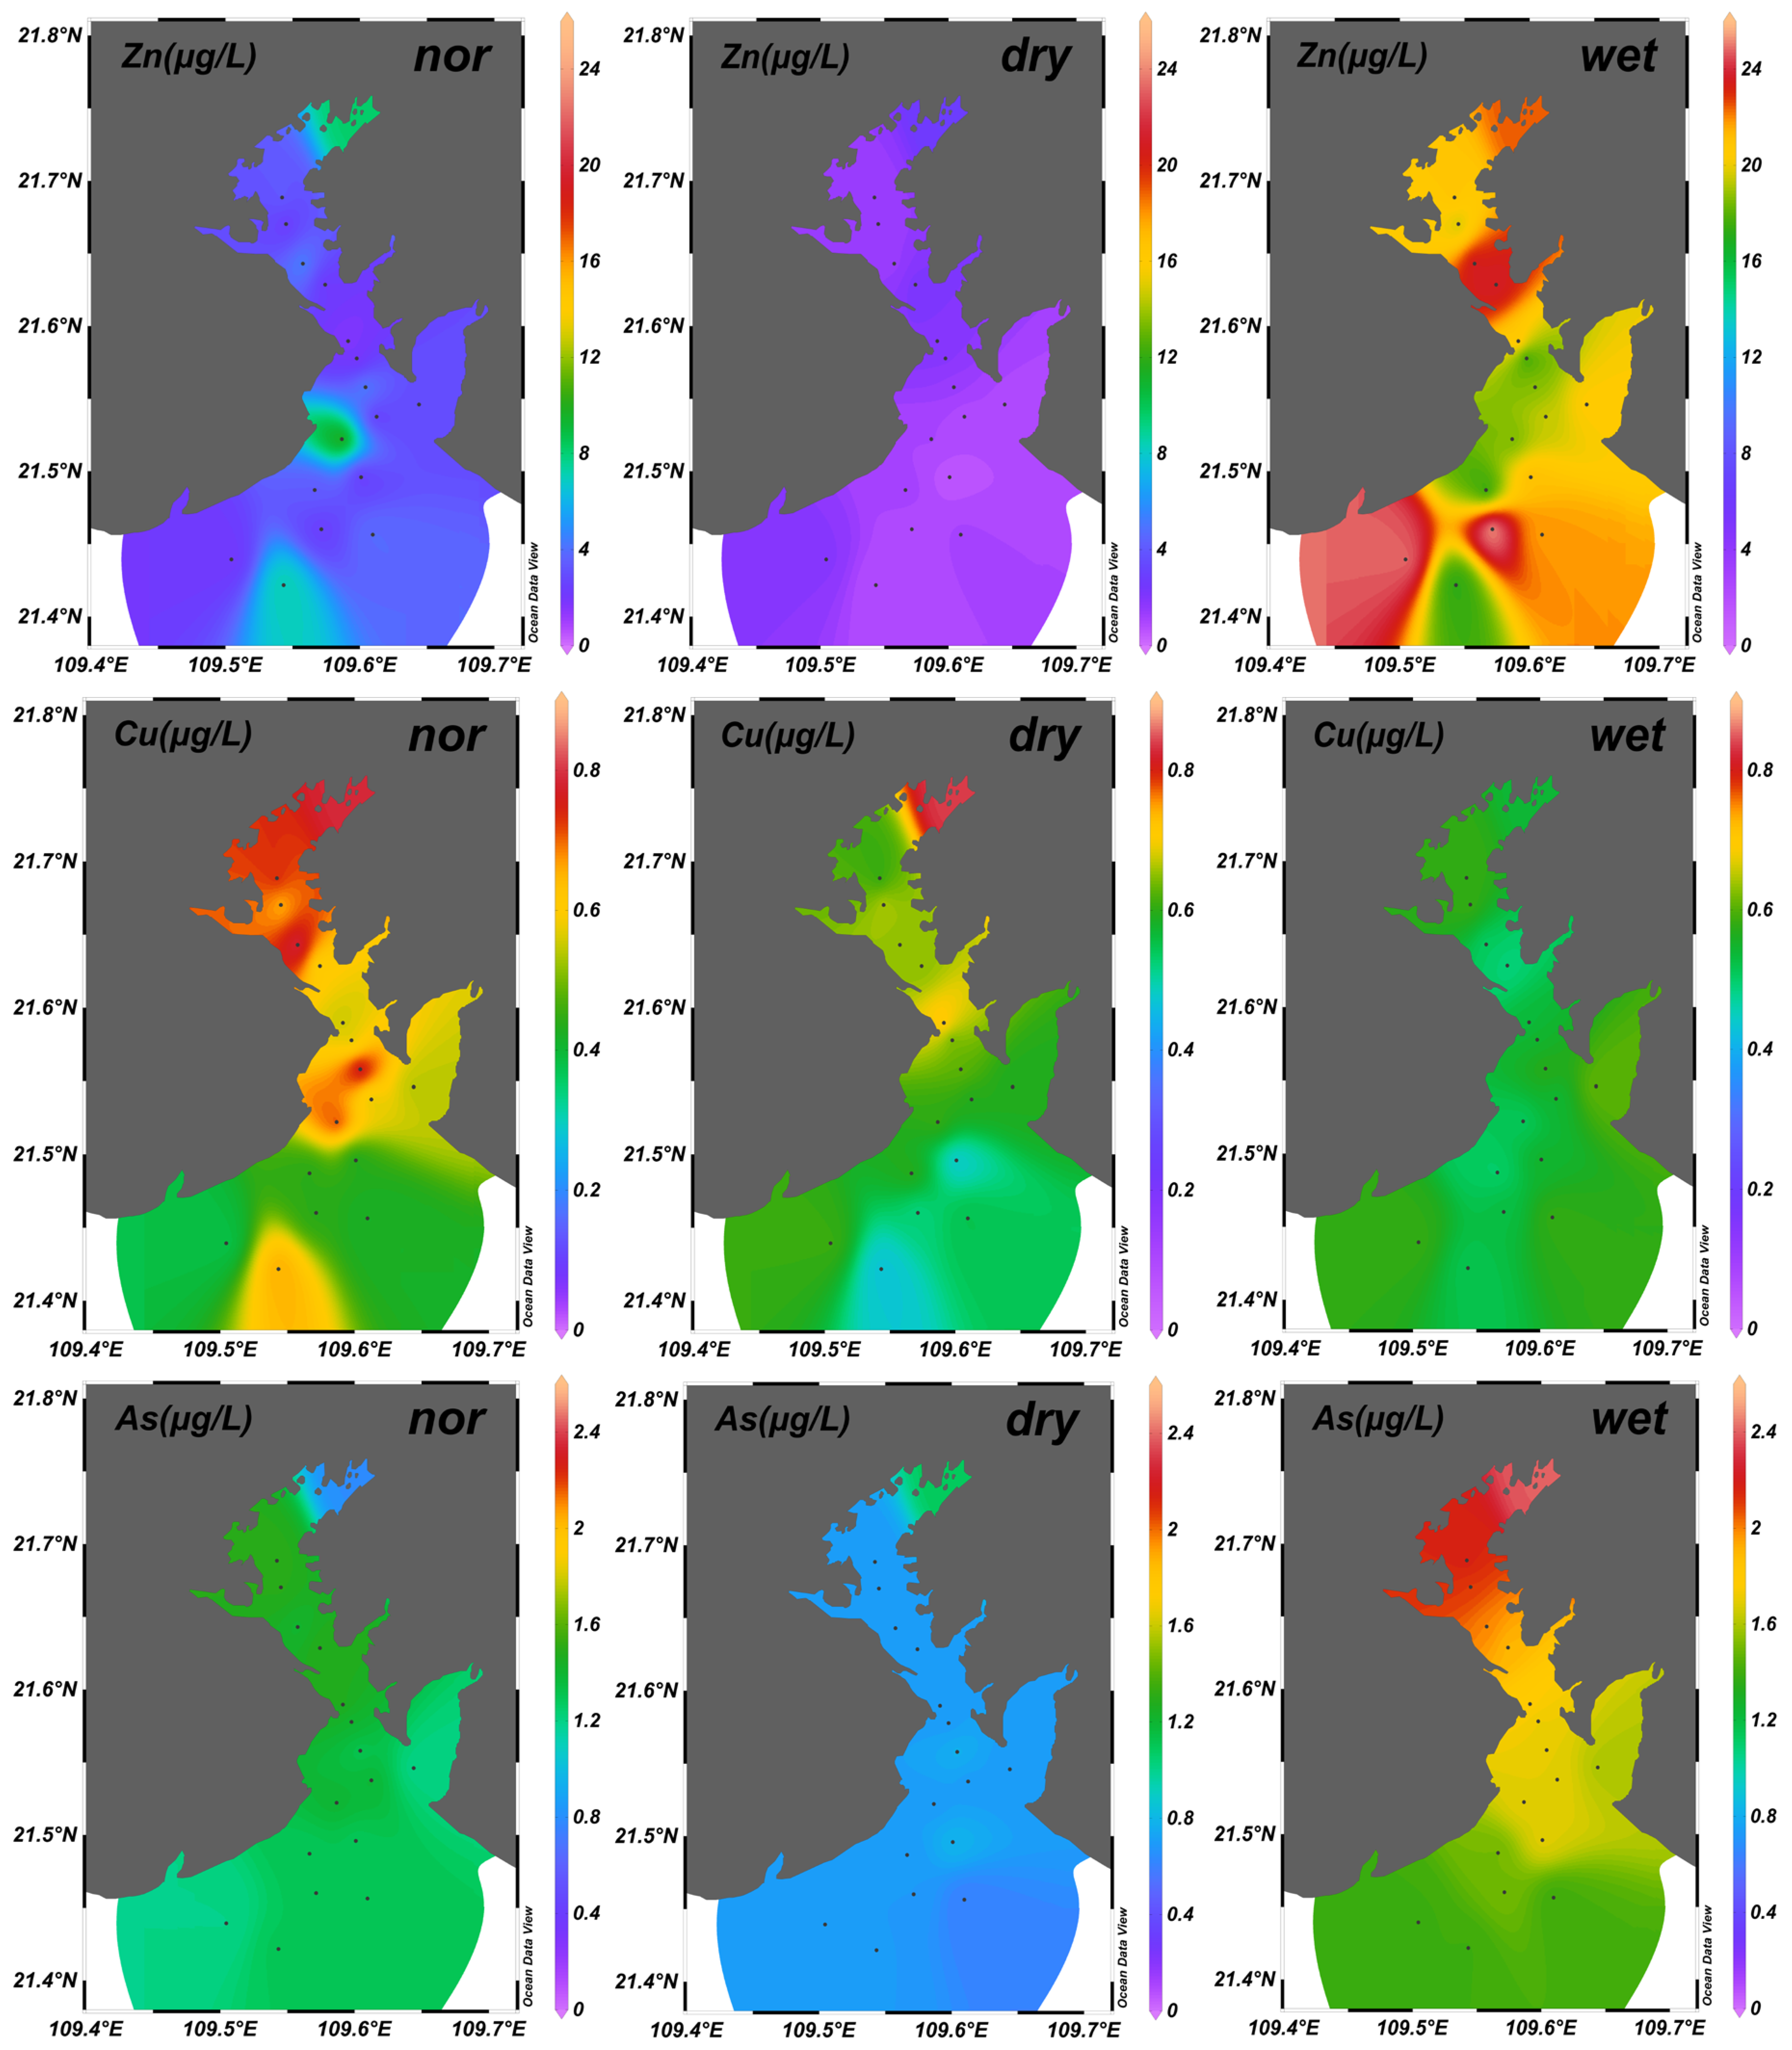
The spatial distribution characteristics of PTEs in seawater, as revealed in this study (Figure 3 and Figure S1), comprehensively reflect the synergistic regulation of natural hydrodynamic conditions and anthropogenic activities. To quantify spatial differences, statistical comparisons (one-way ANOVA or Welch’s ANOVA followed by Tukey HSD) were conducted across three predefined sub-regions: the inner bay (stations S00–S04), the central bay (stations S05–S10), and the outer bay (stations S11–S16). The results revealed obvious spatial heterogeneity in PTE concentrations across all hydrological seasons.
Figure 3.
Spatial distribution of PTEs (Zn, Cu, As) in seawater across different hydrological periods.
In the wet season, strong riverine input and water dispersion dominated the spatial patterns of PTEs. The concentrations of Zn, As, Ni and Cd peaked in the inner bay and gradually decreased toward the outer bay. Statistical tests indicated significant differences in Ni (inner bay > central bay > outer bay), Cd (inner bay > central bay, inner bay > outer bay) and Cr (central bay > inner bay) (p < 0.05). Higher As concentrations were observed in the outer bay (p < 0.05). The persistent enrichment of Cr in the central bay was closely associated with port operations and industrial activities. Due to sufficient water dispersion under high flow conditions, no distinct spatial variations were found for Zn and Cu. Hydrodynamic dispersion weakened considerably in the dry season, leading to the accumulation of pollutants in the inner bay. The concentrations of Zn, As, Ni, Cu and Cd generally declined from the inner bay to the outer bay. Significant differences were detected for Ni, Cu and Cd, with higher values in the outer bay than in the inner bay (p < 0.05). Cr maintained its distribution pattern of central bay > outer bay > inner bay, which was consistent with that in the wet season. This further verified that industrial point-source emissions caused continuous local enrichment of Cr under weak water exchange conditions.
As a transitional period, the normal season combined the characteristics of wet and dry seasons. The spatial variation of PTEs was regulated by terrestrial inputs, industrial emissions and tidal activities. Significant spatial differences were observed in Ni (inner bay > outer bay), Cu (outer bay > inner bay) and Cd (inner bay > central bay > outer bay) (p < 0.05), while Zn, As and Cr showed no remarkable spatial heterogeneity. Zn, Cu and Cd remained high in the inner bay, demonstrating the long-term influence of terrestrial sources. The distribution of As and Ni shifted to central bay predominance, suggesting an increased contribution from port and industrial activities during this period. Cr presented an abnormal distribution (inner bay > outer bay > central bay), which could be explained by the resuspension of sediment-bound PTEs driven by tides in the inner bay, as well as complex water mixing induced by offshore water intrusion into the central bay.
In summary, the pronounced spatial heterogeneity of PTEs in seawater results from the combined effects of pollution source typology, hydrodynamic intensity, and seasonal hydrological variability. PTEs mainly derived from terrestrial sources such as Zn, As, Cu, and Cd exhibited stable concentration gradients with higher levels in the inner bay. Cr, closely related to industrial and port activities, consistently formed high-concentration zones in the central bay, and its enrichment effect became more prominent during low-flow periods including dry and normal seasons. Frequent water exchange with the open sea kept most PTE concentrations at the lowest levels in the outer bay throughout all hydrological periods, reflecting the natural dilution and self-purification capacity of the bay ecosystem.
3.2. PTE Concentrations and Spatial Characteristics in Sediments
3.2.1. PTE Concentrations in Sediments
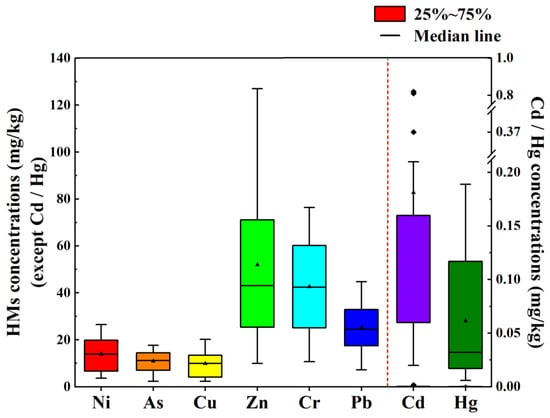
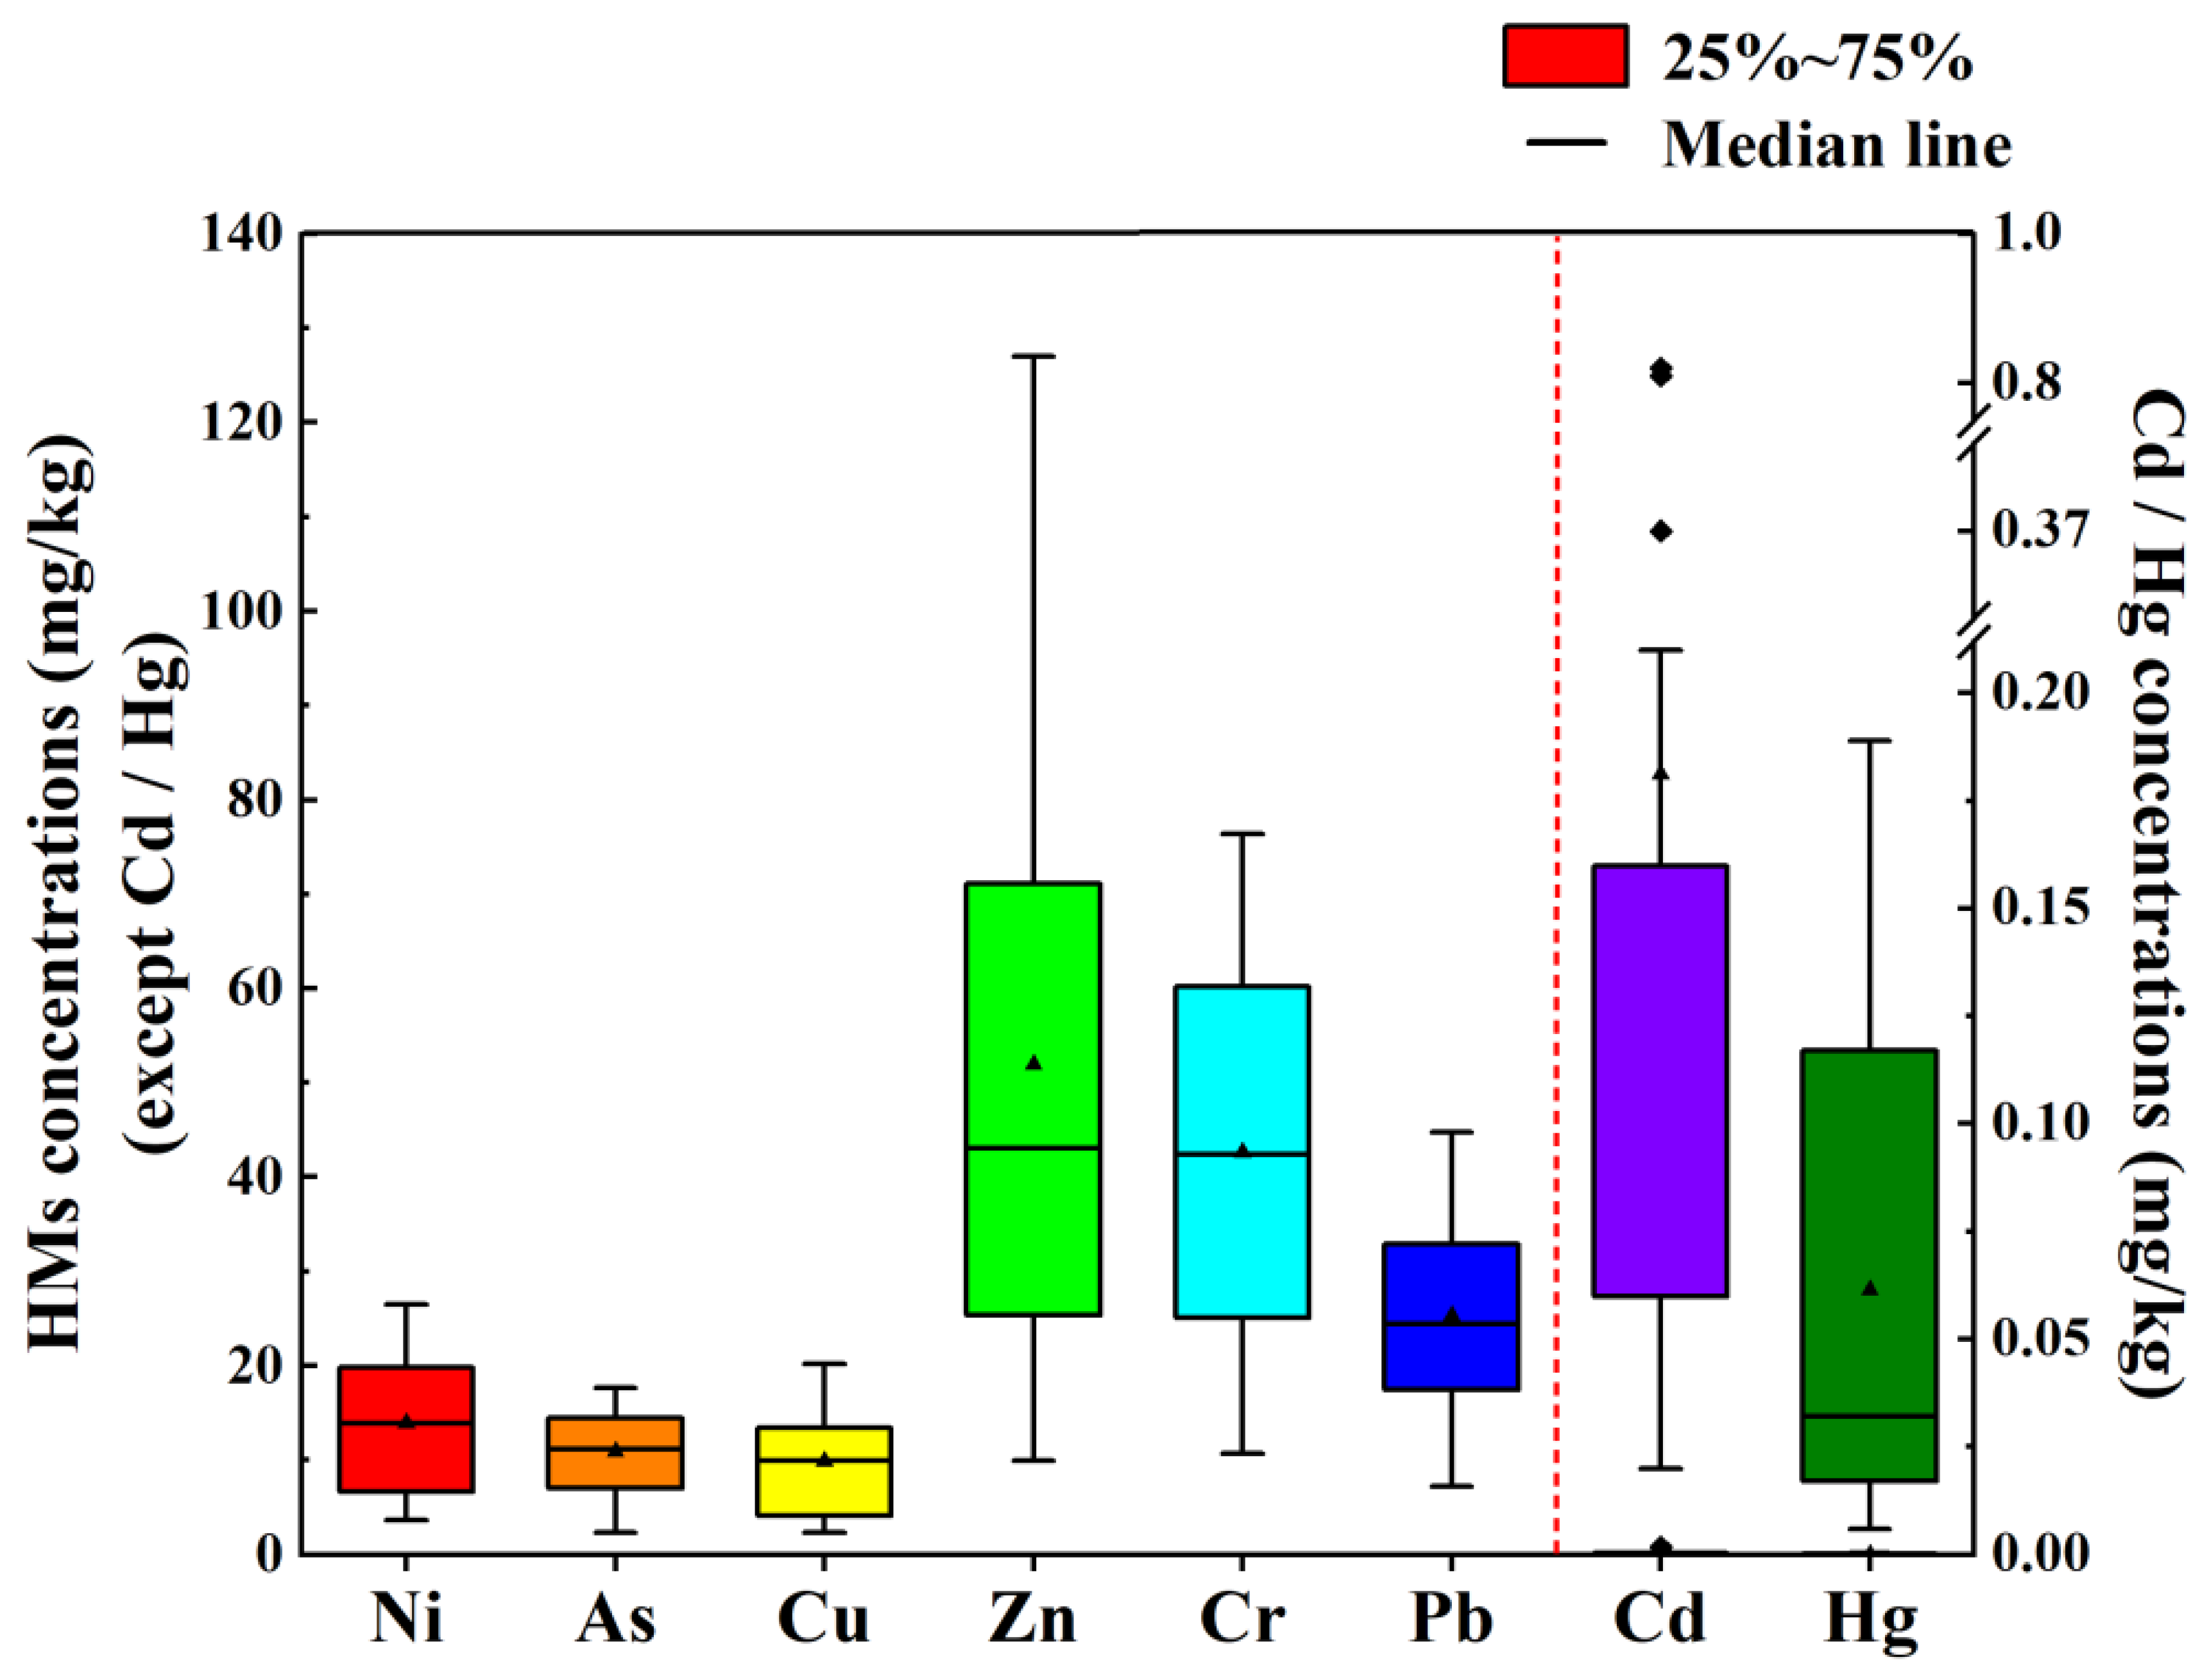
The statistical characteristics of PTE concentrations in surface sediments from Tieshangang Bay are summarized in Figure 4 and Table S7. All eight target PTEs (Ni, As, Cu, Zn, Cr, Pb, Cd, and Hg) were detected at every sampling station, confirming their ubiquitous presence in the sedimentary environment of the study area. Substantial variation in concentration levels was observed among the eight elements. Zn exhibited the highest mean concentration (51.95 mg/kg) with a maximum of 127.00 mg/kg, followed by Cr (42.67 mg/kg) and Pb (25.36 mg/kg). Ni, As, and Cu showed moderate mean concentrations of 13.95, 10.91, and 9.94 mg/kg, respectively, while Cd and Hg recorded the lowest mean values (0.18 mg/kg and 0.061 mg/kg, respectively). This concentration hierarchy (Zn > Cr > Pb > Ni > As > Cu > Cd > Hg) reflects the combined influence of natural background levels and anthropogenic inputs.
Figure 4.
Concentrations of PTEs in sediments from Tieshangang Bay (November 2022). Dashed lines indicate that Cd and Hg do not share the same y-axis with other PTEs. Triangles represent mean values, and squares represent outliers.
The coefficient of variation (CV) revealed distinct spatial heterogeneity among the PTEs, providing insights into their sources and dispersion pathways. Cd exhibited the highest CV (140.14%), indicating pronounced point-to-point fluctuations and suggesting strong localized inputs, likely from point-source pollution. Hg also showed a high CV (99.36%), pointing to significant local enrichment. Zn and Cu displayed relatively high CVs (68.08% and 59.83%, respectively), implying moderate spatial variability. In contrast, Ni, As, Cr and Pb demonstrated lower CVs ranging from 42.59% to 56.56%, indicating relatively uniform spatial distributions across the bay. These CV patterns align with findings from a recent study in Tieshangang Bay [47], which reported CVs of 99.2% for Cd, 103.2% for Cu, 83.9% for Zn, 62.7% for Pb, and 38.7% for As, respectively, further confirming the localized enrichment of Cd and Cu in the study area.
When compared against local background values, Pb recorded the highest exceedance rate (41.18%), identifying it as the element posing the most prominent pollution risk in Tieshangang Bay sediments. Cu and Hg shared an exceedance rate of 29.41%, followed by Cr (23.53%), As (23.53%), Zn (17.65%), and Cd (11.76%). Notably, Ni did not exceed the background value at any sampling station, suggesting a minimal pollution risk from this element. The boxplot (Figure 4) further illustrates these exceedance patterns, with Cd and Hg showing scattered high-value outliers that are consistent with their high CVs and localized accumulation tendencies.
Comparison with other coastal regions, the PTE concentrations in Tieshangang Bay sediments were generally lower than or comparable to those reported in other coastal systems worldwide. In Masan Bay, Korea [48], sediment concentrations of Cu (43.4 mg/kg), Pb (44 mg/kg), and Zn (206.3 mg/kg) were substantially higher than those observed in our study (Cu: 9.94 mg/kg; Pb: 25.36 mg/kg; Zn: 51.95 mg/kg), reflecting the intensive industrial activities in that region. Similarly, Bremen Bay, Germany [49], exhibited even more elevated levels (Cr: 131 mg/kg; Cu: 87 mg/kg; Pb: 122 mg/kg; Zn: 206.3 mg/kg), a legacy of long-term industrial pollution in European coastal zones. Izmit Bay, Turkey [50], showed severe local contamination, with Cd levels reaching 6.3 mg/kg and Cu at 89.4 mg/kg. In contrast, Egypt Bay, Maine, USA [51], presented lower concentrations (Cd: 0.44 mg/kg; Cu: 14.2 mg/kg; Pb: 26.9 mg/kg; Zn: 77.5 mg/kg), which are comparable to our findings. Within China, the Pearl River Estuary [52] exhibited markedly higher concentrations of Cu (61.9 mg/kg), Zn (157.8 mg/kg), and Pb (57.2 mg/kg), while our values for the Beibu Gulf region [53] (Cu: 9.94 mg/kg; Zn: 51.95 mg/kg; Pb: 25.36 mg/kg) are notably lower. Overall, the relatively low PTE levels observed in Tieshangang Bay compared to many industrialized coastal systems worldwide indicate that the bay remains in a good sedimentary environmental condition.
3.2.2. Spatial Distribution Characteristics of PTEs in Sediments
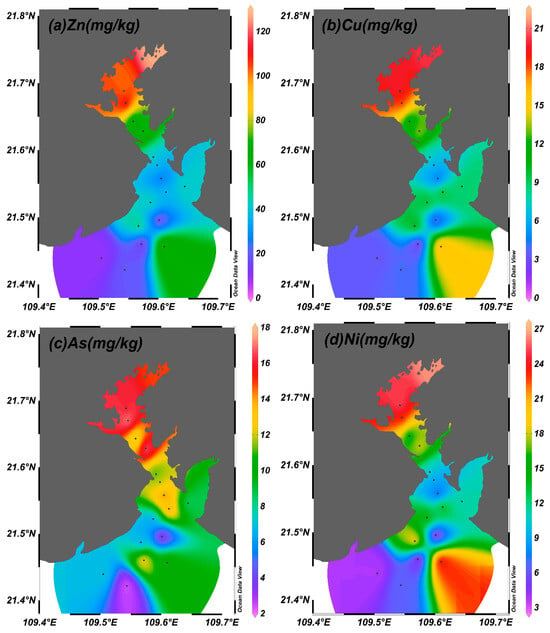
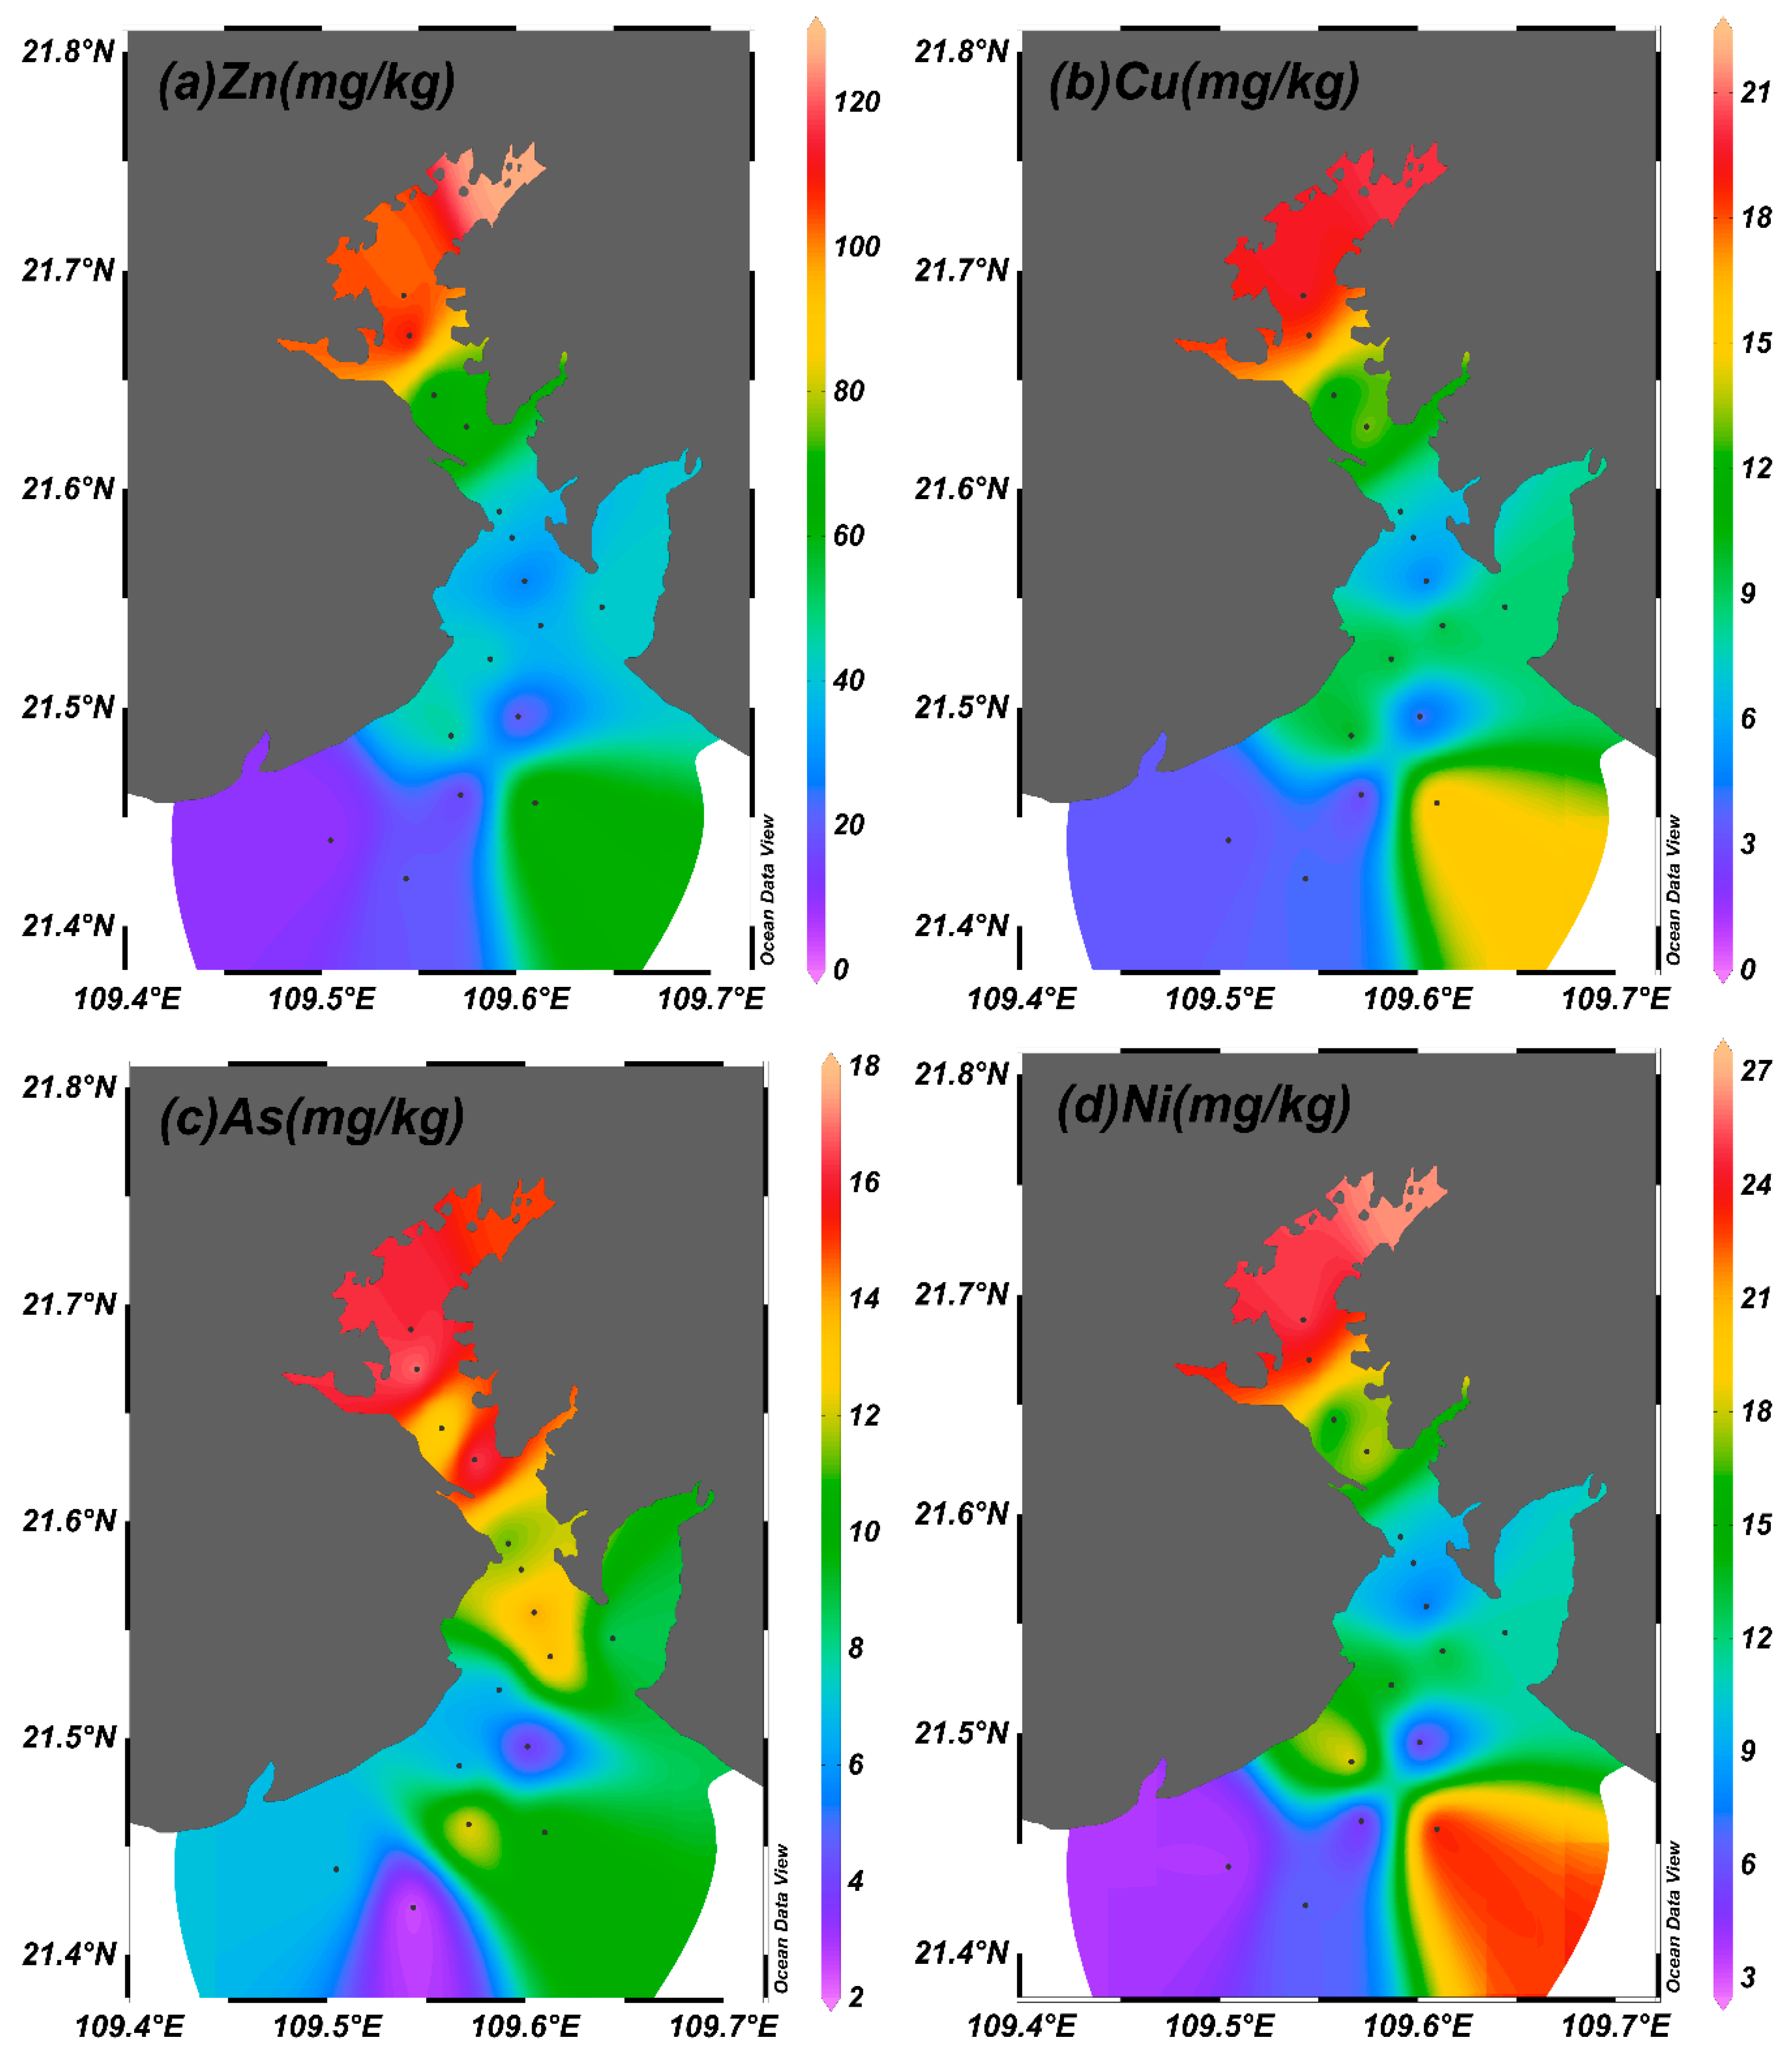
The spatial distribution of PTEs in surface sediments during the normal season is depicted in Figure 5 and Figure S2. One-way ANOVA revealed that, similar to the patterns observed in seawater, significant spatial differences were observed for most PTEs. A consistent spatial gradient was observed for Ni, As, Cu, Zn, Cr, Pb, and Cd, characterized by significantly higher concentrations in the inner bay than in the outer bay (p < 0.05). Zn also exhibited a significant difference between the inner and central bays (p < 0.05). In contrast, Hg showed no statistically significant spatial variation (p > 0.05). This pronounced enrichment pattern in the inner bay is primarily attributed to the synergistic effects of substantial terrestrial inputs and weak hydrodynamic conditions. Proximity to land makes the bay head a primary reception zone for pollutants carried by coastal runoff. PTEs adsorbed onto suspended particles readily settle and accumulate in the sediments of this area due to the shallow water depth and quiescent hydrodynamic environment. Furthermore, the stable sedimentary conditions in the inner bay enhance the adsorption and retention of PTEs. Consequently, elements such as Zn, Cu, and As formed distinct high-concentration zones in the bay head, consistent with the enrichment patterns observed in seawater and reinforcing the dominance of terrestrial sources.
Figure 5.
Spatial distribution of PTEs (Zn, Cu, As, Ni) in sediments during the normal season.
In addition to the pronounced enrichment in the inner bay, localized high concentrations of certain metals (e.g., Cu, Ni, and Pb) were also identified in the outer bay area (S12–S13). This phenomenon may result from the combined effects of marine dynamic processes and anthropogenic activities. Although distant from major terrestrial discharges, tidal intrusion and local hydrodynamic convergence in the outer bay can lead to the accumulation and settling of suspended particles carrying PTEs. Concurrently, human activities such as shipping and fisheries may introduce pollutants, which deposit at localized spots with weaker currents, resulting in discrete high values for Pb and Ni.
Moreover, within the central bay area, most PTEs (Zn, Cu, As, Ni, Cr, Hg, Pb) exhibited a distribution pattern of higher concentrations along the nearshore zones and lower concentrations in the central navigation channel. This pattern is potentially related to periodic dredging activities in the channel [12], which cause resuspension and redistribution of sediments, thereby altering the inherent spatial distribution of PTEs.
3.3. Assessment and Analysis of PTE Pollution
3.3.1. Single-Factor Pollution Index (Cf) and Comprehensive Pollution Index (WQI) in Seawater
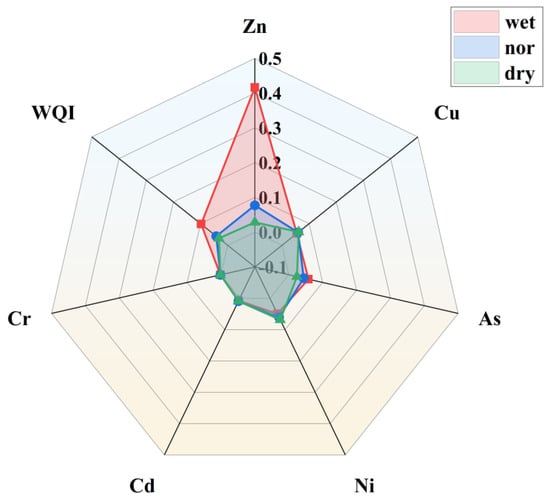
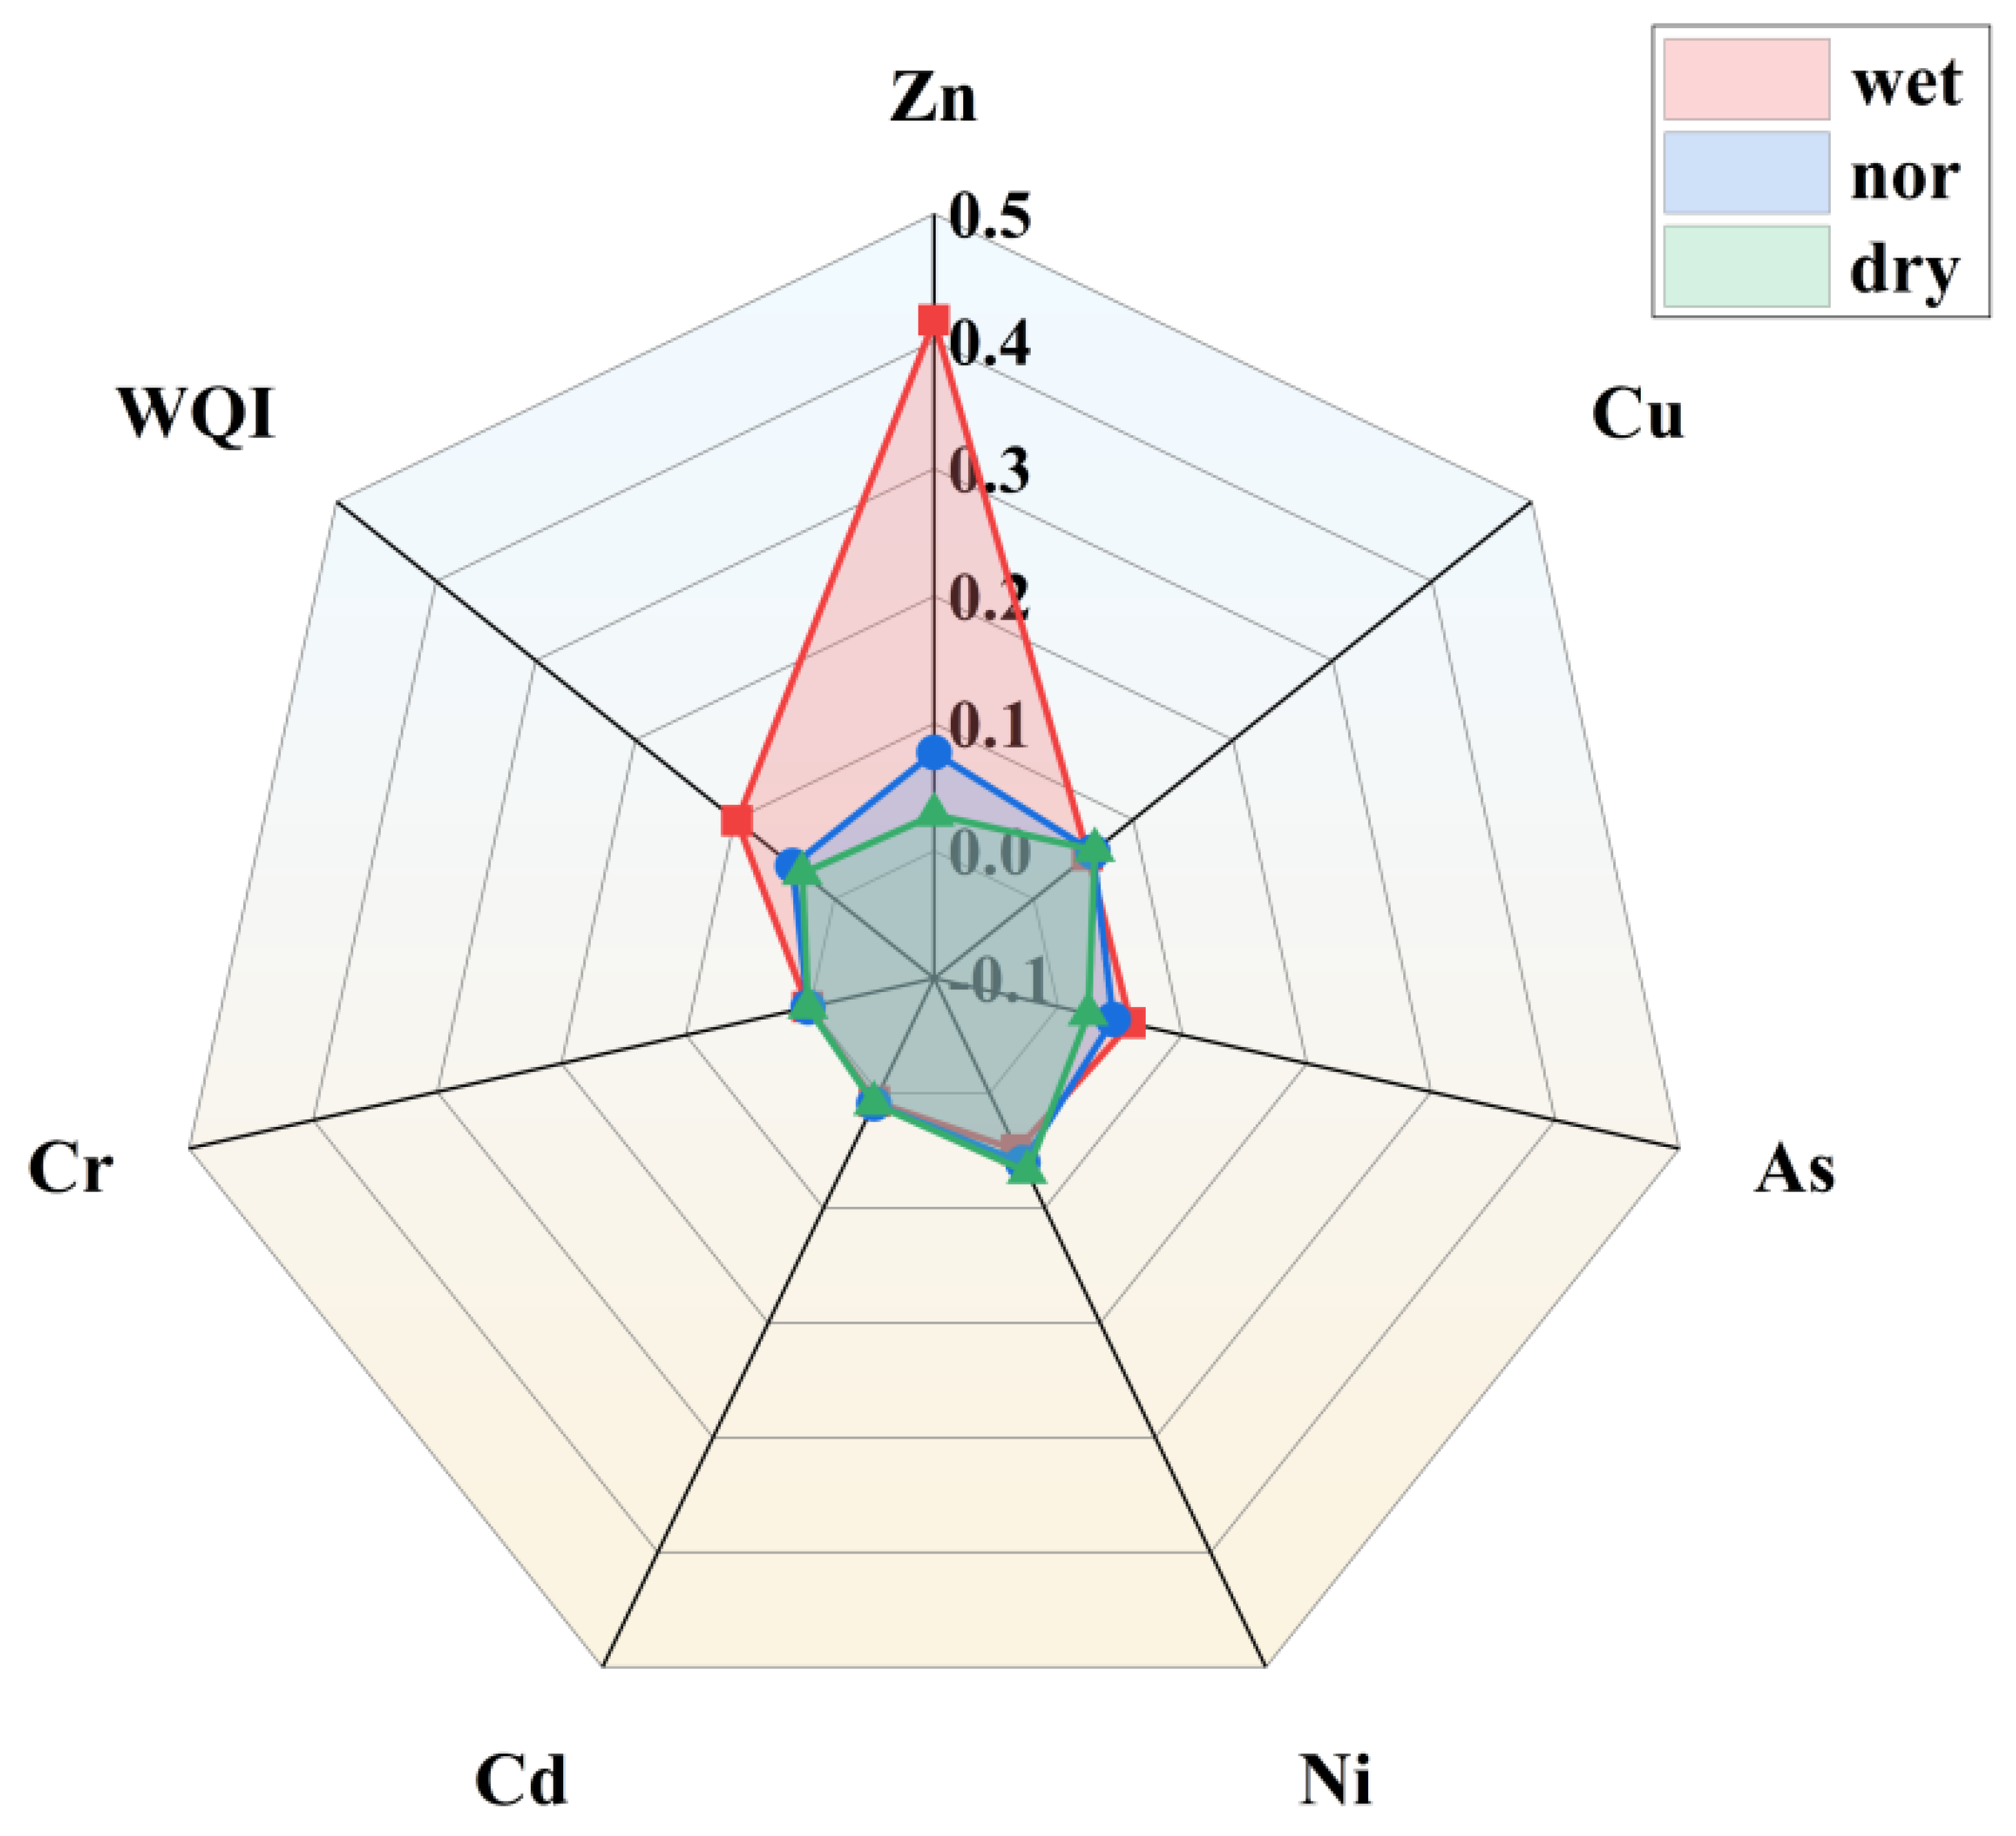
Based on the Class II standards of the Seawater Quality Standard (GB 3097-1997), the single-factor pollution index (Cf) and comprehensive pollution index (WQI) for PTEs in seawater were calculated (Figure 6 and Table S8). Significant differences in Cf values were observed among PTEs across different hydrological periods. Zn exhibited the most pronounced seasonal variation, with its average Cf during the wet period (0.416) being significantly higher than during the normal (0.077) and dry periods (0.028). In contrast, elements such as Cu, As, and Ni showed relatively minor fluctuations. The WQI reached its peak during the wet period (0.098), indicating that terrestrial runoff was the primary input source of PTEs during this season. During the dry period, all Cf values were below 0.1, and the WQI was the lowest (0.032), reflecting reduced terrestrial input and limited pollutant migration under weaker hydrodynamic conditions. The normal period exhibited intermediate pollution levels.
Figure 6.
Assessment results of single-factor pollution index (Cf) and comprehensive pollution index (WQI) for PTEs in seawater.
Overall, all Cf values were below the pollution threshold of 1.0, and the mean WQI values for the three periods (wet: 0.098; normal: 0.042; dry: 0.032) were all below 1. According to the evaluation criteria, this indicates that the PTEs in the seawater of Tieshangang Bay were generally at a clean level during the study period. However, the Cf values for Zn during the wet period was 5–15 times higher than in other periods, highlighting the need to monitor terrestrial Zn input during rainy seasons to prevent potential exceedances.
3.3.2. Evaluation of Geo-Accumulation Index (Igeo) for PTEs in Sediments
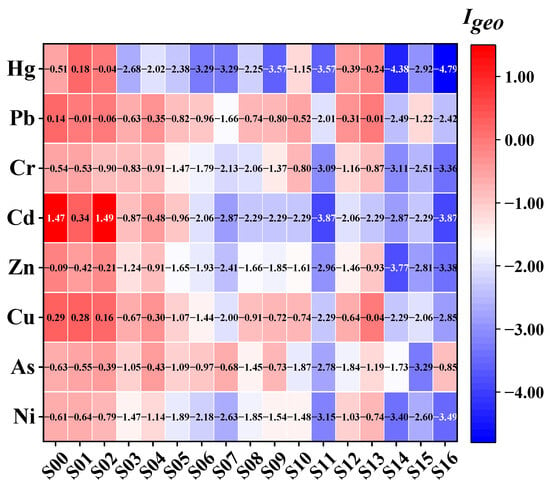
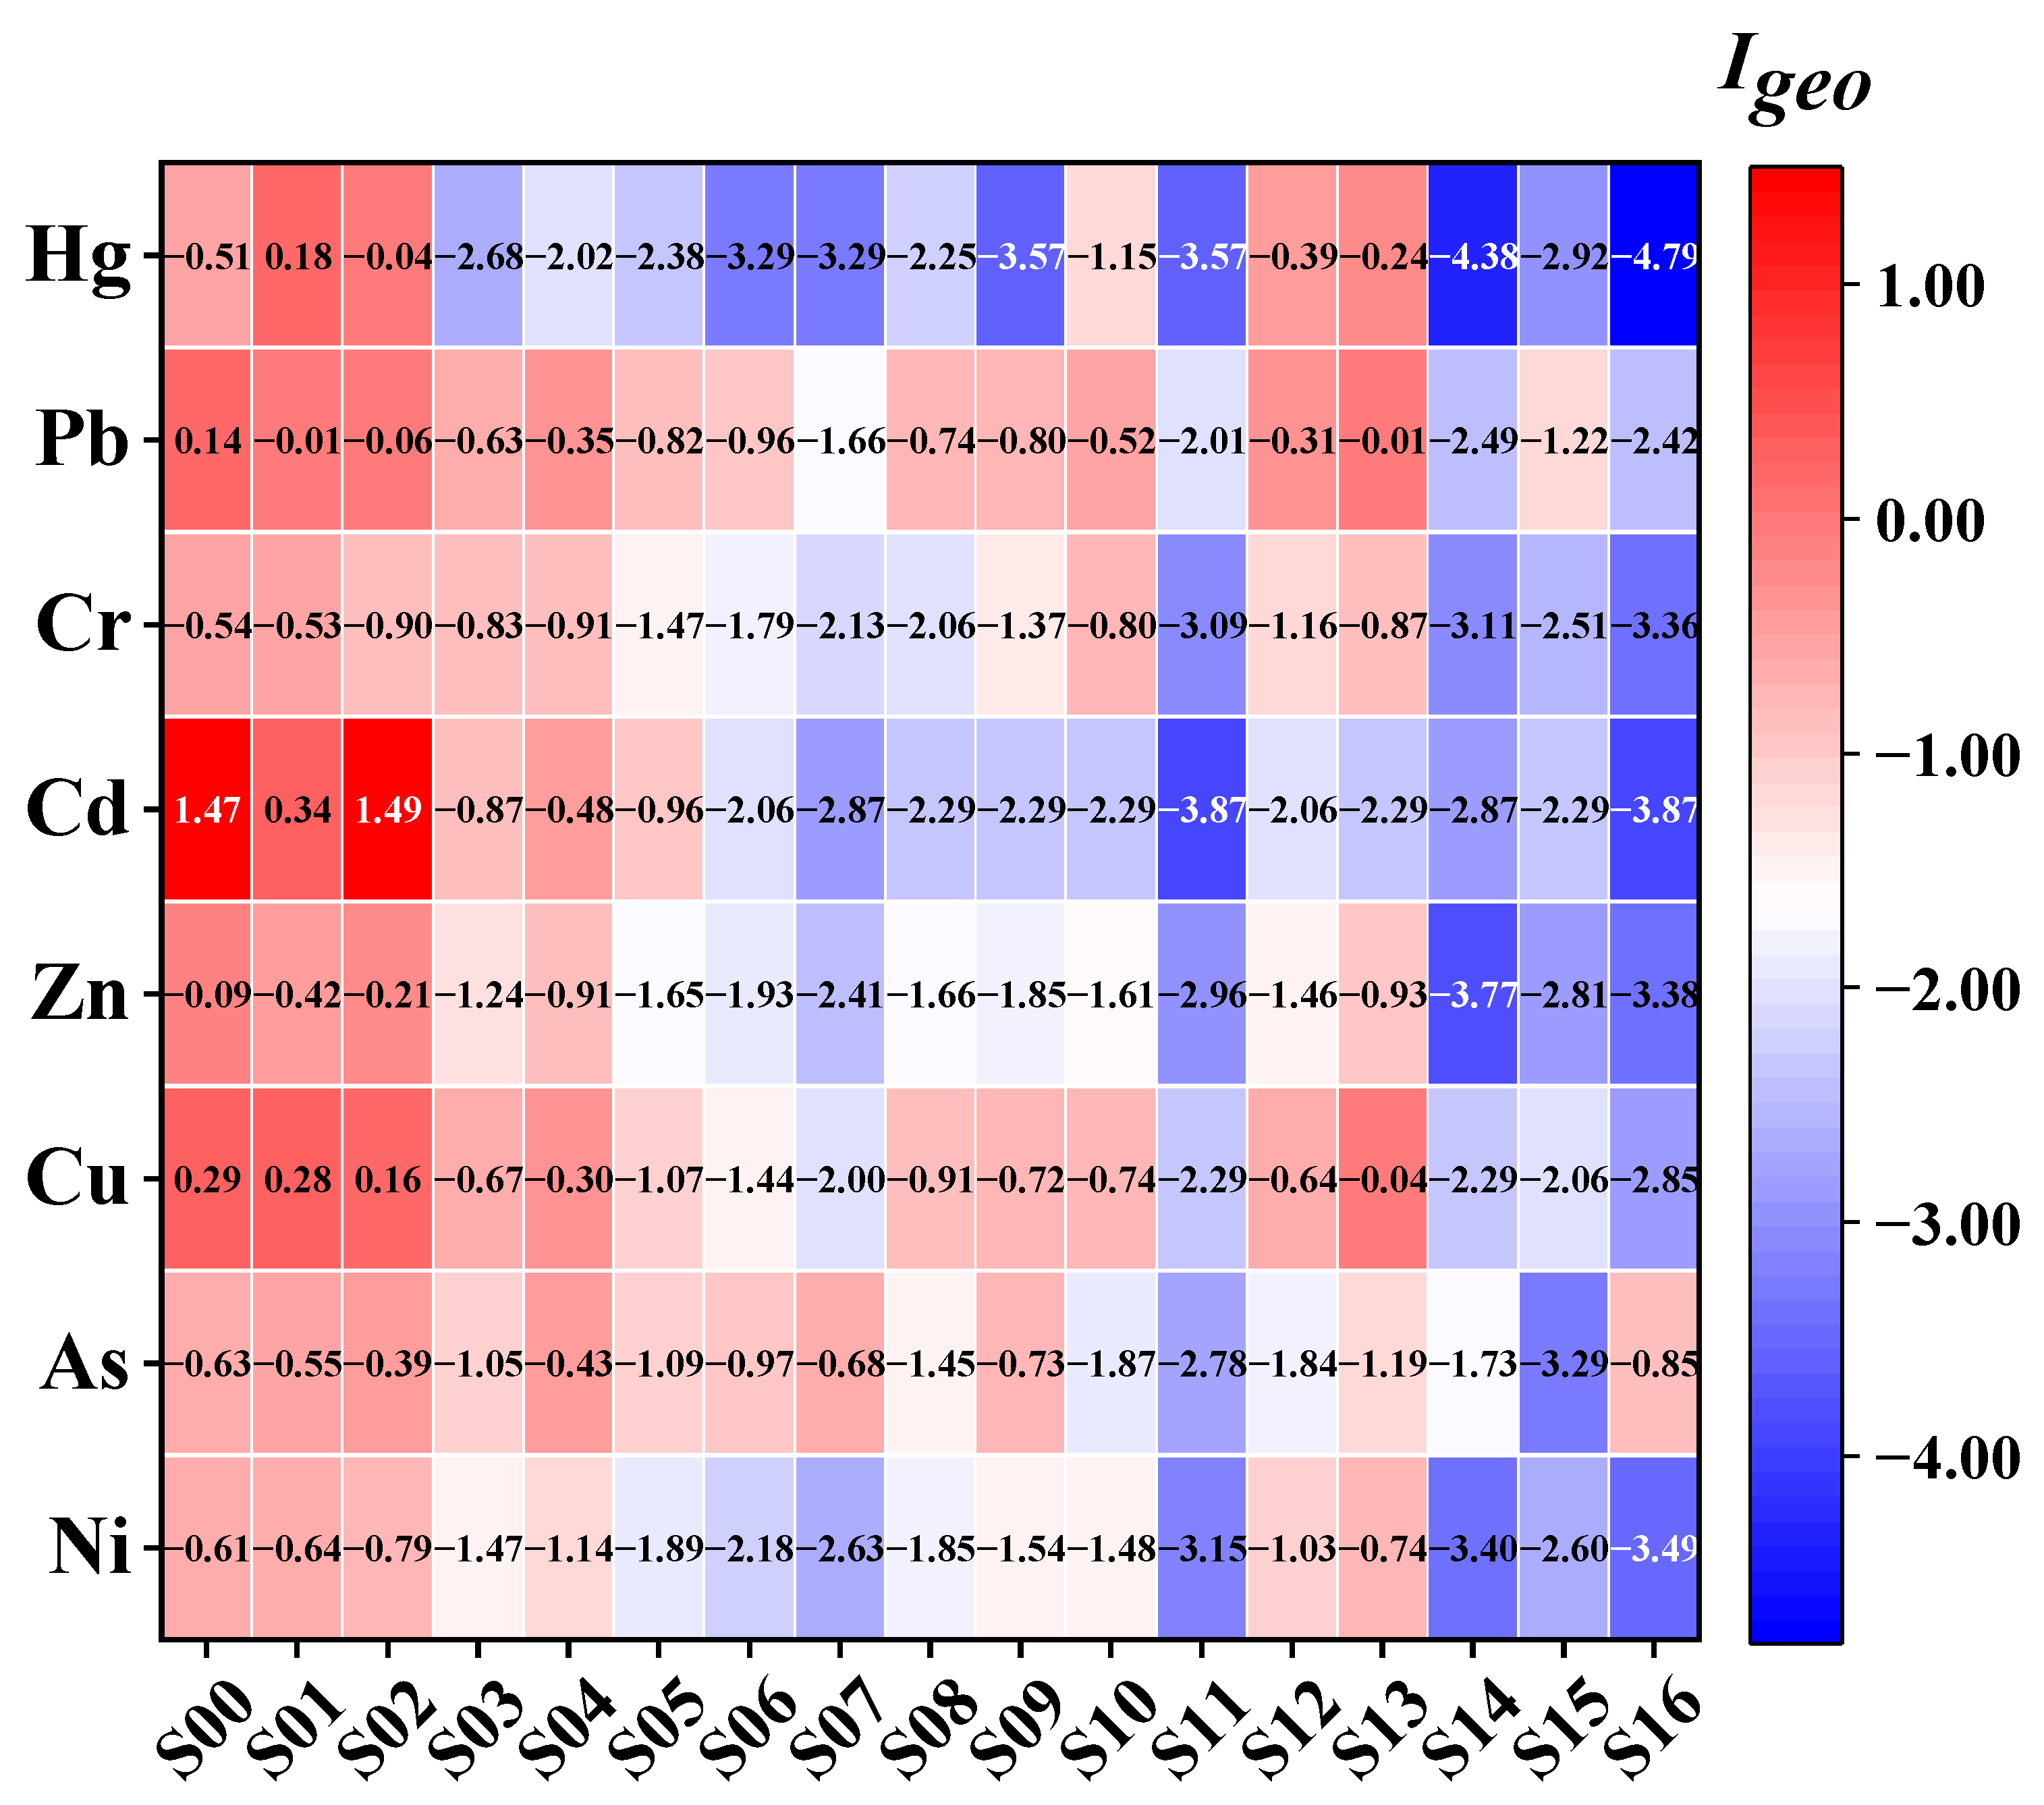
The pollution level of PTEs in sediments was evaluated using the geo-accumulation index (Igeo), with results shown in Table S9. Although the mean Igeo values for all elements were below 0 (indicating an overall unpolluted state), significant spatial heterogeneity was observed. Cd and Cu exhibited relatively higher pollution levels compared to other PTEs. Specifically, at the bay-head stations S00 and S02, Cd reached moderate pollution levels, with Igeo values of 1.47 and 1.49, respectively. Cu displayed mild pollution at stations S00, S01, and S02, with Igeo values ranging from 0.16 to 0.29. The remaining six PTEs (Ni, As, Zn, Cr, Pb, and Hg) showed Igeo values consistently below zero across all sampling stations, suggesting no significant contamination.
Spatially (Figure 7), the Igeo values exhibited a clear decreasing trend from the inner bay to the outer bay, with elevated values concentrated at stations S00 and S02. This spatial pattern closely reflects the hydrodynamic conditions of Tieshangang Bay. In the inner bay, weak hydrodynamics combined with proximity to terrestrial inputs facilitate the deposition and accumulation of PTEs. In contrast, the outer bay experiences stronger water dynamics, which promote pollutant dispersion and limit sediment enrichment.
Figure 7.
Spatial distribution of geo-accumulation index (Igeo) for PTEs in sediments.
In summary, Cd and Cu in the bay-head area have reached moderate and mild pollution levels, respectively, confirming terrestrial inputs as the primary source. Targeted pollution control and long-term monitoring in the bay-head area are recommended.
3.3.3. Potential Ecological Risk Assessment of PTEs in Sediments
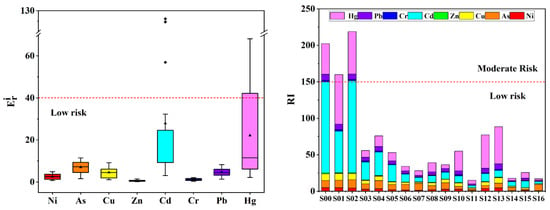
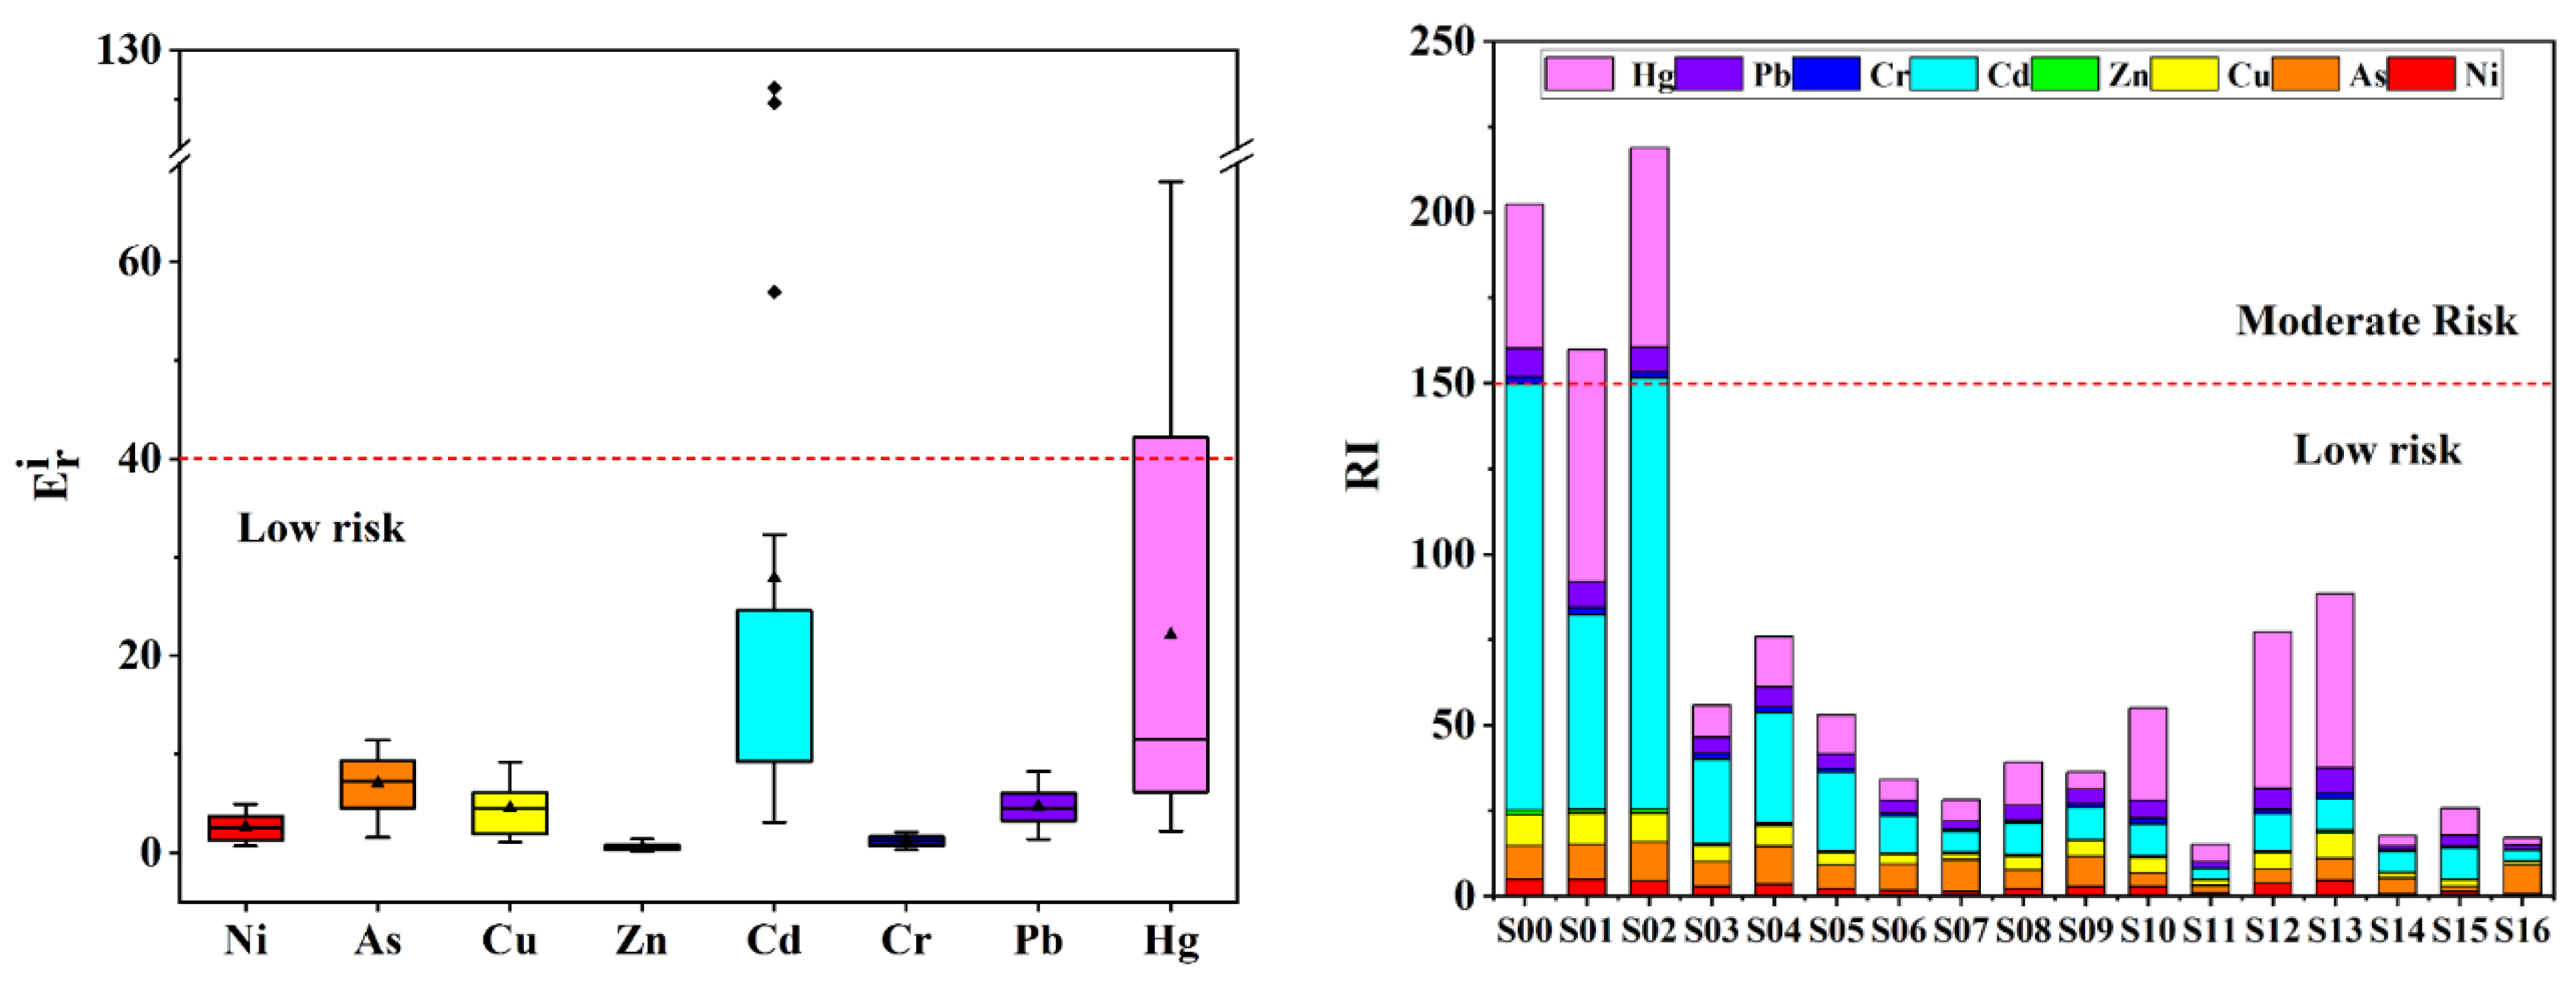
The potential ecological risk was assessed using the single ecological risk index (Eri) and the comprehensive risk index (RI), as shown in Figure 8 and Table S10. The average Eri values ranked in the order Cd > Hg > As > Pb > Cu > Ni > Cr > Zn. Although the mean values for all elements were below 40 (low risk level), Cd and Hg were the primary contributors to ecological risk, with Cd showing the highest average Eri (27.87). The spatial distribution of RI values decreased from the inner bay to the outer bay, with the highest RI observed at S02 (218.79), exceeding the moderate risk threshold (150). The inner bay points (S00–S02) showed significantly higher RI values than other areas, while the outer bay point S16 had the lowest RI (17). In the inner bay area (S00–S02), Cd and Hg together contributed over 80% of the RI, with Cd contributing 35.6–61.6% and Hg 20.8–42.6%. This dominance is attributed to their high toxicity and strong sediment affinity, combined with weak hydrodynamic conditions that facilitate the settling and enrichment of PTEs from coastal runoff.
Figure 8.
Eri values of individual PTEs (left) and comprehensive potential ecological risk index RI (right) in sediments. The red dashed line at Eri = 40 represents the threshold for low ecological risk (values below this line indicate low potential ecological risk). The triangle in each box denotes the mean Eri value for each PTE, while the squares represent outliers.
In summary, while the sediments of Tieshangang Bay currently exhibit an overall low ecological risk, localized risks exist in the inner bay area, primarily driven by Cd accumulation and potential Hg inputs. Targeted control of terrestrial Cd inputs and enhanced monitoring of Hg in the bay-head area are crucial to mitigate ecological risk escalation.
3.4. Analysis of PTE Pollution Sources
3.4.1. Principal Component Analysis (PCA)
Prior to PCA, data suitability was confirmed (KMO = 0.602 > 0.5; Bartlett’s test, p < 0.001). Principal components with eigenvalues greater than 1.0 were retained. For seawater, two principal components were extracted, cumulatively explaining 70.55% of the total variance (Table 2, Figure 9).
Table 2.
Principal component loading matrix of PTEs in Tieshangang Bay.
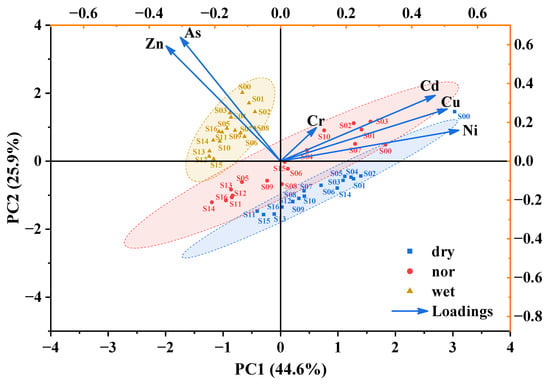
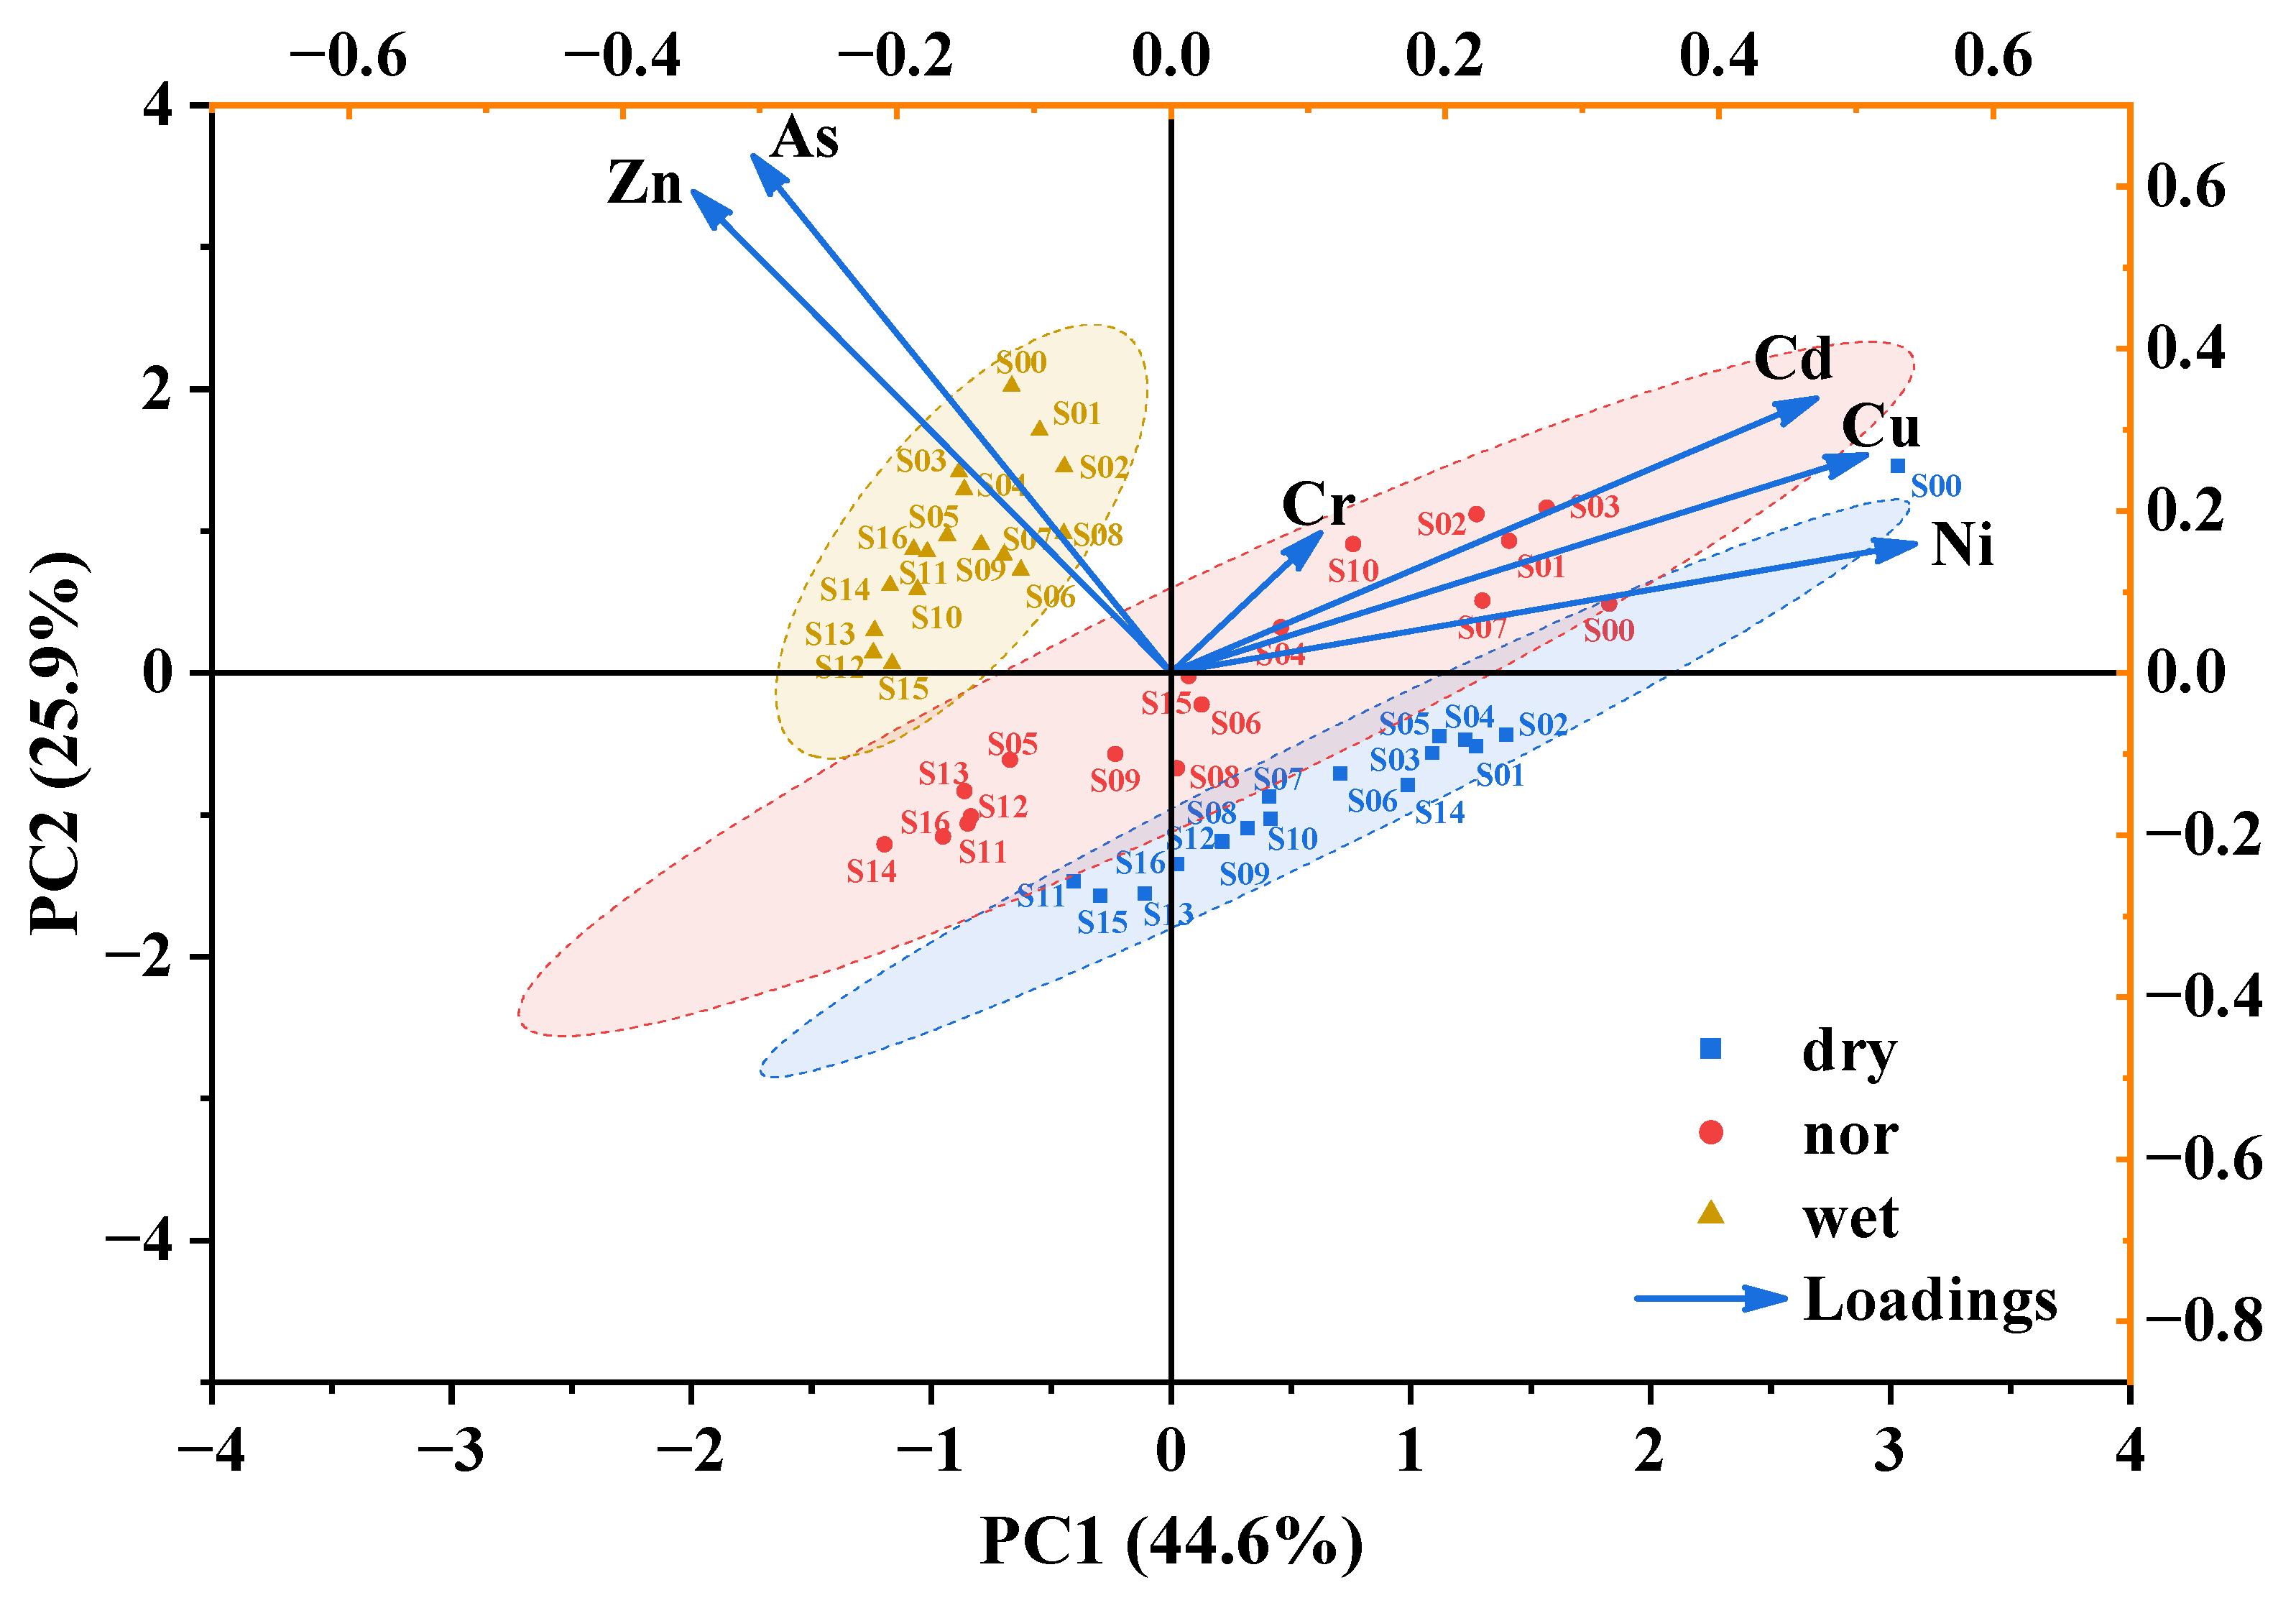
Figure 9.
Biplot of principal component analysis for PTEs in seawater.
- PC1 (44.60% variance) exhibited high positive loadings on Ni (0.888), Cu (0.830), and Cd (0.770). This component is interpreted as a combined industrial–aquaculture source. The association of Ni, Cu, and Cd is widely documented in coastal environments affected by anthropogenic activities. Ni and Cu are common tracers of industrial effluents, particularly from electroplating, metal finishing, and stainless steel processing [54]. Meanwhile, Cu and Cd have been consistently identified as markers of intensive aquaculture operations, where they originate from antifouling paints used on fish cages and from trace elements present in commercial fish feed [55,56]. The co-occurrence of these three elements on PC1 suggests that the inner bay area, which hosts both industrial facilities and marine aquaculture operations, receives mixed inputs from these two sources. This interpretation is consistent with the spatial distribution patterns observed in Figure 3, where elevated concentrations of Ni, Cu, and Cd were concentrated near the bay head.
- PC2 (25.95% variance) was dominated by As (0.795) and Zn (0.740), representing a mixed source of agricultural non-point pollution and domestic sewage. The linkage of As and Zn with agricultural activities is well established. As is a major component of pesticides, herbicides, and wood preservatives, while Zn is present in fertilizers and animal manure [57]. Additionally, Zn is a common indicator of urban runoff and domestic wastewater discharge, originating from corrosion of galvanized materials, tire wear, and household products [58,59]. The elevated concentrations of these two elements during the wet season (Table S6) further support this interpretation, as increased runoff and river discharge during this period enhance the transport of land-based pollutants into the bay.
- Cr did not exhibit loadings above 0.7 on either retained component (PC1: 0.178; PC2: 0.215). This indicates that Cr variability in seawater contributes less to the overall variance compared to the other PTEs, suggesting that Cr may be controlled by localized point sources independent of the major pollution pathways, such as specific industrial emissions (e.g., stainless steel processing) and natural weathering of the Cr-rich geological background [60].
Pb and Hg were not included in the PCA due to their low detection rates in seawater (Pb: 9.80%; Hg: 0%). However, their absence from the statistical model does not imply environmental absence. Both elements are particle-reactive and tend to be rapidly scavenged from the water column and deposited into sediments [61]. This interpretation is supported by their detectable concentrations in surface sediments (Pb: 25.36 mg/kg; Hg: 0.061 mg/kg). Thus, the low dissolved concentrations likely reflect efficient particle-mediated removal rather than negligible inputs.
Notably, clear seasonal clustering was observed in the PCA biplot (Figure 9). Samples from the wet season clustered separately from those of the dry and normal seasons along PC1, while dry and normal seasons showed partial overlap along PC2. This separation is consistent with the repeated-measures ANOVA results presented in Section 3.1.1, which identified statistically significant seasonal variations for Zn and As (p < 0.05), with substantially higher concentrations during the wet season. The pronounced clustering along PC1 thus reflects the dominant influence of wet-season terrestrial runoff, which transports elevated loads of Zn and As from land-based sources into the bay.
Similar seasonal separation patterns in PCA have been widely reported in coastal systems influenced by monsoonal hydrology. For instance, Sun et al. [62] observed clear clustering of wet- and dry-season samples along the first principal component in the Duliujian River estuary, attributing the separation to seasonal variations in nutrient and pollutant inputs from agricultural and domestic sources. Wu et al. [63] also reported distinct seasonal groupings in Daya Bay, where PCA separated summer samples from winter samples due to the combined effects of monsoon-driven hydrodynamics and anthropogenic discharges. The consistency between our findings and these studies suggests that seasonal hydrological forcing is a primary driver of PTE composition in monsoonal coastal bays. The distinct seasonal clusters observed here highlight the temporal variability of source contributions and underscore the importance of multi-season monitoring for capturing pollution dynamics that would be missed by single-season surveys.
For sediment data (Table 2), the suitability for PCA was also evaluated. The Kaiser–Meyer–Olkin (KMO) measure was 0.794 (>0.5), and Bartlett’s test of sphericity was significant (p < 0.001), indicating that the sediment dataset is appropriate for principal component analysis. Only one principal component (PC1) with an eigenvalue greater than 1.0 was extracted, explaining 80.51% of the variance. All eight PTEs showed high loadings on PC1. This suggests a strong homologous characteristic controlled by a common dominant source—namely, terrestrial inputs. The fact that PCA failed to separate sub-sources (e.g., agricultural Cd, industrial As) reflects the strong covariance among terrestrially derived PTEs, which masks the signals of independent sources. Given this limitation of PCA in resolving mixed sources, the PMF model was applied to achieve a more refined apportionment.
3.4.2. Positive Matrix Factorization (PMF) Model
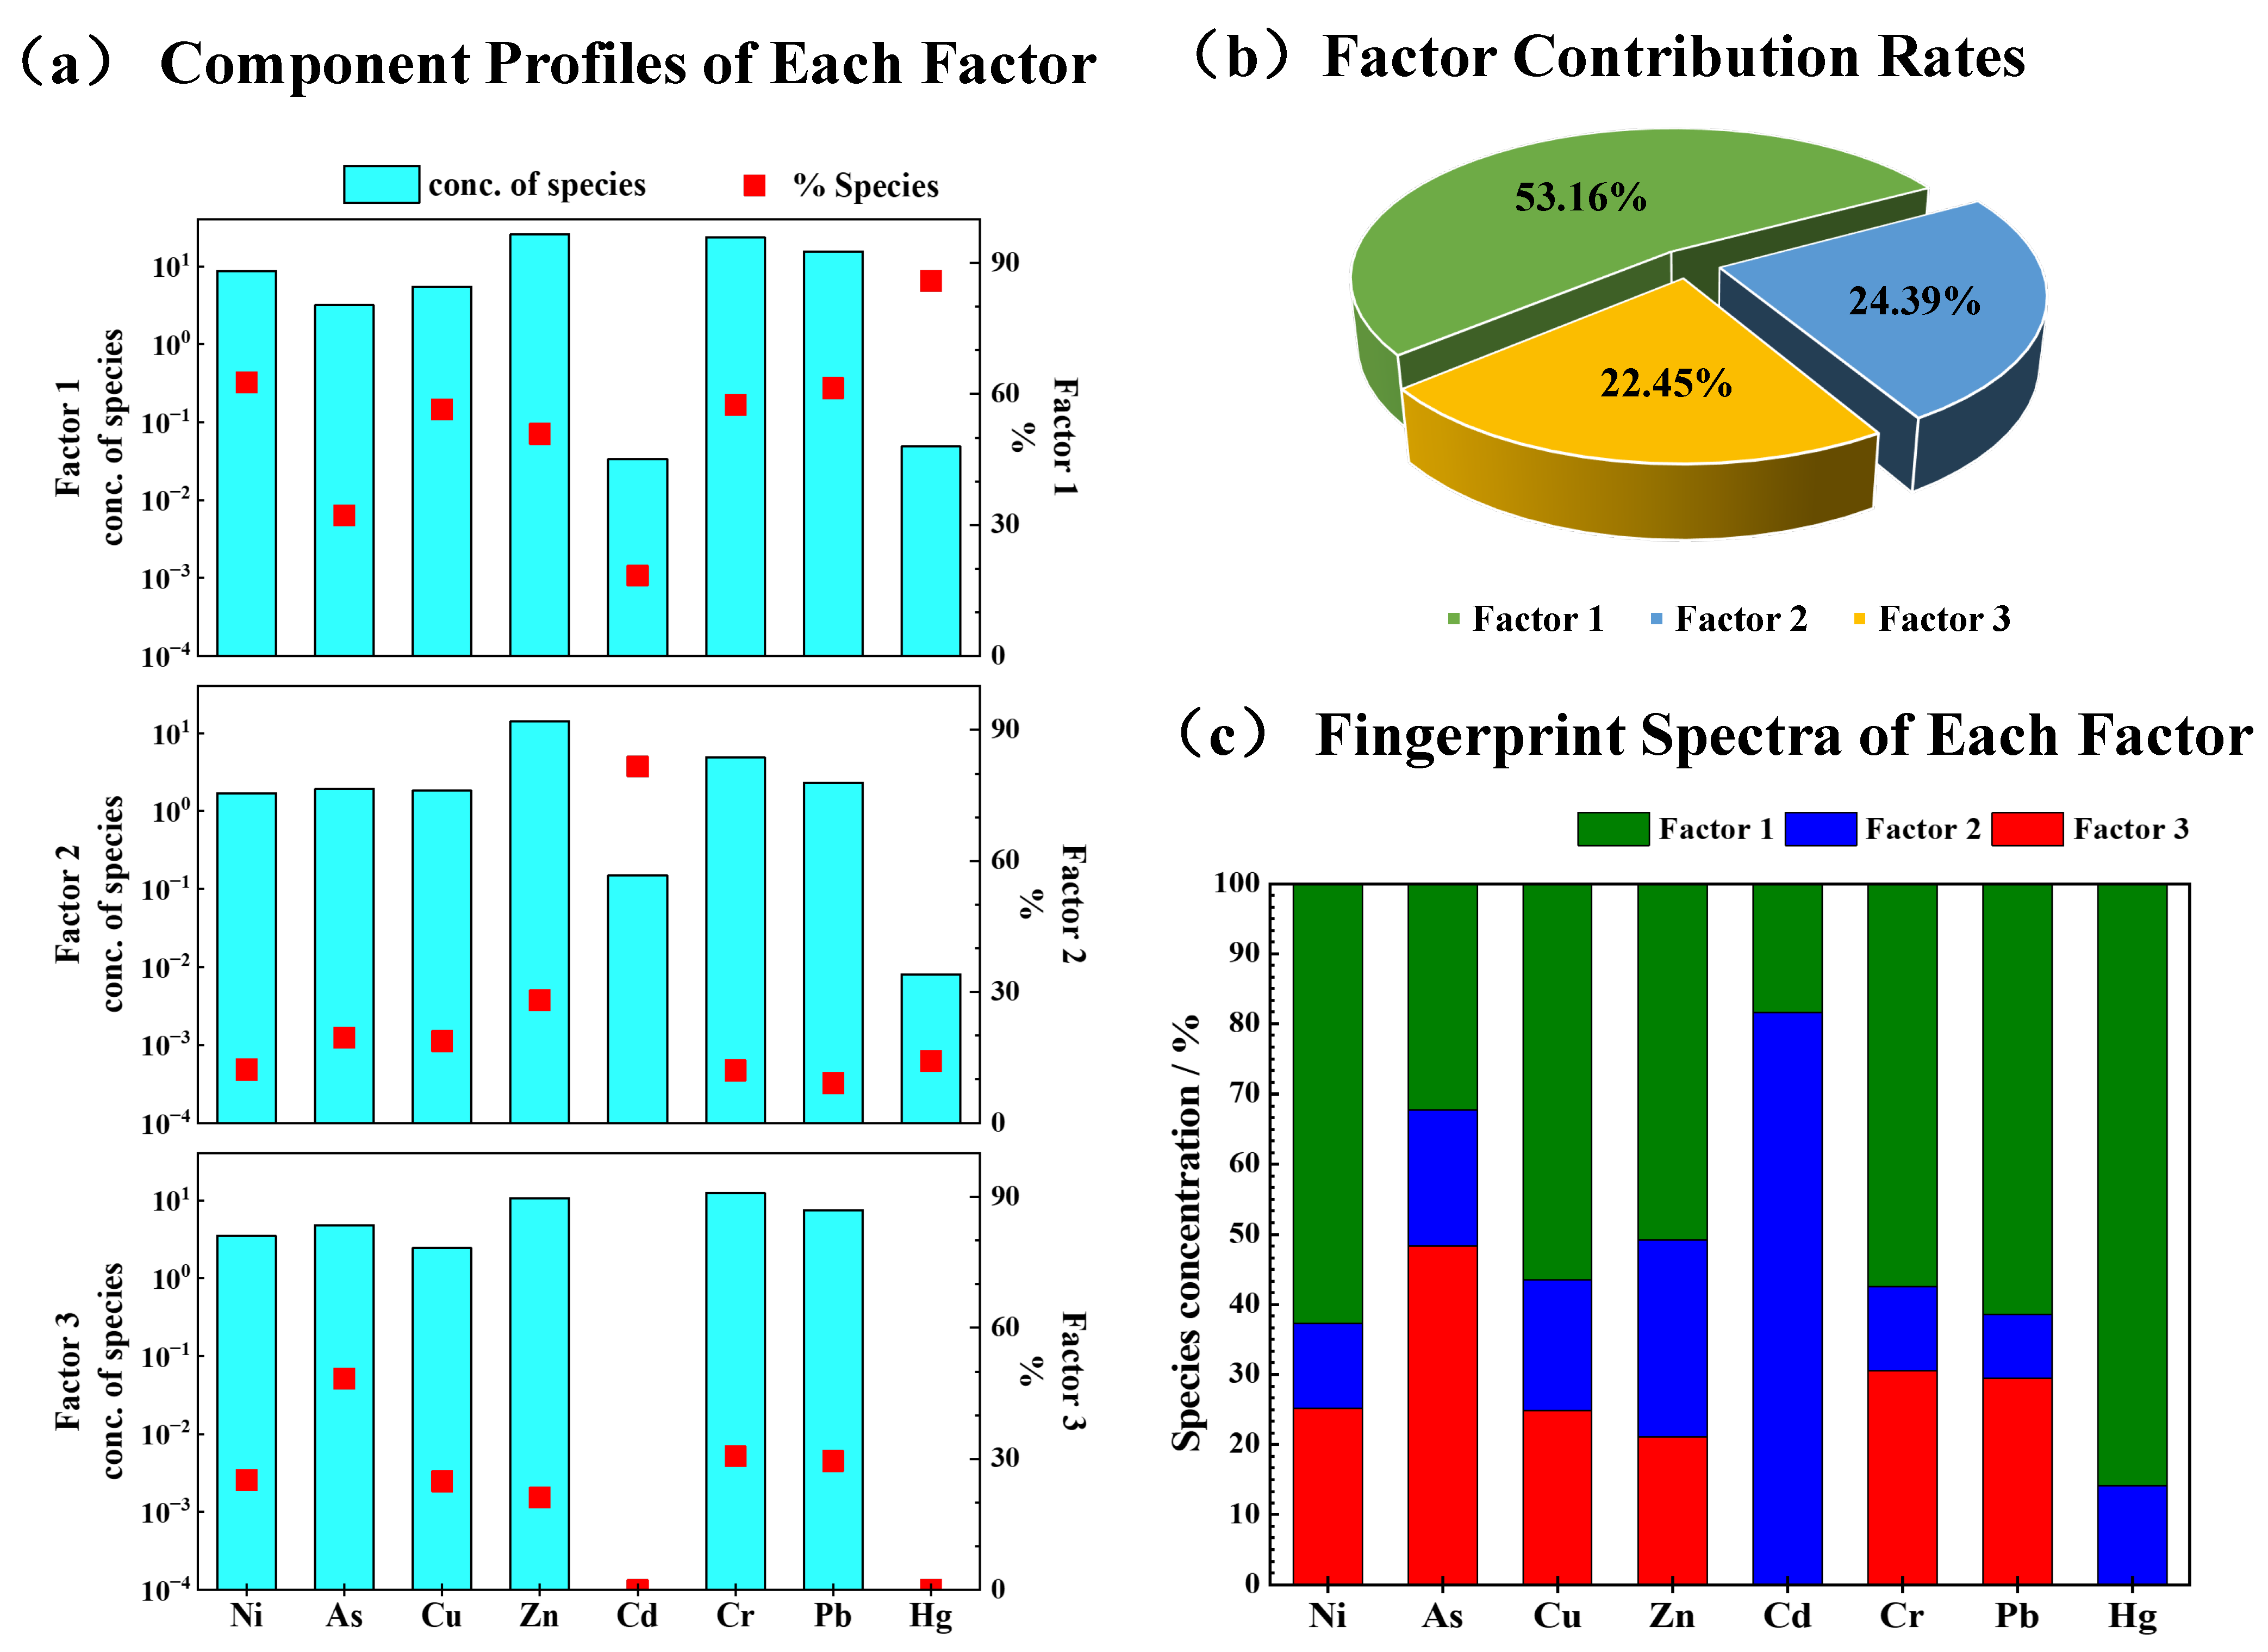
Prior to PMF analysis, signal-to-noise (S/N) ratios for all eight PTEs exceeded 1.0, allowing them to be categorized as “Strong”. The model was run with 20 iterations, and three factors were identified as the optimal solution based on stability and Q-value diagnostics. Residuals for the vast majority of samples fell within ±3, indicating satisfactory convergence. With the exception of As (R2 = 0.633), all elements showed R2 values above 0.85 (Ni: 0.987; Cu: 0.983; Zn: 0.987; Cd: 0.999; Cr: 0.888; Pb: 0.951; Hg: 0.965), demonstrating good overall model performance. The PMF model identified three optimal sources for sediment PTEs (Figure 10):
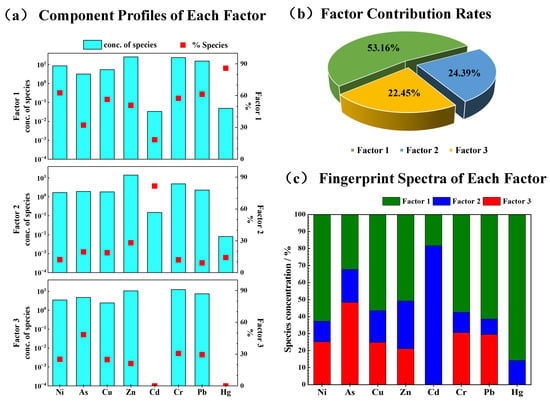
Figure 10.
Source apportionment of PTEs in sediments based on the PMF model.
- Factor 1 (Composite Terrestrial Inputs; 53.16% contribution): Characterized by high loadings of Ni, Cu, Zn, Cr, Pb, and Hg, representing the dominant pollution source in the study area. The combination of Ni, Cu, and Zn is widely recognized as a tracer of industrial effluents, including discharges from electroplating, metal finishing, and stainless steel processing [64]. Pb and Cr are frequently associated with urban sewage and industrial emissions [65], while Hg further supports an industrial origin. This composite source encompasses agricultural runoff, domestic sewage, and industrial discharges transported via riverine input and accumulated in sediments, with the most pronounced enrichment observed in the hydrodynamically quiescent inner bay area.
- Factor 2 (Agricultural Source; 24.39% contribution): Dominated by Cd (81.61%). Cd is widely considered a typical tracer of agricultural activities, primarily originating from phosphate fertilizer application and pesticide use. Long-term application of Cd-containing fertilizers can lead to Cd accumulation in agricultural soils, which subsequently enters the bay through surface runoff and soil erosion [66,67]. Comparable results have been reported in sediment studies from the Huixian Wetland and Dongping Lake, where Cd was closely linked to agricultural practices [68]. This finding is consistent with the extensive agricultural lands surrounding the study area, confirming the significant contribution of agricultural non-point source pollution to sediment PTEs.
- Factor 3 (Industrial–Atmospheric Source; 22.45% contribution): Mainly characterized by As. As is commonly recognized as a marker of coal combustion and atmospheric deposition, originating from the volatilization of As during coal burning and subsequent dry and wet deposition [69,70]. Industrial activities and port operations in the surrounding region are likely the main emission sources, transporting As into the bay through atmospheric pathways followed by accumulation in surface sediments.
The single dominant component (PC1) identified by sediment PCA macroscopically represents the industrial–terrestrial composite pollution system. PMF effectively delineates the structural differentiation within this system, highlighting the relative independence of the agricultural source (Cd) and the industrial–atmospheric source (As). This complementary use of PCA and PMF demonstrates that while PCA is useful for identifying overall source structures and seasonal patterns, PMF is necessary for quantitatively separating mixed sources when strong collinearity exists among variables. The source apportionment results provide targeted management implications. (1) For the industrial–aquaculture composite source dominating seawater pollution, it is necessary to strengthen the supervision of electroplating and metal processing enterprises in the bay head, and standardize feed and drug use in intensive aquaculture areas; (2) for agricultural Cd input in sediments, it is urgent to promote the reduction of pesticide and fertilizer use in the Tieshan River and Zhakou River basins; and (3) for Cr from stainless steel industry and As from coal combustion, regular monitoring of flue gas emission and atmospheric deposition flux should be carried out in the central bay industrial zone.
3.5. Limitations and Future Work
This study has several limitations. First, only one-time sediment sampling was conducted in this study, which cannot reflect seasonal variations in sediment PTEs or the dynamic exchange of metals between the water column and sediment. Subsequent research should carry out multi-hydrological period sediment monitoring and sediment core analysis to further evaluate the actual ecological impact of PTEs in Tieshangang Bay.
Second, grain size normalization using conservative elements (e.g., Al, Fe) was not performed, despite being a standard practice in coastal geochemistry [71]. Recent studies have demonstrated that grain size can exert dominant control over heavy metal distribution in coastal sediments [72]. While this represents a limitation of our study, several lines of evidence suggest that our main conclusions remain robust. Specifically, the consistent decreasing gradients of PTEs from the inner bay to the outer bay align well with the spatial distribution of anthropogenic activities, and the convergence of PCA and PMF results—independently identifying similar source categories—provides cross-validation that is unlikely to arise solely from grain size artifacts. Nevertheless, future studies will incorporate grain size and Al normalization as a routine procedure.
4. Conclusions
This study presents a systematic assessment of the pollution characteristics, ecological risks, and sources of PTEs in the seawater and sediments of Tieshangang Bay, South China Sea. The principal conclusions are as follows:
- (1)
- Pollution Characteristics: In seawater, the average concentrations of PTEs ranged from non-detectable to 8.70 μg/L. Zn and As showed relatively higher levels, yet all elements conformed to the Class II standards of the Seawater Quality Standard (GB 3097-1997). High-concentration zones were primarily identified in the inner bay (dominated by terrestrial input) and central bay (dominated by industrial discharge). In sediments, Zn and Cr were the most predominant metals, with average concentrations of 51.95 mg/kg and 42.67 mg/kg, respectively, displaying significant spatial variability with higher values in the inner bay than the outer bay.
- (2)
- Risk Assessment: The assessment of seawater, based on the single-factor pollution index (Cf < 1) and the comprehensive pollution index (WQI < 1), indicated an overall “clean” status. In sediments, Cd was identified as the primary pollutant, with the geo-accumulation index (Igeo) revealing moderate pollution levels at the bay-head points S00 and S02. The potential ecological risk assessment highlighted that Cd and Hg pose moderate ecological risks, together contributing over 80% to the comprehensive potential ecological risk index (RI) in the bay-head area. Localized RI values at the bay head exceeded 150 (moderate risk), showing an obvious decreasing gradient from the bay head to the bay mouth.
- (3)
- Source Apportionment: Source analysis revealed distinct sources for PTEs in the two media.
- Seawater: Two main sources were identified: an industrial–aquaculture composite source (44.60% contribution, dominated by Ni, Cu, and Cd), and a mixed agricultural non-point and domestic sewage source (25.95% contribution, dominated by Zn, and As).
- Sediments: The PMF model identified three primary sources: composite terrestrial inputs contributing the majority of multiple elements (Ni, Cu, Zn, Cr, Pb, Hg; 53.16% contribution), agricultural activities as the primary source of Cd (24.39% contribution), and a combination of coal-fired industrial activities and atmospheric deposition as the main source of As (22.45% contribution).
Supplementary Materials
The following supporting information can be downloaded at: https://www.mdpi.com/article/10.3390/environments13060357/s1, Figure S1: Spatial distribution of PTEs (Ni, Cd, Cr) in seawater across different hydrological periods; Figure S2: Spatial distribution of PTEs (Cd, Cr, Pb, Hg) in sediments during the normal season.; Table S1. ICP-MS operating conditions and acquisition parameters; Table S2. Detection limits of analytical methods for various PTEs; Table S3. Evaluation criteria for comprehensive pollution index (WQI) of water quality; Table S4. Classification categories of Geo-accumulation Index (Igeo).; Table S5. Classification criteria for single-factor and comprehensive potential ecological risk assessment of sediment PTEs; Table S6. Concentrations of PTEs in seawater of Tieshangang Bay (2022–2023); Table S7. Statistical characteristics of PTEs concentrations (mg/kg) in sediments from Tieshangang Bay during the normal season; Table S8. Single-Factor Pollution Index (Cf) and Comprehensive Pollution Index (WQI) in Seawater; Table S9. Igeo index values for PTEs in Sediments; Table S10. Potential ecological risk assessment results of PTEs in sediments (Eri values and RI values).
Author Contributions
M.Z.: Writing—review and editing, Writing—original draft, Visualization, Validation, Software, Methodology, Investigation, Formal analysis, Data curation, Conceptualization. S.Y.: Writing—review and editing, Validation, Methodology, Investigation, Formal analysis, Data curation, Conceptualization, Resources, Supervision. W.L.: Writing—review and editing, Methodology, Investigation, Formal analysis, Conceptualization, Resources, Supervision. C.R.: Writing—review and editing, Visualization, Validation, Resources, Methodology, Investigation, Formal analysis, Data curation, Conceptualization, Supervision, Funding acquisition. H.Z.: Writing—review and editing, Visualization, Validation, Methodology, Formal analysis, Conceptualization, Supervision. All authors have read and agreed to the published version of the manuscript.
Funding
This research was funded by the Guangxi Key Research and Development Program, grant number GuiKeFN2600640147.
Data Availability Statement
Data will be made available on request.
Acknowledgments
The authors would like to thank the equal contribution of the Marine Environmental Monitoring Center of Guangxi and the College of Chemistry and Environmental Science, Guangdong Ocean University, as joint primary affiliations for this study. Special thanks go to the reviewers for their careful review and constructive suggestions. They also thank all members of the research team and others involved in this study.
Conflicts of Interest
The authors declare no conflicts of interest.
References
- Ali, H.; Khan, E.; Ilahi, I. Environmental Chemistry and Ecotoxicology of Hazardous Heavy Metals: Environmental Persistence, Toxicity, and Bioaccumulation. J. Chem. 2019, 2019, 6730305. [Google Scholar] [CrossRef] [Scilit]
- Tchounwou, P.B.; Yedjou, C.G.; Patlolla, A.K.; Sutton, D.J. Heavy Metal Toxicity and the Environment. In Molecular, Clinical and Environmental Toxicology: Volume 3: Environmental Toxicology; Luch, A., Ed.; Springer: Basel, Switzerland, 2012; pp. 133–164. ISBN 978-3-7643-8340-4. [Google Scholar]
- Mehreen, A.; Liu, X. Heavy Metal Infiltration in Coastal Sediments: Bioaccumulation Pathways and Toxicological Repercussions on Perinereis Aibuhitensis. Mar. Pollut. Bull. 2026, 225, 119263. [Google Scholar] [CrossRef] [Scilit] [PubMed]
- Jannat, J.N.; Mia, M.Y.; Jion, M.M.M.F.; Islam, M.S.; Ali, M.M.; Siddique, M.A.B.; Rakib, M.R.J.; Ibrahim, S.M.; Pal, S.C.; Costache, R.; et al. Pollution Trends and Ecological Risks of Heavy Metal(Loid)s in Coastal Zones of Bangladesh: A Chemometric Review. Mar. Pollut. Bull. 2023, 191, 114960. [Google Scholar] [CrossRef] [Scilit] [PubMed]
- Mushtaq, R.; Gambardella, C.; Miroglio, R.; Novelli, F.; Paturzo, M.; Rubano, A.; Sardo, A.; Balzano, S.; Paparo, D. Using Diatom Chain Length as a Bioindicator of Heavy-Metals Contamination in Marine Environments. J. Hazard. Mater. 2025, 484, 136732. [Google Scholar] [CrossRef] [Scilit] [PubMed]
- Zhao, G.; Lu, Q.; Ye, S.; Yuan, H.; Ding, X.; Wang, J. Assessment of Heavy Metal Contamination in Surface Sediments of the West Guangdong Coastal Region, China. Mar. Pollut. Bull. 2016, 108, 268–274. [Google Scholar] [CrossRef] [Scilit] [PubMed]
- Cai, P.; Cai, G.; Yang, J.; Li, X.; Lin, J.; Li, S.; Zhao, L. Distribution, Risk Assessment, and Quantitative Source Apportionment of Heavy Metals in Surface Sediments from the Shelf of the Northern South China Sea. Mar. Pollut. Bull. 2023, 187, 114589. [Google Scholar] [CrossRef] [Scilit] [PubMed]
- Yue, N.; Dong, C.; Yang, J.; Wang, J.; Feng, J.; Sun, J. Distribution and Pollution Assessment of Heavy Metal(Loid)s in Seawater and Organisms in Rongcheng Coastal Area, China. Front. Mar. Sci. 2025, 12, 1583535. [Google Scholar] [CrossRef] [Scilit]
- Cengiz, E.; Şirin, M.; Yeşilkanat, C.M.; Apaydın, G. Spatiotemporal Distribution, Source Identification and Risk Assessment of Potentially Toxic Elements in Sediments along the Alanya/Antalya Coastline, Mediterranean Sea. Environ. Earth Sci. 2025, 84, 245. [Google Scholar] [CrossRef] [Scilit]
- Qu, L.; Peng, J.; Cong, P.; Huang, Y. Spatiotemporal Evolution and Integrated Risk Assessment of Potentially Toxic Element Pollution in Coastal Waters: A Case Study of Bohai Bay Cases in China. Toxics 2025, 13, 880. [Google Scholar] [CrossRef] [Scilit] [PubMed]
- Su, Q.; Wang, C.; Huang, L.; Feng, Y.; Wei, M.; Xu, H.; Cheng, Y.; Li, N.; Xu, P. Nutrients and Heavy Metals in Surface Sediments of Major Bays in Guangxi: Distribution Characteristics and Risk Assessment. China Environ. Sci. 2023, 43, 221–232. [Google Scholar] [CrossRef]
- Qu, L.; Tan, H.; Liu, T.; Zhang, W. Distribution characteristics and potential ecological risk of heavy metals in the seawater and sediment of Tieshan Port, Beibu Gulf. Environ. Chem. 2023, 42, 757–768. [Google Scholar] [CrossRef]
- Matuszewska, D.; Kiedrzyńska, E.; Jóźwik, A.; Kiedrzyński, M. An Analysis of Catchment Factors Associated with Heavy Metal Export into the Baltic Sea and Nature-Based Solutions Aimed at Its Limitation. J. Hazard. Mater. 2025, 494, 138727. [Google Scholar] [CrossRef] [Scilit] [PubMed]
- Zare, F.; Vaezi, A.; Tavakoli, V.; Lak, R. Assessing Pollution and Ecological Risks of Potentially Toxic Elements in Surface Sediments of the North-Central Persian Gulf. Reg. Stud. Mar. Sci. 2025, 85, 104159. [Google Scholar] [CrossRef] [Scilit]
- Jacquet, S.; Mille, D.; Cartaux, M.; Herlory, O. Interaction of the Gardanne Bayer Effluent with Seawater (Mediterranean Sea): Influence on the Trace Metals Behaviour. Chemosphere 2025, 375, 144220. [Google Scholar] [CrossRef] [Scilit] [PubMed]
- Micella, I.; Bak, M.; Tang, T.; Strokal, M. Inequalities in Future Hotspots of Coastal Water Pollution and Their Socioeconomic Drivers in Africa and Asia: A Multi-Pollutant Modelling Approach. In Proceedings of the European Geosciences Union General Assembly 2025 (EGU25), Vienna, Austria, 27 April–2 May 2025. [Google Scholar]
- Bi, Z.; Guan, Y.; Yang, L.; Ou, R.; Gu, Y.; Wei, H.; Liu, X.; Liu, Z.; Tian, L.; Xiao, K.; et al. Tracing Sources and Ecological Risks: Seasonal-Spatial Variations of Potentially Toxic Element (PTE) Pollution in Marine Sediments of Beibu Gulf. Mar. Pollut. Bull. 2026, 225, 119235. [Google Scholar] [CrossRef] [Scilit] [PubMed]
- GB 17378.3-2007; The Specification for Marine Monitoring—Part 3: Sample Collection, Storage and Transportation. China Standard Press: Beijing, China, 2007.
- GB 17378.4-2007; The Specification for Marine Monitoring—Part 4: Seawater Analysis. China Standard Press: Beijing, China, 2007.
- GB 17378.5–2007; The Specification for Marine Monitoring—Part 5: Sediment Analysis. China Environmental Science Press: Beijing, China, 2007.
- Charvalas, G.; Molla, A.; Lolas, A.; Skoufogianni, E.; Papadopoulos, S.; Chatzikirou, E.; Emmanouil, C.; Christopoulou, O. Evaluation of Potential Toxic Elements in Soils from Three Urban Areas Surrounding a Steel Industrial Zone. Toxics 2025, 13, 351. [Google Scholar] [CrossRef] [Scilit] [PubMed]
- Sun, M.; Zhang, X.; Xia, B.; Qu, K.; Cui, Z.; Ding, D.; Li, Y. Distribution of Heavy Metals in Surface Seawater and Ecological Risk Assessment at Coastal Central Fishing Ports in the Yellow and Bohai Seas during Fishing Ban and Fishing Seasons. Mar. Environ. Sci. 2022, 41, 857–864. [Google Scholar] [CrossRef]
- Wen, Q.; Wang, Y.; Wu, S.; Guo, Y. Analysis of Heavy Metal Concentrations in Seawater and Sediments in Wuchang Waters, Wanning, Hainan. J. Ocean Technol. 2023, 42, 79–85. [Google Scholar] [CrossRef]
- GB 3097–1997; Sea Water Quality Standard. State Environmental Protection Administration China Environmental Science Press: Beijing, China, 1997.
- Chen, L.; Huang, Z.; Wang, Z.; Xing, Z.; Li, P.; Fu, D.; Wei, X. Assessment of Heavy Metal Pollution in Seawater of the Mangrove Area in Wanning Lagoon. Mar. Geol. Front. 2025, 41, 93–102. [Google Scholar] [CrossRef]
- He, S.; Wei, G.; Wang, D.; Chen, H.; Chen, Q. Environmental quality assessment of heavy metals in surface seawater and sediments of Qilianyu waters. J. Appl. Oceanogr. 2020, 39, 246–252. [Google Scholar] [CrossRef]
- Förstner, U.; Müller, G. Concentrations of Heavy Metals and Polycyclic Aromatic Hydrocarbons in River Sediments: Geochemical Background, Man’s Influence and Environmental Impact. GeoJournal 1981, 5, 417–432. [Google Scholar] [CrossRef] [Scilit]
- Qing, S.; Chen, H.; Sun, Y.; Liu, G.; Lao, Q. Current Status of Heavy Metal Pollution in Surface Sediments of Waters Adjacent to Tieshan Port, Guangxi. Guangxi Sci. 2021, 28, 568–576. [Google Scholar] [CrossRef]
- Liu, G.; Zhang, C.; Wei, C.; Lin, M. The current pollution status and potential ecological risk assessment of heavy metals in surface sediments of Lianzhou Bay of Guangxi. Mar. Sci. Bull. 2012, 31, 707–712. [Google Scholar]
- Wei, F.; Chen, J.; Wu, Y.; Zheng, C. Research on background values of China’s soil environment. Environ. Sci. 1991, 12–19, 94. [Google Scholar] [CrossRef]
- Jiang, H.; Zheng, X.; Li, W. Source and risk assessment of heavy metal in sediment of China. China Popul. Resour. Environ. 2018, 28, 108–112. [Google Scholar]
- Liu, H.; Ding, C.; Zhang, G.; Guo, Y.; Song, Y.; Thangaraj, S.; Zhang, X.; Sun, J. Dissolved and Particulate Heavy Metal Pollution Status in Seawater and Sedimentary Heavy Metals of the Bohai Bay. Mar. Environ. Res. 2023, 191, 106158. [Google Scholar] [CrossRef] [Scilit] [PubMed]
- Zhang, M.; Chen, G.; Luo, Z.; Sun, X.; Xu, J. Spatial Distribution, Source Identification, and Risk Assessment of Heavy Metals in Seawater and Sediments from Meishan Bay, Zhejiang Coast, China. Mar. Pollut. Bull. 2020, 156, 111217. [Google Scholar] [CrossRef] [Scilit] [PubMed]
- Hou, W.; Wang, Q.; Xiang, Z.; Jia, N.; Hu, J.; Wu, Z.; Dong, W. Comprehensive Assessment of Occurrence, Temporal-Spatial Variations, and Ecological Risks of Heavy Metals in Jiaozhou Bay, China: A Comprehensive Study. Mar. Pollut. Bull. 2024, 198, 115883. [Google Scholar] [CrossRef] [Scilit] [PubMed]
- Jin, X.; Liu, J.; Wang, L.; Yu, X.; Wang, J.; Jin, Y.; Qiu, S.; Liu, J.; Zhao, Y.; Sun, S. Distribution Characteristics and Ecological Risk Assessment of Heavy Metal Pollution in Seawater near the Yellow River Estuary of Laizhou Bay. Mar. Environ. Res. 2025, 203, 106776. [Google Scholar] [CrossRef] [Scilit] [PubMed]
- Liu, T.; Zhang, Y.; Liu, Y.; Chen, B. Multi-Indicator Assessment of Heavy Metal Pollution in Qinzhou Harbour Sediments: Unraveling Ecological and Human Health Risks. Mar. Pollut. Bull. 2025, 211, 117442. [Google Scholar] [CrossRef] [Scilit] [PubMed]
- He, Y.; Hong, X.; Bi, X.; Chen, C.; Lu, Q.; Pan, R.; Tian, Y.; Chen, B. Characteristics and sources of heavy metal pollution in water environment of Jiuzhou River basin. Environ. Chem. 2021, 40, 240–253. [Google Scholar] [CrossRef]
- Kuang, H.; Hu, C.; Wu, G.; Chen, M. Combination of PCA and PMF to apportion the sources of heavy metals in surface sediments from Lake Poyang during the wet season. J. Lake Sci. 2020, 32, 964–976. [Google Scholar] [CrossRef] [Scilit]
- Zhang, H.; Zhang, J.; Lu, S.; Han, Z.; Shi, Z.; Zhang, R. Spatiotemporal distribution characteristics, ecological risk assessment and source analysis of heavy metals in surface sediments of Hasuhai Lake. China Environ. Sci. 2025, 45, 991–1003. [Google Scholar] [CrossRef]
- Wu, J.; Wu, Z.; Holländer, R. The Application of Positive Matrix Factorization (PMF) to Eco-Efficiency Analysis. J. Environ. Manag. 2012, 98, 11–14. [Google Scholar] [CrossRef] [Scilit] [PubMed]
- Cesari, D.; Amato, F.; Pandolfi, M.; Alastuey, A.; Querol, X.; Contini, D. An Inter-Comparison of PM10 Source Apportionment Using PCA and PMF Receptor Models in Three European Sites. Environ. Sci. Pollut. Res. 2016, 23, 15133–15148. [Google Scholar] [CrossRef] [Scilit] [PubMed]
- Viana, M.; Pandolfi, M.; Minguillón, M.C.; Querol, X.; Alastuey, A.; Monfort, E.; Celades, I. Inter-Comparison of Receptor Models for PM Source Apportionment: Case Study in an Industrial Area. Atmos. Environ. 2008, 42, 3820–3832. [Google Scholar] [CrossRef] [Scilit]
- Antweiler, R.C.; Taylor, H.E. Evaluation of Statistical Treatments of Left-Censored Environmental Data Using Coincident Uncensored Data Sets: I. Summary Statistics. Environ. Sci. Technol. 2008, 42, 3732–3738. [Google Scholar] [CrossRef] [Scilit] [PubMed]
- Wang, W.; Huo, Y.; Lin, C.; Lian, Z.; Wang, L.; Liu, Y.; Sun, X.; Chen, J.; Lin, H. Occurrence, Accumulation, Ecological Risk, and Source Identification of Potentially Toxic Elements in Multimedia in a Subtropical Bay, Southeast China. J. Hazard. Mater. 2024, 476, 135110. [Google Scholar] [CrossRef] [Scilit] [PubMed]
- Arumugam, S.; Karthikeyan, S.; Annathurai, R.; Mahapatra, S.R. Ecological Risk Assessment and Trace Metal Distribution in Surface Water and Sediments of the Bay of Bengal, India. Reg. Stud. Mar. Sci. 2026, 95, 104789. [Google Scholar] [CrossRef] [Scilit]
- Sabarathinam, C.; Bhandary, H.; Al-Khalid, A. A Geochemical Analogy between the Metal Sources in Kuwait Bay and Territorial Sea Water of Kuwait. Environ. Monit. Assess. 2019, 191, 142. [Google Scholar] [CrossRef] [Scilit] [PubMed]
- Ouyang, X.; Li, X.; Pei, M.; Lei, X.; Su, Q. Distribution Characteristics and Influencing Factors Analysis of Pollutants in Surface Sediments from Tieshangang Bay, Beihai, Guangxi. Guangxi Sci. 2025, 32, 339–352. [Google Scholar] [CrossRef]
- Hyun, S.; Lee, C.-H.; Lee, T.; Choi, J.-W. Anthropogenic Contributions to Heavy Metal Distributions in the Surface Sediments of Masan Bay, Korea. Mar. Pollut. Bull. 2007, 54, 1059–1068. [Google Scholar] [CrossRef] [Scilit] [PubMed]
- Hamer, K.; Karius, V. Brick Production with Dredged Harbour Sediments. An Industrial-Scale Experiment. Waste Manag. 2002, 22, 521–530. [Google Scholar] [CrossRef] [Scilit] [PubMed]
- Pekey, H. Heavy Metal Pollution Assessment in Sediments of the Izmit Bay, Turkey. Environ. Monit. Assess. 2006, 123, 219–231. [Google Scholar] [CrossRef] [Scilit] [PubMed]
- Osher, L.J.; Leclerc, L.; Wiersma, G.B.; Hess, C.T.; Guiseppe, V.E. Heavy Metal Contamination from Historic Mining in Upland Soil and Estuarine Sediments of Egypt Bay, Maine, USA. Estuar. Coast. Shelf Sci. 2006, 70, 169–179. [Google Scholar] [CrossRef] [Scilit]
- Qian, X.; Duan, S. Heavy metals concentration and ecological risk assessment in surface sedimentsof Pearl River Estuary in Zhuhai. Ecol. Environ. Sci. 2010, 19, 2123–2129. [Google Scholar] [CrossRef]
- Dou, Y.; Li, J.; Zhao, J.; Hu, B.; Yang, S. Distribution, Enrichment and Source of Heavy Metals in Surface Sediments of the Eastern Beibu Bay, South China Sea. Mar. Pollut. Bull. 2013, 67, 137–145. [Google Scholar] [CrossRef] [Scilit] [PubMed]
- Pekey, H.; Karakaş, D.; Bakoğlu, M. Source Apportionment of Trace Metals in Surface Waters of a Polluted Stream Using Multivariate Statistical Analyses. Mar. Pollut. Bull. 2004, 49, 809–818. [Google Scholar] [CrossRef] [Scilit] [PubMed]
- Farmaki, E.G.; Thomaidis, N.S.; Pasias, I.N.; Baulard, C.; Papaharisis, L.; Efstathiou, C.E. Environmental Impact of Intensive Aquaculture: Investigation on the Accumulation of Metals and Nutrients in Marine Sediments of Greece. Sci. Total Environ. 2014, 485–486, 554–562. [Google Scholar] [CrossRef] [Scilit] [PubMed]
- Ru, S.; Xu, W.; Sun, S.; Hou, L.; Zhao, O.; Zhang, G.; Wang, L.; Liu, L. Distribution Characteristics of Nitrogen, Phosphorus and Heavy Metals in Intensive Livestock and Poultry Wastewater in Hebei Province. J. Hebei Agric. Sci. 2021, 25, 91–96. [Google Scholar]
- Wang, Q.; Han, L.; Han, T.; Fu, Z.; Li, Z.; Ding, H. Dynamic Source Apportionment of Heavy Metals in Bohai Bay Sediments Using a Temporally Hierarchical PCA-APCS-HBM Model. Mar. Pollut. Bull. 2026, 229, 119713. [Google Scholar] [CrossRef] [Scilit] [PubMed]
- Davis, A.P.; Shokouhian, M.; Ni, S. Loading Estimates of Lead, Copper, Cadmium, and Zinc in Urban Runoff from Specific Sources. Chemosphere 2001, 44, 997–1009. [Google Scholar] [CrossRef] [Scilit] [PubMed]
- Mandal, B.K.; Suzuki, K.T. Arsenic Round the World: A Review. Talanta 2002, 58, 201–235. [Google Scholar] [CrossRef] [Scilit]
- Katz, S.A.; Salem, H. The Biological and Environmental Chemistry of Chromium. Choice Rev. Online 1995, 32, 32–4513-32–4513. [Google Scholar] [CrossRef] [Scilit]
- Amdurer, M. Chemical Speciation and Cycling of Trace Elements in Estuaries: Radiotracer Studies in Marine Microcosms; Columbia University: New York, NY, USA, 1983. [Google Scholar]
- Sun, X.; Zhang, H.; Zhong, M.; Wang, Z.; Liang, X.; Huang, T.; Huang, H. Analyses on the Temporal and Spatial Characteristics of Water Quality in a Seagoing River Using Multivariate Statistical Techniques: A Case Study in the Duliujian River, China. Int. J. Environ. Res. Public Health 2019, 16, 1020. [Google Scholar] [CrossRef] [Scilit] [PubMed]
- Wu, M.-L.; Wang, Y.-S.; Wang, Y.-T.; Sun, F.-L.; Sun, C.-C.; Cheng, H.; Dong, J.-D. Seasonal and Spatial Variations of Water Quality and Trophic Status in Daya Bay, South China Sea. Mar. Pollut. Bull. 2016, 112, 341–348. [Google Scholar] [CrossRef] [Scilit] [PubMed]
- Wang, F.; Yu, Z.; Zhang, Y.; Ni, R.; Li, Z.; Li, S.; Song, N.; Liu, J.; Zong, H.; Jiao, W.; et al. Source-Risk and Uncertainty Assessment of Trace Metals in Surface Sediments of a Human-Dominated Seaward Catchment in Eastern China. J. Hazard. Mater. 2024, 480, 135960. [Google Scholar] [CrossRef] [Scilit] [PubMed]
- Tu, C.; He, C.; Ma, Y.; Yin, L.; Tao, L.; Yang, M. Characteristics of Heavy Metal Pollution in Sediments, Ecological Risks and Source Analysis in the Pearl River Basin. Front. Earth Sci. 2024, 31, 410–419. [Google Scholar] [CrossRef]
- Gao, L.; Chen, J.; Ke, Z.; Wang, J.; Yang, X. Shimizu Yuta Spatial and Temporal Variations in Heavy Metal Pollution and Ecotoxicity in the Shima River Basin, Dongguan. Environ. Sci. 2013, 34, 3079–3087. [Google Scholar] [CrossRef]
- Li, Q.; Bai, K.; Jiang, D.; Dai, J.; Zhang, H.; Wan, Z. Distribution and Source Analysis of Heavy Metals in Sediments of Qingshitan Irrigation District in Lijiang River Basin. China Rural Water Hydropower 2022, 7, 16–24. [Google Scholar]
- Mao, K.; Wang, X.; Yu, K.; Li, M.; Wang, Y.; Gao, G.; Geng, S.; Song, H.; Ning, W.; An, H.; et al. Source Apportionment and Ecological Risk Assessment of Heavy Metals in Sediments of Dongping Lake Based on PCA-PMF Model. Sci. Rep. 2025, 15, 32026. [Google Scholar] [CrossRef] [Scilit] [PubMed]
- Amer, H.A.; Nasr, S.M.; Soliman, N.F. PMF-Based Source Apportionment and Ecological Risk of Sediment-Bound Potentially Toxic Elements in an Industrialized Mediterranean Coastal Bay. Reg. Stud. Mar. Sci. 2026, 98, 105089. [Google Scholar] [CrossRef] [Scilit]
- Dasari, B.M.; Aradhi, K.K. Characterizing Pollution and Identifying Heavy Metal Sources in Surface Sediments: A PMF-Based Assessment of Environmental Risks from Produced Water Discharges during Hydraulic Fracturing. Environ. Geochem. Health 2025, 47, 574. [Google Scholar] [CrossRef] [Scilit] [PubMed]
- Loring, D.H. Normalization of Heavy-Metal Data from Estuarine and Coastal Sediments. J. Du Cons. 1991, 48, 101–115. [Google Scholar] [CrossRef] [Scilit]
- Yang, Z.; Zou, Z.; Tan, S.; Yan, H. Assessment of Historical Heavy Metal(Loid)s Contamination Records Reveals Dominant Control of Grain Size Effect on the Sedimentary Profiles from the North Yellow Sea. Environ. Pollut. 2025, 385, 127078. [Google Scholar] [CrossRef] [Scilit] [PubMed]

Disclaimer/Publisher’s Note: The statements, opinions and data contained in all publications are solely those of the individual author(s) and contributor(s) and not of MDPI and/or the editor(s). MDPI and/or the editor(s) disclaim responsibility for any injury to people or property resulting from any ideas, methods, instructions or products referred to in the content. |
© 2026 by the authors. Licensee MDPI, Basel, Switzerland. This article is an open access article distributed under the terms and conditions of the Creative Commons Attribution (CC BY) license.