1. Introduction
In recent decades, the generation of municipal solid waste (MSW) has steadily increased worldwide, intensifying anthropogenic pressure on natural ecosystems [
1,
2,
3,
4,
5]. In many countries, landfilling remains the predominant waste management practice, contributing to leachate formation and the accumulation of toxic substances, including heavy metals, in soils and water bodies [
6,
7,
8,
9,
10,
11]. In this context, the implementation of circular economy principles, including waste prevention, material recovery and recycling, is essential to reduce the dependence on landfilling and to minimize the long-term environmental burden of waste disposal [
12].
In Kazakhstan, MSW management represents a major environmental challenge. A significant proportion of landfills and waste disposal sites do not comply with environmental and sanitary standards, while recycling rates remain very low [
13,
14,
15,
16]. The expansion of areas occupied by waste disposal facilities contributes to land degradation and highlights the need for effective approaches to monitoring and rehabilitating disturbed territories. Several MSW landfills have already reached the end of their operational lifespan and require environmental restoration measures [
17,
18,
19].
During landfill operation, various pollutants may be generated and migrate into soils and groundwater [
20,
21]. Heavy metals pose a particular environmental hazard because of their persistence, bioaccumulative properties and toxic effects on living organisms [
22,
23]. Their mobile forms may exert phytotoxic effects, suppressing plant growth and development and altering vegetation structure [
24,
25,
26,
27]. Even after landfill closure, contamination may persist for long periods, forming stable technogenic geochemical anomalies and generating a “legacy pollution” effect [
28,
29,
30,
31,
32,
33,
34].
In the local context of closed landfill sites, such contamination may have broader environmental and potential human health implications. Heavy metals accumulated in landfill soils may be redistributed through dust dispersion, surface runoff, leachate migration and uptake by spontaneous vegetation, thereby affecting adjacent ecosystems and potentially increasing indirect exposure risks for nearby land-use areas [
2,
22,
35,
36]. Although a direct human health risk assessment was beyond the scope of this study, these pathways highlight the importance of post-closure monitoring of soil and vegetation conditions in landfill-affected territories.
It should also be noted that some of the elements commonly considered in contamination assessments, such as Cu, Mn, Zn and Ni, are essential micronutrients for plants at low concentrations. However, when present at elevated concentrations or in more mobile and bioavailable forms, these elements may become phytotoxic, impairing plant growth and altering vegetation structure [
37].
In recent years, remote sensing methods have been widely applied for landfill monitoring and for assessing ecosystem recovery processes in disturbed areas [
38,
39,
40]. Vegetation indices such as the Normalized Difference Vegetation Index (NDVI) and the Enhanced Vegetation Index (EVI) enable the evaluation of vegetation condition, photosynthetic activity and degradation patterns in areas subjected to anthropogenic impact [
36,
40,
41,
42,
43]. Recent studies have also demonstrated the usefulness of satellite-based spectral indices and machine-learning approaches for environmental monitoring of disturbed landscapes [
4,
39,
44,
45,
46,
47,
48].
Despite the substantial number of studies addressing heavy metal contamination in landfill areas, most research has primarily focused on determining pollutant concentrations and assessing soil contamination levels [
35,
49,
50]. At the same time, the spatial relationship between soil contamination and vegetation conditions, particularly under closed landfill conditions, remains insufficiently investigated. Existing studies rarely integrate geochemical indicators of contamination and ecological risk with long-term analyses of vegetation dynamics based on satellite data, which limits understanding of post-closure ecosystem recovery processes in disturbed territories [
39,
42,
43]. In particular, the relationship between the spatial distribution of heavy metals and the dynamics of vegetation indices in closed MSW landfills located in arid and steppe regions of Central Asia remains poorly understood. For Kazakhstan, such comprehensive studies are still scarce despite the presence of numerous closed and rehabilitated MSW landfills.
The present study is based on the hypothesis that spatial heterogeneity in heavy metal contamination is associated with spatial differences in vegetation conditions, as reflected by NDVI and EVI values. It was also assumed that areas characterized by elevated integrated contamination and ecological risk indices would exhibit less favorable vegetation conditions and slower post-closure recovery patterns. Addressing this gap is important because integrated geochemical and remote sensing approaches can help determine whether spatial patterns of soil contamination are reflected in long-term vegetation-index behavior. Such information can support ecological zoning, identification of priority areas for reclamation and the development of post-closure monitoring strategies for disturbed landfill territories.
The aim of this study was to assess the spatio-temporal relationship between heavy metal contamination in soils and vegetation conditions within a closed MSW landfill near Kokshetau using geochemical indices and NDVI/EVI satellite time series.
To achieve this aim, the following objectives were addressed:
To determine heavy metal concentrations in landfill soils;
To calculate integrated contamination and ecological risk indices (Igeo, Zc, RI);
To analyze NDVI and EVI dynamics for the period 2017–2025;
To evaluate the relationship between soil contamination and vegetation conditions.
2. Materials and Methods
The study was conducted at a closed MSW landfill located in the eastern part of Kokshetau (Akmola Region, Northern Kazakhstan), at the boundary between the southwestern margin of the West Siberian Plain and the northern slopes of the Kokshetau Upland (53.320833° N, 69.478333° E). The study area is situated within a moderately arid forest-steppe zone characterized by a sharply continental climate, with pronounced annual temperature fluctuations and limited precipitation.
The landfill covers an area of 36.5 ha and was operated from 1960 to 2017. It consists of a multilayered waste body covered with soil and was developed without engineered liners or leachate collection systems. The waste deposits reach a thickness of approximately 5–7 m. Despite its official closure, unauthorized waste disposal still occurs in some areas, thereby increasing anthropogenic pressure on the ecosystem [
17].
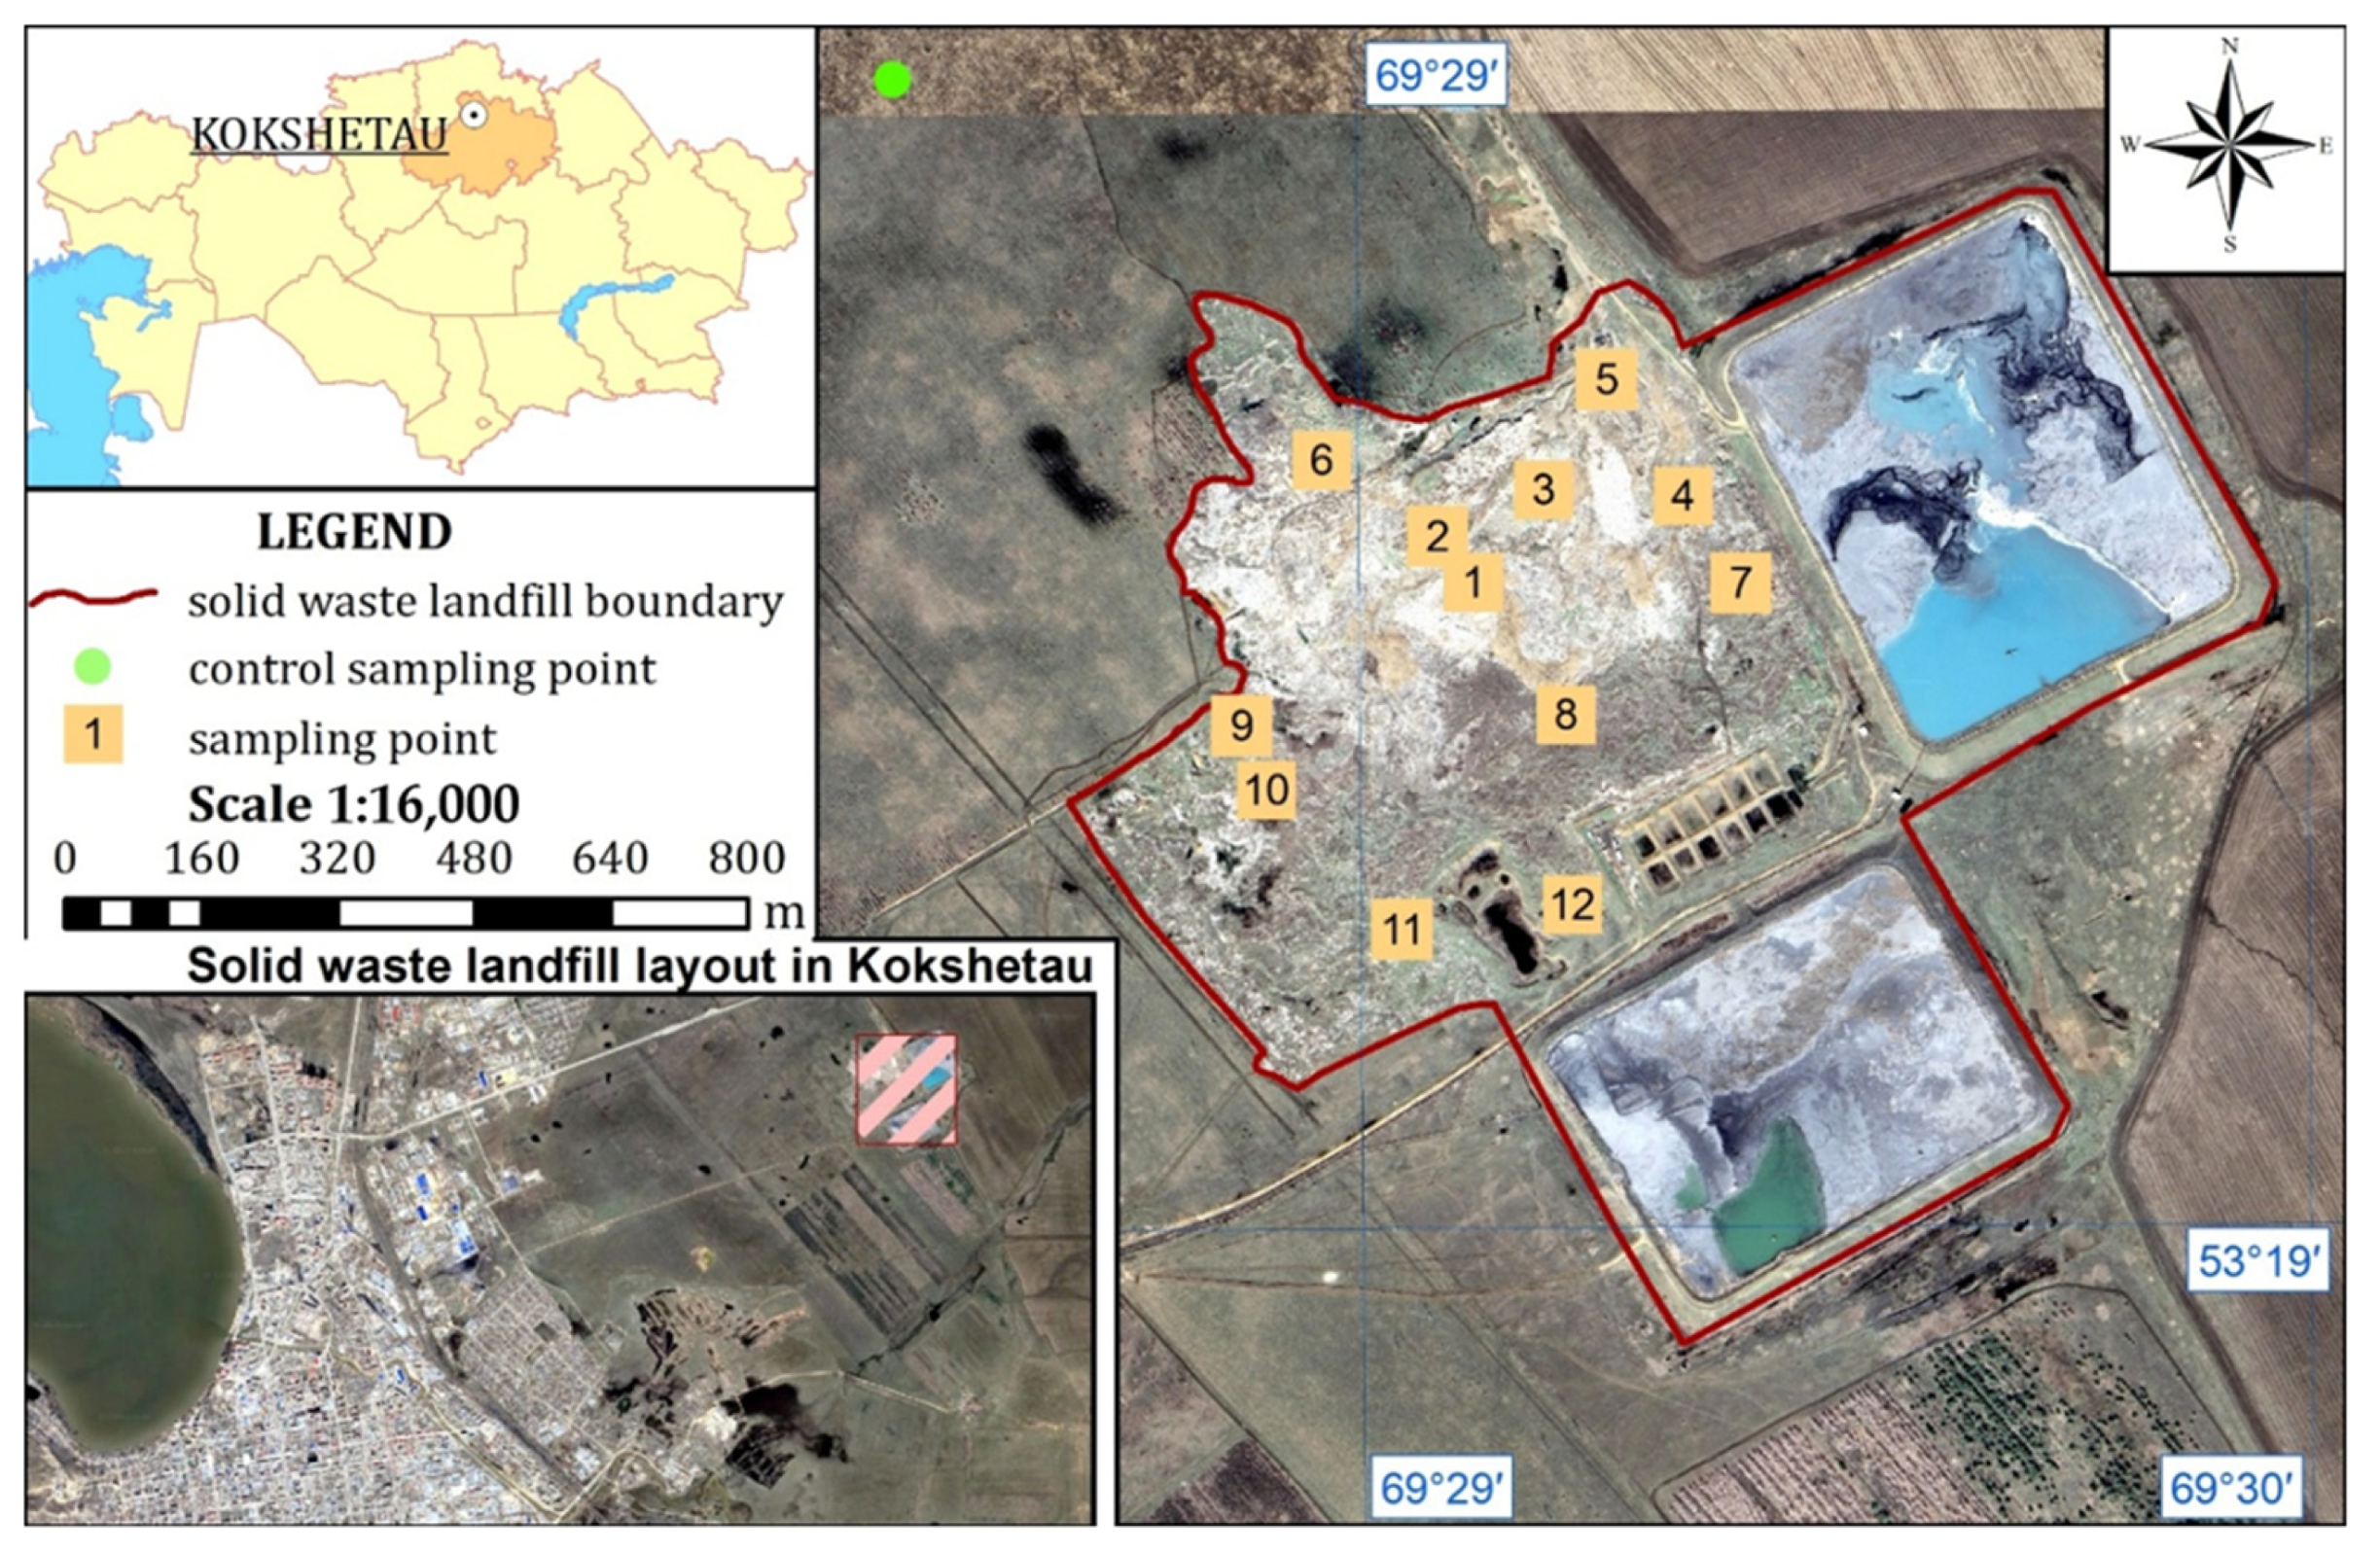
Figure 1 shows the spatial distribution of the sampling points within the closed MSW landfill in Kokshetau. Georeferencing of sampling locations was ensured using the built-in GPS module of the pXRF analyzer (
Table 1).
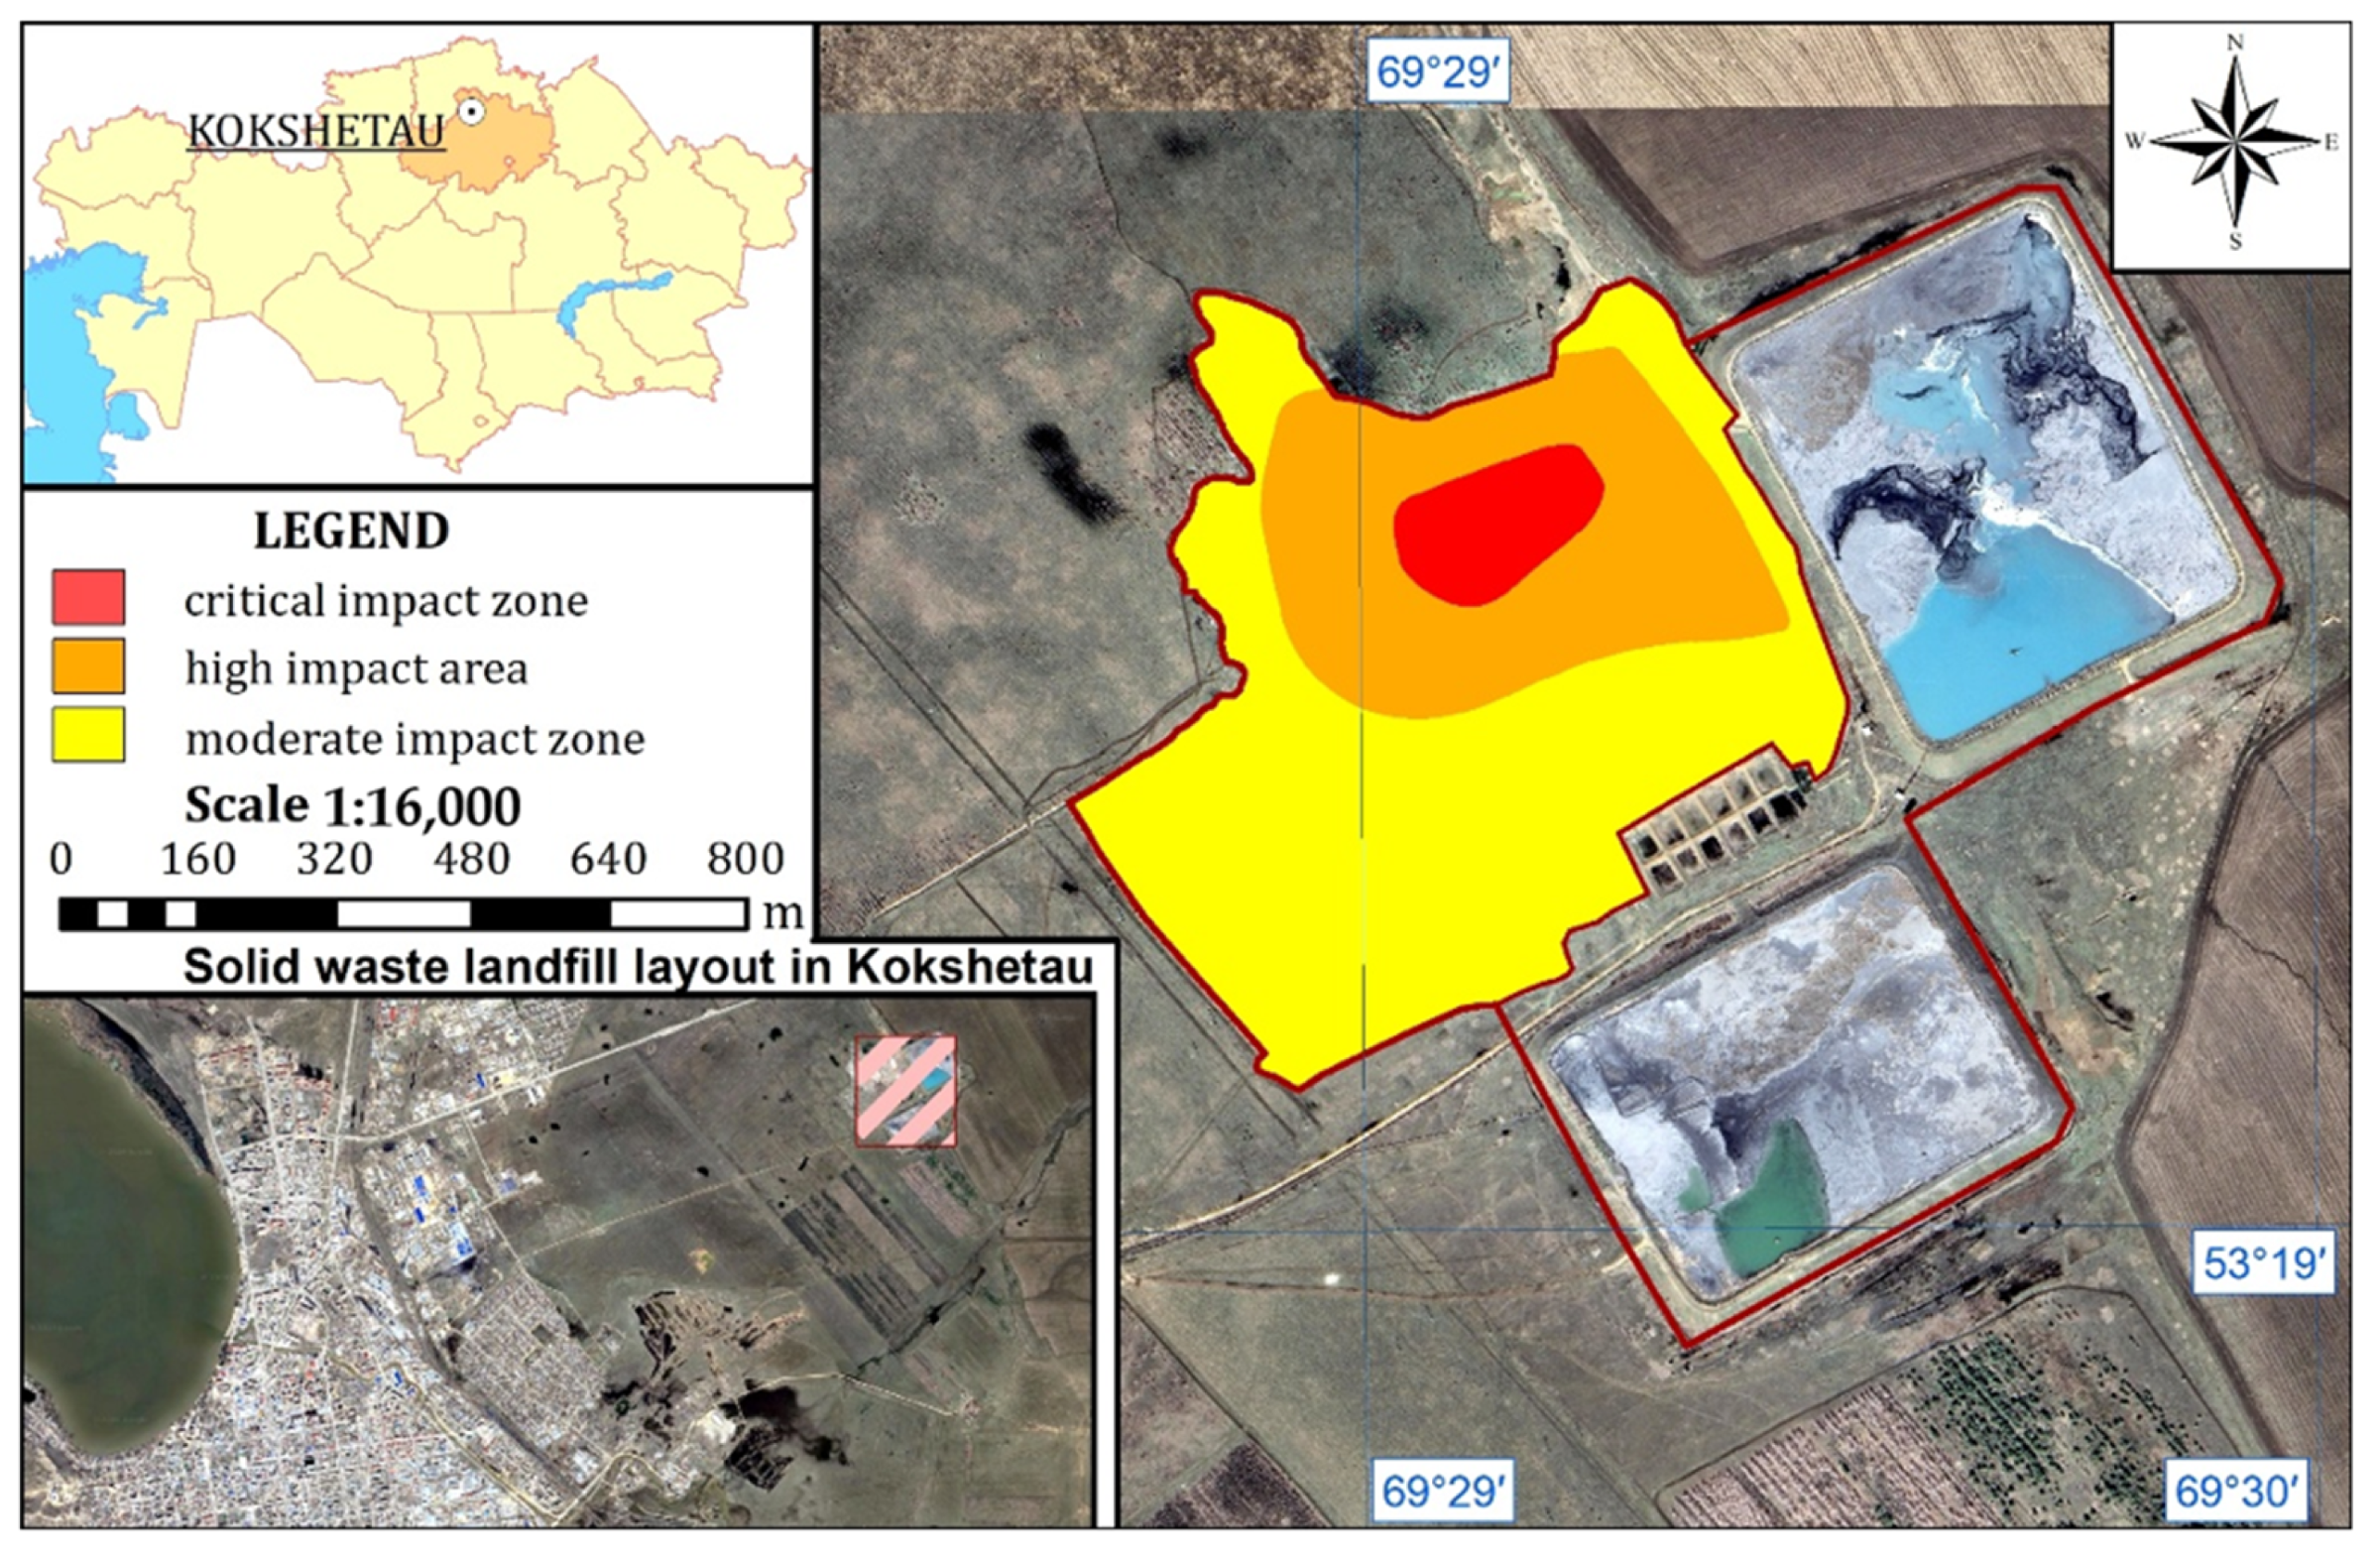
Soil sampling at the closed MSW landfill was conducted using a radial-gradient design between 21 July and 4 August 2025 in order to characterize the spatial distribution of heavy metals as a function of distance from the landfill center. The reference center was defined as the area showing the maximum thickness of the technogenic body and the greatest accumulation of waste (
Figure 2).
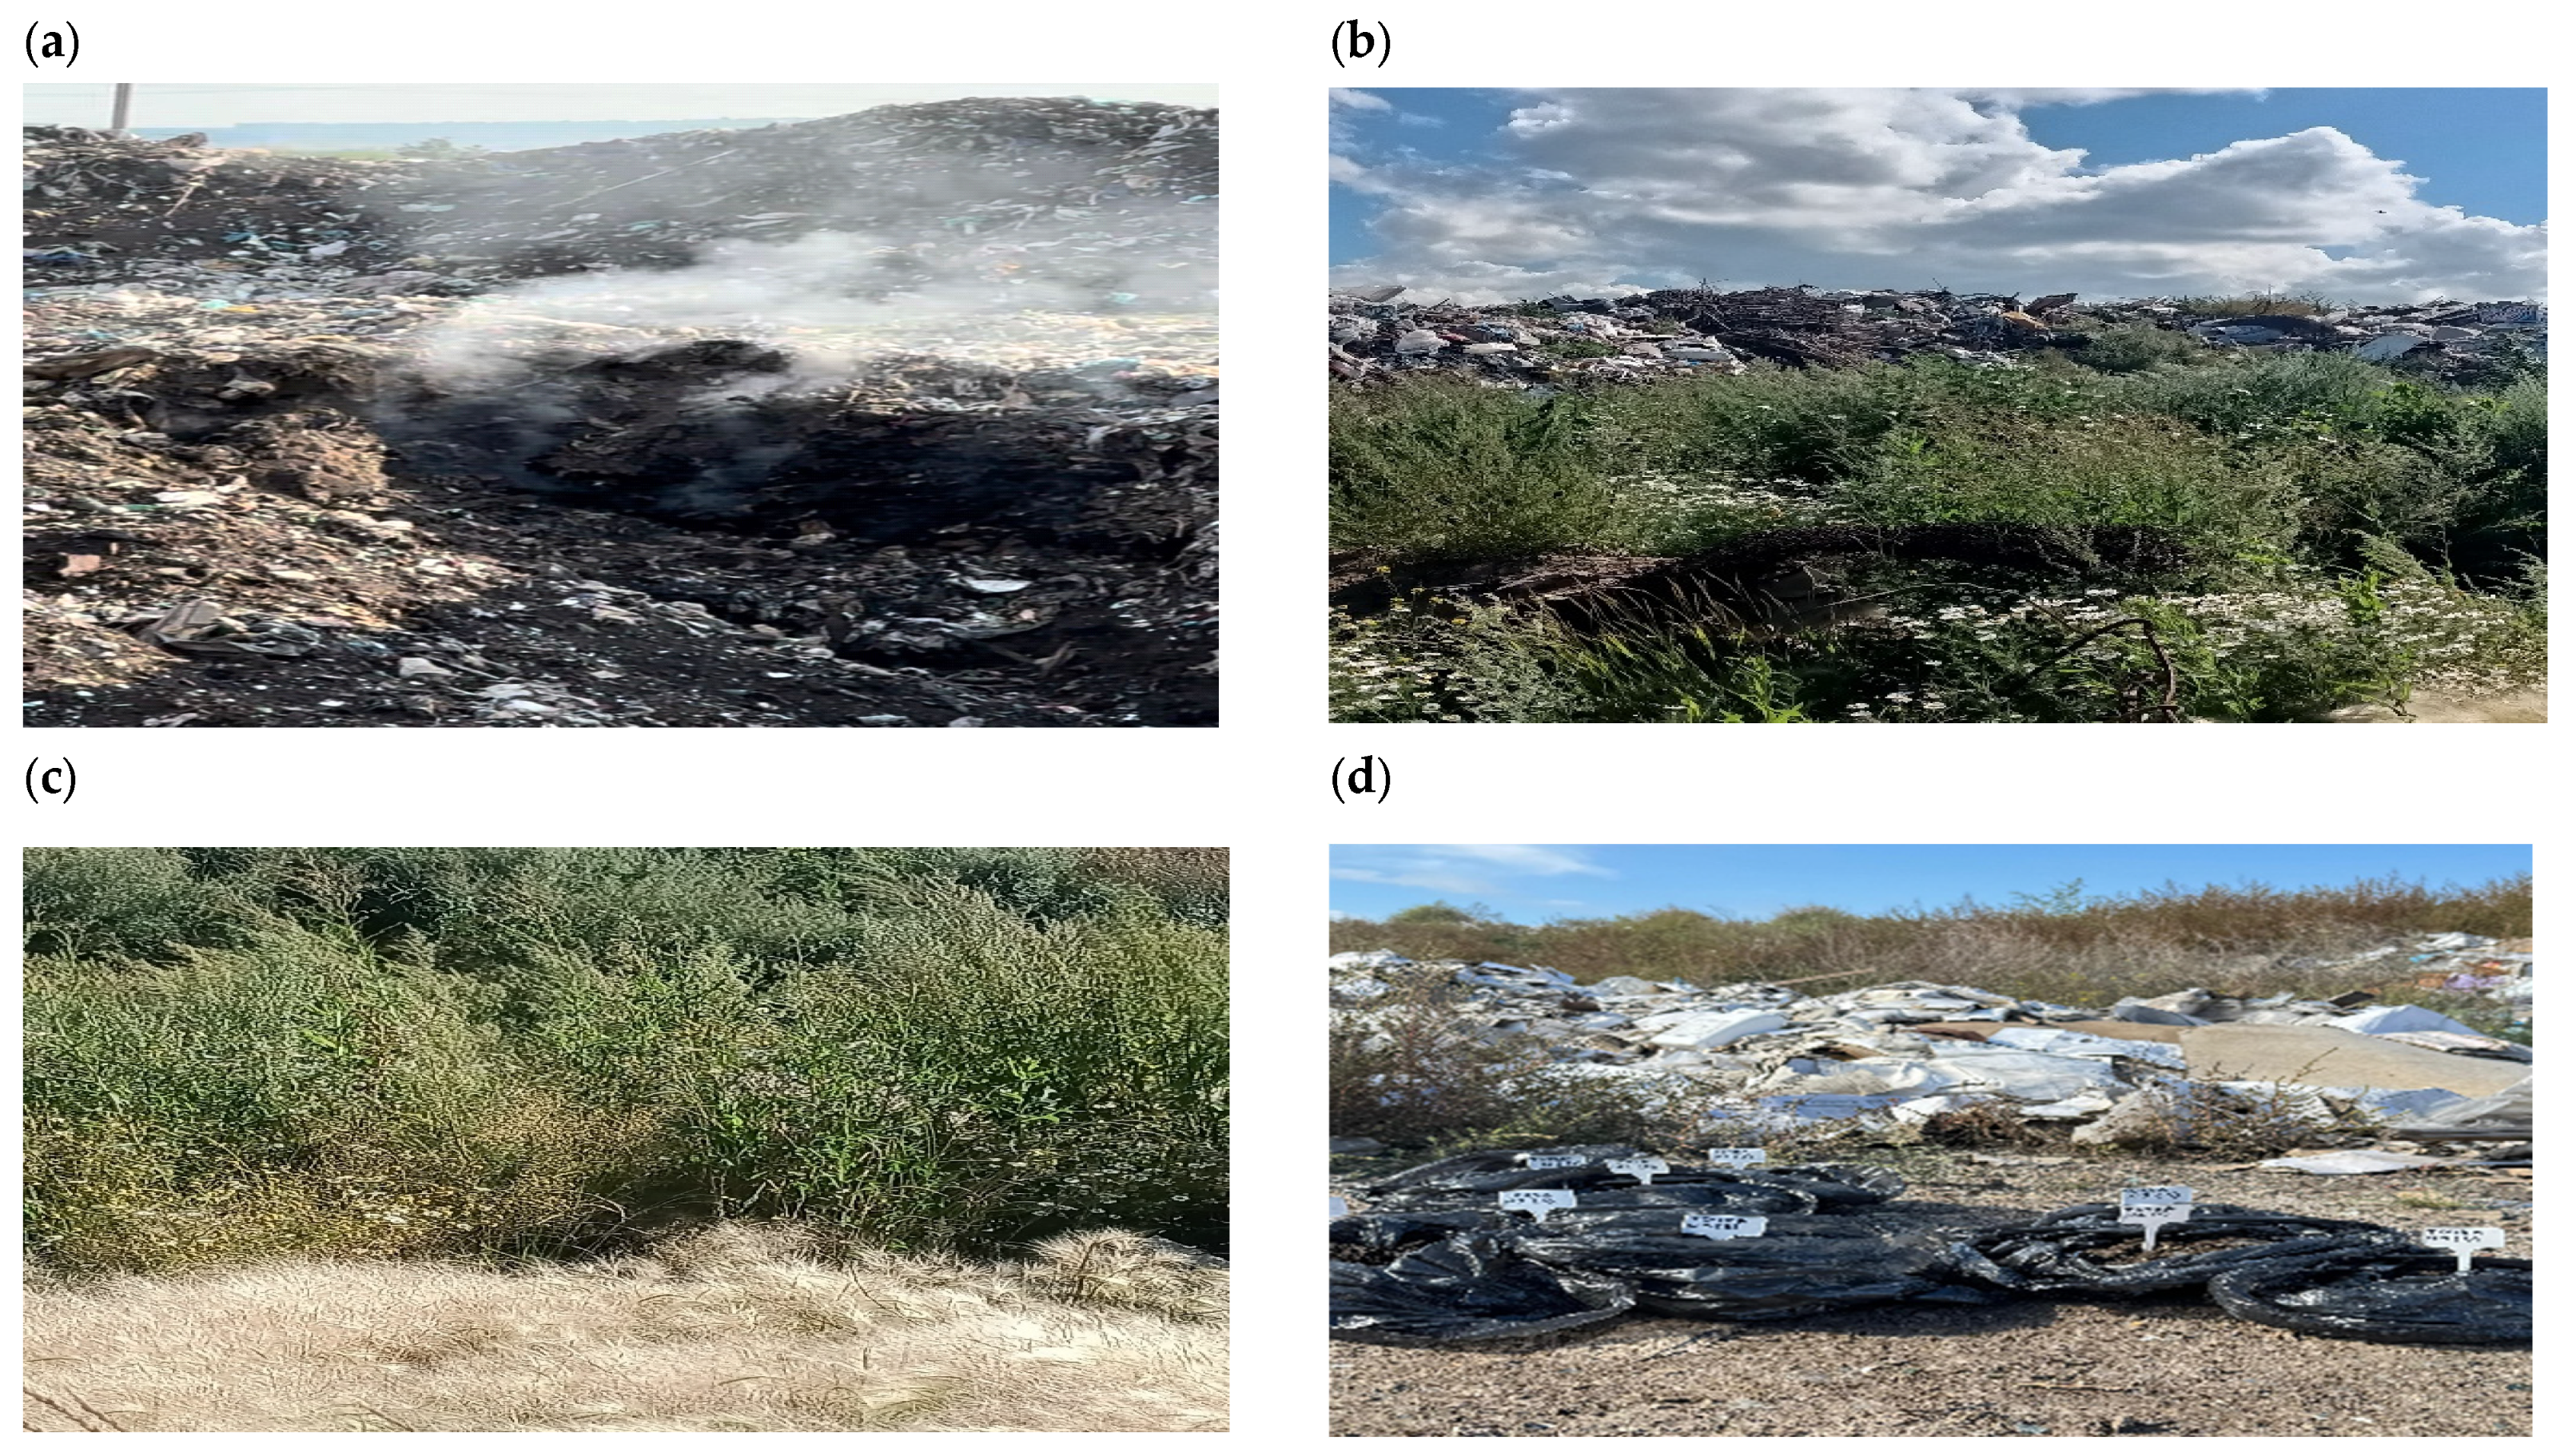
The field conditions observed across the landfill confirmed the strong morphological heterogeneity of the technogenic body, with exposed waste material and signs of combustion in the central zone and progressively denser vegetation cover toward the peripheral areas (
Figure 3).
Within the landfill body, twelve soil sampling points were established and grouped into three functional zones of technogenic impact: a critical impact zone (points 1–3, within 50 m of the landfill center), a high-impact zone (points 4–7, 50–150 m) and a moderate-impact zone (points 8–12, 150–500 m). In addition, one background soil sample was collected outside the influence area of the closed MSW landfill, at a distance of 5–10 km, under comparable natural conditions and was used as a reference for assessing contamination levels. This functional zoning was defined a priori as part of the sampling design, before the geochemical analyses were performed. It was based on distance from the landfill center, field observations of the technogenic substrate, surface morphology, visible waste accumulation and vegetation cover, rather than on the analytical results obtained after sampling. At each sampling point, a composite soil sample was formed using the envelope method. Five subsamples were collected within the immediate vicinity of each sampling location and then homogenized to obtain one representative composite sample for geochemical analysis. This procedure was applied to reduce the influence of small-scale spatial heterogeneity and to improve the representativeness of each sampling point under the heterogeneous conditions of the landfill substrate.
The sampling design was based on a targeted radial-gradient approach rather than on random statistical sampling. This design was selected to characterize the internal contamination gradient of the landfill, from the central technogenic body toward the peripheral zones. The number and spatial distribution of sampling points were determined by the area of the study site, the morphology of the technogenic substrate and the presence of a clearly identifiable contamination hotspot [
4,
5,
51,
52]. Nevertheless, the limited number of sampling points restricts the strength of statistical inference and prevents robust geostatistical interpolation. Accordingly, the results are interpreted as site-specific spatial patterns rather than as regionally generalizable estimates.
It should also be noted that the territory surrounding the landfill has been substantially transformed by anthropogenic activity. Construction sites, ash disposal areas, agricultural lands and other disturbed territories are located in the immediate vicinity of the landfill, which considerably limits the possibility of establishing an extensive network of undisturbed background sites under comparable natural conditions.
The use of a single background point represents a methodological limitation because it does not allow the natural spatial variability of soil geochemical conditions to be statistically characterized. In the present study, the background sample was therefore used only as a reference baseline for calculating relative geochemical indices, including I
geo, Z
c and RI, rather than as a statistically representative estimate of the regional soil background. Accordingly, the calculated indices should be interpreted as site-specific indicators of contamination intensity relative to the selected reference condition. The selected background site was located outside the direct influence area of the landfill and was characterized by comparable natural conditions and no visible signs of technogenic disturbance. Although the high enrichment observed for Zn, Pb and Cu supports the interpretation of a pronounced technogenic anomaly, future studies should include multiple background sites to better account for natural soil variability and improve the robustness of I
geo, Z
c and RI calculations [
5,
51,
52].
Sampling depth was determined according to the morphological position of each site and the structure of the soil–technogenic profile. In the central part of the landfill, corresponding to the critical impact zone, a developed natural soil profile was not present. The upper layer consisted mainly of technogenic material, waste fragments and construction debris and therefore did not represent a comparable natural soil horizon. For this reason, samples in the central zone were collected from the 0–50 cm layer in order to characterize the soil–technogenic material affected by contaminant accumulation within the landfill body.
In the high-impact and moderate-impact zones, a surface soil horizon was directly exposed and was more closely associated with vegetation development and plant–soil interactions. Therefore, samples in these peripheral zones were collected from the upper 0–20 cm layer, corresponding to the biologically active surface horizon most commonly used in ecological and soil contamination studies [
4,
5].
The use of different sampling depths represents a methodological limitation because heavy metal concentrations may vary with depth and strict quantitative comparability between zones may therefore be affected. Accordingly, the results should not be interpreted as a direct comparison of equivalent genetic soil horizons. Instead, they are interpreted as evidence of a spatial gradient of technogenic impact within a morphologically heterogeneous landfill system, where the central zone represents the soil–technogenic landfill body and the peripheral zones represent surface soil horizons involved in vegetation recovery. This approach is consistent with methodological principles for studying technogenically disturbed territories, where sampling depth is determined by substrate morphology and research objectives rather than by a fixed depth interval [
4,
5]. Future studies should include depth-standardized sampling profiles and vertical sampling intervals to better quantify metal migration and improve comparability among landfill zones.
Before analysis, the soil samples underwent standard laboratory preparation: they were air-dried at room temperature, cleared of extraneous materials, sieved and homogenized to obtain a uniform mass. This procedure improved analytical reproducibility and minimized the influence of within-sample heterogeneity on the results.
Total concentrations of heavy metals (Zn, Cu, Mn, Sr, Pb, As and Ni) were determined using a portable X-ray fluorescence (pXRF) analyzer (Olympus Vanta Pro, VCR series, Olympus Scientific Solutions Americas Corp., Waltham, MA, USA; currently Evident Scientific) equipped with GeoChem software (integrated analytical package supplied with the Olympus Vanta Pro instrument) [
53]. The method is based on X-ray fluorescence, whereby atoms excited by primary X-ray radiation emit secondary radiation with element-specific energy spectra, enabling qualitative and quantitative elemental analysis. The Olympus Vanta Pro is equipped with a 4 W X-ray tube with a rhodium (Rh) anode and a large-area silicon drift detector (SDD, up to 50 mm
2), providing high analytical sensitivity for elemental determination. The instrument also includes a built-in GPS module and digital camera, which facilitate georeferencing of sampling locations and support spatial analysis and contamination mapping [
53]. Before measurement, the instrument was calibrated using standard reference materials recommended by the manufacturer. The analysis time for each sample was approximately 60–90 s and at least three replicate measurements were performed for each sample; the reported values correspond to the mean of these replicates. Quality control included regular verification of instrument stability, analysis of control samples and exclusion of outliers outside the acceptable range. The obtained results were also checked against the performance specifications of the method in order to support data reliability and measurement reproducibility.
To assess vegetation recovery under continuing anthropogenic influence, NDVI and EVI were used. The data were obtained from the United States Geological Survey (USGS) platform [
41]. Landsat 8 imagery (OLI sensor) was used for the period 2017–2021 and Landsat 9 imagery (OLI-2 sensor) for 2022–2025. These sensors have comparable spectral characteristics and are widely applied in long-term environmental monitoring.
The analysis was based on Level-2 Surface Reflectance products, which include atmospheric correction and radiometric calibration. The spatial resolution of the spectral bands used for index calculation (RED, NIR and BLUE) is 30 m. To ensure comparability and reduce the influence of external factors, image selection followed these criteria: acquisition during July–August, corresponding to peak vegetation activity; scene cloud cover not exceeding 10% over the study area; absence of major atmospheric disturbances (haze, smoke, or aerosols); and selection of no more than one representative image per year under comparable conditions. Cloud masking and removal of related distortions were performed using the QA_PIXEL quality assessment band included in Landsat Level-2 products. Pixels corresponding to clouds, cloud shadows, cirrus and snow were excluded through bitmask filtering. A total of nine representative scenes, corresponding to one image per year, were finally selected in order to ensure temporal consistency and minimize the influence of interannual variability in acquisition conditions. Although the selected Landsat scenes corresponded to the same July–August seasonal window as the soil sampling campaign, exact same-day synchronization between satellite acquisition and field sampling was not always possible due to Landsat revisit frequency and the availability of cloud-free imagery. In addition, visual inspection of the selected scenes was conducted to eliminate residual artifacts and improve the reliability of the analysis.
The Normalized Difference Vegetation Index (NDVI) was calculated using Equation (1):
where NIR is the reflectance in the near-infrared spectral region and RED is the reflectance in the red spectral region. The index ranges from −1 to 1. For vegetation, NDVI typically takes positive values, usually within the range of 0.2–0.8 [
54].
The Enhanced Vegetation Index (EVI) was calculated using Equation (2):
where BLUE is the reflectance in the blue spectral region. The coefficients C1, C2 and L are empirically derived parameters used to account for atmospheric effects and soil background influence. Their standard values (6.0, 7.5 and 1.0, respectively) were established through calibration with satellite and field observations, improving the sensitivity of the index to vegetation while reducing atmospheric and soil-related noise. The index ranges from −1 to 1, while typical values for green vegetation lie between 0.2 and 0.8 [
42].
For each sampling point, NDVI and EVI values were extracted taking into account the spatial resolution of the satellite data. To this end, a buffer with a radius of 30–60 m was generated around each point and the mean value of each index was calculated within that area. This procedure reduces the influence of mixed pixels and improves the representativeness of the data when integrating satellite-derived and field-based information. The selection of buffer radius was based on the spatial resolution of Landsat data (30 m): the minimum radius of 30 m corresponds to the size of a single pixel, whereas increasing the buffer to 60 m, equivalent to two pixels, helps reduce the influence of geolocation errors, mixed-pixel effects and local spatial heterogeneity in vegetation cover, which is typical of technogenically disturbed areas.
The data were also aggregated by functional landfill zones (critical, high-impact and moderate-impact zones), which made it possible to assess spatial patterns in vegetation dynamics along the contamination gradient. For each point, mean NDVI and EVI values were extracted for July–August of each year from 2017 to 2025, resulting in a 9-year time series. The following parameters were evaluated: mean index value over the study period, linear trend (slope), interannual variability (standard deviation and coefficient of variation) and spatial differences between zones. NDVI and EVI are widely used to assess vegetation condition and its response to environmental change and anthropogenic disturbance [
42,
43,
55].
The geoaccumulation index (I
geo) was originally proposed by Müller to assess the degree of heavy metal contamination in sediments and soils [
52]:
where
Ci—is the concentration of the element in the sample;
Bi is the corresponding background value.
The integrated contamination index (Z
c) is used for a comprehensive assessment of the level of technogenic soil contamination by heavy metals [
56]:
where
The RI was originally proposed by Hakanson for assessing the potential ecological risk of heavy metal contamination [
51]:
where Tr—is the toxic-response coefficient of the element.
To assess the relationship between soil contamination and vegetation condition, NDVI and EVI indices were used as integrated indicators of the ecological status of the territory. It should be noted that variations in NDVI/EVI values may be influenced not only by the level of heavy metal contamination, but also by other environmental factors characteristic of closed MSW landfill sites, including compaction of the technogenic substrate, moisture deficiency, soil texture and structure properties, heterogeneity of the reclamation cover, local microrelief features, as well as the potential influence of landfill gas and degassing processes. Therefore, the identified correlations between geochemical indicators and vegetation indices were interpreted as spatial ecological associations rather than as direct evidence of a causal relationship between heavy metal contamination and vegetation condition.
Statistical data processing was performed using MS Excel and the STATISTICA software package v.10.0. The effective sample size depended on the type of analysis performed. For the analysis of heavy metal concentrations and the calculation of geochemical indices, data from 12 sampling points (n = 12), grouped into functional landfill zones, were used. Background conditions were represented by a single background point (n = 1), which served as a reference baseline for the calculation of geochemical indices.
For the analysis of NDVI and EVI time series, data for the period 2017–2025 were used, resulting in 9 observations for each sampling point. In the zonal analysis, values were aggregated by functional groups of points (n = 3 for the critical impact zone, n = 4 for the high-impact zone and n = 5 for the moderate-impact zone).
Prior to the application of parametric statistical methods, data normality was assessed using the Shapiro–Wilk test. Most of the analyzed variables, including heavy metal concentrations and vegetation indices, did not show significant deviations from normality (p > 0.05), which did not contradict the use of parametric approaches; however, given the small group sizes, the statistical results were interpreted cautiously and used primarily as exploratory indicators of spatial differences.
At the same time, considering the limited number of sampling points and the small size of individual functional groups (n = 3–5), the statistical analysis was used primarily to identify general spatial trends and ecological relationships within the study site rather than for strict statistical generalization of the results. Therefore, the results of the parametric tests were interpreted with caution and considered in combination with geochemical indices, spatial gradient analysis and long-term NDVI/EVI remote sensing time series.
The selected background site was located within a natural phytocenosis characterized by comparable soil-forming conditions, natural vegetation cover and minimal anthropogenic disturbance. The selection of additional background sites was substantially limited by the characteristics of the surrounding territory, as the landfill area is adjacent to ash disposal zones, construction sites and agricultural lands potentially affected by technogenic influence. Under these conditions, the selected natural phytocenosis represented the most environmentally representative reference area available for comparative assessment.
Differences between functional landfill zones were initially evaluated using Student’s
t-test as an exploratory parametric procedure [
57]. However, given the small size of the individual groups (n = 3–5), these comparisons were interpreted cautiously and were not used as the sole basis for inference. Relationships between variables were assessed using Pearson’s correlation coefficient, while statistical significance was evaluated at
p < 0.05. Nevertheless, the interpretation focused primarily on the direction and consistency of the observed spatial patterns rather than on formal statistical significance alone.
To reduce dependence on parametric assumptions, Spearman’s rank correlation coefficient was also calculated as a complementary non-parametric check of the direction of the relationships between geochemical indicators and vegetation indices. This analysis was performed in accordance with the functional zoning of the landfill and was used to verify the consistency of the monotonic spatial pattern. Therefore, the non-parametric results were interpreted as supporting evidence of spatial consistency, not as an independent basis for formal statistical inference.
The statistical analysis was considered exploratory and was interpreted together with the radial-gradient sampling design, geochemical indices, contamination gradients and long-term NDVI/EVI time-series data.
3. Results
The analysis of total heavy metal concentrations in soils from the closed MSW landfill (points 1–12) revealed pronounced spatial heterogeneity across the different impact zones, together with variable degrees of exceedance relative to background values and maximum permissible concentrations (MPC) (
Table 2).
Heavy metal concentrations showed a clear radial gradient pattern across the landfill. The highest values were recorded in the critical impact zone, where Zn, Pb, Cu and As markedly exceeded both background values and maximum permissible concentrations. Toward the high-impact and moderate-impact zones, concentrations progressively decreased, although residual polymetallic contamination remained detectable, particularly for Zn, Pb and Cu.
Overall, the spatial distribution of heavy metals exhibited a pronounced radial gradient pattern, with maximum concentrations concentrated in the central part of the landfill and progressively decreasing toward the periphery. Zinc, lead and copper were the main contributors to the geochemical anomaly, a pattern that is consistent with the composition typically reported for municipal solid waste disposal sites.
To further characterize the spatial gradient of technogenic impact, contamination levels were classified separately for each zone on the basis of mean geoaccumulation index (I
geo) values. The corresponding I
geo results for points 1–12 are presented in
Table 3.
The geoaccumulation index confirmed the radial differentiation of contamination across the landfill. The critical impact zone showed the highest pollution classes, especially for Zn and Pb, which reached strong to very strong pollution levels. In the high-impact zone, Igeo values decreased but still indicated moderate to strong pollution for the main contaminant elements. In the moderate-impact zone, most elements approached slight or near-background conditions, although Zn and Pb still indicated residual contamination.
The Igeo results show that Zn and Pb were the dominant elements controlling the geochemical anomaly, whereas the remaining elements contributed to a lesser extent. This pattern supports the interpretation of a decreasing technogenic impact from the landfill center toward the peripheral zones.
The values of the integrated contamination index likewise indicated marked spatial differentiation of technogenic impact across the closed MSW landfill (
Table 4).
The integrated contamination index showed marked spatial differentiation among the functional zones. The critical impact zone corresponded to a very high level of contamination, while the high-impact zone showed high contamination with some local heterogeneity. In the moderate-impact zone, Zc values decreased to a moderate level, indicating a substantial reduction in the overall technogenic load toward the landfill periphery.
These results confirm that the landfill center represents the main contamination hotspot, whereas the peripheral zones show progressively lower levels of integrated pollution.
The values of the RI likewise showed pronounced spatial differentiation of ecological risk across the closed MSW landfill (
Table 5).
The potential ecological risk index followed the same spatial pattern observed for the concentration data and the integrated contamination index. The highest ecological risk was recorded in the critical impact zone, while the high-impact zone showed intermediate values and the moderate-impact zone corresponded to a low risk level.
The RI results therefore confirm a radial decrease in ecological risk from the landfill center toward the periphery. Zn and Pb made the largest contribution to the overall ecological risk because of their elevated concentrations and toxic-response weighting.
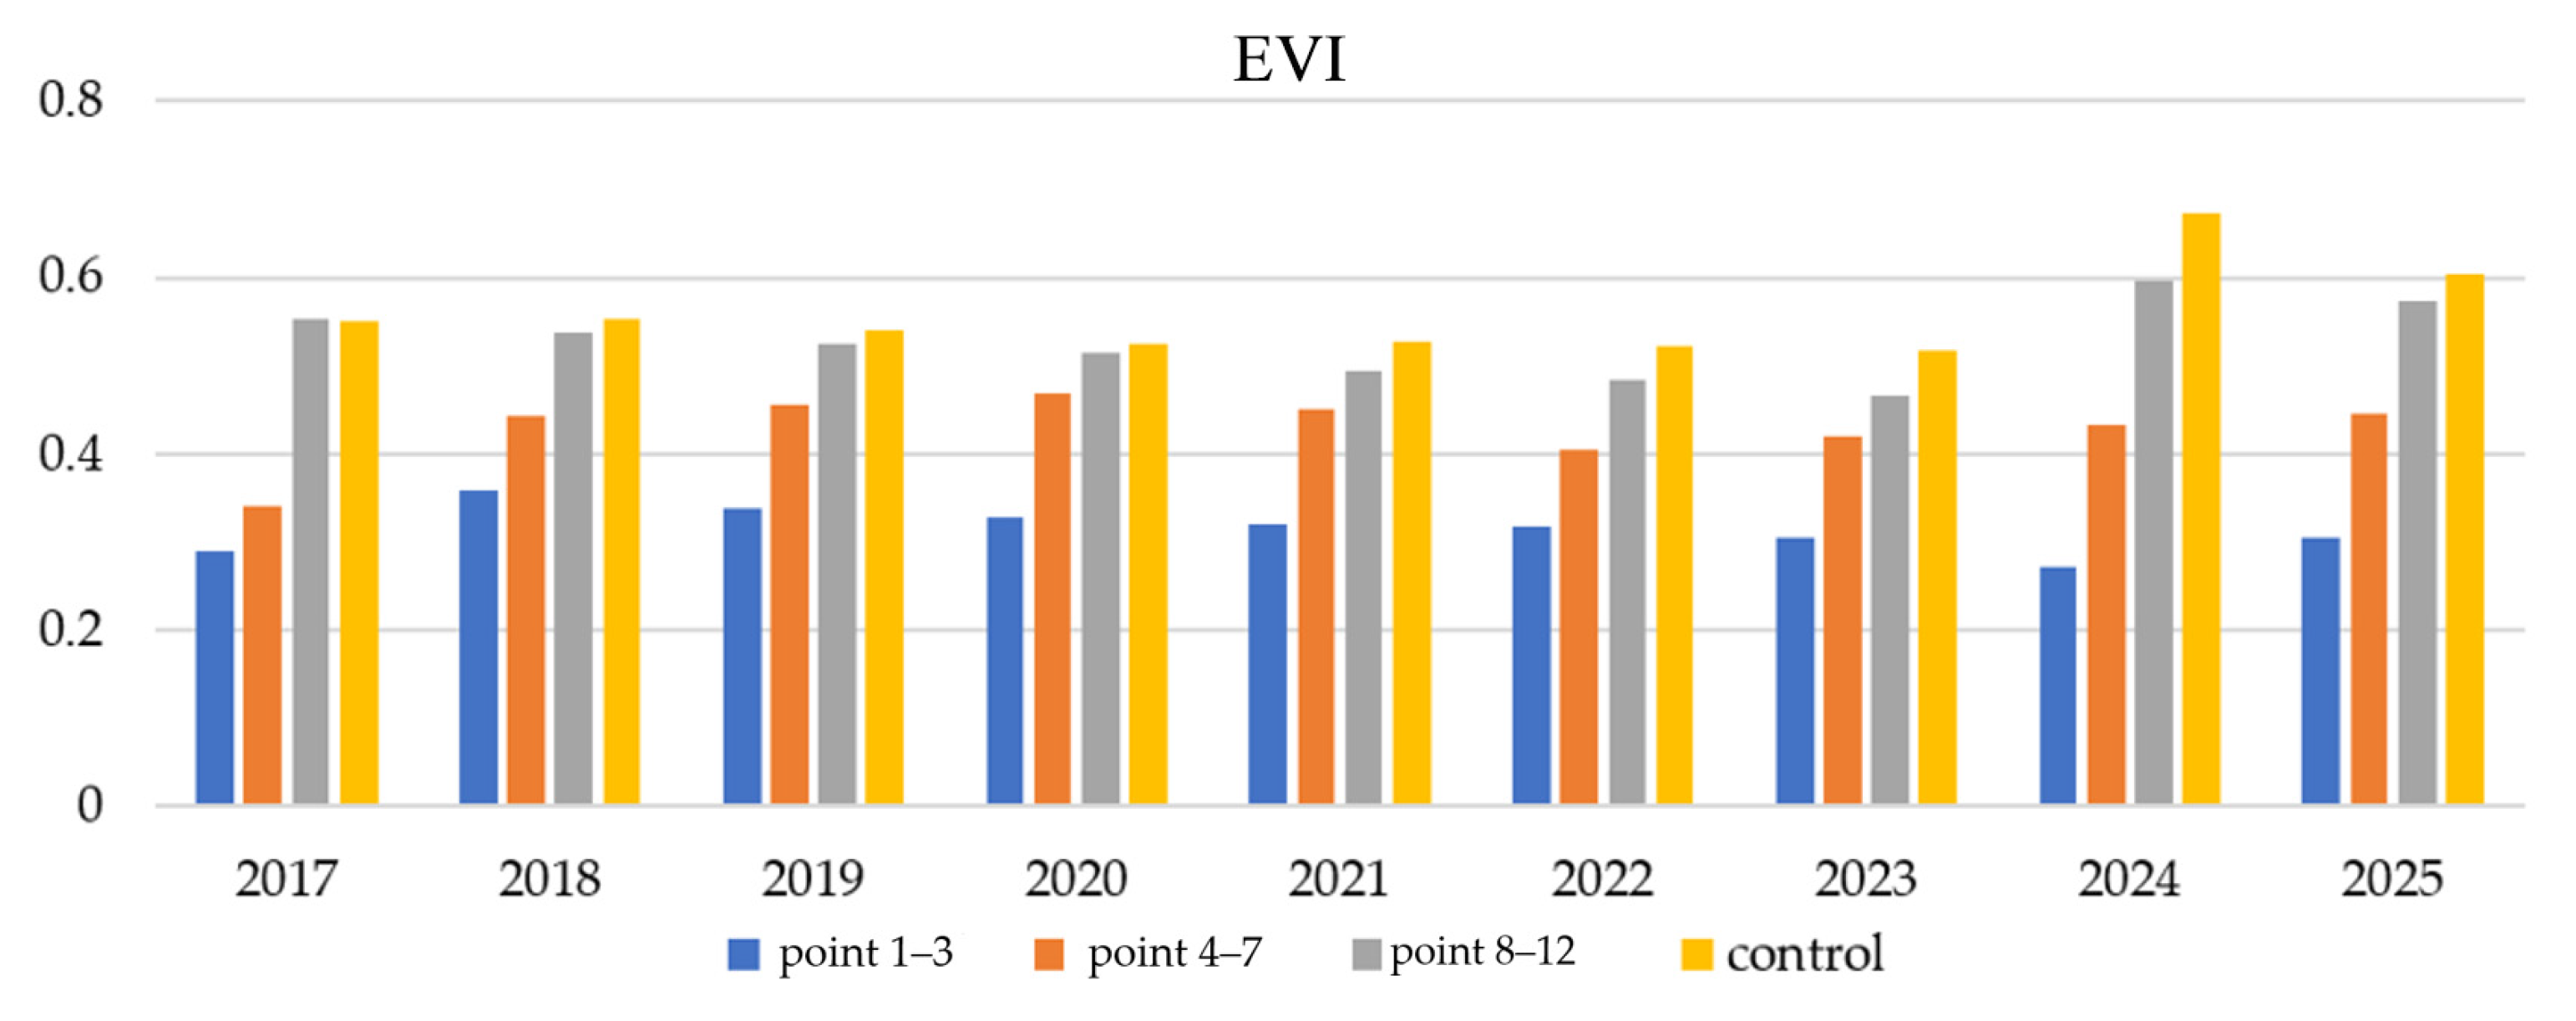
The temporal dynamics of vegetation indices (NDVI and EVI) over the period 2017–2025 also showed pronounced spatial differentiation in vegetation condition across the closed MSW landfill.
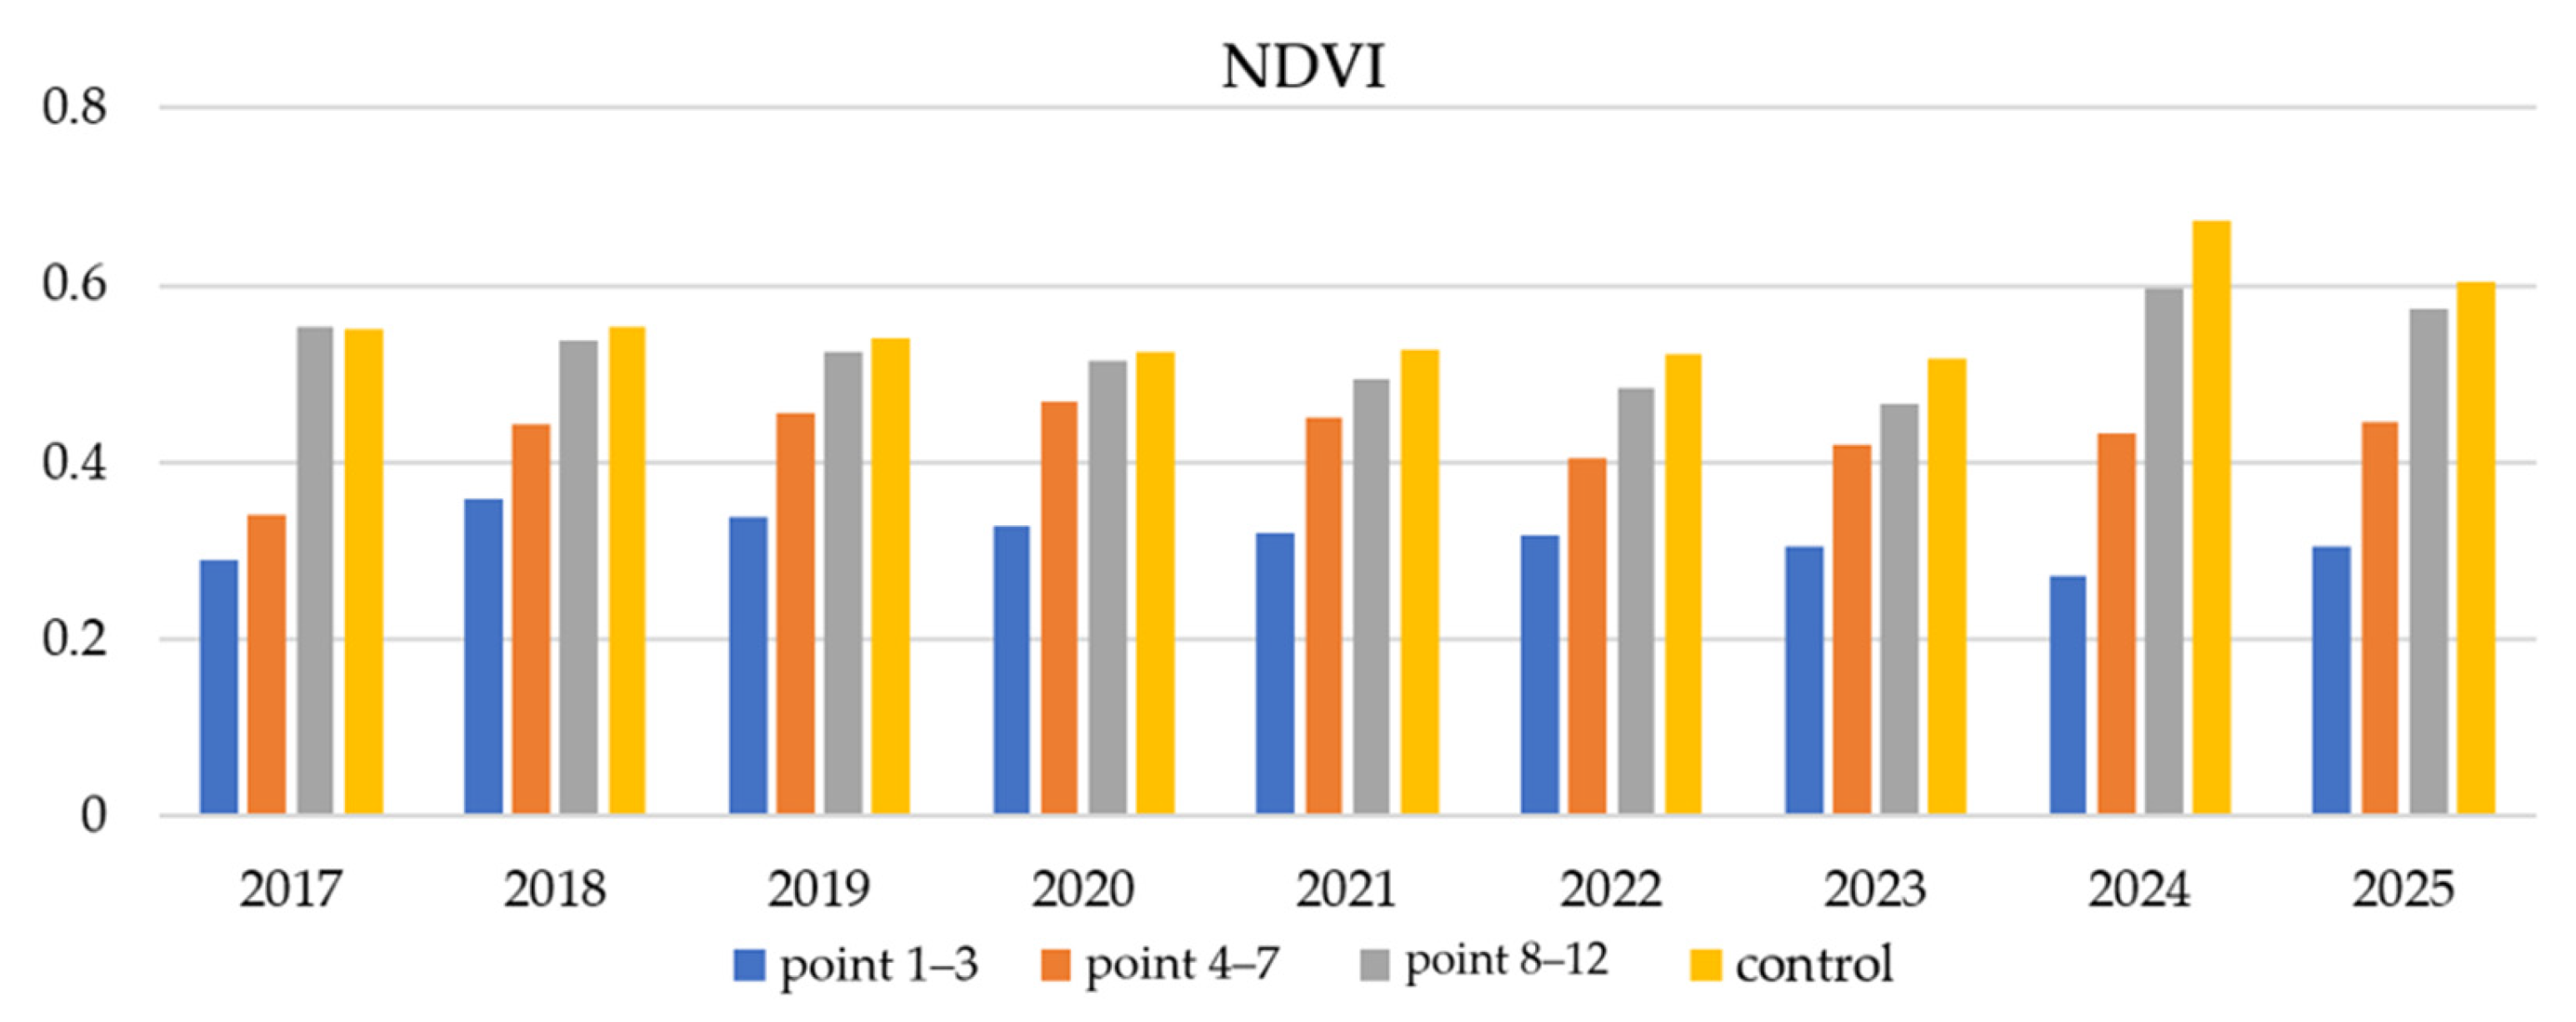
Figure 4 and
Figure 5 present the temporal variation in NDVI and EVI values for the sampling points located within the landfill (points 1–12).
Mean NDVI values showed a clear spatial gradient across the landfill. The lowest values were observed in the critical impact zone, where vegetation recovery appeared more limited and unstable. Intermediate NDVI values were recorded in the high-impact zone, whereas the moderate-impact zone showed values closer to those of the background site.
Temporally, NDVI values showed interannual variability across all zones, but the overall spatial pattern remained consistent throughout the 2017–2025 period. This indicates persistently less favorable vegetation conditions in the central landfill area and comparatively better vegetation development toward the periphery.
NDVI reflected a clear radial gradient pattern in vegetation condition, with minimum values in the central zone and progressively higher values toward the periphery.
The EVI results were consistent with the NDVI patterns and provided a complementary assessment of vegetation condition. The lowest EVI values were recorded in the critical impact zone, intermediate values in the high-impact zone and the highest values in the moderate-impact zone, where vegetation conditions were closer to or slightly above those observed at the background site.
As with NDVI, the EVI time series showed interannual variability but maintained a consistent spatial gradient, supporting the interpretation of more favorable vegetation conditions toward the landfill periphery.
The comparison between NDVI and EVI showed strong consistency between the two indices and supported the robustness of the observed spatial pattern.
The results indicate that vegetation condition across the landfill was spatially heterogeneous and showed a spatial pattern consistent with the gradient of technogenic pressure, with less favorable conditions toward the center of the landfill.
4. Discussion
The integrated assessment of the closed municipal solid waste landfill in Kokshetau showed that the technogenic accumulation of heavy metals was associated with clear spatial differences in vegetation condition, as reflected by the dynamics of remotely sensed vegetation indices (NDVI and EVI). The geochemical analysis revealed substantial exceedances of background concentrations for several elements, particularly Zn, Cu and Pb, indicating pronounced anthropogenic alteration of the soil cover. The concentrations of these elements were markedly higher than the background concentrations measured at the reference site, which is consistent with their technogenic origin. Similar contamination patterns are commonly reported at waste disposal sites, where landfill leachate constitutes an important pathway for the introduction of heavy metals into the soil environment [
7,
9,
10]. The concentration of heavy metals in the central part of the landfill may also be related to the morphology of the landfill body and historical waste-storage patterns. The central zone corresponds to the main technogenic body, where the thickness of waste deposits is greatest and where long-term accumulation of municipal waste was most intensive. The absence of engineered liners and leachate collection systems, together with the heterogeneous structure of the waste body, may have favored contaminant retention, localized leachate formation and vertical or lateral redistribution of metals within the central part of the landfill. These morphological and operational characteristics help explain why the strongest geochemical anomaly and the lowest NDVI/EVI values were observed in the central zone, while peripheral areas showed lower contamination levels and more favorable vegetation conditions.
To obtain an integrated assessment of contamination intensity, the geochemical indices I
geo, Z
c and RI were calculated. The I
geo values indicated pronounced enrichment in Zn and Pb, which represent the main contributors to the geochemical anomaly identified in the landfill soils. According to Müller’s classification, these elements fell within moderate to strong pollution categories, whereas Mn and Ni showed lower index values. This pattern is consistent with differences in elemental accumulation and distribution within the soil environment [
5,
52].
The integrated contamination index indicated a high degree of technogenic transformation of the soil cover. Elevated Z
c values resulted from the combined contribution of several elements, reflecting the presence of a stable polymetallic anomaly. The RI further showed that Zn and Pb contributed most strongly to the overall ecological risk, owing to their high concentrations and toxic-response weighting within the index formulation [
51].
Time-series analysis of NDVI and EVI for 2017–2025 revealed marked spatial heterogeneity in vegetation density and productivity across the landfill. Areas with elevated heavy metal concentrations generally showed lower vegetation-index values, indicating less favorable vegetation conditions. However, these patterns should be interpreted as spatial associations because NDVI and EVI may also reflect other landfill-related stressors, including substrate compaction, moisture limitation, soil texture, reclamation cover heterogeneity, microrelief and possible landfill gas emissions.
It should also be noted that the geochemical data represent the contamination pattern measured during a specific field campaign, whereas NDVI and EVI describe multi-year vegetation dynamics. Therefore, these datasets were not interpreted as directly comparable temporal series. Instead, they were integrated to assess whether landfill zones characterized by higher contamination levels also showed persistently less favorable vegetation conditions over time. Although the satellite images were selected from the same July–August seasonal window of peak vegetation activity to improve comparability, interannual climatic variability, especially differences in precipitation and moisture availability, as well as slight differences between image acquisition dates and soil sampling dates, may still have influenced NDVI and EVI values and should be considered in future monitoring studies.
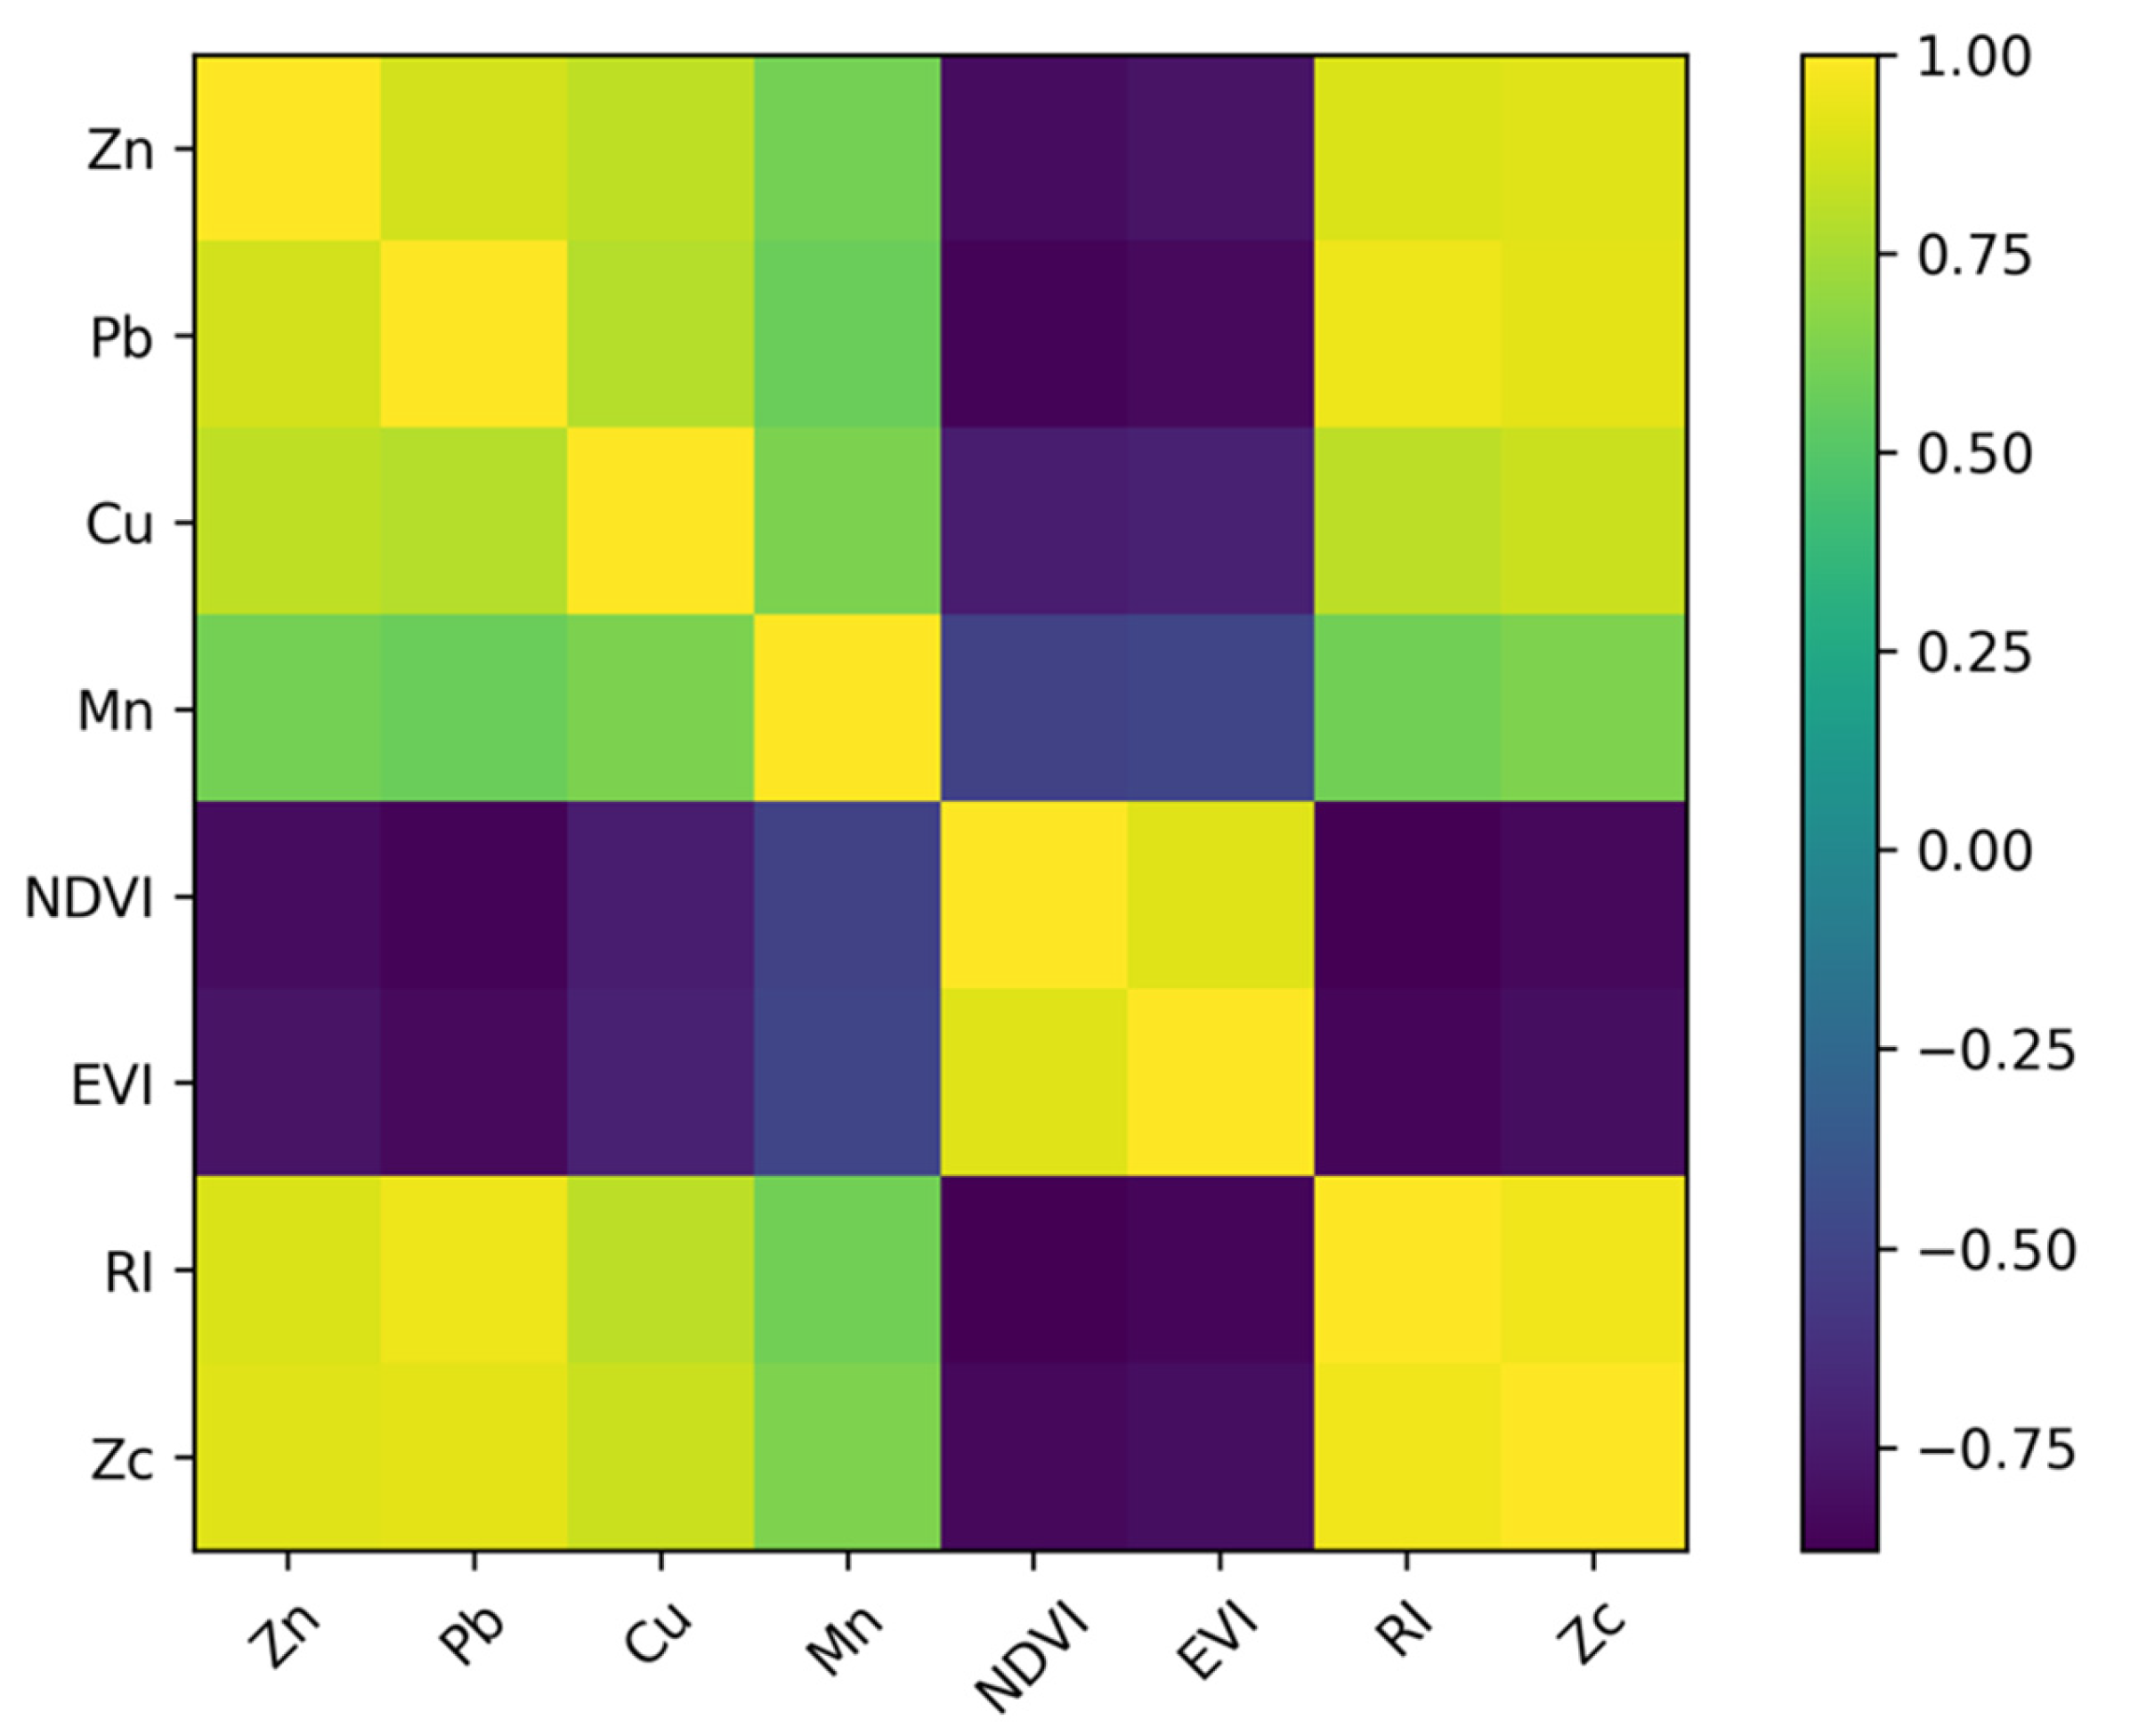
Pearson correlation analysis showed negative associations between soil contamination indicators and vegetation indices (
Table 6,
Figure 6). NDVI exhibited negative correlations with RI (r ≈ −0.88), Pb (r ≈ −0.86) and Zn (r ≈ −0.82), while similar, although slightly weaker, associations were observed for EVI.
Similar, though slightly weaker, associations were observed for EVI. The corresponding
p-values were below 0.01 (
Table 7), although these results should be interpreted cautiously given the limited number of sampling points and the exploratory nature of the analysis [
56].
The obtained p-values (<0.01) indicate statistically significant associations between vegetation indices and contamination indicators within the studied dataset. These negative associations are consistent with less favorable vegetation conditions in areas characterized by higher contamination levels, but they should not be interpreted as evidence that heavy metals alone caused the observed vegetation patterns.
As a complementary non-parametric check, Spearman’s rank correlation was also calculated. This analysis was performed in accordance with the functional zoning of the landfill and confirmed the same monotonic direction of association observed in the Pearson correlations: zones with higher RI, Zc, Zn and Pb values corresponded to lower NDVI and EVI values. Therefore, the non-parametric analysis supported the spatial consistency of the observed pattern. However, it was interpreted as complementary evidence rather than as an independent basis for formal statistical inference.
A strong positive correlation was also observed between NDVI and EVI (r ≈ 0.91), indicating broad consistency between the two remote sensing indices used to assess vegetation condition. At the same time, NDVI appeared to show a somewhat stronger response to the contamination gradient, whereas EVI may be less influenced by background and atmospheric effects under certain conditions [
42,
43].
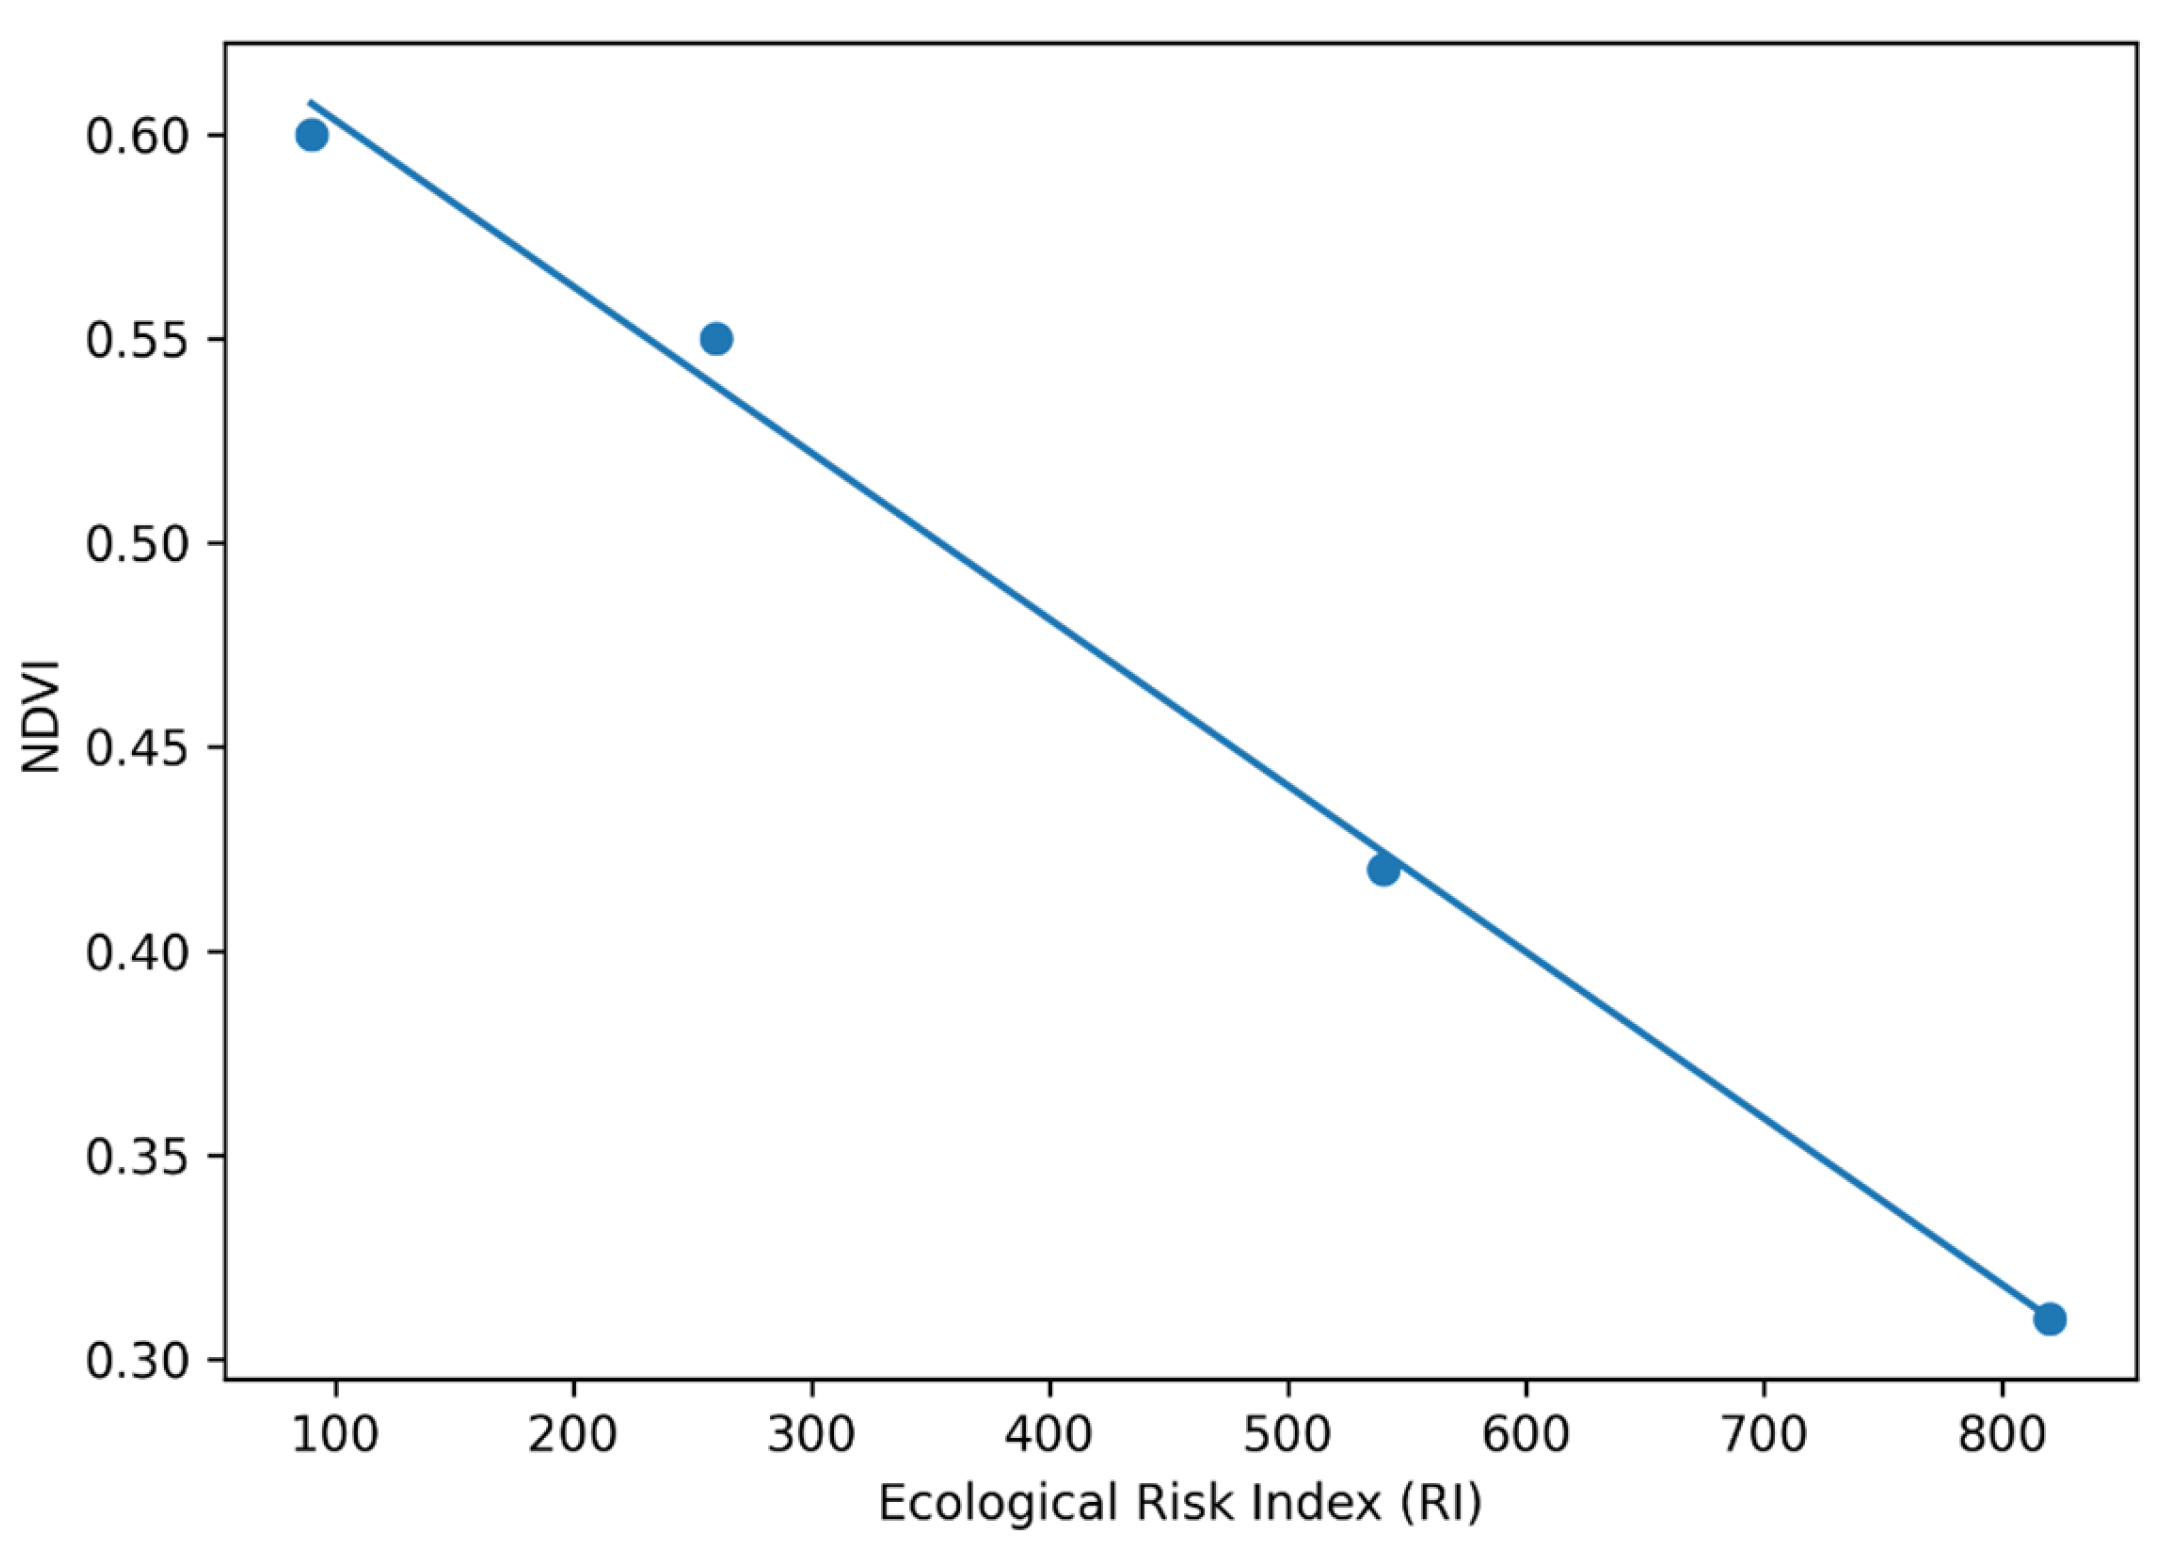
Further examination of the RI–NDVI relationship (
Figure 7) revealed a pronounced negative trend along the pollution gradient. The highest ecological risk and lowest vegetation indices were concentrated in the central part of the landfill, while peripheral zones approached background conditions.
The analysis revealed a pronounced negative association between RI and NDVI values. Higher RI values corresponded to lower NDVI values, indicating less favorable vegetation conditions within the landfill area. The highest RI values were recorded in the central areas of the landfill, where the lowest NDVI values were also observed. In contrast, peripheral zones, characterized by lower heavy metal concentrations, showed higher NDVI values approaching those of the background site.
This spatial co-occurrence suggests that ecological risk and vegetation conditions are related within the landfill system. However, the RI–NDVI relationship should be interpreted as an ecological association rather than as proof of a direct causal effect of heavy metals on vegetation decline.
The remotely sensed vegetation indices reflect not only overall productivity but also shifts in plant community composition along with the contamination gradient. A detailed floristic survey conducted on the same landfill documented 76 vascular plant species, predominantly ruderal and disturbance-tolerant taxa characteristic of semi-arid steppe environments [
17]. The most abundant species included
Artemisia absinthium,
Bassia scoparia and other pioneer taxa known for their high ecological plasticity and relative tolerance to heavy metal stress and nutrient-poor substrates. These tolerant species tend to dominate in the central, more contaminated zones where NDVI and EVI values are lowest. In contrast, peripheral areas with lower heavy metal loads support a slightly more diverse assemblage with higher representation of less stress-tolerant grasses and forbs. Such floristic shifts may contribute to the observed negative associations between contamination indicators, especially Zn and Pb and vegetation indices. The predominance of disturbance-tolerant pioneer species in the central landfill zones is consistent with reduced overall vegetation vigor and productivity, although this pattern may also reflect other landfill-related stressors such as substrate compaction, moisture limitation, soil heterogeneity and landfill gas emissions.
These findings suggest that soil contamination is one of several factors associated with spatial differences in vegetation productivity and community structure at the site. The results are consistent with previous studies documenting NDVI declines and shifts toward stress-tolerant species in technogenically disturbed areas [
36,
45,
58,
59,
60].
Although the observed patterns are internally consistent, several limitations should be considered when interpreting the results. First, the number of sampling points was limited and the small size of the functional groups restricted the statistical power of both parametric and non-parametric analyses. Therefore, the statistical results should be regarded as exploratory and site-specific. Background conditions were represented by a single reference sample used primarily for index calculation rather than for characterizing natural soil variability. Consequently, the calculated Igeo, Zc and RI values should be considered relative, site-specific indicators rather than absolute estimates of regional contamination levels. Second, sampling depth differed between the central and peripheral zones in accordance with substrate morphology and study objectives, which may limit strict quantitative comparability between zones. Third, the spatial resolution of Landsat 8 and 9 imagery (30 m, corresponding to approximately 900 m2 per pixel) represents an additional limitation, as it may not capture fine-scale heterogeneity, narrow transition zones, or small vegetation patches within the landfill. Despite the use of buffered extraction and quality filtering to reduce mixed-pixel effects, the NDVI/EVI results should be interpreted as indicators of broad spatial gradients and integrated vegetation condition rather than as high-resolution representations of microspatial variability. Accordingly, the identified relationships between geochemical indicators and vegetation indices should be interpreted primarily as spatial ecological associations within the landfill area rather than as direct evidence of causal relationships.
Despite these constraints, the integration of geochemical indexing, ecological risk assessment, multi-temporal remote sensing and floristic information may provide a useful complementary framework for post-closure monitoring of legacy landfills. The results highlight the long-term persistence of heavy metal contamination and its spatial association with less favorable vegetation recovery patterns even decades after site closure. This integrated approach may support the identification of zones with elevated ecological risk and reduced vegetation condition, ecological zoning of closed landfill territories, prioritization of reclamation measures, organization of long-term monitoring programs, assessment of vegetation recovery dynamics and future ecological risk modeling.




 ,
,