


Abstract
Wastewater surveillance emerged as a critical public health tool during the COVID-19 pandemic, enabling early detection of community-level pathogen circulation independent of clinical testing. Its ability to capture signals from both symptomatic and asymptomatic individuals highlighted the importance of optimizing sampling methodologies to improve sensitivity and reliability. A key question is whether the several-fold increase in SARS-CoV-2 detectability observed when using passive tampon swab sampling compared with paired grab samples also applies to other respiratory viruses, including influenza A (including its avian influenza H5N1 subtype), influenza B, and respiratory syncytial virus (RSV). We collected 24 h passive swab samples with same-day grab samples from Detroit sewersheds, concentrated and purified nucleic acids, and using RT-ddPCR, quantified respiratory syncytial virus, SARS-CoV-2, influenza A, influenza B, and H5N1 influenza A viruses using markers RSV, SC2, InfA, InfB, and H5, respectively. Samples testing positive for H5 (marker for H5N1 influenza A) were further analyzed by targeted PCR and amplicon sequencing. Across three sites, median 24 h swab:grab ratios of virus copies were 7.0 for RSV, 9.2 for SC2, 9.9 for InfA, and 3.6 for InfB. A 239 bp hemagglutinin sequence from a sample with a strong H5 signal (795 copies/10 mL) had 100% identity to avian influenza viruses from Canada geese. Twenty-four-hour swab sampling greatly improves viral detectability across diverse targets and enabled the first confirmed detection of H5 in Detroit wastewater. Combined with magnetic bead purification, the overall sensitivity gain over conventional PEG-NaCl-Qiagen methods is approximately 36-fold, enabling earlier warning of community pathogens than grab samples. By integrating 24 hour passive swab sampling with high-efficiency nucleic acid purification, we expand the sensitivity of wastewater surveillance to enable detection and confirmation of low-abundance pathogens like avian influenza (H5).
1. Introduction
Wastewater surveillance (WBS) has become a widely used method for public health epidemiology by enabling population-level monitoring of infectious diseases independent of clinical and over-the-counter at-home testing. The utility of wastewater surveillance was demonstrated globally during the COVID-19 pandemic, where wastewater measurements often provided earlier signals of community transmission than clinical case data, including in settings with vulnerable populations such as long-term care facilities [1]. It provides a noninvasive and cost-effective means of tracking disease circulation independent of clinical testing rates [2]. During the COVID-19 pandemic, WBS proved particularly valuable for providing early warning of outbreaks [1]. As interest grows in applying this approach to a broader range of respiratory and zoonotic pathogens, methodological sensitivity has become a central limitation, particularly for viruses that circulate at low abundance or are shed intermittently.
Most wastewater surveillance programs rely on grab sampling, which can underestimate viral presence due to temporal variability in shedding, wastewater flow, and matrix inhibition. In Detroit, our laboratory has focused on systematically improving the sensitivity of viral detection in community wastewater samples. Early studies demonstrated that replacing the commonly used PEG-NaCl-Qiagen purification method [3] with an automated magnetic bead purification system significantly improved recovery efficiency, yielding about 4.9-times-higher concentrations of SARS-CoV-2 markers N1 and N2 compared to the PEG-NaCl + Qiagen method for same-sample comparisons [4]. Similar improvements were also observed when the recovery of spiked-in Phi6 bacteriophage was tested in both field blanks and wastewater samples purified on the automated purification system [4].
To further enhance sensitivity, the laboratory introduced passive sampling using swabs (tampons) placed in sewers for 4–6 h to collect a more concentrated composite sample before purification. This approach yielded roughly 3.7 times more SARS-CoV-2 RNA than traditional grab samples collected on the same day [5,6]. When both improvements were combined—the magnetic bead purification and the swab-based sampling—the overall sensitivity improvement in the detection of SARS-CoV-2 markers was approximately 18-fold (=4.9 × 3.7), compared to conventional grab sampling and PEG-NaCl + Qiagen purification. However, whether these improvements generalize to other respiratory viruses, and whether longer passive deployment further enhances sensitivity, remained unknown.
These questions are particularly relevant for respiratory syncytial virus (RSV) and influenza viruses, which are shed into wastewater at lower and more variable levels than SARS-CoV-2 [7]. Influenza virus and RSV markers are therefore more likely to be missed by conventional grab sampling. RSV causes infections of the lower respiratory tract, contributing to significant hospitalization rates in infants and older adults worldwide [8,9]. Transmission of RSV in healthcare settings is under-reported [10] while early warning of RSV outbreaks in 2023–2024 and 2024–2025 might have helped hospital systems better prepare for those outbreaks [11].
Influenza virus has several subgroups and types, of which the present paper focuses on influenza A, influenza B, and the H5N1 variant of influenza A, commonly known as “bird flu” or avian influenza. Seasonal influenza A viruses are a major global public health challenge, causing substantial annual mortality and morbidity, particularly in young children, older adults, and people with underlying health conditions [12,13]. The H5N1 variant of influenza A, commonly known as bird flu, continues to pose a serious zoonotic threat [14]. While historically associated with outbreaks in birds, H5N1 has more recently been reported to have infected multiple mammalian species, including cattle, and has caused sporadic but severe human infections with high case fatality rates [15]. In Michigan, bird flu infections have been confirmed in dairy cattle, and in dairy farm workers [16,17]. Influenza B causes seasonal flu; localized outbreaks associated with influenza B viruses occur often (Koutsakos et al., 2016) [18] and new variants continually emerge [19]. In the USA, greater mortality due to influenza during 1997–2009 was caused by influenza B than by influenza A in 4 of 14 years [20]. Given the growing evidence that WBS can provide early warning of infectious disease circulation in communities, improving the sensitivity of wastewater detection of influenza A, its H5N1 variant, and RSV through swab-based monitoring may offer a valuable approach for early detection and tracking of these respiratory pathogens and the growing threat of human infections by avian influenza virus.
The present study sought to answer the following questions: (1) Would the sensitivity of detection using swabs be further enhanced with 24 h immersion? (2) Does the improved detection of SARS-CoV-2 mediated by swabs also occur for other viruses, including respiratory syncytial virus (RSV) and influenza viruses? And (3) could the avian influenza variant of influenza A, detected through the application of these advanced passive sampling methods, be eluted and confirmed in community wastewater in Detroit with these techniques?
2. Materials and Methods
2.1. Collection and Nucleic Acid Purification from Wastewater
Wastewater was collected by both grab sampling and 24 h passive tampon swabs (Tampax Pearl Regular Jumbo pack, Proctor & Gamble, Cincinnati, OH, USA (manufacturer); purchased from CVS, item #842425, Berkley, MI, USA) from three Detroit sewersheds by LimnoTech (Ann Arbor, MI, USA). The sampling sites for this study are described in previous publications [21] and include PA (referred to as AP when collected by swab, latitude 42.3361 N, longitude 83.2169 W, draining wastewater from Zip Code 48228); SG (GS when collected by swab, latitude 42.43516 N, longitude 82.97638 W, draining wastewater from Zip Code 48205), and FH (FX when collected by swab, 42.368093 N, 83.083433 W, draining Henry Ford Health System hospital and a small adjacent residential area in Zip Code 48202). The populations within these sewersheds are estimated at 4500, 12,500, and 10,000 people, respectively. The population in the FH/FX sewershed includes a large daily influx of staff and outpatients, in addition to patients and a small adjacent residential area. Samples used in this study for swab versus grab comparisons were collected between 14 January 2025 and 1 April 2025. Samples tested for the H5 avian flu marker for this study were collected from 25 February 2025 until 1 April 2025.
Sample collection procedures followed the methods described previously for both grab and swab sampling [5,6]. After removing the manhole cover, grab samples were collected by dipping a 250 mL Nalgene bottle attached to a long pole into the flowing wastewater stream. For tampon swab samples, tampons were housed in a perforated cylinder that was attached by steel cable to the manhole cover and immersed in the sewer on one day and then retrieved 24 h later. The swab was transferred to a sterile Whirlpak bag (Hach Company, Fisher Scientific, Part #501995586, Pittsburgh, PA, USA), put into a second bag, and stored on ice until delivered to the laboratory at Wayne State University within two hours of collection. Grab samples were usually collected between 8 and 10 am, in volumes of approximately 200 mL, of which, after mixing well, 10 mL was transferred to a 50 mL tube for nucleic acid purification, as described in the next paragraph. For the tampon swab samples, the only modification from prior work was that tampon swabs at these sites were retrieved after a 24 h deployment, instead of the 4–6 h retrieval used in the earlier study [5]. Tampon processing followed the “M2” elution method [5], in which the tampon is treated with 2 mL of elution buffer (EB; 0.5× TE (Invitrogen, Thermo Fisher Scientific lot #1609981 cat. #12090-015, San Diego, CA, USA) + 0.75% Tween-20 (Sigma-Aldrich, CAS #9005-64-5, St. Louis, MO, USA)) transferred (tampon, captured sewage in the tampon, and EB) to a 50 mL syringe, and then subjected to manual expression with high force applied to the syringe plunger to maximize fluid elution into a 50 mL collection tube. The total volume expressed from the tampon sample varied between 10 and 15 mL.
For nucleic acid purification, both wastewater and tampon eluate samples were processed using the Revvity (formerly PerkinElmer; now merged into Revvity Health Sciences, Waltham, MA, USA) Chemagic™ 360 automated magnetic bead-based extraction system, following the protocol described by [22]. The Chemagic™ 360 (catalog number, 2024-0020, purchased from PerkinElmer Health Sciences in 2021) with the 12-rod head (CMG-371, purchased in 2021 from PerkinElmer; this item and other supplies are listed with their current Revvity Health Sciences (Waltham, MA, USA) catalog numbers to assure reproducibility. Prior to loading onto the extraction instrument, wastewater samples (45 mL) or tampon eluates (10–15 mL) were subjected to 4696× g centrifugation for 15 min. Next, 10 mL of the resulting supernatant was transferred to a 50 mL tube containing Poly A RNA (7 µL, CMG842, Revvity Health Sciences, Waltham, MA, USA), Proteinase K (50 µL, CMG749, Revvity Health Sciences, Waltham, MA, USA), and Lysis Buffer 1 (8 mL, CMG749, Revvity Health Sciences, Waltham, MA, USA). The mixture was warmed to 55 °C for 30 min to ensure effective lysis and proteolytic digestion. Magnetic beads (50 µL, CMG749, Revvity Health Sciences, Waltham, MA, USA) were then added, followed by thorough mixing to allow nucleic acid binding.
The prepared samples were loaded onto the Chemagic™ 360, along with a corresponding set of 4 mL Sarstedt® receiving tubes filled with elution buffer (100 µL, CMG749, Revvity Health Sciences, Waltham, MA, USA). Automated extraction was controlled by the PerkinElmer Chemagic™ Viral10k 360 H12 prefilling drying protocol (VD210119.che Version 6.3.0.3, copyright 2000–2015), with a run time of approximately 75 min [22]. The purification process yielded an ~85 µL sample in elution buffer in the Sarstedt® collection tube, which was then transferred into a 1.5 mL Eppendorf Lo-Bind microcentrifuge tube (Fisher Scientific, Eppendorf Tubes®, cat. #022431021, Hanover Park, IL, USA) for immediate analysis and/or freezing at −80 °C for later measurements.
2.2. RT-ddPCR Analysis
Reactions were assembled in a PCR hood following Bio-Rad’s suggested protocol for RT-ddPCR using the Bio-Rad One-Step RT-ddPCR Advanced Kit for Probes on a Bio-Rad QX600/QX200 Droplet Digital system (Bio-Rad, Hercules, CA, USA). Viral targets were detected using the 5-plex respiratory kit for BioRad ddPCR (GT Molecular, cat. #100735, Fort Collins, CO, USA) and the H5-Influenza A duplex kit (GT Molecular, cat. #100700, Fort Collins, CO, USA). Markers measured by the 5-plex kit are RSV for respiratory syncytial virus, SC2 for SARS-CoV-2, InfA for influenza A, InfB for influenza B, and BCOV for a spiked-in bovine coronavirus. All markers had positive controls and exhibited no “bleed over” between markers with adjacent fluorophore emission wavelengths. We provide additional information from GT Molecular about the kit’s analytical selectivity in Section 1 of the Supplement. H5 is the marker for H5N1 and InfA is the marker for influenza A in the H5-influenza A duplex kit. For RT-ddPCR, a 16.5 µL reaction mix per reaction was prepared with the Bio-Rad One-Step RT-ddPCR Advanced Kit for Probes supermix (Bio-Rad, cat. #1864022, Hercules, CA, USA), including 2.2 µL reverse transcriptase, 5.5 µL supermix, 1.1 µL of 15 mM DTT, 1.1 µL of gene target primers-probe kit (according to instructions for each GT Molecular primer-probe kit), and 1.1 µL Nuclease-Free Water (Thermo Fisher, Scientific (Invitrogen) cat. #AM9932, Austin, TX, USA). To this reaction 5.5 µL of template nucleic acids purified on the ChemagicTM 360 was added for a final reaction mix of 22 µL, of which 20 µL was processed for each RT-ddPCR reaction.
RT-ddPCR reactions were made in triplicate for each sampling site and quality controls (positive, no-template, extraction, and processing controls) in a 96-well PCR plate. The plate was sealed with Pierceable Foil Heat Seal (Bio-Rad, cat. #1814040, Hercules, CA, USA) and the Bio Rad PX1 PCR Plate Sealer (Model #PX1 PCR Plate Sealer, Serial #770BR6267, Hercules, CA, USA) at 180 °C for 5 s. After sealing, the plate was mixed thoroughly on a vortex mixer and centrifuged for 1 min at 850× g on a microplate centrifuge (Thermo Fisher Scientific, Model #14955300, Waltham, MA, USA) and then transferred to the Automated Droplet Generator (QX200, Bio-Rad, Hercules, CA, USA). Upon completing generation of droplets according to the Bio-Rad instructions, the 96-well plate containing droplets was sealed with the PX1 PCR Plate Sealer for 5 s at 180 °C. Next, the plate was put in a Bio-Rad C1000 Thermo Cycler (Bio-Rad, Hercules, CA, USA) and PCR was initiated with the following settings: hold 25 °C for 3 min, reverse transcription 50 °C for 60 min, DNA polymerase activation at 95 °C for 10 min, 40 cycles of 95 °C (denaturation) for 30 s and 55 °C (annealing/extension) for 1 min, then 98 °C (DNA polymerase deactivation) for 10 min, and, finally, 4 °C (hold) until ready for droplet reading within 12 h.
The reactions on the 96-well plate were analyzed on the Bio-Rad QX600 Droplet Reader using Bio-Rad QuantaSoft (version 1.7.4.0917 (Bio-Rad, Hercules, CA, USA)) reader control and analysis software. Following droplet reading, threshold intensity values were set for each reaction and the data file was exported in comma-separated value (.csv) format for further analysis. Results were calculated in terms of number of copies of RT-ddPCR markers per 10 mL of the collected wastewater (or field blank) sample or per 10 mL of tampon eluate, as previously described [5]. The Limit of Detection (LOD) for detecting the RT-ddPCR targets was 70 copies/10 mL, corresponding to the count values for two positive droplets per reaction for our typical total droplets per sample of 17,000 droplets. Two positive droplets have been recommended as the Bio-Rad ddPCR LOD [23].
2.3. Amplification and Sequence Analysis of H5 Positive Samples
RT-PCR was used to amplify and sequence identifying regions of the influenza A segment 4 hemagglutinin (HA) gene in samples that had been measured to have high counts of the H5 marker with the above RT-ddPCR methods. To get a longer length of sequence of HA, we used two different primer sets to amplify overlapping sequences of the HA gene, illustrated in a typical reference sequence (PQ708857.1, HA gene in an influenza A virus from a Canada goose) in Figure S1. The primer and probe sequences, including citations, are given in the caption of Figure S1.
RT-PCR reactions used iTaq Universal SYBR Green One-Step Kit (cat. #1725150, Bio-Rad, Hercules, CA, USA). A reaction mix of 20 µL per reaction was prepared using 5 µL of nuclease-free water, 2 µL of ChemagicTM 360 purified RNA product, 10 µL of 2× iTaq Universal SYBR Green supermix and 0.25 µL of iScript reverse transcriptase (One-Step Kit components), and 0.6 µL each of forward and reverse primers. The thermal cycling program began with a reverse transcription step at 50 °C for 10 min, followed by 95 °C (initial denaturation) for 1 min, then amplification by 40 cycles of 95 °C (denaturation) for 10 s and 57 °C (annealing/extension) for 30 s, with fluorescence data acquisition at the end of each annealing/extension step. Following amplification, a melt curve was generated by moving the temperature up from 65 °C to 95 °C in 0.5 °C steps with fluorescence acquisition at each step, to confirm amplification specificity. Sanger sequencing in both directions was accomplished by Genewiz (South Plainfield, NJ, USA), using the same primers as were used for the RT-PCR. Examination of chromatogram data and alignment of resultant sequences was accomplished using Geneious Prime® 2025.1.2 (GraphPad Software LLC, Boston, MA, USA).
2.4. Statistics
Statistical analysis was done with GraphPad Prism (Version 9.4.1, GraphPad Software LLC, Boston, MA, USA), Excel, and online statistical tests (McNemar’s, https://www.graphpad.com/quickcalcs/mcnemar1/ accessed on 23 December 2025). The alpha value for statistical significance was 0.05. The concentrations of viral markers in copies/10 mL of wastewater or swab eluate were analyzed for normal and lognormal distributions with the Kolmogorov–Smirnov test and where needed for use of parametric statistics, logarithms of the data were calculated using a LOG10 function, prior to analysis. Statistical methods compared central measures (means or medians, as indicated) with parametric (ANOVA or paired t-tests), non-parametric or mixed methods analysis, as appropriate. Non-parametric or mixed methods statistics were used and graphics employed median and quartile ranges if the data or its logarithmic transformation did not have a normal distribution. Adjustments for multiple tests utilized post hoc tests suggested by GraphPad, or, when multiple paired t-tests were performed and p values for significance were adjusted for multiple tests by GraphPad’s Holm–Šídák method for stacked p values. The LOD of 70 copies/10 mL and the estimated copies in experimental samples were calculated by the Poisson statistic methods built into the Bio-Rad QuantaSoft program.
Statistical comparisons did not include samples where the counts were <100 copies/10 mL for the swabs, as swab values close to the LOD would have artificially reduced the effect ratio through comparisons to a fixed “LOD” value, likely larger than the actual copy number in the sample. For calculations that compared swab counts to grab counts, samples with amounts below LOD were given a value of half the LOD (35 copies/10 mL), as possibly representative of the average value of such “below detectable” samples.
3. Results
3.1. Swab Versus Grab Sample Detection
3.1.1. Frequency of Detection
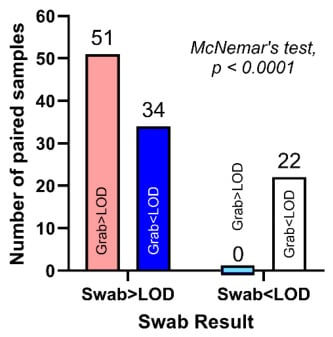
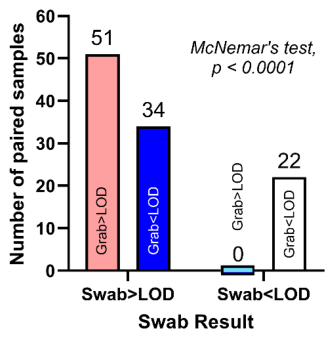
Viral markers RSV, SC2, InfA, and InfB for each of the four viruses studied here were detected more frequently with swabs than with grab samples. An analysis of 107 paired measurements showed no instances where a grab sample detected a viral marker and its paired swab sample was below the level of detection (LOD). In contrast, grab samples failed to detect viral markers in 34 out of 85 instances (i.e., 40% of the time) that swab samples were positive (Figure 1), representing a significant discordance between swab detection and grab sample detection (p < 0.0001, McNemar’s test). Swab samples detected RSV in 12 instances, SC2 in four instances, InfA in nine instances, and InfB in nine instances when the corresponding grab samples failed to detect a signal. Overall, as tabulated in Table S1, 85 of 107 swab samples (79%) were positive compared to only 51 of the 107 grab samples (48%), indicating a higher probability of detecting the viral markers with swab samples than with grab samples.
Figure 1.
Grab samples often failed to detect viral markers even when paired swab samples detected them. Bars represent the number of paired samples in each combination of results, and the number of samples in each combination is indicated above each bar. Blue bars represent discordant pairs; the pink bar represents when grab samples and swab samples were both above the Limit of Detection (>LOD); the white bar represents when both swab and grab samples were negative (<LOD). The blue bar straddling the x-axis represents 0. The marked asymmetry in discordant pairs (34 swab-positive/grab-negative vs. 0 swab-negative/grab-positive) resulted in a statistically significant McNemar test (p < 0.0001).
3.1.2. Copies Detected
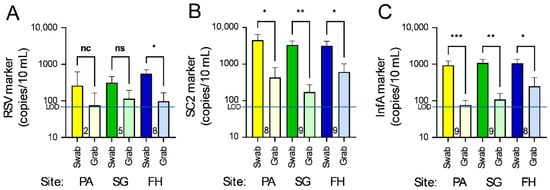
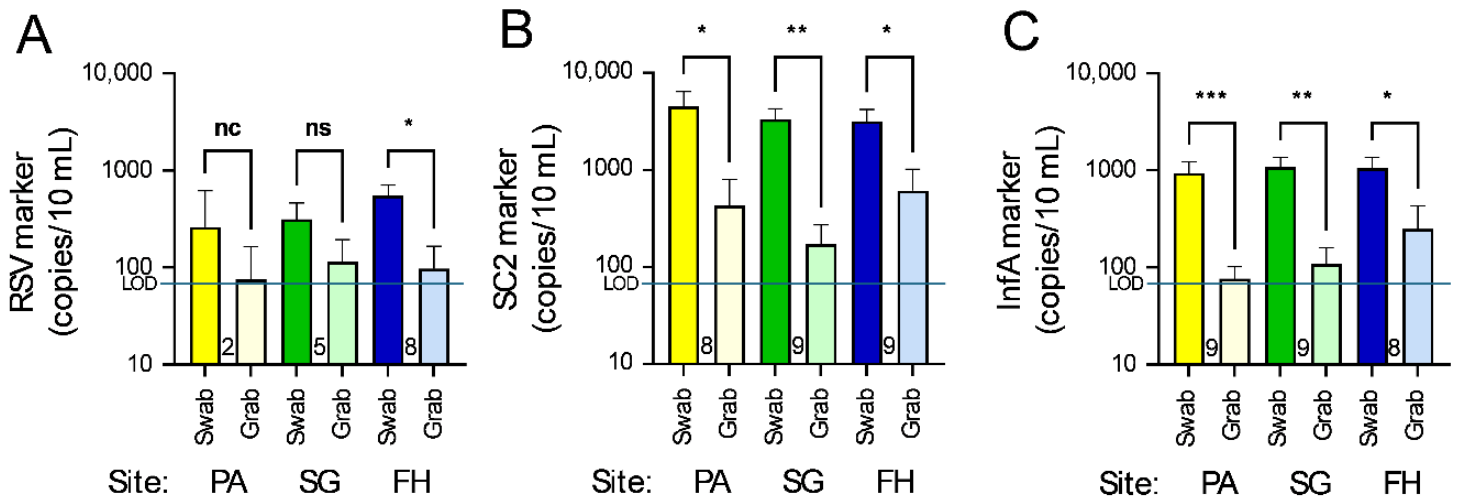
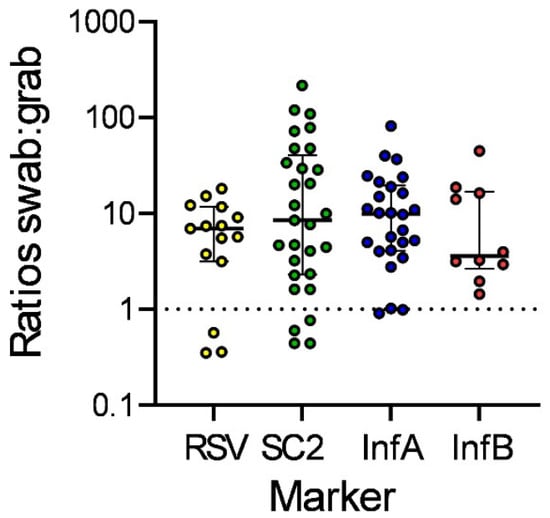
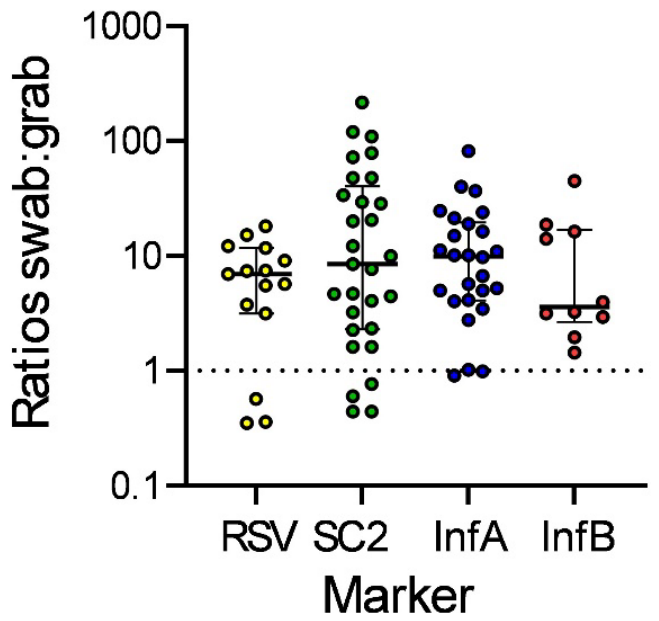
Swabs detected significantly higher amounts of the viral markers for most comparisons of RSV, SC2, and InfA markers than their paired grab samples, for which mean log-transformed values for swab and grab samples are shown in Figure 2. Values for individual pairs of samples are further illustrated in the Supplement (Figure S2). Statistical analysis utilized paired t-tests of swab v. paired grab counts for each virus, with p values adjusted for multiple comparisons with the Holm–Šídák method and further explanation in the Supplement (Table S1). Where no significance is shown, this may be partly due to low numbers of pairs that could be included (e.g., only five pairs or less in some groups); also, no paired t-test was calculated where the number of samples was only two pairs. Statistical comparisons did not include samples where the counts were <100 copies/10 mL for the swabs, which reduced the numbers of pairs more for RSV (Figure 2A) and InfB (shown in Figure S2) than for SC2 (Figure 2B) and InfA (Figure 2C). The mean counts were about one order of magnitude higher for the swab samples than for their corresponding paired grab samples, as further analyzed by calculating the pairwise ratios for each pair of grab and swab samples (Figure 3).
Figure 2.
Counts of (A) RSV, (B) SC2, and (C) InfA markers in samples collected by 24 h swabs and their paired grab samples. Counts/10 mL have been log-transformed to yield data with normal distributions (Kolmogorov–Smirnov test, p > 0.05). Bars represent mean log values and SEM; the horizontal lines represent the Limit of Detection (LOD). Paired swab and grab samples were compared by paired t-tests. To adjust for multiple comparisons, p values were adjusted using the Holm–Šídák method and are illustrated for each comparison as *, p < 0.05; **, p < 0.001; and ***, p < 0.0001. “ns” means not statistically significant; “nc” means the paired t-test was not calculated due to the “n” being too small (<4). PA, SG, and FH denote the sampling sites (see Materials and Methods for details). The numbers shown between each pair of bars indicate the number of paired samples (n) used for each statistical comparison.
Figure 3.
Ratios of counts for swab:grab pairs for each marker (all sites combined) for all pairs for which the number of copies of the marker in swabs was >100 copies/10 mL. Horizontal bars represent the medians and upper and lower interquartile ranges. The values that are <1 are due to unusually high grab sample counts, not low swab counts. The numbers of pairs for which ratios could be calculated were RSV, 15; SC2, 29; InfA, 26; InfB, 10.
3.1.3. Pairwise Ratios
The ratios of swab counts to grab sample counts for each virus and paired sample were calculated, using for this calculation the swab samples that had viral marker counts > 100 copies/10 mL, a total of 80 paired measurements that included 15 RSV pairs, 29 SC2 pairs, 26 InfA pairs, and 10 InfB pairs. We included grab samples that were below the Limit of Detection using a substitute value of half the Limit of Detection (35 copies/10 mL) for calculating the ratios of low count samples. The ratios for each virus are summarized in Figure 3. Overall, the median ratio for the 80 pairs included in this comparison was 7.4. The medians for each marker were 7.0, 9.2, 9.9, and 3.6, respectively, for RSV, SC2, InfA, and InfB.
3.2. Avian Influenza Virus Detection and Sequencing
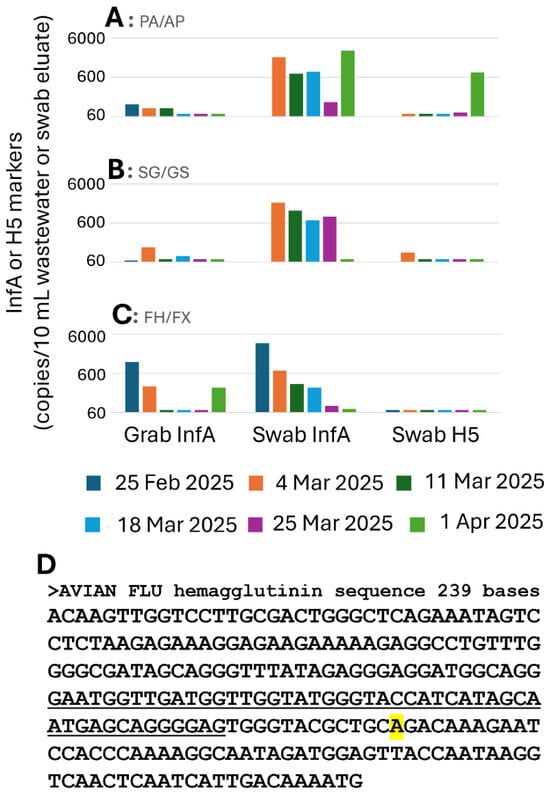
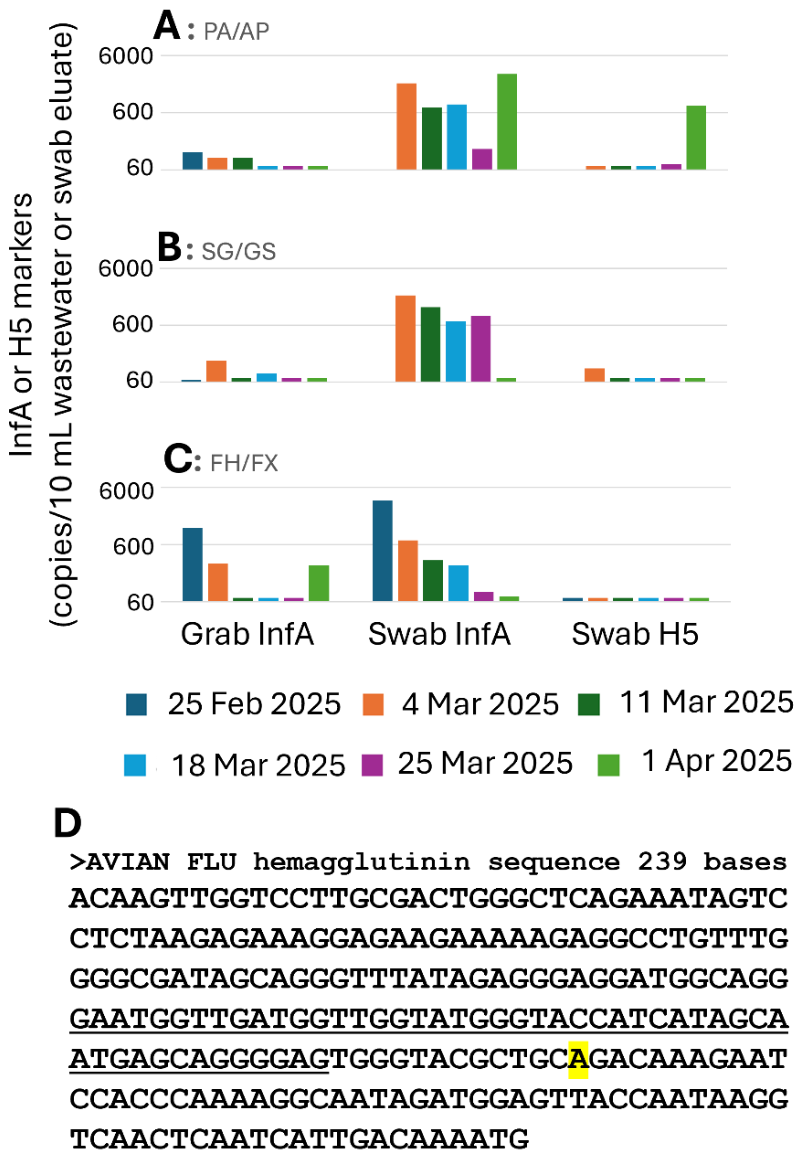
Preliminary selective testing using the H5 and H5/InfA test kit on grab samples of wastewater from multiple sewersheds in Detroit for several months prior to this study had sporadically detected low-level (70–100 copies/100 mL in 11 out of 97 samples tested) detections of H5 markers. To enhance our sensitivity of detection and potentially obtain enough virus for sequencing, we began systematic testing for H5 in swabs at the end of February 2025. As illustrated in Figure 4A–C, we tested 16 swab samples for both the H5 and InfA markers between 25 February 2025 and 1 April 2025; grab sample measurements of InfA collected from the same sites at the time of swab retrieval are also illustrated. The H5 marker was detected in three swab samples, at AP on 25 March and 1 April 2025 and at GS on 4 March 2025. The wastewater sample collected by 24 h swab from site AP on 1 April 2025 had the highest H5 level, with the duplex H5/InfA RT-ddPCR kit detecting 795 copies of H5 and 2850 copies of InfA per 10 mL swab eluent, while the corresponding PA grab sample from this site was below the LOD for InfA, thereby emphasizing the advantage of using the swabs.
Figure 4.
Detection of the H5 avian influenza virus marker in wastewater samples and sequencing of the hemagglutinin (HA) gene of sample 28AP250401M. Counts of InfA and H5 markers in wastewater and swabs from sewersheds (A) PA/AP, (B) SG/GS, and (C) FH/FX. The Limit of Detection, indicated by the shortest bars (e.g., all measurements of H5 in the FX swabs in (C)) was 70 copies/10 mL wastewater or tampon eluate. Where no bar is present (e.g., 25 February for GS), the sample was not analyzed. (D) Sequence assembled from the overlapping products of the two primer sets described in Methods. The overlapping region of the two RT-PCR products is underlined. Primer sequences at the 5′ and 3′ end of the sequence have been omitted. The sequence is 100% identical to PV336412.1, an avian influenza virus sequenced from a Canada goose and differs at one base, highlighted in yellow, from the avian influenza viral sequence PQ708857.1, illustrated in Figure S1.
The earlier samples had too little detectable target for confirming the RT-ddPCR result by sequencing; however, the H5 marker levels in the 1 April 2025 AP swab sample were >10-fold above the LOD. As a result, it was successfully subjected to RT-PCR amplification and subsequent sequencing of the amplicons to confirm the identity of the H5 marker. Assembling the overlapping sequences of the RT-PCR products of the two sets of primers described in the Methods yielded a 239 bp sequence (exclusive of primer sequences), illustrated in Figure 4D. The context of this sequence, in comparison to representative sequences of other influenza hemagglutinin sequences is shown in a neighbor-joining tree in Figure S3. This wastewater sequence is 100% identical to avian influenza viruses reported in GenBank, including from Canada geese (e.g., PV336412.1), though it differs in one base from the sequence in Figure S1 used to illustrate the primer design. Thus, the H5 signal in the 1 April 2025 swab sample from site AP has been unambiguously confirmed by sequencing as due, at least partly, to avian influenza virus. The illustrated sequence will be uploaded to GenBank prior to publication.
4. Discussion
This study demonstrates that methodological decisions in wastewater surveillance play a critical role in determining the detection of respiratory viruses present at low levels in the community. Beyond merely enhancing quantitative recovery, the integration of 24 h passive tampon swab sampling with automated magnetic bead-based purification fundamentally influences which signals can be detected in the first place. Wastewater viral surveillance data has applications in real-world scenarios, including triggering health department preventative measures and individual testing, like during the COVID-19 pandemic in response to SARS-CoV-2 detections [21]. In fact, this diversification of wastewater testing to viruses beyond SARS-CoV-2 came in response to direct requests from the Detroit Health Department and the Michigan Department of Health and Human Services. A historic and ongoing surveillance activity, dependent on wastewater analysis, tests for polio virus in many places and has triggered massive vaccination surges when polio virus has been detected in wastewater [24,25]. Early detection of new outbreaks for such applications could be improved by using the swab-based methods described here. Additionally, transporting samples as compact swabs rather than large volumes of wastewater to a central laboratory may be more practical and safer than approaches used in previously reported real-world wastewater virus detection efforts.
The novelty of the present study lies in several key advances. First, while passive swab sampling has previously been shown to improve SARS-CoV-2 detection, this study is the first to systematically demonstrate that extended (24 h) passive swab sampling enhances detection across multiple respiratory viruses, including RSV, influenza A, influenza B, and SARS CoV-2, using paired grab comparisons. Focusing on “detected v. not detected” the advantage of 24 h tampon swabs with our extraction and purification methods gives an even greater advantage than shown previously for shorter swab immersions [5]. Second, we show that extending swab deployment from several hours to 24 h substantially increases viral recovery, indicating continued adsorption over time rather than early saturation, an issue that had not been previously resolved experimentally. Third, by combining 24 h passive swab sampling with automated magnetic bead-based nucleic acid purification, we demonstrate 36-fold overall sensitivity improvement relative to commonly used grab sampling and PEG-based workflows [3]. Importantly, this enhanced sensitivity enabled the first confirmed detection and sequencing of avian influenza (H5) RNA in Detroit wastewater, a novel result made possible by the use of tampon swab sampling. This low-abundance zoonotic pathogen was not detected by paired grab samples, emphasizing the advantage of tampon swabs for “first detection” of new viruses in the community. Together, these findings establish 24 h passive swab sampling as a broadly applicable and highly sensitive approach for wastewater surveillance of respiratory and emerging zoonotic viruses, extending the scope of WBS beyond SARS-CoV-2, which was the focus of our previous studies. The findings therefore have implications not only for sensitivity, but also for how WBS can be used to provide early warnings for emerging and zoonotic pathogens.
The significantly higher recovery, on average, of viral markers for swab sampling over grab sampling across multiple viruses suggests that time-integrated collection is particularly well suited for respiratory pathogens, whose shedding into wastewater varies diurnally [26]. Detection of these targets may be influenced by daily human activity patterns [27] and the bottleneck in the transfer of viruses from the respiratory system to the gastrointestinal tract [28]. Pathogens such as influenza viruses and RSV may be shed intermittently and at lower concentrations than SARS-CoV-2 [7]. Therefore, grab samples may miss transient viral inputs entirely (e.g., the InfA marker at site PA on 1 April 2025, illustrated in Figure 4A) or, rarely, due to such variability, a grab sample may have a higher level of viral marker than its paired swab sample (note the small proportion of data points below the “equal counts” line in Figure 3, and the specific example on 1 April 2025 at site FH/FX, illustrated in Figure 4C). In contrast, 24 h swabs can integrate fluctuations in viral shedding over many hours, varying dilution, and flow dynamics.
Although the 24 h immersion of the swabs may delay reporting for a day (compared to a grab sample collected the day the swab is put in place), the fact that grab samples have “non-detects” 40% of the time that swabs have positive detections means that with weekly testing, the swab detection may often come, during a new outbreak, 6 days before a positive grab sample detection occurs. No instances were observed in which grab samples detected viruses that were not also detected by paired swabs, supporting the conclusion that passive swabs reduce false negatives compared to grab sampling under field conditions. Despite the 24 h delay, the swab method tested here is therefore more likely to give an early warning signal during a new outbreak.
Extending swab placement to 24 h demonstrated improved sensitivity of tampon swab sampling compared to grab samples with shorter (4–6 h) placement [5]. The higher virus marker count observed with longer swab immersion reflects cumulative adsorption over time in flowing sewage rather than an incubation-driven amplification effect. For SARS-CoV-2 measurements, the quantitative advantage of 24 h tampon swab placements was 7.4-fold over paired grab samples (Figure 3), which was double the 3.7-fold quantitative gain of SARS-CoV-2 capture observed previously with 4–6 h tampon swab immersion [5]. While the present findings indicate that viral capture beyond 6 h has not reached saturation, the fact that the median increase at 24 h is only double what it was for 6 h indicates that somewhere between 6 h and 24 h these tampon swabs may have reached a saturation point, and the method might be optimized in future experiments at intermediate time points, such as 12 h or 18 h placements. Nevertheless, these gains were observed consistently across multiple respiratory viruses, indicating that the benefit of longer duration tampon swab immersion is not virus-specific but reflects a general increase in viral capture over time.
The integration of swab sampling with automated magnetic bead purification is particularly impactful for low-abundance targets. The enhancement of purification efficiency previously demonstrated for our automated magnetic bead technology over the PEG-NaCl-Qiagen method that has been widely used in Michigan [3] averages about 4.9-fold [4]. When paired with the 24 h swab collection method the advantage over grab samples purified with the PEG-NaCl-Qiagen method is approximately 4.9 × 7.4 = 36.3-fold. Together, these approaches transform wastewater from a challenging, variable inhibitor-rich matrix into a sample type capable of supporting sensitive molecular detection and sequencing. This has practical consequences for public health laboratories seeking to expand surveillance beyond high-prevalence pathogens.
These methodological improvements were essential for detecting avian (H5) influenza A RNA in Detroit wastewater. Unlike seasonal respiratory viruses, H5 has occurred sporadically in birds and cows, and more recently in wastewater in which the fecal material is largely from humans. To date, only a small number of people have been infected by avian influenza, and no human-to-human transmission has been shown to occur. Currently, it is unknown whether H5 detections in wastewater reflect contamination from environmental sources washed into sewers in combined storm water/sanitary sewer systems, limited zoonotic deposits into the wastewater stream, or asymptomatic human infections rather than widespread human transmission. We further caution that wastewater detection alone only indicates the presence of specific environmental nucleic acid fragments of the genome and provides no information about viral viability, infectious risk, or the host source. Furthermore, the relationship of the quantitative measurements in wastewater and in humans or animals is tentative at best since sewers have numerous inputs from non-toilet activities such as showers, business use of water, storm sewers in combined sewers, etc. The most critical outcome is accurate detection of virus presence, for which swab sampling provides improved sensitivity. Both swab and grab samples can yield semiquantitative data that inform trends in viral levels over time (e.g., increasing or decreasing). While fully quantitative measures may be used to estimate the number of infected individuals within a sewershed, the approaches described here primarily support reliable detection and trend monitoring.
The fact that H5 signals were detected in swab samples but not in paired grab samples indicates that conventional wastewater methods may systematically underestimate or entirely miss such rare signals. From a surveillance perspective, the failure to detect by grab samples does not necessarily imply absence, but may instead reflect insufficient methodological sensitivity.
The confirmation of H5 through targeted amplification and sequencing further highlights the value of enhanced sampling for actionable public health surveillance. Sequencing is rarely obtained from wastewater when target concentrations are low, so the fact that we were able to confirm avian influenza sequences in Detroit through use of 24 h swab sampling demonstrates that this methodology can support not only detection but also genetic confirmation of specific virus variants.
The detections of H5 avian influenza virus markers in Detroit wastewater were the first such reports of the virus in the city; no cases of avian influenza in people have been reported in the metropolitan area. Unfortunately, the loss of funding due to an abrupt withdrawal of granted funds on 1 April 2025 reduced the possibility of intensive follow-up of the avian influenza observations in this paper. However, surveillance of a limited number of sites, including by tampon swab sampling at two of the three sites reported in this paper, did not detect InfA or its H5 variant in monthly collections between May and September 2025, and only moderate levels of InfA in November and December 2025, with no detections of the H5 marker. Whether avian influenza virus may recur again in a seasonally related or pandemic manner and whether it may be related to zoonotic or human sources is a question for future surveillance activity.
Future work will focus on extending 24 h passive swab-based surveillance across additional sewersheds, seasons, and wastewater system types to better define its performance under diverse real-world conditions. Applying a swab-sampling approach to a wider range of emerging and zoonotic pathogens, including pathogenic bacteria and fungi, and integrating sequencing or variant-specific assays when concentrations permit, will further enhance its value for public health preparedness. Continued refinement of sample processing workflows may support faster turnaround times and sustainable implementation in routine wastewater surveillance programs. Future research may also evaluate the use of alternative reusable or biodegradable passive sampling materials. The commercial tampons that we used and their applicators contain numerous plastics, synthetic fibers, and other non-biodegradable materials. Tampons with higher proportions of biodegradable content are available but untested as yet in this context. In any case, the environmental footprint of tampon swabs for environmental surveillance is minimal compared to their general consumer use and also compared to other consumables required for wastewater surveillance workflows. However, passive sampling can reduce overall resource use by minimizing site visits, eliminating autosamplers, and decreasing the volume of wastewater transported and processed. Future studies may test reusable or biodegradable passive sampling materials as alternatives and evaluate net environmental impacts.
In settings where human cases of infections are absent, sporadic, or underreported, 24 h swab-enhanced wastewater surveillance may provide an early environmental signal of pathogen circulation, possibly weeks before sample-time-dependent grab samples. Enhanced sensitivity therefore expands the scope of WBS from tracking established epidemics to identifying emerging threats at their earliest stages. For pathogens with pandemic potential, such as avian influenza virus, this capability could inform targeted surveillance, guide field investigations, and support proactive public health decision making.
5. Conclusions
This study demonstrates that 24 h passive tampon swab sampling, combined with magnetic bead-based nucleic acid purification, significantly improves viral detection sensitivity in wastewater compared to conventional grab sampling. Across the respiratory viruses examined, swab sampling yielded approximately 7.4-fold-higher viral counts than paired grab samples, and when integrated with magnetic bead purification, provided an overall sensitivity improvement of ~36-fold relative to the commonly used PEG-NaCl-Qiagen workflow.
Application of this optimized approach enabled the detection of H5 avian influenza viral RNA in Detroit wastewater, illustrating its capability to identify low-abundance and emerging zoonotic pathogens that may not be captured using standard methodologies. These findings emphasize that methodological enhancements in both sampling and purification can substantially influence the effectiveness of wastewater-based surveillance.
Future work will focus on extending this approach to a broader range of pathogens, refining sampling durations and processing workflows to improve turnaround time and evaluating alternative materials that may reduce environmental impact while maintaining analytical performance.
Supplementary Materials
The following supporting information can be downloaded at: https://www.mdpi.com/article/10.3390/environments13050242/s1, Figure S1. Alignment of primers used in this study with a portion of the H5 hemagglutinin (HA) gene. Figure S2. Paired t-test results for same site, same day pairs of swab and grab samples. Figure S3. Neighbor-joining tree and sequences of H5 (hemagglutinin gene) sequences. in a Detroit wastewater sample and previously published sequences. Table S1. Positive measurements (>LOD). Table S2. Adjusted p values for the multiple paired t-tests illustrated in Figure S2 [29,30].
Author Contributions
Methodology was developed by J.L.R., S.G., E.S.Z. and M.A.; Results were visualized by J.L.R. and S.G.; The original draft of the manuscript was written by J.L.R. and S.G. C.L.T. Supervision and Project administration; J.H. Methodology. No authors were precluded from accessing data in the study, and all authors accept responsibility for submitting the paper for publication. All authors have read and agreed to the published version of the manuscript.
Funding
Project ELCSNP-WS Wastewater Network Project of the Funding for wastewater analysis in this work was provided by Coronavirus Response Support Program—2024 and 2025, entitled “SARS-CoV-2 Epidemiology—Wastewater Evaluation and Reporting (SEWER) Network” from the Michigan Department of Health and Human Services (MDHHS).
Data Availability Statement
The data presented in this study are available upon request from the corresponding author.
Acknowledgments
The authors thank Rachel Willimas for assisting in the preparation of the graphical abstract and Ali Jomaa for assisting in the preparation of Figure S2 in the Supplementary Materials.
Conflicts of Interest
Carrie L. Turner and James Hartrick were employed by the company LimnoTech. The authors declare that this study received funding from ELCSNP-WS Wastewater Network Project. The funder was not involved in the study design, collection, analysis, interpretation of data, the writing of this article, or the decision to submit it for publication.
References
- Wang, W.; Li, R.; Chen, S.; Chen, L.; Jiang, Y.; Xiang, J.; Wu, J.; Li, J.; Chen, Z.; Wu, C. Wastewater-Based Surveillance of SARS-CoV-2 and Modeling of COVID-19 Infection Trends. Trop. Med. Infect. Dis. 2025, 10, 264. [Google Scholar] [CrossRef] [Scilit] [PubMed]
- Grassly, N.C.; Shaw, A.G.; Owusu, M. Global Wastewater Surveillance for Pathogens with Pandemic Potential: Opportunities and Challenges. Lancet Microbe 2025, 6, 100939. [Google Scholar] [CrossRef] [Scilit] [PubMed]
- Flood, M.T.; D’Souza, N.; Rose, J.B.; Aw, T.G. Methods Evaluation for Rapid Concentration and Quantification of SARS-CoV-2 in Raw Wastewater Using Droplet Digital and Quantitative RT-PCR. Food Environ. Virol. 2021, 13, 303–315. [Google Scholar] [CrossRef] [Scilit] [PubMed]
- West, N.W.; Vasquez, A.A.; Bahmani, A.; Khan, M.F.; Hartrick, J.; Turner, C.L.; Shuster, W.; Ram, J.L. Sensitive Detection of SARS-CoV-2 Molecular Markers in Urban Community Sewersheds Using Automated Viral RNA Purification and Digital Droplet PCR. Sci. Total Environ. 2022, 847, 157547. [Google Scholar] [CrossRef] [Scilit]
- Alamin, M.; Oladipo, P.; Hartrick, J.; Islam, N.; Bahmani, A.; Turner, C.L.; Shuster, W.; Ram, J.L. Improved Passive Sampling Methods for Wastewater to Enable More Sensitive Detection of SARS-CoV-2 and Its Variants. Sci. Total Environ. 2024, 950, 175044. [Google Scholar] [CrossRef] [Scilit]
- West, N.W.; Hartrick, J.; Alamin, M.; Vasquez, A.A.; Bahmani, A.; Turner, C.L.; Shuster, W.; Ram, J.L. Passive Swab versus Grab Sampling for Detection of SARS-CoV-2 Markers in Wastewater. Sci. Total Environ. 2023, 889, 164180. [Google Scholar] [CrossRef] [Scilit]
- Toribio-Avedillo, D.; Gómez-Gómez, C.; Sala-Comorera, L.; Rodríguez-Rubio, L.; Carcereny, A.; García-Pedemonte, D.; Pintó, R.M.; Guix, S.; Galofré, B.; Bosch, A.; et al. Monitoring Influenza and Respiratory Syncytial Virus in Wastewater. Beyond COVID-19. Sci. Total Environ. 2023, 892, 164495. [Google Scholar] [CrossRef] [Scilit]
- Li, Y.; Wang, X.; Blau, D.M.; Caballero, M.T.; Feikin, D.R.; Gill, C.J.; Madhi, S.A.; Omer, S.B.; Simões, E.A.F.; Campbell, H.; et al. Global, Regional, and National Disease Burden Estimates of Acute Lower Respiratory Infections Due to Respiratory Syncytial Virus in Children Younger than 5 Years in 2019: A Systematic Analysis. Lancet 2022, 399, 2047–2064. [Google Scholar] [CrossRef] [Scilit]
- Nowalk, M.P.; D’Agostino, H.; Dauer, K.; Stiegler, M.; Zimmerman, R.K.; Balasubramani, G.K. Estimating the Burden of Adult Hospitalized RSV Infection Including Special Populations. Vaccine 2022, 40, 4121–4127. [Google Scholar] [CrossRef] [Scilit]
- Gettler, E.B.; Talbot, H.K.; Zhu, Y.; Ndi, D.; Mitchel, E.; Markus, T.M.; Schaffner, W.; Harris, B.; Talbot, T.R. Respiratory Syncytial Virus: An under-Recognized Healthcare-Associated Infection. Infect. Control Hosp. Epidemiol. 2025, 46, 611–615. [Google Scholar] [CrossRef] [Scilit]
- Dewey, G.; Meyer, A.G.; Garcia, R.G.; Santillana, M. Uncovering the Post-Pandemic Timing of Influenza, RSV, and COVID-19 Driving Seasonal Influenza-like Illness in the United States: A Retrospective Ecological Study. Lancet Reg. Health Am. 2026, 55, 101359. [Google Scholar] [CrossRef] [Scilit] [PubMed]
- Hannaford, A.; Aleissa, M.; Sherman, A.C. Update on Influenza. Am. J. Med. Sci. 2026, 371, 124–132. [Google Scholar] [CrossRef] [Scilit] [PubMed]
- Uyeki, T.M.; Hui, D.S.; Zambon, M.; Wentworth, D.E.; Monto, A.S. Influenza. Lancet 2022, 400, 693–706. [Google Scholar] [CrossRef] [Scilit] [PubMed]
- Lee, A.J.; Carson, S.; Reyne, M.I.; Marshall, A.; Moody, D.; Allen, D.M.; Allingham, P.; Levickas, A.; Fitzgerald, A.; Bell, S.H.; et al. Wastewater Monitoring of Human and Avian Influenza A Viruses in Northern Ireland: A Genomic Surveillance Study. Lancet Microbe 2024, 5, 100933. [Google Scholar] [CrossRef] [Scilit]
- Krammer, F.; Hermann, E.; Rasmussen, A.L. Highly Pathogenic Avian Influenza H5N1: History, Current Situation, and Outlook. J. Virol. 2025, 99, e02209-24. [Google Scholar] [CrossRef] [Scilit]
- Morse, J.; Coyle, J.; Mikesell, L.; Stoddard, B.; Eckel, S.; Weinberg, M.; Kuo, J.; Riner, D.; Margulieux, K.; Stricklen, J.; et al. Influenza A(H5N1) Virus Infection in Two Dairy Farm Workers in Michigan. N. Engl. J. Med. 2024, 391, 963–964. [Google Scholar] [CrossRef] [Scilit]
- Rothman, R.E.; Fenstermacher, K.Z.J.; Pekosz, A. Outbreak of Highly Pathogenic Avian Influenza A(H5N1) Viruses in U.S. Dairy Cattle and Detection of Two Human Cases—United States, 2024. Ann. Emerg. Med. 2024, 84, 441–444. [Google Scholar] [CrossRef] [Scilit]
- Koutsakos, M.; Nguyen, T.H.; Barclay, W.S.; Kedzierska, K. Knowns and Unknowns of Influenza B Viruses. Future Microbiol. 2016, 11, 119–135. [Google Scholar] [CrossRef] [Scilit]
- Din, G.U.; Hasham, K.; Amjad, M.N.; Hu, Y. Natural History of Influenza B Virus—Current Knowledge on Treatment, Resistance and Therapeutic Options. Curr. Issues Mol. Biol. 2023, 46, 183–199. [Google Scholar] [CrossRef] [Scilit]
- Matias, G.; Taylor, R.; Haguinet, F.; Schuck-Paim, C.; Lustig, R.; Shinde, V. Estimates of Mortality Attributable to Influenza and RSV in the United States during 1997–2009 by Influenza Type or Subtype, Age, Cause of Death, and Risk Status. Influenza Other Respir. Viruses 2014, 8, 507–515. [Google Scholar] [CrossRef] [Scilit]
- Ram, J.L.; Shuster, W.; Gable, L.; Turner, C.L.; Hartrick, J.; Vasquez, A.A.; West, N.W.; Bahmani, A.; David, R.E. Wastewater Monitoring for Infectious Disease: Intentional Relationships between Academia, the Private Sector, and Local Health Departments for Public Health Preparedness. Int. J. Environ. Res. Public Health 2023, 20, 6651. [Google Scholar] [CrossRef] [Scilit] [PubMed]
- Vasquez, A.A.; West, N.W.; Bahmani, A.; Ram, J.L. Rapid and Direct Method to Extract SARS-CoV-2 RNA from Municipal Wastewater Using the ChemagicTM 360 12-Rod Head Platform V1. 2021. Available online: https://www.protocols.io/view/rapid-and-direct-method-to-extract-sars-cov-2-rna-e6nvwkp32vmk/v1 (accessed on 15 April 2026).
- Dong, L.; Zhou, J.; Niu, C.; Wang, Q.; Pan, Y.; Sheng, S.; Wang, X.; Zhang, Y.; Yang, J.; Liu, M.; et al. Highly Accurate and Sensitive Diagnostic Detection of SARS-CoV-2 by Digital PCR. Talanta 2021, 224, 121726. [Google Scholar] [CrossRef] [Scilit] [PubMed]
- Odoom, J.K.; Dzotse, E.K.; Nii-Trebi, N.I.; Opare, D.; Akyereko, E.; Attiku, K.; Duker, E.O.; Eshun, M.; Boahene, B.B.; Gberbi, E.; et al. Outbreak Response to Circulating Vaccine-Derived Poliovirus in Three Northern Regions of Ghana, 2019. BioMed Res. Int. 2024, 2024, 5515777. [Google Scholar] [CrossRef] [Scilit] [PubMed]
- Shaikh, M.S.; Faiyazuddin, M.; Ali, S.S.; Ansari, I.H.; Sah, S.; Mehta, R. Silent Spread of Poliovirus Type 2 Variant (cVDPV) in Gaza. Egypt. J. Intern. Med. 2025, 37, 73. [Google Scholar] [CrossRef] [Scilit]
- Ahmed, W.; Bertsch, P.M.; Bibby, K.; Haramoto, E.; Hewitt, J.; Huygens, F.; Gyawali, P.; Korajkic, A.; Riddell, S.; Sherchan, S.P.; et al. Decay of SARS-CoV-2 and Surrogate Murine Hepatitis Virus RNA in Untreated Wastewater to Inform Application in Wastewater-Based Epidemiology. Environ. Res. 2020, 191, 110092. [Google Scholar] [CrossRef] [Scilit]
- Lowry, S.A.; Wolfe, M.K.; Boehm, A.B. Respiratory Virus Concentrations in Human Excretions That Contribute to Wastewater: A Systematic Review and Meta-Analysis. J. Water Health 2023, 21, 831–848. [Google Scholar] [CrossRef] [Scilit]
- Wang, Y.; Wang, D.; Zhang, L.; Sun, W.; Zhang, Z.; Chen, W.; Zhu, A.; Huang, Y.; Xiao, F.; Yao, J.; et al. Intra-Host Variation and Evolutionary Dynamics of SARS-CoV-2 Populations in COVID-19 Patients. Genome Med. 2021, 13, 30. [Google Scholar] [CrossRef] [Scilit]
- Wolfe, M.K.; Duong, D.; Shelden, B.; Chan, E.M.G.; Chan-Herur, V.; Hilton, S.; Paulos, A.H.; Xu, X.-R.S.; Zulli, A.; White, B.J.; et al. Detection of Hemagglutinin H5 Influenza A Virus Sequence in Municipal Wastewater Solids at Wastewater Treatment Plants with Increases in Influenza A in Spring, 2024. Environ. Sci. Technol. Lett. 2024, 11, 526–532. [Google Scholar] [CrossRef] [Scilit]
- Keller, M.; Llewellyn, A. Singleplex Digital PCR Testing of Influenza A, H1pdm09, H3, and H5 from Wastewater (Version 1). Centers for Disease Control and Prevention. CDC LB-177 2025, R-OD, 21 pages.
Disclaimer/Publisher’s Note: The statements, opinions and data contained in all publications are solely those of the individual author(s) and contributor(s) and not of MDPI and/or the editor(s). MDPI and/or the editor(s) disclaim responsibility for any injury to people or property resulting from any ideas, methods, instructions or products referred to in the content. |
© 2026 by the authors. Licensee MDPI, Basel, Switzerland. This article is an open access article distributed under the terms and conditions of the Creative Commons Attribution (CC BY) license.