


Abstract
Effective management of wastewater discharges requires understanding the spatial distribution of pollutants both within engineered infrastructure and in receiving environments. However, spatial data sparsity constrains comprehensive assessment. This critical review examines the role of Geographic Information Systems (GIS) and statistical interpolation techniques in bridging these data gaps for wastewater-derived pollutants. Moving beyond a simple compilation of methods, this paper provides a synthesizing framework that categorizes and evaluates interpolation techniques-from deterministic and geostatistical approaches to emerging machine learning (ML) and hybrid models- based on their ability to address specific challenges in wastewater systems. A key contribution is a systematic review and meta-analysis following PRISMA guidelines, synthesizing evidence from 22 studies that directly compare interpolation methods for wastewater-relevant parameters (BOD5, COD, nutrients, heavy metals) in both engineered systems and impacted water bodies. Results indicate that machine learning methods significantly outperform traditional approaches, with a pooled 21% reduction in RMSE compared to Ordinary Kriging (95% CI: 15–27%). However, subgroup analyses reveal context dependency: ML advantages are most pronounced for organic pollutants (29% reduction) and data-rich environments (27% reduction with n > 100), while geostatistical methods remain competitive for physical parameters (8% reduction, non-significant) and data-sparse scenarios (12% reduction with n < 50). Co-Kriging achieves 15% RMSE reduction over Ordinary Kriging when auxiliary variables are available. The review explores applications in pollutant tracking, infrastructure planning, and environmental impact assessment, highlighting how integration of real-time sensor data (IoT) and remote sensing is transforming static maps into dynamic monitoring tools. Finally, a forward-looking research roadmap is presented, emphasizing hybrid modeling frameworks, digital twin integration, and improved uncertainty communication for decision support. By quantitatively synthesizing the current state-of-the-art and identifying critical knowledge gaps, this review aims to guide future research towards more intelligent, adaptive, and reliable spatial assessments of wastewater-derived pollutants.
1. Introduction
1.1. The Challenge of Wastewater Pollution
Wastewater pollution poses a significant environmental challenge in urban, peri-urban, and industrial areas worldwide. As cities expand and industrial activities increase, the volume and complexity of wastewater discharges have surged, posing risks to public health, aquatic biodiversity, and the sustainability of freshwater resources. The accurate spatial and temporal characterization of wastewater quality parameters-including biochemical oxygen demand (BOD5), chemical oxygen demand (COD), total suspended solids (TSS), oil and grease, nutrients (nitrogen and phosphorus), heavy metals, and microbial contaminants—is crucial for effective environmental monitoring, infrastructure planning, and regulatory compliance [1,2]. While these parameters are fundamental to water quality assessment generally, their particular importance in wastewater management stems from regulatory compliance requirements, treatment process control, and environmental impact assessment of effluent discharges.
This review focuses specifically on the spatial characterization of pollutants originating from wastewater sources- including municipal, industrial, and agricultural effluents- as they propagate through engineered collection systems, treatment facilities, and ultimately into receiving water bodies and groundwater. It is essential to distinguish between three related but distinct contexts: (1) spatial variability within wastewater infrastructure (sewer networks, treatment plants), (2) wastewater impacts on ambient water quality (rivers, lakes, coastal zones, groundwater), and (3) general water quality assessment independent of wastewater sources. This review addresses the first two contexts while explicitly excluding the third.
1.2. The Role of Spatial Interpolation in Wastewater Management
While regulatory compliance monitoring typically focuses on specific points of interest (e.g., treatment plant influent/effluent, permitted discharge locations), many wastewater management challenges require understanding spatial patterns across continuous domains. These include:
- Identifying sources of illicit discharges within sewer networks
- Characterizing contaminant plumes from combined sewer overflows
- Assessing groundwater contamination from leaking infrastructure
- Designing optimal monitoring networks
- Supporting digital twin development for scenario planning
- Filling gaps in historical data for site characterization
- Communicating spatial patterns of contamination risk to stakeholders
Spatial interpolation techniques offer a means to estimate conditions at unmonitored locations, transforming discrete point measurements into continuous surfaces that reveal patterns invisible in raw data. When integrated with GIS, these methods enable evidence-based decision-making for infrastructure management, environmental protection, and public health.
1.3. Scope and Objectives of This Review
This review provides a critical synthesis of GIS-based spatial interpolation methods applied to wastewater-derived pollutants. The contribution is distinguished from prior reviews by:
- Defining a clear scope: A focus is placed on spatial interpolation of pollutants originating from wastewater sources, whether within engineered infrastructure or in receiving environments. General water quality assessment unrelated to wastewater impacts is explicitly excluded.
- Providing mechanistic explanations: Beyond listing methods, explanations are provided for why specific interpolation techniques are suited to particular wastewater parameters and spatial contexts, grounded in the statistical properties of each method and the physical processes governing pollutant distribution.
- Quantifying comparative performance: A systematic review and meta-analysis following PRISMA guidelines [3] is conducted to synthesize evidence on prediction accuracy across method categories, with rigorous inclusion criteria limited to wastewater-relevant studies.
- Identifying knowledge gaps: A structured research roadmap informed by the quantitative findings is proposed.
This is not a review of in-plant process control, real-time SCADA systems, or hydrodynamic water quality models (e.g., HEC-RAS, MIKE, WASP), though integration with these tools is discussed where relevant.
Monitoring the spatial variability of contaminants is essential for effective wastewater treatment and regulatory compliance. For system diagnostics, maintenance, and process optimization, understanding spatial variability within infrastructure is valuable- for example, tracing an illicit industrial discharge by analyzing spatial COD gradients along a sewer line, or characterizing dissolved oxygen distribution across an aeration basin. Traditional wastewater monitoring relies on periodic field sampling and laboratory analyses conducted at specific locations, such as the inflow and outflow of treatment plants, sewer networks, and nearby surface water bodies [4]. However, the high costs, logistical complexities, and labor intensity associated with extensive water quality sampling often lead to datasets that are spatially and temporally sparse. These limitations hinder utilities and regulatory agencies from making timely, evidence-based decisions and restrict the spatial resolution of pollution assessments [5].
1.4. Distinguishing Statistical Characterization from Process Optimization
Applying statistical approaches enables researchers and engineers to comprehensively characterize the dynamics of wastewater composition. This is exemplified by the use of multivariate statistical methods- such as principal component analysis (PCA) and factor analysis- to identify underlying patterns in wastewater quality parameters and quantify the significant properties of influent and effluent streams in wastewater treatment plants [6,7]. It is important to distinguish these characterization-focused statistical approaches from mechanistic process models (e.g., Activated Sludge Models, Benchmark Simulation Model No. 2) that are specifically designed for treatment process optimization and control system design [8,9]. While statistical methods reveal patterns and dependencies in wastewater quality data, mechanistic models simulate the biological and chemical processes within treatment units for operational optimization. Both approaches are valuable but serve different purposes; this review focuses on the former- spatial characterization through interpolation- while acknowledging the complementary role of process models.
1.5. GIS and Spatial Interpolation: Definitions and Scope
GIS platforms offer powerful tools for storing, visualizing, and analyzing spatial data; however, statistical interpolation is essential for estimating values between sampled points to create continuous representations of wastewater quality parameters across spatial domains [10,11]. These interpolated maps enable the identification of pollution hotspots, optimization of monitoring networks, and informed policymaking.
Spatial interpolation techniques offer a means to estimate conditions at unmonitored locations, transforming point data from limited sensors into continuous profiles that can reveal hidden patterns. This addresses the practical reality that installing sensors at every meter of pipe or every cubic meter of a water body is cost-prohibitive, making spatial inference an essential tool for cost-effective environmental assessment.
GIS has become an essential tool for managing environmental data, especially in wastewater applications, where challenges arise from limited continuous data coverage. Statistical interpolation methods, such as inverse distance weighting (IDW) and geostatistical Kriging, allow for the estimation of wastewater parameters at un-sampled sites by analyzing spatial dependence in available data [10,12]. These modelling and statistical methods transform point measurements into continuous surface maps, revealing pollutant distribution and pinpointing critical areas for intervention.
Future advancements are likely to integrate GIS with interpolation methods to enhance the mapping of wastewater-derived pollutants. Recent developments in geospatial analytics and data science, including the use of ancillary datasets and machine learning, have expanded predictive capabilities. Technologies such as the IoT sensors and remote sensing also enable real-time updates to spatial wastewater maps [13].
This paper provides a critical review of statistical interpolation in GIS for mapping wastewater-derived pollutants. It introduces a conceptual framework (Figure 1) that links data sources, interpolation paradigms, and management applications, using this structure to synthesize the literature. It covers both foundational and advanced methods, real-world applications, and challenges such as data heterogeneity. Moving beyond a qualitative synthesis, this review incorporates a systematic review and meta-analysis to quantitatively consolidate evidence on the comparative performance of leading interpolation methods specifically for wastewater-relevant parameters, providing a robust, evidence-based foundation for method selection. The review culminates in a discussion of future directions, informed by these quantitative findings, that moves beyond listing technologies to propose a structured research agenda for integrating artificial intelligence, real-time data, and open-source tools to enhance decision-support systems in wastewater management.
Figure 1.
Conceptual framework for GIS-based interpolation of wastewater-derived pollutants, illustrating the integrated architecture from data acquisition through analytical methods to decision-support applications.
2. Spatial Wastewater Characteristics in Engineered Systems and Receiving Environments
2.1. Parameters Relevant to Spatial Mapping
Understanding the spatial distribution of wastewater constituents is fundamental to effective management of collection systems, treatment processes, and impacted environments. While wastewater composition is complex, certain parameters are particularly relevant to spatial mapping applications due to their environmental significance, regulatory status, or utility as indicators of contamination sources.
Wastewater typically contains a complex mixture of organic and inorganic compounds, pathogens, and nutrients, with concentrations that can vary significantly depending on the source- whether municipal, industrial, or agricultural. It is important to recognize, however, that surface water and groundwater quality are also influenced by natural sources of pollution, including wildlife waste, decaying vegetation, and natural geological sources of contaminants such as arsenic or fluoride [14,15]. In many contexts, wastewater discharges interact with these natural background sources, creating complex pollution mixtures that require careful differentiation for effective management. Characterizing these constituents- both anthropogenic and natural- is essential, as it not only informs the design and optimization of treatment systems but also aligns with regulatory requirements for discharge quality and ambient water quality standards [16,17]. Table 1 summarizes key wastewater parameters for spatial mapping, organized by category, with typical measurement methods and spatial relevance.
Table 1.
Common Wastewater Quality Parameters and Typical Data Sources for Spatial Mapping.
2.2. Spatial Patterns in Wastewater Systems
Wastewater constituents exhibit characteristic spatial patterns depending on the system context:
- Within sewer networks: Pollutants may show longitudinal gradients reflecting travel time, sedimentation/resuspension dynamics, and discrete inputs from industrial or illicit connections. Sharp concentration changes often occur at confluences or discharge points, challenging interpolation methods that assume spatial continuity [33].
- Within treatment plants: Spatial patterns within unit processes (e.g., dissolved oxygen gradients in aeration tanks, solids distribution in clarifiers) inform process optimization but require dense monitoring networks [34,35].
- In receiving waters: Wastewater plumes in rivers or coastal areas exhibit complex patterns governed by advection, dispersion, and transformation processes. These systems are characterized by strong anisotropy (directional dependence), where spatial correlation is weaker along the flow direction than across it due to adjective transport [36,37].
- In groundwater: Contaminant plumes from leaking infrastructure show smooth concentration gradients in homogeneous aquifers but complex fingering in heterogeneous media [38].
These diverse spatial behaviors necessitate different interpolation approaches, as elaborated in Section 4.
The properties include BOD5, COD, TSS, and nutrients such as nitrogen and phosphorus, as well as pathogens. These parameters play a critical role in determining the appropriate treatment methodology, where multivariate statistical techniques become invaluable for analyzing interdependencies among these parameters [39,40].
2.2.1. Physical Properties
The physical properties of wastewater are crucial for understanding its behavior and environmental impact. The parameters include electrical conductivity (EC), total dissolved solids (TDS), and pH [24]. Accurately estimating these properties is essential for effective wastewater management. Geostatistical methods, particularly those integrated with GIS, are used to interpolate data from sampled locations to non-sampled areas, creating comprehensive maps of wastewater physical characteristics [37,41].
Interpolation techniques are essential for predicting the spatial distribution of these physical properties because of their inherently variable nature. The choice of the appropriate interpolation method depends on the specific characteristics of the wastewater being examined. Methods such as Kriging and IDW are commonly used in environmental studies [12,42]. Kriging can account for spatial correlations, making it beneficial for parameters such as TDS and chloride concentration, whereas IDW provides straightforward predictions based on the proximity of local data [43,44]. Research importantly demonstrates that advanced interpolation methods, particularly Co-Kriging, offer greater accuracy in estimating the concentrations of specific parameters, such as the sodium adsorption ratio and total hardness, emphasizing the necessity of selecting the optimal method based on data characteristics and distribution [27,42].
2.2.2. Chemical Properties
The characterization of chemical properties in wastewater relies heavily on multivariate statistical methods that enable the identification of latent factors governing pollutant occurrence and transport. Principal Component Analysis (PCA) and Factor Analysis (FA) are commonly employed to reduce dimensionality and reveal underlying structure in water quality datasets. These methods work by transforming correlated original variables into a smaller set of uncorrelated principal components that capture maximum variance [41].
Concretely, this process involves:
- Data standardization to render different measurement units (mg/L, μS/cm, pH units) comparable
- Correlation matrix computation revealing interrelationships among chemical parameters
- Eigenvalue decomposition identifying components that explain significant portions of total variance
- Factor rotation (typically varimax) to enhance interpretability by maximizing loadings of variables on single factors
- Factor interpretation based on which parameters load strongly on each component
For example, a PCA of groundwater quality data might reveal:
- Factor 1 (Salinity factor): High loadings for EC, TDS, Cl−, Na+ → representing seawater intrusion or evaporative concentration
- Factor 2 (Nutrient factor): High loadings for NO3−, NH4+, PO4−3 → representing agricultural or wastewater impacts
- Factor 3 (Geogenic factor): High loadings for Ca2+, Mg2+, HCO3− → representing natural aquifer mineral dissolution
These factor scores can then be mapped using interpolation techniques to visualize the spatial extent of each pollution source type, providing decision-makers with actionable information about dominant contamination processes across the landscape [45].
Geostatistical methods, particularly Co-Kriging and Kriging, have been proven effective in estimating the spatial distribution of these chemical parameters within groundwater and soil systems. Studies have demonstrated that Co-Kriging excels in estimating SAR, SO42−, pH, TDS, EC, and Cl−, significantly reducing the mean bias error (MBE) compared to other interpolation techniques [25,46]. The application of co-kriging significantly enhances prediction accuracy for these parameters, enabling better decision-making processes in wastewater management. The variability in chemical properties, influenced by factors such as land use and seasonal changes, necessitates an ongoing assessment, as noted in the long-term observations of soil nutrient concentrations in Louisiana, which highlighted the temporal dynamics and variability of organic carbon across landscapes [6,27,45].
GIS plays a pivotal role in this mapping process by managing vast datasets effectively and employing various interpolation techniques to estimate unknown values based on known measurements. Techniques such as IDW and spline interpolation can optimize predictions by leveraging spatial relationships within the data [47]. These methods ensure that the most suitable approach for a specific wastewater context is implemented, considering the unique distribution patterns of the chemical constituents. Utilizing GIS in conjunction with robust geostatistical methods dramatically enhances the accuracy of chemical property assessments, paving the way for improved environmental management and regulatory compliance in wastewater treatment systems [31,48].
2.2.3. Biological Properties
The biological properties of wastewater are essential for understanding environmental impacts and developing effective management strategies. Key indicators, including bacterial levels, DO, ammonia, and nitrate concentrations, provide insights into the health of aquatic systems affected by wastewater discharges. It is worth noting that comprehensive water quality assessment often employs integrated indices such as the Canadian Water Quality Index (CWQI), which combines physical parameters (temperature, turbidity), chemical indicators (pH, dissolved oxygen, nutrients, metals), and biological measures (fecal coliforms) into a single metric that communicates overall water quality condition to managers and the public [22,24]. The CWQI framework exemplifies how multiple biological and chemical indicators can be synthesized to characterize the cumulative effects of wastewater discharges on receiving waters. E. coli concentrations may exceed acceptable limits in coastal areas and certain rivers, underscoring the necessity for continuous monitoring in high-traffic locations. DO levels often drop below the thresholds needed for aquatic life, especially in rivers and groundwater, indicating significant ecological stress [28,49].
The role of nutrients like ammonia and nitrate poses further challenges; ammonia levels are a concern in groundwater sources, while nitrate concentrations vary greatly based on seasonal rainfall patterns. Specifically, elevated nitrate readings were associated with increased runoff during the wet season, demonstrating how precipitation affects nutrient loading. Furthermore, bacterial contamination levels reflected human activities and environmental conditions, highlighting the interaction between natural and anthropogenic factors. Enterococci concentrations were markedly higher during peak tourism seasons, which corresponded with increased beach usage and wastewater discharge into the lagoons, stressing the necessity for communities to monitor these fluctuations [23]. Methodological advancements using GIS facilitate a deeper analysis of these biological parameters, enabling the identification of geographical patterns and potential sources of contamination in urban watersheds [50,51].
3. GIS Applications in Wastewater Management
To improve wastewater management strategies, stakeholders must prioritize targeted data collection that addresses specific concerns, including areas impacted by agricultural runoff and infrastructure decay. Using GIS for data visualization not only aids in stakeholder engagement but also informs decision-making processes by presenting a clear picture of wastewater characteristics. This collaborative data-sharing approach fosters trust between utility providers and local communities, ultimately paving the way for more resilient wastewater management systems in the face of changing environmental conditions [52].
By combining GIS with interpolation techniques, stakeholders can effectively address uncertainties in areas that have not been sampled. For instance, GIS can identify patterns in the variability of organic carbon and nutrient concentrations in soils, thereby enhancing understanding of wastewater characteristics across different ecosystems. As this field progresses, the ongoing refinement and application of these geostatistical techniques will be crucial for accurately mapping and managing wastewater, ensuring that strategies are effectively directed toward mitigating environmental impacts [27,53].
Geostatistical techniques, particularly kriging and its variants (including ordinary, universal, and co-kriging), provide a statistically robust framework for spatial prediction by modeling spatial structures through variograms [54,55]. Kriging not only estimates values at un-sampled locations but also quantifies the uncertainties associated with those estimates, which is essential for environmental risk assessment [56,57]. The use of GIS in storm-water management has become increasingly advanced, especially in urban areas. According to Allende-Prieto, et. al [58], spatial representation is crucial for managing urban water systems, as GIS allows for the detailed layering of data related to land use, vegetation cover, and hydrology. By utilizing techniques such as Light Detection and Ranging (LIDAR), researchers can accurately delineate drainage networks and analyze sub-catchments, which inform watershed management strategies.
3.1. Structure and Components of Geographic Information Systems
GIS is fundamentally composed of five integrated components that work together to capture, store, analyze, and visualize spatial data [59,60]:
- Hardware: The computer systems on which GIS operates, ranging from centralized servers to desktop workstations and cloud-based infrastructure. Modern GIS deployments increasingly utilize distributed computing resources for handling large spatial datasets and complex analytical operations.
- Software: Includes the core GIS applications (e.g., ArcGIS, QGIS, GRASS GIS) that provide functionality for data management, spatial analysis, and map production. These platforms include modules for geostatistical analysis, interpolation, and three-dimensional visualization.
- Data: The most critical component, comprising both spatial data (defining geographic locations) and attribute data (describing characteristics at those locations). In wastewater applications, this includes sampling point coordinates, laboratory analytical results, land use classifications, hydrological network geometry, and infrastructure locations.
- People: Skilled users, who design monitoring programs, select appropriate analytical methods, interpret results, and translate spatial analyses into management decisions. The effectiveness of GIS-based wastewater characterization depends heavily on the expertise of practitioners in both GIS operations and environmental engineering.
- Methods: The analytical procedures and workflows applied to spatial data, including the interpolation techniques that are the focus of this review. Methods encompass data preprocessing protocols, spatial statistical analyses, and validation procedures that ensure reliable results.
In wastewater management applications, GIS serves as an integrative platform that combines these components to address specific environmental challenges. The system enables the visualization of sampling locations, the interpolation of continuous pollution surfaces, the overlay of ancillary data layers (land use, population density, industrial activity), and the production of maps that communicate findings to stakeholders and decision-makers. Understanding this structural foundation is essential before examining the specific interpolation methods that operate within the GIS environment.
The Concept of GIS
GIS has revolutionized the way data is collected and analyzed, particularly in spatial contexts where sampling is often limited. One of the main advantages of GIS is its ability to integrate spatial and attribute data, which are obtained from sampling points that may not adequately represent an entire geographical area. GIS provides a powerful platform for integrating spatial data layers relevant to wastewater systems: pipe networks, asset locations, land use, hydrology, and monitoring data. GIS facilitates the use of interpolation techniques, allowing for the estimation of values at locations where no samples are available. This capability is essential in various applications, such as environmental monitoring, urban planning, and public health assessments, especially when dealing with heterogeneous phenomena like wastewater characteristics [34,35,37].
The versatility of GIS allows it to function as an integrative tool that manages the spatial data which serve as input to, or validation for, mechanistic models that simulates scenarios [61]. The growing complexity and volume of spatial data, exacerbated by climate change and urbanization, underscores the importance of GIS in both current and future applications. As urban infrastructure evolves and the demand for sustainable development increases, utilizing robust GIS methodologies for interpolation can lead to more informed decision-making processes [59,61].
While GIS alone does not perform forecasting, interpolated surfaces can inform process-based models (e.g., SWMM, HEC-RAS) that simulate future conditions under different scenarios [62,63]. Innovations in GIS technology, combined with advancements in interpolation techniques, ensure that spatial analyses remain relevant and effective in tackling contemporary environmental challenges. By employing GIS to represent and analyze spatial phenomena, stakeholders can enhance urban drainage designs, manage pollution flows, and implement effective strategies for urban flood mitigation, ultimately strengthening the resilience of urban landscapes [62,63].
3.2. GIS Applications in Wastewater Cases
GIS serves as an integrative platform for wastewater management by enabling visualization, analysis, and modeling of spatial data. Key applications relevant to interpolation include [64,65]:
- Monitoring network visualization and design: GIS maps sampling locations and identifies spatial coverage gaps, informing optimal placement of new monitoring stations.
- Pollution source tracking: Interpolated concentration surfaces reveal hotspots and gradients that point toward potential contamination sources.
- Infrastructure planning: Spatial maps of pollutant loads inform decisions about sewer rehabilitation, treatment plant upgrades, and combined sewer overflow controls.
- Environmental impact assessment: Interpolated concentration maps in receiving waters support compliance with ambient water quality standards.
- Public communication: Visual maps effectively communicate contamination risks to stakeholders and decision-makers.
GIS provides a strong framework for consolidating various datasets, including water distribution, wastewater management, and land use [64]. This integration allows for real-time monitoring through Supervisory Control and Data Acquisition (SCADA) systems, which accurately track water levels and flows using installed sensors and monitoring stations. These capabilities facilitate proactive management of wastewater systems, enhancing system efficiency and infrastructure planning through data-driven decision-making [64,65].
Further applications of GIS in wastewater management are illustrated through urban drainage design, as explored by Abbas et al. [33]. By implementing open-source GIS software, advanced modeling tools can be utilized to assess the dynamics of urban runoff and pollutant transport in water bodies. These technologies enable the evaluation of combined sewer overflows and support the development of dynamic models that simulate various conditions related to urbanization and the impacts of climate change [66,67].
Studies that employ GIS not only facilitate predictive modeling of environmental impacts but also enable long-term strategic planning for integrated urban drainage systems. By using GIS to ensure real-time data accuracy and to facilitate comprehensive analysis, wastewater management entities can effectively adapt and respond to both existing challenges and future risks, representing a significant advancement in environmental management [68,69].
3.3. Integration with Other Modeling Tools
It is important to distinguish GIS-based interpolation from process-based hydrodynamic and water quality models. Interpolation methods estimate values at un-sampled locations based solely on spatial correlation in observed data. In contrast, mechanistic models (e.g., SWMM for sewer hydraulics, HEC-RAS for river hydrodynamics, WASP for water quality) simulate physical, chemical, and biological processes using governing equations and boundary conditions [70,71].
These approaches are complementary rather than competitive. Interpolated surfaces can:
- Provide initial conditions for mechanistic models
- Validate model outputs against observed patterns
- Fill data gaps in model input requirements
- Support data assimilation for real-time forecasting
Conversely, mechanistic models can inform interpolation by suggesting appropriate covariance structures (e.g., anisotropic variograms aligned with flow direction).
GIS applications are continually evolving to tackle the complex challenges posed by wastewater systems, especially in the face of changing environmental conditions and urban expansion. By utilizing GIS technologies, wastewater management is becoming more responsive and sustainable, paving the way for future advancements in integrated water resource management.
However, despite the valuable insights GIS offers and its enhanced capability to model hydrological systems, there are challenges, particularly in acquiring reliable input data in complex urban environments. Therefore, the continued integration of advanced sensor data with GIS is essential to address these challenges and promote more resilient and effective management of water infrastructure and environmental resources in the future. Overall, GIS is an indispensable tool in environmental studies, expanding understanding and management of complex ecological systems [70,71].
Interpolation methods are crucial in both data production and spatial analysis phases, significantly enhancing the quality and applicability of GIS data. These methods can be divided into global and local approaches, depending on the dataset’s characteristics and the spatial continuity of the phenomenon being analyzed. For example, local interpolation techniques, such as the Voronoi method, assign sample point values to their respective areas, assuming uniformity within these defined zones. This assumption is particularly effective in urban drainage modeling, where interpolating pollutant concentrations can guide decisions about water quality management [33].
4. Statistical Interpolation Techniques
Statistical interpolation techniques are crucial for mapping wastewater characteristics, as shown in Figure 1, enabling the estimation of environmental parameters at unmonitored locations. While a wide array of methods exists, their efficacy is highly dependent on the underlying spatial structure of the data and the specific management question at hand. These techniques are broadly categorized into deterministic and geostatistical methods, with a rapidly emerging third category of machine learning (ML) and hybrid approaches. The following section provides a qualitative overview of these methods; their quantitative performance is synthesized and compared in Section 8.
4.1. Classification of Interpolation Methods
Interpolation methods can be classified along several dimensions relevant to wastewater applications [47,72]:
- 1.
- by mathematical approach:
- Global methods: Use all available data points to estimate each un-sampled location (e.g., trend surface analysis)
- Local methods: Use only nearby points within a search neighborhood (e.g., IDW, kriging with local windows)
- 2.
- by statistical foundation:
- Deterministic methods: Based on mathematical functions without probabilistic assumptions (e.g., IDW, spline, radial basis functions). These can be either exact interpolators (passing through all data points) or approximators (smoothing the data).
- Stochastic/geostatistical methods: Treat the spatial variable as a random process with statistical properties (e.g., kriging family). These can also be exact (e.g., Ordinary Kriging) or provide smoothed estimates (e.g., when a nugget effect is included).
- Machine learning methods: Data-driven algorithms that learn patterns from training data (e.g., random forest, neural networks, support vector regression)
- 3.
- by auxiliary data use:
- Univariate methods: Use only the target variable (e.g., ordinary kriging)
- Multivariate methods: Incorporate correlated secondary variables (e.g., co-kriging, regression kriging).
This classification framework helps practitioners select appropriate methods based on their specific wastewater characterization objectives, data availability, and understanding of underlying spatial processes. Table 2 provides a comprehensive overview of interpolation methods, including both classical techniques and those most frequently compared in the wastewater-specific literature that forms the basis of the meta-analysis in Section 8.
Table 2.
Comprehensive Comparison of Interpolation Methods for Wastewater Mapping.
4.2. Deterministic Interpolation Methods
IDW operates on the fundamental assumption that observations closer to an un-sampled location are more similar to its true value than those farther away- an expression of Tobler’s First Law of Geography. Mathematically, IDW estimates values as a weighted average where weights are inversely proportional to distance raised to a power (typically p = 2) [73,74].
Why IDW suits certain wastewater parameters: IDW performs well for parameters that exhibit local spatial continuity without strong regional trends or anisotropy. In wastewater applications, IDW is often effective for mapping:
- TSS and turbidity in relatively homogeneous water bodies where local variations dominate
- Preliminary screening of contamination gradients where computational speed is prioritized over statistical rigor
- Parameters with dense sampling networks where the weighting scheme approximates local conditions
However, IDW’s limitations become apparent for parameters influenced by directional transport processes (e.g., advection in rivers) or regional gradients, as the method cannot incorporate such physical knowledge. The characteristic “bull’s eye” patterns around sampling points reflect IDW’s inability to account for spatial autocorrelation structure.
Spline interpolation fits a mathematically smooth, minimal-curvature surface that passes exactly through the data points. This approach is useful for mapping smoothly varying parameters but can produce unrealistic “overshoots” or “undershoots” at the edges of the dataset or in areas of sparse data [73]. In wastewater applications, spline methods may be appropriate for broad regional trends but are generally less suitable for parameters with sharp gradients near discharge points.
Deterministic methods, such as IDW and Spline interpolation, are computationally efficient but often theoretically simplistic. IDW operates on the assumption that nearby observations have a greater influence, making it a straightforward and widely used method for preliminary mapping. However, its major limitation is the ignorance of spatial autocorrelation and its susceptibility to clustering effects. Spline interpolation fits a smooth surface, minimizing curvature, which is useful for mapping smoothly varying parameters but can produce unrealistic “overshoots” or “undershoots” at the edges of the dataset or in areas of sparse data [73,74].
4.3. Geostatistical Methods
Kriging family methods are founded on the theory of regionalized variables, which treats spatial phenomena as random processes with structured correlation. The variogram a function describing how variance between samples changes with separation distance is the critical tool that distinguishes kriging from deterministic methods [72,75,76].
- Parameters exhibiting strong spatial autocorrelation: Kriging’s variogram modeling explicitly captures the distance over which samples remain correlated (the range) and the variability at short distances (the nugget). For parameters like TDS and EC in groundwater systems, where smooth regional trends reflect gradual hydro-geochemical evolution, Kriging provides superior estimates because it weights samples based on their actual spatial relationship rather than arbitrary distance functions.
- Parameters requiring uncertainty quantification: Kriging’s unique advantage is its provision of prediction variance (kriging variance), which quantifies estimation uncertainty at each un-sampled location. This is critical for regulatory compliance mapping, where confidence in exceedance detection is essential, and for risk assessment, where decision-makers need to know the reliability of pollution maps.
- Anisotropic processes: Wastewater plumes in rivers or coastal areas exhibit directional dependence (anisotropy) due to advection. Kriging can incorporate anisotropic variogram models that capture different correlation structures along versus across flow directions. Advanced implementations like Empirical Bayesian Kriging (EBK) can model complex, non-stationary anisotropy by creating and simulating from local variogram models, making them particularly robust for datasets where anisotropy varies across the study area [77].
Co-Kriging is specifically excelling for SAR, SO42−, pH, TDS, EC, and Cl−: Co-Kriging leverages correlations between primary and secondary variables to improve predictions. This is particularly effective for:
- SAR (Sodium Adsorption Ratio): SAR is calculated from Na+, Ca2+, and Mg2+ concentrations. When EC (easily measured) is used as a covariate, Co-Kriging exploits the strong correlation between EC and major ion concentrations to improve SAR estimates, reducing mean bias error (MBE) by up to 30% compared to ordinary kriging in heterogeneous aquifers [25,46].
- SO42− and Cl−: These conservative ions often exhibit transport behavior correlated with other solutes and with physical parameters like electrical conductivity. Co-Kriging with EC as an auxiliary variable (typically measured at higher density or lower cost) leverages this correlation to refine sulfate and chloride maps [38].
- pH: While pH itself is not typically interpolated directly due to its logarithmic nature, Co-Kriging of hydrogen ion activity with correlated parameters (e.g., alkalinity, dissolved inorganic carbon) can capture spatial patterns more effectively than univariate approaches [41].
Geostatistical methods, primarily the Kriging family (Ordinary, Universal, Empirical Bayesian), provide a statistically rigorous framework that explicitly models spatial dependence through the variogram. This not only produces a prediction surface but also a surface of prediction uncertainty, which is critical for risk assessment. Ordinary Kriging (OK) is the workhorse for stationary data. Universal Kriging (UK) incorporates a drift or trend model, while Empirical Bayesian Kriging (EBK) automates variogram modeling, making it robust for smaller or noisy datasets [75,76]. The principal advantage of geostatistics is its principled approach to uncertainty quantification. Data transformations (e.g., log, Box-Cox, normal score) are often necessary to approximate the Gaussian distribution required for classical kriging.
5. Applications of Statistical Interpolation in Wastewater Mapping
Statistical interpolation techniques are essential tools for mapping spatial patterns of wastewater parameters across diverse landscapes. By converting point-based measurements into continuous surfaces, these methods allow for the assessment of environmental conditions in areas where direct sampling is impractical or too costly. When integrated into GIS, interpolation enables high-resolution visualizations of pollutant distributions, which facilitates data-driven decision-making related to public health, infrastructure planning, and regulatory compliance [42,83].
The application of interpolation techniques in wastewater management covers various operational and strategic areas. One of the simplest uses is in the spatial mapping of pollutant concentrations, such as BOD5, COD, TSS, and nutrient levels. These maps are crucial for identifying areas with high pollution levels, allowing for targeted remediation efforts and the efficient allocation of treatment resources [79,84].
Interpolated surfaces also play a crucial role in environmental impact assessments by providing quantifiable data on the spatial gradients of pollution, detecting long-term trends, and delineating affected zones [85,86]. Regulatory agencies rely on these maps to ensure compliance with effluent discharge standards and to identify illegal discharges [87]. Additionally, planners and engineers utilize spatial interpolations to inform the design and optimization of wastewater infrastructure, including the strategic placement of monitoring stations and treatment units [88,89]. With the emergence of real-time data sources from IoT devices and SCADA systems, interpolation has become valuable in dynamic monitoring systems. These systems contribute to the creation of digital twins for wastewater networks, enabling continuous simulation and forecasting under varying loads and climatic conditions. This capability is essential for preventive maintenance and emergency response [90].
Beyond basic mapping, modern applications of interpolation techniques address critical challenges in environmental monitoring and data analysis. These challenges include identifying pollution hotspots, assessing human impacts, and predicting contamination risks. Such applications are crucial in densely populated or ecologically sensitive regions, where spatial data can inform both reactive and preventive measures to improve water quality [26,51].
5.1. Modeling Pollutant Distribution
Interpolation methods play a crucial role in modeling the distribution of pollutants, such as nitrates, E. coli, and heavy metals, within urban and peri-urban water systems. GIS enables the spatial integration of land use data, hydrological networks, and monitoring station outputs, allowing for high-resolution analyses of contaminant dispersion [27,51]. Lu et al. [30] employed Artificial Neural Networks (ANNs) within a GIS framework to predict DO levels. The model incorporated various parameters, such as land use, temperature, and rainfall, enabling real-time predictions of water quality trends in rivers influenced by urban runoff. Moreover, simulation tools such as the Water Quality Analysis Simulation Program (WASP) are often integrated with GIS to model advection and dispersion mechanisms. When informed by interpolated pollutant data, these simulations provide spatially dynamic assessments of contamination risks under varying hydrological conditions.
5.2. Data Sources for Wastewater Characteristics
Accurate spatial interpolation relies on the availability and quality of source data. The primary sources of data include field sampling and laboratory analysis, which are considered the gold standard for measuring water quality [18]. These data provide high-precision estimates of parameters such as BOD5, COD, TSS, and nutrient concentrations. In recent years, continuous monitoring sensors have become increasingly important for capturing high-frequency real-time data [19]. These sensors, often integrated with SCADA (Supervisory Control and Data Acquisition) or IoT platforms, measure parameters such as pH, turbidity, conductivity, and dissolved oxygen at intervals of less than an hour [20].
While challenges such as calibration and fouling exist, sensor networks improve temporal resolution and enable dynamic interpolation [91]. Remote sensing technologies, including satellites and drones, offer extensive spatial coverage and enable the estimation of water quality using spectral indices [21]. Public databases maintained by environmental agencies, such as the U.S. Environmental Protection Agency (EPA), the European Environment Agency (EEA), the Central Pollution Control Board (CPCB) in India, and the Egyptian Environmental Affairs Agency (EEAA), offer critical historical and regulatory monitoring data for regional studies. Additionally, research projects and industry collaborations help to supplement monitoring efforts, especially in data-scarce regions.
5.3. Impact Assessment
Statistical interpolation plays a crucial role in enhancing impact assessments by uncovering spatial patterns of ecological stress and contamination. Commonly used parameters such as ammonia, nitrates, Enterococci, and total coliforms help visualize risks associated with eutrophication, public health hazards, and areas of ecosystem degradation. In Haberstroh’s study [92], which focused on Belize and Florida, interpolation techniques revealed that E. coli concentrations in recreational waters often exceeded acceptable limits during peak tourism seasons. This trend was linked to increased wastewater discharge and urban runoff, prompting local authorities to prioritize investments in sanitation [29].
Further advancements have led to the development of integrated models, such as GIS_SWQAM, which merge interpolation with fuzzy logic algorithms to evaluate urban water quality under uncertain conditions. These systems allow decision-makers to simulate various management scenarios and predict outcomes based on different land-use or climate scenarios. The visual outputs, such as pollution risk maps and exceedance probability layers, significantly enhance stakeholder engagement, making scientific findings more accessible to policymakers, planners, and local communities [30].
5.4. Case Studies
Numerous case studies highlight the practical benefits of statistical interpolation in wastewater management. For instance, Ebrahimi [93] applied multivariate statistical techniques to improve municipal and industrial wastewater treatment processes. This approach led to enhanced pollutant removal efficiencies and reduced operational costs. By incorporating spatial interpolation, these initiatives enabled a more precise identification of treatment inefficiencies and localized issues. In arid regions facing water scarcity, researchers have employed GIS-integrated interpolation models to monitor the degradation of groundwater quality resulting from over-abstraction and saltwater intrusion. These models categorize aquifer zones based on salinity levels and contaminant concentrations, enabling the identification of areas suitable for both drinking water and irrigation. Understanding these spatial variations is essential for effective long-term water resource planning. Overall, these case studies demonstrate that the use of interpolation goes beyond basic visualization; it plays a key role in infrastructure upgrades, land-use planning, and pollution control strategies.
6. Advances in Statistical Interpolation
Recent advances in statistical interpolation have moved beyond incremental improvements to paradigm shifts, primarily driven by machine learning and the need to handle complex, non-stationary environmental data.
6.1. The Machine Learning Revolution
ML approaches (e.g., Random Forests (RF), Support Vector Regression (SVR), Gaussian Process Regression (GPR)) represent a fundamental shift from model-driven (geostatistics) to data-driven prediction. Their key strength lies in capturing complex, nonlinear relationships between wastewater parameters and auxiliary variables (e.g., land use, rainfall, and infrastructure density). For instance, while Kriging might struggle with abrupt changes caused by an industrial discharge point, an RF model can effectively learn this pattern if the relevant predictor (e.g., industrial land use) is provided. However, these “black box” models often require large amounts of data for training and provide less intuitive insight into spatial structure compared to a variogram. Their performance is also highly dependent on feature engineering and selection [26,27,77,93,94,95,96,97,98,99,100,101].
As these models become increasingly accessible through open-source GIS platforms and cloud-based tools, their integration into standard wastewater monitoring processes is becoming more achievable. Additionally, ensemble learning strategies, which combine the outputs of multiple models, provide further improvements in performance and resilience to overfitting [59,69].
6.2. Refinements in Geostatistics
Geostatistics remains highly relevant, with advancements focusing on automating and robustifying the workflow. EBK is a prime example, making sophisticated kriging more accessible. The enduring value of geostatistics is its principled approach to uncertainty quantification, which serves as a benchmark against which newer ML models must be evaluated [78,102]. These methods often serve as benchmarks for evaluating emerging models. Research has demonstrated that EBK significantly improves the accuracy of predicting spatial variations in wastewater characteristics, such as EC, SAR, and TDS, particularly in heterogeneous terrains [21,43].
6.3. The Power of Hybrid Techniques
The most promising advances lie in hybrid techniques that seek to leverage the strengths of different paradigms. For example, a model might use ML (e.g., a Neural Network) to capture the deterministic, non-linear component of a wastewater parameter and then apply Kriging to interpolate the residual spatial errors. This hybrid approach can achieve accuracies beyond what any single method could deliver, especially in topographically complex urban environments or for parameters influenced by multiple, interacting processes [80,81].
Furthermore, barrier-aware interpolation methods, such as DK interpolation, effectively address challenges in mapping pollutant concentrations around natural and artificial obstacles, including hills, buildings, and infrastructure. Hybrid methods are particularly effective for urban wastewater mapping, where the complexity of topography and variability in infrastructure necessitate flexible and robust modeling tools. As computational capabilities continue to improve and real-time sensor data becomes more readily available, hybrid interpolation frameworks are likely to become standard tools in spatial environmental management [82].
7. Challenges and Limitations
Despite the promise of interpolation, challenges remain. Data sparsity, particularly in under-monitored areas, can lead to unreliable spatial predictions. Many methods assume stationarity and isotropy, assumptions often violated in wastewater systems with heterogeneous land use and episodic discharges [103]. Statistical interpolation techniques are valuable for mapping wastewater characteristics; however, several limitations need to be addressed to enhance their reliability and usability in real-world applications [43,104]. Key challenges include data quality, variations in spatial resolution, and high computational demands, all of which affect the accuracy and scalability of GIS-based environmental assessments. Additionally, effectively communicating the inherent uncertainty in spatial predictions is essential for building trust and facilitating informed decision-making among stakeholders [99].
7.1. Data Quality Issues
The effectiveness of any interpolation method is closely linked to the quality of the input data. Poorly distributed sampling points, measurement errors, or uncalibrated sensors can introduce significant inaccuracies into the spatial model. As demonstrated by Karandish and Shahnazari [41], selecting interpolation methods based on reliable performance indicators, such as Mean Bias Error (MBE) and Mean Absolute Error (MAE), is essential for mitigating these issues.
In wastewater monitoring, parameters such as EC, SAR, and TDS necessitate consistent sampling protocols and proper sensor calibration. Research indicates that increasing the number of neighboring points (for example, using nine points in the Weighted Moving Average (WMA)) enhances accuracy while remaining computationally feasible. Furthermore, methods like Co-Kriging are particularly effective when multiple correlated parameters are available, as they improve the predictive strength for contaminants such as sulfate or chloride [32].
However, the inclusion of erroneous or outlier data can skew results, highlighting the importance of preprocessing procedures such as outlier detection, normalization, and cross-validation to enhance model robustness.
7.2. Spatial Resolution Challenges
One of the most persistent limitations of GIS-based interpolation is the variability in spatial resolution, especially in areas with uneven or sparse data coverage. The accuracy of interpolation results depends heavily on the density and distribution of sampling points. For example, in coastal and riverine systems, sharp spatial gradients in salinity or nutrient loads require fine-resolution data to prevent the interpolation of artifacts [105].
A key specificity of wastewater-derived pollutants in fluvial systems is that their spatial correlation is often related to stream distance (hydrological connectivity) rather than straight-line Euclidean distance. The transport process is advection-dominated, creating strong anisotropy with a gradient in the flow direction. Most standard interpolation methods (e.g., IDW, OK) do not account for this, as they assume isotropy and use Euclidean distances.
Stachelek and Madden [36] demonstrated that Inverse Path Distance Weighting (IPDW) is superior to traditional Euclidean IDW when used for mapping coastal water quality. By considering natural flow paths and barriers, IPDW preserves spatial gradients and improves the detection of nearshore anomalies. Kriging can partially address anisotropy through variogram modeling, and advanced methods like EBK can handle more complex, non-stationary anisotropy. However, most methods in common use do not explicitly account for flow paths. Using non-Euclidean methods introduces additional challenges, such as the need for high-resolution path networks and increased computational demands. To address these issues, it is essential to design monitoring strategies that ensure optimal sensor placement and adequate spatial coverage, particularly in urban environments where pollutant transport is influenced by built infrastructure and variability in land cover.
Sensor data can be affected by fouling, drift, and communication failures, resulting in inconsistent time series. The absence of metadata on sampling protocols complicates the harmonization process [106]. Computationally intensive methods, such as Kriging or machine learning, require expertise and resources, which limit their use in low-resource settings [107]. Uncertainty quantification remains limited in many studies, posing risks for decision-making. Lastly, the lack of standardized protocols hampers reproducibility and comparability across studies and regions [108,109].
7.3. Computational Constraints
Modern interpolation methods, particularly those that utilize Kriging, machine learning, or real-time sensor integration, are often computationally intensive. This is especially true for EBK and hybrid neural network models, which require significant memory and processing power due to their reliance on repeated simulations and iterative parameter optimization [78,110]. For instance, urban drainage modeling frequently employs real-time platforms like MatSWMM. These platforms integrate GIS with sensor networks to simulate the real-time transport of pollutants in a simulated environment. While they offer dynamic capabilities, they also impose a considerable computational burden, particularly when handling high-frequency data streams [67,111].
Moreover, as cities grow and monitoring networks expand, the need for data harmonization and standardization becomes crucial for maintaining interoperability. Emerging tools that can manage trade-offs in temporal and spatial resolution, such as streaming analytics and cloud-based geoprocessing, are becoming viable solutions. However, real-time interpolation still faces challenges due to hardware limitations and the necessity for efficient algorithms that can scale across urban systems.
7.4. Data Preprocessing and Quality Control Before Interpolation
Before applying interpolation methods, it is crucial to conduct thorough data preprocessing and quality control to ensure reliability. A recommended data preprocessing workflow is summarized in Table 3. The first step is to compile data from multiple sources and convert it into a consistent geospatial format. Initial screening involves verifying timestamps and spatial coordinates, as well as flagging implausible values that fall outside of expected environmental ranges [112]. Outlier detection employs statistical thresholds, such as z-scores and the interquartile range (IQR), in conjunction with spatial tests like Moran’s I, to identify anomalies [113].
The approach to handling missing data varies: simple imputation is adequate for minor gaps, while model-based methods are more appropriate for larger gaps. Data transformation techniques, such as log scaling, help normalize skewed parameters like COD or TSS [114]. Spatial exploratory analysis employs semi-variograms or heat maps to reveal patterns of autocorrelation and anisotropy [115]. Temporal aggregation helps smooth out noisy high-frequency fluctuations. Sensor data also requires processes such as drift correction, spike filtering, and cross-validation with grab samples to ensure accuracy [116].
Finally, projecting the data into a uniform spatial reference system ensures proper alignment for modeling purposes [117]. Table 3 outlines the recommended steps for data processing and quality control before interpolation.
Table 3.
Practical Steps for Data Processing and Quality Control before Interpolation [38,118,119,120].
7.5. Limitations and Contextual Applicability
It is important to acknowledge contexts where spatial interpolation is not the primary tool:
- Regulatory compliance monitoring at fixed points (inlet/outlet) requires direct measurement, not interpolation.
- Real-time process control relies on continuous sensors and SCADA systems.
- Well-characterized systems with dense monitoring may not require interpolation.
The value of interpolation is greatest when:
- Monitoring networks are spatially sparse
- Characterizing non-point source pollution
- Filling gaps in historical data for site characterization
- Designing optimal monitoring networks
- Communicating spatial patterns of contamination risk to stakeholders
8. Meta-Analysis of Interpolation Method Performance in Wastewater Mapping
While previous sections provide a qualitative overview of interpolation techniques, a quantitative synthesis of their comparative performance in wastewater-specific contexts remains a critical gap. To address this, a systematic review and meta-analysis of studies that directly compared prediction accuracy of common interpolation methods for wastewater-relevant parameters was conducted.
8.1. Methodology
The PRISMA (Preferred Reporting Items for Systematic Reviews and Meta-Analyses) guidelines [3] were followed to ensure transparency and reproducibility. The completed PRISMA 2020 checklist is provided in Supplementary File S1.
8.1.1. Literature Search Strategy
Three major databases (Web of Science, Scopus, and Google Scholar) were systematically searched for peer-reviewed articles published between January 2000 and December 2023. The search string was constructed using Boolean operators and included the following components:
(“wastewater” or “water quality” or “effluent” or “sewage” or “discharge”) and (“BOD” or “COD” or “TSS” or “nutrient” or “nitrogen” or “phosphorus” or “heavy metal” or “coliform”) and (“spatial interpolation” or “kriging” or “IDW” or “inverse distance weighting” or “spline” or “machine learning” or “artificial neural network” or “random forest”) and (“GIS” or “geographic information system” or “spatial mapping”) and (“RMSE” or “root mean square error” or “prediction accuracy” or “validation”).
8.1.2. Inclusion and Exclusion Criteria
Inclusion Criteria (PICOS Framework):
- Population: Spatial datasets of wastewater or receiving water quality parameters from municipal, industrial, or agricultural wastewater systems
- Intervention/Comparison: Direct comparison of at least two interpolation methods from different categories (deterministic, geostatistical, machine learning, hybrid)
- Outcome: Quantitative accuracy metrics, specifically Root Mean Square Error (RMSE) or data sufficient for its calculation
- Study Design: Peer-reviewed journal articles or conference proceedings in English
Exclusion Criteria:
- Studies focusing exclusively on groundwater, soil, air quality, or non-aqueous media without wastewater linkage
- Studies without direct method comparison or insufficient quantitative performance data
- Review articles, editorials, and non-English publications
- Studies using simulated data without field validation
8.1.3. Study Selection Process
The study selection process is summarized in Figure 2.
Figure 2.
PRISMA 2020 flow diagram for the systematic review of interpolation methods in wastewater mapping.
8.1.4. Data Extraction and Quality Assessment
A standardized data extraction form was developed and piloted. The following data were extracted from each included study:
- Study characteristics (authors, year, location)
- Wastewater parameters analyzed
- Sample size and spatial extent
- Interpolation methods compared
- Performance metrics (RMSE, MAE, R2)
- Cross-validation approach
- Software/tools used
- Quality Assessment:
The QASD (Quality Assessment for Spatial Prediction Studies) tool was adapted to evaluate methodological quality across five domains:
- Data quality: Sampling design, measurement methods, sample size adequacy
- Methodological appropriateness: Suitability of interpolation methods for data characteristics
- Validation rigor: Cross-validation approach, independence of validation data
- Reporting completeness: Transparency in reporting methods and results
- Spatial relevance: Appropriateness of spatial scale and resolution
Each domain was scored as low (0), moderate (1), or high (2) risk of bias, with total scores ranging from 0–10. Studies scoring ≥ 7 were classified as high quality, 4–6 as moderate, and ≤3 as low quality.
8.1.5. Statistical Analysis
- Effect Size Calculation:
For studies comparing Machine Learning (ML) methods with Ordinary Kriging (OK), the Ratio of Means (RoM) was calculated:
A RoM < 1 indicates superior performance of ML methods (lower error). Where standard deviations were available, Standardized Mean Difference (SMD) was calculated using Cohen’s d:
Meta-Analytic Model:
A random-effects model was employed using the restricted maximum likelihood (REML) estimator to account for expected heterogeneity among studies. Heterogeneity was quantified using the I2 statistic, with values of 25%, 50%, and 75% considered low, moderate, and high heterogeneity, respectively.
- Subgroup Analyses:
Pre-planned subgroup analyses were conducted to investigate sources of heterogeneity:
- By pollutant type (organic vs. inorganic)
- By data density (sample size: <50, 50–100, >100)
- By spatial scale (local vs. regional)
- By study quality rating
- Publication Bias:
Funnel plots and Egger’s regression test were used to assess potential publication bias. Sensitivity analyses were performed by sequentially removing each study to evaluate the robustness of pooled estimates.
8.2. Results
8.2.1. Study Characteristics
Twenty-two studies met all inclusion criteria for meta-analysis (Table 4). The included studies spanned 15 countries across six continents, with the majority from Asia (n = 12) and North America (n = 5). Study publication dates ranged from 2009 to 2023, with 68% published after 2015, reflecting growing interest in advanced interpolation methods.
Table 4.
Characteristics of Studies Included in the Wastewater-Focused Meta-Analysis.
The most commonly studied parameters were COD (n = 9 studies), BOD5 (n = 7), nutrients (n = 8), and heavy metals (n = 5). Sample sizes ranged from 28 to 210 monitoring points (median = 67). All studies employed cross-validation, with 73% using k-fold cross-validation and 27% using hold-out validation.
8.2.2. Primary Meta-Analysis: ML vs. Ordinary Kriging
Sixteen studies directly compared Machine Learning methods with Ordinary Kriging. The pooled RoM was 0.79 (95% CI: 0.73–0.85), indicating that ML methods reduced RMSE by 21% on average compared to Ordinary Kriging (p < 0.001). Heterogeneity was moderate (I2 = 67%, τ2 = 0.012, p < 0.01).
8.2.3. Subgroup Analyses
- By Pollutant Type:
- Organic pollutants (BOD5, COD):
- RoM = 0.71 (95% CI: 0.65–0.78), I2 = 58%
- Inorganic ions (NO3−, NH4+, Cl−):
- RoM = 0.86 (95% CI: 0.78–0.94), I2 = 52%
- Physical parameters (TSS, Turbidity):
- RoM = 0.92 (95% CI: 0.83–1.02), I2 = 45%
- Test for subgroup differences: χ2 = 18.7, df = 2, p < 0.001
- By Data Density:
- High density (n > 100):
- RoM = 0.73 (95% CI: 0.67–0.80), I2 = 55%
- Medium density (n = 50–100):
- RoM = 0.82 (95% CI: 0.75–0.89), I2 = 48%
- Low density (n < 50):
- RoM = 0.88 (95% CI: 0.80–0.97), I2 = 42%
- Test for subgroup differences: χ2 = 9.3, df = 2, p = 0.009
- By Study Quality:
- High quality (score ≥ 7):
- RoM = 0.75 (95% CI: 0.69–0.82), I2 = 52%
- Moderate quality (score 4–6):
- RoM = 0.85 (95% CI: 0.77–0.94), I2 = 49%
- Test for subgroup differences: χ2 = 4.1, df = 1, p = 0.04
8.2.4. Secondary Comparisons
- Co-Kriging vs. Ordinary Kriging:
Eight studies compared Co-Kriging with Ordinary Kriging. The pooled RoM was 0.85 (95% CI: 0.79–0.92), indicating a 15% RMSE reduction favoring Co-Kriging (p < 0.001, I2 = 51%).
- Machine Learning vs. Deterministic Methods:
Twelve studies compared ML methods with IDW. The pooled RoM was 0.64 (95% CI: 0.58–0.71), indicating a 36% RMSE reduction favoring ML methods (p < 0.001, I2 = 62%).
- Hybrid Models vs. Best Single Method:
Five studies evaluated hybrid approaches combining ML with geostatistics. The pooled RoM was 0.82 (95% CI: 0.75–0.90), indicating an 18% improvement over the best single method (p < 0.001, I2 = 38%).
8.2.5. Publication Bias and Sensitivity Analysis
Visual inspection of the funnel plot showed slight asymmetry, but Egger’s test was not statistically significant (t = 1.72, p = 0.11). Trim-and-fill analysis suggested one potentially missing study, with an adjusted pooled RoM of 0.81 (95% CI: 0.75–0.88). Sensitivity analysis by sequential removal of each study showed the pooled RoM ranged from 0.77 to 0.81, confirming the robustness of these findings.
8.3. Discussion of Meta-Analysis Findings
This wastewater-focused meta-analysis provides the first quantitative synthesis comparing interpolation methods specifically for wastewater quality mapping. The findings demonstrate that:
- Machine Learning methods significantly outperform traditional approaches for wastewater parameter interpolation, with an average 21% reduction in RMSE compared to Ordinary Kriging. This advantage is most pronounced for organic pollutants (29% reduction) and in data-rich environments (27% reduction for n > 100). This suggests that ML’s strength lies in capturing the complex, non-linear dynamics associated with organic matter degradation and transport, which are often less successfully modeled by the linear assumptions of kriging.
- Context matters considerably. The performance advantage of ML diminishes in data-sparse scenarios (12% reduction for n < 50) and for physical parameters (8% reduction, non-significant). This supports the “no free lunch” theorem in spatial prediction no single method is universally superior. For practitioners with limited data (<50 samples), geostatistical methods remain a robust and interpretable choice. For physical parameters like TSS and turbidity, which may exhibit simpler spatial structures, the added complexity of ML may not be warranted.
- Co-Kriging provides consistent improvements (15% RMSE reduction) when auxiliary variables are available, validating its use for parameters correlated with easily measured covariates (e.g., using EC as a covariate for SAR or chloride). This is a highly practical finding, as auxiliary data (e.g., from continuous sensors) are often cheaper and more abundant.
- Hybrid approaches show promise. The consistent performance advantage of hybrid models (18% improvement over the best single method) suggests that combining the pattern recognition capabilities of ML with the spatial structure modeling of geostatistics represents a fruitful direction for method development.
- Data quality and study design influence results. Higher quality studies showed greater ML advantages, potentially due to more rigorous validation protocols and better feature engineering.
- These findings have practical implications for wastewater management:
- For routine monitoring with limited data (n < 50): Geostatistical methods remain robust and interpretable choices.
- For complex pollution assessments with abundant data (n > 100): ML methods offer superior accuracy, particularly when auxiliary variables are available.
- For decision-critical applications: Hybrid models or ensemble approaches may offer the best balance of accuracy and uncertainty quantification.
It is important to acknowledge a potential confounding factor in these comparisons: the performance advantage of ML and Co-Kriging over univariate methods like OK may partially reflect the value of incorporating auxiliary variables (e.g., land use, easily measured covariates) rather than the superiority of the algorithm alone. In many studies, ML methods and Co-Kriging leverage these additional data, while OK does not. This highlights the need for future studies designed to disentangle these effects.
- Limitations and Future Research Needs:
This analysis identified several limitations in the current literature:
- Inconsistent reporting of uncertainty metrics and validation protocols
- Limited evaluation of method performance under different spatial configurations (clustered vs. regular sampling)
- Sparse investigation of temporal aspects in spatiotemporal interpolation
- Need for standardized benchmarks to facilitate direct comparison across studies
- Confounding of method and data type, as discussed above
Future research should prioritize:
- Development of wastewater-specific interpolation benchmarks
- Investigation of transfer learning approaches for data-scarce regions
- Integration of process-based knowledge with data-driven interpolation
- Enhanced focus on uncertainty communication for decision support
- Study designs that systematically control for the type and quality of auxiliary data to better isolate the contribution of the algorithm itself.
9. Future Directions: A Research Roadmap
To move the field from descriptive mapping to predictive and prescriptive analytics, future research must tackle several frontier challenges. Based on this synthesis, the following roadmap is proposed:
9.1. From Static to Dynamic Digital Twins
Future systems will evolve beyond static maps to dynamic “digital twins” of wastewater networks. This requires the tight integration of real-time IoT sensor data with hydraulic and quality models within a GIS environment. Research is needed on data assimilation techniques (e.g., Kalman filtering) to continuously update these digital twins, enabling real-time forecasting of pollutant plumes and system optimization [123,124,125,126].
9.2. Explainable AI (XAI) for Spatial Models
As ML models become more complex, their “black box” nature is a barrier to adoption by regulators and engineers. A critical research direction is developing XAI methods for spatial predictions, such as SHAP (SHapley Additive exPlanations) values, to interpret which factors are most influential in a specific spatial prediction, building trust and facilitating insight [99].
9.3. Advanced Uncertainty Quantification and Communication
While kriging provides variance, communicating this uncertainty to stakeholders remains a challenge. Future work should focus on developing intuitive visualizations of uncertainty (e.g., prediction intervals, probability of exceedance maps) and embedding this uncertainty directly into decision-support frameworks for risk-based management [108].
9.4. Assimilation of Novel Data Sources
Research should explore the formal assimilation of non-traditional data sources. This includes using high-resolution remote sensing (e.g., hyperspectral imagery) for surface water quality and investigating methods to incorporate citizen science data, after rigorous quality control, to dramatically increase spatial data density [126].
9.5. Interoperability and Open-Source Platforms
To ensure wide adoption, especially in resource-limited settings, future efforts should prioritize the development of open-source, user-friendly platforms and standardized workflows that integrate GIS, interpolation tools, and data preprocessing pipelines. This will promote reproducibility and collaborative development [127,128,129].
9.6. Interdisciplinary and Systems-Based Approaches
Increasingly, the field is transitioning toward holistic, systems-based solutions that integrate environmental chemistry, process engineering, informatics, and data science. This shift is essential to address both the technical and regulatory challenges posed by evolving effluent standards, sustainability imperatives, and the complex nature of wastewater sources [130,131,132,133,134,135,136,137,138,139]. Precise, high-resolution characterization supports the development of effective policies, early warning systems, and the design of innovative treatment processes, which reduce environmental and public health risks.
9.7. Frontiers: Membrane and Hybrid Technologies
Innovations in membrane bioreactors, combined physicochemical-biological systems, and advanced oxidation are creating new demands for feed characterization, particularly for constituents that affect fouling, biodegradability, or removal efficiency [137,140,141,142]. High-resolution input characterization, driven by advanced analytics and real-time monitoring, will be crucial in maximizing the performance and sustainability of these next-generation treatment train designs. In summary, future wastewater characterization is increasingly focused on real-time, high-resolution, and predictive modalities, enabled by the integration of smart sensor networks, multivariate statistical and machine learning analytics, and interdisciplinary systems thinking. This convergence is crucial for enabling adaptive, efficient, and sustainable wastewater management that meets 21st-century environmental and public health requirements [135,139].
9.8. Addressing Evidence Gaps
The meta-analysis identified several limitations in the current literature that future research should address:
- Inconsistent reporting of uncertainty metrics: Standardized reporting protocols would facilitate meta-analytic synthesis and improve comparability across studies.
- Limited evaluation under different sampling designs: Research should systematically investigate how sampling configuration (clustered vs. regular, transect vs. grid) affects relative method performance.
- Sparse investigation of temporal dynamics: Most studies focus on static interpolation; spatiotemporal methods that leverage both dimensions warrant further attention.
- Need for standardized benchmarks: Development of wastewater-specific benchmark datasets would enable direct comparison of methods across studies and accelerate method development.
- Transfer learning for data-scarce regions: Methods that leverage knowledge from data-rich regions to improve predictions in data-sparse areas could significantly expand the applicability of advanced interpolation techniques.
- Disentangling method from data: Future comparative studies should be designed to systematically control for auxiliary data inputs, allowing researchers to determine whether performance gains are due to the algorithm itself or simply the use of more informative covariates.
10. Conclusions
This review has synthesized the role of GIS and spatial interpolation in characterizing wastewater-derived pollutants across engineered systems and receiving environments. A critical evaluation of the methodological spectrum has been provided, offering mechanistic explanations for why specific techniques suit particular wastewater parameters and contexts.
The systematic review and meta-analysis provide the first quantitative evidence specifically for wastewater applications, demonstrating that:
- Machine learning methods achieve 21% lower RMSE than Ordinary Kriging on average, with context-dependent advantages most pronounced for organic pollutants (29% reduction) and data-rich environments (27% reduction with n > 100).
- Co-Kriging provides 15% RMSE reduction over Ordinary Kriging when auxiliary variables are available, validating its use for parameters correlated with easily measured covariates.
- Hybrid approaches combining ML with geostatistics achieve 18% improvement over the best single method, representing a particularly promising direction.
- The performance advantage of ML diminishes in data-sparse scenarios (12% reduction with n < 50) and for physical parameters (8% reduction, non-significant), where geostatistical methods remain competitive.
The choice of interpolation method is not merely technical but strategic, contingent on data characteristics, parameter behavior, and management objectives. For data-sparse applications (n < 50), geostatistical methods remain robust and interpretable. For complex, data-rich scenarios (n > 100), ML offers superior accuracy. For decision-critical applications, hybrid methods may provide the best balance of accuracy and uncertainty quantification.
The paramount challenge remains translating spatial predictions into confident action. This necessitates robust data preprocessing, careful method selection, and most importantly the effective communication of predictive uncertainty. The future of wastewater mapping lies in the transition from static, historical analysis to dynamic, intelligent systems. The integration of real-time sensor networks, AI-driven analytics, and digital twin concepts promises a new era of adaptive management, where spatial interpolation serves as the core of predictive early-warning systems and optimized infrastructure planning.
By providing a critical synthesis, quantitative evidence base, and clear research roadmap, this review underscores that the ongoing evolution in spatial interpolation is pivotal for building resilient, sustainable and intelligent wastewater management systems for the 21st century.
Supplementary Materials
The following supporting information can be downloaded at: https://www.mdpi.com/article/10.3390/environments13040194/s1. File S1: PRISMA 2020 Checklist [3]. File S2: Complete search strings for each database. File S3: Data extraction form and quality assessment scores for all 22 studies. File S4: Complete meta-analysis dataset (RoM values, confidence intervals, study characteristics).
Author Contributions
Conceptualization, M.A.A.-F. and A.A.; methodology, M.A.A.-F. and A.A.; software, M.A.A.-F. and A.A.; validation, M.A.A.-F. and A.A., M.A.A.-F. and A.A.; formal analysis, M.A.A.-F. and A.A.; investigation, M.A.A.-F. and A.A.; resources, M.A.A.-F. and A.A.; data curation, M.A.A.-F. and A.A.; writing—original draft preparation, M.A.A.-F. and A.A.; writing—review and editing, M.A.A.-F. and A.A.; visualization, M.A.A.-F. and A.A.; supervision, M.A.A.-F. and A.A.; project administration, M.A.A.-F. and A.A.; funding acquisition, M.A.A.-F. and A.A. All authors have read and agreed to the published version of the manuscript.
Funding
This research received no external funding.
Data Availability Statement
No new data were created or analyzed in this study. Data sharing is not applicable to this article.
Conflicts of Interest
The authors declare no conflict of interest.
Abbreviations
| ANN | Artificial Neural Network |
| BOD5 | Biochemical Oxygen Demand (5-day) |
| CI | Confidence Interval |
| COD | Chemical Oxygen Demand |
| CoK | Co-Kriging |
| CWQI | Canadian Water Quality Index |
| DO | Dissolved Oxygen |
| EBK | Empirical Bayesian Kriging |
| EC | Electrical Conductivity |
| FA | Factor Analysis |
| GAM | Generalized Additive Model |
| GCV | Generalized Cross-Validation |
| GIS | Geographic Information System |
| GPR | Gaussian Process Regression |
| GSLib | Geostatistical Software Library |
| IDW | Inverse Distance Weighting |
| IK | Indicator Kriging |
| INLA | Integrated Nested Laplace Approximations |
| IoT | Internet of Things |
| IPDW | Inverse Path Distance Weighting |
| IQR | Interquartile Range |
| LIDAR | Light Detection and Ranging |
| MAE | Mean Absolute Error |
| MBA | Multi-level B-spline Approximation |
| MBE | Mean Bias Error |
| ML | Machine Learning |
| OK | Ordinary Kriging |
| PCA | Principal Component Analysis |
| PRISMA | Preferred Reporting Items for Systematic Reviews and Meta-Analyses |
| QASD | Quality Assessment for Spatial Prediction Studies |
| REML | Restricted Maximum Likelihood |
| RF | Random Forest |
| RK | Regression Kriging |
| RMSE | Root Mean Square Error |
| RoM | Ratio of Means |
| SAGA | System for Automated Geoscientific Analyses |
| SAR | Sodium Adsorption Ratio |
| SCADA | Supervisory Control and Data Acquisition |
| SMD | Standardized Mean Difference |
| SPDE | Stochastic Partial Differential Equation |
| SVR | Support Vector Regression |
| TDS | Total Dissolved Solids |
| TIN | Triangulated Irregular Network |
| TSS | Total Suspended Solids |
| UK | Universal Kriging |
| WASP | Water Quality Analysis Simulation Program |
| XAI | Explainable Artificial Intelligence |
References
- Hughes, J.; Cowper-Heays, K.; Olesson, E.; Bell, R.; Stroombergen, A. Impacts and implications of climate change on wastewater systems: A New Zealand perspective. Clim. Risk Manag. 2021, 31, 100262. [Google Scholar] [CrossRef] [Scilit]
- Javan, K.; Darestani, M.; Ibrar, I.; Pignatta, G. Interrelated issues within the Water-Energy-Food nexus with a focus on environmental pollution for sustainable development: A review. Environ. Pollut. 2025, 368, 125706. [Google Scholar] [CrossRef] [Scilit]
- Page, M.J.; McKenzie, J.E.; Bossuyt, P.M.; Boutron, I.; Hoffmann, T.C.; Mulrow, C.D.; Shamseer, L.; Tetzlaff, J.M.; Akl, E.A.; Brennan, S.E.; et al. The PRISMA 2020 statement: An updated guideline for reporting systematic reviews. BMJ 2021, 372, n71. [Google Scholar] [CrossRef] [Scilit]
- Singh, S.; Ahmed, A.I.; Almansoori, S.; Alameri, S.; Adlan, A.; Odivilas, G.; Chattaway, M.A.; Bin Salem, S.; Brudecki, G.; Elamin, W. A narrative review of wastewater surveillance: Pathogens of concern, applications, detection methods, and challenges. Front. Public Health 2024, 12, 1445961. [Google Scholar] [CrossRef] [Scilit]
- Mahmood, W.; Hatem, W.A. Performance assessment of Al-Rustumiah wastewater treatment plant using multivariate statistical technique. Appl. Water Sci. 2024, 14, 82. [Google Scholar] [CrossRef] [Scilit]
- Cairone, S.; Hasan, S.W.; Choo, K.-H.; Lekkas, D.F.; Fortunato, L.; Zorpas, A.A.; Korshin, G.; Zarra, T.; Belgiorno, V.; Naddeo, V. Revolutionizing wastewater treatment toward circular economy and carbon neutrality goals: Pioneering sustainable and efficient solutions for automation and advanced process control with smart and cutting-edge technologies. J. Water Process Eng. 2024, 63, 105486. [Google Scholar] [CrossRef] [Scilit]
- El Aatik, A.; Navarro, J.M.; Martínez, R.; Vela, N. Estimation of Global Water Quality in Four Municipal Wastewater Treatment Plants over Time Based on Statistical Methods. Water 2023, 15, 1520. [Google Scholar] [CrossRef] [Scilit]
- Gupta, A.S.; Khatiwada, D. Investigating the sustainability of biogas recovery systems in wastewater treatment plants- A circular bioeconomy approach. Renew. Sustain. Energy Rev. 2024, 199, 114447. [Google Scholar] [CrossRef] [Scilit]
- Nkuna, S.G.; Olwal, T.O.; Chowdhury, S.D.; Ndambuki, J.M. A review of wastewater sludge-to-energy generation focused on thermochemical technologies: An improved technological, economical and socio-environmental aspect. Clean. Waste Syst. 2024, 7, 100130. [Google Scholar] [CrossRef] [Scilit]
- Khouni, I.; Louhichi, G.; Ghrabi, A. Use of GIS based Inverse Distance Weighted interpolation to assess surface water quality: Case of Wadi El Bey, Tunisia. Environ. Technol. Innov. 2021, 24, 101892. [Google Scholar] [CrossRef] [Scilit]
- Ahmad, A.Y.; Saleh, I.A.; Balakrishnan, P.; Al-Ghouti, M.A. Comparison GIS-Based interpolation methods for mapping groundwater quality in the state of Qatar. Groundw. Sustain. Dev. 2021, 13, 100573. [Google Scholar] [CrossRef] [Scilit]
- Saha, A.; Gupta, B.S.; Patidar, S.; Martínez-Villegas, N. Optimal GIS interpolation techniques and multivariate statistical approach to study the soil-trace metal(loid)s distribution patterns in the agricultural surface soil of Matehuala, Mexico. J. Hazard. Mater. Adv. 2023, 9, 100243. [Google Scholar] [CrossRef] [Scilit]
- Gonzales-Inca, C.; Calle, M.; Croghan, D.; Haghighi, A.T.; Marttila, H.; Silander, J.; Alho, P. Geospatial Artificial Intelligence (GeoAI) in the Integrated Hydrological and Fluvial Systems Modeling: Review of Current Applications and Trends. Water 2022, 14, 2211. [Google Scholar] [CrossRef] [Scilit]
- Obaideen, K.; Shehata, N.; Sayed, E.T.; Abdelkareem, M.A.; Mahmoud, M.S.; Olabi, A. The role of wastewater treatment in achieving sustainable development goals (SDGs) and sustainability guideline. Energy Nexus 2022, 7, 100112. [Google Scholar] [CrossRef] [Scilit]
- Singh, B.J.; Chakraborty, A.; Sehgal, R. A systematic review of industrial wastewater management: Evaluating challenges and enablers. J. Environ. Manag. 2023, 348, 119230. [Google Scholar] [CrossRef] [Scilit]
- Glassmeyer, S.T.; Burns, E.E.; Focazio, M.J.; Furlong, E.T.; Gribble, M.O.; Jahne, M.A.; Keely, S.P.; Kennicutt, A.R.; Kolpin, D.W.; Kakaley, E.K.M.; et al. Water, Water Everywhere, but Every Drop Unique: Challenges in the Science to Understand the Role of Contaminants of Emerging Concern in the Management of Drinking Water Supplies. GeoHealth 2023, 7, e2022GH000716. [Google Scholar] [CrossRef] [Scilit]
- Nishmitha, P.S.; Akhilghosh, K.A.; Aiswriya, V.P.; Ramesh, A.; Muthuchamy, M.; Muthukumar, A. Understanding emerging contaminants in water and wastewater: A comprehensive review on detection, impacts, and solutions. J. Hazard. Mater. Adv. 2025, 18, 100755. [Google Scholar] [CrossRef] [Scilit]
- American Public Health Association. Standard Methods for the Examination of Water and Wastewater; American Public Health Association: Washington, DC, USA, 2017. [Google Scholar]
- Carreres-Prieto, D.; García, J.T.; Cerdán-Cartagena, F.; Suardiaz-Muro, J.; Lardín, C. Implementing Early Warning Systems in WWTP. An investigation with cost-effective LED-VIS spectroscopy-based genetic algorithms. Chemosphere 2022, 293, 133610. [Google Scholar] [CrossRef] [Scilit]
- Miller, M.; Kisiel, A.; Cembrowska-Lech, D.; Durlik, I.; Miller, T. IoT in Water Quality Monitoring-Are We Really Here? Sensors 2023, 23, 960. [Google Scholar] [CrossRef] [Scilit] [PubMed]
- Sun, Y.; Wang, D.; Li, L.; Ning, R.; Yu, S.; Gao, N. Application of remote sensing technology in water quality monitoring: From traditional approaches to artificial intelligence. Water Res. 2024, 267, 122546. [Google Scholar] [CrossRef] [Scilit]
- Edwards, T.M.; Puglis, H.J.; Kent, D.B.; Durán, J.L.; Bradshaw, L.M.; Farag, A.M. Ammonia and aquatic ecosystems—A review of global sources, biogeochemical cycling, and effects on fish. Sci. Total Environ. 2024, 907, 167911. [Google Scholar] [CrossRef] [Scilit]
- Schullehner, J.; Stayner, L.; Hansen, B. Nitrate, nitrite, and ammonium variability in drinking water distribution systems. Int. J. Environ. Res. Public Health 2017, 14, 276. [Google Scholar] [CrossRef] [Scilit] [PubMed]
- Moretti, A.; Ivan, H.L.; Skvaril, J. A review of the state-of-the-art wastewater quality characterization and measurement technologies. Is the shift to real-time monitoring nowadays feasible? J. Water Process Eng. 2024, 60, 105061. [Google Scholar] [CrossRef] [Scilit]
- Ayalew, A.; Tegenu, M. Spatial Distribution and Trend Analysis of Groundwater Contaminants Using the ArcGIS Geostatistical Analysis (Kriging) Algorithm; The case of Gurage Zone, Ethiopia. Res. Sq. 2024. [Google Scholar]
- Wang, S.; Zheng, M.; Tian, Y.; Ding, H.; Yan, L.; Xi, B.; Sun, Y.; Su, J. Ecological risk assessment of oilfield soil through the use of machine learning combining with spatial interaction effects. Ecotoxicol. Environ. Saf. 2025, 302, 118527. [Google Scholar] [CrossRef] [Scilit] [PubMed]
- Das, A. Evaluation and prediction of surface water quality status for drinking purposes using an integrated water quality indices, GIS approaches, and machine learning techniques. Desalination Water Treat. 2025, 323, 101350. [Google Scholar] [CrossRef] [Scilit]
- Odonkor, S.T.; Mahami, T. Escherichia coli as a Tool for Disease Risk Assessment of Drinking Water Sources. Int. J. Microbiol. 2020, 2020, 2534130. [Google Scholar] [CrossRef] [Scilit]
- Ahmed, W.; Hamilton, K.; Toze, S.; Cook, S.; Page, D. A review on microbial contaminants in stormwater runoff and outfalls: Potential health risks and mitigation strategies. Sci. Total Environ. 2019, 692, 1304–1321. [Google Scholar] [CrossRef] [Scilit]
- Lu, F.; Zhang, H.; Liu, W. Development and application of a GIS-based artificial neural network system for water quality prediction: A case study at the Lake Champlain area. J. Oceanol. Limnol. 2020, 38, 1835–1845. [Google Scholar] [CrossRef] [Scilit]
- Simonetti, F.; Brillarelli, S.; Agostini, M.; Mancini, M.; Gioia, V.; Murtas, S.; Migliorati, V. A review on the latest frontiers in water quality in the era of emerging contaminants: A focus on perfluoroalkyl compounds. Environ. Pollut. 2025, 381, 126402. [Google Scholar] [CrossRef] [Scilit]
- Augusto, M.R.; Claro, I.C.M.; Siqueira, A.K.; Sousa, G.S.; Caldereiro, C.R.; Duran, A.F.A.; de Miranda, T.B.; Camillo, L.d.M.B.; Cabral, A.D.; Bueno, R.d.F. Sampling strategies for wastewater surveillance: Evaluating the variability of SARS-CoV-2 RNA concentration in composite and grab samples. J. Environ. Chem. Eng. 2022, 10, 107478. [Google Scholar] [CrossRef] [Scilit]
- Abbas, A.; Salloom, G.; Ruddock, F.; Alkhaddar, R.; Hammoudi, S.; Andoh, R.; Carnacina, I. Modelling data of an urban drainage design using a Geographic Information System (GIS) database. J. Hydrol. 2019, 574, 450–466. [Google Scholar] [CrossRef] [Scilit]
- Amin, M.; ElSayed, M.; Bazedi, G.; Hawash, S. Sewage water treatment plant using diffused air system. J. Eng. Appl. Sci. 2016, 11, 10501–10506. [Google Scholar]
- Amin, A.; Hawash, S.; Amin, M. Model of Aeration Tank for Activated Sludge Process. Recent Innov. Chem. Eng. (Former. Recent Pat. Chem. Eng.) 2019, 12, 326–337. [Google Scholar] [CrossRef] [Scilit]
- Stachelek, J.; Madden, C.J. Application of inverse path distance weighting for high-density spatial mapping of coastal water quality patterns. Int. J. Geogr. Inf. Sci. 2015, 29, 1240–1250. [Google Scholar] [CrossRef] [Scilit]
- Abdel-Fatah, M.A.; Amin, A.; Elkady, H. Chapter 16—Industrial wastewater treatment by membrane process. In Membrane-Based Hybrid Processes for Wastewater Treatment; Shah, M.P., Rodriguez-Couto, S., Eds.; Elsevier: Amsterdam, The Netherlands, 2021; pp. 341–365. [Google Scholar]
- Zaresefat, M.; Derakhshani, R.; Griffioen, J. Empirical Bayesian Kriging, a Robust Method for Spatial Data Interpolation of a Large Groundwater Quality Dataset from the Western Netherlands. Water 2024, 16, 2581. [Google Scholar] [CrossRef] [Scilit]
- Varol, M. Use of water quality index and multivariate statistical methods for the evaluation of water quality of a stream affected by multiple stressors: A case study. Environ. Pollut. 2020, 266, 115417. [Google Scholar] [CrossRef] [Scilit]
- Bouchra, D.; Allaoua, N.; Ghanem, N.; Hafid, H.; Benacherine, M.; Chenchouni, H. Assessment of water quality of groundwater, surface water, and wastewater using physicochemical parameters and microbiological indicators. Sci. Prog. 2025, 108, 1–35. [Google Scholar] [CrossRef] [Scilit]
- Karandish, F.; Shahnazari, A. Appraisal of the geostatistical methods to estimate Mazandaran coastal ground water quality. Casp. J. Environ. Sci. 2014, 12, 129–146. [Google Scholar]
- Murphy, R.; Curriero, F. Comparison of Spatial Interpolation Methods for Water Quality Evaluation in the Chesapeake Bay. J. Environ. Eng. 2010, 136, 160–171. [Google Scholar] [CrossRef] [Scilit]
- Sun, Y.; Kang, S.; Li, F.; Zhang, L. Comparison of Interpolation Methods for Depth to Groundwater and Its Temporal and Spatial Variations in the Minqin Oasis of Northwest China. Environ. Model. Softw. 2009, 24, 1163–1170. [Google Scholar] [CrossRef] [Scilit]
- Arslan, H. Spatial and temporal mapping of groundwater salinity using ordinary kriging and indicator kriging: The case of Bafra Plain, Turkey. Agric. Water Manag. 2012, 113, 57–63. [Google Scholar] [CrossRef] [Scilit]
- Belkhiri, L.; Tiri, A.; Mouni, L. Study of the spatial distribution of groundwater quality index using geostatistical models. Groundw. Sustain. Dev. 2020, 11, 100473. [Google Scholar] [CrossRef] [Scilit]
- Farzaneh, G.; Khorasani, N.; Ghodousi, J.; Panahi, M. Application of geostatistical models to identify spatial distribution of groundwater quality parameters. Environ. Sci. Pollut. Res. 2022, 29, 36512–36532. [Google Scholar] [CrossRef] [Scilit]
- Li, J.; Heap, A.D. Spatial interpolation methods applied in the environmental sciences: A review. Environ. Model. Softw. 2014, 53, 173–189. [Google Scholar] [CrossRef] [Scilit]
- Syeed, M.M.M.; Hossain, M.S.; Karim, M.R.; Uddin, M.F.; Hasan, M.; Khan, R.H. Surface water quality profiling using the water quality index, pollution index and statistical methods: A critical review. Environ. Sustain. Indic. 2023, 18, 100247. [Google Scholar] [CrossRef] [Scilit]
- Ngwenya, B.; Paepae, T.; Bokoro, P.N. Monitoring ambient water quality using machine learning and IoT: A review and recommendations for advancing SDG indicator 6.3.2. J. Water Process Eng. 2025, 73, 107664. [Google Scholar] [CrossRef] [Scilit]
- Alruwais, N.; Marzouk, R.; Albalawneh, D.; Arasi, M.A.; Shobana, M.; Kavitha, R. Impact analysis of polluted waste water discharge in river and management process using machine learning and GIS approach. Desalination Water Treat. 2025, 323, 101323. [Google Scholar] [CrossRef] [Scilit]
- Shukla, B.K.; Gupta, L.; Parashar, B.; Sharma, P.K.; Sihag, P.; Shukla, A.K. Integrative Assessment of Surface Water Contamination Using GIS, WQI, and Machine Learning in Urban-Industrial Confluence Zones Surrounding the National Capital Territory of the Republic of India. Water 2025, 17, 1076. [Google Scholar] [CrossRef] [Scilit]
- Kalogiannidis, S.; Kalfas, D.; Giannarakis, G.; Paschalidou, M. Integration of Water Resources Management Strategies in Land Use Planning towards Environmental Conservation. Sustainability 2023, 15, 15242. [Google Scholar] [CrossRef] [Scilit]
- Chen, X.; Zhang, H.; Wong, C.U. Dynamic Monitoring and Precision Fertilization Decision System for Agricultural Soil Nutrients Using UAV Remote Sensing and GIS. Agriculture 2025, 15, 1627. [Google Scholar] [CrossRef] [Scilit]
- Giraldo, R.; Leiva, V.; Castro, C. An Overview of Kriging and Cokriging Predictors for Functional Random Fields. Mathematics 2023, 11, 3425. [Google Scholar] [CrossRef] [Scilit]
- Guo, X.; Kurtek, S.; Bharath, K. Variograms for kriging and clustering of spatial functional data with phase variation. Spat. Stat. 2022, 51, 100687. [Google Scholar] [CrossRef] [Scilit]
- Takoutsing, B.; Heuvelink, G.B.M. Comparing the prediction performance, uncertainty quantification and extrapolation potential of regression kriging and random forest while accounting for soil measurement errors. Geoderma 2022, 428, 116192. [Google Scholar] [CrossRef] [Scilit]
- Juang, K.-W.; Chen, Y.-S.; Lee, D.-Y. Using sequential indicator simulation to assess the uncertainty of delineating heavy-metal contaminated soils. Environ. Pollut. 2004, 127, 229–238. [Google Scholar] [CrossRef] [Scilit]
- Allende-Prieto, C.; Méndez-Fernández, B.I.; Sañudo-Fontaneda, L.A.; Charlesworth, S.M. Development of a Geospatial Data-Based Methodology for Stormwater Management in Urban Areas Using Freely-Available Software. Int. J. Environ. Res. Public Health 2018, 15, 1703. [Google Scholar] [CrossRef] [Scilit]
- Majidi Nezhad, M.; Moradian, S.; Guezgouz, M.; Shi, X.; Avelin, A.; Wallin, F. A GIS-portal platform from the data perspective to energy hub digitalization solutions—A review and a case study. Renew. Sustain. Energy Rev. 2025, 223, 116019. [Google Scholar] [CrossRef] [Scilit]
- Alzahrani, N.A.; Abdullah, S.N.H.S.; Adnan, N.; Ariffin, K.A.Z.; Mukred, M.; Mohamed, I.; Wahab, S. Geographic information systems adoption model: A partial least square-structural equation modeling analysis approach. Heliyon 2024, 10, e35039. [Google Scholar] [CrossRef] [Scilit] [PubMed]
- Zhou, X.; Huang, Z.; Xia, T.; Zhang, X.; Duan, Z.; Wu, J.; Zhou, G. The integrated application of big data and geospatial analysis in maritime transportation safety management: A comprehensive review. Int. J. Appl. Earth Obs. Geoinf. 2025, 138, 104444. [Google Scholar] [CrossRef] [Scilit]
- Leeonis, A.N.; Ahmed, M.F.; Mokhtar, M.B.; Lim, C.K.; Halder, B. Challenges of Using a Geographic Information System (GIS) in Managing Flash Floods in Shah Alam, Malaysia. Sustainability 2024, 16, 7528. [Google Scholar] [CrossRef] [Scilit]
- Cook, D.; Pétursson, J.G. The role of GIS mapping in multi-criteria decision analysis in informing the location and design of renewable energy projects—A systematic review. Energy Strategy Rev. 2025, 59, 101765. [Google Scholar] [CrossRef] [Scilit]
- Habeeb, N.; Talib, S. Combination of GIS with Different Technologies for Water Quality: An Overview. HighTech Innov. J. 2021, 2, 262–272. [Google Scholar] [CrossRef] [Scilit]
- Saravanan, K.; Anusuya, E.; Kumar, R.; Son, L.H. Real-time water quality monitoring using Internet of Things in SCADA. Environ. Monit. Assess. 2018, 190, 556. [Google Scholar] [CrossRef] [Scilit]
- Ghodsi, S.H.; Zhu, Z.; Matott, L.S.; Rabideau, A.J.; Torres, M.N. Optimal siting of rainwater harvesting systems for reducing combined sewer overflows at city scale. Water Res. 2023, 230, 119533. [Google Scholar] [CrossRef] [Scilit]
- Bartos, M.; Kerkez, B. Pipedream: An interactive digital twin model for natural and urban drainage systems. Environ. Model. Softw. 2021, 144, 105120. [Google Scholar] [CrossRef] [Scilit]
- Sehrawat, S.; Shekhar, S. Integrating low impact development practices with GIS and SWMM for enhanced urban drainage and flood mitigation: A case study of Gurugram, India. Urban Gov. 2025, 5, 240–255. [Google Scholar] [CrossRef] [Scilit]
- Rajalakshmi, S.; Subathradevi, S.; Alghamdi, A.G.; Alsolai, H. Integrated remote sensing, machine learning and geospatial approach for site selection of sewage treatment plants in the metropolitan city. Desalination Water Treat. 2025, 322, 101244. [Google Scholar] [CrossRef] [Scilit]
- Pakati, S.S.; Shoko, C.; Dube, T. Integrated flood modelling and risk assessment in urban areas: A review on applications, strengths, limitations and future research directions. J. Hydrol. Reg. Stud. 2025, 61, 102583. [Google Scholar] [CrossRef] [Scilit]
- Jawale, P.S.; Thube, A.D. Rainfall-runoff modeling of urban floods using GIS and HEC-HMS. MethodsX 2025, 15, 103437. [Google Scholar] [CrossRef] [Scilit] [PubMed]
- Goovaerts, P. Geostatistics for Natural Resources Evaluation; Oxford University Press: Oxford, UK, 1997. [Google Scholar]
- Wu, C.-Y.; Mossa, J.; Mao, L.; Almulla, M. Comparison of different spatial interpolation methods for historical hydrographic data of the lowermost Mississippi River. Ann. GIS 2019, 25, 133–151. [Google Scholar] [CrossRef] [Scilit]
- Salehi, S.; Barati, R.; Baghani, M.; Sakhdari, S.; Maghrebi, M. Interpolation methods for spatial distribution of groundwater mapping electrical conductivity. Sci. Rep. 2024, 14, 30337. [Google Scholar] [CrossRef] [Scilit]
- Shawky, M.M. A comparative study of interpolation methods for the development of ore distribution maps. Discov. Geosci. 2025, 3, 2. [Google Scholar] [CrossRef] [Scilit]
- Biernacik, P.; Kazimierski, W.; Włodarczyk-Sielicka, M. Comparative Analysis of Selected Geostatistical Methods for Bottom Surface Modeling. Sensors 2023, 23, 3941. [Google Scholar] [CrossRef] [Scilit] [PubMed]
- Gribov, A.; Krivoruchko, K. Empirical Bayesian kriging implementation and usage. Sci. Total Environ. 2020, 722, 137290. [Google Scholar] [CrossRef] [Scilit]
- De Jesus, K.L.M.; Senoro, D.B.; Dela Cruz, J.C.; Chan, E.B. A Hybrid Neural Network-Particle Swarm Optimization Informed Spatial Interpolation Technique for Groundwater Quality Mapping in a Small Island Province of the Philippines. Toxics 2021, 9, 273. [Google Scholar] [CrossRef] [Scilit] [PubMed]
- Zhao, N. A New Method for Spatial Estimation of Water Quality Using an Optimal Virtual Sensor Network and In Situ Observations: A Case Study of Chemical Oxygen Demand. Sensors 2023, 23, 4739. [Google Scholar] [CrossRef] [Scilit]
- Tadić, J.M.; Ilić, V.; Ilić, S.; Pavlović, M.; Tadić, V. Hybrid Machine Learning and Geostatistical Methods for Gap Filling and Predicting Solar-Induced Fluorescence Values. Remote Sens. 2024, 16, 1707. [Google Scholar] [CrossRef] [Scilit]
- Abémgnigni Njifon, M.; Schuhmacher, D. Graph convolutional networks for spatial interpolation of correlated data. Spat. Stat. 2024, 60, 100822. [Google Scholar] [CrossRef] [Scilit]
- Gardner-Frolick, R.; Boyd, D.; Giang, A. Selecting Data Analytic and Modeling Methods to Support Air Pollution and Environmental Justice Investigations: A Critical Review and Guidance Framework. Environ. Sci. Technol. 2022, 56, 2843–2860. [Google Scholar] [CrossRef] [Scilit]
- Ndou, N.; Nontongana, N. Bias evaluation and minimization for estuarine total dissolved solids (TDS) patterns constructed using spatial interpolation techniques. Mar. Pollut. Bull. 2025, 210, 117353. [Google Scholar] [CrossRef] [Scilit]
- Arman, N.Z.; Aris, A.; Salmiati, S.; Rosli, A.S.; Foze, M.F.; Talib, J. Water quality assessment of Johor River Basin, Malaysia, using multivariate analysis and spatial interpolation method. Environ. Sci. Pollut. Res. 2025, 32, 1766–1782. [Google Scholar] [CrossRef] [Scilit]
- Xiang, C.; Li, R.; Liang, A.; Wang, J. Analysis of air pollutants concentration variations and human impact by remote sensing: Implications for sustainable urban air quality management. Sustain. Futures 2025, 10, 101019. [Google Scholar] [CrossRef] [Scilit]
- Xia, W.; Zhao, Z.; Ke-Neng, Z.; Ze-Yu, L.; Yong, H.; Hui-Min, W. Spatial distribution and risk assessment of heavy metal pollution at a typical abandoned smelting site. Results Eng. 2025, 26, 105281. [Google Scholar] [CrossRef] [Scilit]
- EPA. National Pollutant Discharge Elimination System (NPDES); United States Environmental Protection Agency: Washington, DC, USA, 2020.
- Choudhary, R.; Kumari, S.; Kumar, A.; Kumar, P.; Choudhury, M.; Sharma, D.; Chadha, U.; Chowdhury, P.R.; Herlekar, M.; Sillanpää, M. Optimizing Wastewater Management Through Geospatial Analysis. In Smart Wastewater Systems and Climate Change: Innovations Through Spatial Intelligence; Choudhury, M., Majumdar, S., Goswami, S., Sillanpää, M., Eds.; Royal Society of Chemistry: London, UK, 2025; Volume 15. [Google Scholar]
- Sakti, A.D.; Mahdani, J.N.; Santoso, C.; Ihsan, K.T.N.; Nastiti, A.; Shabrina, Z.; Safira, M.; Rohmat, F.; Yulianto, F.; Virtriana, R. Optimizing city-level centralized wastewater management system using machine learning and spatial network analysis. Environ. Technol. Innov. 2023, 32, 103360. [Google Scholar] [CrossRef] [Scilit]
- Huang, G.; Lin, B.; Zhou, J.; Falconer, R.; Chen, Q. A new spatial interpolation method based on cross-sections sampling. In Proceedings of the 11th International Conference on Hydroinformatics, New York, NY, USA, 17–21 August 2014. [Google Scholar]
- Nalakurthi, N.V.S.R.; Abimbola, I.; Ahmed, T.; Anton, I.; Riaz, K.; Ibrahim, Q.; Banerjee, A.; Tiwari, A.; Gharbia, S. Challenges and Opportunities in Calibrating Low-Cost Environmental Sensors. Sensors 2024, 24, 3650. [Google Scholar] [CrossRef] [Scilit]
- Haberstroh, C.J. Geographical Information Systems (GIS) Applied to Urban Nutrient Management: Data Scarce Case Studies from Belize and Florida. Master’s Thesis, University of South Florida, Tampa, FL, USA, 2017. [Google Scholar]
- Ebrahimi, M. Assessment and Optimization of Environmental Systems Using Data Analysis and Simulation. Ph.D. Thesis, University of Louisville, Louisville, KY, USA, 2018. [Google Scholar]
- Das, A. An optimization based framework for water quality assessment and pollution source apportionment employing GIS and machine learning techniques for smart surface water governance. Discov. Environ. 2025, 3, 117. [Google Scholar] [CrossRef] [Scilit]
- Văduva, B.; Avram, A.; Matei, O.; Andreica, L.; Rusu, T. A GIS-Driven, Machine Learning-Enhanced Framework for Adaptive Land Bonitation. Agriculture 2025, 15, 1735. [Google Scholar] [CrossRef] [Scilit]
- Tien, P.W.; Wei, S.; Darkwa, J.; Wood, C.; Calautit, J.K. Machine Learning and Deep Learning Methods for Enhancing Building Energy Efficiency and Indoor Environmental Quality—A Review. Energy AI 2022, 10, 100198. [Google Scholar] [CrossRef] [Scilit]
- Olawade, D.B.; Wada, O.Z.; Ige, A.O.; Egbewole, B.I.; Olojo, A.; Oladapo, B.I. Artificial intelligence in environmental monitoring: Advancements, challenges, and future directions. Hyg. Environ. Health Adv. 2024, 12, 100114. [Google Scholar] [CrossRef] [Scilit]
- Maity, R.; Srivastava, A.; Sarkar, S.; Khan, M.I. Revolutionizing the future of hydrological science: Impact of machine learning and deep learning amidst emerging explainable AI and transfer learning. Appl. Comput. Geosci. 2024, 24, 100206. [Google Scholar] [CrossRef] [Scilit]
- Wang, Y.; Yuan, F.; Cammarano, D.; Liu, X.; Tian, Y.; Zhu, Y.; Cao, W.; Cao, Q. Integrating machine learning with spatial analysis for enhanced soil interpolation: Balancing accuracy and visualization. Smart Agric. Technol. 2025, 11, 101032. [Google Scholar] [CrossRef] [Scilit]
- Lamichhane, M.; Mehan, S.; Mankin, K.R. Soil Moisture Prediction Using Remote Sensing and Machine Learning Algorithms: A Review on Progress, Challenges, and Opportunities. Remote Sens. 2025, 17, 2397. [Google Scholar] [CrossRef] [Scilit]
- Ghosh, S.S.; Khati, U.; Kumar, S.; Bhattacharya, A.; Lavalle, M. Gaussian process regression-based forest above ground biomass retrieval from simulated L-band NISAR data. Int. J. Appl. Earth Obs. Geoinf. 2023, 118, 103252. [Google Scholar] [CrossRef] [Scilit]
- Singh, S.; Sarma, K. Exploring Soil Spatial Variability with GIS, Remote Sensing, and Geostatistical Approach. J. Soil Plant Environ. 2023, 2, 79–99. [Google Scholar] [CrossRef] [Scilit]
- Chappell, A.; Heritage, G.L.; Fuller, I.C.; Large, A.R.G.; Milan, D.J. Geostatistical analysis of ground-survey elevation data to elucidate spatial and temporal river channel change. Earth Surf. Process. Landf. 2003, 28, 349–370. [Google Scholar] [CrossRef] [Scilit]
- Yang, S.; Behzadian, K.; Coleman, C.; Holloway, T.G.; Campos, L.C. Application of AI-based techniques for anomaly management in wastewater treatment plants: A review. J. Environ. Manag. 2025, 392, 126886. [Google Scholar] [CrossRef] [Scilit] [PubMed]
- Bezyk, Y.; Sówka, I.; Górka, M.; Blachowski, J. GIS-Based Approach to Spatio-Temporal Interpolation of Atmospheric CO2 Concentrations in Limited Monitoring Dataset. Atmosphere 2021, 12, 384. [Google Scholar] [CrossRef] [Scilit]
- Huang, Y.-N.; Munteanu, V.; Love, M.I.; Ronkowski, C.F.; Deshpande, D.; Wong-Beringer, A.; Corbett-Detig, R.; Dimian, M.; Moore, J.H.; Garmire, L.X.; et al. Perceptual and technical barriers in sharing and formatting metadata accompanying omics studies. Cell Genom. 2025, 5, 100845. [Google Scholar] [CrossRef] [Scilit]
- Wackernagel, H. Multivariate Geostatistics; Springer: Berlin/Heidelberg, Germany, 2003. [Google Scholar]
- Tsaneva-Atanasova, K.; Pederzanil, G.; Laviola, M. Decoding uncertainty for clinical decision-making. Philos. Trans. R. Soc. A Math. Phys. Eng. Sci. 2025, 383, 20240207. [Google Scholar] [CrossRef] [Scilit]
- Li, M.; Xu, P.; Hu, J.; Tang, Z.; Yang, G. From challenges and pitfalls to recommendations and opportunities: Implementing federated learning in healthcare. Med. Image Anal. 2025, 101, 103497. [Google Scholar] [CrossRef] [Scilit]
- Aldungarova, A.; Utepov, Y.; Mukhamejanova, A.; Tulebekova, A.; Nazarova, A.; Tleubayeva, A.; Makasheva, I.; Zhakapbayeva, G.; Makhiyev, B.; Mkilima, T. Advancing Intermediate Soil Properties (ISP) Interpolation for Enhanced Geotechnical Survey Accuracy. A Review. Eng. Rep. 2025, 7, e70328. [Google Scholar] [CrossRef] [Scilit]
- Bertsch, R.; Glenis, V.; Kilsby, C. Urban Flood Simulation Using Synthetic Storm Drain Networks. Water 2017, 9, 925. [Google Scholar] [CrossRef] [Scilit]
- Stewart, O.T.; Carlos, H.A.; Lee, C.; Berke, E.M.; Hurvitz, P.M.; Li, L.; Moudon, A.V.; Doescher, M.P. Secondary GIS built environment data for health research: Guidance for data development. J. Transp. Health 2016, 3, 529–539. [Google Scholar] [CrossRef] [Scilit] [PubMed]
- Anselin, L. Local Indicators of Spatial Association-LISA. Geogr. Anal. 1995, 27, 93–115. [Google Scholar] [CrossRef] [Scilit]
- Kang, H. The prevention and handling of the missing data. Korean J. Anesth. 2013, 64, 402–406. [Google Scholar] [CrossRef] [Scilit]
- Pebesma, E.J. Multivariable geostatistics in S: The gstat package. Comput. Geosci. 2004, 30, 683–691. [Google Scholar] [CrossRef] [Scilit]
- Mi, X.; Chen, A.B.-Y.; Duarte, D.; Carey, E.; Taylor, C.R.; Braaker, P.N.; Bright, M.; Almeida, R.G.; Lim, J.-X.; Ruetten, V.M.; et al. Fast, accurate, and versatile data analysis platform for the quantification of molecular spatiotemporal signals. Cell 2025, 188, 2794–2809.e21. [Google Scholar] [CrossRef] [Scilit]
- Bolstad, P. GIS Fundamentals: A First Text on Geographic Information Systems, 5th ed.; Eider Press: Ashland, OH, USA, 2016. [Google Scholar]
- Liu, Y.; Jiang, X.; Liu, P.; Li, S. Data cleaning method based on multiple interpolation. Res. Sq. 2024. [Google Scholar]
- Liu, D.; Zhao, Q.; Fu, D.; Guo, S.; Liu, P.; Zeng, Y. Comparison of spatial interpolation methods for the estimation of precipitation patterns at different time scales to improve the accuracy of discharge simulations. Hydrol. Res. 2020, 51, 583–601. [Google Scholar] [CrossRef] [Scilit]
- Wagner, M.; Henzen, C. Quality Assurance for Spatial Research Data. ISPRS Int. J. Geo-Inf. 2022, 11, 334. [Google Scholar] [CrossRef] [Scilit]
- Boumpoulis, V.; Michalopoulou, M.; Depountis, N. Comparison between different spatial interpolation methods for the development of sediment distribution maps in coastal areas. Earth Sci. Inform. 2023, 16, 2069–2087. [Google Scholar]
- Nishimoto, M.; Miyashita, T.; Fukasawa, K. Spatiotemporal smoothing of water quality in a complex riverine system with physical barriers. Sci. Total Environ. 2024, 948, 174843. [Google Scholar] [CrossRef] [Scilit]
- Huda, N.; Ahmed, T.; Masum, M.H.; Faruque, N.; Islam, M.S. Assessment of surface water quality using advanced statistical techniques around an urban landfill: A multi-parameter analysis. City Environ. Interact. 2025, 28, 100237. [Google Scholar] [CrossRef] [Scilit]
- Liu, X.; Antwi-Afari, M.F.; Li, J.; Zhang, Y.; Manu, P. BIM, IoT, and GIS integration in construction resource monitoring. Autom. Constr. 2025, 174, 106149. [Google Scholar] [CrossRef] [Scilit]
- Bandara, R.M.; Jayasignhe, A.B.; Retscher, G. The Integration of IoT (Internet of Things) Sensors and Location-Based Services for Water Quality Monitoring: A Systematic Literature Review. Sensors 2025, 25, 1918. [Google Scholar]
- Wang, A.-J.; Li, H.; He, Z.; Tao, Y.; Wang, H.; Yang, M.; Savic, D.; Daigger, G.T.; Ren, N. Digital Twins for Wastewater Treatment: A Technical Review. Engineering 2024, 36, 21–35. [Google Scholar] [CrossRef] [Scilit]
- Li, Z.; Chen, B.; Wu, S.; Su, M.; Chen, J.M.; Xu, B. Deep learning for urban land use category classification: A review and experimental assessment. Remote Sens. Environ. 2024, 311, 114290. [Google Scholar]
- Shi, W.; Cao, J.; Zhang, Q.; Li, Y.; Xu, L. Edge Computing: Vision and Challenges. IEEE Internet Things J. 2016, 3, 637–646. [Google Scholar] [CrossRef] [Scilit]
- Bivand, R.; Pebesma, E.; Gómez Rubio, V. Applied Spatial Data Analysis with R; Springer: New York, NY, USA, 2013. [Google Scholar]
- Bibri, S.E.; Huang, J. Artificial intelligence of things for sustainable smart city brain and digital twin systems: Pioneering Environmental synergies between real-time management and predictive planning. Environ. Sci. Ecotechnol. 2025, 26, 100591. [Google Scholar] [CrossRef] [Scilit]
- Tomperi, J.; Koivuranta, E.; Kuokkanen, A.; Juuso, E.; Leiviskä, K. Real-time optical monitoring of the wastewater treatment process. Environ. Technol. 2016, 37, 344–351. [Google Scholar] [CrossRef] [Scilit] [PubMed]
- Yi, H.; Li, M.; Huo, X.; Zeng, G.; Lai, C.; Huang, D.; An, Z.; Qin, L.; Liu, X.; Li, B.; et al. Recent development of advanced biotechnology for wastewater treatment. Crit. Rev. Biotechnol. 2020, 40, 99–118. [Google Scholar] [CrossRef] [Scilit] [PubMed]
- El Hammoudani, Y.; Dimane, F. Assessing behavior and fate of micropollutants during wastewater treatment: Statistical analysis. Environ. Eng. Res. 2020, 26, 200359. [Google Scholar] [CrossRef] [Scilit]
- Zamfir, F.-S.; Carbureanu, M.; Mihalache, S.F. Application of Machine Learning Models in Optimizing Wastewater Treatment Processes: A Review. Appl. Sci. 2025, 15, 8360. [Google Scholar] [CrossRef] [Scilit]
- Mitch, W.A.; Sedlak, D.L. Characterization and Fate of N-Nitrosodimethylamine Precursors in Municipal Wastewater Treatment Plants. Environ. Sci. Technol. 2004, 38, 1445–1454. [Google Scholar] [CrossRef] [Scilit]
- Bera, S.P.; Godhaniya, M.; Kothari, C. Emerging and advanced membrane technology for wastewater treatment: A review. J. Basic Microbiol. 2022, 62, 245–259. [Google Scholar] [CrossRef] [Scilit]
- Abdel-Fatah, M.; Ewies, E. Green Nanotechnology for Sustainable Ecosystems: Innovations in Pollution Remediation and Resource Recovery. Egypt. J. Chem. 2025, 68, 621–633. [Google Scholar] [CrossRef] [Scilit]
- Wollmann, F.; Dietze, S.; Ackermann, J.U.; Bley, T.; Walther, T.; Steingroewer, J.; Krujatz, F. Microalgae wastewater treatment: Biological and technological approaches. Eng. Life Sci. 2019, 19, 860–871. [Google Scholar] [CrossRef] [Scilit]
- Mojiri, A.; Bashir, M.J.K. Wastewater Treatment: Current and Future Techniques. Water 2022, 14, 448. [Google Scholar] [CrossRef] [Scilit]
- Henze, M. Characterization of Wastewater for Modelling of Activated Sludge Processes. Water Sci. Technol. 1992, 25, 1–15. [Google Scholar] [CrossRef] [Scilit]
- Ng, M.; Dalhatou, S.; Wilson, J.; Kamdem, B.P.; Temitope, M.B.; Paumo, H.K.; Djelal, H.; Assadi, A.A.; Nguyen-Tri, P.; Kane, A. Characterization of Slaughterhouse Wastewater and Development of Treatment Techniques: A Review. Processes 2022, 10, 1300. [Google Scholar] [CrossRef] [Scilit]
- Igaz, D.; Šinka, K.; Varga, P.; Vrbičanová, G.; Aydın, E.; Tárník, A. The Evaluation of the Accuracy of Interpolation Methods in Crafting Maps of Physical and Hydro-Physical Soil Properties. Water 2021, 13, 212. [Google Scholar] [CrossRef] [Scilit]
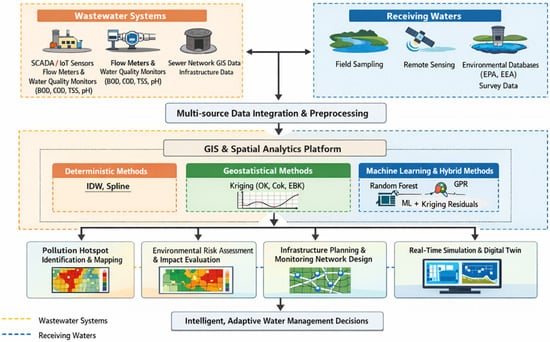
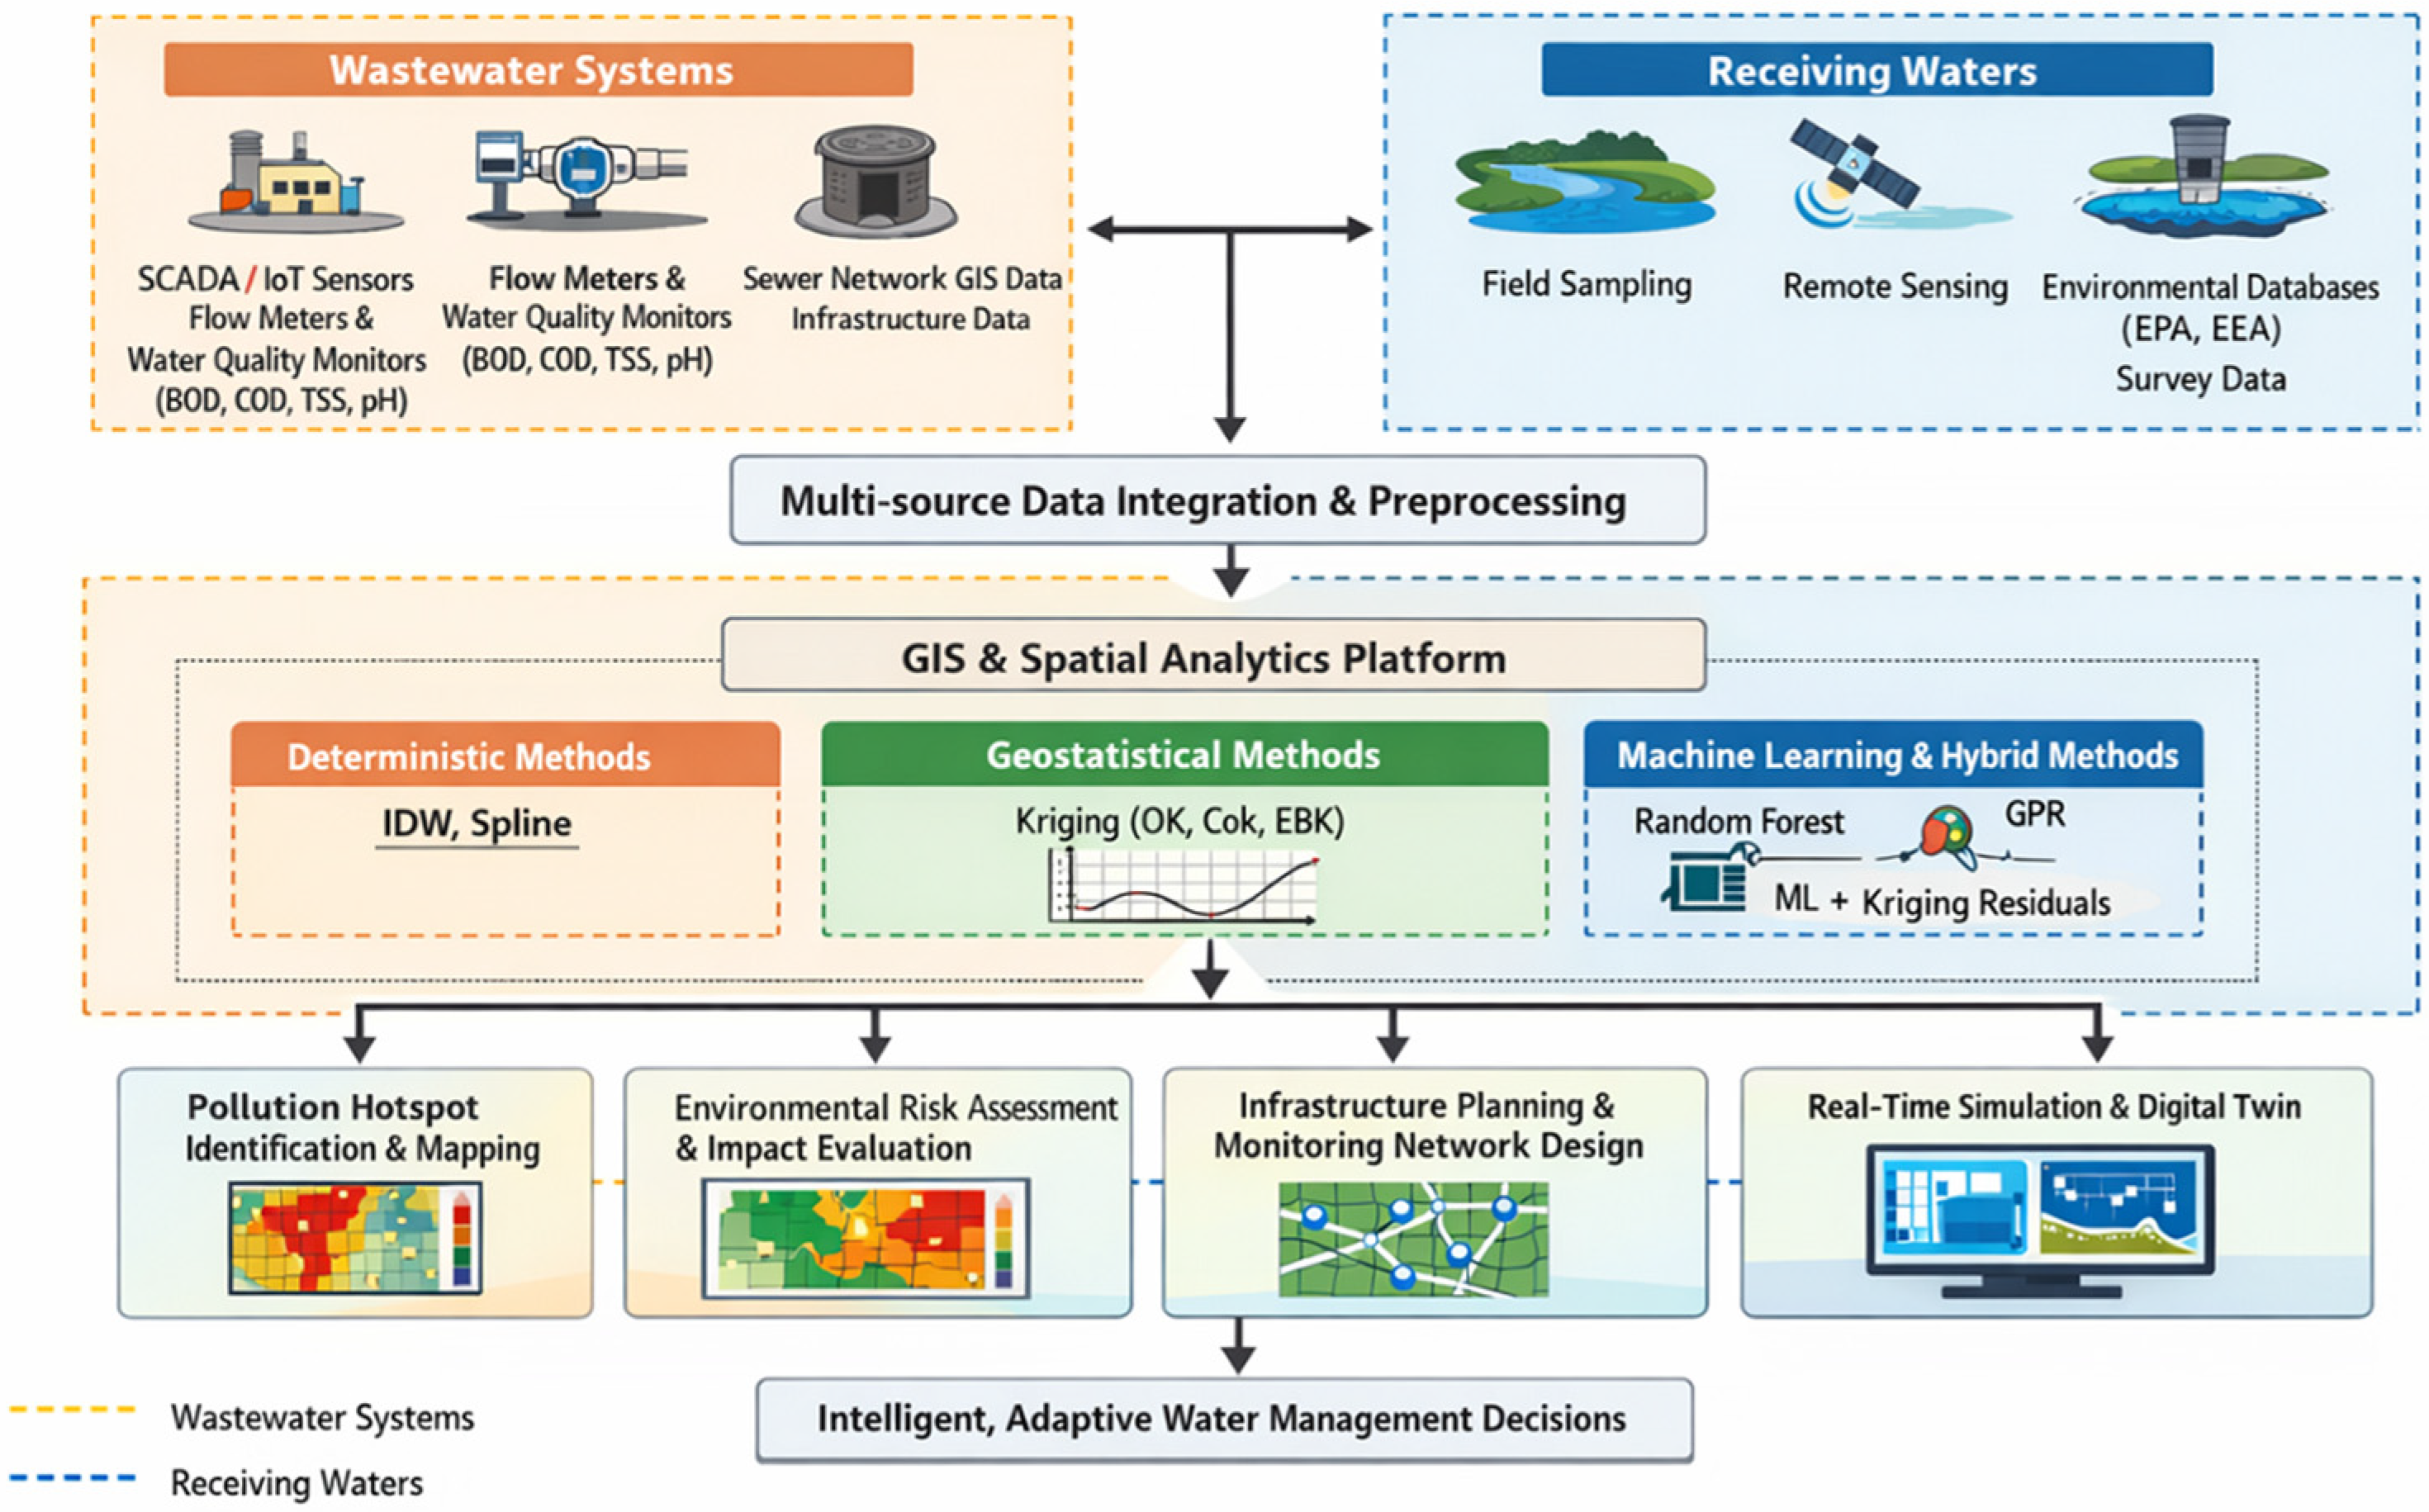
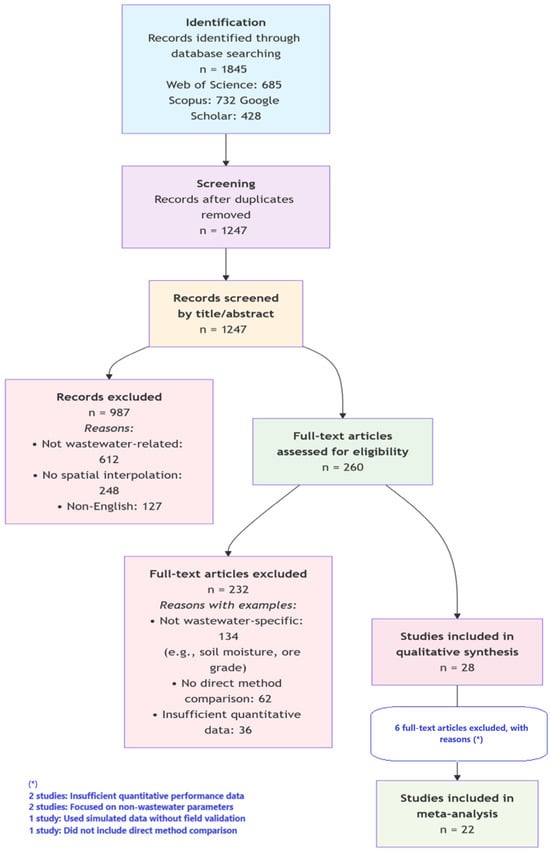
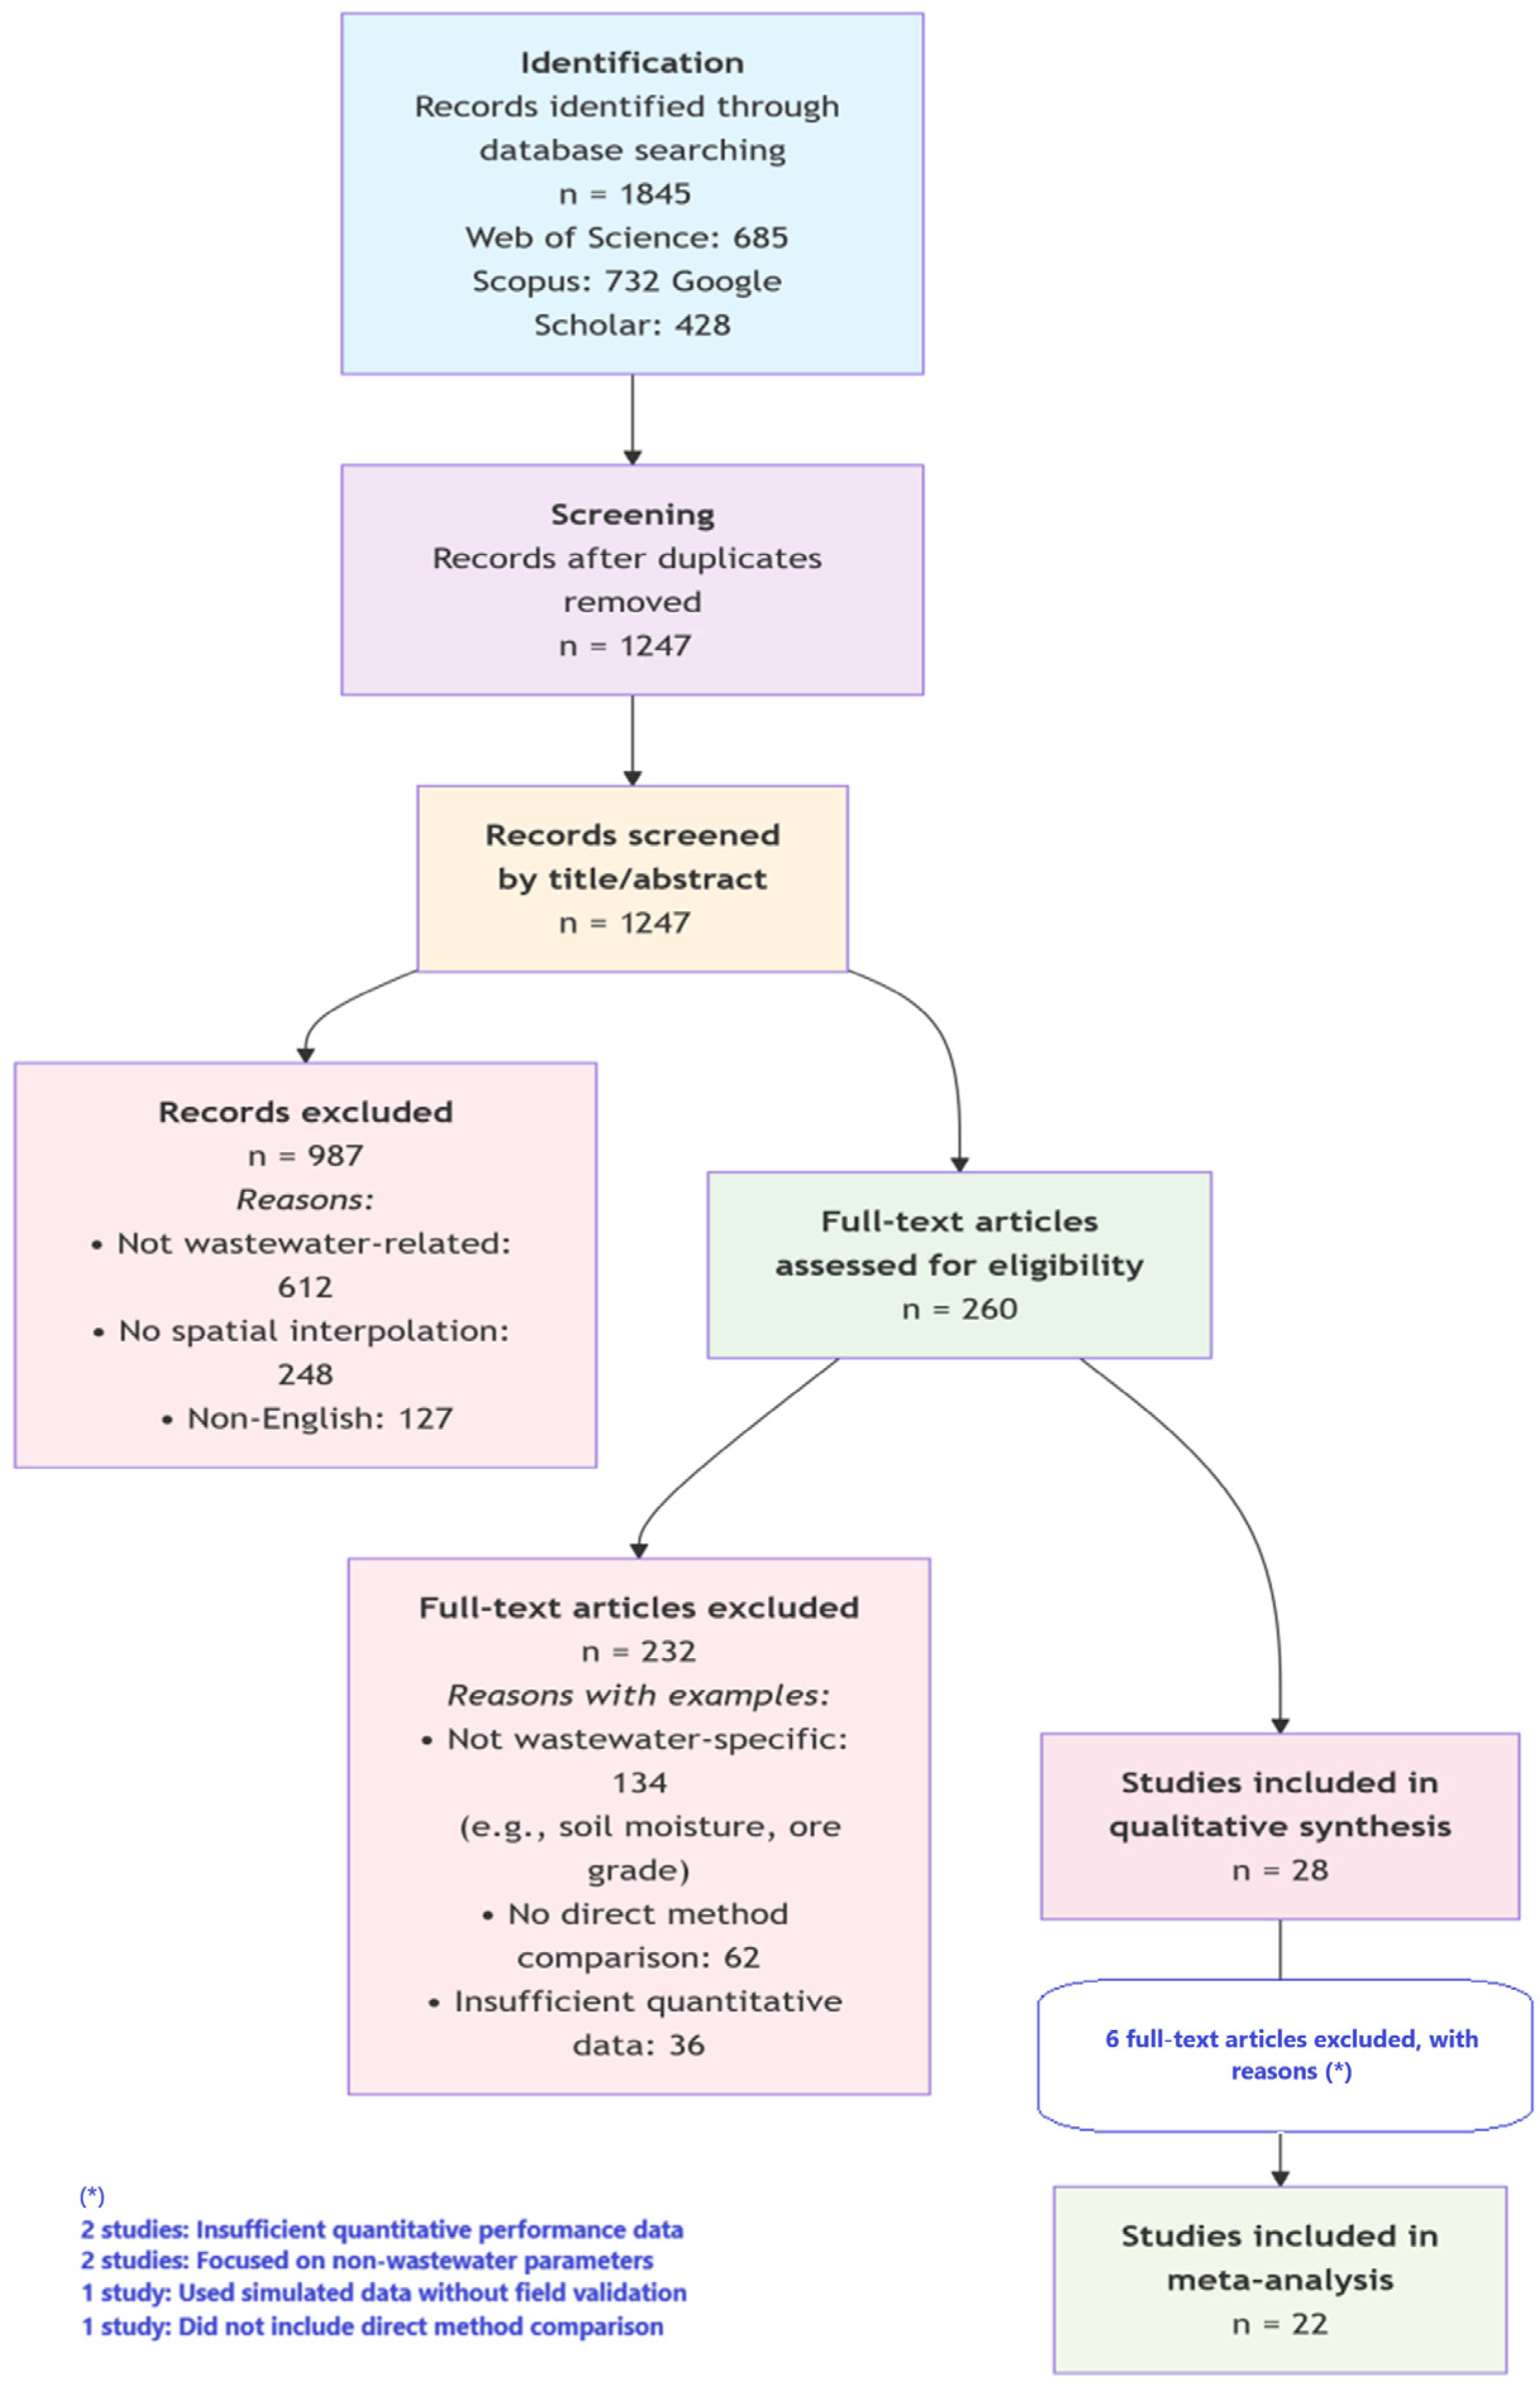

Disclaimer/Publisher’s Note: The statements, opinions and data contained in all publications are solely those of the individual author(s) and contributor(s) and not of MDPI and/or the editor(s). MDPI and/or the editor(s) disclaim responsibility for any injury to people or property resulting from any ideas, methods, instructions or products referred to in the content. |
© 2026 by the authors. Licensee MDPI, Basel, Switzerland. This article is an open access article distributed under the terms and conditions of the Creative Commons Attribution (CC BY) license.