


Abstract
The transition to a circular economy requires assessment tools that capture not only the environmental and economic performance of products but also their circular design, functionality, and durability. While Life Cycle Assessment (LCA) and Life Cycle Costing (LCC) are widely used, they alone do not capture modularity, reparability, reuse potential, or product lifespan. This study introduces a novel, integrated framework combining LCA, LCC, and product-level circularity indicators to provide a holistic evaluation of sustainability and circularity. In this study, two types of injection molds for plastic part production are compared: a conventionally manufactured mold and an additively manufactured metal mold produced by Laser Powder Bed Fusion (L-PBF) technology. The comparison integrates Life Cycle Assessment (LCA), Life Cycle Costing (LCC), and a set of micro-circularity indicators, including the Material Circularity Indicator (MCI), Recycling Desirability Index (RDI), circular design guidelines (CDG), Disassembly Effort Index (DEI), longevity indicator (LI), and Circular Economy Indicator Prototype (CEIP). Results show that the AM mold exhibits lower environmental impacts across almost all categories, while its slightly higher initial cost is largely offset by reduced indirect costs over the product lifecycle. Micro-circularity indicators reveal that the AM mold achieves higher material circularity and better circular design performance (MCI, CDG, CEIP) but shows only minor improvements in disassembly and recyclability (DEI, RDI) and lower longevity (LI) compared to the conventional mold, highlighting potential limitations for remanufacturing and end-of-life recovery. The novelty of this study lies in the integrated application of LCA, LCC, and multiple micro-circularity indicators, providing an operational framework for evaluating circular design, reparability, and durability in additive manufacturing and enabling informed, holistic decision-making for truly circular products.
1. Introduction
Over the past decades, increasing environmental awareness, driven by social and legislative factors, has led to growing attention to the principles of sustainability and circularity in product development processes [1]. In this context, a gradual transition is occurring from the traditional linear economic model toward a circular economic model aimed at promoting more sustainable and resilient societies.
Product design plays a strategic role in circularity, as decisions made at this stage determine the potential for product reuse, refurbishment, modularity, and disassembly [2]. Designers can simplify product architecture during the conceptual phase to facilitate end-of-life treatment. Two complementary approaches to circular design can be distinguished: (A) extending product lifespan and (B) promoting circular flows and closing material loops to prevent waste and emissions [1].
To support the transition to circularity, it is essential to assess new product strategies in advance, comparing them with linear approaches to determine their sustainability potential and alignment with the principles of the circular economy [3,4]. Recent systematic reviews highlight the growing role of LCA in supporting circular design decisions while also identifying methodological gaps related to durability and reuse modeling [5]. Circularity alone does not guarantee sustainability, so companies require tools capable of evaluating both circular performance and environmental and economic impacts [3]. Life Cycle Assessment (LCA) and Life Cycle Costing (LCC) are well-established methodologies that quantify environmental and economic impacts throughout a product’s life cycle [4,6]. LCA, standardized under ISO 14040:2006 [7], covers goal and scope definition, life cycle inventory, impact assessment, and result interpretation, supporting informed environmental decisions [8,9]. LCC evaluates total costs across the life cycle, including direct, indirect, and operational costs, and can adopt different approaches, such as conventional, environmental, or corporate [10,11,12,13,14]. The integration of LCA and LCC enables a more holistic assessment by balancing environmental impacts with economic performance, thereby providing a robust basis for the simultaneous optimization of the sustainability and economic viability of products [15].
Several recent studies have attempted to combine LCA with circularity-oriented metrics, particularly material flow-based indicators such as the Material Circularity Indicator (MCI), to support circular product redesign. In these applications, circularity is typically quantified through recycled content, recyclability rates, and material recirculation potential. While such approaches provide valuable insights into material efficiency, they often prioritize end-of-life recovery strategies and give limited attention to product architecture, durability, modularity, and reparability. Moreover, the integration between environmental and economic dimensions is frequently performed in parallel rather than through a truly interlinked framework capable of capturing trade-offs between circular design strategies and life cycle impacts.
However, these methods have limitations in assessing structural circularity, as they do not capture modularity, durability, repairability, material diversity, or potential for reuse, repair, or refurbishment, particularly regarding the modeling of product lifetime in circular scenarios [5,8,9,16,17,18]. In many cases, product lifetime is modeled using fixed or linear assumptions, without considering multiple use cycles, refurbishment loops, component replacement strategies, or performance degradation over time. As a result, the environmental benefits associated with lifespan extension strategies are often underestimated or oversimplified. Additionally, structural features such as modular design or ease of disassembly are rarely translated into quantitative parameters within LCA or LCC models, creating a disconnection between circular design intentions and sustainability assessment outcomes.
To address this gap, product-level circularity indicators (micro-indicators) provide both quantitative and qualitative insights, capturing aspects critical to circularity, such as reparability, lifespan extension, and the potential for reuse and recyclability [1,8,9,19]. Thus, integrating LCA/LCC and micro-indicators offers a more nuanced and representative evaluation of a product’s actual circular potential, as recently demonstrated in studies combining LCA with material circularity metrics for multi-material product redesign [20].
For the transition to a circular economy to materialize, it is essential to monitor product performance throughout its life cycle, which requires the development of specific tools that are widely recognized by the scientific community, as well as by business and policy stakeholders and sustainability-related organizations [21]. In this context, circularity indicators—quantitative or qualitative measures of progress towards specific objectives—have been developed for different purposes and levels of application (micro-, meso-, and macro-level) depending on their focus on products and companies, industrial systems, or territories and regions [22,23]. Recent policy-driven initiatives at the European level have also proposed new frameworks and harmonized indicator sets to measure progress towards circularity, reinforcing the need for multi-dimensional assessment approaches [2] Micro-indicators complement LCA and LCC by evaluating design- and circularity-related aspects, such as reuse, recyclability, resource efficiency, dismantling, and end-of-life management, thereby supporting decision-making from the early product design stages [24,25,26,27]. Recent systematic reviews on circular economy metrics highlight the diversity of methods and the need for standardized approaches to assess circularity across multiple levels, including product-related frameworks [28]. Among foundational works on micro-level circularity indicators, Kristensen and Mosgaard [29] systematically categorized product-level circularity metrics and highlighted their conceptual diversity and methodological fragmentation. Their review emphasizes that, although micro-indicators provide valuable design-oriented insights, their application is often case-specific and lacks harmonized calculation procedures. Consequently, results may be sensitive to subjective assumptions, particularly when qualitative criteria such as reparability or modularity are involved. Furthermore, many micro-indicators focus predominantly on recyclability and material recovery, while aspects such as operational energy use, durability performance, and indirect environmental impacts remain insufficiently integrated, leading to only a partial representation of overall product sustainability [25,27,29].
Despite the growing body of literature on circular economy assessment, three major gaps remain evident. First, there is limited methodological integration between environmental (LCA), economic (LCC), and structural circularity micro-indicators within a single coherent assessment framework. Second, most empirical applications focus on consumer goods, with comparatively little attention given to industrial tooling systems, where durability, maintenance cycles, and refurbishment strategies are particularly relevant. Third, comparative studies evaluating conventional and additive manufacturing routes under a combined sustainability and circularity perspective remain scarce.
In this context, the present study compares the environmental and economic impacts, as well as the circular potential, of two metal polymer injection molds—one produced via conventional machining and the other manufactured using additive manufacturing through Laser Powder Bed Fusion (L-PBF). By integrating LCA and LCC with product-level circularity micro-indicators within a unified analytical framework, this research advances existing methodologies by explicitly linking structural design features to environmental and economic performance. This study demonstrates how circularity and dimensions related to modularity, disassembly, and lifespan extension can be systematically incorporated into sustainability assessments of industrial tooling. This integrated approach contributes to reducing subjectivity in circularity evaluation and provides decision-support guidance for the optimization of manufacturing strategies aligned with circular economy principles.
2. Methodology
In this chapter, we present the methodology employed to assess the environmental impacts and associated costs of two case studies involving the production of molds using conventional and additive manufacturing techniques. Specifically, we describe the approaches used to perform LCA, LCC, and circularity indicators, as well as the procedures adopted to address the uncertainties associated with the data used in the LCA.
2.1. Case Study Selection
The case studies selected for this article consist of two steel injection molds for plastic products: one produced by conventional machining and the other produced by additive manufacturing, specifically using the Laser Metal Powder Bed Fusion (L-MPBF) process. Both molds were produced by Erofio in Portugal.
The conventional mold consists of 449 components, of which 44 are massive elements, 64 are cylindrical elements, 244 are screws, 88 are accessories for the cooling channels, and 9 are other standard elements used in mold assembly. The accessories for the cooling channels and all standard elements (screws, cooling channels accessories, ejection components, and other elements) are supplied to Erofio by the suppliers already machined. However, for most standard elements, Erofio was unable to provide data regarding all the materials used. Only for the screws and the insulation plate do we know their materials. Therefore, for the other standard elements, it was decided to consider only the transport of these elements from the supplier to Erofio.
The 5G mold produced by Erofio consists of 116 components, of which 10 are massive elements, 7 are cylindrical, 5 are manufactured by additive manufacturing, 68 are screws, 8 are cooling channel accessories, and 24 are standard components. In contrast to conventional molds, whose production is based exclusively on traditional machining processes for the manufacturing of their components, the 5G mold adopts a hybrid approach that integrates machining techniques with advanced additive manufacturing technologies. This combination allows for a significant reduction in the number of assembly operations while enabling functional optimization of certain mold elements. In the case of the 5G mold, additive manufacturing is used in the production of the bushing, cavity, and respective support plates, which are manufactured as two single pieces using the Laser Powder Bed Fusion (L-PBF) process. The choice of Laser Powder Bed Fusion for the production of the bushing, cavity, and support plates was motivated by its ability to produce complex geometries as single integrated components, which would be difficult or impossible to achieve with conventional machining or other additive manufacturing techniques such as Fused Deposition Modeling or directed energy deposition. L-PBF allows for enhanced dimensional accuracy, reduced assembly operations, and improved material utilization, enabling functional optimization and design flexibility that are essential for evaluating the environmental and economic performance of highly integrated mold components. Additionally, the mold incorporates three supplementary cable protection covers, produced by Fused Deposition Modeling (FDM), components absent in the conventional mold, and which demonstrate advances in functional integration and geometric complexity.
2.2. Life Cycle Assessment and Life Cycle Costs
This subchapter describes the goal and scope definition of the inventory phases of the Life Cycle Assessment and Life Cycle Costs (LCA/LCC) framework, including the identification of relevant environmental impact categories. In parallel, LCC analysis was conducted to complement environmental assessment and support economically informed decision-making in mold production.
The LCC analysis was performed in Excel and included direct costs (e.g., materials, energy, labor, transportation, and waste management) and indirect costs, represented by monetized environmental impacts based on global monetization factors (2010 values in Table S1 in Section S1 of the Supplementary Materials).
The LCA modeling was performed on the OpenLCA software with the Ecoinvent 3.9 database, applying the Allocation at the Point of Substitution (APOS) system. This approach was selected due to its suitability for multifunctional processes and recycling scenarios typical of mold manufacturing, enabling the allocation of environmental burdens and credits based on economic value and substitution effects [30,31].
As this study involves a comparative assessment of two molds and relies on data from multiple sources, an uncertainty analysis was conducted to evaluate the robustness of the results. Uncertainties used from data gaps and assumptions were systematically addressed to ensure transparency and reproducibility.
2.2.1. Goal and Scope
The objective of this LCA study is to compare the environmental impacts of a conventionally manufactured plastic injection mold with those of an additively manufactured mold, assessing whether additive manufacturing offers environmental advantages over conventional production.
This study encompasses all initial stages of the mold life cycle, from the extraction of natural resources to final assembly, including relevant transportation and outsourced finishing operations. Use and end-of-life phases were not considered due to the prototype status of the additively manufactured mold. Therefore, the cradle-to-gate approach was adopted.
The functional unit was defined as one complete mold, weighing approximately 500 kg for the conventional mold and 92 kg for the additively manufactured mold (5G mold).
System boundaries and industrial processes used were defined through two LCA flowcharts—one for each study—illustrating in-house manufacturing process and external activities such as raw material supply, transportation, and outsourced operations. Figure 1 and Figure 2 present system boundaries for the conventional and 5G mold, respectively.
Figure 1.
Flowchart of the LCA/LCC analysis used for conventional molds.
Figure 2.
Flowchart of the LCA/LCC analysis used for the 5G mold.
2.2.2. Life Cycle Inventory Analysis
In this phase of the LCA/LCC study, data collected by the mold manufacturing company were developed to construct the LCI of the two molds so that the LCA and LCC can be carried out later.
To systematize the LCI modeling, the analysis was organized by mold, identifying and quantifying all input (inputs) and output (outputs) flows associated with each system. To prepare for the LCI, we divided the flow to be evaluated into elements that make up the mold and that share the same machining processes. In addition, we divided the inventory into three stages to evaluate in the LCA/LCC study, namely (i) raw material acquisition, (ii) transportation, and (iii) production of the elements. In the following subchapters, the specific inventories of the two molds under study are presented in detail, allowing for a complete characterization of the processes involved and providing a basis for the assessment of environmental impacts.
Conventional Mold
The LCI of the conventional mold was developed based on the primary data provided by the manufacturing company, including machine operation parameters, material removal rates, steel typologies, component volumes, consumption of water and cutting fluids, and annual waste generation. Based on these data, energy and material flows were estimated for each machining step and modeled using existing Ecoinvent flows. When company-specific data were unavailable, technologically and compositionally similar Ecoinvent datasets were selected. Otherwise, new flows were modeled using data available in the literature.
The massive components of the mold were classified into three groups (1 to 3), according to their machining process. Accessories for the cooling channels and all standard elements (e.g., screws, accessories for the cooling channels, extraction components, and other elements) were supplied pre-machined by external suppliers.
For reporting purposes, LCI inputs and outputs were aggregated by component category and flow type, with the complete inventory available upon request. Table 1 summarizes the component groups, including initial and final mass, associated Ecoinvent flows, and steel unit costs.
Table 1.
LCI of the extraction and production stages of the raw materials involved in the conventional mold.
Raw material transport was modeled considering a representative scenario, in which the steel supply was equally distributed among five countries (China, Germany, Mexico, USA, and India). A similar approach was applied to the standard elements. Detailed transport distances and costs are provided in Section S2 of the Supplementary Materials (Table S2).
Machining processes varied by component type: massive elements 1 underwent faceting, rough machining, milling, and finishing; massive elements 2 additionally included wire erosion, spark erosion, and heat treatment; massive elements 3 involved only rough machining and finishing; and cylindrical elements underwent turning and finishing. Cutting tools were excluded from the LCI due to their negligible contribution relative to other flows.
Wire erosion requires no cooling water or lubricating liquids, generating no water waste or sludge. Spark erosion involves internally manufactured graphite electrodes, with graphite consumption estimated based on Erofio non-ferrous waste generation. All graphite waste is collected and recompacted. Massive elements 2 were subjected to subcontracted heat treatment. Due to limited data availability, only transportation to and from the contracted company was included.
Steel shavings, dust, sludge, and emulsions were estimated from primary data and allocated proportionally based on the contribution of conventional mold production to Erofio’s annual waste generation (0.22%). Waste typologies, allocation procedures, and associated Ecoinvent flows are detailed in Section S2 of the Supplementary Materials (Tables S3 and S4). Energy, raw material, water, coolant, and subcontracted processes were aggregated as inputs, and the generated solid and liquid waste was consolidated as outputs, as shown in Table 2.
Table 2.
LCI of the processing stages of the conventional Mold elements.
5G Mold
The 5G mold combines conventional machining with additive manufacturing, enabling reduced assembly and functional optimization of key elements. The bushing, cavity, and respective support plates were produced as two single stainless steel pieces via L-PBF, while supplementary cable protection covers were manufactured in PA6 filaments using FDM.
As no specific Ecoinvent flows exist for stainless steel powder or PA6 filament, these were modeled using similar existing flows. The stainless steel powder production was based on the “steel chromium 18/8” process, adjusted for composition, with additional Vacuum Induction Melting Gas Atomization (VIGA) atomization flows incorporated based on literature for the atomization of nickel alloys [32] and 316L stainless steel [33]. The data for modeling the extraction and production process of the steel powder used in the elaboration of Mold 5G are found in Section S3 of the Supplementary Materials (Table S5).
Nylon 6 filament production was modeled starting from Nylon 6 granules and integrating extrusion steps, with energy consumption and waste adapted to reflect the filament production process [34,35]. The LCI of the PA6 filament extraction and production process can be found in Section S3 of the Supplementary Materials (Table S6). Standard elements with known composition used Ecoinvent flows. Unknown components accounted only for transportation impacts. The type of steel allocated to each of the other elements of the 5G mold and the corresponding initial mass are found in Table 3, as well as the flow assigned in Ecoinvent. Transportation and processing followed the same approach as for the conventional mold. The detailed list of distances and flows is in Section S3 of the Supplementary Materials (Table S7).
During L-PBF, the machine’s build chamber holds approximately 130 kg of powder. Unmelted powder (84.24 kg) is recovered and reused, of which 10% can be recycled, and 5% is discarded as metallic waste. Subsequent conventional machining processes (wire erosion, shot peening, rough machining, and finishing) were applied, with subcontracted treatments considered in LCA only for transportation impacts.
For FDM parts, energy consumption, emissions, and waste were estimated from the final mass, assuming a 5% rejection rate due to process preparation. All waste was collected and recycled for filament reuse [36]. Total waste generated by the 5G mold was proportional to its contribution to the annual Erofio waste (0.03%) present in Section S2 of the Supplementary Materials (Table S2). The breakdown of the type and mass quantity of waste generated by the operation of Erofio infrastructure, allocated proportionally to the production of one 5G mold, is presented in Section S3 of the Supplementary Materials (Table S8).
The input and output flows of the 5G mold processing stage, including transport flows to subcontracted companies, are summarized in Table 4.
Table 3.
LCI of the extraction and production stages of the raw materials used in the 5G mold.
Table 4.
LCI of the processing stages of the 5G mold components.
Table 5.
Data used and respective results of the longevity indicator for both molds.
2.2.3. Environmental Impact Category Selection
The modeling and analysis of the systems under study were performed using the open-source software OpenLCA 2.4.0, adopting the ReCiPe 2016 v1.03 impact assessment method, from a hierarchical (H) perspective. The ReCiPe method allows for the quantification of environmental impacts at two levels: midpoint indicators—representing specific environmental categories, such as climate change and human toxicity, among others—and endpoint indicators, which aggregate impacts in protected areas such as human health, ecosystems, and resources. For this study, the midpoint approach was chosen exclusively, using the ReCiPe midpoint (H)—Europe factor set to assess 18 environmental impact categories. In order to allow for a comparison between different impact categories, a normalization step was performed based on the 2010 global reference factors provided by the ReCiPe 2016 method (Table S9, Section S4 of the Supplementary Materials). After obtaining and normalizing the results, those categories that presented the most significant contributions to the total environmental impact of each mold were selected from among the 18 evaluated in order to facilitate the interpretation and comparative analysis of the scenarios studied.
The environmental impact categories selected for evaluation were defined based on the results obtained through the LCA methodology, namely global warming potential (GWP), Fine Particulate Matter Formation Potential (FPMFP), Non-Carcinogenic Human Toxicity Potential (HTPnc), Ionizing Radiation Potential (IRP), Marine Ecotoxicity Potential (METP), Terrestrial Ecotoxicity Potential (TETP), Water Consumption Potential (WCP), Fossil Fuel Potential (FFP), Surplus Ore Potential (SOP), and Land Occupation Potential (LOP).
2.2.4. Uncertainty Assessment
To ensure the robustness and reliability of the results obtained in the LCA of conventional and 5G molds, an uncertainty analysis based on the Pedigree matrix associated with inventory data was performed, complemented by Monte Carlo simulations with 5000 iterations. This approach enabled the quantification of result variability and the evaluation of the sensitivity of environmental impact categories to the quality and origin of the data used. The comparison between the two scenarios considered deterministic values, confidence intervals, and standard deviations from the simulations, providing a statistically sound basis for the conclusions. The Pedigree matrix was constructed using qualitative criteria of completeness; reliability; and temporal, geographical, and technological representativeness, resulting in the values (2, 2, 1, 2, 3), which were rescaled to reflect a conservative and realistic approach. The coefficients used are detailed in Section S5 of the Supplementary Materials (Table S10).
2.3. Micro-Circularity Indicators
The transition to a circular economy (CE), based on reducing, reusing, recycling, and recovering materials, is fundamental to minimizing resource extraction and environmental impacts. Assessing product circularity requires tools that complement traditional environmental and economic metrics, considering design and function aspects that influence reuse, reconditioning, and end-of-life management. For both molds, circularity was analyzed using micro-circularity indicators, which provide quantitative and qualitative information on performance in circular flows. These indicators complement LCA and LCC by evaluating design characteristics, material choices, and strategies that affect durability, repairability, and recyclability. The Material Circularity Indicator (MCI), Recycling Desirability Index (RDI), and longevity indicator (LI) assessed materials flows, recycling compatibility, and overall lifespan, while Disassembly Effort Index (DEI), Circularity Design Guidelines (CDG), and Circular Economy Indicator Prototype (CEIP) supported design improvements, repairability, and life cycle extension.
Together, these analyses enable a comprehensive assessment of the molds’ circular potential, guiding design decisions and aligning the 5G mold with circular economy principles.
2.3.1. Material Circularity Indicator
The Material Circularity Indicator (MCI), developed by the Ellen MacArthur Foundation in collaboration with ANSYS Granta, evaluates product circularity based on material flows and product usefulness, ranging from 0 (fully linear) to 1 (fully circular) [37,38]. In this study, the MCI was applied to conventional and 5G molds, following the calculation methodology detailed in [36,37], as described in Section S6 of the Supplementary Materials.
For the MCI, data on recycled content, reused and bio-based materials, and end-of-life recovery (recycling, reuse, composting, or incineration) were collected. The conventional mold, mostly composed of steel (468.76 kg), self-lubricating bronze (1.35 kg), and mixed materials such as plastic and composites (19.89 kg), incorporated ~29% recycled material and has an end-of-life recovery of ~90.5%. The 5G mold, composed of 54.1 kg solid steel, 35.9 kg steel powder, and mixed materials, incorporates ~53% recycled material, with ~90% recoverable at end-of-life, indicating that its circularity is strongly influenced by metallic components while polymers reduce overall circularity [39,40,41,42,43,44,45].
Accordingly, the 5G mold was assessed under two scenarios: (i) life span equal to conventional molds and (ii) slightly shorter, conservative scenario (~7 years). The service life values of 10 years for conventional molds and 7 years for additively manufactured 5G molds were selected based on industrial experience and literature data. Ten years represents the typical operational lifespan of conventional steel molds (~500,000 cycles) [46,47,48], while seven years represents a conservative scenario for additive molds, accounting for potential reductions in durability due to porosity, material heterogeneity, and fatigue, as reported in previous studies [49]. This approach allows for the assessment of environmental and circularity impacts under realistic and conservative usage conditions. Detailed data for MCI calculation are provided in Section S6 of the Supplementary Materials (Table S11).
2.3.2. Recycling Desirability Index
The Recycling Desirability Index (RDI) studies whether there is an advantage in recycling a product or not. This micro-indicator is expressed on a scale of 0 to 3 and results from the sum of three factors: the Material Separation Simplicity Index, the Material Safety Index (MSI), and the Technology Readiness Level (TRL) [50]. The MSI evaluates material availability and supply risks by combining individual safety scores of each material into a product-level index. In this study, the MSI was calculated considering eight parameters—global consumption, substitutability, global warming potential, total material requirement, scarcity, supply monopoly, political stability, and vulnerability to climate change—each scored on a scale from 1 (low risk) to 3 (high risk) with equal weighting, based on literature and European Union reports. The TRL assesses the maturity of recycling technologies for each material, being the mechanical recycling considered for all materials analyzed. Detailed formulas, calculation procedures, and the MSI and TRL classifications assigned to each material are provided in Section S7 of the Supplementary Materials (Tables S12 and S13).
2.3.3. Longevity Indicator
The Longevity Index (LI) evaluates the effective durability of a mold throughout its life cycle, integrating initial useful life, potential for component reuse, life extension from reconditioning, and materials circulation after recycling. The calculation methodology adopted followed that described by [51] and is detailed in Section S8 of the Supplementary Material.
For the conventional mold, a typical useful life of 10 years was considered, while for the 5G mold produced by additive manufacturing, a conservative scenario of 7 years was adopted. Approximately 94% of the conventional mold and 80% of the 5G mold mass are structural or hardened steel elements with high reuse potential. Direct reuse was considered negligible, in line with literature [46,52,53], whereas reconditioning operations (grinding, polishing, heat treatment, and replacement of critical components) were assumed to extend life cycle by 5 years in both molds, according to industrial studies reported in [53,54].
The circulation time of the materials after recycling was set at 20 years for both molds, reflecting the high recyclability of structural and hardened steels in the conventional mold [44,55] and of steels adapted for additive manufacturing in the 5G mold [56,57].
All quantitative assumptions and bibliographic sources can be consulted in Section S8 of the Supplementary Materials (Table S14).
2.3.4. Disassembly Effort Index
The Disassembly Effort Index (DEI) considers the effort and processes required to disassemble a product and provides a percentage score that can be used to calculate the cost of disassembly [58]. Disassembly practices allow for the recovery of parts or subassemblies, the removal of hazardous or toxic materials, and the remanufacturing of products. To calculate the DEI, it is necessary to evaluate factors such as disassembly time, tools, fastening, access to certain components, instructions for performing the disassembly, imminent hazards, and workforce requirements to perform it. The combination of these factors therefore allows for a reduction in the environmental impact and ecological damage associated with product disposal.
The disassembly of both the conventional and 5G molds was performed in a stepwise manner, following a structured procedure to ensure component integrity, operator safety, and circularity considerations. For each mold, the process began by separating the fixed and moving halves to access internal components. External accessories were removed first, followed by the disassembly of structural plates, the carburetor, and the extraction system, including ejectors and pins. All components were then carefully cleaned, inspected, and classified according to material or type, preparing them for recycling, reconditioning, or storage. This systematic approach allowed the calculation of the DEI and supports the recovery and reuse of parts while minimizing environmental impacts.
The detailed calculation methodology, as well as tables with the evaluation of each disassembly step for the molds under study, are described in Section S9 of the Supplementary Materials (Table S15 and Table S16, respectively).
2.3.5. Circular Design Guidelines
The circular design guidelines (CDG) indicator is a holistic tool that identifies design approaches to improve a product by assessing the potential for improvement and the relevance of a set of circular design guidelines [59]. These guidelines are divided into five groups, corresponding to the fundamental principles of the circular economy: (i) life extension, (ii) disassembly, (iii) product reuse, (iv) component reuse, and (v) material recycling. For each guideline, an improvement level is assigned, ranging from 1 to 3 (1 being irrelevant and 3 highly relevant to the product under study). This process is repeated for each of the five groups. Then, the average improvement level for each group of guidelines is calculated and multiplied by the relevance index assigned to each group. The improvement level for each circular design group ranges from 0 to 9. The guidelines with the highest improvement levels are those that should be prioritized to increase the product’s circularity. The results of this micro-indicator are presented in a radar diagram, which shows the groups of guidelines that require improvements, as well as the level of improvement for each one [59].
The detailed calculation methodology, as well as the levels assigned to relevance and improvement for each circular design guideline relating to the analyzed molds, are described in Section S10 of the Supplementary Materials (Tables S17 and S18).
2.3.6. Circular Economy Indicator Prototype
The Circular Economy Indicator Prototype (CEIP) indicator is a cross-cutting indicator across all phases of a product’s life cycle that allows us to verify the level of circularity of a product. In addition to circularity, this indicator also shows us at which stages of the life cycle the product should make improvements to increase its circularity. The CEIP is a tool based on the Kingfisher Circularity Calculator (KCC), which consists of a set of 15 questions divided into five phases of the life cycle, with the results presented according to the minimum and maximum limits of circularity performance [29,39,60]. The assignment of the maximum CEIP score (152 points) followed the logic of distributing an equal number of points for each phase of the product’s life cycle: design/redesign (27 points), remanufacturing (25 points), commercialization (30 points), use (35 points), and end of useful life (35 points). There are questions where the score is given according to the answer provided, and others that are yes/no, where the total score for the question is given if the answer is affirmative. The detailed calculation methodology, as well as the scoring levels assigned to each phase of the life cycle for the molds analyzed, is described in Section S11 of the Supplementary Materials (Table S19).
3. Results
The results were presented in sequential analytical sub-steps to ensure traceability and understanding of the main contributors to the environmental impacts. Initially, the total environmental impact of the conventional and 5G molds was assessed. Subsequently, the most critical life cycle stages and mold elements were identified, followed by an analysis of the impact categories with highest contributions. Finally, the key elementary flows (e.g., energy consumption, water consumption, cutting fluids, waste generated, etc.) driving these impacts were examined. This systematic approach allowed the identification of the main flows causing environmental impact in both mold systems analyzed.
3.1. Conventional Mold
To facilitate the interpretation of the LCA results for the conventional mold, the data were structured into three life cycle stages: (i) raw materials extraction and production, (ii) transportation, and (iii) manufacturing processes, which were later further disaggregated by component. Absolute impact results by category are present in Section S12 of the Supplementary Materials (Table S20), while Figure 3 shows the relative contribution of each stage.
Figure 3.
Contribution of the different groups of elements of the conventional mold in the total environmental impacts per life cycle stage.
The raw materials extraction and production were the dominant stage, accounting for approximately 70% of total impacts, followed by manufacturing (26%), with transportation contributing marginally (4%). The massive elements 1 and 3 were identified as the main contributors, whereas massive elements 2, cylindrical elements, and screws showed significantly lower impacts.
For the most impactful component group, the dominant raw materials were identified, as illustrated in Figure 4. Steels 1.2312 and 1.1730, predominantly used in massive elements 1, were the most critical materials. Steel 1.2312 accounted for approximately 30–50% of impacts, while steel 1.1730 contributed around 20%, particularly in Surplus Ore Potential (SOP), Water Consumption Potential (WCP), Fossil Fuel Potential (FFP), Land Occupation Potential (LOP), global warming potential (GWP), and Particulate Matter Formation Potential (PMFP). These results are largely driven by the high mass of these components and the energy-intensive steel production.
Figure 4.
Contribution of the raw material of the main contributor’s group on the overall environmental impact of the raw material extraction/production stage.
In contrast, the self-lubricating bronze used in the massive elements 3 showed a significant environmental contribution in Terrestrial Ecotoxicity Potential (TETP), Human Toxicity—Non-Cancer Effects (HTPnc), and Marine Ecotoxicity Potential (METP), with contributions ranging from 60% to 70%, mainly associated with its metallic composition and casting process.
In the production stage, massive elements 1 and cylindrical elements accounted for approximately 42% and 34% of the total impact, respectively. The finishing process was identified as the main contributor, representing 56% and 71%, respectively, of the impacts for these two groups, consistently across all impact categories.
In the finishing process of massive elements 1 (Figure 5), electricity consumption remained the main impact factor, exceeding 90% of the total in all categories analyzed. The contributions associated with steel shavings and lubricating fluid remained marginal, with greater expression in the LOP and SOP categories, related to waste management and the mineral origin of the resources. A similar pattern was observed for the cylindrical elements.
Figure 5.
Contribution of the flows involved in the finishing process of massive elements 1 in the evaluated impact categories.
In economic terms, conventional mold costs are dominated by raw materials acquisition (58.4%) and processing (41.5%). Standard elements accounted for 86.5% of raw material costs due to their acquisition as pre-machined components, while massive elements 1 represent 8.4% (Figure 6). Processing costs are highest for massive elements 2 (35.3%) and cylindrical elements (34%), followed by massive elements 1, with massive elements 3 showing the lowest contribution.
Figure 6.
Percentage distribution of direct costs among the elements incorporated into the conventional mold.
Labor constitutes the main internal cost driver, except for massive elements 2, where subcontracting accounts for 76% of total costs. Electricity contributes between 8% and 16%, while waste costs are negligible (<0.5%) (Figure 7). Indirect costs dominate raw material acquisition and transportation (>80%), whereas in processing, they represent less than 25% of the total costs (Figure 8), reflecting component mass, environmental intensity, and the outsourcing of pre-machined components.
Figure 7.
Distribution of the economic impact of each flow involved in the elements that constitute the conventional mold.
Figure 8.
Percentage distribution of direct and indirect costs of the different elements and stages of the conventional mold life cycle.
Overall, energy consumption is the main driver of environmental impacts in mold manufacturing, highlighting the need for mitigation strategies focused on energy efficiency, material selection, and decarbonization of the electricity grid. Residual flows, although of smaller quantitative significance, remain relevant in specific categories. Economically, the stages of raw material acquisition and processing dominate costs, making it crucial to optimize internal production and reduce subcontracting to minimize the total cost of conventional molds.
3.2. 5G Mold
The absolute values of the total environmental impact of the 5G mold by selected impact category are presented in Section S13 of the Supplementary Materials (Table S21). The results demonstrate that the raw material extraction and production stage is the dominant contributor to the environmental impact of 5G mold, accounting for 72% of the total impact of the 5G mold, followed by the processing stage with 23%. The transportation stage presents a residual contributor, contributing only 5% to the environmental impact.
Figure 9 shows the percentage contribution of each element group in the environmental impact of each life cycle stage. In the raw material extraction and production stage, the L-PBF-manufactured elements dominate the environmental impact, accounting for more than 95% of this life cycle stage. As steel powder is the sole material used in these elements, its production emerges as the main environmental hotspot, due to the high energy consumption and the complexity of atomization processes, which typically involve gas or plasma atomization, and energy-intensive alloy production steps [61].
Figure 9.
Contribution of each group of elements in different life cycle stages to the overall environmental impact of the 5G mold.
The processing stage is the second largest contributor to the environmental impact of the 5G mold and is likewise dominated by L-PBF-produced elements, which represent about 86% of the impact. Within this stage, the L-PBF process and subsequent conventional finishing together account for more than 80% of the total processing impact (Figure 10).
Figure 10.
Percentage distribution of the machining processes involved in the processing of L-PBF elements by different impact categories evaluated.
The analysis of the environmental impacts associated with the inputs and outputs involved in the L-PBF process (Figure 11) reveals that energy consumption is the main driver, contributing more than 90% across most categories. This result is consistent with the literature, which highlights the high energy consumption of laser-based additive manufacturing due to the need for controlled atmosphere, high-precision optical systems, and elevated temperatures during selective melting of the metal powder [62]. Purge gas (nitrogen) is the second largest contributor (6–7%), with particular relevance in the LOP category (33%), mainly due to the energy- and infrastructure-intensive cryogenic separation process used in its industrial production [63]. Waste generation has a marginal contribution (<1%), reflecting the high rate of metal powder reuse. The reduced contribution of these streams is associated with the high powder reuse rate (with reuse in multiple cycles after sieving) and the limited amount of operational waste allocated proportionally to the analyzed production.
Figure 11.
Percentage distribution of the L-PBF process inputs/outputs across the different impact categories assessed.
In the finishing stage of L-PBF-produced elements (Figure 12), energy consumption remains the main impact factor, accounting for approximately 99% of the total environmental impact. The remaining flows have residual contributions (<1%), with cutting fluids and sludge waste being relatively more relevant in toxicity- and eutrophication-related categories, due to the presence of persistent organic compounds with pollutant potential.
Figure 12.
Percentage distribution of inputs/outputs of the finishing process of additively produced elements by the different impact categories evaluated.
Overall, the main environmental hotspots of 5G mold are associated with steel powder production and the high energy demand of the L-PBF and finishing process. Consequently, mitigation strategies should prioritize optimizing metal powder production, the reduction of energy consumption—through more efficient equipment, renewable energy integration, or design adaptations that reduce laser exposure time—as well as the replacement of conventional fluids with biodegradable alternatives and the implementation of recirculation and local treatment systems.
Regarding the economic analysis, raw materials acquisition is the most expensive step, accounting for about 83% of the total cost, followed by processing (17%). The L-PBF and standard elements dominate the acquisition costs, while L-PBF and massive elements drive the processing costs (Figure 13). The transportation costs are dominated by the massive elements accounting for more than 72%, since these elements present the major weight fraction in the 5G mold.
Figure 13.
Percentage distribution of direct costs among the elements that make up the 5G mold.
This reflects the high unit cost of additive manufacturing materials, the commercial values of externally acquired standard elements, and the specialized, high-precision nature of L-PBF production. Massive elements incur significant processing costs due to material volume and processing time.
Analysis of economic flows shows that costs vary by the type of element and technology, with raw materials, labor, and energy as the main economic hotspots. A detailed evaluation of direct costs per element (Figure 14) reveals that screws and standard elements concentrate costs in raw materials, while FDM elements are dominated by labor (73%) and energy (23%), followed by energy consumption (23.42%), reflecting the high cost of the materials used and the need for manual operations, CAD preparation, and final finishes. L-PBF elements mainly incur raw material (66%) and labor costs (22%) due to the photopolymer resins and conventional finishing. Other flows show a residual contribution.
Figure 14.
Distribution of the economic impact across the flows involved in each element that constitutes the 5G mold.
In the cylindrical elements, transportation (58%) and raw materials (33%) dominate costs, while massive elements are driven by raw materials (67%), labor (17%), and electricity (14%) due to material volume and machining complexity.
Indirect costs (Figure 15), linked to environmental impacts, are also significant, particularly in raw material acquisition and transportation stages, occasionally exceeding direct costs for conventionally machined elements.
Figure 15.
Comparison of direct and indirect costs at different stages of the life cycle of each of the 5G mold components.
In the raw material acquisition stage, indirect costs—linked to environmental impacts—exceed direct costs only for conventionally machined elements, particularly massive and cylindrical ones, representing 70% of the total and highlighting the high environmental footprint of material extraction and processing. In the FDM elements, direct and indirect costs are balanced, while in the L-PBF and standard elements, direct costs clearly predominate, reflecting lower relative environmental burdens.
In transportation, indirect costs are dominant (>90% of the total for most elements), showing that the environmental impact of logistics outweighs direct transportation costs influenced by distance, transport mode, and element weight/volume. This underscores the importance of optimizing logistics to reduce emissions and costs.
During processing, direct costs prevail, especially for FDM (99%), massive (82%), and L-PBF elements (82%), indicating labor and energy as the main drivers. Cylindrical elements are an exception, with indirect costs at 32%, reflecting the environmental impact of conventional machining.
In summary, the analysis of direct and indirect costs across the 5G mold life cycle shows that economic burdens are closely linked to both materials/process characteristics and environmental impacts, emphasizing the need for a holistic approach to economic and environmental sustainability.
3.3. LCA/LCC Result Discussion
A comparison of the LCA/LCC results for the two analyzed molds shows that the 5G mold with additive manufacturing-produced elements achieved an approximately 56% reduction in environmental impact compared to the conventional mold (Figure 16). The environmental impact associated with raw material acquisition was reduced by 39%, while the reduction in the processing stage was lower but still significant (15%).
Figure 16.
Comparison of the LCA results of the two studied molds.
The comparative analysis between the conventional and 5G molds was statistically supported by Monte Carlo simulations, enabling the assessment of both differences in average environmental impact and the statistical robustness of these differences across impact categories. In general, the results indicate a consistently superior environmental performance of the 5G mold, although the level of confidence varies by category. A comparative synthesis of average values, variability, and statistical robustness by impact category allows for the identification of those in which the 5G mold presents a clear environmental advantage and those where uncertainty limits the reliability of the conclusions. The complete table is available in Section S14 of the Supplementary Materials (Table S22), providing a detailed basis for interpreting the environmental performance differences between the conventional and 5G molds.
Overall, the results demonstrate that the environmental superiority of the 5G mold is clearly supported in key categories related to emissions, resource consumption, and marine and terrestrial ecotoxicity. In the categories with higher uncertainty, the advantage remains indicative but not statistically conclusive, highlighting the importance of uncertainty analysis for transparent and robust LCA interpretation. Considering both mean values and variability, the 5G mold emerges as the more environmentally efficient solution, with strong statistical evidence in the most environmentally relevant categories.
Regarding life cycle costs and accounting for the mass differences between molds and total direct and indirect costs—both overall and by life cycle stage—Figure 17 presents the comparative analysis of the direct and indirect costs of the conventional and 5G molds, disaggregated by life cycle stage.
Figure 17.
Comparison of the LCC of the conventional mold with the 5G mold.
Comparing direct costs, the 5G mold is 24% more expensive than the conventional mold, mainly due to a 34% increase in raw materials acquisition costs. Processing costs show a slight reduction of ~13%. Indirect environmental costs decrease by 24% for the 5G mold, with the largest reduction (22%) in the raw material acquisition phase.
Thus, it can be concluded that, although the 5G mold requires a higher initial investment due to the high cost of the additive manufacturing equipment, the reduction in indirect costs—mainly from avoided emissions over the mold’s life cycle—balances this increase, demonstrating that the 5G mold is a technically and economically viable solution, particularly in sustainability-focused contexts.
3.4. Circularity Analysis
This section presents the circularity analysis of conventional and 5G molds, using selected circularity indicators. This study evaluated the mold’s potential for circular design, disassembly, reuse, recycling, and material recovery throughout the life cycles, highlighting structural and operational differences that impact resource efficiency. The indicators provide a quantitative and qualitative view of the material loop closure, showing which design strategies and processes enhance circularity and sustainability.
3.4.1. Material Circularity Indicator
Figure 18 presents the MCI results, enabling a direct comparison between the conventional and 5G molds under different service scenarios. The conventional mold achieves an MCI of 64%, reflecting relatively high circularity, mainly due to its metallic components, which incorporate recycled content (30% for steel and 15% for bronze) and show high end-of-life recoverability (95% for steel and 90% for bronze). In contrast, the mixed and plastic materials, despite representing only about 6% of the total mass, reduce overall circularity, due to their low recycling content (20%) and have limited recoverability (20%), with most being landfilled.
Figure 18.
Result of the MCI calculation for both molds.
The 5G mold produced by additive manufacturing reaches an MCI of 74.1% when a 10-year service life is assumed, outperforming the conventional mold due to the high recycled content of steel powder (70%) and its good end-of-life recoverability. However, under a conservative scenario with a reduced service life of 7 years, the MCI decreased to 63%, falling below that of the conventional mold. This result highlights the strong influence of durability on circularity and shows that the advantage of additive manufacturing depends on achieving a service life comparable to conventional solutions.
In general terms, the results confirm that additive manufacturing can offer a higher circularity, provided that adequate durability is ensured. Accordingly, the literature recommends strategies, such as appropriate alloy selection, process control to reduce porosity, post-processing treatments [64], and hybrid manufacturing approaches [49,65,66], to prevent circularity gains from being offset by reducing service life.
3.4.2. Recycling Desirability Index
Based on the results obtained in Figure 19, the RDI remains largely unchanged with the incorporation of additive manufacturing, with very similar values for the conventional mold (2.33) and the 5G mold (2.36). Nevertheless, differences are observed in the underlying parameters. The 5G mold presents greater material simplicity (DMSI = 0.55 versus 0.60), indicating reduced materials diversity and improved recyclability. A slight improvement in material safety is also observed (DS = 0.90 compared to 0.84), reflecting a higher share of materials considered safer for recycling. In contrast, the technological readiness level of the recycling process (DTRL) remains unchanged for both molds (0.90).
Figure 19.
RDI results for each studied mold.
In summary, the 5G mold exhibits modest improvements in material simplicity and safety, but these do not significantly affect the overall recyclability performance. Both molds therefore present very similar RDI values, indicating that the adoption of additive manufacturing does not substantially alter recyclability, nor does it provide advantages in terms of technological maturity of the recycling process.
3.4.3. Longevity Indicator
The Longevity Index of the conventional mold is 35 years, while the 5G mold reaches 32 years (Table 5). Although the conventional mold shows a slightly higher value, the difference is small, reflecting similar circularity and overall durability for both solutions. The marginal advantage of the conventional mold is mainly related to structural robustness and the higher technological maturity of the conventional manufacturing process.
Despite its shorter initial service life, the 5G mold achieves comparable longevity, supported by the positive effects of reconditioning and the high recyclability of materials used.
In summary, while the 5G mold offers benefits in material efficiency and geometric optimization, the conventional mold still provides greater total durability, highlighting the need to consider both structural robustness and circular strategies when assessing mold longevity.
3.4.4. Disassembly Effort Index
For the conventional mold, the total disassembly time was 11,400 s, considering all stages and factors associated with the DEI indicator, namely time, tools, fastening, access, instructions, hazard, and force indices described in Table 6. In contrast, the 5G mold required 3880 s to complete disassembly, accounting for the same operation factors. The total DEI value was 10.2% for the conventional mold and 8.64% for the 5G mold, reflecting a more efficient and focused disassembly in the latter. The DEI attribution values for each factor, as well as the detailed description of each disassembly step for both molds, are presented in Tables S15 and S16 in Section S9 of the Supplementary Materials.
Table 6.
DEI classification for each mold.
In the conventional mold, the effort is evenly distributed across critical tasks—removal of accessories, sheet separation, and extraction system disassembly (17.7–17.8%)—with the final separation of parts requiring the least effort (DEI 10.1%). In the 5G mold, the highest effort was concentrated on carburetor cleaning and extraction system disassembly (9.91%), while accessory removal and sheet separation required less effort (7.66–8.16%).
The 5G mold disassembles almost three times faster than the conventional mold, concentrating effort on critical operations, while secondary steps demand less time and effort. Complex component handling remains important in both molds but represents a smaller proportion of the total effort in the 5G mold, reflecting a more optimized design. The final step of separating parts by type or material is essential for recycling in both cases. Overall, the 5G mold demonstrates lower disassembly effort, shorter disassembly time, and a more focused effort on critical operations, highlighting improvements in maintenance, ergonomics, and operational safety.
3.4.5. Circular Design Guidelines
The radar chart in Figure 20 illustrates the circular design guidelines (CDG) requiring improvement and their respective levels for the conventional and 5G molds, highlighting significant differences in guidelines implementation and optimization opportunities. In the conventional mold, areas such as product architecture and connectors have high CDG levels (6 to 7), indicating the need for standardized and easily accessible joints, minimizing the number and type of joints, and reducing the number of tools. Material recycling and component reuse also present room for improvement (both CDG = 6) through unifying materials, promoting monomaterial designs, and using standardized components while minimizing component variations. Extension of the product life cycle and reuse have lower CDG levels (2 to 4.8), though durability, adaptability, and maintenance can still be optimized.
Figure 20.
The radar chart represents the groups of design guidelines that require improvements for both molds.
In contrast, the 5G mold exhibits lower CDG levels (2 to 3.6), reflecting a more circular design overall. Optimization opportunities include product reuse (CDG = 3.6), such as design improvements to avoid dirt accumulation and incorporating monitoring systems, and material recycling and modular architecture (both CDG = 3) through the use of low-impact and recyclable materials, adoption of modular designs, and improved disassembly accessibility. The detailed improvement levels and relevance indices for each guideline and each mold are provided in Section S10 of the Supplementary (Tables S17 and S18), enabling the reader to review the raw assessments underpinning the radar chart. Overall, the CDG levels clearly show that the conventional mold has a higher potential for improvement, whereas the 5G mold already demonstrates more circular design practices.
3.4.6. Circular Economy Indicator Prototype
Figure 21 shows the radar chart of the circular performance of the conventional and 5G molds across their life cycle. CEIP analysis indicates that circular economy principles are partially integrated in both molds, with the 5G mold consistently outperforming the conventional one, though gaps remain relative to indicator limits.
Figure 21.
Results of the application of the CEIP indicator for each one of the molds. The blue line represents the reference limit of the indicator for each phase, while the green line translates the current performance of the conventional mold and the orange line the performance of the 5G mold in terms of circularity.
In the design/redesign phase, both molds score high, with a slight advantage for the 5G mold (27/27 points) due to the performed topological optimization, reducing material use, improving structural efficiency, and increasing adaptability. The largest difference appears in manufacturing, where the conventional mold (0/25 points) follows a linear approach, while the 5G mold (15/25 points) benefits from additive manufacturing, achieving more efficient material use, reduced waste, and greater geometric flexibility. In commercialization and end of life, both molds show low and similar performance (15/30 points), reflecting linear business models and limited value recovery. During use, the 5G mold scored higher (25/35 points) due to better operational performance and durability.
Overall, CEIP demonstrates that the 5G mold (102 points) is more circular than the conventional mold (80 points), especially in design, manufacturing, and use, highlighting additive manufacturing and topological optimization benefits. Both molds, however, require more integrated strategies in commercialization and end-of-life phases to maximize circularity across the life cycle.
4. Conclusions
This study demonstrates that the 5G mold produced by additive manufacturing represents a more environmentally efficient and economically competitive solution compared to the conventional mold. Its advantages are particularly evident when considering environmental impacts, life cycle costs, and integration of circular design principles. Specifically, the 5G mold achieves an approximately 54% reduction in total environmental impact, with a 24% decrease in indirect environmental costs, while direct costs increase by 24%. The Material Circularity Indicator reaches 75.6%, compared to 64% for the conventional mold, and disassembly time is reduced from 11,400 s to 3880 s, highlighting improved maintainability and operational efficiency.
From an industrial perspective, the conventional mold maintains advantages in applications requiring high structural robustness and established manufacturing processes, whereas the 5G mold is particularly suitable for flexible customized production, complex geometries, rapid prototyping, and sustainability-focused operations, provided that energy-intensive additive manufacturing processes and durability considerations are properly managed.
At the same time, the conventional mold shows strengths in overall structural robustness and technological maturity, indicating that a holistic assessment must consider trade-offs between durability, material efficiency, and circularity. Table 7 provides a comprehensive summary of the environmental, economic, and circularity results, integrating key numerical values and industrial implications, allowing for a clear view of the performance differences and trade-offs between the two mold solutions.
Table 7.
Comparative summary of conventional and 5G molds, showing environmental impacts, costs, circularity, disassembly effort, and industrial factors, highlighting key differences and trade-offs.
Overall, the findings reinforce the importance of integrating environmental, economic, and circularity indicators for a comprehensive sustainability assessment. The use of micro-indicators of circularity proves essential to capture aspects such as disassembly, recyclability, and design for longevity, which traditional LCA and LCC analyses alone cannot fully address. This integrated approach enables more informed decision-making in industrial contexts, supporting the adoption of solutions that balance environmental performance, economic feasibility, and circularity throughout the product life cycle.
Future research could explore strategies to further enhance the sustainability and circularity of mold production. Potential avenues include the integration of renewable energy sources in additive and conventional machining processes, the use of bio-based lubricants or Minimum Quantity Lubrication (MQL), and the reuse of steel from obsolete molds for the machining of conventional components. Additionally, optimizing mold designs for improved disassembly, modularity, and maintenance, as well as investigating long-term durability and performance under repeated use cycles, could provide valuable insights for balancing environmental performance, economic feasibility, and circularity. These approaches would complement the integrated use of LCA, LCC, and circularity micro-indicators, supporting more informed decision-making in sustainable and circular manufacturing.
Supplementary Materials
The following supporting information can be downloaded at: https://www.mdpi.com/article/10.3390/environments13030169/s1, Table S1: Monetization values for environmental impacts based on global costs for the year 2010. Table S2: LCI for the raw material transport stage involved in conventional mold. Table S3: Quantity of waste resulting from the operation of mold producer company’s infrastructure in accordance with the proportion that conventional mold represents in the company’s total waste production. Table S4: LCI of the waste resulting from the operation of the company’s infrastructure, estimated for the contribution corresponding to the production of a conventional mold. Table S5: LCI for modeling the extraction and atomization production process of steel powder. Table S6: LCI for modeling the extraction and production process of PA6 filament. Table S7: LCI for the transport step of the raw material wrapped in the supplier’s 5G mold to manufacture company. Table S8: LCI of the waste resulting from the operation of the mold-producing company’s infrastructure, estimated for the contribution corresponding to the production of a 5G mold. Table S9: Normalization values for environmental impacts are available in the ReCiPe 2016 method. Table S10: Coefficients applied to the Pedigree matrix used in uncertainty analysis. Table S11: Data used to calculate the MCI indicator for both molds under study. Table S12: Material safety index of each material that makes up the two molds under study. Table S13: Technology Readiness Level for each material involved in each mold under study. Table S14: Parameters for calculating the Longevity Index (LI) for the conventional and 5G molds, including useful life, reuse, reconditioning, recycling, and reusable mass [44,46,47,48,49,52,53,54,55,56,57]. Table S15: DEI classification for each stage of conventional mold disassembly. Table S16: DEI classification for each stage of the 5G mold disassembly. Table S17: Data used to calculate the CDG indicator for the conventional mold. Table S18: Data used to calculate the CDG indicator for the 5G mold. Table S19: Detailed Circular Economy Indicator Prototype (CEIP) scores for the conventional and 5G molds across all life cycle phases. Table S20: LCA study results of conventional molding for selected impact categories. Table S21: Results of the LCA study of the typologically optimized 5G mold for selected impact categories. Table S22: Results of the Monte Carlo uncertainty analysis comparing the conventional and 5G molds for each selected impact category, where CV is the Coefficient of Variation and CI is the confidence interval.
Author Contributions
Conceptualization, J.M., P.P. and E.C.; methodology, J.M.; validation, J.M. and E.C.; investigation, J.M.; resources, A.S. and P.P.; writing—original draft preparation, J.M.; writing—review and editing, P.P. and A.S.; supervision, P.P. and A.S.; project administration, P.P. and A.S. All authors have read and agreed to the published version of the manuscript.
Funding
This work was carried out within the framework of the “Agendas para a Inovação Empresarial” (Project n° 49, acronym “INOV.AM”), supported by the RRP—Recovery and Resilience Plan—and by European Funds NextGeneration EU.
Data Availability Statement
The data supporting the findings of this study are available from the corresponding author upon reasonable request.
Conflicts of Interest
The authors António Silva and Eleonora Caneve were employed by the Erofio company. All authors declare that the research was conducted in the absence of any commercial or financial relationships that could be construed as a potential conflict of interest.
References
- Formentini, G.; Ramanujan, D. Design for circular disassembly: Evaluating the impacts of product end-of-life status on circularity through the parent-action-child model. J. Clean. Prod. 2023, 405, 137009. [Google Scholar] [CrossRef] [Scilit]
- Simão, M.J.; Matos, J.; Simoes, R. Integrating Circularity Micro-Indicators into Automotive Product Development to Evaluate Environmental Trade-Offs and Guide Sustainable Design Decisions. Environments 2025, 12, 299. [Google Scholar] [CrossRef] [Scilit]
- Medina-Salgado, M.S.; García-Muiña, F.E.; Cucchi, M.; Settembre-Blundo, D. Adaptive life cycle costing (Lcc) modeling and applying to italy ceramic tile manufacturing sector: Its implication of open innovation. J. Open Innov. Technol. Mark. Complex. 2021, 7, 101. [Google Scholar] [CrossRef] [Scilit]
- Rossi, L.; Leone, D.; Barni, A.; Fontana, A. Assessing the Sustainability of Industrial Equipment Life Extension Strategies through a Life Cycle Approach: Methodology and Practical Guidelines. Processes 2022, 10, 203. [Google Scholar] [CrossRef] [Scilit]
- Falsafi, A.; Togiani, A.; Colley, A.; Varis, J.; Horttanainen, M. Life cycle assessment in circular design process: A systematic literature review. J. Clean. Prod. 2025, 521, 146188. [Google Scholar] [CrossRef] [Scilit]
- Lisiecki, M.; Damgaard, A.; Ragaert, K.; Astrup, T. Circular economy initiatives are no guarantee for increased plastic circularity: A framework for the systematic comparison of initiatives. Resour. Conserv. Recycl. 2023, 197, 107072. [Google Scholar] [CrossRef] [Scilit]
- ISO 14040:2006; Environmental Management—Life Cycle Assessment—Principles and Framework. International Organization for Standardization: Geneva, Switzerland, 2006.
- Mesa, J.A.; González-Quiroga, A. Development of a diagnostic tool for product circularity: A redesign approach. Res. Eng. Des. 2023, 34, 401–420. [Google Scholar] [CrossRef] [Scilit]
- Takeda, S.; Fargnoli, M.; Saito, I.K.; Ponce-Cueto, E. Key metrics to measure the performance and impact of reusable packaging in circular supply chains. Front. Sustain. 2022, 3, 910215. [Google Scholar] [CrossRef] [Scilit]
- Norris, G.A. Integrating Life Cycle Cost Analysis and LCA. Int. J. Life Cycle Assess. 2001, 6, 118–120. [Google Scholar] [CrossRef] [Scilit]
- Swarr, T.E.; Hunkeler, D.; Klöpffer, W.; Pesonen, H.-L.; Ciroth, A.; Brent, A.C.; Pagan, R. Environmental life-cycle costing: A code of practice. Int. J. Life Cycle Assess. 2011, 16, 389–391. [Google Scholar] [CrossRef] [Scilit]
- Swiderski, W.; Rolek, W. A model of product life cycle cost management based on the example of the spartan multimedia shooting training system. Economies 2021, 9, 90. [Google Scholar] [CrossRef] [Scilit]
- Hunkeler, D.; Lichtenvort, K.; Rebitzer, G. Environmental Life Cycle Costing, 1st ed.; Society of Environmental Toxicology and Chemistry; CRC Press: Boca Raton, FL, USA, 2008. [Google Scholar] [CrossRef] [Scilit]
- Martinez-Sanchez, V.; Kromann, M.A.; Astrup, T.F. Life cycle costing of waste management systems: Overview, calculation principles and case studies. Waste Manag. 2015, 36, 343–355. [Google Scholar] [CrossRef] [Scilit] [PubMed]
- Calado, E.A.; Leite, M.; Silva, A. Integrating life cycle assessment (LCA) and life cycle costing (LCC) in the early phases of aircraft structural design: An elevator case study. Int. J. Life Cycle Assess. 2019, 24, 2091–2110. [Google Scholar] [CrossRef] [Scilit]
- Lahner, K. Benefits & Limitations of Product Life Cycle Assessments (LCA). Sustainable Brand Platform. Available online: https://www.sustainablebrandplatform.com/articles/the-benefits-and-limitations-of-product-lca-explained (accessed on 2 December 2025).
- Samani, P. Synergies and gaps between circularity assessment and Life Cycle Assessment (LCA). Sci. Total. Environ. 2023, 903, 166611. [Google Scholar] [CrossRef] [Scilit]
- Jerome, A.; Ljunggren, M. Product lifetime in life cycle assessments of circular economy strategies—A review and consolidation of methodology. Int. J. Life Cycle Assess. 2025, 30, 2162–2189. [Google Scholar] [CrossRef] [Scilit]
- Favi, C.; Marconi, M. Product Eco-Design in the Era of the Circular Economy. Sustainability 2025, 17, 213. [Google Scholar] [CrossRef] [Scilit]
- Ortiz-de-Montellano, C.G.-S.; Ghannadzadeh, A.; Van der Meer, Y. Life Cycle Assessment and Circularity Assessment as Complementary Methods for the Circular and Sustainable Redesign of Multi-Material Products: A Case Study on Safety Industrial Footwear. J. Circ. Econ. 2025, 3, 251–273. [Google Scholar] [CrossRef] [Scilit]
- Lonca, G.; Lesage, P.; Majeau-Bettez, G.; Bernard, S.; Margni, M. Assessing scaling effects of circular economy strategies: A case study on plastic bottle closed-loop recycling in the USA PET market. Resour. Conserv. Recycl. 2020, 162, 105013. [Google Scholar] [CrossRef] [Scilit]
- Almeida, C.G. Estudo comparativo dos indicadores existentes de economia circular com perspetivas à criação de uma ferramenta de monitorização à realidade nacional portuguesa. 2020. Available online: https://repositorio-aberto.up.pt/bitstream/10216/129852/2/427536.pdf (accessed on 25 November 2025).
- Matos, J.; Martins, C.; Simões, C.L.; Simoes, R. Comparative analysis of micro level indicators for evaluating the progress towards a circular economy. Sustain. Prod. Consum. 2023, 39, 521–533. [Google Scholar] [CrossRef] [Scilit]
- European Commission; ECORYS; IEEP; Norion Ricardo. New Indicators Measuring Transition to Circularity Final Report; Publications Office of the European Union: Luxembourg, 2025; Available online: https://data.europa.eu/doi/10.2777/8593318 (accessed on 25 November 2025).
- Rigamonti, L.; Mancini, E. Life cycle assessment and circularity indicators. Int. J. Life Cycle Assess. 2021, 26, 1937–1942. [Google Scholar] [CrossRef] [Scilit]
- Matos, J.; Santos, S.; Simões, C.L.; Martins, C.I.; Simoes, R. Practical application of circularity micro-indicators to automotive plastic parts in an industrial context. Sustain. Prod. Consum. 2023, 43, 155–167. [Google Scholar] [CrossRef] [Scilit]
- Basile, V.; Petacca, N.; Vona, R. Measuring Circularity in Life Cycle Management: A Literature Review. Glob. J. Flex. Syst. Manag. 2024, 25, 419–443. [Google Scholar] [CrossRef] [Scilit]
- Munonye, W.C. Towards Circular Economy Metrics: A Systematic Review. Circ. Econ. Sustain. 2025, 5, 4093–4135. [Google Scholar] [CrossRef] [Scilit]
- Kristensen, H.S.; Mosgaard, M.A. A review of micro level indicators for a circular economy—Moving away from the three dimensions of sustainability? J. Clean. Prod. 2020, 243, 118531. [Google Scholar] [CrossRef] [Scilit]
- Frischknecht, R.; Jungbluth, N.; Althaus, H.J.; Hischier, R.; Doka, G.; Dones, R.; Heck, T.; Hellweg, S.; Wernet, G.; Nemecek, T.; et al. Overview and Methodology Data v2.0; A Joint Initiative of the ETH Domain and Swiss Federal Offices; Swiss Centre for Life Cycle Inventories: Dübendorf, Switzerland, 2007. [Google Scholar]
- Schoenberger, H. Integrated pollution prevention and control in large industrial installations on the basis of best available techniques—The Sevilla Process. J. Clean. Prod. 2009, 17, 1526–1529. [Google Scholar] [CrossRef] [Scilit]
- Xiao, H.; Gao, B.; Yu, S.; Liu, B.; Cao, S.; Peng, S. Life cycle assessment of metal powder production: A Bayesian stochastic Kriging model-based autonomous estimation. Auton. Intell. Syst. 2024, 4, 20. [Google Scholar] [CrossRef] [Scilit]
- Kokare, S.; Oliveira, J.; Godina, R. Life cycle assessment of additive manufacturing processes: A review. J. Manuf. Syst. 2023, 68, 536–559. [Google Scholar] [CrossRef] [Scilit]
- Mosomi, E.K.; Olanrewaju, O.A.; Adeosun, S.O. Pivotal role of polylactide in carbon emission reduction: A comprehensive review. Eng. Rep. 2024, 6, e12909. [Google Scholar] [CrossRef] [Scilit]
- Polymer Process. How Much Plastic Is Wasted During Extrusion: Understanding the Impact on Environment. Available online: https://polymer-process.com/how-much-plastic-is-wasted-during-extrusion/?utm_source=chatgpt.com (accessed on 13 May 2025).
- Osadolor, A.O.; Showole, A.O.; Asamoah, G.A.; Judethaddeus, T. Life Cycle Assessment of Polylactic Acid (PLA) in 3D Printing Applications: Evaluating Environmental Impacts and Energy Consumption. Int. J. Eng. Res. Technol. (IJERT) 2024, 13, 266–270. Available online: https://www.ijert.org/research/life-cycle-assessment-of-polylactic-acid-pla-in-3d-printing-applications-evaluating-environmental-impacts-and-energy-consumption-IJERTV13IS080020.pdf (accessed on 7 March 2026).
- Goddin, J.; Jones, S.; Krieger, T.; Lenges, C.; Coleman, B.; Pierce, C.J.; Iliefski-Janols, S.; Veenendaal, R.; Stoltz, P.; Ford, L.; et al. Circularity Indicators Project—Project Overview; Ellen MacArthur Foundation Project Team. 2019. Available online: http://www.ellenmacarthurfoundation.org/circularity-indicators/ (accessed on 13 May 2025).
- Mesa, J.; Esparragoza, I.; Maury, H. Developing a set of sustainability indicators for product families based on the circular economy model. J. Clean. Prod. 2018, 196, 1429–1442. [Google Scholar] [CrossRef] [Scilit]
- Circular Steel: A System Perspective on Recycled Content Targets. 2023. Available online: www.thyssenkrupp-steel.com/en/ (accessed on 13 May 2025).
- Steel Recycling Institute. Steel Takes LEED® with Recycled Content: LEED® NC 2009 Recycled Content Value of Steel Building Products. American Iron and Steel Institute. 2012. Available online: https://strucsteel.com/docs/Steel-Recycling.pdf (accessed on 10 October 2025).
- Gronostajski, J.; Chmura, W.; Gronostajski, Z. Bearing materials obtained by recycling of aluminium and aluminium bronze chips. J. Mater. Process. Technol. 2002, 125, 483–490. [Google Scholar] [CrossRef] [Scilit]
- Pauliuk, S.; Kondo, Y.; Nakamura, S.; Nakajima, K. Regional distribution and losses of end-of-life steel throughout multiple product life cycles—Insights from the global multiregional MaTrace model. Resour. Conserv. Recycl. 2017, 116, 84–93. [Google Scholar] [CrossRef] [Scilit] [PubMed]
- Zeiler, B.; Bartl, A.; Schubert, W.-D. Recycling of tungsten: Current share, economic limitations, technologies and future potential. Int. J. Refract. Met. Hard Mater. 2021, 98, 105546. [Google Scholar] [CrossRef] [Scilit]
- Karmakar, G.P. Regeneration and Recovery of Plastics. In Encyclopedia of Materials: Plastics and Polymers; Elsevier: Amsterdam, The Netherlands, 2022; Volumes 1–4, pp. 634–651. [Google Scholar] [CrossRef] [Scilit]
- Sun, X.; Chen, M.; Liu, T.; Zhang, K.; Wei, H.; Zhu, Z.; Liao, W. Characterization, preparation, and reuse of metallic powders for laser powder bed fusion: A review. Int. J. Extrem. Manuf. 2024, 6, 012003. [Google Scholar] [CrossRef] [Scilit]
- Frumosu, F.D.; Rønsch, G.Ø.; Kulahci, M. Mould wear-out prediction in the plastic injection moulding industry: A case study. Int. J. Comput. Integr. Manuf. 2020, 33, 1245–1258. [Google Scholar] [CrossRef] [Scilit]
- Ilyas, I.P. Production of Plastic Injection Moulding Tools using Selective Laser Sintering and High Speed Machining. Doctoral Dissertation, University of Leeds, Leeds, UK, 2007. [Google Scholar]
- Neagu, C.-D. Understanding Plastic Injection Molding’s Lifespan. Xometry. Available online: https://www.xometry.com/resources/injection-molding/plastic-injection-molding-lifespan/ (accessed on 2 October 2025).
- Liu, H.; Yu, H.; Guo, C.; Chen, X.; Zhong, S.; Zhou, L.; Osman, A.; Lu, J. Review on Fatigue of Additive Manufactured Metallic Alloys: Microstructure, Performance, Enhancement, and Assessment Methods. Adv. Mater. 2024, 36, e2306570. [Google Scholar] [CrossRef] [Scilit]
- Sultan, A.A.M.; Lou, E.; Mativenga, P.T. What should be recycled: An integrated model for product recycling desirability. J. Clean. Prod. 2017, 154, 51–60. [Google Scholar] [CrossRef] [Scilit]
- Figge, F.; Thorpe, A.S.; Givry, P.; Canning, L.; Franklin-Johnson, E. Longevity and Circularity as Indicators of Eco-Efficient Resource Use in the Circular Economy. Ecol. Econ. 2018, 150, 297–306. [Google Scholar] [CrossRef] [Scilit]
- Goldsberry, C. Old Molds Made New Again. Plastics Today. Available online: https://www.plasticstoday.com/injection-molding/old-molds-made-new-again (accessed on 2 October 2025).
- Serratore, G.; Borda, F.; Basile, V.; Filice, L. Life cycle assessment-guided design for sustainable microinjection molds. In Materials Research Proceedings; Association of American Publishers: Washington, DC, USA, 2025; pp. 1807–1816. [Google Scholar] [CrossRef] [Scilit]
- El Kashouty, M.F.; Rennie, A.E.W.; Ghazy, M. Tool life performance of injection mould tooling fabricated by selective laser melting for high-volume production. Materials 2019, 12, 3910. [Google Scholar] [CrossRef] [Scilit]
- Eggert, A.; European Steel Association (EUROFER). EUROFER Annual Report 2022; EUROFER: Brussels, Belgium, 14 June 2022; Available online: https://www.eurofer.eu/assets/publications/reports-or-studies/annual-report-2022/EUROFER-Annual-Report-2022.pdf (accessed on 25 October 2025).
- Birat, J.-P. Life-cycle assessment, resource efficiency and recycling. Met. Res. Technol. 2015, 112, 206. [Google Scholar] [CrossRef] [Scilit]
- Lanzutti, A.; Marin, E. The Challenges and Advances in Recycling/Re-Using Powder for Metal 3D Printing: A Comprehensive Review. Metals 2024, 14, 886. [Google Scholar] [CrossRef] [Scilit]
- Das, S.K.; Yedlarajiah, P.; Narendra, R. An approach for estimating the end-of-life product disassembly effort and cost. Int. J. Prod. Res. 2000, 38, 657–673. [Google Scholar] [CrossRef] [Scilit]
- Bovea, M.D.; Pérez-Belis, V. Identifying design guidelines to meet the circular economy principles: A case study on electric and electronic equipment. J. Environ. Manag. 2018, 228, 483–494. [Google Scholar] [CrossRef] [Scilit] [PubMed]
- Cayzer, S.; Griffiths, P.; Beghetto, V. Design of indicators for measuring product performance in the circular economy. Int. J. Sustain. Eng. 2017, 10, 289–298. [Google Scholar] [CrossRef] [Scilit]
- Ehmsen, S.; Conrads, J.; Klar, M.; Aurich, J.C. Environmental Impact of Powder Production for Additive Manufacturing: Carbon Footprint and Cumulative Energy Demand of Gas Atomization. J. Manuf. Syst. 2025, 82, 13–25. [Google Scholar] [CrossRef] [Scilit]
- Faludi, J.; Baumers, M.; Maskery, I.; Hague, R. Environmental Impacts of Selective Laser Melting: Do Printer, Powder, Or Power Dominate? J. Ind. Ecol. 2017, 21, S144–S156. [Google Scholar] [CrossRef] [Scilit]
- Zhang, M.; Cheng, C.; Zhao, Y.; Wang, B. Life Cycle Assessment for Industrial Gas Production in China. Research Square 2024, preprint. [Google Scholar] [CrossRef] [Scilit]
- Qin, S.; Herzog, S.; Kaletsch, A.; Broeckmann, C. Improving the Fatigue Strength of Laser Powder Bed-Fused AISI M3:2 by Hot Isostatic Pressing. Steel Res. Int. 2022, 94, 2200435. [Google Scholar] [CrossRef] [Scilit]
- Afroz, L.; Qian, M.; Forsmark, J.; Li, Y.; Easton, M.; Das, R. Fatigue life of laser powder bed fusion (L-PBF) AlSi10Mg alloy: Effects of surface roughness and porosity. Prog. Addit. Manuf. 2025, 10, 2423–2441. [Google Scholar] [CrossRef] [Scilit]
- Pragana, J.P.M.; Sampaio, R.F.V.; Bragança, I.M.F.; Silva, C.M.A.; Martins, P.A.F. Hybrid metal additive manufacturing: A state–of–the-art review. Adv. Ind. Manuf. Eng. 2021, 2, 100032. [Google Scholar] [CrossRef] [Scilit]
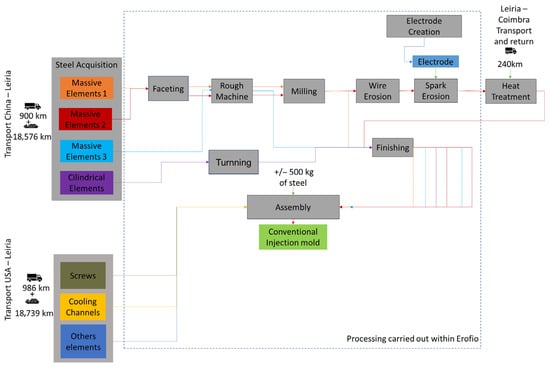
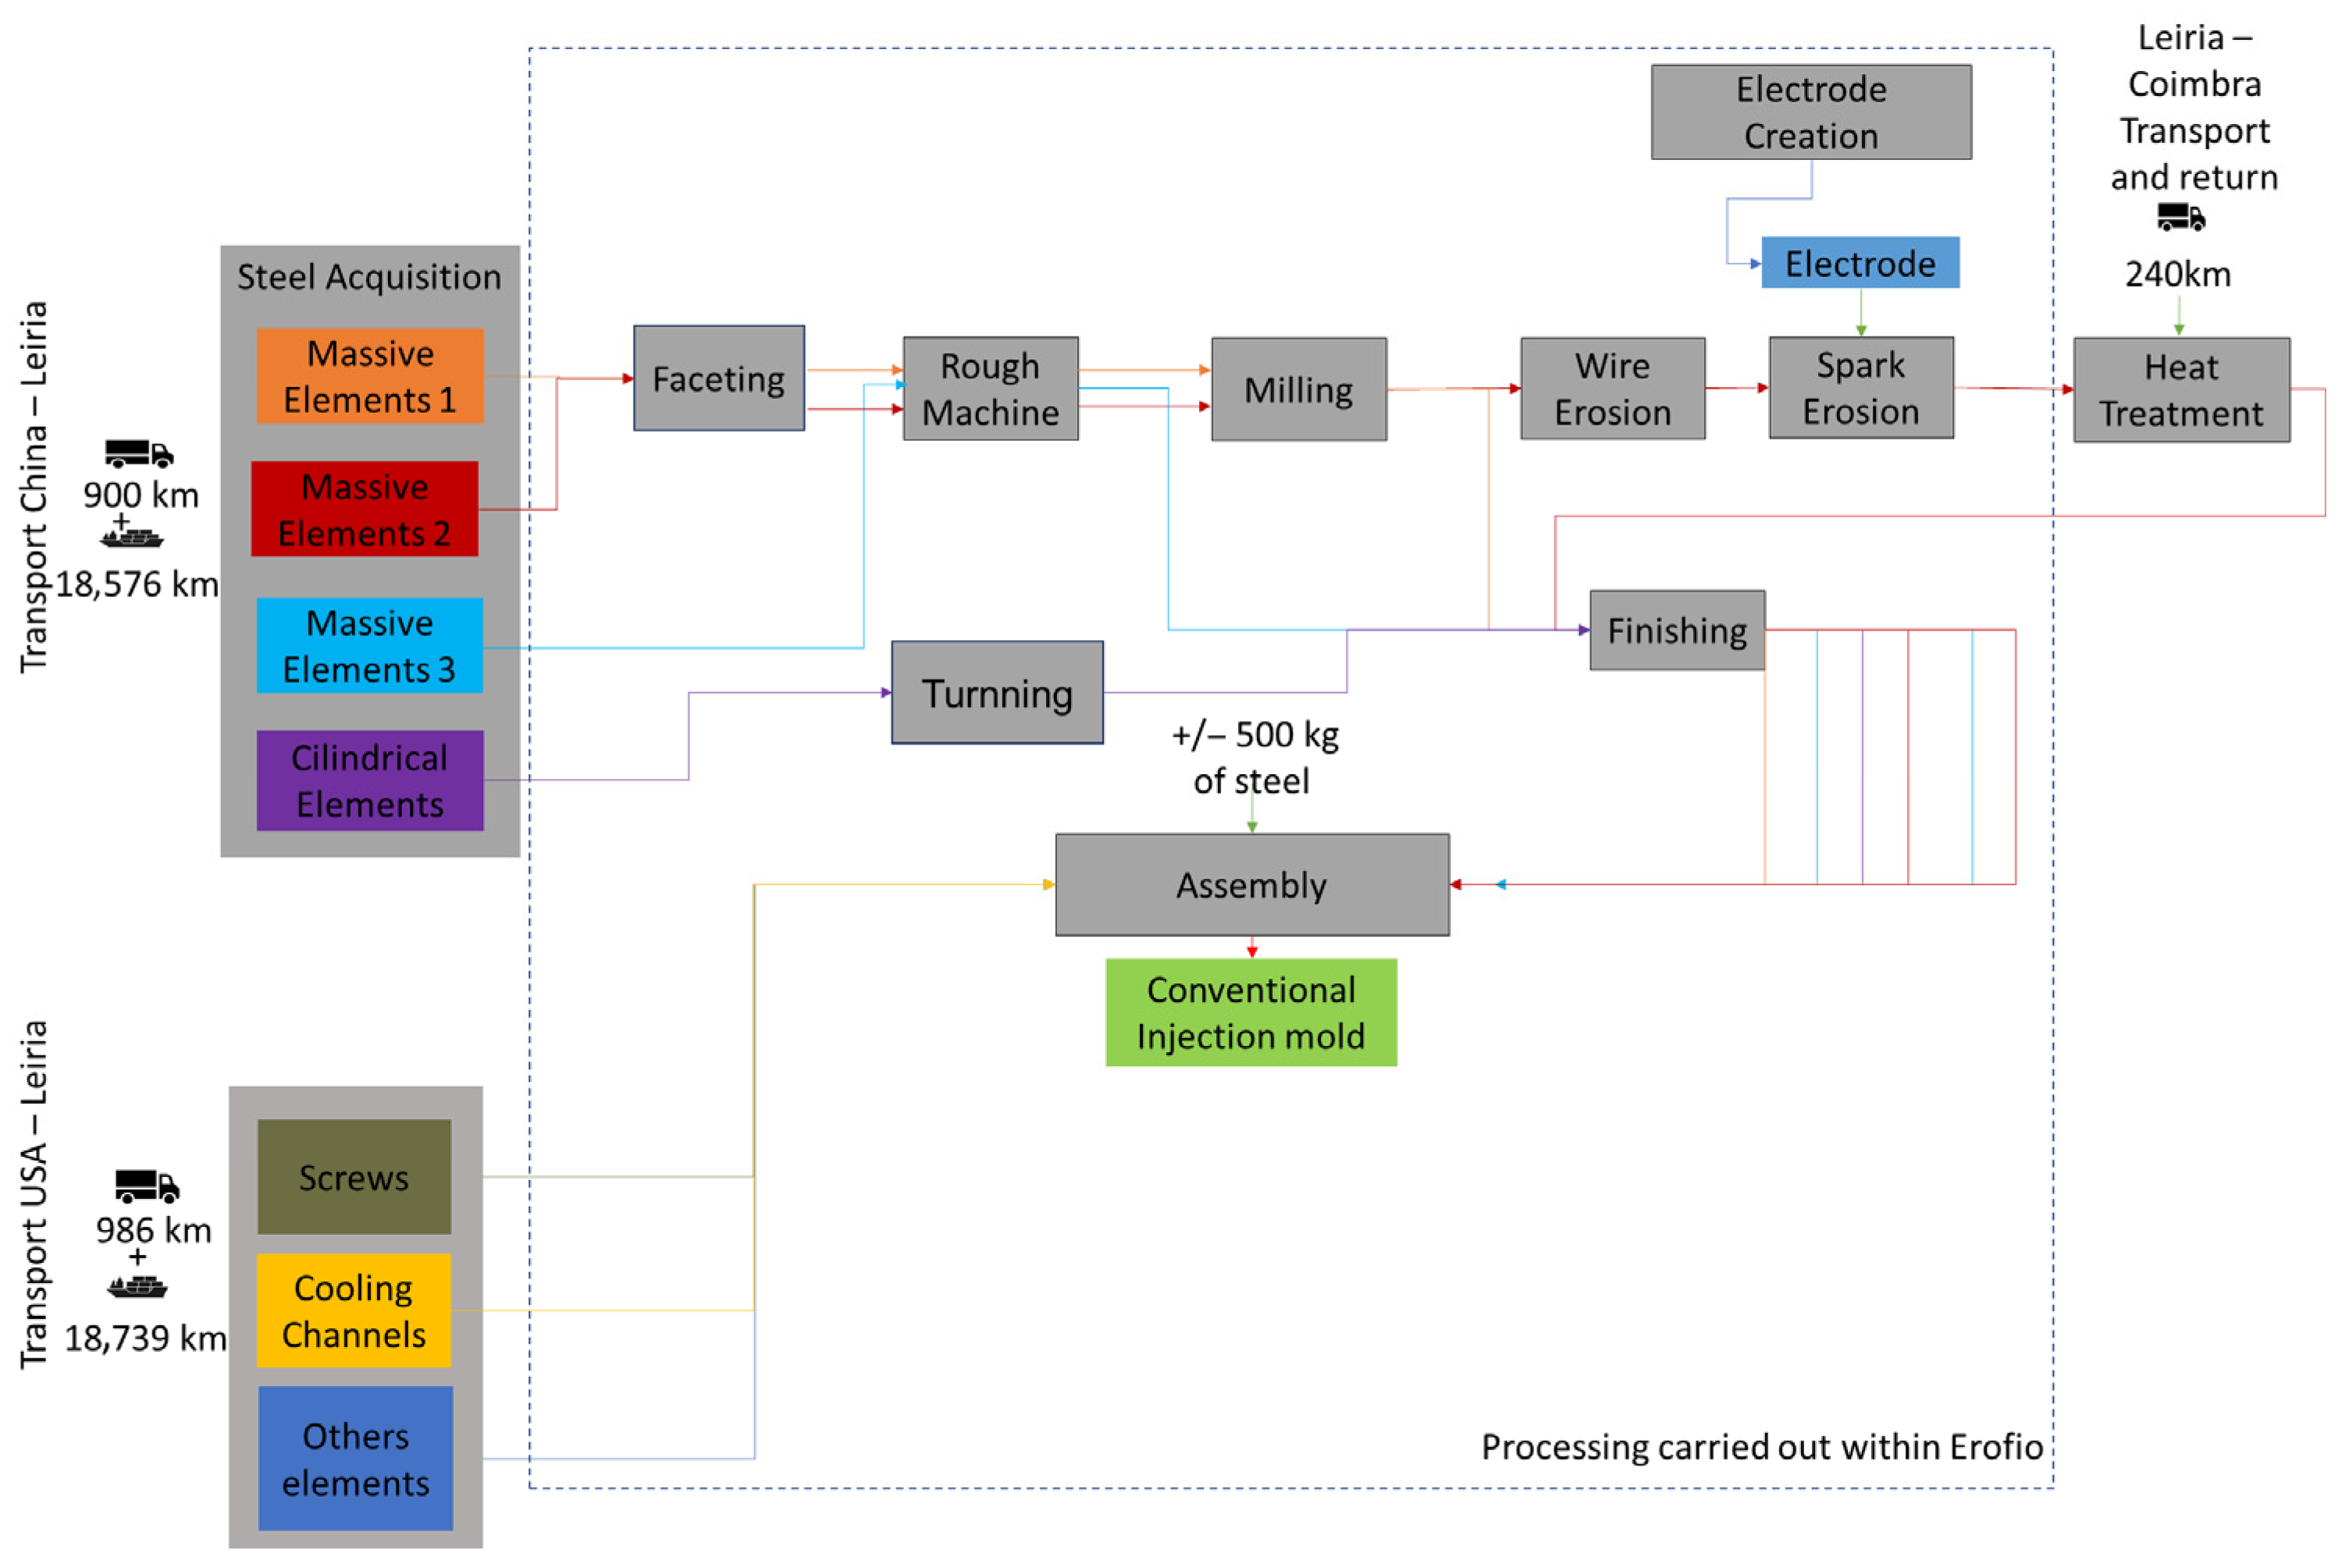
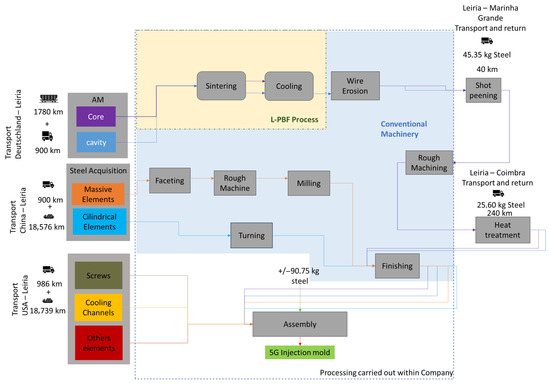
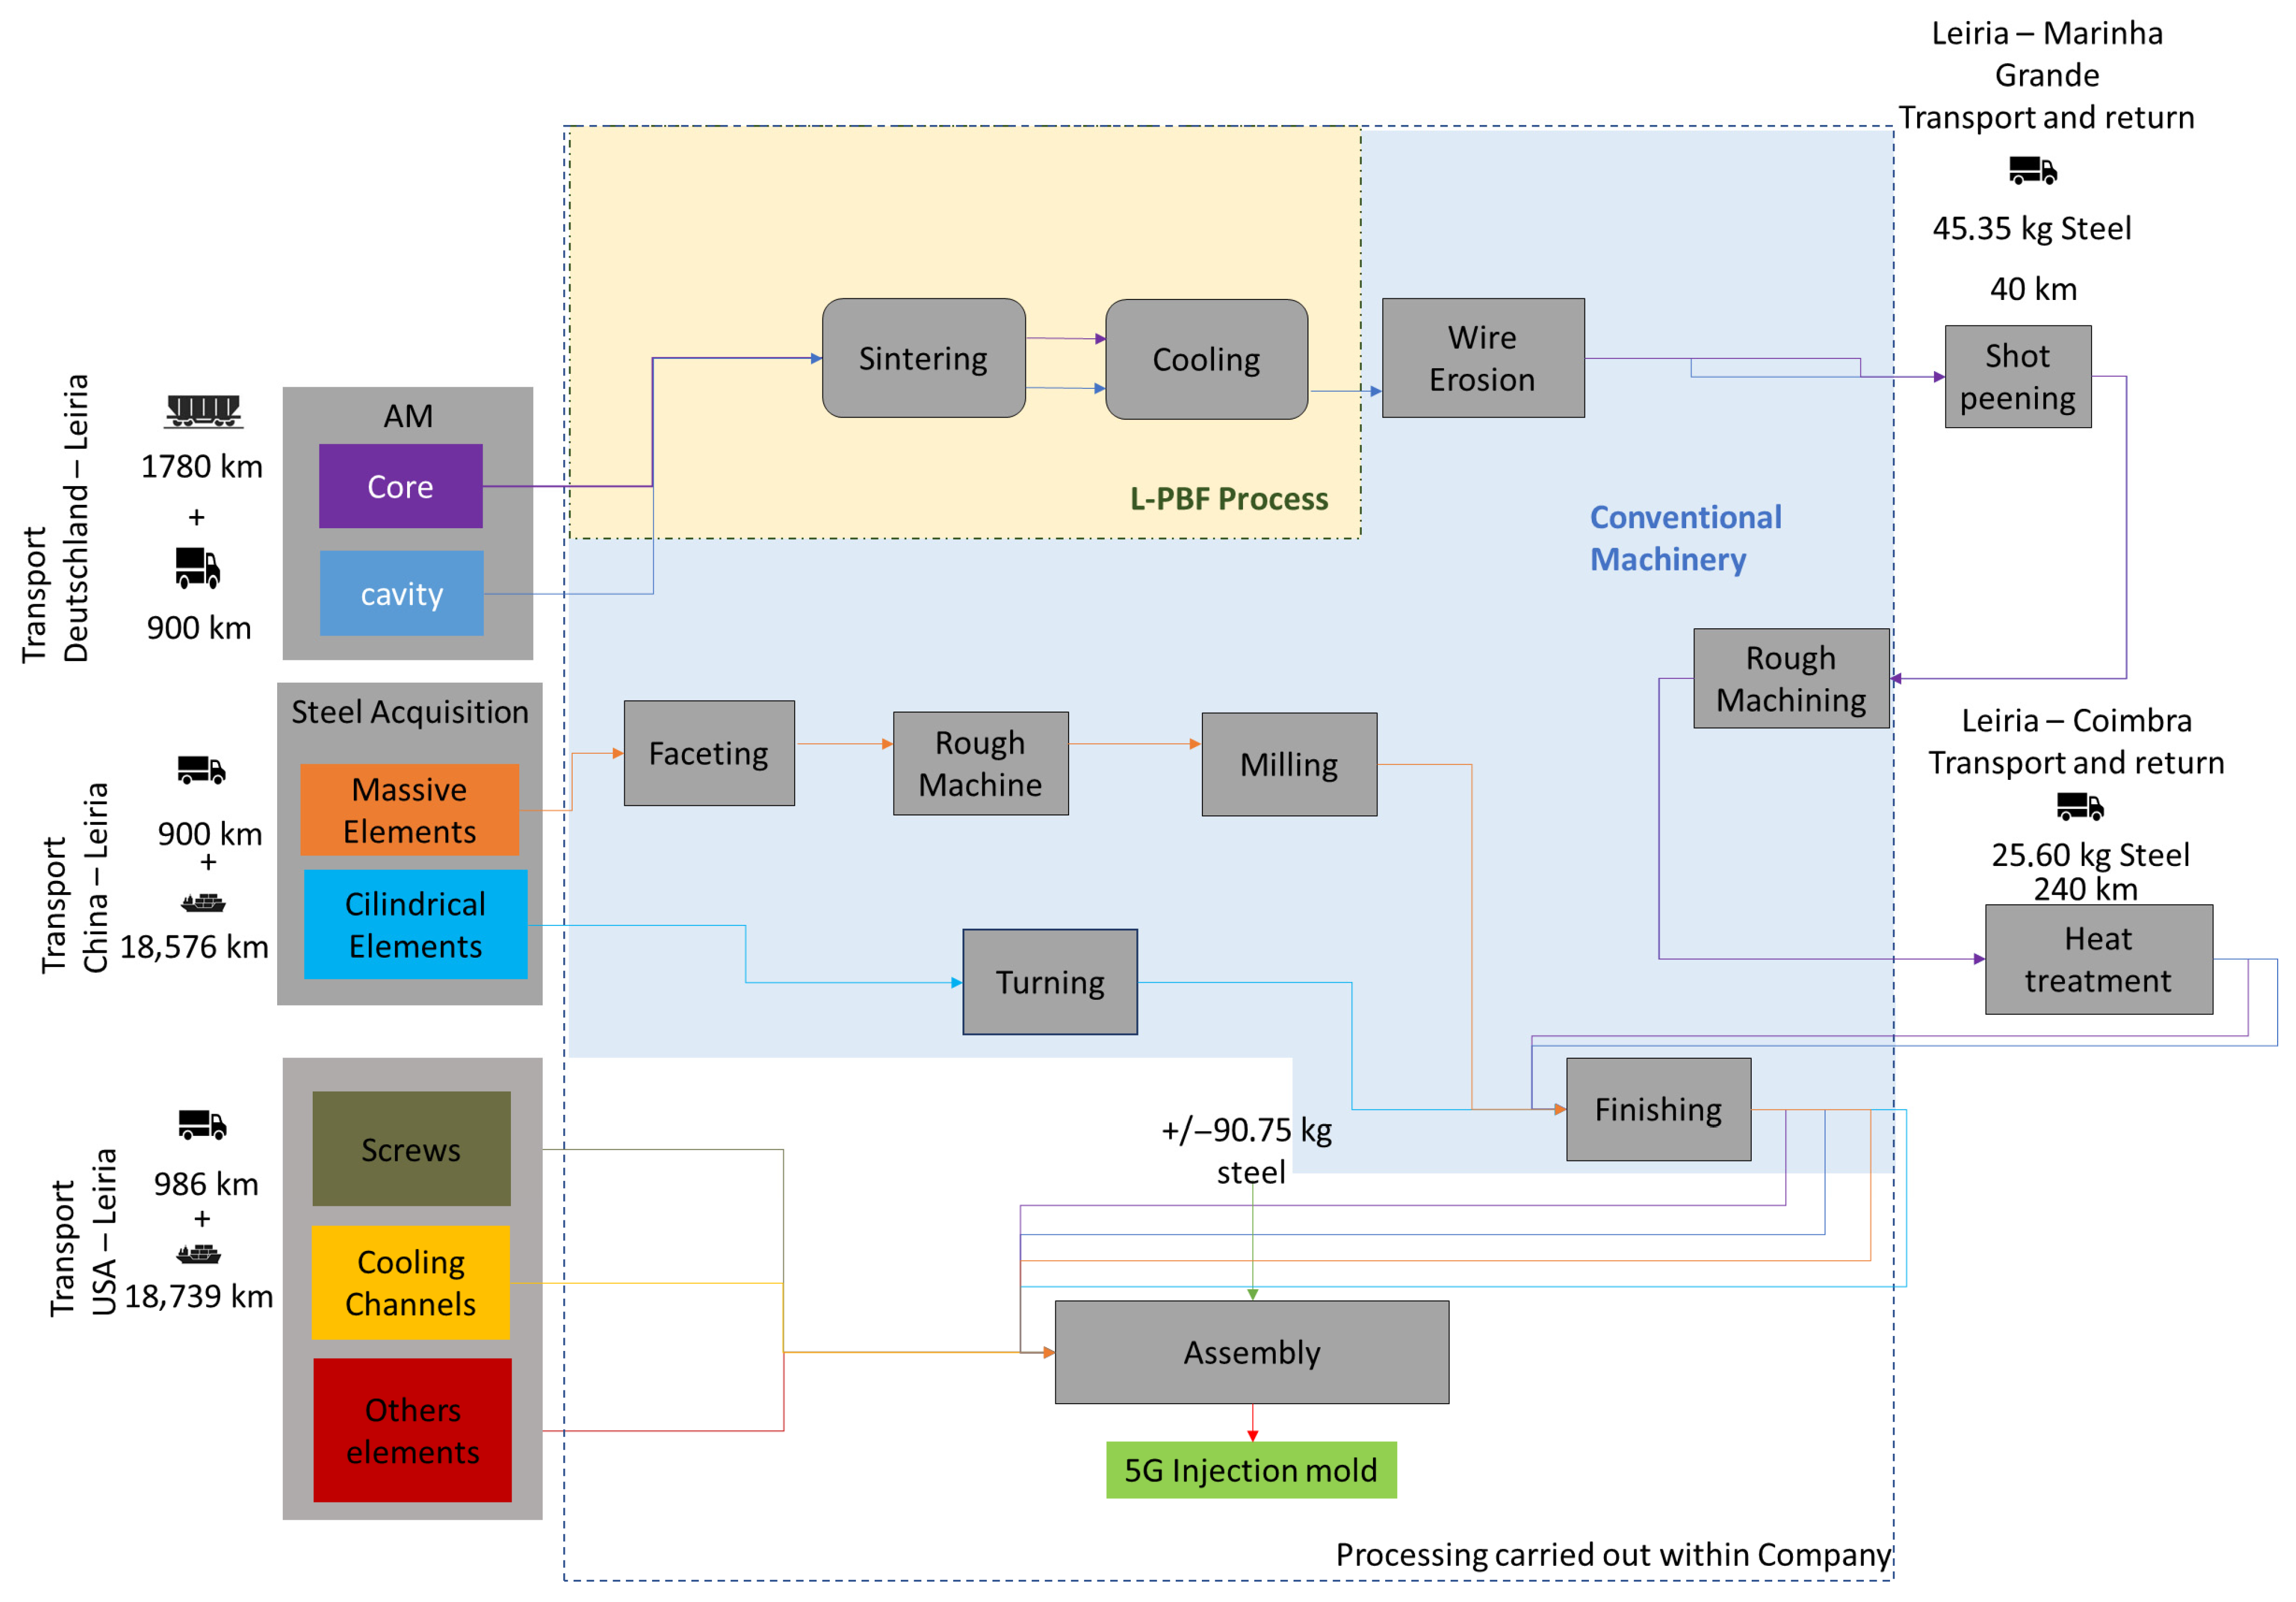
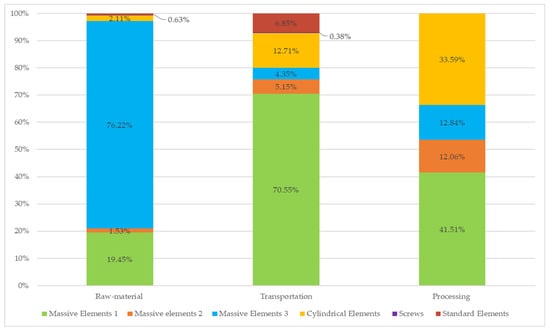
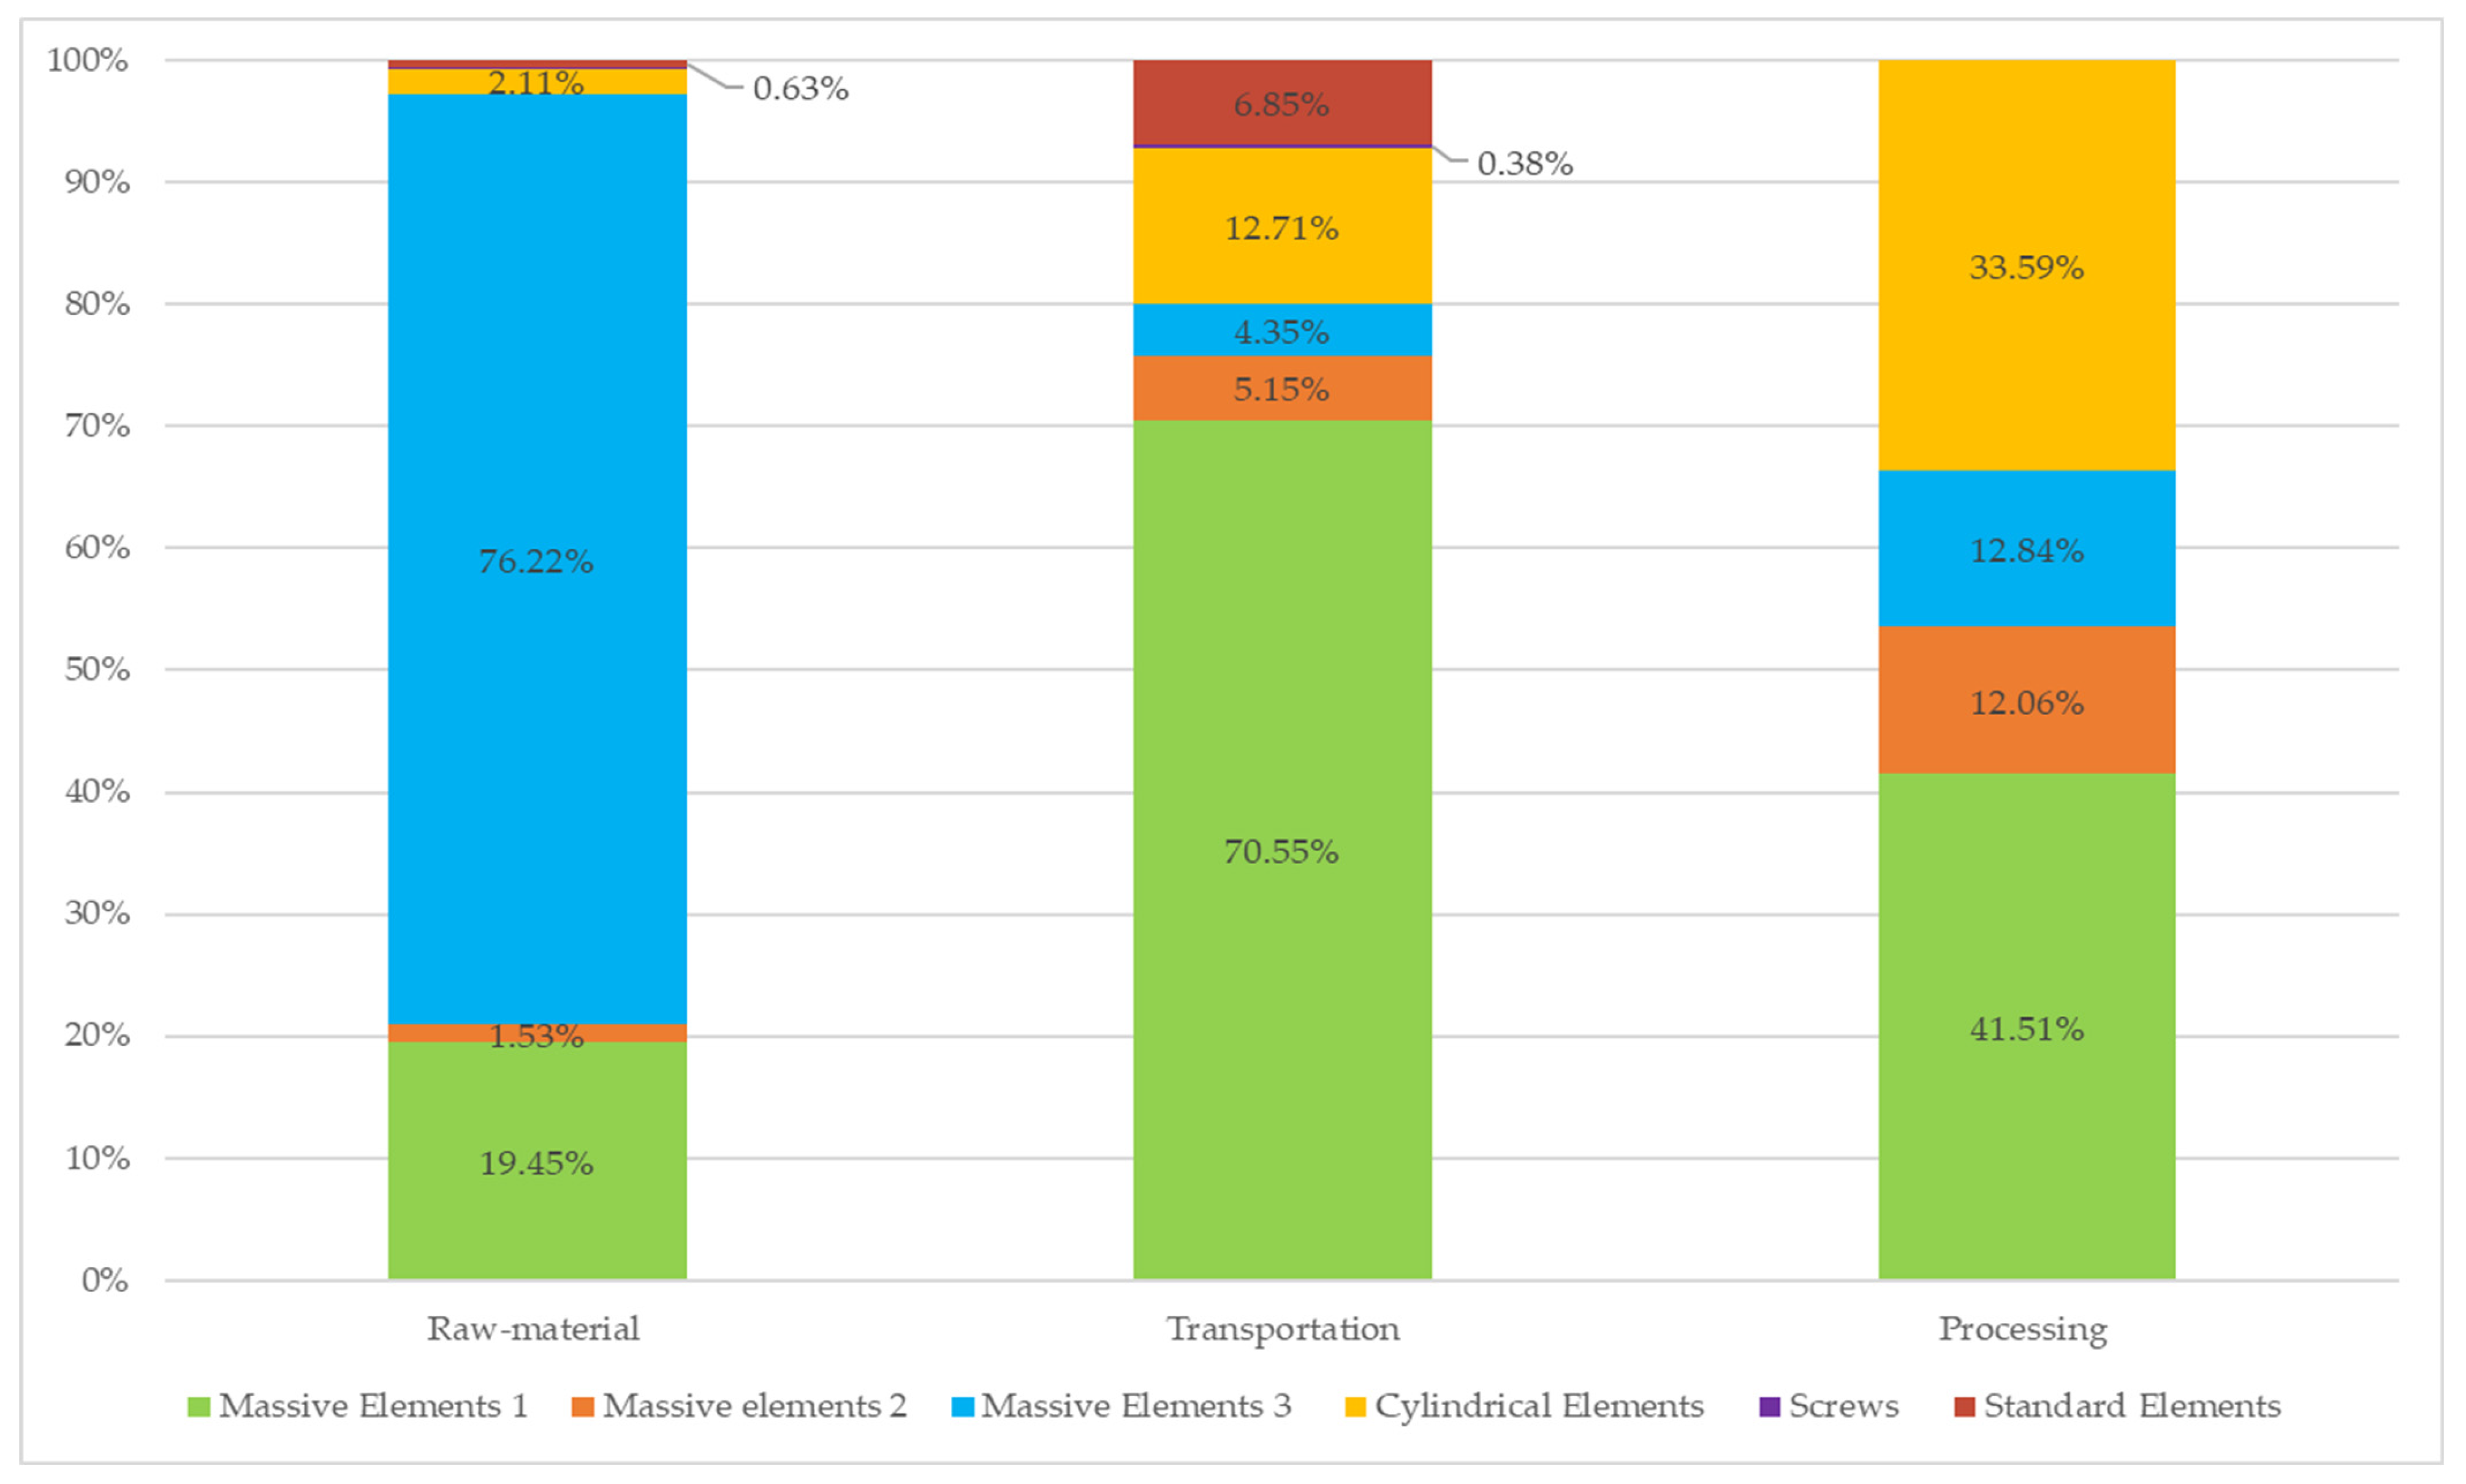
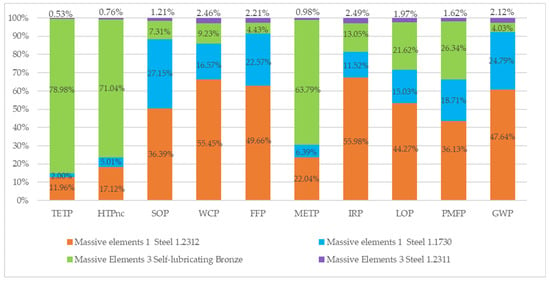
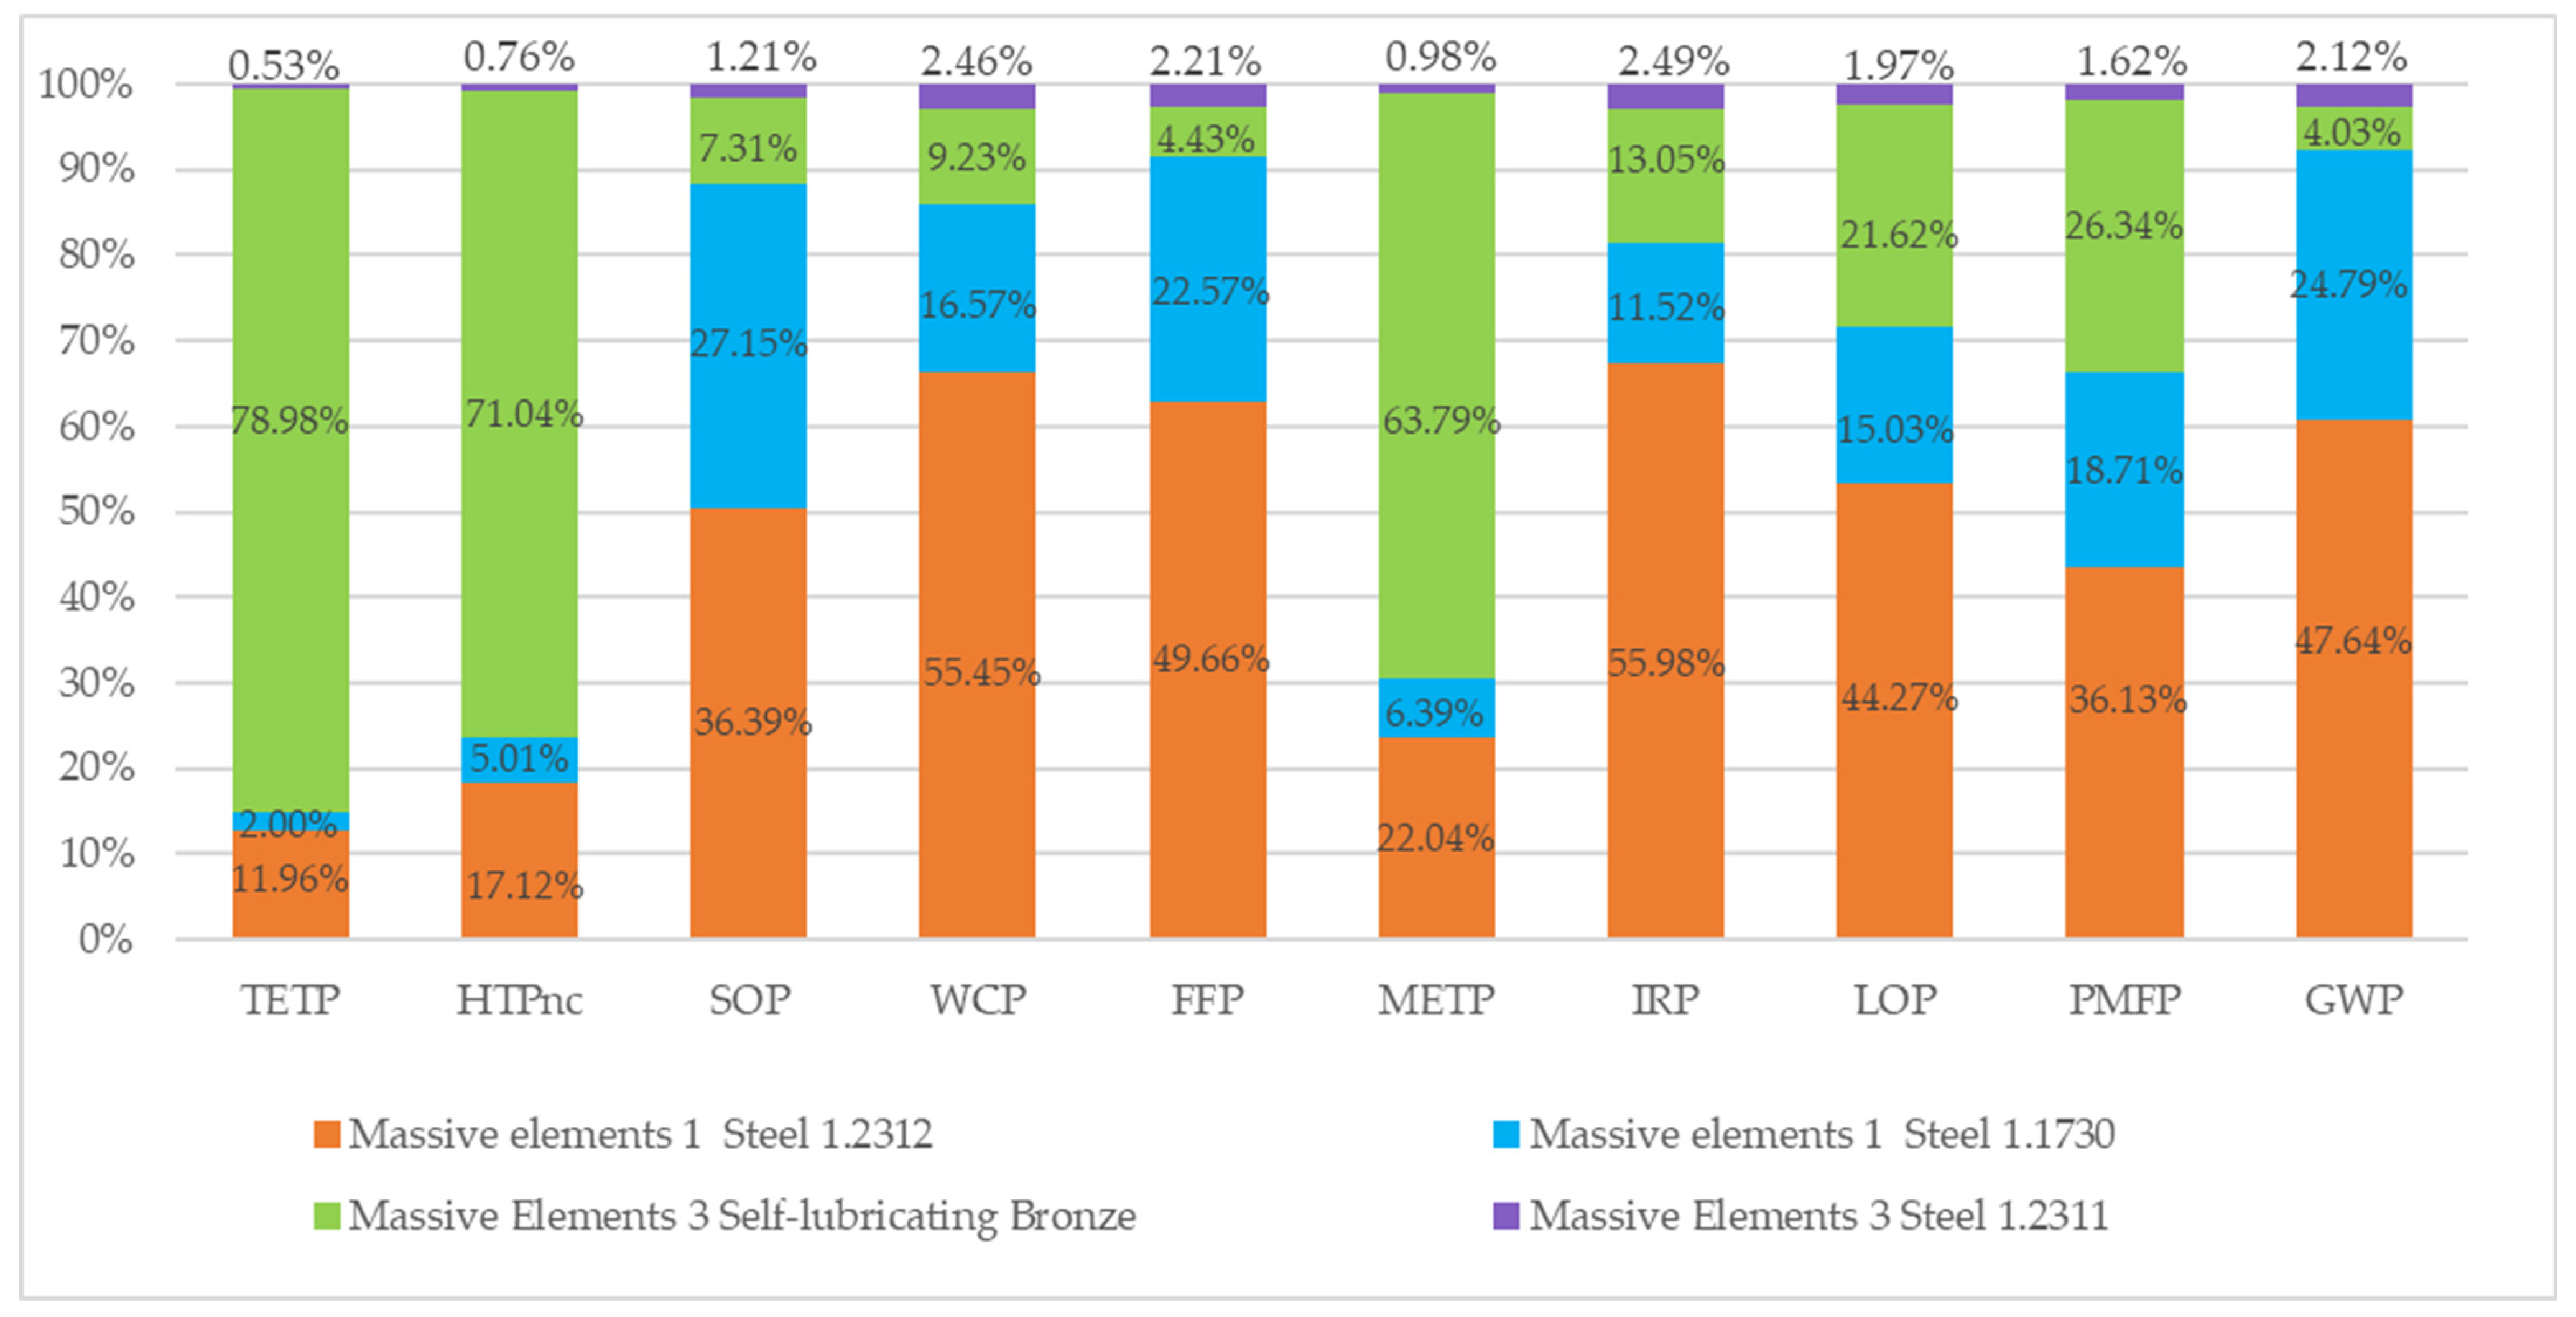
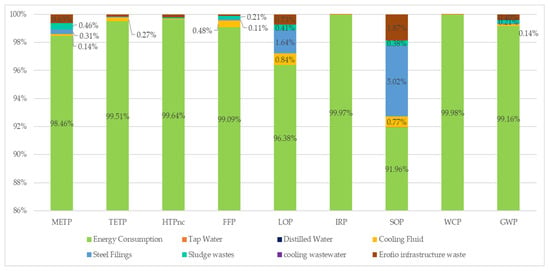
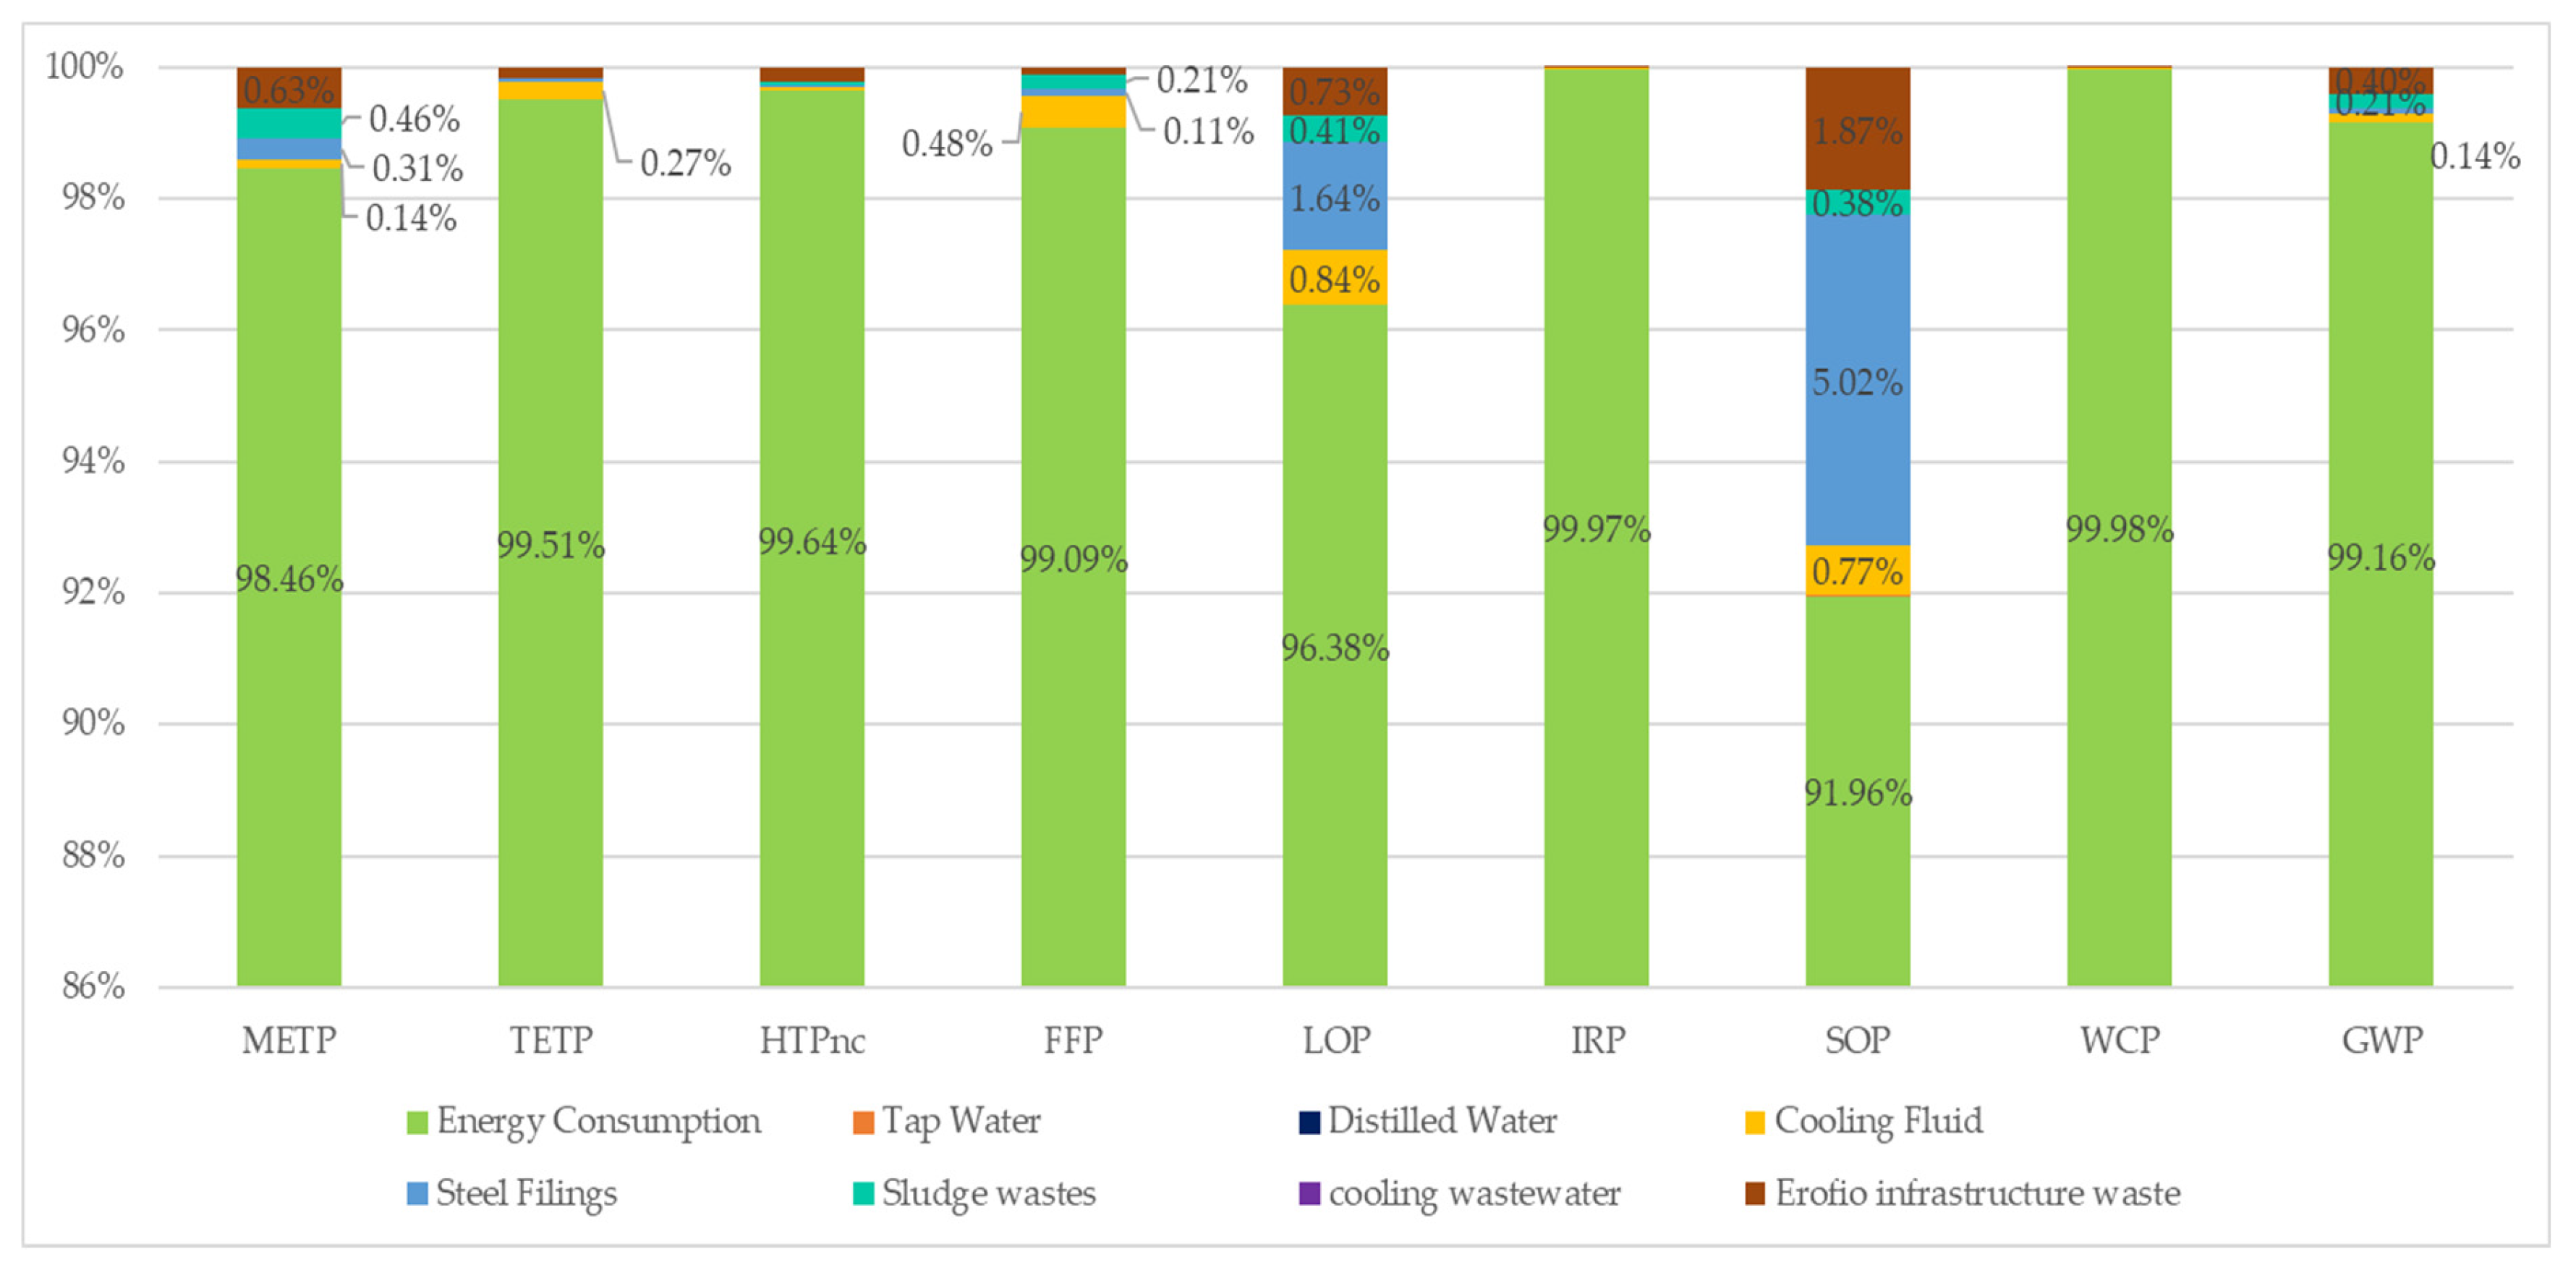
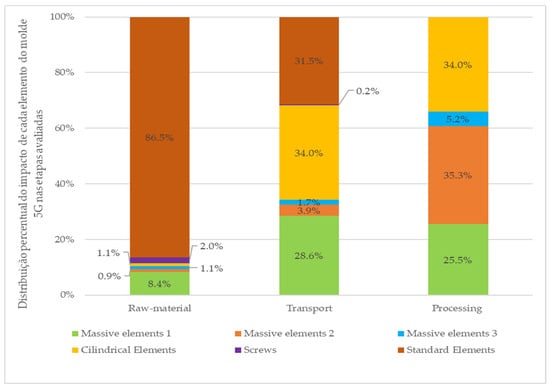
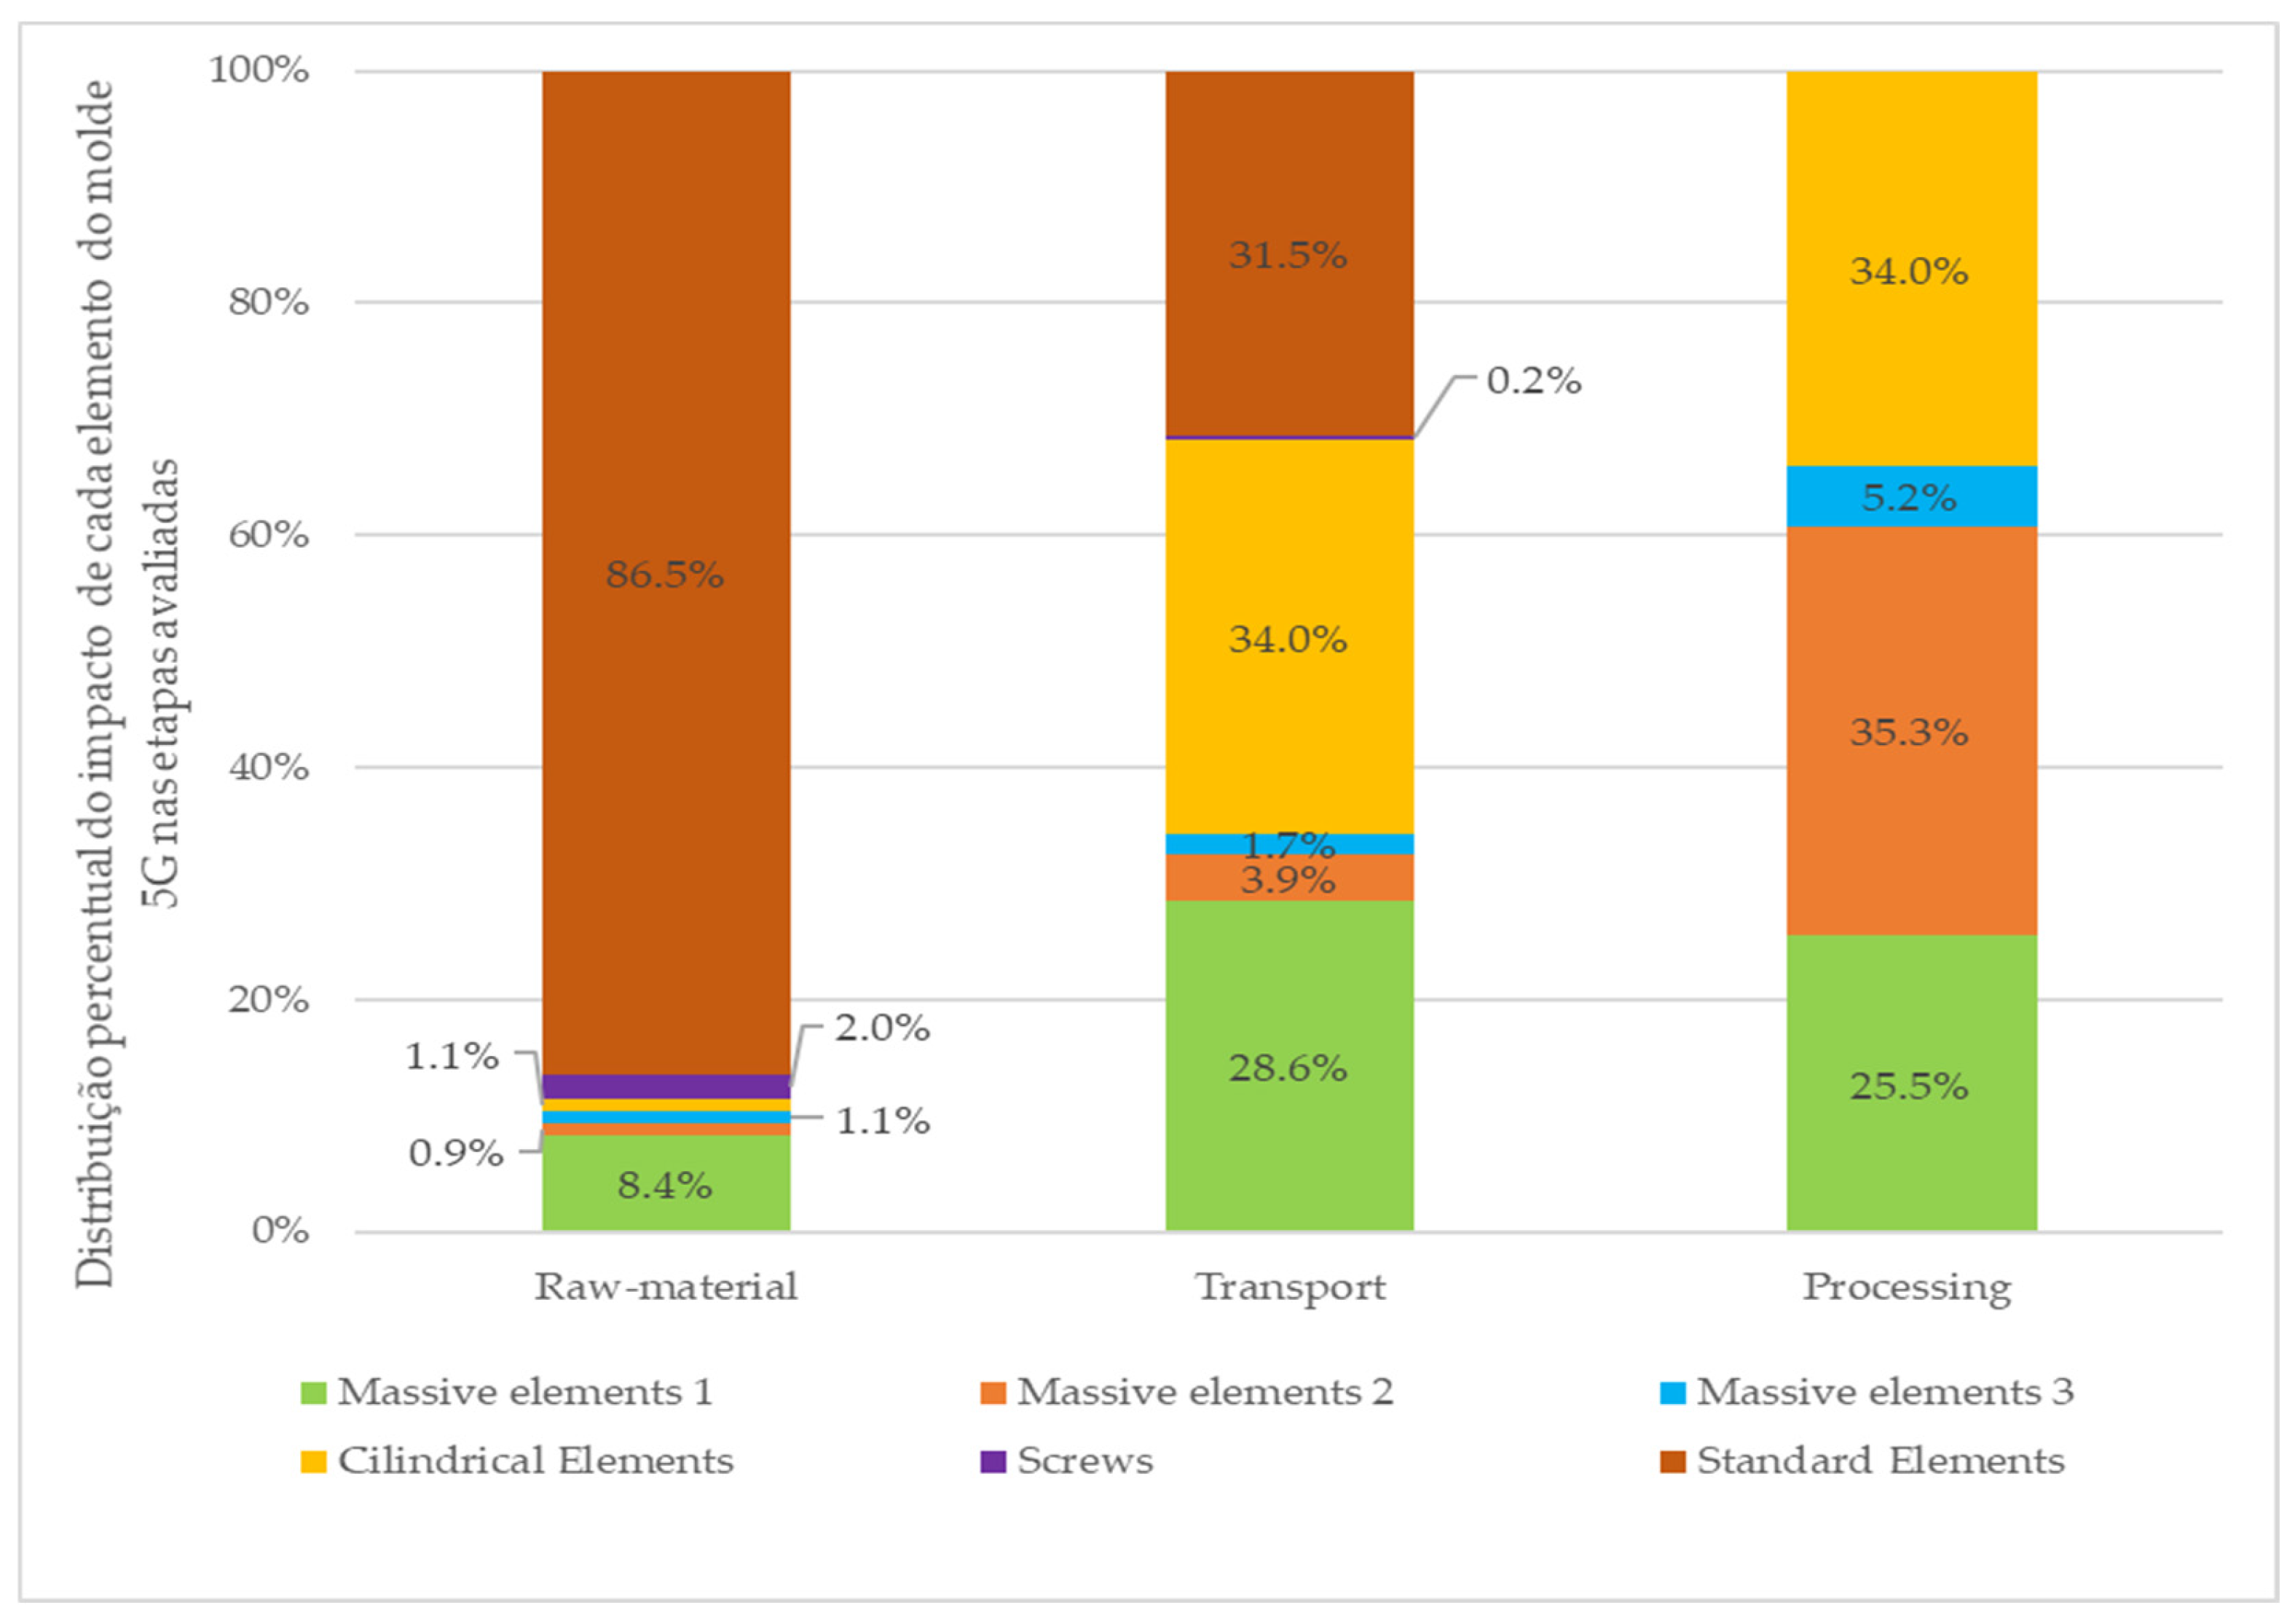
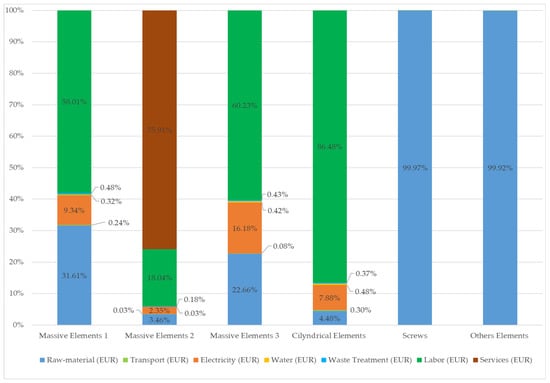
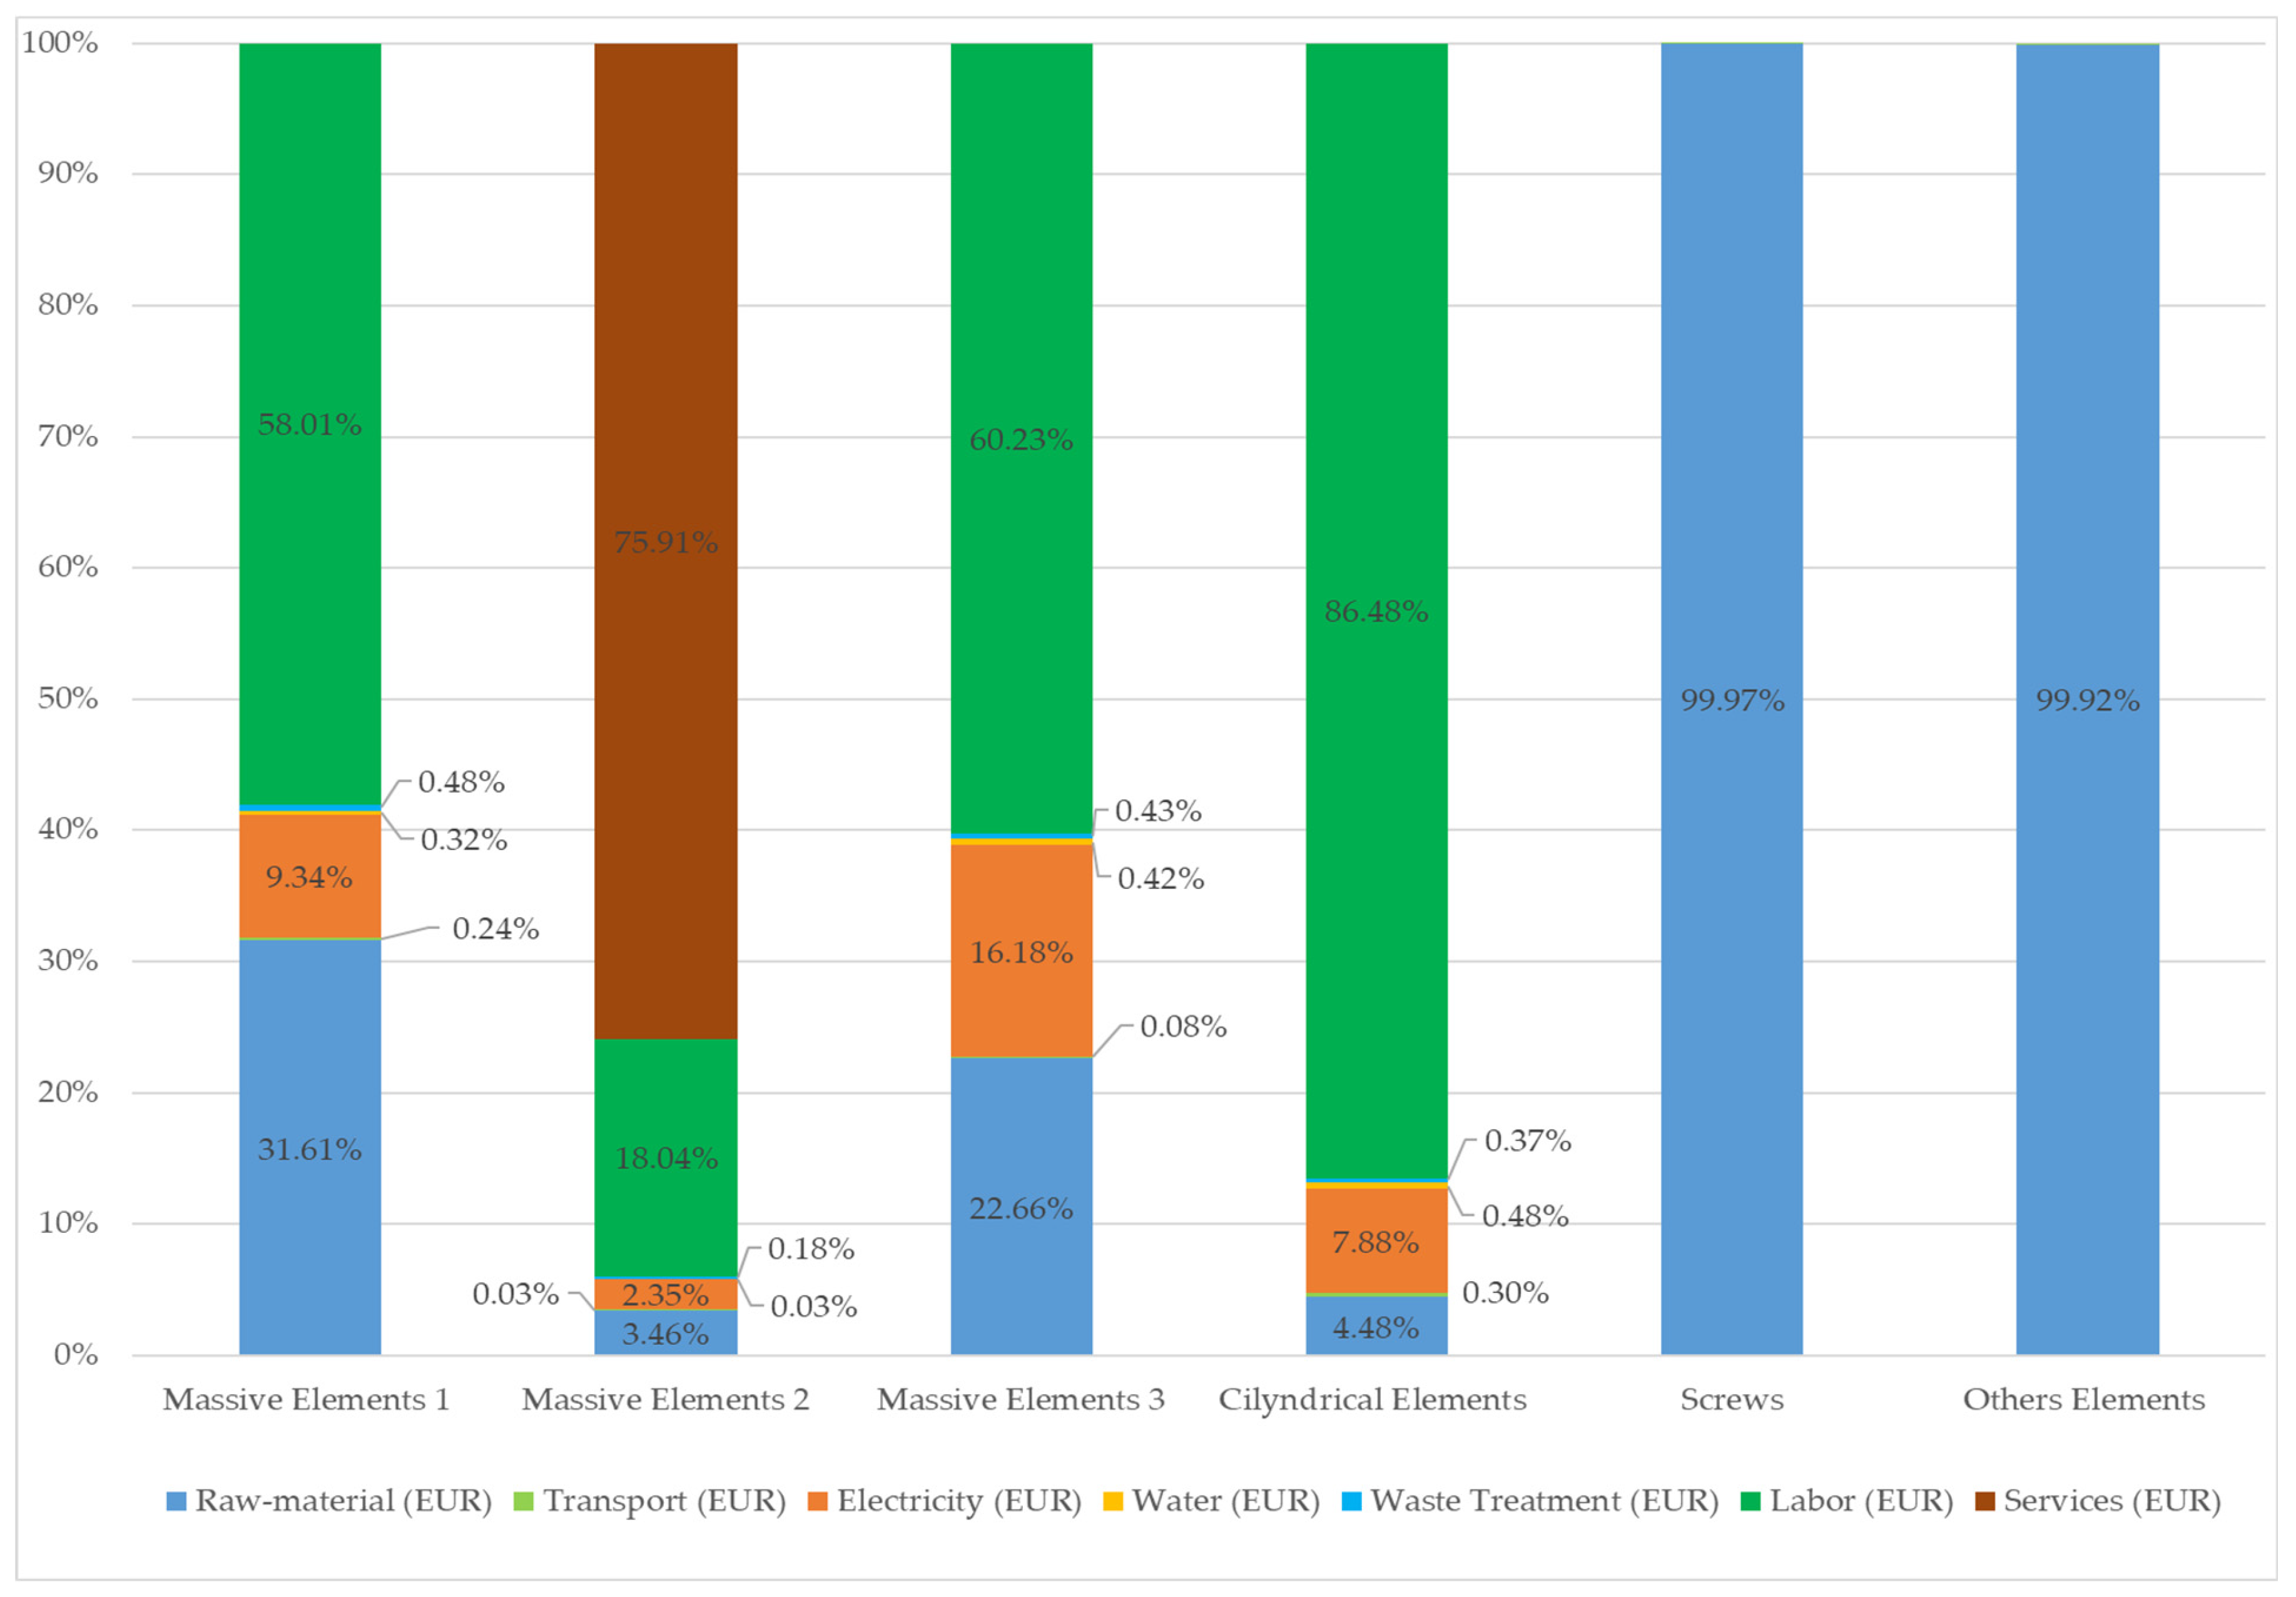
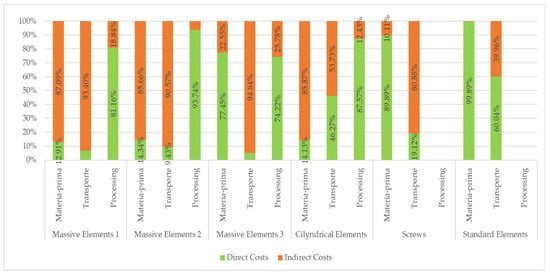
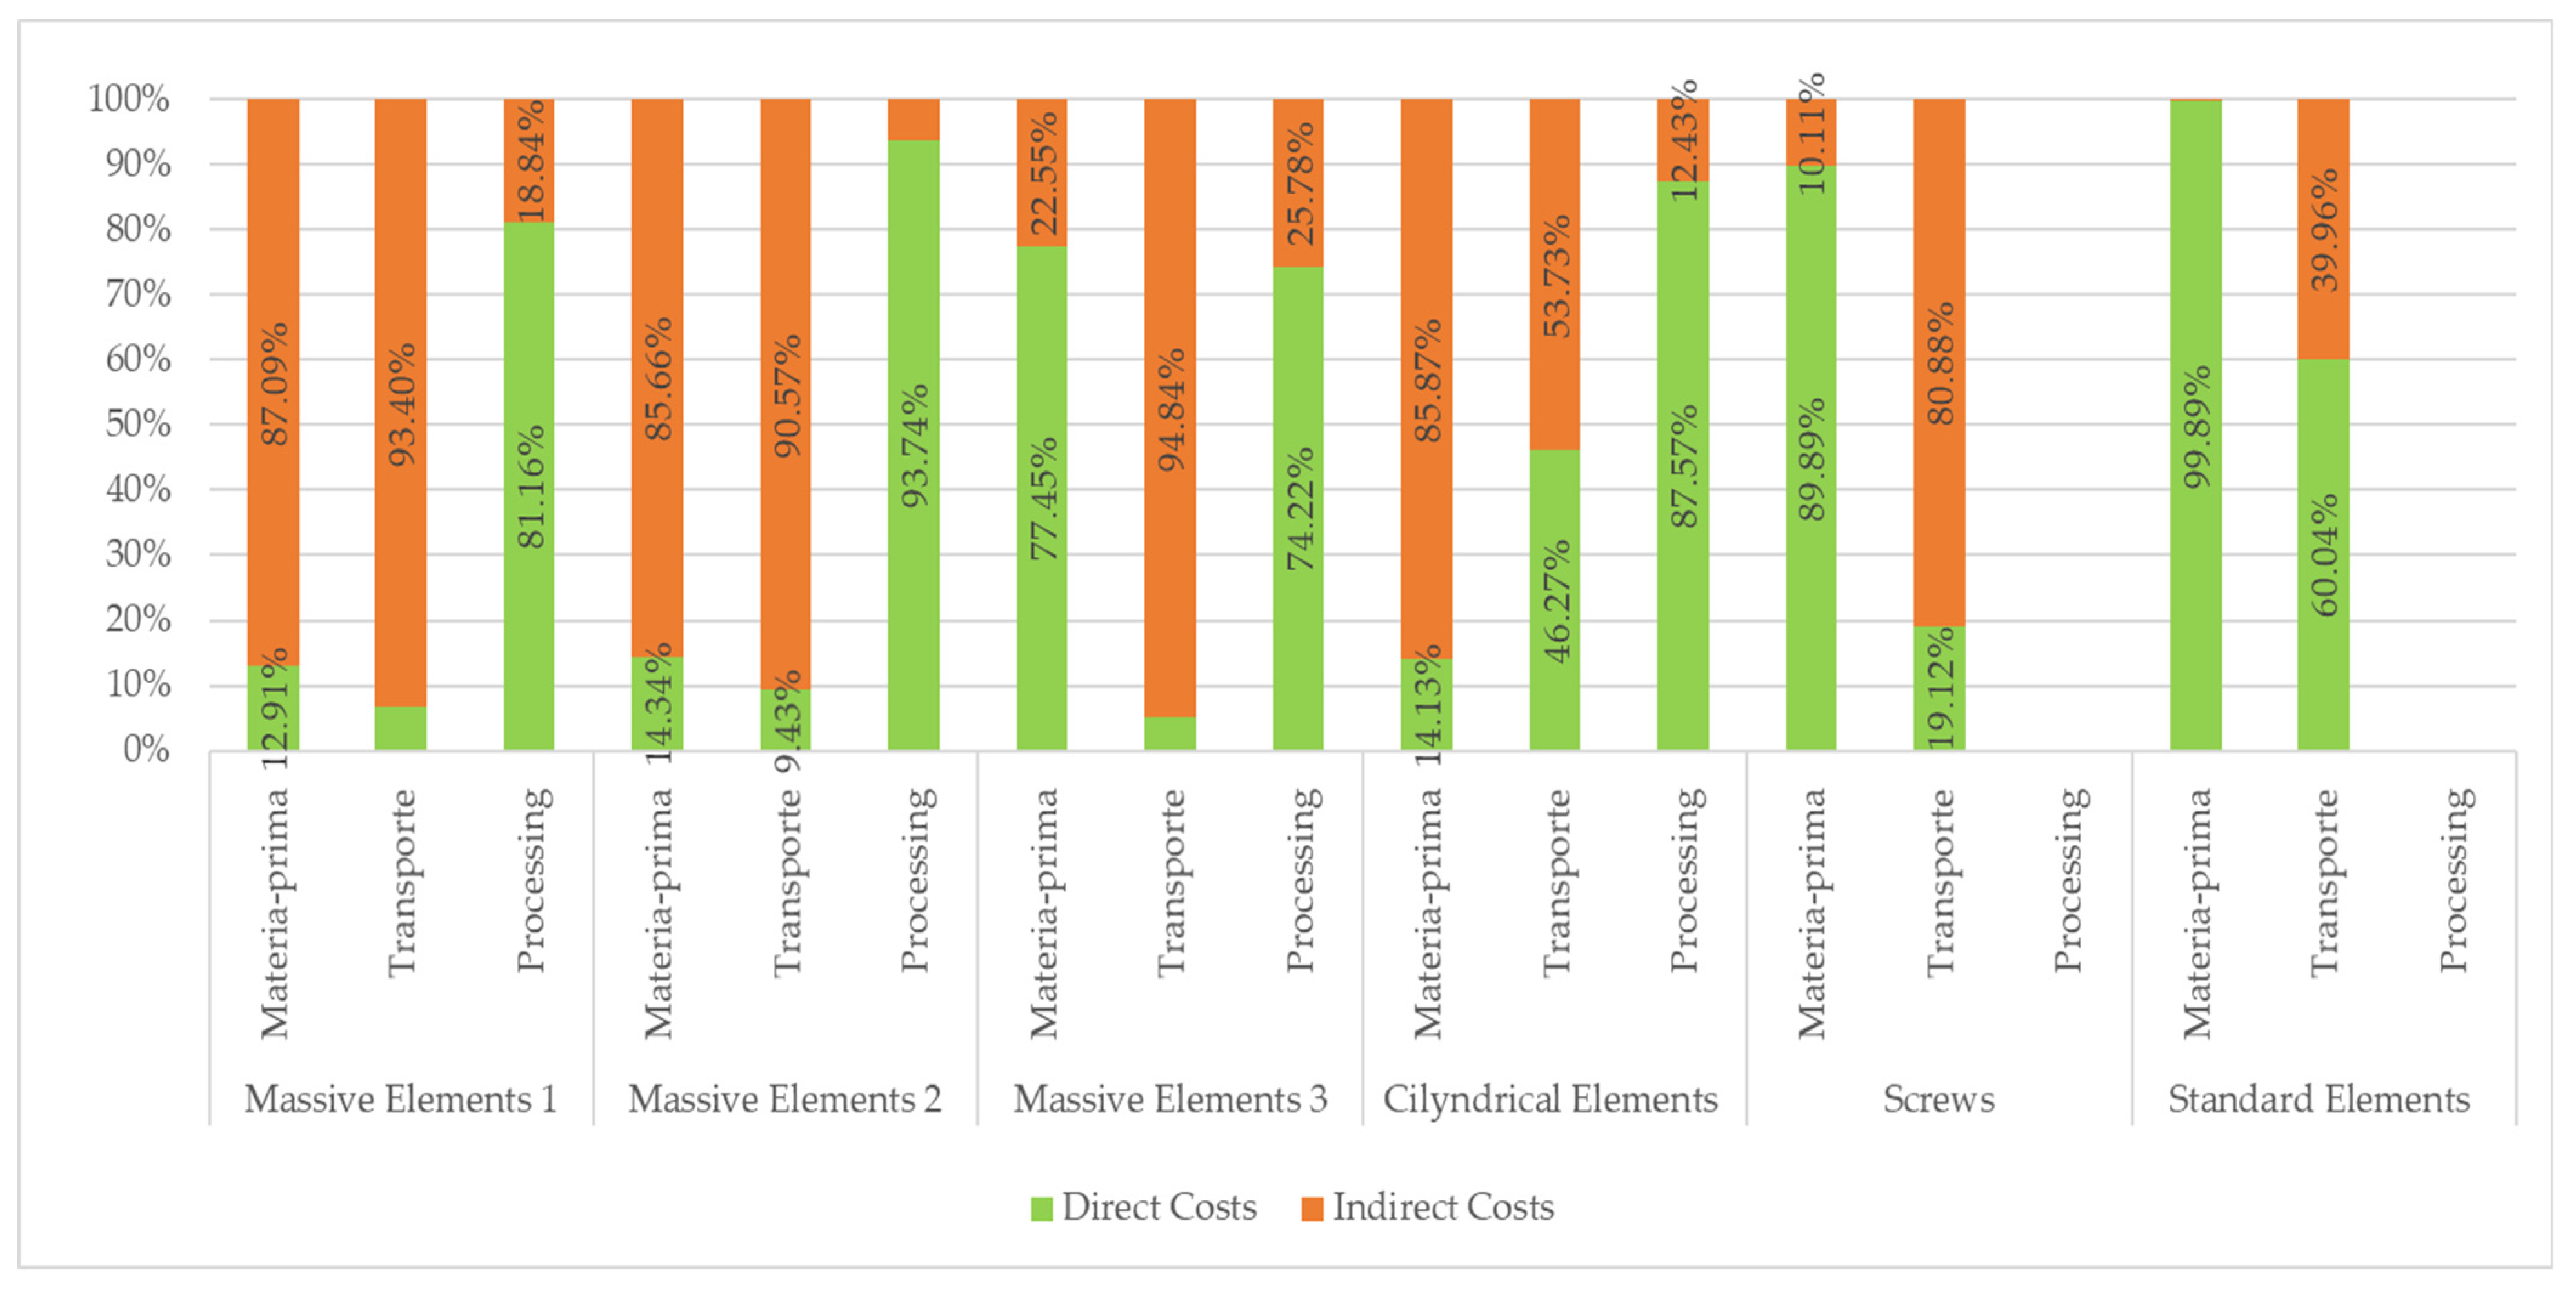
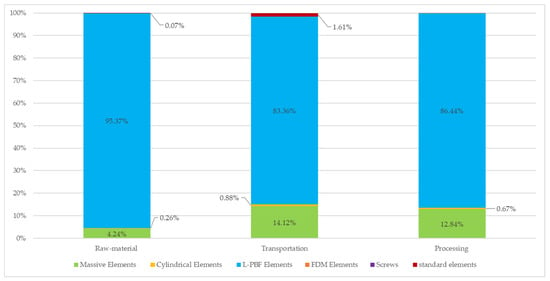
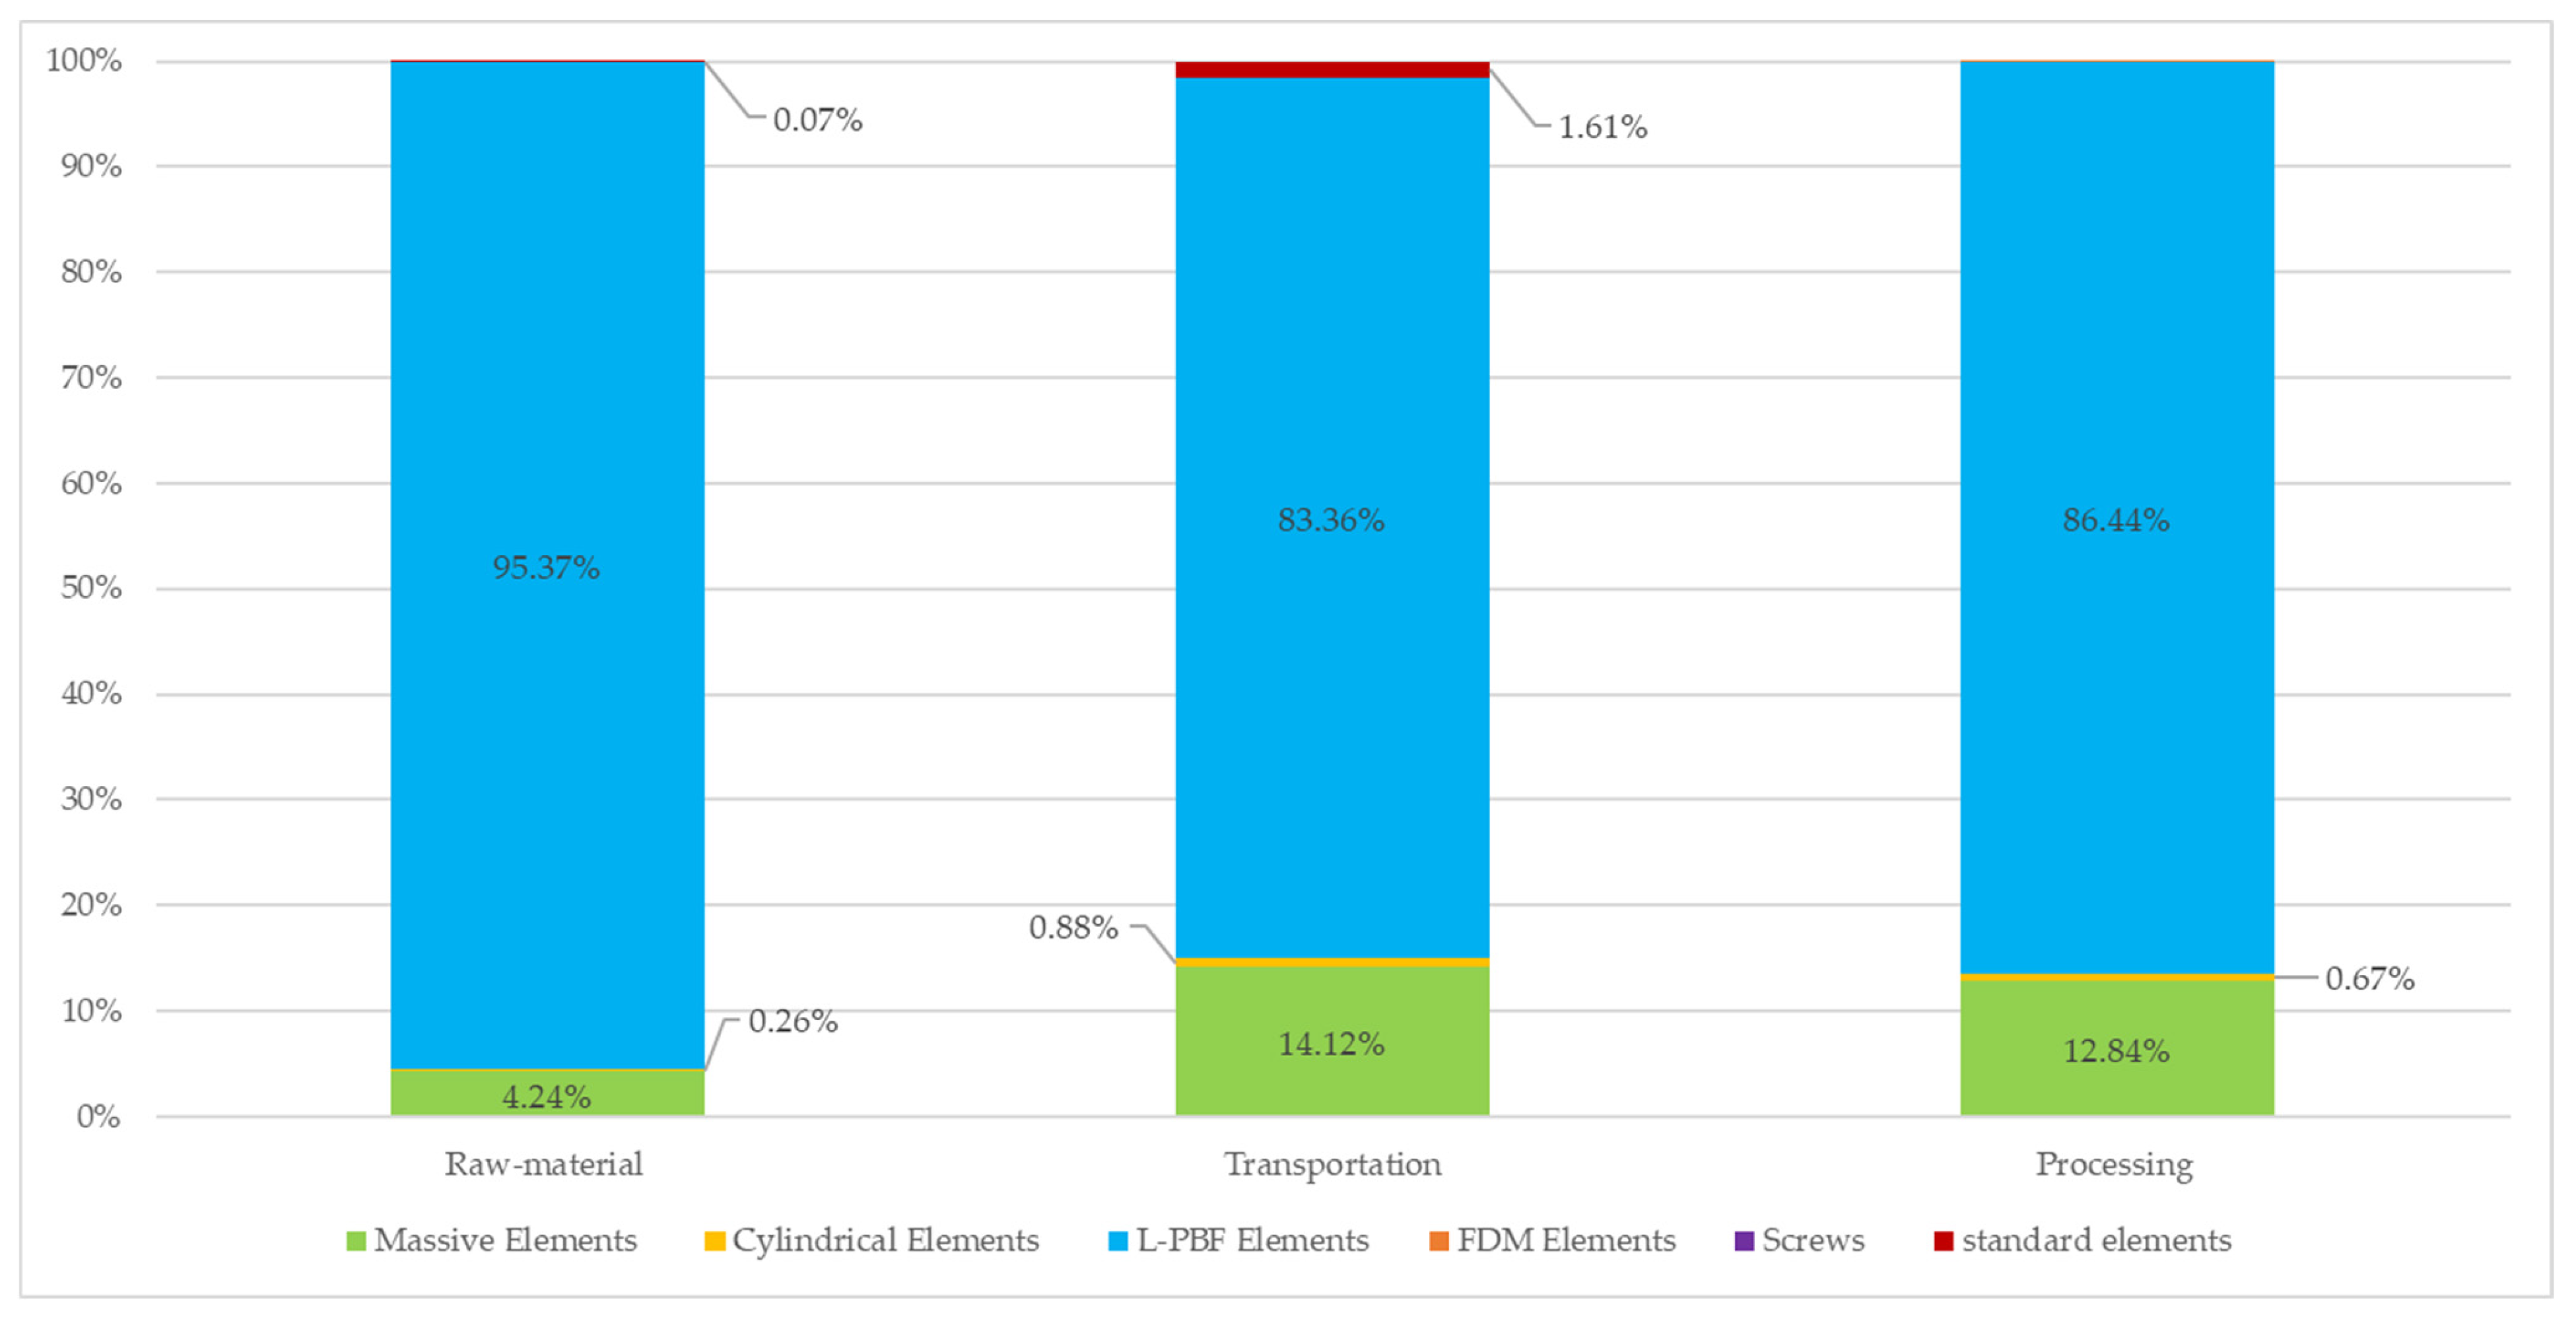
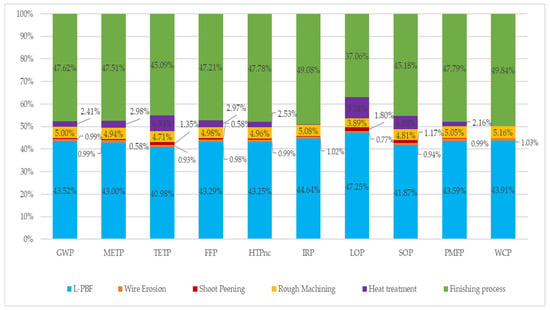
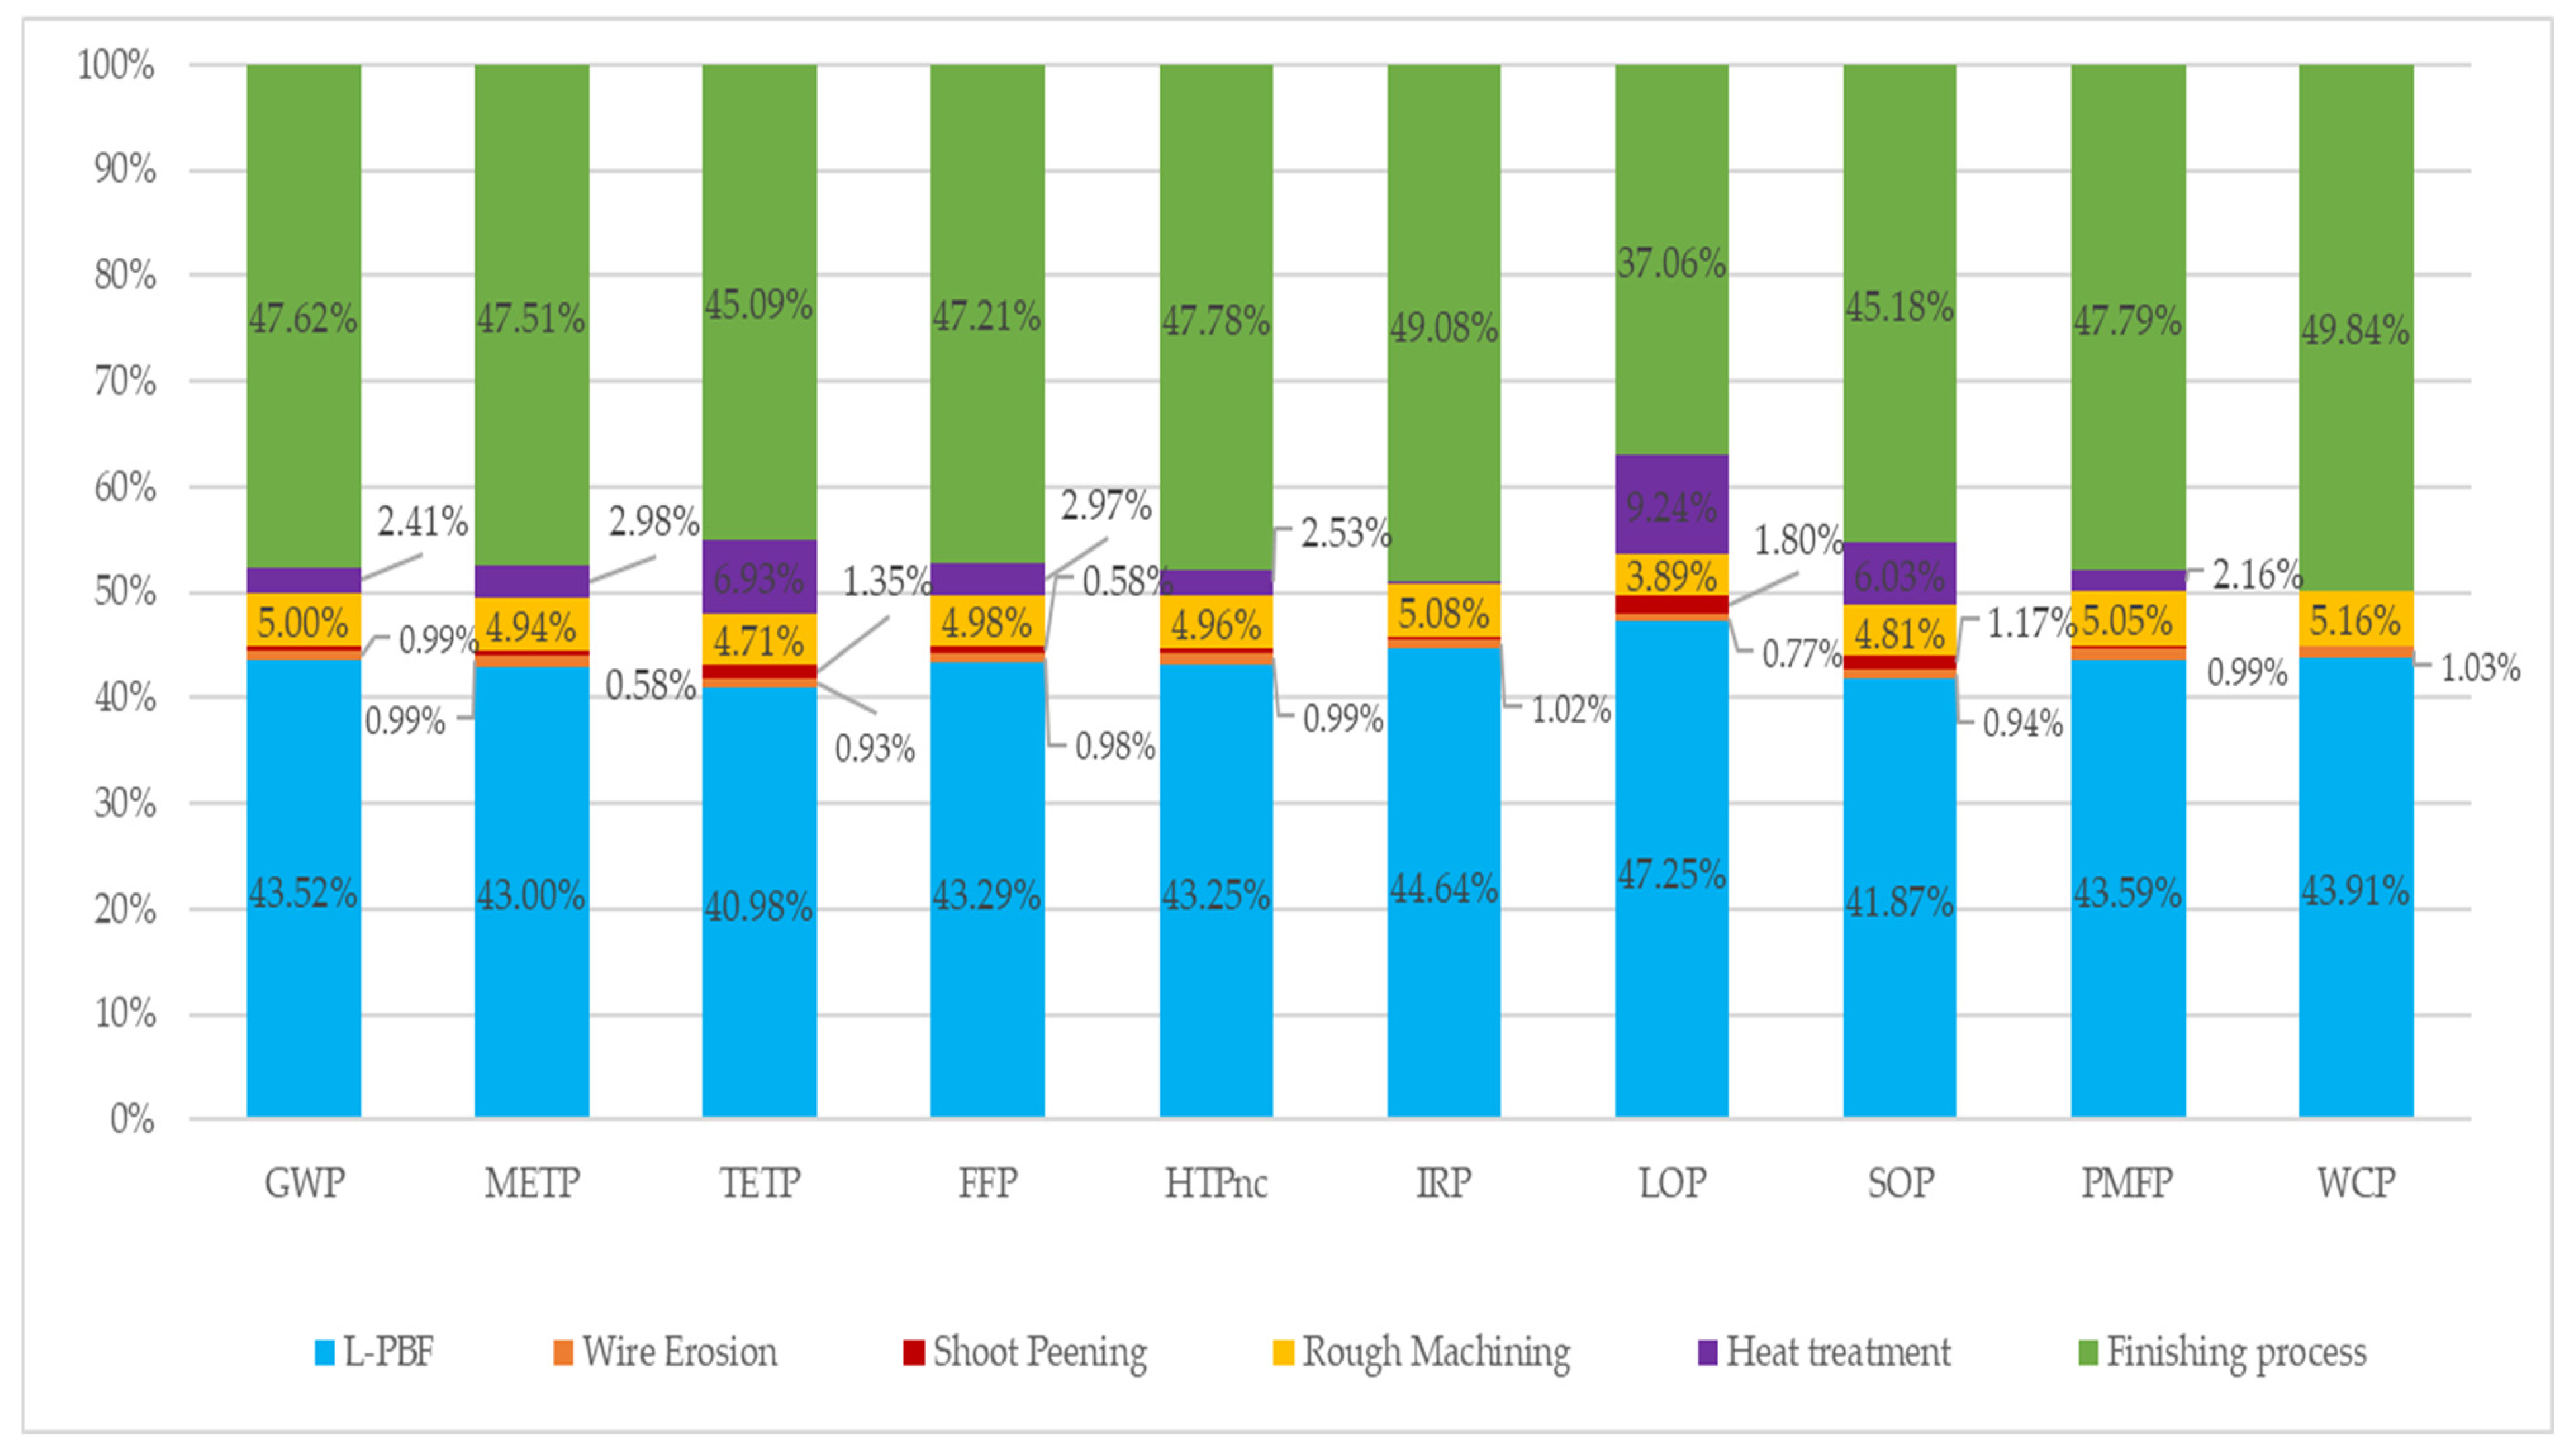
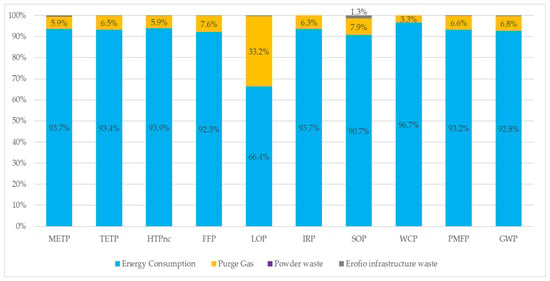
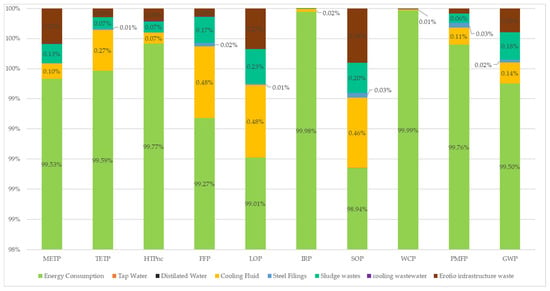
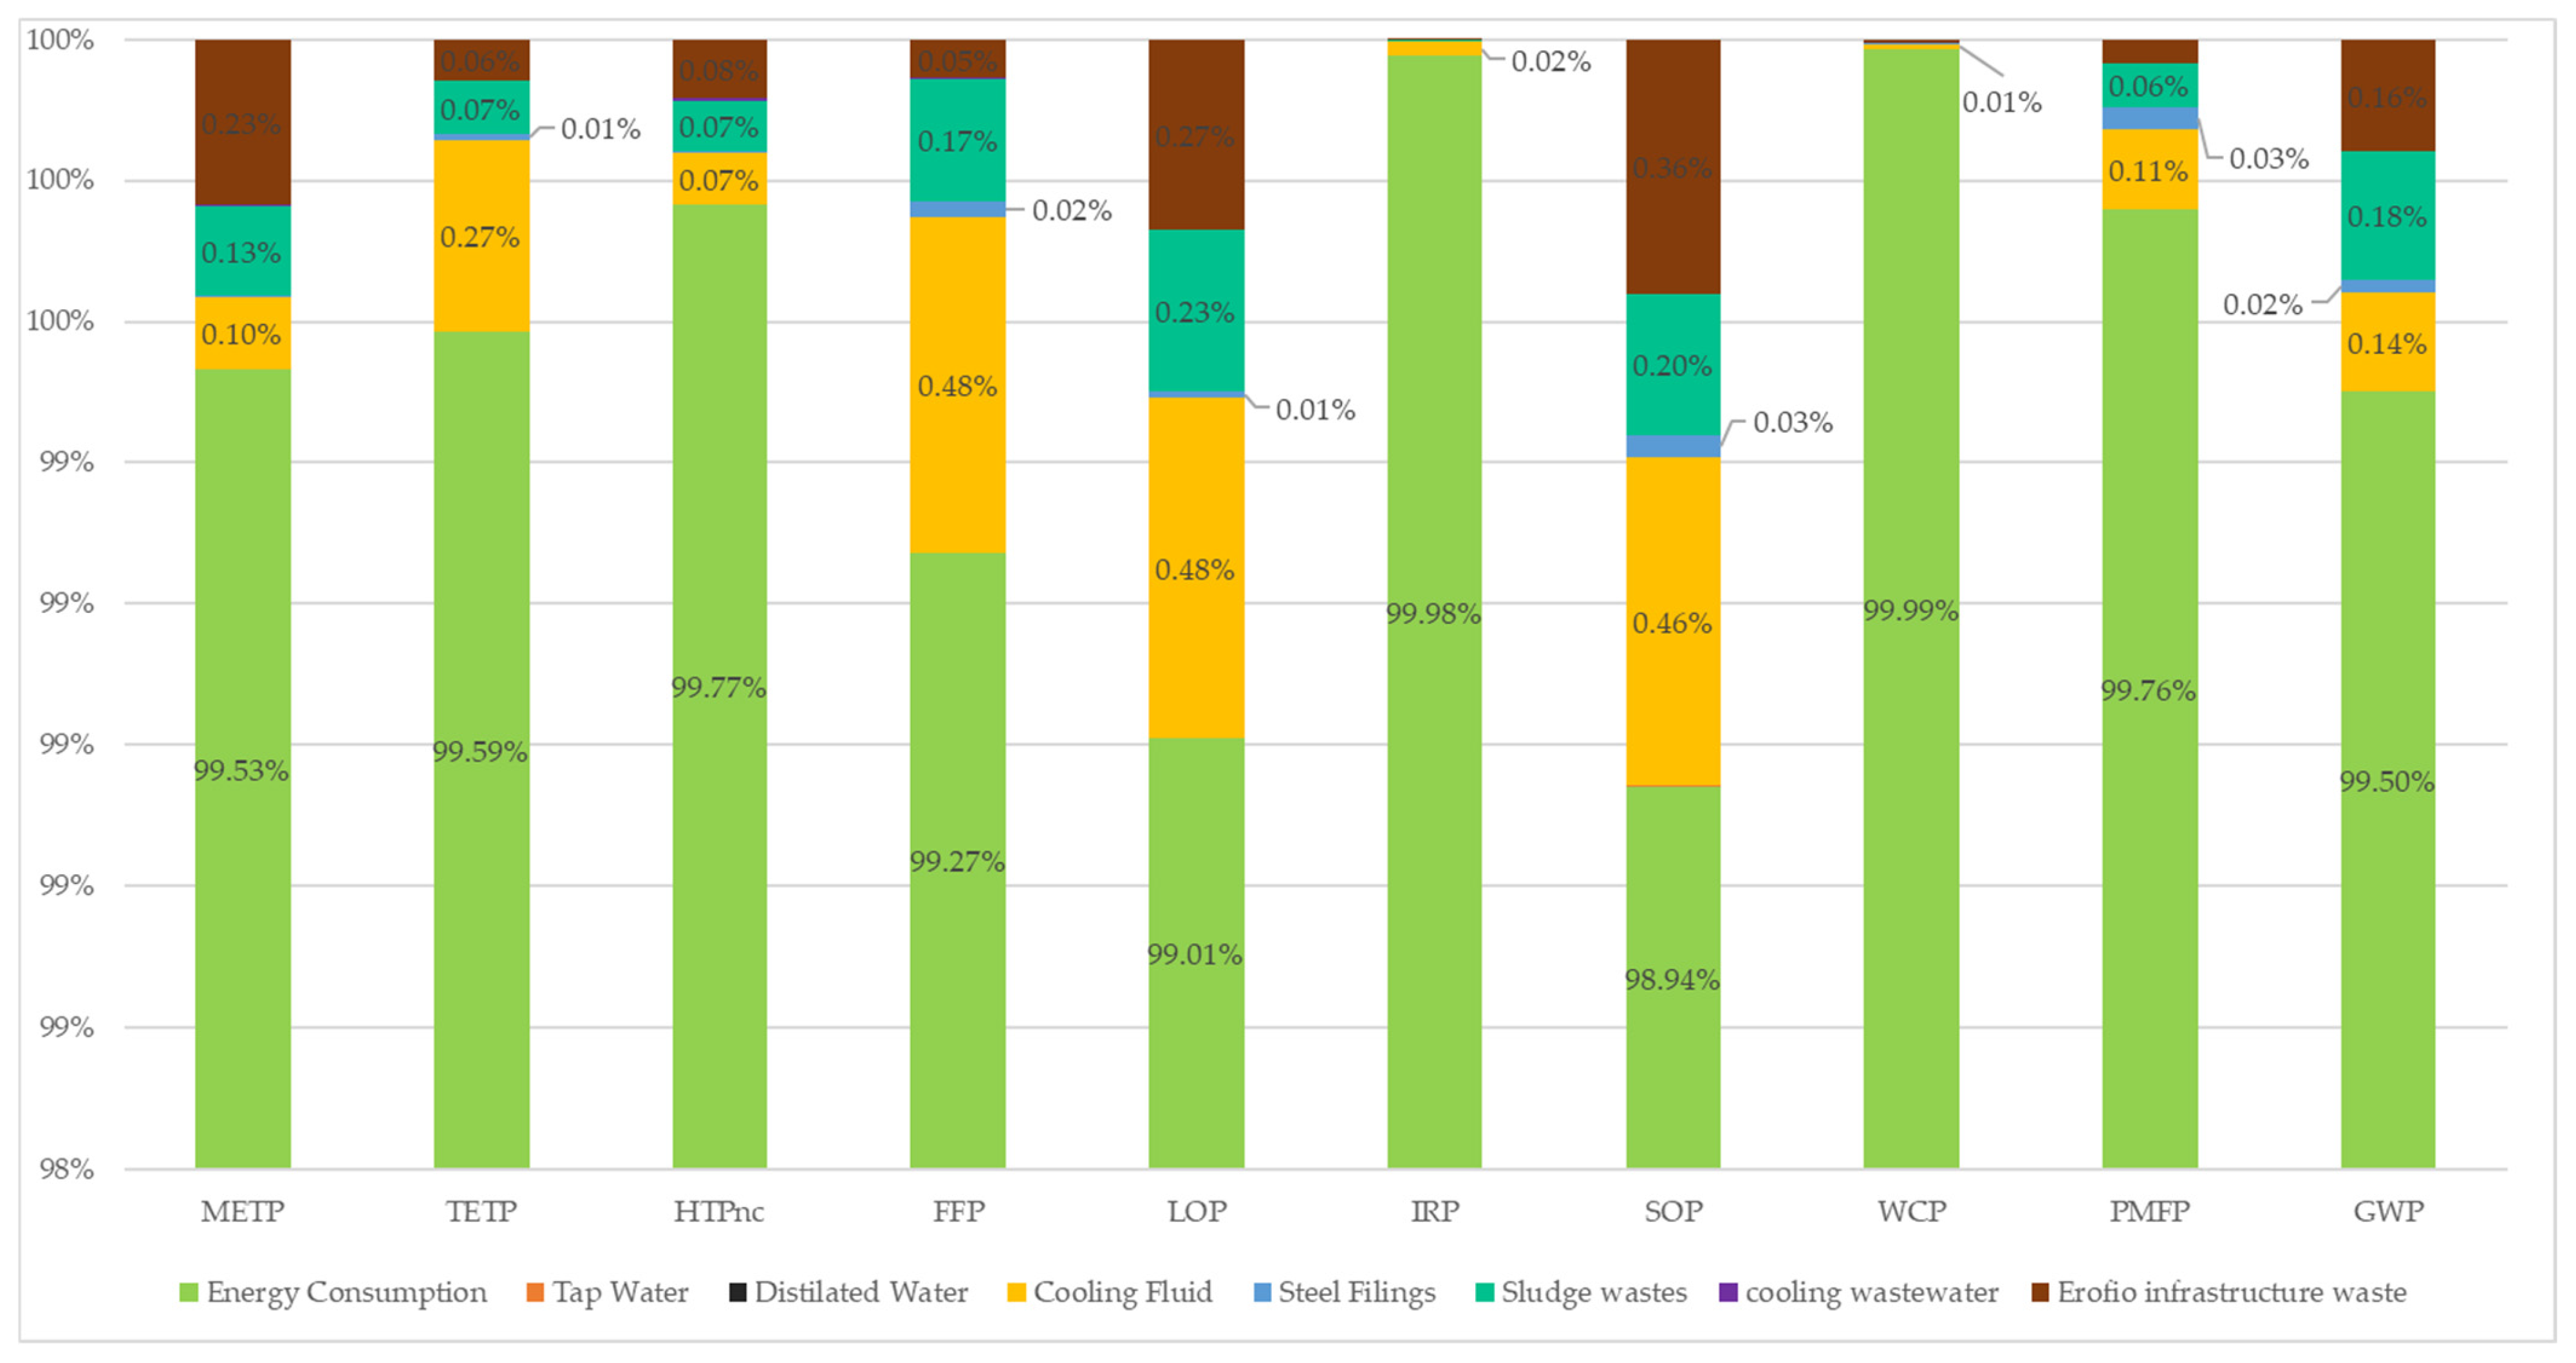
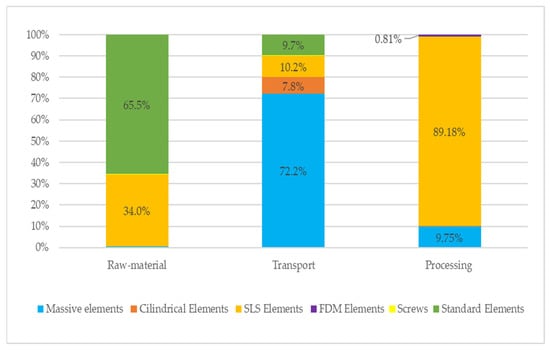
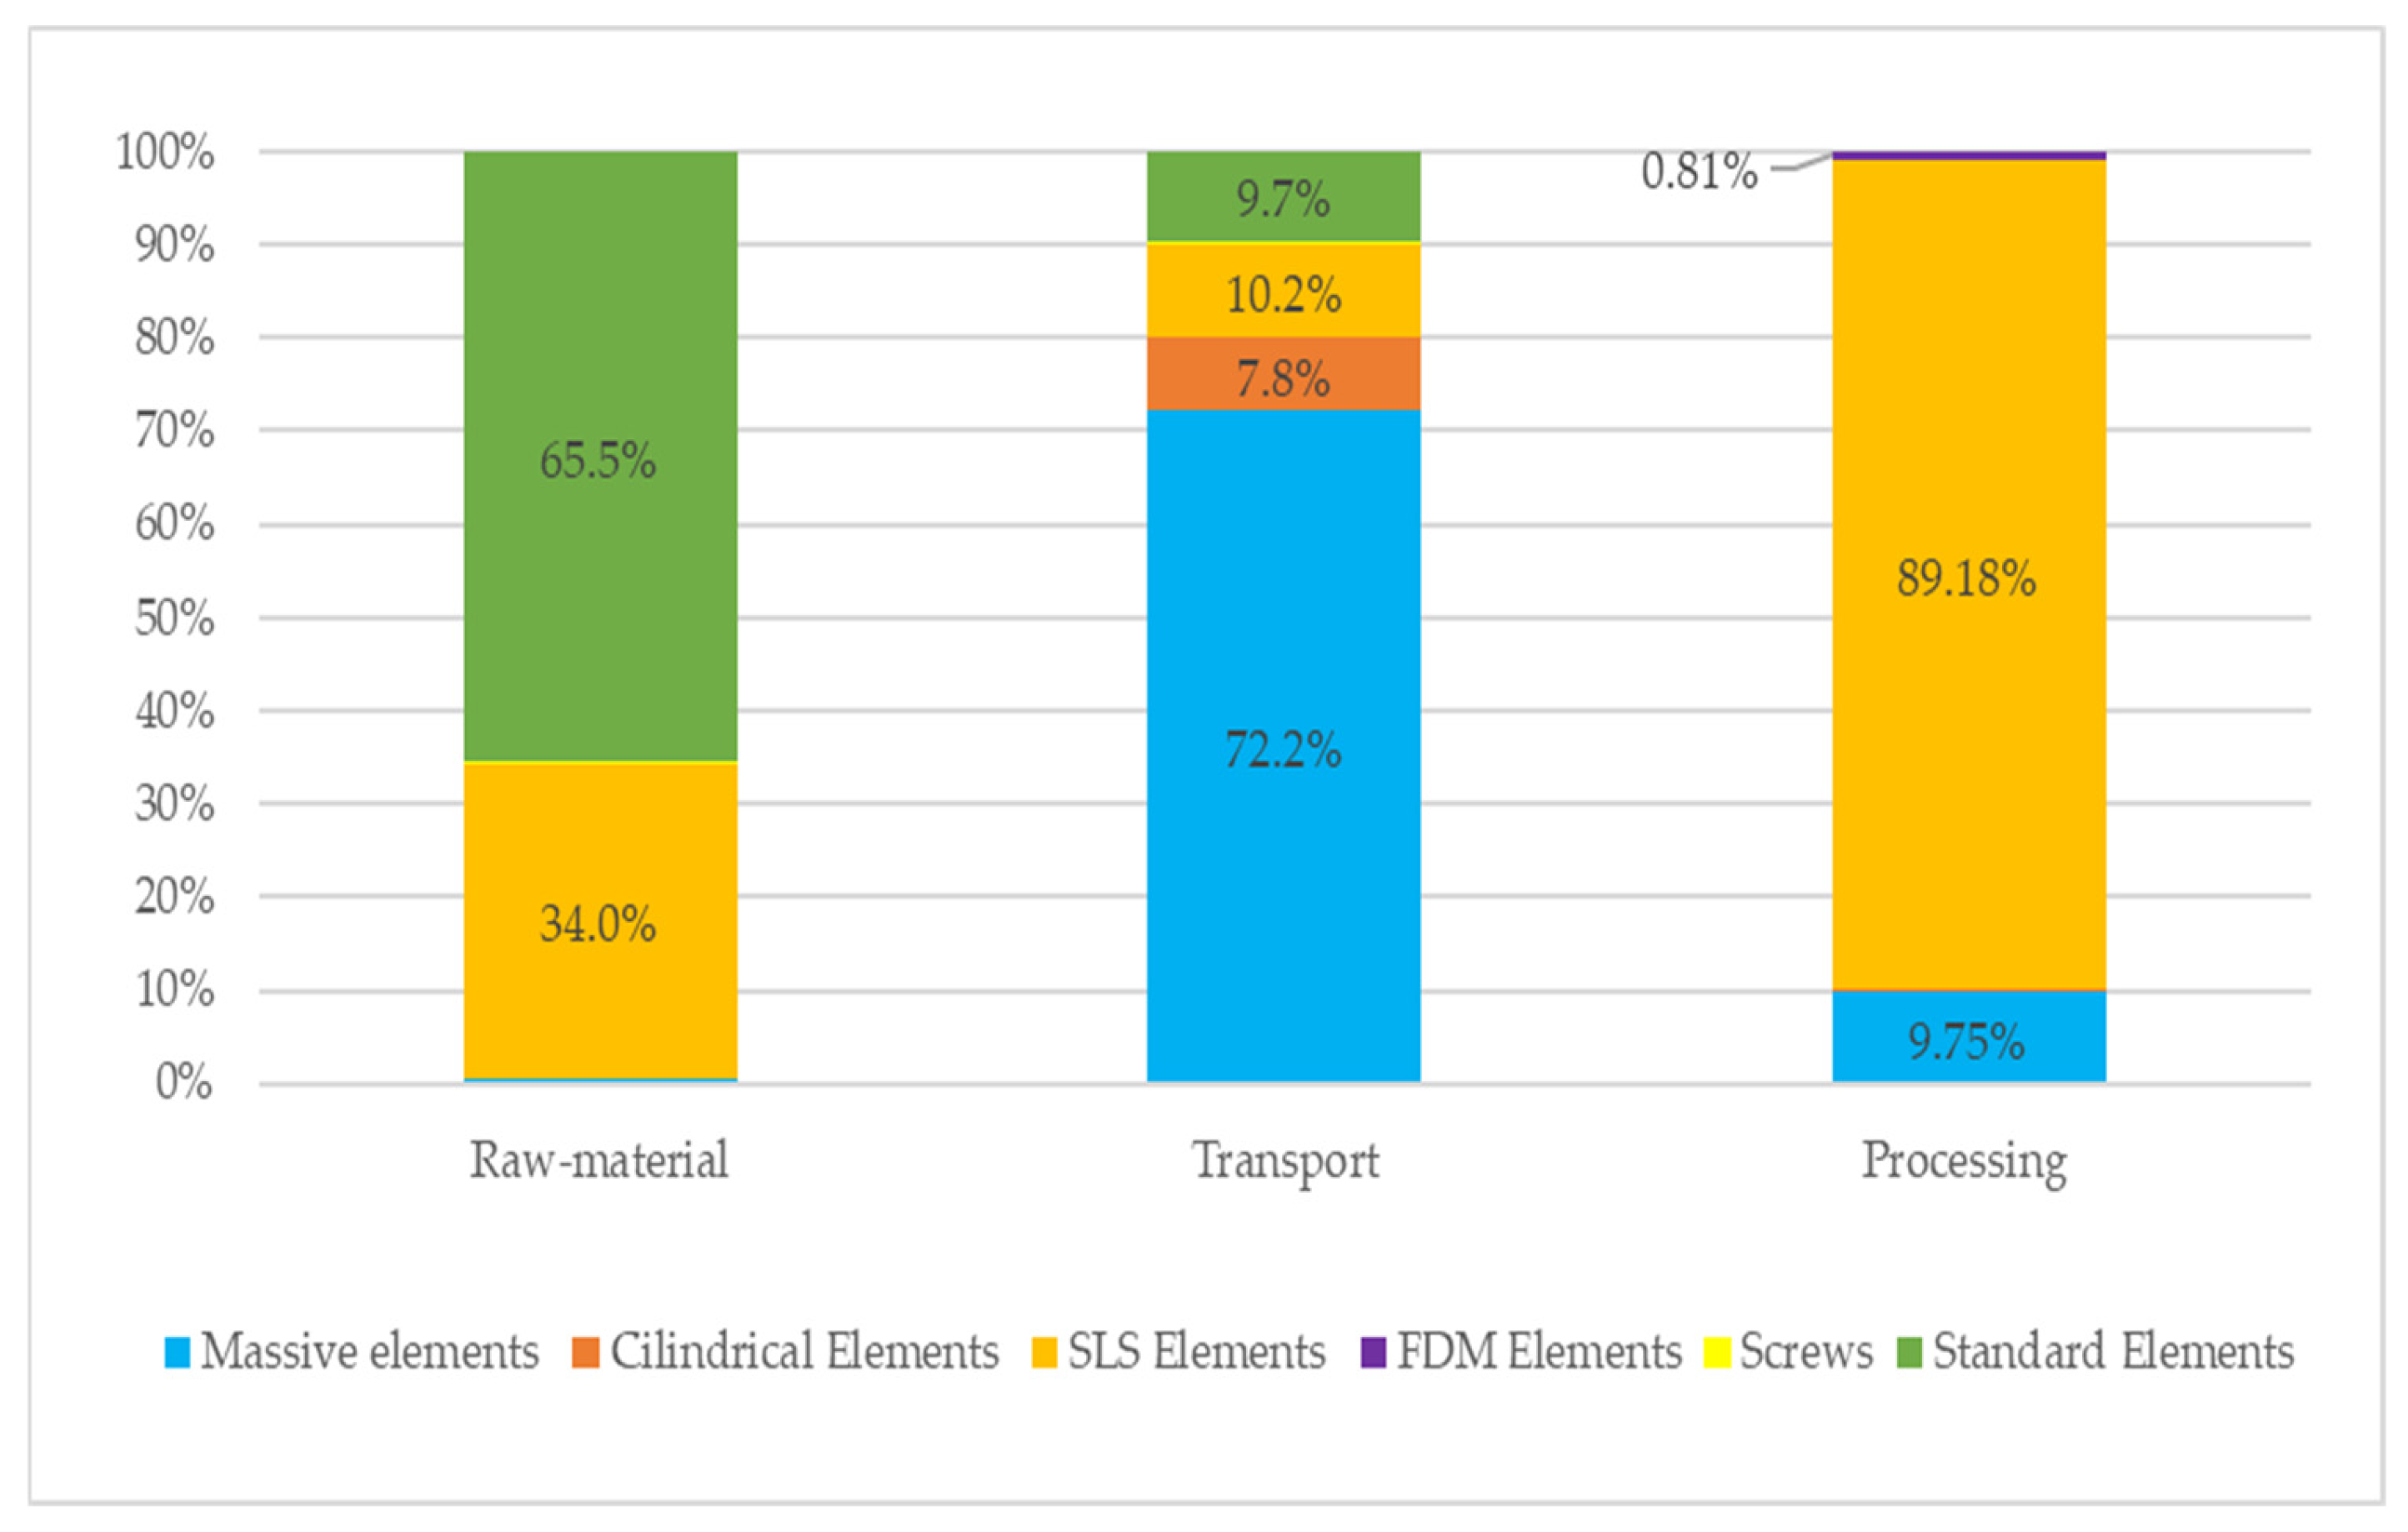
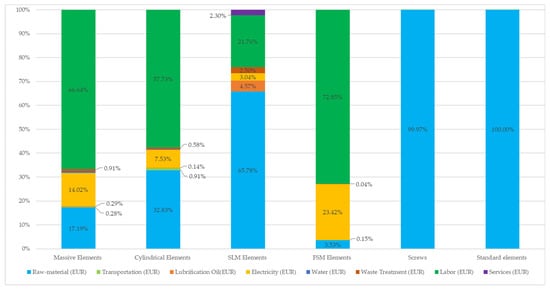
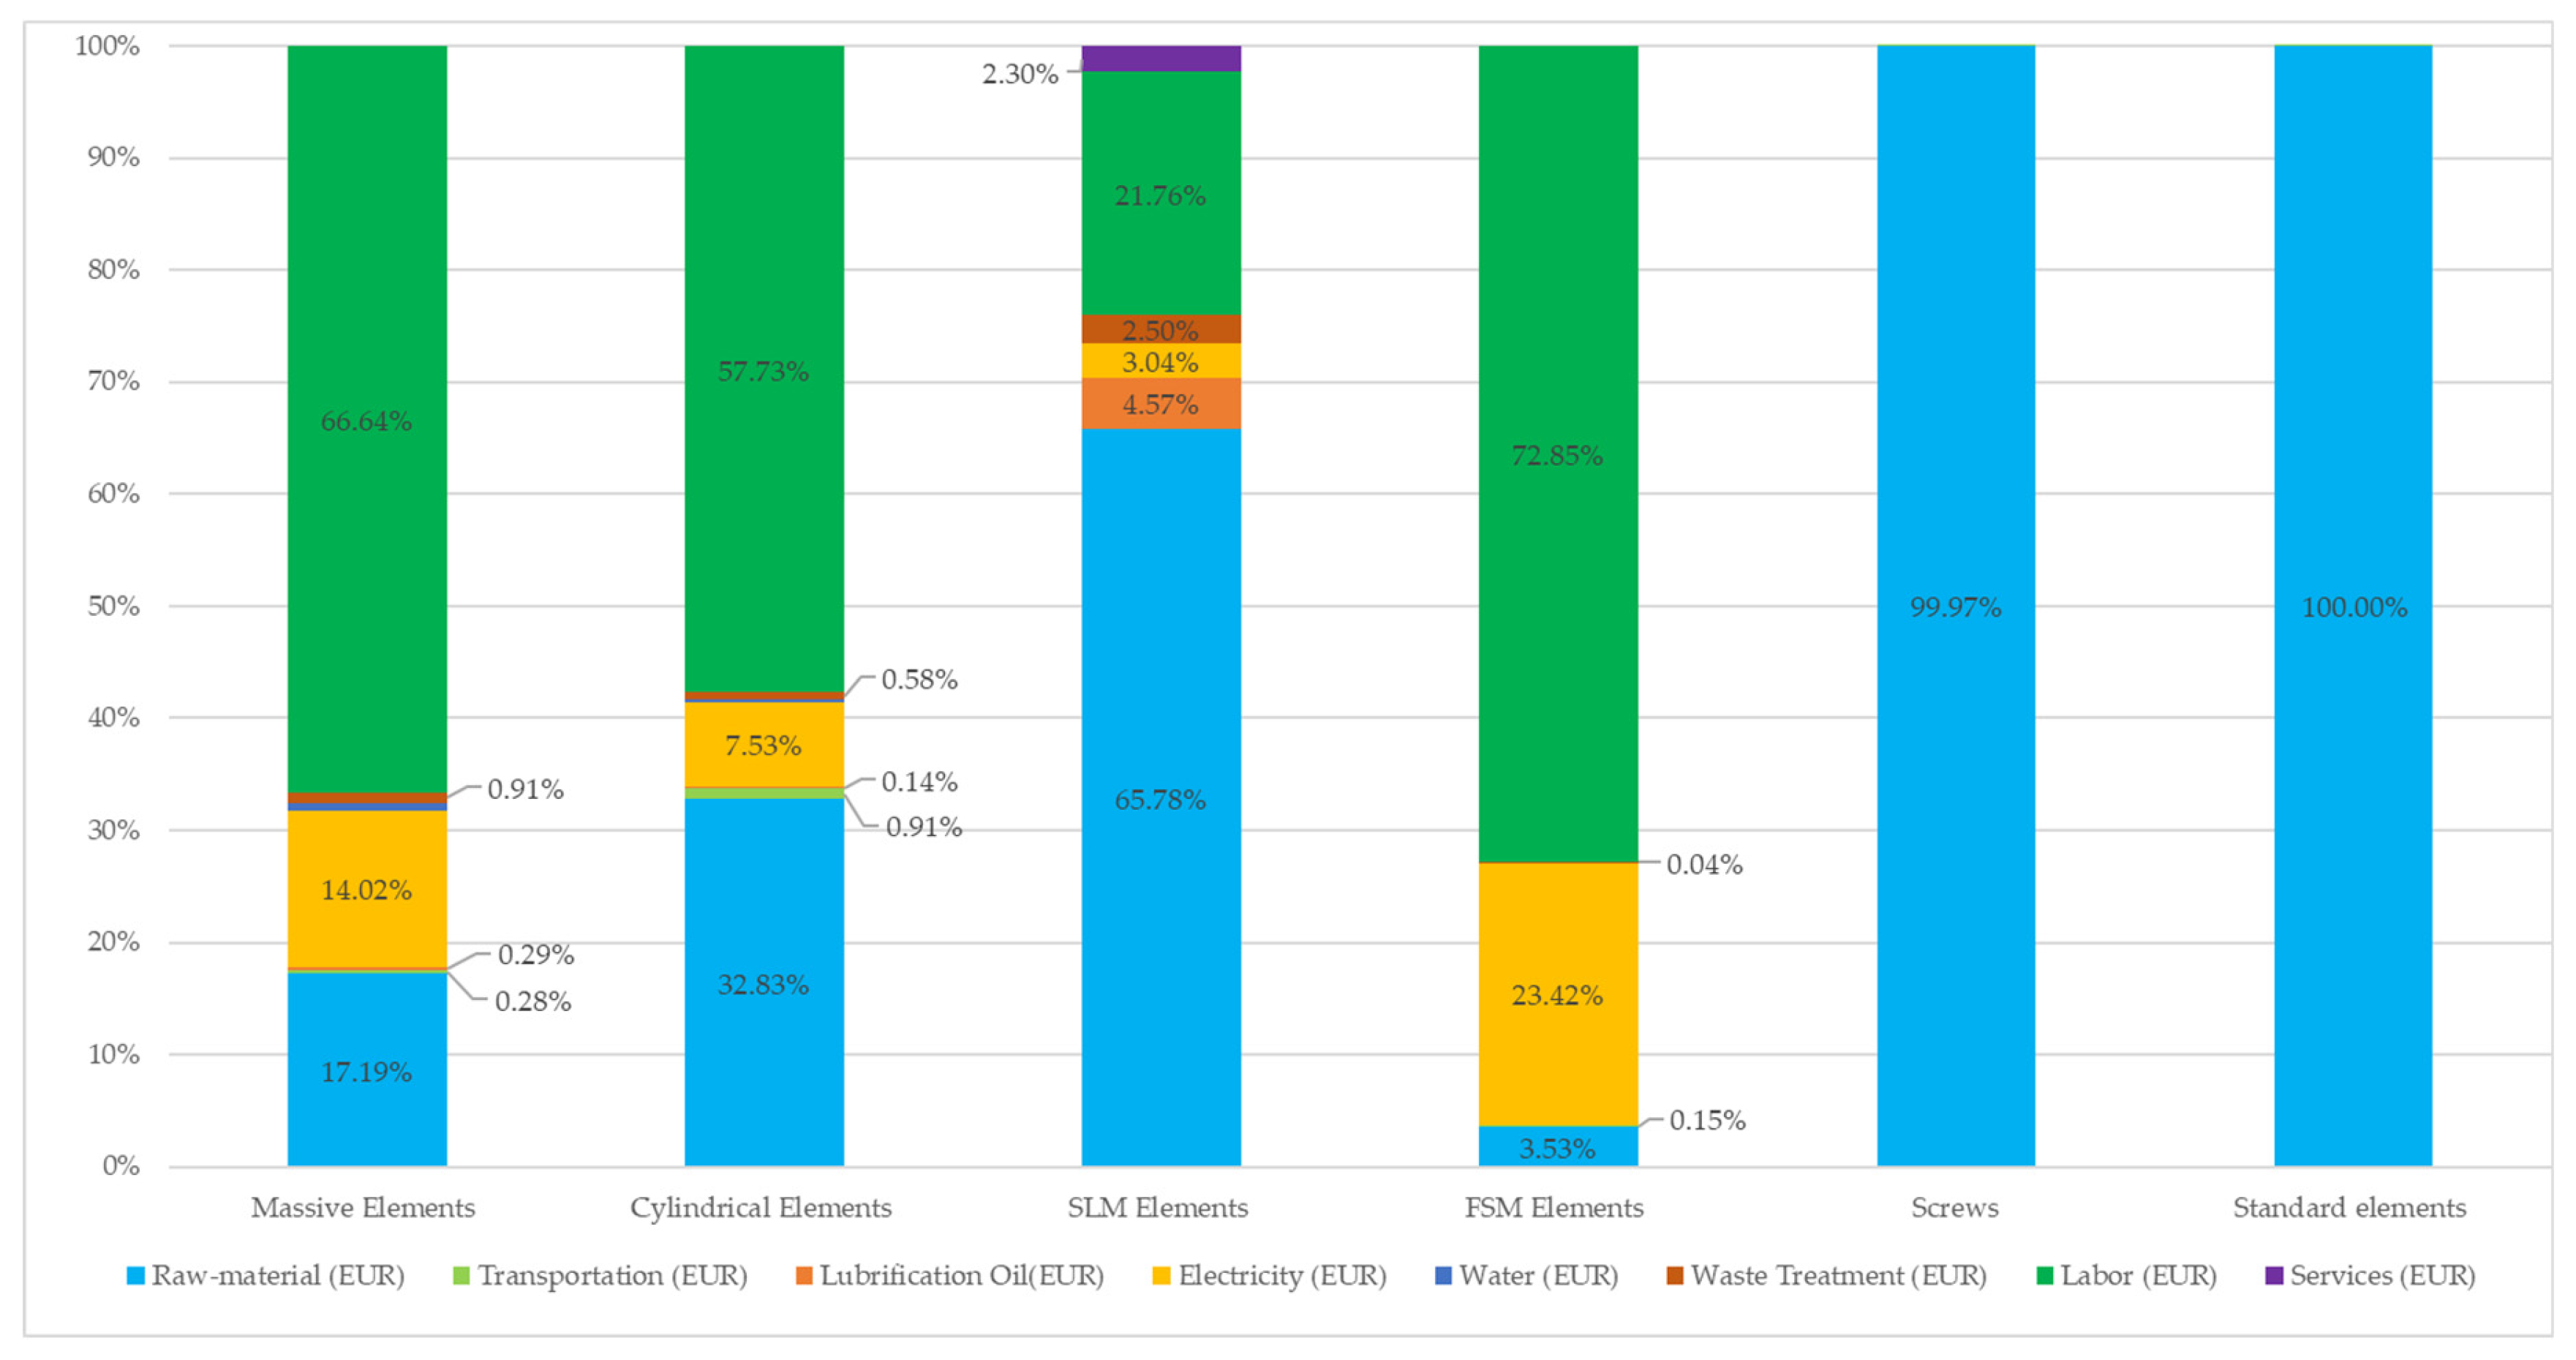
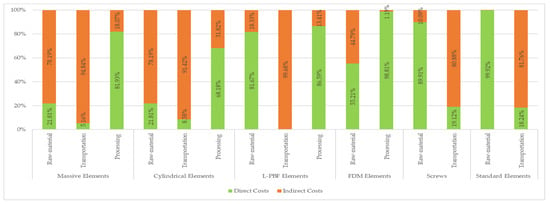
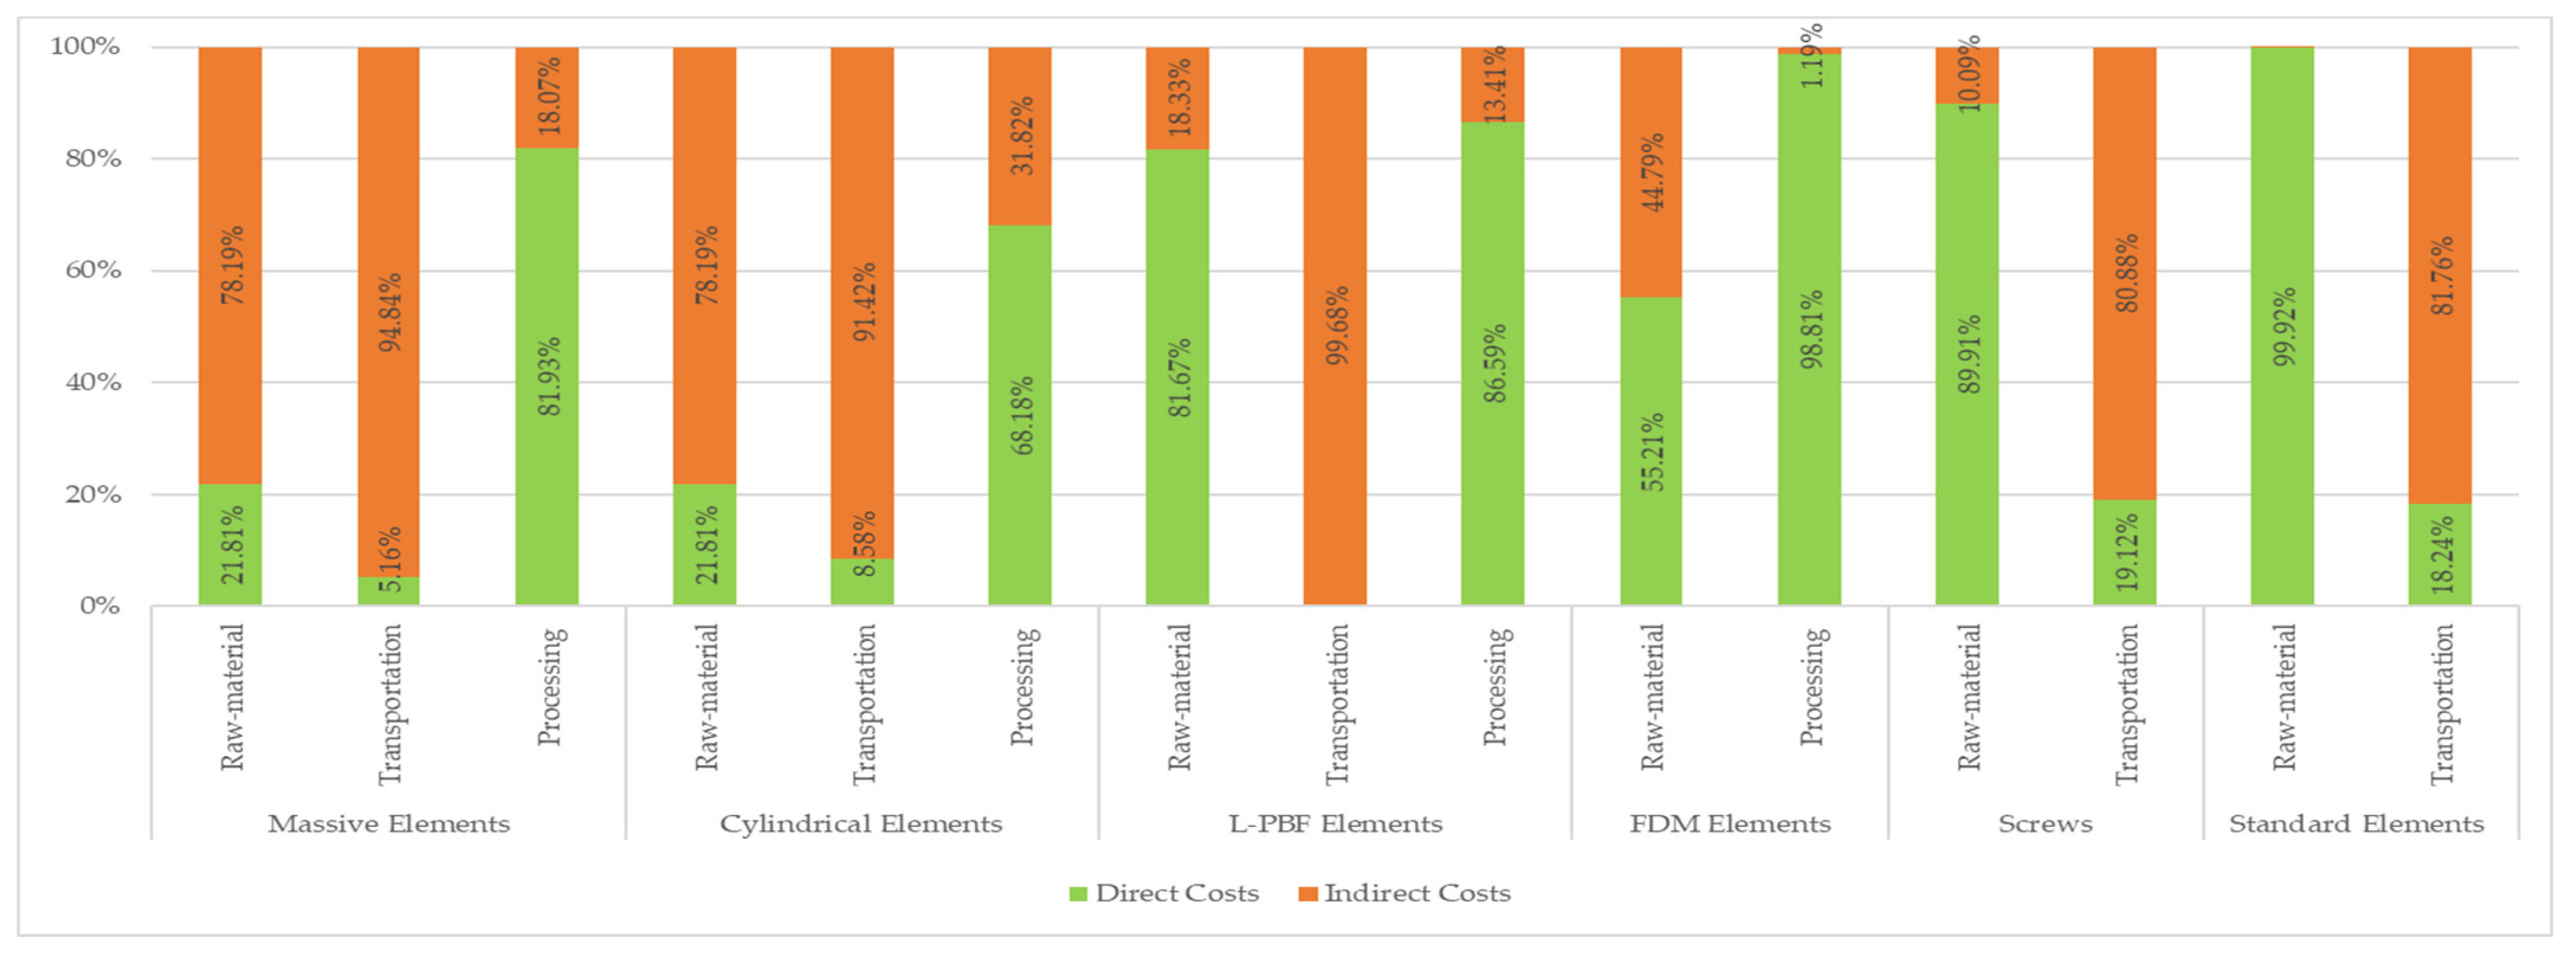
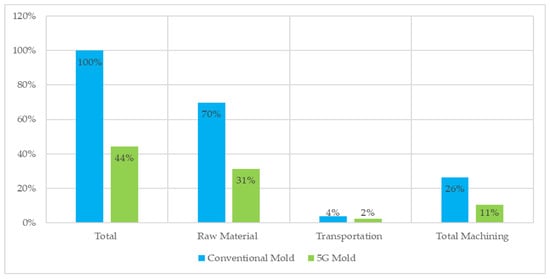
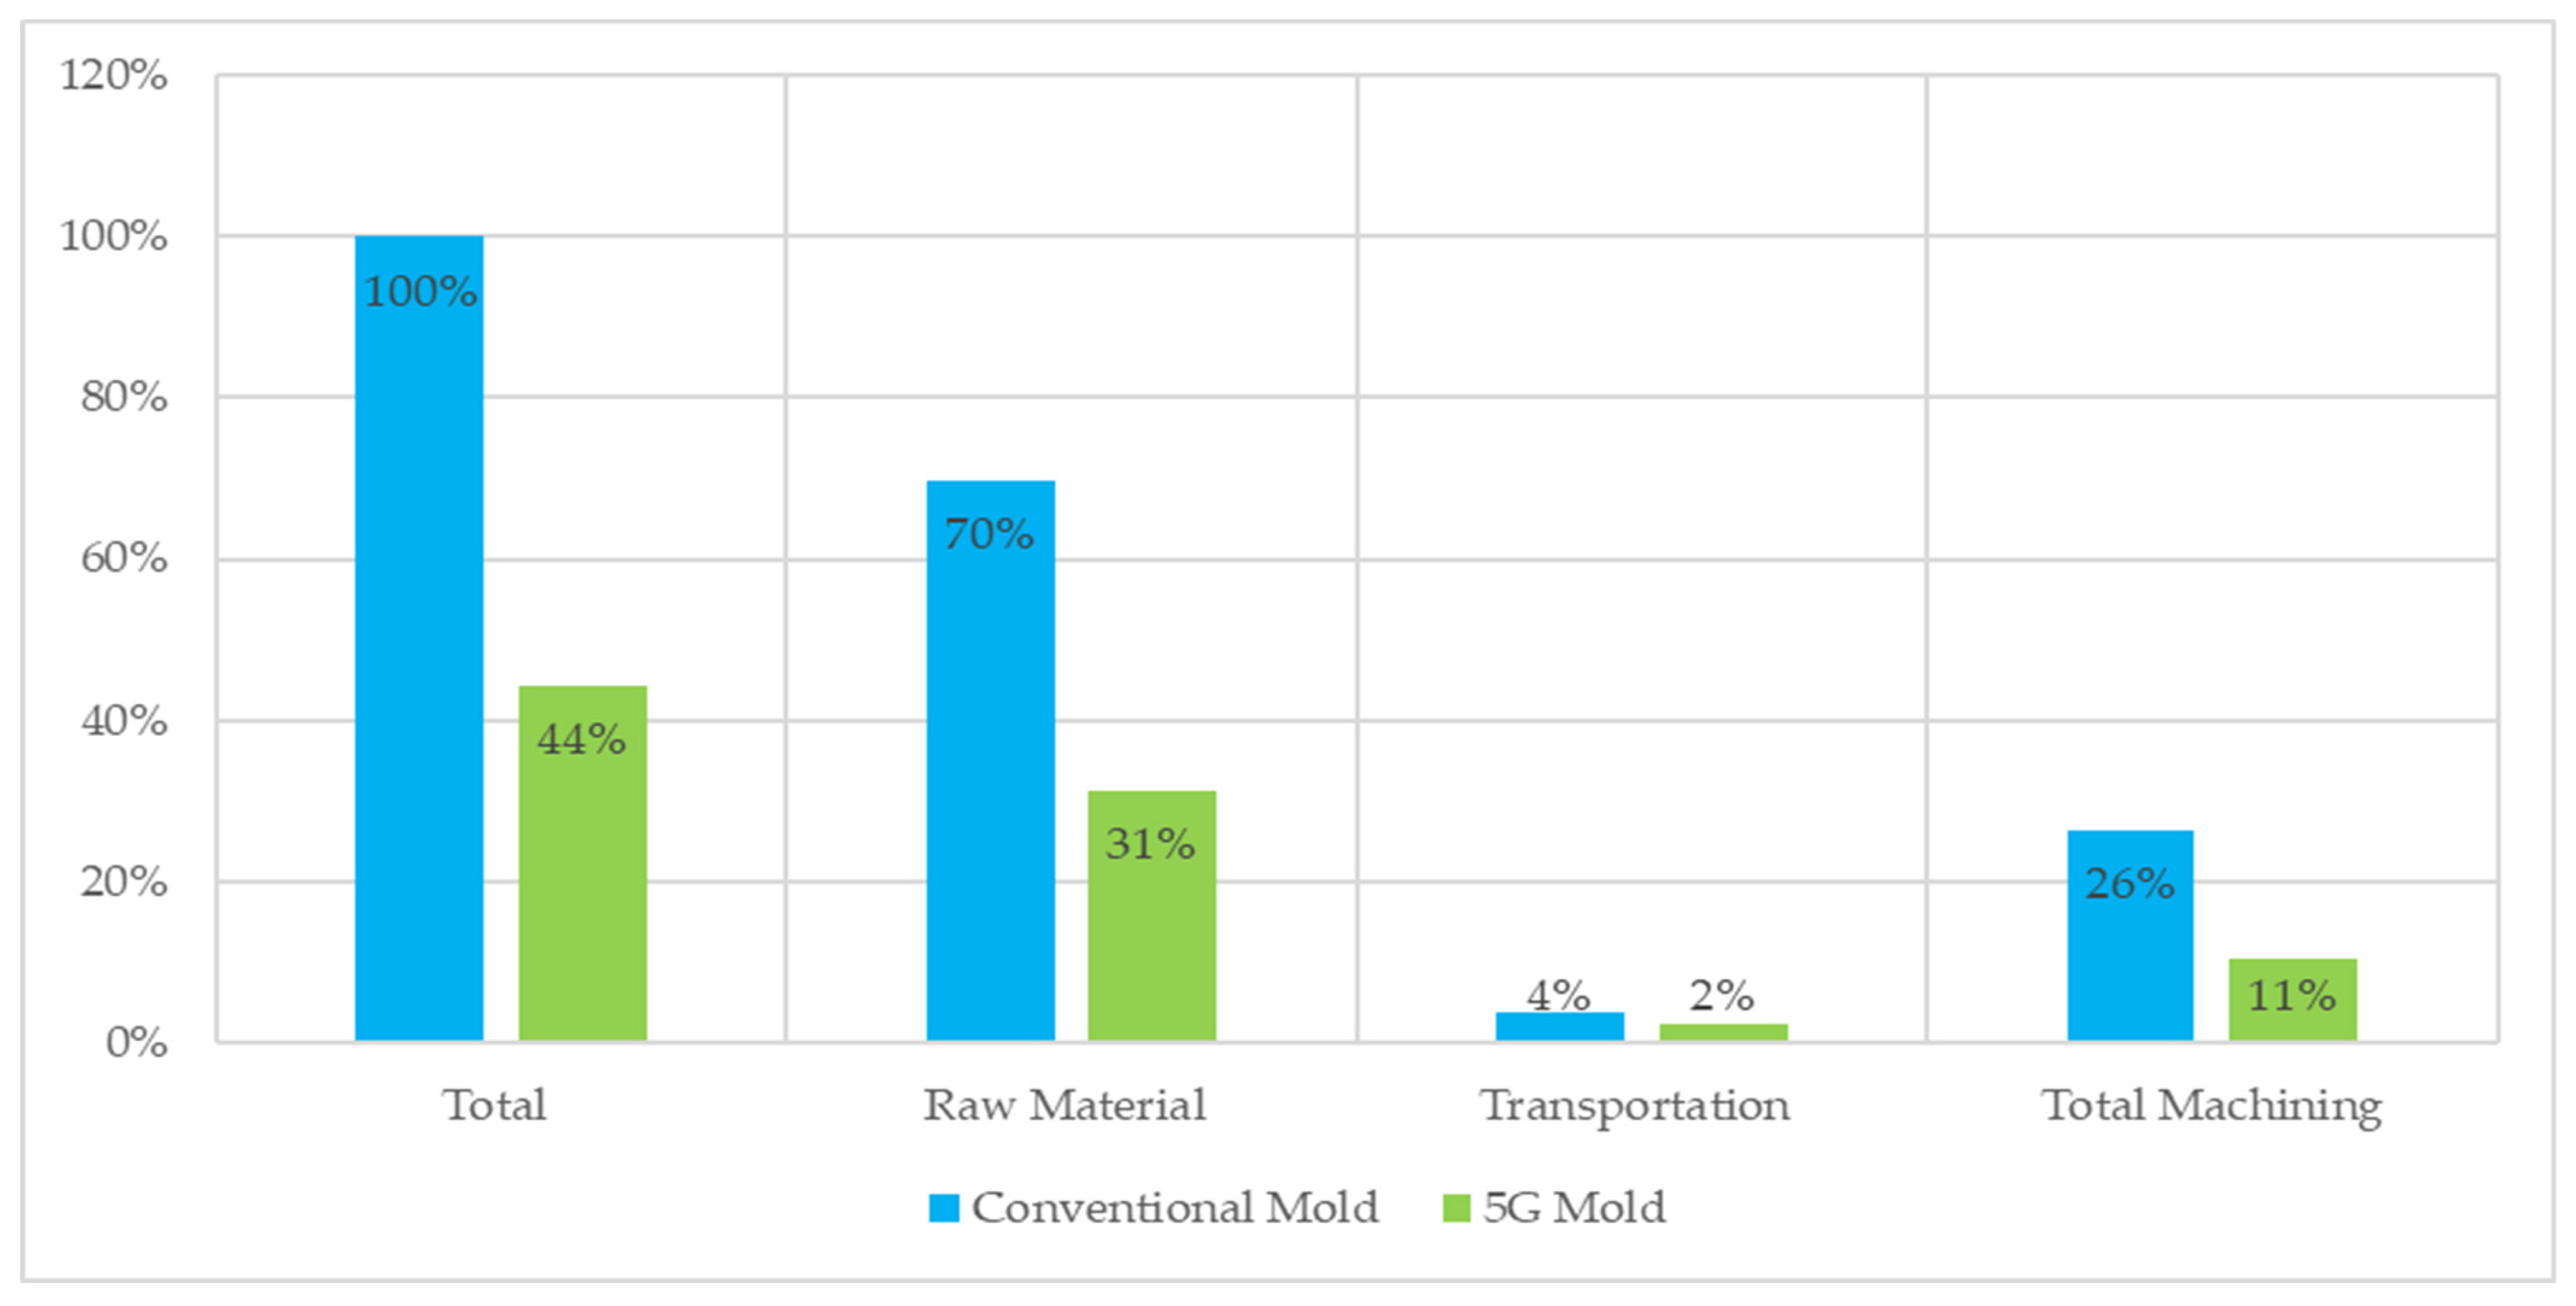
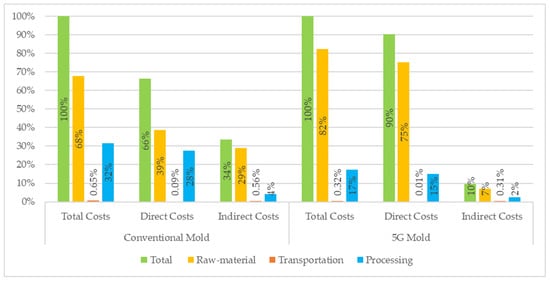
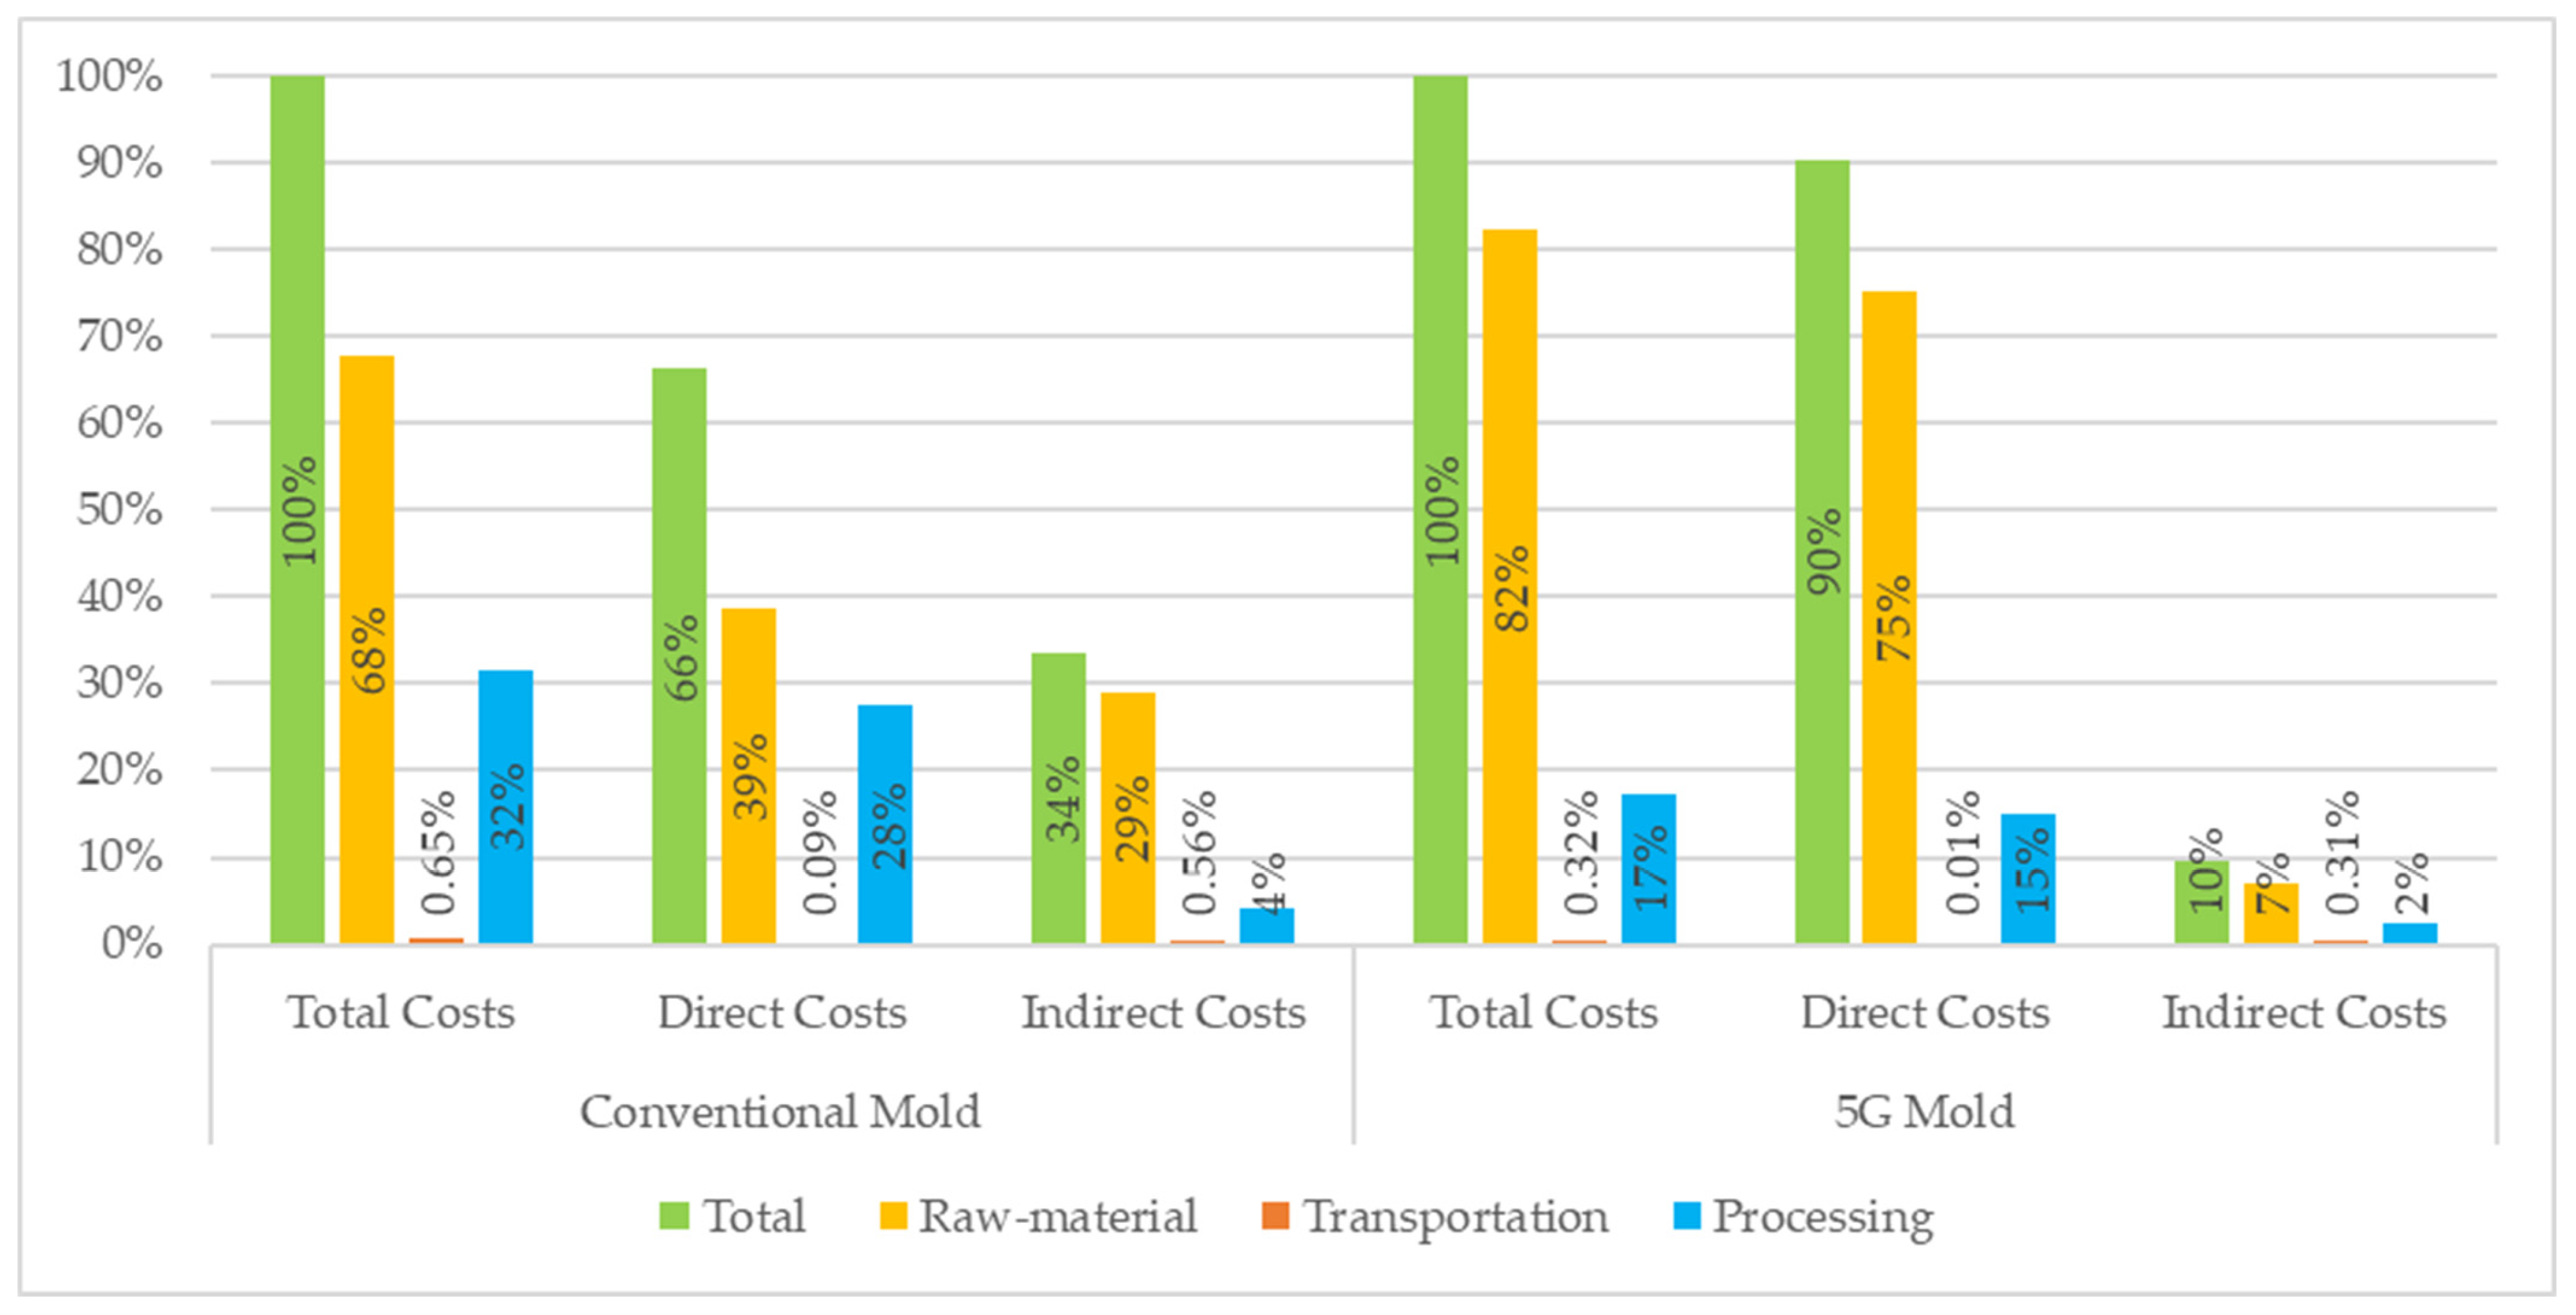
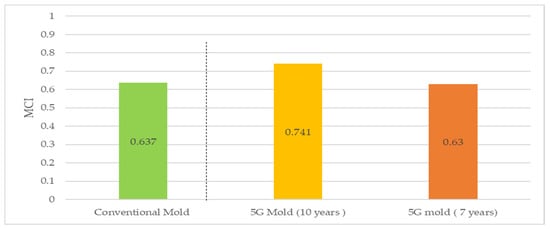
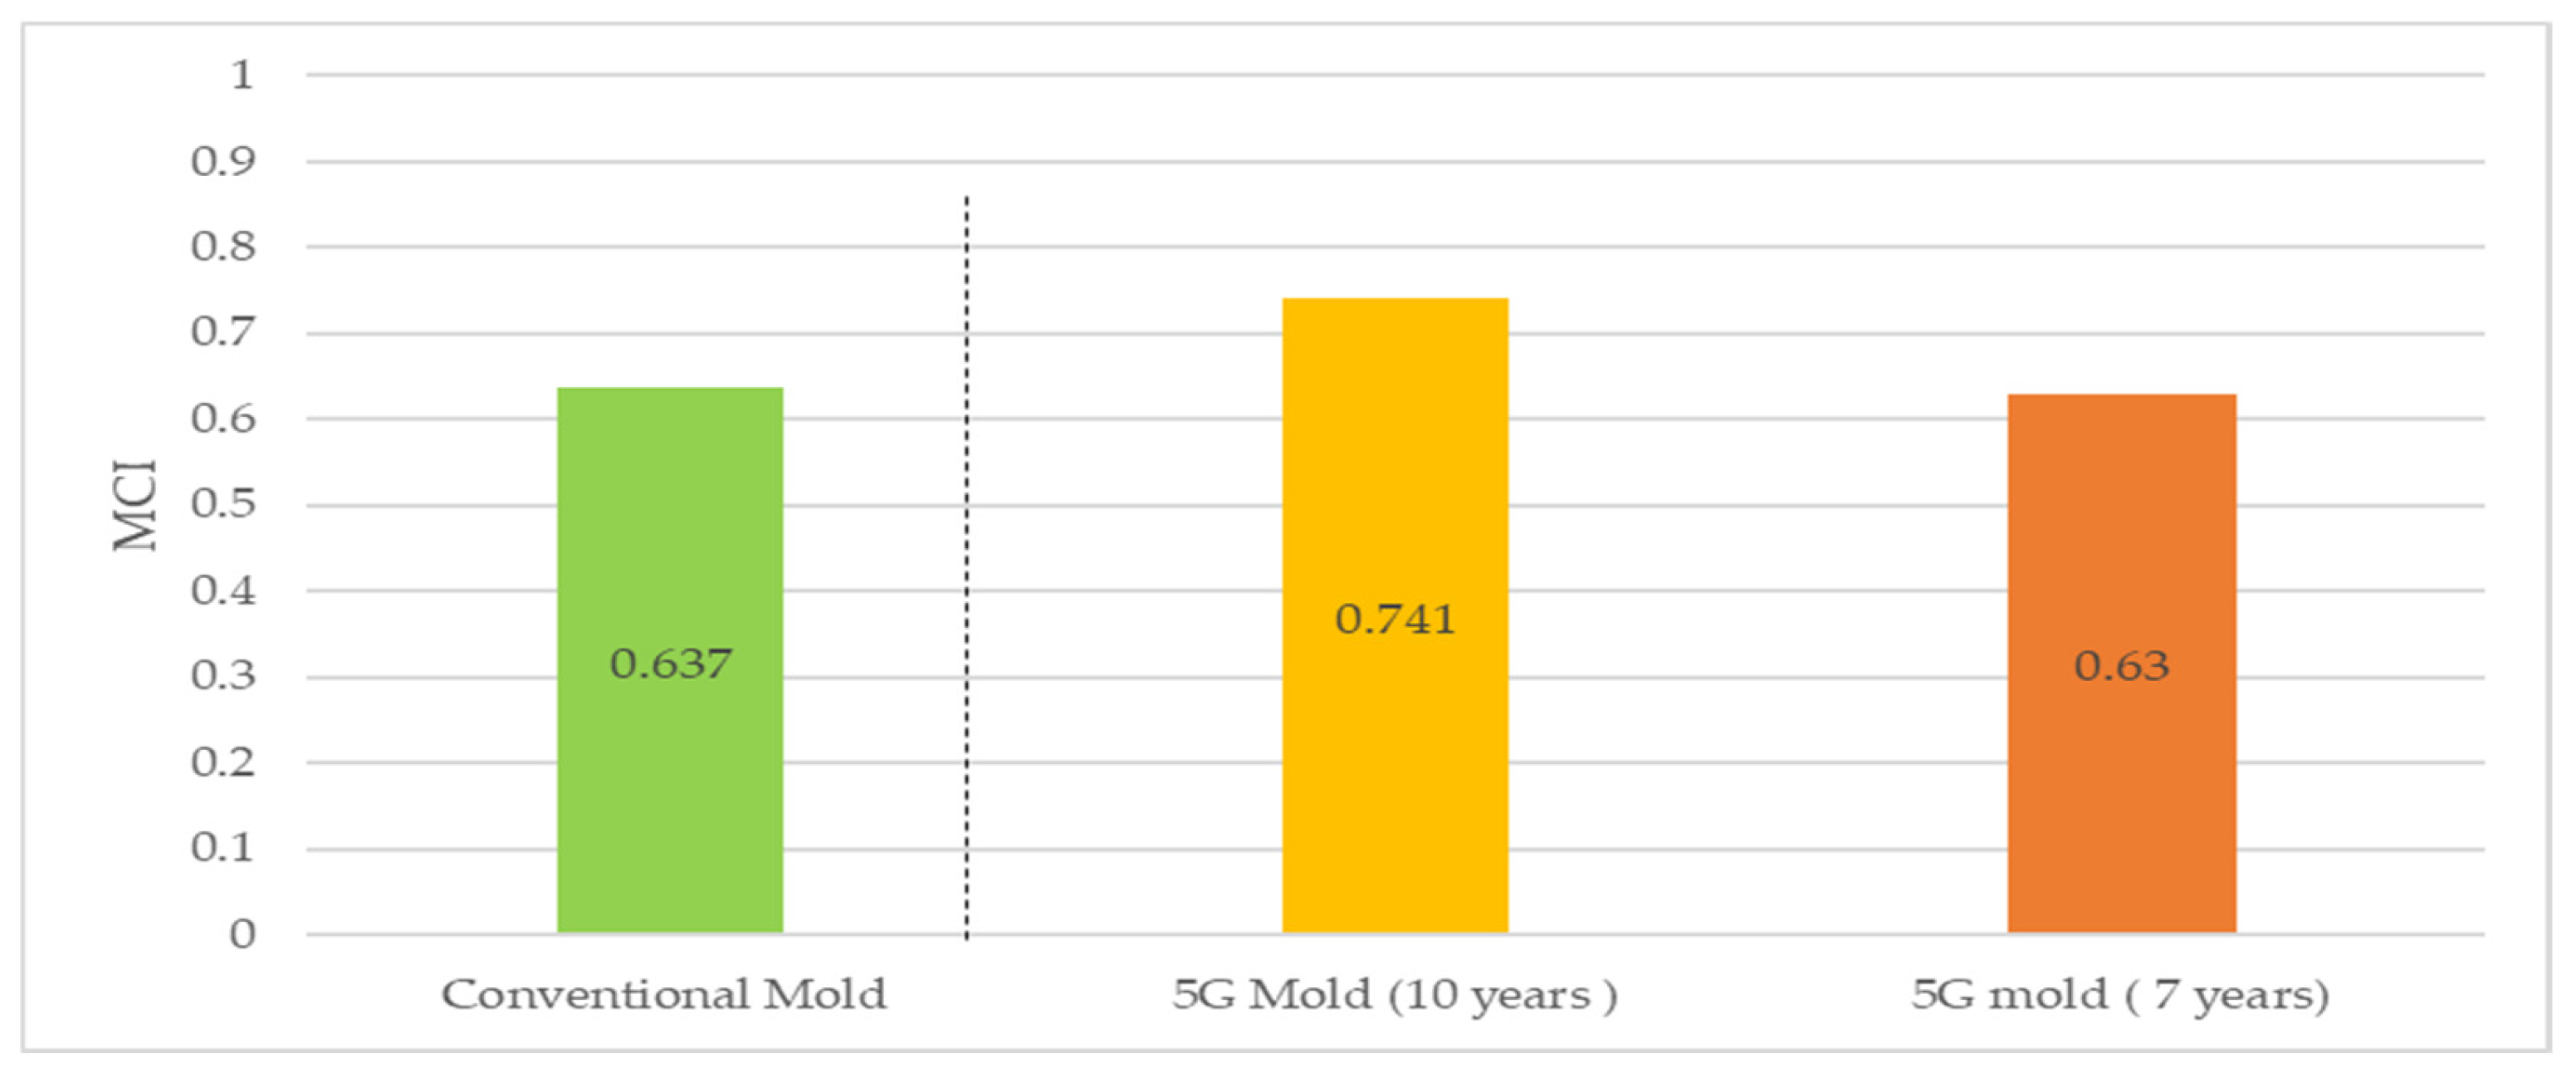
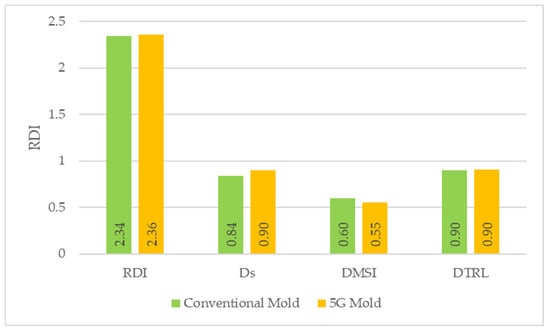
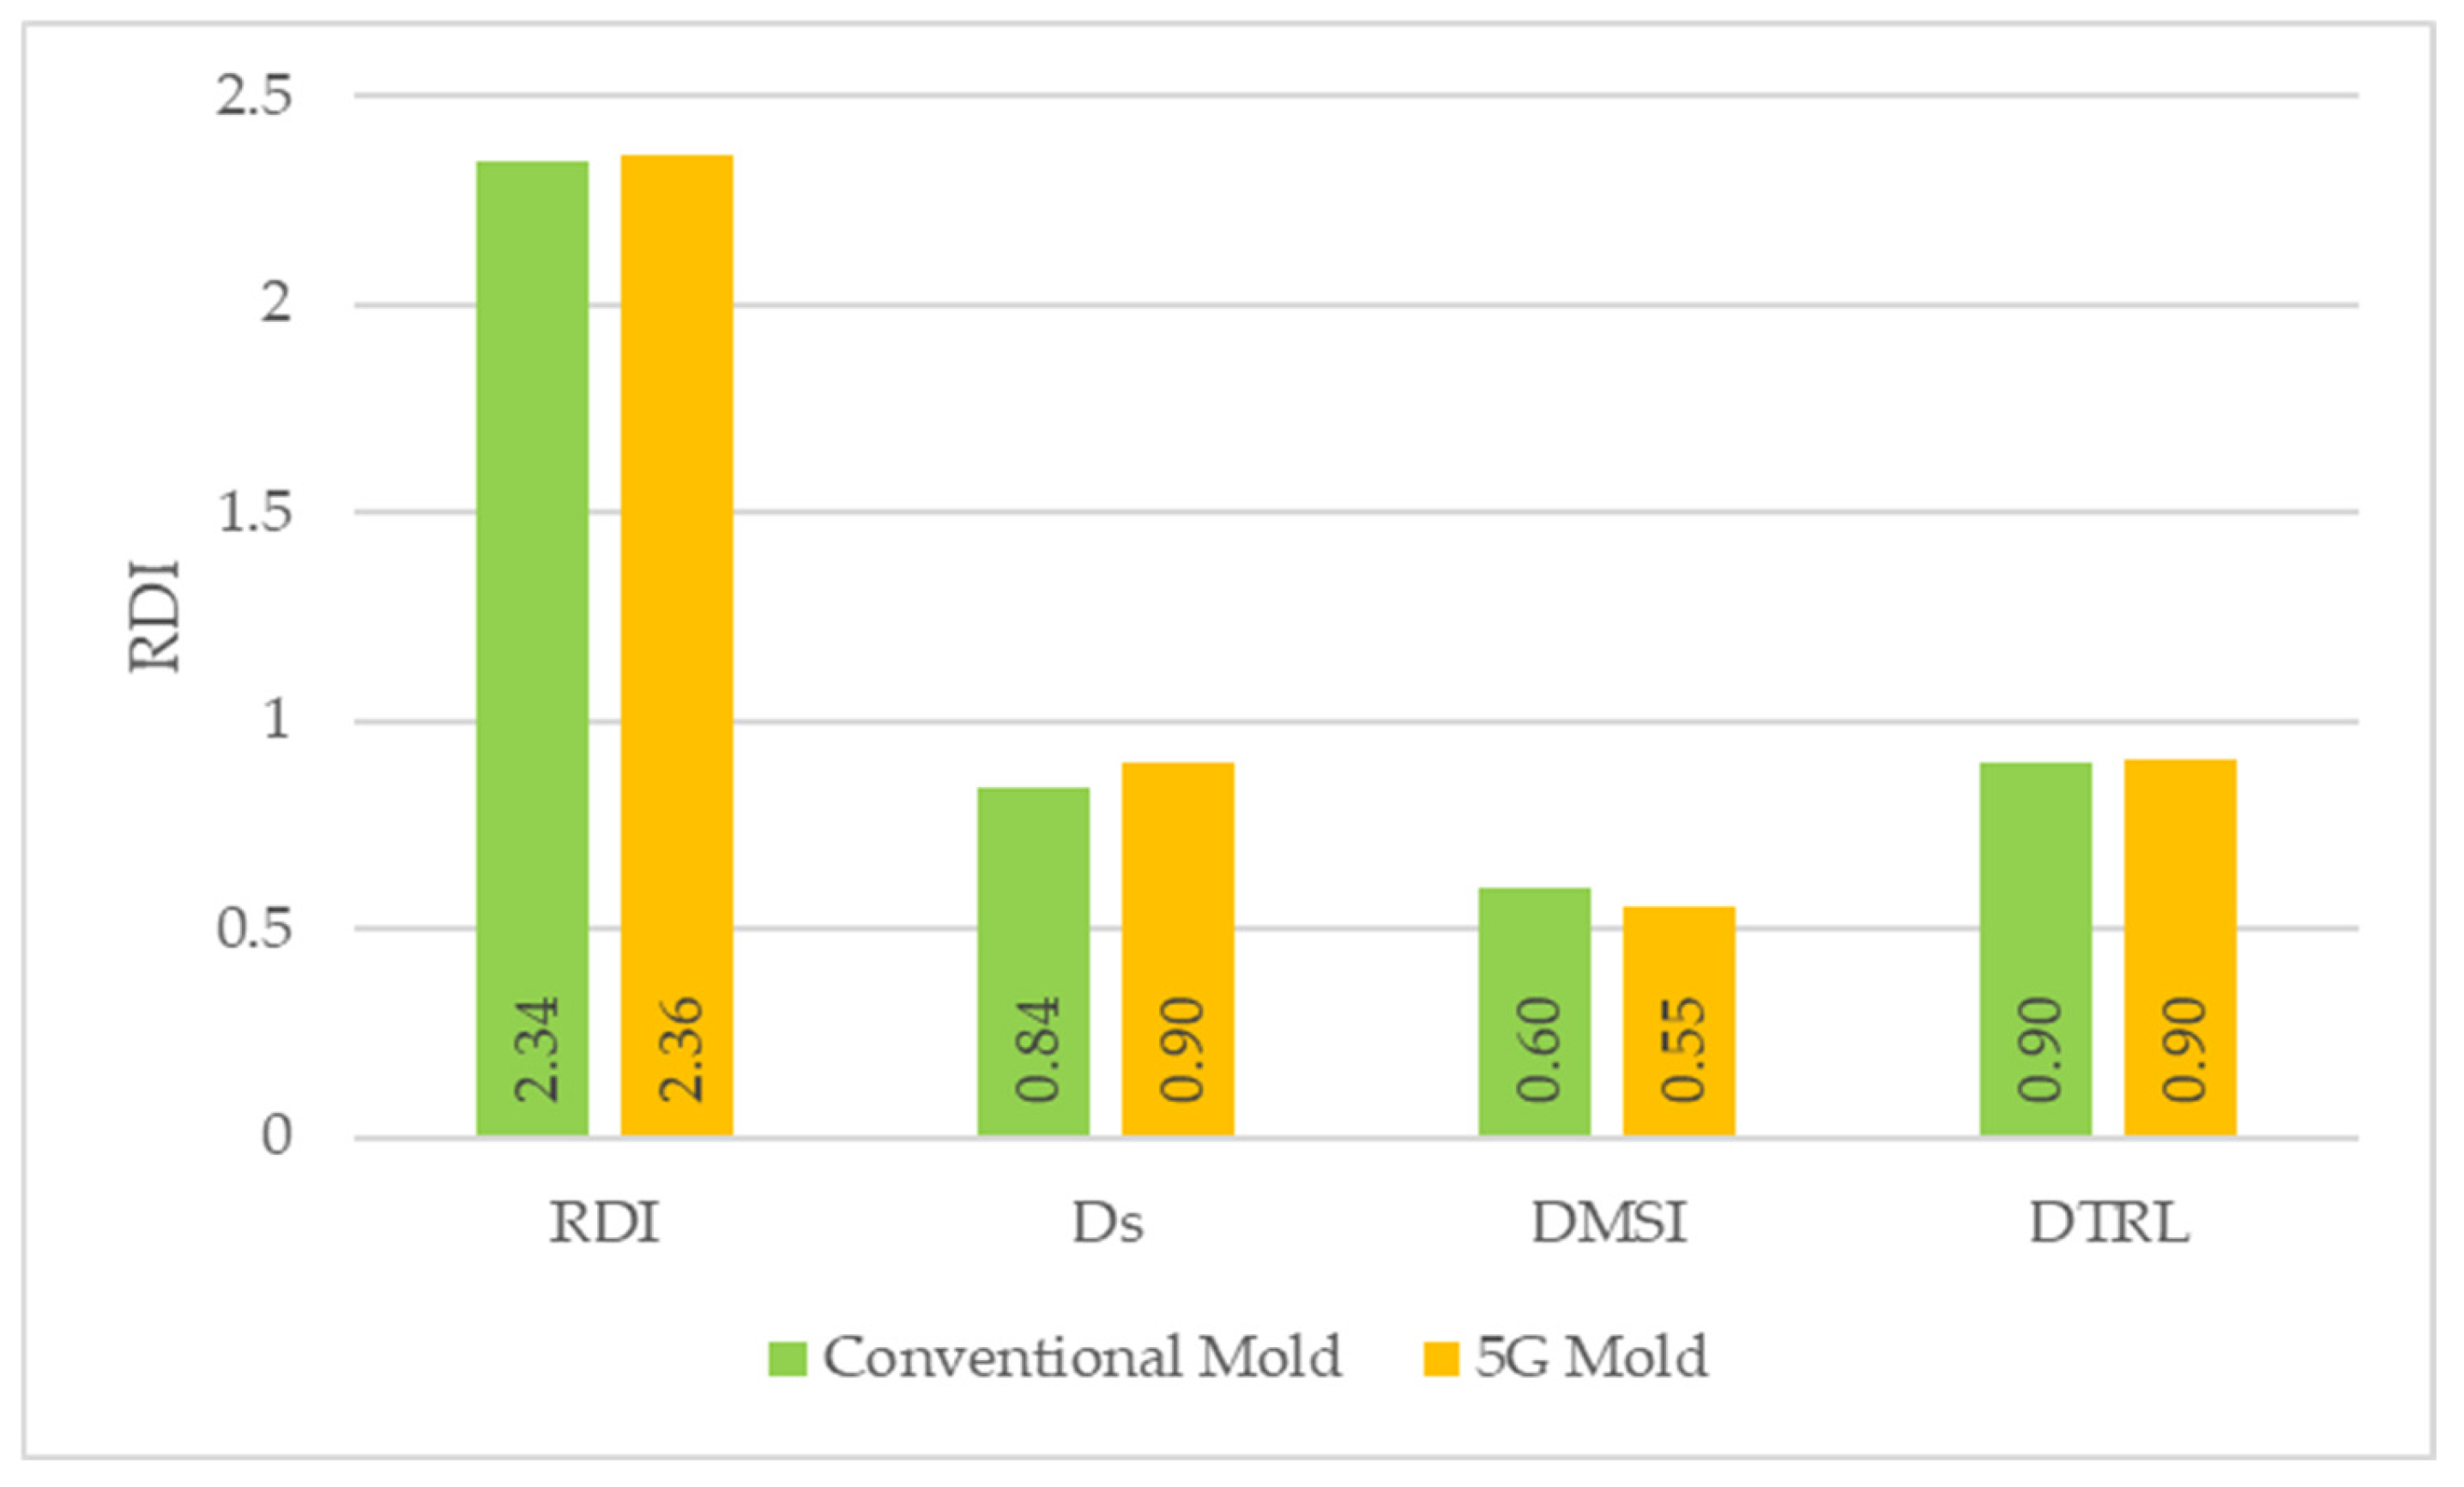
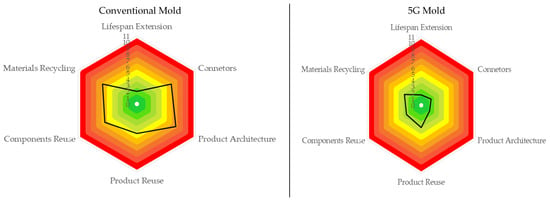
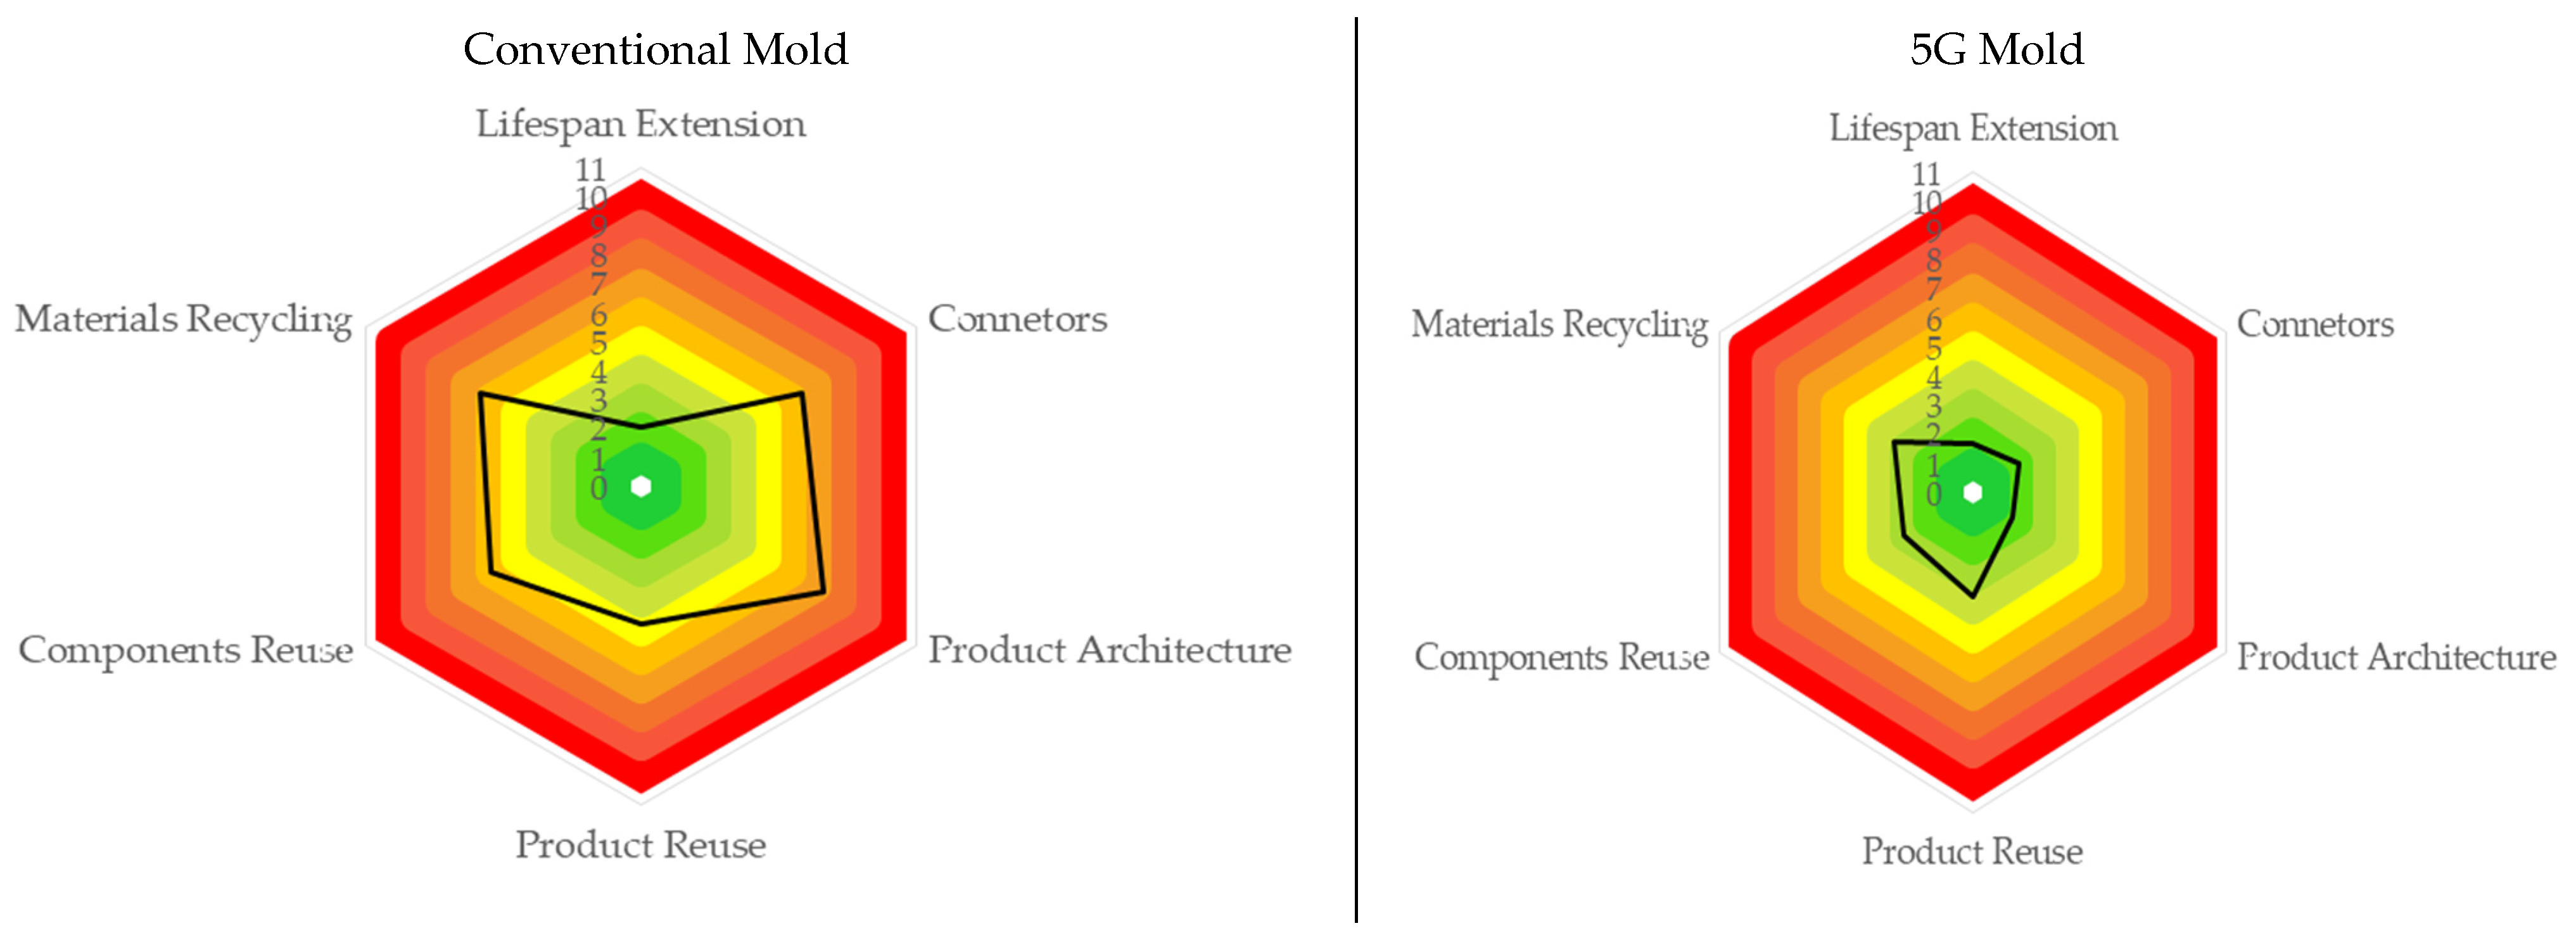
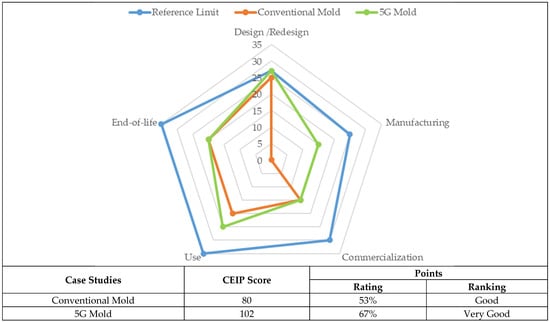
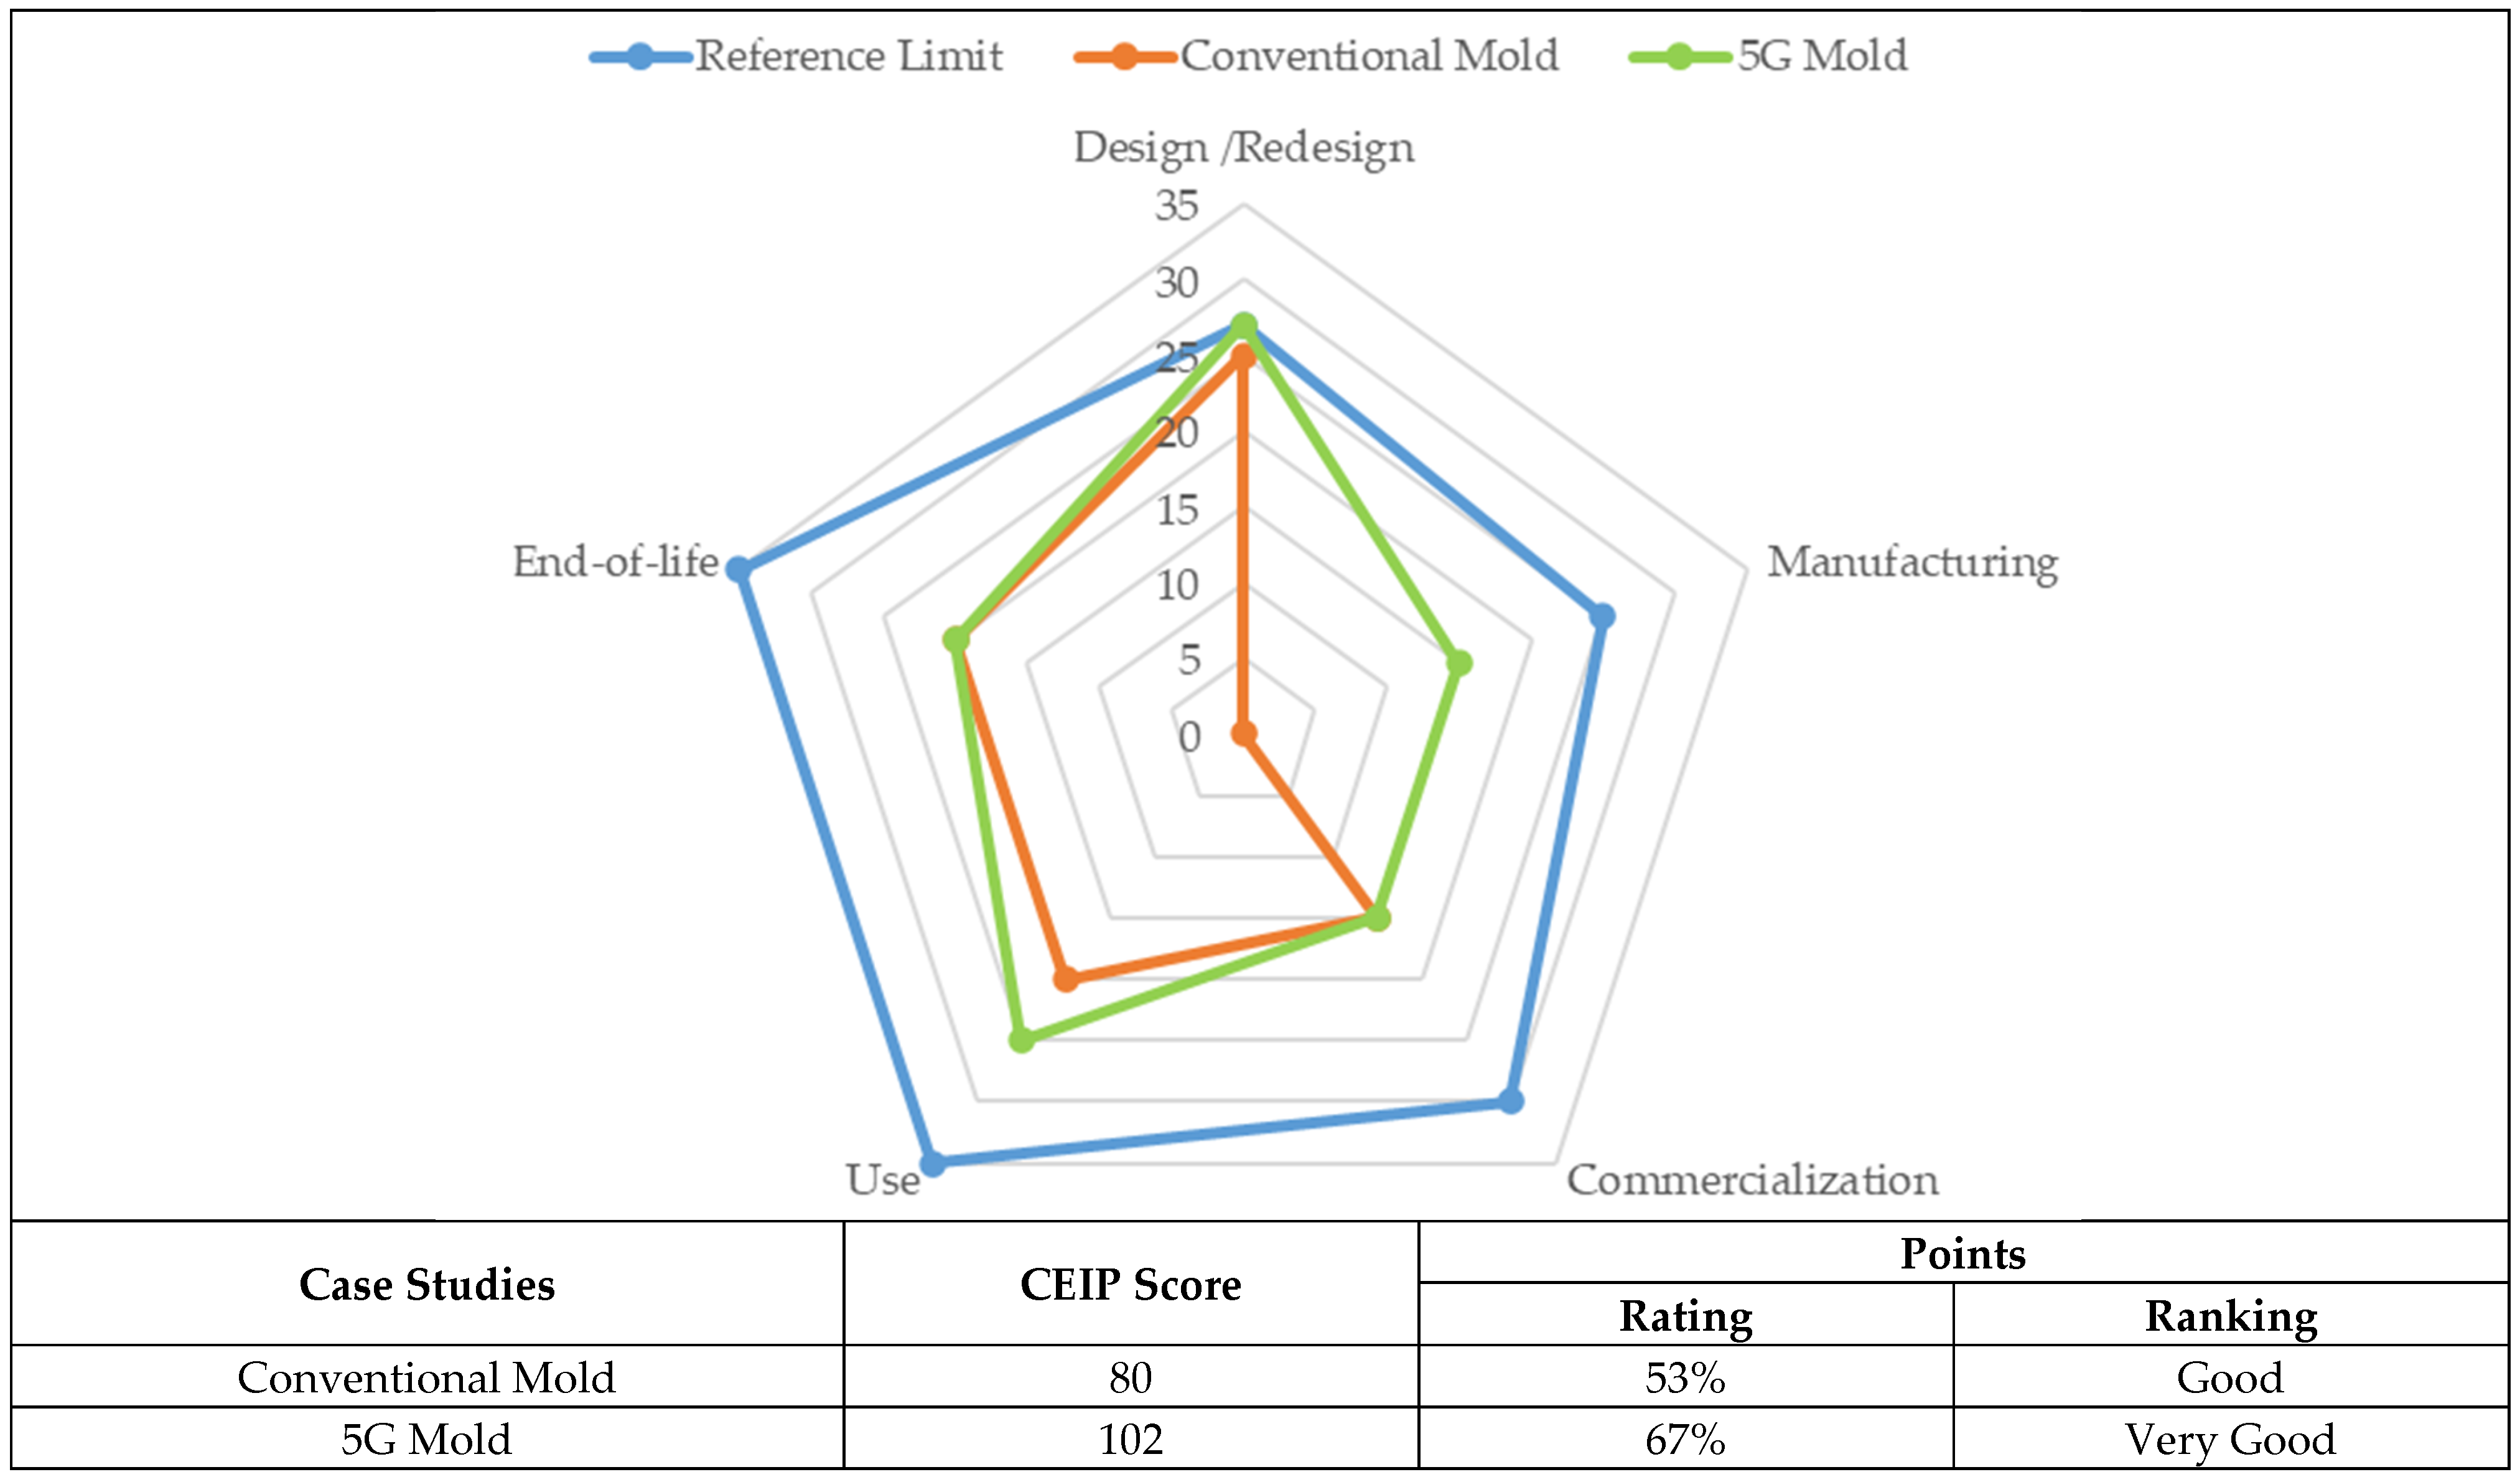

Disclaimer/Publisher’s Note: The statements, opinions and data contained in all publications are solely those of the individual author(s) and contributor(s) and not of MDPI and/or the editor(s). MDPI and/or the editor(s) disclaim responsibility for any injury to people or property resulting from any ideas, methods, instructions or products referred to in the content. |
© 2026 by the authors. Licensee MDPI, Basel, Switzerland. This article is an open access article distributed under the terms and conditions of the Creative Commons Attribution (CC BY) license.