


Abstract
Port-city residents may be exposed to air pollution from shipping, port operations, industry, road traffic, and other urban sources. This systematic review evaluates associations between short- and long-term air pollution exposure and health outcomes among port-city residents. Eligible studies were observational investigations reporting quantitative exposure and health associations. Indoor exposure studies were excluded. Medline, Embase, and Web of Science were searched on 18 June 2026. Two reviewers screened independently. Risk of bias was assessed using the WHO tool for the Global Air Quality Guidelines. Owing to heterogeneity, findings were synthesised narratively. Of 12,277 records, 19 studies were included. The most consistent evidence concerned short-term cardiovascular and respiratory outcomes, with associations reported for particulate matter, nitrogen dioxide, and sulfur dioxide. Long-term associations were reported for mortality, impaired lung function, asthma-related outcomes, and macrosomia. Harbour-related PM10 was associated with reduced lung function, while nickel and vanadium, potential markers of shipping emissions, were associated with cardiovascular hospitalisations. Findings suggest health risks in port-city settings but do not establish effects specifically attributable to port activities. The review was funded by the Italian Ministry of Health (PNC PREV-B-2022-12376988) and registered in PROSPERO (CRD42024534493).
1. Introduction
Air pollution is one of the main environmental determinants of public health, with clear established evidence on respiratory, cardiovascular, and other adverse health outcomes [1,2,3,4]. The health impact of air pollution depends not only on pollutant concentrations, but also on the chemical mixture of particulate matter, the emission sources involved, the characteristics of the exposed population, and the local meteorological and environmental setting, which can influence pollutant dispersion, transformation, and population exposure and vulnerability [5,6,7]. Therefore, similar pollutant concentrations may result in different health impacts across populations with different exposure profiles. In this context, port cities represent particularly relevant settings for environmental epidemiology, as residents may be exposed to a complex composition of pollutants.
Maritime transport plays a central role in the global economy, but it also represents an important source of air pollution. Shipping and port-related activities contribute to emissions of particulate matter, nitrogen oxides, sulfur oxides, black carbon, and trace metals associated with residual fuel combustion, including nickel and vanadium [8,9,10]. Beyond differences in exposure levels, the chemical composition of shipping-related particulate matter may contribute to its health relevance, as particles from residual fuel oil combustion are enriched in transition metals and other toxic constituents capable of promoting oxidative stress and inflammatory responses [11,12]. These emissions may occur close to densely populated coastal areas, increasing the potential burden for population exposure. Previous health impact assessments have indicated that the highest concentrations attributable to shipping and port emissions occur along major shipping routes and near ports, with the greatest health burden affecting nearby coastal populations [13].
Port cities typically experience overlapping emissions from maritime, industrial, urban, and transport-related sources. Because port cities are affected by multiple emission sources, observed associations cannot be attributed exclusively to shipping or port operations. Evidence from epidemiological studies has shown that air pollution exposure in port-city environments may be associated with several health outcomes, including cardiovascular hospital admissions, mortality, respiratory symptoms, reduced lung function, asthma prevalence, and asthma severity [14,15,16,17,18].
On the other hand, coastal environments may provide meteorological conditions that favour pollutant dispersion, including sea-breeze circulation and greater atmospheric ventilation, potentially resulting in lower air pollution levels than in inland areas [19,20]. This potential mitigating effect is highly context-specific and may be offset by intense emissions from maritime traffic, port operations, industrial activities, and road transport, as well as by coastal aerosol formation and long-range transported particles [21,22].
Although previous reviews have synthesised estimates of the global health burden attributable to shipping and port-related emissions using health impact assessment approaches, there remains a need to specifically evaluate epidemiological evidence on residents of port cities [13]. An important distinction is that associations between ambient air pollution and health outcomes observed in port cities cannot necessarily be attributed to maritime activities, as residents are exposed to mixtures of pollutants originating from multiple urban and industrial sources. Therefore, this systematic review aims to synthesise epidemiological evidence on associations between short- and long-term air pollution exposure and health outcomes among residents of port cities, with a broader perspective beyond a narrow focus on pollution exclusively attributable to port activities distinguishing between general ambient pollution and source-related exposure.
2. Materials and Methods
2.1. Protocol, Registration, and Reporting Standards
The review protocol was registered in the International Prospective Register of Systematic Reviews (PROSPERO; registration number CRD42024534493). This systematic review was conducted and reported in accordance with the PRISMA 2020 guidelines [23]. The protocol was amended after registration to adopt the WHO Risk of Bias Assessment Instrument, as documented in PROSPERO. The literature search was subsequently updated to 18 June 2026. Although meta-analysis was considered in the protocol if sufficient comparable data were available, quantitative pooling was not feasible because of substantial methodological heterogeneity.
2.2. Research Question
This systematic review aimed to investigate the associations between short- and long-term exposure to air pollution and adverse health outcomes among residents of port cities.
To address this question, the study selection process was guided by the Population, Exposure, Comparator, Outcome (PECO) framework, as follows:
Population: Residents of port cities.
Exposure: Short- and long-term exposure to ambient air pollution in port-city environments, including pollutants related to maritime traffic, port operations, industrial activities, road traffic, and other urban sources.
Comparator: Lower levels of air pollution exposure, unexposed or less exposed populations, or contrasts across exposure gradients.
Outcome: Non-accidental and cause-specific adverse health outcomes, including mortality, hospital admissions, disease incidence and all reported health effects.
2.3. Inclusion Criteria and Study Selection
Observational studies were considered eligible when they met all of the following criteria:
- (i)
- Assessed the association between exposure to air pollution and health outcomes among residents of port cities;
- (ii)
- A quantitative estimate of the association reported, expressed as an effect size;
- (iii)
- Included residents of port cities or populations residing in areas potentially affected by port-city air pollution;
- (iv)
- Adopted an observational design, including cohort, cross-sectional, time series, case–control, case-crossover, or panel studies;
- (v)
- Were available online as full-text articles.Studies were excluded when they:
- (i)
- focused exclusively on environmental contaminants other than airborne pollutants (e.g., water or soil pollution, bacterial contamination);
- (ii)
- addressed exclusively indoor air pollution;
- (iii)
- were review, conference abstracts, editorials, commentaries, and other non-original research articles.
Studies were classified as having an ineligible exposure when they investigated environmental exposures other than ambient air pollution, such as water or soil contamination, noise, or exclusively indoor pollutants. Studies using indirect indicators of ambient pollution exposure, including residential proximity to ports or industrial sources, were considered eligible when they reported quantitative associations with health outcomes.
Systematic reviews were not included in the analysis but were examined separately to contextualize and compare their conclusions with the findings of the present review.
2.4. Data Searches and Extraction
We conducted a systematic literature search in MEDLINE, EMBASE (via OVID), and Web of Science up to 18 June 2026, without any language restrictions, to identify epidemiological studies assessing associations between ambient air pollution in port-city contexts and health outcomes among resident populations. The search strategy combined controlled vocabulary terms (e.g., MeSH/Emtree) and free-text keywords related to (i) port cities/harbours/shipping/maritime activities and (ii) air pollution (e.g., PM2.5, PM10, NO2/NOx, SO2, O3, CO) and (iii) health outcomes. The strategy was adapted to each database’s syntax and is provided in Supplementary File S1, Tables S1 and S2.
To identify additional potentially eligible studies, the reference lists of existing systematic reviews were examined for additional eligible studies. We also manually searched the reference lists that included studies and relevant review articles to identify any remaining studies. Grey literature was not considered in this review. The search results were deduplicated using the focused algorithm, then manually reviewed, using the Deduplicator available via the Evidence Review Accelerator (TERA) [24].
Article selection was initially conducted through title and abstract screening by two reviewers working independently. The first reviewer (P.D.G) screened all identified records using Rayyan, while the second reviewer (G.N.) independently performed a blinded screening using ASReview LAB (version 1.5) used with default settings [25,26]. Two other reviewers (P.S. and A.S.) intervened in resolving disagreements between the two screening decisions. The literature was examined to determine the stopping rules used in ASReview LAB’s screening, a mixed method was chosen which provides a minimum screening threshold of 20% followed by reaching 50 consecutive irrelevant articles [27,28]. Full texts of potentially eligible articles were retrieved and independently assessed against the predefined eligibility criteria by two reviewers (P.D.G and G.N.). Disagreements regarding study inclusion were resolved through discussion and consensus. Reasons for exclusion at the full-text stage were recorded and reported in Supplementary File S1, Table S3. Data was subsequently extracted from all studies meeting the eligibility criteria.
From each included study, the first reviewer extracted the following data to summarise key characteristics of study designs and findings: first author, publication year, country, study period, study design, exposure assessment methods, pollutant details, population characteristics, health outcomes, effect estimates with confidence intervals, comparator details, noting whether long- or short-term effects were examined. Additional information was extracted, where available, on the number and type of monitoring sites, measurement frequency, temporal resolution, exposure-data completeness and missing-data handling, spatial resolution, exposure assignment methods, and source specificity. We also recorded, where reported, meteorological variables and geographical characteristics considered in exposure modelling, epidemiological adjustment, or effect-modification analyses, distinguishing quantitative evaluation from contextual discussion.
Moreover, all available effect estimates, and corresponding confidence intervals were extracted for eligible exposure–outcome combinations, including estimates across different lag structures and model specifications. A subset of these estimates was subsequently selected for the narrative and graphical synthesis according to the criteria described below. When effect estimates were reported only in graphical form, numerical values and corresponding 95% confidence intervals, when available, were extracted from the published figures using WebPlotDigitizer (version 4.8) [29].
Results for short- and long-term exposure were presented separately. The substantial heterogeneity in exposure metrics, comparators, and effect measures made direct quantitative comparison across studies inappropriate; the findings were therefore synthesised narratively and presented graphically.
In the absence of a standard method of reporting the lag, we adopted an approach consistent with previous studies to select the lag results to derive the overall estimates included in the synthesis [30].
If only one lagged estimate for a given pollutant/outcome pair was presented (either because only one was analysed or only one was reported in the paper), this estimate was recorded for the outcome/pollutant pair. If more than one lag measure was presented, we selected one according to the following hierarchical order, with each subsequent criterion applied only if the preceding one did not allow selection: (1) the lag that the author focused on or stated a priori; (2) the lag that was the most statistically significant (positive or negative) and (3) the lag with the largest effect estimate (positive or negative). For options (2) and (3) results for single lags were selected ahead of results for cumulative/distributed lags.
2.5. Risk-of-Bias Assessment
Risk of bias (RoB) was assessed using the WHO Risk of Bias Assessment Instrument for systematic reviews informing the WHO Global Air Quality Guidelines [31]. The assessment covered confounding, selection bias, exposure assessment, outcome measurement, missing data, and selective reporting, with each domain rated as low, moderate, or high risk of bias. Critical and other/additional confounders were defined a priori and evaluated according to study design. For long-term studies, particular attention was given to age, sex, socioeconomic status, and smoking, together with other relevant factors such as occupational exposure and body mass index. For short-term studies, we considered control of meteorological conditions, seasonality and long-term temporal trends, day of the week, holidays, and influenza epidemics where relevant. Temporal control achieved through appropriate modelling of calendar time in time-series studies or through time-stratified referent selection in case-crossover studies was considered in the judgement. For the exposure assessment domain, additional a priori criteria were used to evaluate whether the exposure method adequately captured temporal variation in short-term studies and spatial contrasts in long-term studies. These criteria complemented, rather than replaced, the WHO instrument and are summarised in Supplementary File S1, Table S4. Risk of bias due to missing results across studies was not formally assessed.
2.6. Data Analysis and Synthesis
The results of the included studies were systematically presented and described through a narrative synthesis of the evidence. Due to the heterogeneity in study designs, exposure assessments and outcome measures, a quantitative meta-analysis was not feasible. Sources of heterogeneity were explored descriptively by comparing study designs, exposure assessment methods, exposure windows, pollutants, health outcomes, and effect measures. Instead, key findings were summarised to provide an overview of the current available evidence, highlighting consistency, discrepancies, and knowledge gaps across the overall body of evidence. Forest plots were provided as a graphical representation of individual study effect sizes and were not used to derive pooled estimates; therefore, they should not be interpreted as a meta-analysis. For main graphical presentation, percentage changes in risk and their confidence intervals were converted to ratio measures using the transformation 1 + (percentage change/100). No pooling of study-specific estimates was performed. To avoid double counting, only one effect estimate per exposure–outcome combination within the same study area was retained for the synthesis. Health risk estimates were organised according to the analytical approach and exposure metric. Estimates from conventional single-pollutant models are presented first, followed by estimates based on source-specific pollutant concentrations, source-proxy exposure measures, analyses of PM components and composition, and mutually adjusted multi-pollutant or multi-source models. Because the exposure contrasts and effect measures differed across studies, the magnitude of estimates should not be compared directly between analyses. No formal assessment of the certainty of evidence was conducted.
3. Results
A total of 12,277 records were identified through literature research. After removing duplicates and screening titles and abstracts, 90 articles were selected for full-text assessment. Of these, 71 studies were excluded for not meeting the inclusion criteria (reasons for exclusion detailed in Figure 1). Finally, 19 studies were included in the present review (Figure 1; Table 1). The screening and selection process is further described in Figure 1.
Figure 1.
PRISMA flow diagram of the study selection process. Flow diagram showing the identification, screening, eligibility assessment, and final inclusion of studies in the systematic review.
Table 1.
Study design, pollutants and health outcomes assessed in the included studies.
3.1. Characteristics of Included Studies
The main characteristics of the 19 included studies are presented in Table 1. Further information on study populations and exposure assessment methods is provided in Supplementary File S1, in Tables S5 and S6, respectively. Six studies were conducted in China, six in Europe (4 in Italy, 1 in Greece and Cyprus, 1 in the Netherlands), two in the USA, one in Brazil, one in South Africa, one in Republic of Korea, one in Malaysia and one in Oman. Regarding study design, the majority were time-series studies (n = 8). Other designs included cohort studies (n = 4), case-crossover studies (n = 2), cross-sectional (n = 2), panel studies (n = 2) and case–control (n = 1). The included studies covered a wide time span (1995–2025), with the majority conducted after 2010, reflecting increasing availability of routine air-quality monitoring and administrative health data. Seven studies investigated long-term effects, while the remaining studies focused on short-term exposures. Analytical approaches differed accordingly. Long-term studies mainly used cohort or cross-sectional designs and generally focused on chronic or spatial exposure contrasts, with adjustment primarily for sociodemographic and other individual-level confounders. Short-term studies, particularly time-series and case-crossover analyses, commonly examined delayed effects using single-day or cumulative lag structures and adjusted for meteorological variables, seasonality, and temporal trends. Single-day lags were the most frequently reported. Exposure assessments varied across studies and included several pollutants. PM10 was evaluated in 13 studies, PM2.5 in 10, NO2 in 10, SO2 and O3 in six each, CO in four, NOx in two, and NO and coarse particulate matter (PMc) in one study each. Two studies additionally examined particulate matter components: Tian et al. evaluated nickel and vanadium in PM10, whereas Yoo et al. evaluated several PM2.5 components. Three studies used source-proxy exposure measures, including residential distance from the harbour or categorical exposure zones. The most studied health outcomes were respiratory diseases and cardiovascular diseases. One study focused on prenatal exposure to port city emissions in pregnant women and risk of macrosomia, another one was conducted on schizophrenia hospital re-admissions, and another addressed impacts on pediatric outpatients.
3.2. Risk of Bias
A summary of the quality of the studies, according to the risk-of-bias assessment instrument for systematic reviews informing WHO global air quality guidelines, is reported in Figure 2. Overall, 15 of the 19 included studies were evaluated as having a high RoB, three as moderate risk, and one as low risk.
Figure 2.
Distribution of risk-of-bias judgements across domains. Stacked bar plots show the percentage of included studies classified as low, moderate, high, or critical risk of bias, or as having no information, for each risk of bias domain and for the overall judgement.
Confounding was the most frequent source of bias, with eleven studies rated as high risk, four as moderate risk, and four as low risk. Judgements were design-specific. For short-term studies, particular attention was given to meteorological factors, temporal and seasonal patterns, calendar effects, and influenza epidemics where relevant; appropriate control through time-series modelling or case-crossover design was taken into account. For long-term studies, the main concerns were incomplete adjustment for factors such as smoking, socioeconomic status, and occupational exposures.
Exposure assessment was judged as low risk of bias in eight studies, moderate risk in eight studies, and high risk in three studies. For short-term studies, concerns in exposure assessment were mainly related to the reliability and completeness of monitoring data, the representativeness of monitoring sites for day-to-day variations in population exposure, and the use of indirect or non-daily exposure measurements. For long-term studies, concerns were mainly related to whether the exposure assessment method could adequately capture spatial contrasts between individuals or areas, particularly when exposure was assigned using proximity indicators, broad exposure zones, or a limited number of monitoring sites.
Selection bias was identified in four studies, three of which were rated as high risk and one as moderate risk. Missing data were generally judged as low risk of bias, with only one study rated as high risk in this domain. Outcome measurement and selective reporting were not identified as a major concern, as all studies were rated as low risk in these domains. Further details of the risk-of-bias assessment are presented in Supplementary File S1, Tables S7 and S8 [50].
3.3. Exposure Assessment Approaches
Exposure assessment methods varied substantially across the included studies in terms of temporal resolution, monitoring frequency, spatial coverage, and source specificity (Supplementary File S1, Table S6). The main approaches included fixed-site ambient monitoring, atmospheric dispersion modelling, and residential proximity indicators.
Among long-term studies, exposure assessment approaches differed primarily in their ability to capture spatial contrasts. Bauleo et al. and Paolocci et al. used dispersion modelling to assign source-specific concentrations to geocoded residential addresses at a spatial resolution of 500 × 500 m [32,37]. Other studies relied on residential proximity to emission sources [33,38], nearest-monitor assignment [35], or annual city-level concentrations [34], providing different degrees of spatial differentiation. Some short-term studies also employed more spatially detailed approaches. Willers et al. estimated daily population-weighted concentrations at the neighbourhood level [45], whereas Su et al. assigned monthly modelled concentrations from port-craft and railway emissions to individual health records using geographic location information [49]. The latter approach provided source-specific spatial exposure estimates but did not resolve daily changes in pollutant concentrations. Moreover, most fixed-site measurements represented general ambient pollution, whereas only a limited number of studies explicitly modelled contributions from port-related sources [37,49]. Other studies relied on indirect indicators, including harbour proximity, chemical tracers, or wind direction, which did not permit unequivocal attribution of health effects to port activities [32,33,36,38,40,44,47].
Most short-term studies relied on fixed-site monitoring networks, commonly aggregating hourly measurements into daily concentrations and assigning city-wide averages to daily health outcomes [39,40,42,43,46,48]. Monitoring coverage varied considerably, ranging from a single station in Klang [48] to eight or nine stations in Qingdao [42,46] and 93 stations distributed across 17 cities in Shandong Province [43]. Other studies combined school-based and municipal monitoring to characterise exposures in different urban areas [41]. Although these approaches generally captured day-to-day variations in ambient pollution, their ability to represent within-city spatial contrasts was more limited, particularly when concentrations were averaged across monitoring sites.
Meteorological and geographical factors were considered to varying degrees and for different analytical purposes. Most short-term studies adjusted for temperature, relative humidity, and seasonal or long-term temporal patterns [21,39,40,42,43,44,46,47,48]. Wind speed was additionally included in the epidemiological models by Liu et al. [43], while Gianicolo et al. examined effect modification by prevailing wind direction from the port and industrial sector [40]. However, the latter approach relied on daily prevailing winds and could not fully capture shorter-term sea–land breeze circulation. Mentz et al. incorporated wind speed and direction, rainfall, atmospheric pressure, and vertical temperature differences into the imputation of missing pollutant concentrations [41]. Psistaki et al. also investigated seasonal differences and dust-storm conditions, using atmospheric back-trajectories to identify dust events [21]. These approaches provided different levels of meteorological information but did not consistently characterise the transport of port-related emissions towards residential areas.
Meteorological and geographical conditions were more directly incorporated into exposure estimation in studies using atmospheric dispersion models. Bauleo et al. and Paolocci et al. employed the SPRAY model, which accounts for meteorological conditions and terrain characteristics when estimating source-specific pollutant dispersion [32,37]. Su et al. used meteorological inputs in the STILT model to estimate contributions from port-craft and railway emissions [49]. Willers et al. incorporated meteorological observations and spatial differences in urban thermal conditions to estimate neighbourhood-level exposures [45]. In contrast, studies based on residential proximity or broad exposure zones represented geographical contrasts without explicitly accounting for wind-dependent pollutant transport [32,33,38]. Although coastal meteorology and sea breezes were discussed in some studies, quantitative assessments of sea–land breeze circulation, atmospheric stability, boundary-layer height, and coastline configuration were generally limited or insufficiently reported. This lack of consistent information restricted the assessment of how local meteorological and geographical conditions influenced exposure differences across port-city settings.
Monitoring frequency, data completeness, and missing-data handling also differed across studies. Gianicolo et al. reported at least 90% valid daily TSP observations and 78.3% valid NO2 observations, with missing values imputed [40]. Psistaki et al. reported less than 1% missing data in Thessaloniki after imputation and less than 5% in Limassol [21], while Abd Rahim et al. reported 11.9% missing observations overall and applied multiple imputation [48]. In contrast, studies investigating particulate matter components used intermittent sampling schedules. Tian et al. collected PM10 components every sixth day at individual monitoring stations, using staggered sampling schedules [44], whereas Yoo et al. used predominantly three- or six-day sampling intervals during part of the study period [47]. Several studies did not quantify exposure-data completeness.
3.4. Exposure Concentration
The mean daily concentrations of air pollutants reported in the study areas across the included studies are summarised in Supplementary File S1, Tables S9–S10. Reported pollutant concentrations were summarised separately for short-term and long-term studies because the exposure metrics and averaging periods differed substantially between the two study types. Short-term studies generally reported distributions or study-period averages of daily pollutant concentrations, whereas long-term studies more commonly reported annual or multi-year average concentrations. Additionally, most studies reported a single period mean value, while others reported minimum–maximum ranges when more than one cohort was analysed, and one study reported median values (Willers 2016), limiting direct comparability across settings [45]. Among long-term studies, information on ambient pollutant concentrations was relatively sparse. PM10 was reported in one study, with a mean concentration of 78.47 µg/m3 (Li et al., 2022), whereas PM2.5 concentrations ranged from 12.8 µg/m3 (Kioumourtzoglou et al., 2015) to 45.12 µg/m3 (Li et al., 2022) [34,35]. Available concentrations of gaseous pollutants included NO2 at 24.29 µg/m3 (Li et al., 2022), O3 ranging from 32.28–41.20 µg/m3 (Matos et al., 2022) to 78.86 µg/m3 (Li et al., 2022), CO at 0.76 mg/m3, and SO2 at 16.33 µg/m3 (Li et al., 2022) [35,36]. PMc and NO concentrations were not reported in the long-term studies. Greater variability was observed among short-term studies. PM10 concentrations ranged from 26.10 µg/m3 (Gianicolo et al., 2013) to 128.0 µg/m3 (Liu et al., 2018), while PM2.5 ranged from 18.3 µg/m3 (Psistaki et al., 2023) to 61.59 µg/m3 (Abd Rahim et al., 2024) [21,40,43,48]. PMc was reported in only one study, with a concentration of 41.10 µg/m3 (Ji et al., 2021) [42]. Among gaseous pollutants, NO2 concentrations ranged from 10.9 µg/m3 (Mentz et al., 2018) to 70.18 µg/m3 (Abd Rahim et al., 2024), and NO from 15.4 to 57.0 µg/m3 (Psistaki et al., 2023) [21,41,48]. O3 concentrations ranged from 39.8 µg/m3 (Tian et al., 2013) to 101.7 µg/m3 (Yang et al., 2022), whereas CO concentrations ranged from 0.64 mg/m3 (Liu et al., 2022) to 1.91 mg/m3 (Abd Rahim et al., 2024) [39,44,47,48]. SO2 concentrations showed substantial variability, ranging from 1.9 µg/m3 (Mentz et al., 2018) to 43.4 µg/m3 (Liu et al., 2018) [41,43]. Only a minority of studies provided source-resolved particulate indicators. Specifically, two long-term studies reported source-attributed contributions for PM10 and NOx (e.g., industrial, port-related, biomass combustion, and traffic-related metrics), whereas the remaining evidence primarily relied on bulk pollutant concentrations without source evaluation.
3.5. Outcome Sources and Outcome Definitions
Health outcomes data were assessed using a variety of sources, reflecting the heterogeneity of the included study designs. Short-term studies commonly examined daily mortality, hospital admissions, or outpatient visits, generally using mortality registries and routinely collected healthcare data. In long-term studies, additional outcomes included incident conditions, respiratory symptoms, asthma severity, and lung function measures. Outcome definitions were therefore not fully comparable across studies, particularly for respiratory outcomes, which ranged from self-reported symptoms to clinically recorded hospital events.
3.6. Effect Metrics and Exposure Contrasts
Effect estimates were reported using different metrics across studies, reflecting differences in study design and outcome type. Long-term studies mainly reported hazard ratios (HRs) or odds ratios (ORs), whereas short-term studies most often used risk ratios (RRs) or percent changes in incidence rate (IR%), and fewer studies reported regression coefficients (β) or incidence rate ratios (IRR). Exposure contrasts were also heterogeneous and included fixed increments in pollutant concentration (most commonly per 10 µg/m3), interquartile range (IQR) increases, comparisons across percentiles or quantiles of exposure, and categorical contrasts based on proximity to the harbour or predefined exposure levels. Because both effect metrics and exposure contrasts varied substantially across studies, direct quantitative comparison was limited and a narrative synthesis was considered the most appropriate approach.
3.7. Health Risk Estimates
Health-risk estimates were organised primarily according to exposure time frame, distinguishing long-term from short-term studies, and subsequently according to analytical approach. Within each group, results from single-pollutant models are presented first, followed, where available, by mutually adjusted multi-pollutant or multi-source analyses, source-specific pollutant estimates, source-proxy exposure measures, and analyses of PM components and composition. The evidence map in Figure 3 indicate the number of included studies that evaluated the pollutant as an exposure in a health-effect analysis. Red circles indicate combinations for which at least one statistically significant association was reported.
Figure 3.
Evidence map of health outcomes and air pollution exposures in the included studies. Circles represent exposure–outcome combinations included in the narrative and graphical synthesis, based on selected estimates from single-pollutant, source-specific, and source-proxy analyses. Numbers within circles indicate the number of unique studies contributing to each combination. Red circles indicate combinations for which at least one statistically significant association was reported, whereas white circles indicate combinations without statistically significant associations. PM-component and mutually adjusted multi-pollutant analyses are presented separately and are not included in the evidence map. Source-specific exposures: 1 traffic-related NOx; 2 PM10 from biomass combustion; 3 harbour-related PM10; 4 PM10 from industrial sources; 5 PM10 from power plants.
The evidence map (Figure 3) highlights an uneven distribution of evidence across exposure–outcome combinations. Short-term studies covered a broader range of cardiovascular and respiratory outcomes, particularly for PM10, PM2.5, and NO2, with statistically significant associations also reported for SO2 in respiratory morbidity outcomes. Long-term evidence was more fragmented, with associations reported for selected mortality, respiratory, and birth outcomes. However, most exposure–outcome combinations were investigated in only one study. Source-specific estimates were reported mainly for long-term mortality. Source-proxy analyses were relatively limited, although harbour-related PM10 was associated with reduced lung function, and harbour proximity was associated with selected mortality outcomes. Importantly, the presence of at least one statistically significant association should not be interpreted as evidence of consistent or robust findings, particularly when individual exposure–outcome combinations were investigated in only one study.
The forest plot in Figure 4 showed the mortality estimates for the three main outcomes. Individual effect estimates and 95% confidence intervals are presented in Supplementary Files S2–S6.
Figure 4.
Main results of associations between air pollution exposure and mortality outcomes in port-city populations. Study-specific effect estimates (circles) and 95% confidence intervals (horizontal error bars) are presented separately for long-term and short-term exposure and for non-accidental, cardiovascular, and respiratory mortality. Ratio measures are shown on a logarithmic scale. Red circles denote statistically significant positive associations, whereas gray circles indicate statistically non-significant associations or inverse associations. Where necessary, estimates originally reported as percentage changes in risk were converted to ratio measures to improve comparability across studies. More than one estimate from the same study is shown when results were reported separately for distinct study populations or locations.
3.7.1. Long-Term Exposure Studies
Estimates from single-pollutant models:
- Three of the seven long-term studies reported single-pollutant estimates, investigating mortality, respiratory outcomes, and macrosomia [34,35,36]. As each outcome was investigated in a different study, the evidence did not allow assessment of consistency across studies. Associations are presented in Supplementary File S2, Figures S1–S3. Regarding mortality, long-term PM2.5 exposure was positively associated with all-cause mortality in the Portland–Seattle cluster (United States) (HR = 1.91, 95% CI 1.10 to 3.32, per 10 μg/m3 increase), whereas estimates for Los Angeles and New York were not statistically significant [34]. For respiratory outcomes, higher O3 concentrations were associated with an increased prevalence of asthma symptoms in Santos (Brasil) (OR = 6.81, 95% CI 1.96 to 23.62, for >Q1 vs. Q1), while estimates for PM10 and NO2 were not statistically significant [36]. Regarding birth outcomes, air pollution was associated with an increased risk of macrosomia in Yancheng (China) for exposure during the entire pregnancy to PM10 (RR = 1.057, 95% CI 1.028 to 1.087), PM2.5 (RR = 1.073, 95% CI 1.034 to 1.113), and SO2 (RR = 1.314, 95% CI 1.188 to 1.454), per 10 μg/m3 increase [35]. Trimester-specific estimates for PM10, PM2.5, and SO2 were generally smaller but consistent in direction, with positive associations across all three trimesters; therefore, only whole-pregnancy estimates are presented here. In contrast, O3 was associated with a positive association observed only during the first trimester.
Mutually adjusted multi-pollutant exposure:
- One long-term study evaluated mutually adjusted pollutant associations [35]. In Yancheng (China), Li et al. found that associations between PM10 and macrosomia remained positive after adjustment for CO, NO2, or O3, with RRs ranging from 1.054 to 1.095 per 10 μg/m3 increase, but were not statistically significant after adjustment for PM2.5 or SO2 [35]. Associations with PM2.5 similarly persisted after adjustment for CO, NO2, or O3, with RRs ranging from 1.068 to 1.121, but not after adjustment for PM10 or SO2. SO2 showed the most consistent results, remaining positively associated with macrosomia after adjustment for each of the other five pollutants, with RRs ranging from 1.302 to 1.474 per 10 μg/m3 increase. CO, NO2, and O3 did not show clear positive associations after co-pollutant adjustment.
Source-specific pollutant exposure estimates:
- Two long-term studies conducted in Civitavecchia (Italy) reported estimates based on source-specific pollutant concentrations, including emissions attributed to industrial plants, road traffic, harbour activities, biomass combustion, and power plants [32,37]. Individual estimates are presented in Supplementary File S3, Figures S11–S18. For mortality, positive associations were observed mainly with industrial-source PM10 and traffic-related NOx. Industrial-source PM10 was associated with non-accidental mortality (HR = 1.06, 95% CI 1.01 to 1.12), cardiac mortality (HR = 1.12, 95% CI 1.01 to 1.23) and mortality from all malignant cancers (HR = 1.11, 95% CI 1.01 to 1.21), with additional positive associations reported for kidney cancer, pancreatic cancer, and pleural cancer, per P95-P5 increase [32]. Traffic-related NOx was associated with mortality from all malignant cancers (HR = 1.13, 95% CI 1.01 to 1.26) and neurological diseases (HR = 1.50, 95% CI 1.01 to 2.20), per P95-P5 increase. The remaining source-specific mortality estimates did not provide evidence of increased risk. In a second study, Paolocci et al. evaluated respiratory symptoms and lung function. Higher estimated PM10 concentrations from harbour-related emissions were associated with lower lung-function parameters, including FEF25–75 (β = −0.12, 95% CI −0.21 to −0.02), FEV1 (β = −0.12, 95% CI −0.21 to −0.03), and FEV1/FVC (β = −1.67, 95% CI −3.10 to −0.23), per P95-P5 increase [37]. In contrast, estimates for respiratory symptoms were not statistically significant, and no significant reductions in lung function were observed for PM10 from biomass combustion or power plants or for traffic-related NOx.
Source-proxy exposure estimates:
- Three long-term studies reported estimates based on source-proxy exposure measures, including residential distance from a harbour or industrial complex and categorical exposure zones [32,33,38]. Individual estimates are presented in Supplementary File S4, Figures S19–S25. For mortality outcomes, two studies conducted in Civitavecchia (Italy) reported different findings regarding residential proximity to the harbour. In the cohort study, residence within 500 m of the harbour was associated with mortality from tracheal, bronchial, and lung cancer (HR = 1.31, 95% CI 1.04 to 1.66, ≤500 m vs. >500 m) and neurological diseases (HR = 1.51, 95% CI 1.05 to 2.18) compared with residence beyond 500 m [32]. Other mortality outcomes did not show evidence of increased risk in relation to harbour proximity. In contrast, the case–control study found no statistically significant association between residential distance from the harbour and lung cancer mortality, with ORs of 1.12 (95% CI 0.77 to 1.61) for residence at 0.7–1.3 km and 1.31 (95% CI 0.86 to 1.86) for residence beyond 1.3 km, compared with residence within 0.7 km [33]. For respiratory outcomes, a study conducted in Sohar industrial port (Oman) evaluated asthma severity using categorical exposure zones surrounding the Sohar industrial port. Asthma severity was higher among residents in the high-exposure zone than among those in the low-exposure zone (RR = 2.42, 95% CI 1.01 to 5.78, high vs. low exposure zone) [38].
3.7.2. Short-Term Exposure Studies
Estimates from single-pollutant models:
- Eleven of the 12 short-term studies reported estimates from single-pollutant models, covering mortality, cardiovascular and respiratory hospital admissions, respiratory healthcare use and symptoms, pneumonia, asthma-related outcomes, and neuropsychiatric outcomes. Associations are presented in Supplementary File S2, Figures S4–S10. For all-cause mortality, a positive association with PM2.5 was found in Limassol (Cyprus) (percentage change = 5.36%, 95% CI 0.82% to 10.21%, per 10 μg/m3 increase) [21]. In Rotterdam (the Netherlands), natural-cause mortality was associated with PM10, O3, and NO2, with percentage increases of 1.70% (95% CI 0.80% to 2.60%), 2.90% (95% CI 1.10% to 4.70%), and 1.70% (95% CI 0.40% to 3.10%) per IQR increase, respectively [45]. Four studies reported short-term single pollutant estimates for cardiovascular outcomes with positive associations between PM or NO2 and mortality or hospital admissions [21,40,47,48]. For cardiovascular mortality, PM10 was associated with increased risk in Thessaloniki (Greece) (percentage change = 1.55%, 95% CI 0.65% to 2.42%) and with PM2.5 in both Limassol (Cyprus) (percentage change = 9.67%, 95% CI 1.80% to 18.39%) and Thessaloniki (Greece) (percentage change = 2.81%, 95% CI 1.28% to 4.24%), per 10 μg/m3 increase [21]. In Ulsan (Republic of Korea) a positive association between PM2.5 and cardiovascular mortality (RR = 1.165, 95% CI 1.058 to 1.287, per IQR increase) was also observed [47]. In Klang (Malaysia), NO2 was associated with cardiovascular hospital admissions (RR = 1.075, 95% CI 1.036 to 1.114) and ischaemic heart disease admissions (RR = 1.091, 95% CI 1.038 to 1.146) per 10 μg/m3 increase [48]. Additional positive associations were reported in Brindisi (Italy) between cardiac hospital admissions and NO2 (percentage change = 5.30%, 95% CI 1.10% to 9.60%) and PM10 (percentage change = 4.00%, 95% CI 0.30% to 7.80%), per 10 μg/m3 increase [40]. Eight studies evaluated short-term single-pollutant associations with respiratory outcomes, including mortality, hospital admissions, healthcare visits, respiratory symptoms, pneumonia, COPD, and asthma-related outcomes.
Positive associations were reported for several pollutants, although their consistency varied across outcomes and studies. For respiratory mortality, PM2.5 was positively associated with mortality in Busan (Republic of Korea) (RR = 1.078, 95% CI 1.006 to 1.161, per IQR increase) [47]. Among healthcare-related outcomes, NO2 and SO2 were associated with increased respiratory morbidity in several studies. In Brindisi (Italy), NO2 was associated with hospital admissions for respiratory diseases (percentage change = 6.10%, 95% CI 1.50% to 11.30%, per 10 μg/m3 increase) [40]. Liu et al. reported city-specific associations between NO2 and COPD hospital admissions in Shandong Province (China), with percentage increases ranging from 1.99% in Rizhao (China) to 3.32% in Dongying (China) per 10 μg/m3 increase [43]. SO2 was also positively associated with COPD admissions in all six cities, with increases ranging from 2.05% in Rizhao (China) to 3.61% in Weihai (China), per 10 μg/m3 increase. Associations with PM10 and PM2.5 were less consistent and were statistically significant only in Weifang (China) and Yantai (China). Other respiratory healthcare outcomes were associated with a broader range of pollutants. In Zhoushan (China), paediatric respiratory outpatient visits were positively associated with PM10, PM2.5, NO2, SO2, O3, and CO [39]. Similarly, for pneumonia hospital visits in Qingdao (China) association was found with PM10, PM2.5, NO2, SO2, and CO, whereas the association with O3 was not statistically significant [46]. The strongest reported association with pneumonia was observed for NO2 (RR = 1.104, 95% CI 1.012 to 1.200, for P95 vs. P25) [46].
Associations were also reported for symptom-based outcomes. Among schoolchildren in Durban (South Africa), NO, NO2, PM10, and SO2 were associated with chest tightness, cough, and shortness of breath, with ORs ranging from approximately 1.06 to 1.11 per IQR increase, whereas no evidence of increased wheeze incidence was observed [41]. In Southern California (United States), both PM2.5 (IRR = 1.00347, 95% CI 1.00210 to 1.00484, per 1 μg/m3 increase) and NO2 (IRR = 1.00158, 95% CI 1.00064 to 1.00252, per 1 ppb increase) were associated with increased daily rescue-medication use [49]. Evidence for neuropsychiatric outcomes was limited to one study conducted in Qingdao (China), where short-term exposure to PM10 (RR = 1.05, 95% CI 1.02 to 1.09), PM2.5 (RR = 1.04, 95% CI 1.01 to 1.07) and coarse particulate matter (PMc; RR = 1.02, 95% CI 1.01 to 1.06) was associated with schizophrenia hospital re-admissions, per IQR increase [42].
PM components and composition:
- Two short-term studies evaluated associations between PM components and health outcomes, including cardiovascular hospital admissions and cause-specific mortality [44,47]. Individual estimates are presented in Supplementary File S5, Figures S26–S29. For cardiovascular outcomes, positive associations involving nickel and vanadium were reported in both studies, although the particulate fractions and health endpoints differed. In Hong Kong (China), interquartile-range increases in both components in PM10, considered as indicators of residual-oil and shipping emissions, were associated with hospital admissions for total cardiovascular, cardiac, cerebrovascular, and ischaemic heart diseases [44]. For total cardiovascular admissions, the excess risks were 1.23% for nickel at lag 0 (95% CI 0.81% to 1.66%) and 0.66% for vanadium at lag 3 (95% CI 0.29% to 1.06%). The largest estimate was observed for vanadium and ischaemic heart disease admissions at lag 0 (excess risk = 1.66%, 95% CI 0.85% to 2.47%). In South Korean cities, cardiovascular mortality in Busan was positively associated with copper, elemental carbon, potassium, nickel, nitrate, lead, vanadium, and zinc in PM2.5, with RRs ranging from approximately 1.06 to 1.12 per IQR increase. Zinc was also associated with cardiovascular mortality in Ulsan (Republic of Korea) (RR = 1.019, 95% CI 1.000 to 1.042) [47]. Associations with non-accidental and respiratory mortality varied across PM2.5 components and cities. In Ulsan, elemental carbon was associated with non-accidental mortality (RR = 1.039, 95% CI 1.002 to 1.080), while positive associations were reported for organic carbon (RR = 1.033, 95% CI 1.007 to 1.057) and vanadium (RR = 1.023, 95% CI 1.000 to 1.044), per IQR increase [47]. Respiratory mortality in Seoul (Republic of Korea) was associated with nickel (RR = 1.141, 95% CI 1.059 to 1.224) and vanadium (RR = 1.104, 95% CI 1.034 to 1.177), per IQR increase. Most other component-specific estimates were not statistically significant [47].
Mutually adjusted multi-pollutant exposure:
- Five short-term studies reported estimates from mutually adjusted models, covering cardiovascular, respiratory, pneumonia, asthma-related, and mortality outcomes [21,39,46,48,49]. Individual estimates from mutually adjusted models are presented in Supplementary File S6, Figures S30–S35. For cardiovascular outcomes, PM10 remained associated with total cardiovascular admissions after adjustment for NO2 (RR = 1.031, 95% CI 1.002 to 1.062, per 10 μg/m3 increase) and with ischaemic heart disease admissions (RR = 1.043, 95% CI 1.0001 to 1.089, per 10 μg/m3 increase) in Klang (Malaysia) [48]. The other two pollutant estimates did not provide evidence of increased risk. For respiratory outcomes, PM2.5 showed positive associations with healthcare visits in two studies, although results varied according to co-pollutant adjustment. In Zhoushan (China), associations with paediatric respiratory outpatient visits remained statistically significant after adjustment for CO, O3, or SO2 (RRs ranging from 1.004 to 1.007 per 1 μg/m3 increase), but not after adjusting for NO2 [39]. In Southern California (United States), the association between PM2.5 and daily rescue medication use remained after adjustment for NO2 (IRR = 1.003, 95% CI 1.002 to 1.005, per 1 μg/m3 increase), whereas the estimate for NO2 adjusted for PM2.5 was not statistically significant [49]. For pneumonia hospital visits in Qingdao (China), positive associations were retained in 21 of the 28 selected two-pollutant models [46]. O3 and NO2 showed the most consistent results: each remained positively associated with pneumonia after adjustment for all five co-pollutants, with RRs ranging from 1.078 to 1.177 for O3 and from 1.028 to 1.117 for NO2, for P95 vs. P25. CO remained associated after adjustment for NO2, O3, or PM2.5; PM10 after adjustment for CO, NO2, or O3; and SO2 after adjustment for CO, NO2, O3, or PM2.5. In contrast, PM2.5 remained statistically significant only after adjustment for O3 (RR = 1.032, 95% CI 1.006 to 1.061, for P95 vs. P25). For mortality, mutually adjusted analyses of PM10 and PM2.5 estimates for non-accidental, cardiovascular, and respiratory mortality in Limassol (Cyprus) and Thessaloniki (Greece) were not statistically significant following adjustment for NO, NO2, O3, or SO2 [21].
4. Discussion
This systematic review synthesised the epidemiological evidence from 19 studies on the health effects of ambient air pollution among residents of port cities. Overall, the included studies indicated that air pollution exposure in these settings may be associated with a broad range of adverse outcomes, including mortality, cardiovascular and respiratory morbidity, impaired lung function, asthma-related outcomes, adverse birth outcomes, and neuropsychiatric hospital re-admissions.
However, the evidence was heterogeneous, and statistically significant associations were generally limited to specific combinations of pollutants, outcomes, exposure windows, and study locations. These findings should therefore be interpreted as evidence of potential health risks in port-city environments rather than as proof of a uniform effect across all port cities or of effects exclusively attributable to maritime activities.
General mortality was investigated in six studies, including three examining long-term exposure and three examining short-term exposure [21,32,33,34,45,47]. Long-term findings were heterogeneous. In Civitavecchia, industrial-source PM10 was associated with non-accidental and selected cause-specific mortality outcomes, while residential proximity to the harbour was associated with lung cancer and neurological mortality [32]. However, another study conducted in the same city did not identify a statistically significant association between harbour proximity and lung cancer mortality [33]. In the United States, long-term PM2.5 exposure was associated with all-cause mortality in the Portland-Seattle cluster, but not consistently across the other geographical groups examined [34]. Short-term studies reported associations between ambient particulate matter and mortality in selected cities, including Thessaloniki, Limassol, and Rotterdam [21,45]. In South Korea, associations involving PM2.5 and its chemical components varied across cities and mortality causes [47]. The contributing studies also differed in population characteristics, exposure assessment methods, and outcome definitions. Three were rated as having high overall risk of bias, two as moderate risk, and one as low risk, further limiting the strength of conclusions.
Cardiovascular outcomes were investigated in six studies, including one examining long-term exposure and five examining short-term exposure [21,32,40,44,47,48]. The most consistent findings concerned acute associations involving particulate matter and NO2, with increased cardiovascular mortality or hospital admissions reported in several cities [21,40,47,48]. Nevertheless, associations varied across pollutants, locations, and cardiovascular endpoints. Some evidence also suggested a potential role of particulate composition. In Hong Kong, nickel and vanadium in PM10 were associated with emergency cardiovascular hospitalisations, while associations involving these metals and other PM2.5 components were observed in selected South Korean cities [44,47]. These findings are relevant to port environments because nickel and vanadium are commonly considered indicators of residual-oil combustion, although they are not exclusive markers of shipping emissions and may also originate from industrial and other combustion sources [44,51]. In the long-term study by Bauleo et al., positive associations involving cardiovascular mortality were observed mainly for industrial-source PM10 [32]. However, five of the six studies were rated as having high overall risk of bias and one as moderate risk. Potential residual confounding, correlations among pollutants and emission sources, and differences in exposure assessment and lag selection therefore limit causal interpretation and prevent the independent contribution of port emissions from being established.
Respiratory outcomes were the most frequently investigated domain, with twelve contributing studies, including four examining long-term exposure and eight examining short-term exposure [21,32,36,37,38,39,40,41,43,46,47,49]. The outcomes were heterogeneous, encompassing respiratory mortality, hospital admissions, outpatient visits, respiratory symptoms, asthma severity, lung function, pneumonia, COPD-related healthcare use, and rescue-medication use. Short-term studies reported positive associations involving PM2.5, PM10, NO2, and SO2 in several settings, although the results were not consistent across all pollutants, cities, or outcomes [39,40,41,43,46]. Associations with respiratory mortality also varied geographically [21,47]. In Southern California, modelled pollution attributable to port-craft and railway operations was associated with increased daily rescue-medication use among patients with asthma or COPD [49]. Although this study provided source-related exposure estimates and individual-level health information, the monthly temporal resolution of modelled pollutant concentrations limited the characterisation of daily exposure variability.
Long-term respiratory evidence was more limited and concerned substantially different health endpoints. In Civitavecchia, modelled harbour-related PM10 was associated with reduced lung-function parameters, whereas associations with respiratory symptoms were less consistent [37]. In Santos, higher ambient O3 concentrations were associated with self-reported asthma symptoms, while in Sohar, greater asthma severity was observed among patients residing closer to the industrial port [36,38]. However, residential proximity cannot distinguish exposure to maritime emissions from that attributable to neighbouring industrial activities, road traffic, or other factors associated with residential location. The interpretation of respiratory findings is further complicated by differences in outcome ascertainment, ranging from self-reported symptoms to clinical examinations, administrative healthcare records, and digitally recorded inhaler use. Ten of the twelve contributing studies were rated as having high overall risk of bias and two as moderate risk. Thus, although the evidence suggests potential respiratory health effects in port-city populations, differences in exposure assessment, confounding control, and outcome measurement limit the consistency and source-specific interpretation of the findings.
Cardiovascular and respiratory associations are biologically plausible in light of established mechanisms linking air pollution exposure to cardiovascular and respiratory system injury through a wide range of pathways. Inhaled particulate matter and gaseous pollutants can induce oxidative stress and pulmonary inflammation, potentially triggering systemic inflammatory responses, endothelial dysfunction, autonomic imbalance, and increased thrombotic activity [52,53]. In addition, that exposure may affect heart rate variability, blood pressure and cardiac electrophysiology increasing probability of acute cardiovascular events like myocardial infarction, stroke and cardiovascular mortality [54].
Evidence concerning pregnancy and birth outcomes was restricted to one prospective cohort study conducted in Yancheng, China [35]. Prenatal exposure to PM10, PM2.5, and SO2 was associated with an increased risk of macrosomia, with SO2 showing relatively consistent associations after adjustment for other pollutants. However, the study investigated general ambient pollution rather than emissions specifically attributed to maritime activities. Its overall risk of bias was rated as high, and no other included study examined comparable birth outcomes. Consequently, these findings remain preliminary and cannot be generalised to other port-city populations without further investigation.
Evidence on neuropsychiatric and other less frequently investigated outcomes was similarly limited. One short-term study conducted in Qingdao reported positive associations between PM10, PM2.5, and coarse particulate matter and hospital re-admissions for schizophrenia [42]. Separately, Bauleo et al. reported selected associations involving neurological mortality and source-related exposure indicators [32]. These studies investigated substantially different outcomes and therefore do not constitute a consistent body of neuropsychiatric evidence. Both were rated as having high overall risk of bias. Other outcomes, including selected cancer and renal mortality endpoints, were investigated in a small number of long-term studies [32,33]. Although these results may indicate additional areas of concern, limited replication and differences in exposure assessment prevent conclusions about consistent associations or effects specifically attributable to port activities.
An important finding across outcome domains is that studies based exclusively on conventional ambient pollutant concentrations may provide an incomplete characterisation of the complex emission mixtures present in port environments. In particular, studies examining particulate composition or source-specific exposures provided potentially informative evidence beyond that obtained from total particulate mass alone. However, the distinction between general ambient pollution, chemical source indicators, and source-attributed concentrations is essential. Nickel and vanadium may indicate residual-fuel combustion but do not uniquely identify maritime emissions, while harbour proximity may reflect a combination of shipping, cargo handling, road and railway traffic, industrial activities, and socioeconomic characteristics. Similarly, dispersion models estimating the contribution of selected sources do not necessarily represent total ambient or individual exposure. Consequently, associations observed in port cities cannot generally be interpreted as effects caused specifically by shipping or port operations.
Meteorological and geographical conditions may further influence the relationship between emissions and population exposure. Wind direction and speed, atmospheric stability, sea–land breeze circulation, temperature, humidity, and coastal topography affect pollutant transport, dispersion, recirculation, and secondary aerosol formation [6,7,20,22]. Sea breezes and greater atmospheric ventilation may reduce pollutant accumulation under some conditions, whereas recirculation and unfavourable dispersion conditions may increase exposure near coastal emission sources. Most short-term studies considered temperature and humidity as potential confounders, but relatively few explicitly evaluated wind-dependent transport or coastal circulation [40,41,43]. Studies employing dispersion modelling incorporated meteorological information more directly into exposure estimation [32,37,49]. These methodological differences are particularly relevant because monitoring stations may adequately represent daily fluctuations in urban background concentrations while failing to capture localised gradients near ports, industrial facilities, and transport corridors.
Differences in urban structure and port characteristics may also contribute to heterogeneity across study settings. The scale and type of port operations, including cargo handling, container transport, ferry and cruise activities, and associated road and railway traffic, may produce different emission profiles. Population density, residential proximity to terminals and industrial facilities, and the historical development of port infrastructure may further influence exposure patterns. Nevertheless, these characteristics were not systematically quantified across the included studies. While some studies incorporated operational information or spatially resolved emission inventories into exposure assessment [32,37,49], others described the port context only qualitatively. Consequently, their contribution to differences in observed health associations could not be systematically evaluated. Importantly, the presence of a port alone does not establish the magnitude of port-related exposure, nor does coastal location necessarily imply either increased or reduced health risk compared with inland urban environments.
The findings from mutually adjusted models further illustrate the complexity of environmental pollutant mixtures. Some associations persisted after adjustment for other pollutants, including those involving SO2 and macrosomia, PM2.5 and paediatric respiratory visits, and selected pollutants and pneumonia visits [35,39,46]. Other associations were attenuated or became statistically non-significant. However, attenuation after co-pollutant adjustment does not necessarily indicate that an association was entirely confounded, particularly when pollutants originate from common sources and are highly correlated. Conversely, persistence after adjustment does not establish that an individual pollutant is the causal agent. Similarly, inverse associations should not be interpreted as evidence of protective effects without considering residual confounding, exposure misclassification, model instability, and random variation.
This review has several strengths. It provides a systematic synthesis of epidemiological evidence across multiple health outcome domains, distinguishing short- and long-term exposure and separating conventional single-pollutant estimates from source-specific concentrations, source proxies, particulate components, and mutually adjusted analyses. Independent study screening, predefined eligibility criteria, and a structured risk-of-bias assessment based on the WHO instrument supported a transparent evaluation of the evidence. Furthermore, the narrative and graphical synthesis allowed results from heterogeneous studies to be presented without implying that the underlying exposure contrasts or effect measures were directly comparable.
Several limitations must also be acknowledged. First, the definition of a port-city setting was necessarily broad, and some included studies examined general ambient pollution in coastal or port cities without directly quantifying port-related emissions. The review therefore primarily addresses health effects associated with air pollution among port-city residents, rather than effects specifically attributable to maritime activities. Second, substantial methodological heterogeneity in exposure assessment, pollutants, exposure increments, outcome definitions, and effect measures precluded meta-analysis and limited direct comparison of association magnitudes. Exposure misclassification was a frequent concern, particularly when city-wide monitoring data were used to represent spatially heterogeneous populations or when residential proximity was adopted as an indirect indicator of pollution exposure. Although some dispersion models provided greater spatial detail, they did not necessarily capture total exposure or temporal changes over the entire study period.
Third, fifteen of the nineteen included studies were rated as having high overall risk of bias, with confounding representing the most frequent concern. Long-term studies did not always adequately account for individual characteristics such as smoking, socioeconomic conditions, and occupational exposure, whereas some short-term studies had limitations in their control of temporal patterns or other time-varying confounders. These concerns reduce confidence in the causal interpretation of the observed associations. Furthermore, information on monitoring frequency, data completeness, and model validation was inconsistently reported, limiting the assessment of exposure reliability across studies.
Finally, the selection of individual lag-specific estimates for the narrative and graphical synthesis introduced additional uncertainty. Although a hierarchical approach previously used in the literature was adopted, selecting estimates according to statistical significance or effect magnitude may have favoured more extreme positive or negative findings and may not adequately represent delayed or cumulative effects. Conversely, applying an identical lag across all studies would have introduced different limitations, given the variability in exposure-response patterns across pollutants and outcomes. Multiple comparisons, incomplete reporting of alternative estimates, and limited replication further complicate interpretation. Some effect estimates extracted from published figures were not independently verified, potentially introducing extraction inaccuracies. No formal certainty-of-evidence assessment was conducted, and the absence of statistical significance should not be interpreted as evidence of no health effect.
Future epidemiological studies should more clearly distinguish exposure to shipping, cargo handling, port-related road and railway traffic, industrial sources, and the wider urban background. This will require greater integration of detailed emission inventories, high-resolution dispersion or land-use models, chemical source apportionment, and monitoring data collected in residential areas. Where feasible, both total ambient concentrations and source-attributed contributions should be estimated and validated against measured concentrations. Greater harmonisation of exposure metrics, monitoring frequency, missing-data reporting, lag structures, outcome definitions, and statistical methods would improve comparability and facilitate future quantitative syntheses.
Further research should also investigate nonlinear and cumulative exposure-response relationships, pollutant mixtures, and interactions with meteorological conditions, while paying particular attention to vulnerable populations, including children, pregnant women, older adults, individuals with pre-existing diseases, and socially disadvantaged communities. Comparative studies involving appropriately selected non-port urban populations, longitudinal evaluations, and natural experiments may provide stronger evidence concerning the additional health burden attributable to port activities. Changes in marine-fuel composition, vessel-emission controls, port electrification, cargo-handling technologies, and traffic management represent potential opportunities for evaluating whether reductions in source-specific emissions translate into measurable improvements in population exposure and health. Such evaluations should also consider the potential environmental consequences of alternative fuels and technologies [22,55,56,57].
Overall, the available evidence supports concern regarding the potential health effects of air pollution in port-city populations, particularly for short-term cardiovascular and respiratory outcomes. However, the predominance of high-risk studies, methodological heterogeneity, and limited source-specific exposure assessment prevent definitive conclusions regarding the independent health effects of maritime activities. More robust and comparable epidemiological studies are needed to clarify these associations and inform effective prevention strategies.
5. Conclusions
The available epidemiological evidence suggests that air pollution in port-city environments may adversely affect the health of nearby residents, with the clearest signals involving short-term cardiovascular and respiratory morbidity and selected source-related or component-specific exposures. However, the evidence remains fragmented and is limited by heterogeneous methods, exposure misclassification, and a predominantly high risk of bias. Current findings support precautionary measures to reduce emissions from shipping, port operations, industry, and associated land transport, but they do not yet allow the health effects observed in most port cities to be attributed exclusively to maritime sources. More robust and source-resolved epidemiological studies are needed to quantify the specific contribution of port activities and to guide locally appropriate prevention policies.
Supplementary Materials
The following supporting information can be downloaded at https://www.mdpi.com/article/10.3390/environments13110637/s1. Supplementary File S1 contains Tables S1–S10, providing search strategies, excluded studies and reasons for exclusion, risk-of-bias assessment criteria and judgements, study characteristics, exposure assessment methods, and pollutant information. Supplementary Files S2–S6 provide supplementary forest plots of effect estimates from single-pollutant models (Supplementary File S2; Figures S1–S10), source-specific pollutant exposures (Supplementary File S3; Figures S11–S18), air pollution exposure proxies (Supplementary File S4; Figures S19–S25), particulate matter components and composition (Supplementary File S5; Figures S26–S29), and multi-pollutant and/or multi-source models (Supplementary File S6; Figures S30–S35).
Author Contributions
Conceptualization, P.D.G., I.B., V.S. and L.B.; methodology, P.D.G., B.d.O.A., S.S., V.S., S.V. and P.C.; validation, B.d.O.A., G.N., S.V., C.A. and P.C.; formal analysis, P.D.G.; investigation, P.D.G., G.N., A.S. and P.S.; resources, I.B.; data curation, P.D.G., I.B., G.N., A.S. and P.S.; writing—original draft preparation, P.D.G. and I.B.; writing—review and editing, B.d.O.A., G.N., A.S., P.S., T.S., S.S., V.S., P.L., S.V., C.A. and P.C.; visualization, P.D.G.; supervision, B.d.O.A., S.S., V.S., S.V., C.A., L.B. and P.C.; project administration, L.B.; funding acquisition, L.B. and P.C. All authors have read and agreed to the published version of the manuscript.
Funding
This research was funded by Ministry of Health, project number PNC PREV-B-2022-12376988.
Data Availability Statement
Study characteristics and effect estimates supporting the narrative and graphical syntheses are reported in the Supplementary Materials (Supplementary Files S1–S6). Further extracted data may be made available by the corresponding author upon reasonable request.
Acknowledgments
We acknowledge the members of the SalPIAm Working Group for their valuable scientific discussions and support throughout the development of this systematic review. During the preparation of this manuscript, the authors used ChatGPT (OpenAI) to support language editing, improve clarity and readability, assist with manuscript organization and presentation, and support the development of R code for data visualization. The authors reviewed and edited the AI-generated content and verified the code and resulting figures. The authors take full responsibility for the content of this publication.
Conflicts of Interest
The authors declare no conflicts of interest. The funder had no role in the design of the study; in the collection, analyses, or interpretation of data; in the writing of the manuscript; or in the decision to publish the results.
Abbreviations
The following abbreviations are used in this manuscript:
| ASL | Azienda Sanitaria Locale (Local Health Authority) |
| CI | Confidence interval |
| CO | Carbon monoxide |
| COPD | Chronic obstructive pulmonary disease |
| Cu | Copper |
| EC | Elemental carbon |
| FEF25-75 | Forced expiratory flow between 25% and 75% of forced vital capacity |
| FEV1 | Forced expiratory volume in one second |
| FVC | Forced vital capacity |
| HR | Hazard ratio |
| IQR | Interquartile range |
| IR% | Percentage change in incidence rate |
| IRR | Incidence rate ratio |
| K | Potassium |
| Ni | Nickel |
| NO | Nitric oxide |
| NO2 | Nitrogen dioxide |
| NOx | Nitrogen oxides |
| O3 | Ozone |
| OC | Organic carbon |
| OR | Odds ratio |
| P5 | 5th percentile |
| P25 | 25th percentile |
| P95 | 95th percentile |
| Pb | Lead |
| PECO | Population, Exposure, Comparator, Outcome |
| PM | Particulate matter |
| PM2.5 | Particulate matter with aerodynamic diameter ≤ 2.5 μm |
| PM10 | Particulate matter with aerodynamic diameter ≤10 μm |
| PMc | Coarse particulate matter |
| PNC | Piano Nazionale Complementare (National Complementary Plan) |
| ppb | Parts per billion |
| Q1 | First quartile |
| RoB | Risk of bias |
| RR | Relative risk |
| Si | Silicon |
| SO2 | Sulfur dioxide |
| V | Vanadium |
| WHO | World Health Organization |
| Zn | Zinc |
References
- Khoshakhlagh, A.H.; Mohammadzadeh, M.; Gruszecka-Kosowska, A.; Oikonomou, E. Burden of cardiovascular disease attributed to air pollution: A systematic review. Glob. Health 2024, 20, 37. [Google Scholar] [CrossRef] [Scilit] [PubMed]
- Manisalidis, I.; Stavropoulou, E.; Stavropoulos, A.; Bezirtzoglou, E. Environmental and Health Impacts of Air Pollution: A Review. Front. Public Health 2020, 8, 14. [Google Scholar] [CrossRef] [Scilit] [PubMed]
- Stafoggia, M.; Oftedal, B.; Chen, J.; Rodopoulou, S.; Renzi, M.; Atkinson, R.W.; Bauwelinck, M.; O Klompmaker, J.; Mehta, A.; Vienneau, D.; et al. Long-term exposure to low ambient air pollution concentrations and mortality among 28 million people: Results from seven large European cohorts within the ELAPSE project. Lancet Planet. Health 2022, 6, e9–e18. [Google Scholar] [CrossRef] [Scilit] [PubMed]
- Tran, H.M.; Tsai, F.-J.; Lee, Y.-L.; Chang, J.-H.; Chang, L.-T.; Chang, T.-Y.; Chung, K.F.; Kuo, H.-P.; Lee, K.-Y.; Chuang, K.-J.; et al. The impact of air pollution on respiratory diseases in an era of climate change: A review of the current evidence. Sci. Total Environ. 2023, 898, 166340. [Google Scholar] [CrossRef] [Scilit] [PubMed]
- Zanobetti, A.; Franklin, M.; Koutrakis, P.; Schwartz, J. Fine particulate air pollution and its components in association with cause-specific emergency admissions. Environ. Health 2009, 8, 58. [Google Scholar] [CrossRef] [Scilit] [PubMed]
- Gong, S.; Zhang, L.; Liu, C.; Lu, S.; Pan, W.; Zhang, Y. Multi-scale analysis of the impacts of meteorology and emissions on PM2.5 and O3 trends at various regions in China from 2013 to 2020 2. Key weather elements and emissions. Sci. Total Environ. 2022, 824, 153847. [Google Scholar] [CrossRef] [Scilit] [PubMed]
- Ma, T.; Duan, F.; He, K.; Qin, Y.; Tong, D.; Geng, G.; Liu, X.; Li, H.; Yang, S.; Ye, S.; et al. Air pollution characteristics and their relationship with emissions and meteorology in the Yangtze River Delta region during 2014–2016. J. Environ. Sci. 2019, 83, 8–20. [Google Scholar] [CrossRef] [Scilit] [PubMed]
- Third IMO Greenhouse Gas Study. Executive Summary and Final Report. 2014. Available online: https://wwwcdn.imo.org/localresources/en/OurWork/Environment/Documents/Third%20Greenhouse%20Gas%20Study/GHG3%20Executive%20Summary%20and%20Report.pdf (accessed on 30 October 2025).
- Initial IMO Strategy on Reduction of GHG Emissions from Ships. Available online: https://wwwcdn.imo.org/localresources/en/KnowledgeCentre/IndexofIMOResolutions/MEPCDocuments/MEPC.304(72).pdf (accessed on 30 October 2025).
- Serra, P.; Fancello, G. Towards the IMO’s GHG Goals: A Critical Overview of the Perspectives and Challenges of the Main Options for Decarbonizing International Shipping. Sustainability 2020, 12, 3220. [Google Scholar] [CrossRef] [Scilit]
- Oeder, S.; Kanashova, T.; Sippula, O.; Sapcariu, S.C.; Streibel, T.; Arteaga-Salas, J.M.; Passig, J.; Dilger, M.; Paur, H.-R.; Schlager, C.; et al. Particulate matter from both heavy fuel oil and diesel fuel shipping emissions show strong biological effects on human lung cells at realistic and comparable in vitro exposure conditions. PLoS ONE 2015, 10, e0126536. [Google Scholar] [CrossRef] [Scilit] [PubMed]
- Easton, N.H.; Dean, L.S.; Parkin, J.G.; Bell, J.A.; Cooper, M.J.; Ridley, R.; Conforti, F.; Davies, E.R.; Sofia, C.; Edgeway, L.; et al. Ultrafine particulate matter emitted from ships drives inflammation and susceptibility to viral infection. Environ. Int. 2026, 214, 110381. [Google Scholar] [CrossRef] [Scilit] [PubMed]
- Mueller, N.; Westerby, M.; Nieuwenhuijsen, M. Health impact assessments of shipping and port-sourced air pollution on a global scale: A scoping literature review. Environ. Res. 2023, 216, 114460. [Google Scholar] [CrossRef] [Scilit] [PubMed]
- Vermeulen, R.; Silverman, D.T.; Garshick, E.; Vlaanderen, J.; Portengen, L.; Steenland, K. Exposure-Response Estimates for Diesel Engine Exhaust and Lung Cancer Mortality Based on Data from Three Occupational Cohorts. Environ. Health Perspect. 2014, 122, 172–177. [Google Scholar] [CrossRef] [Scilit] [PubMed]
- Moolgavkar, S.H.; Chang, E.T.; Luebeck, G.; Lau, E.C.; Watson, H.N.; Crump, K.S.; Boffetta, P.; McClellan, R. Diesel Engine Exhaust and Lung Cancer Mortality: Time-Related Factors in Exposure and Risk. Risk Anal. 2015, 35, 663–675. [Google Scholar] [CrossRef] [Scilit] [PubMed]
- Ritz, B.; Lee, P.-C.; Hansen, J.; Lassen, C.F.; Ketzel, M.; Sørensen, M.; Raaschou-Nielsen, O. Traffic-Related Air Pollution and Parkinson’s Disease in Denmark: A Case-Control Study. Environ. Health Perspect. 2016, 124, 351–356. [Google Scholar] [CrossRef] [Scilit] [PubMed]
- Costa, L.G.; Cole, T.B.; Coburn, J.; Chang, Y.C.; Dao, K.; Roque, P. Neurotoxicants Are in the Air: Convergence of Human, Animal, and In Vitro Studies on the Effects of Air Pollution on the Brain. BioMed Res. Int. 2014, 2014, 736385. [Google Scholar] [CrossRef] [Scilit] [PubMed]
- Levesque, S.; Surace, M.J.; McDonald, J.; Block, M.L. Air pollution & the brain: Subchronic diesel exhaust exposure causes neuroinflammation and elevates early markers of neurodegenerative disease. J. Neuroinflamm. 2011, 8, 105. [Google Scholar] [CrossRef] [Scilit] [PubMed]
- Wan, Z.; Yang, C.; Wang, X.; Xue, Y.; Zhao, J.; Cui, J.; Guo, Q.; Hua, H.; Sun, H.; Chen, D.; et al. Spatial and temporal differentiation of air quality and its influence factors in 16 cities in Shandong Province from 2019 to 2020. RSC Sustain. 2024, 2, 1528–1542. [Google Scholar] [CrossRef] [Scilit]
- Varaprasad, V.; Kanawade, V.P.; Narayana, A.C. Association between sea-land breeze and particulate matter in five coastal urban locations in India. Sci. Total Environ. 2024, 913, 169773. [Google Scholar] [CrossRef] [Scilit] [PubMed]
- Psistaki, K.; Achilleos, S.; Middleton, N.; Paschalidou, A.K. Exploring the impact of particulate matter on mortality in coastal Mediterranean environments. Sci. Total Environ. 2023, 865, 161147. [Google Scholar] [CrossRef] [Scilit] [PubMed]
- Merico, E.; Cesari, D.; Gregoris, E.; Gambaro, A.; Cordella, M.; Contini, D. Shipping and Air Quality in Italian Port Cities: State-of-the-Art Analysis of Available Results of Estimated Impacts. Atmosphere 2021, 12, 536. [Google Scholar] [CrossRef] [Scilit]
- Page, M.J.; McKenzie, J.E.; Bossuyt, P.M.; Boutron, I.; Hoffmann, T.C.; Mulrow, C.D.; Shamseer, L.; Tetzlaff, J.M.; Akl, E.A.; Brennan, S.E.; et al. The PRISMA 2020 statement: An updated guideline for reporting systematic reviews. BMJ 2021, 372, n71. [Google Scholar] [CrossRef] [Scilit] [PubMed]
- Forbes, C.; Greenwood, H.; Carter, M.; Clark, J. Automation of duplicate record detection for systematic reviews: Deduplicator. Syst. Rev. 2024, 13, 206. [Google Scholar] [CrossRef] [Scilit] [PubMed]
- Ouzzani, M.; Hammady, H.; Fedorowicz, Z.; Elmagarmid, A. Rayyan—A web and mobile app for systematic reviews. Syst. Rev. 2016, 5, 210. [Google Scholar] [CrossRef] [Scilit] [PubMed]
- van de Schoot, R.; de Bruin, J.; Schram, R.; Zahedi, P.; de Boer, J.; Weijdema, F.; Kramer, B.; Huijts, M.; Hoogerwerf, M.; Ferdinands, G.; et al. An open source machine learning framework for efficient and transparent systematic reviews. Nat. Mach. Intell. 2021, 3, 125–133. [Google Scholar] [CrossRef] [Scilit]
- Scherhag, J.; Burgard, T. Performance of Semi-Automated Screening Using Rayyan and ASReview: A Retrospective Analysis of Potential Work Reduction and Different Stopping Rules. In Proceedings of the Big Data & Research Syntheses 2023; ZPID (Leibniz Institute for Psychology): Trier, Germany, 2023. [Google Scholar] [CrossRef]
- Oami, T.; Okada, Y.; Sakuraya, M.; Fukuda, T.; Shime, N.; Nakada, T.-A. Efficiency and Workload Reduction of Semi-automated Citation Screening Software for Creating Clinical Practice Guidelines: A Prospective Observational Study. J. Epidemiol. 2024, 34, 380–386. [Google Scholar] [CrossRef] [Scilit] [PubMed]
- Rohatgi, A. WebPlotDigitizer, Version 4.8. Available online: https://automeris.io/ (accessed on 7 July 2025).
- Atkinson, R.W.; Kang, S.; Anderson, H.R.; Mills, I.C.; Walton, H.A. Epidemiological time series studies of PM2.5 and daily mortality and hospital admissions: A systematic review and meta-analysis. Thorax 2014, 69, 660–665. [Google Scholar] [CrossRef] [Scilit] [PubMed]
- World Health Organization. Regional Office for Europe. Risk of Bias Assessment Instrument for Systematic Reviews Informing WHO Global Air Quality Guidelines; World Health Organization: Geneva, Switzerland, 2020. [Google Scholar]
- Bauleo, L.; Bucci, S.; Antonucci, C.; Sozzi, R.; Davoli, M.; Forastiere, F.; Ancona, C. Long-term exposure to air pollutants from multiple sources and mortality in an industrial area: A cohort study. Occup. Environ. Med. 2019, 76, 48–57. [Google Scholar] [CrossRef] [Scilit] [PubMed]
- Fano, V.; Michelozzi, P.; Ancona, C.; Capon, A.; Forastiere, F.; A Perucci, C. Occupational and environmental exposures and lung cancer in an industrialised area in Italy. Occup. Environ. Med. 2004, 61, 757–763. [Google Scholar] [CrossRef] [Scilit] [PubMed]
- Kioumourtzoglou, M.A.; Austin, E.; Koutrakis, P.; Dominici, F.; Schwartz, J.; Zanobetti, A. PM2.5 and Survival Among Older Adults: Effect Modification by Particulate Composition. Epidemiology 2015, 26, 321–327. [Google Scholar] [CrossRef] [Scilit] [PubMed]
- Li, C.; Ju, L.; Yang, M.; Zhang, Q.; Sun, S.; Cao, J.; Ding, R. Prenatal air pollution exposure increases the risk of macrosomia: Evidence from a prospective cohort study in the coastal area of China. Environ. Sci. Pollut. Res. 2022, 29, 5144–5152. [Google Scholar] [CrossRef] [Scilit] [PubMed]
- Matos, J.d.C.; Botelho, M.L.D.A.; Pamplona, Y.D.A.P.; Pereira, L.A.A.; Braga, A.L.F.; Martins, L.C. Self-reported prevalence of asthma symptoms in adults living in a port city. Environ. Sci. Pollut. Res. 2022, 29, 73519–73527. [Google Scholar] [CrossRef] [Scilit] [PubMed]
- Paolocci, G.; Bauleo, L.; Folletti, I.; Murgia, N.; Muzi, G.; Ancona, C. Industrial Air Pollution and Respiratory Health Status among Residents in an Industrial Area in Central Italy. Int. J. Environ. Res. Public Health 2020, 17, 3795. [Google Scholar] [CrossRef] [Scilit] [PubMed]
- Al Okla, S.M.; Rasbi, F.A.Z.K.A.; Al Marhubi, H.S.; Al Mataani, S.S.; Al Sawai, Y.M.; Mohammed, H.I.; Al Mamari, M.A.S.; Al Balushi, S.A.A.; Abbady, A.Q. The Impact of Air Pollution on Asthma Severity among Residents Living near the Main Industrial Complex in Oman: A Cross-Sectional Study. Int. J. Environ. Res. Public Health 2024, 21, 553. [Google Scholar] [CrossRef] [Scilit] [PubMed]
- Liu, W.Y.; Yi, J.P.; Shi, L.; Tung, T.H. Association Between Air Pollutants and Pediatric Respiratory Outpatient Visits in Zhoushan, China. Front. Public Health 2022, 10, 865798. [Google Scholar] [CrossRef] [Scilit] [PubMed]
- Gianicolo, E.A.L.; Bruni, A.; Mangia, C.; Cervino, M.; Vigotti, M.A. Acute effects of urban and industrial pollution in a government-designated “Environmental risk area”: The case of Brindisi, Italy. Int. J. Environ. Health Res. 2013, 23, 446–460. [Google Scholar] [CrossRef] [Scilit] [PubMed]
- Mentz, G.; Robins, T.G.; Batterman, S.; Naidoo, R.N. Acute respiratory symptoms associated with short term fluctuations in ambient pollutants among schoolchildren in Durban, South Africa. Environ. Pollut. 2018, 233, 529–539. [Google Scholar] [CrossRef] [Scilit] [PubMed]
- Ji, Y.; Liu, B.; Song, J.; Pan, R.; Cheng, J.; Su, H.; Wang, H. Particulate matter pollution associated with schizophrenia hospital re-admissions: A time-series study in a coastal Chinese city. Environ. Sci. Pollut. Res. 2021, 28, 58355–58363. [Google Scholar] [CrossRef] [Scilit] [PubMed]
- Liu, Y.; Sun, J.; Gou, Y.; Sun, X.; Li, X.; Yuan, Z.; Kong, L.; Xue, F. A Multicity Analysis of the Short-Term Effects of Air Pollution on the Chronic Obstructive Pulmonary Disease Hospital Admissions in Shandong, China. Int. J. Environ. Res. Public Health 2018, 15, 774. [Google Scholar] [CrossRef] [Scilit] [PubMed]
- Tian, L.; Ho, K.-F.; Louie, P.K.; Qiu, H.; Pun, V.C.; Kan, H.; Yu, I.T.; Wong, T.W. Shipping emissions associated with increased cardiovascular hospitalizations. Atmos. Environ. 2013, 74, 320–325. [Google Scholar] [CrossRef] [Scilit]
- Willers, S.M.; Jonker, M.F.; Klok, L.; Keuken, M.P.; Odink, J.; Elshout, S.v.D.; Sabel, C.E.; Mackenbach, J.P.; Burdorf, A. High resolution exposure modelling of heat and air pollution and the impact on mortality. Environ. Int. 2016, 89–90, 102–109. [Google Scholar] [CrossRef] [Scilit] [PubMed]
- Yang, L.; Yang, J.; Liu, M.; Sun, X.; Li, T.; Guo, Y.; Hu, K.; Bell, M.L.; Cheng, Q.; Kan, H.; et al. Nonlinear effect of air pollution on adult pneumonia hospital visits in the coastal city of Qingdao, China: A time-series analysis. Environ. Res. 2022, 209, 112754. [Google Scholar] [CrossRef] [Scilit] [PubMed]
- Yoo, S.-E.; Park, J.-S.; Lee, S.H.; Park, C.-H.; Lee, C.-W.; Lee, S.-B.; Yu, S.D.; Kim, S.-Y.; Kim, H. Comparison of Short-Term Associations between PM2.5 Components and Mortality across Six Major Cities in South Korea. Int. J. Environ. Res. Public Health 2019, 16, 2872. [Google Scholar] [CrossRef] [Scilit] [PubMed]
- Rahim, N.A.; Zaki, R.A.; Yahya, A.; Mahiyuddin, W.W. Acute effects of air pollution on cardiovascular hospital admissions in the port district of Klang, Malaysia: A time-series analysis. Atmos. Environ. 2024, 333, 120629. [Google Scholar] [CrossRef] [Scilit]
- Su, J.G.; Vuong, V.; Shahriary, E.; Jacobsen, J.; Balmes, J.; Barrett, M. Impacts of port and locomotive-related air pollution on respiratory symptoms within vulnerable communities in Southern California. Environ. Int. 2025, 202, 109618. [Google Scholar] [CrossRef] [Scilit] [PubMed]
- McGuinness, L.A.; Higgins, J.P.T. Risk-of-bias VISualization (robvis): An R package and Shiny web app for visualizing risk-of-bias assessments. Res. Syn. Meth. 2020, 12, 1–7. [Google Scholar] [CrossRef] [Scilit] [PubMed]
- Lin, H.; Tao, J.; Qian, Z.; Ruan, Z.; Xu, Y.; Hang, J.; Xu, X.; Liu, T.; Guo, Y.; Zeng, W.; et al. Shipping pollution emission associated with increased cardiovascular mortality: A time series study in Guangzhou, China. Environ. Pollut. 2018, 241, 862–868. [Google Scholar] [CrossRef] [Scilit] [PubMed]
- Kayalar, Ö.; Rajabi, H.; Konyalilar, N.; Mortazavi, D.; Aksoy, G.T.; Wang, J.; Bayram, H. Impact of particulate air pollution on airway injury and epithelial plasticity; underlying mechanisms. Front. Immunol. 2024, 15, 1324552. [Google Scholar] [CrossRef] [Scilit] [PubMed]
- Fussell, J.C.; Jauniaux, E.; Smith, R.B.; Burton, G.J. Ambient air pollution and adverse birth outcomes: A review of underlying mechanisms. BJOG Int. J. Obstet. Gynaecol. 2024, 131, 538–550. [Google Scholar] [CrossRef] [Scilit] [PubMed]
- Fathieh, S.; Grieve, S.M.; Negishi, K.; Figtree, G.A. Potential Biological Mediators of Myocardial and Vascular Complications of Air Pollution—A State-of-the-Art Review. Heart Lung Circ. 2023, 32, 26–42. [Google Scholar] [CrossRef] [Scilit] [PubMed]
- Jian, Y.; Tong, R.; Dai, Z.; Li, H.; Yan, Z.; Ai, Y.; Yang, Y.; Liu, X.; Yu, J.; Zhang, S. Multifunctional Aerogel-Structured Metafabrics Assembled by Hierarchically Porous Microsphere/Nanofibril. Adv. Mater. 2026, 38, e21428. [Google Scholar] [CrossRef] [Scilit] [PubMed]
- Elkafas, A.G.; Seddiek, I.S. Application of renewable energy systems in seaports towards sustainability and decarbonization: Energy, environmental and economic assessment. Renew. Energy 2024, 228, 120690. [Google Scholar] [CrossRef] [Scilit]
- Rathod, S.; Edwards, M.R.; Roy, C.; Warnecke, L.; Rafaj, P.; Kiesewetter, G.; Klimont, Z. Air quality and health effects of a transition to ammonia–fueled shipping in Singapore. Environ. Res. Health 2023, 1, 041002. [Google Scholar] [CrossRef] [Scilit]
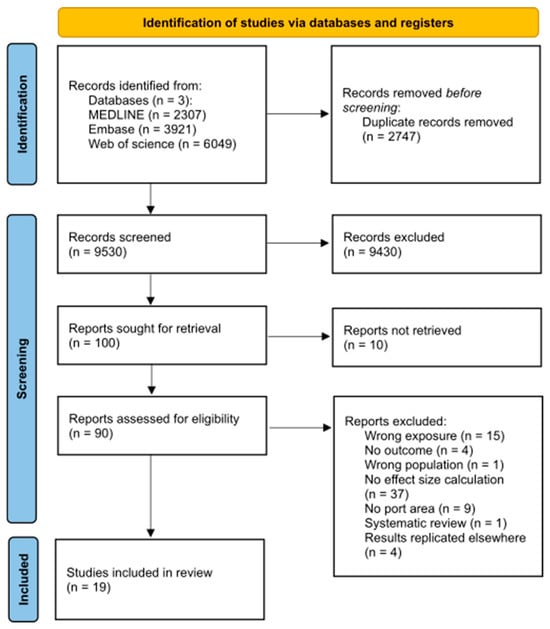
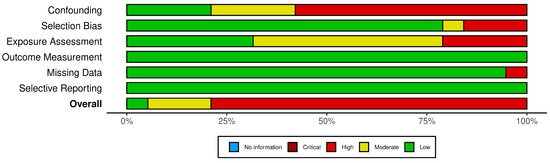
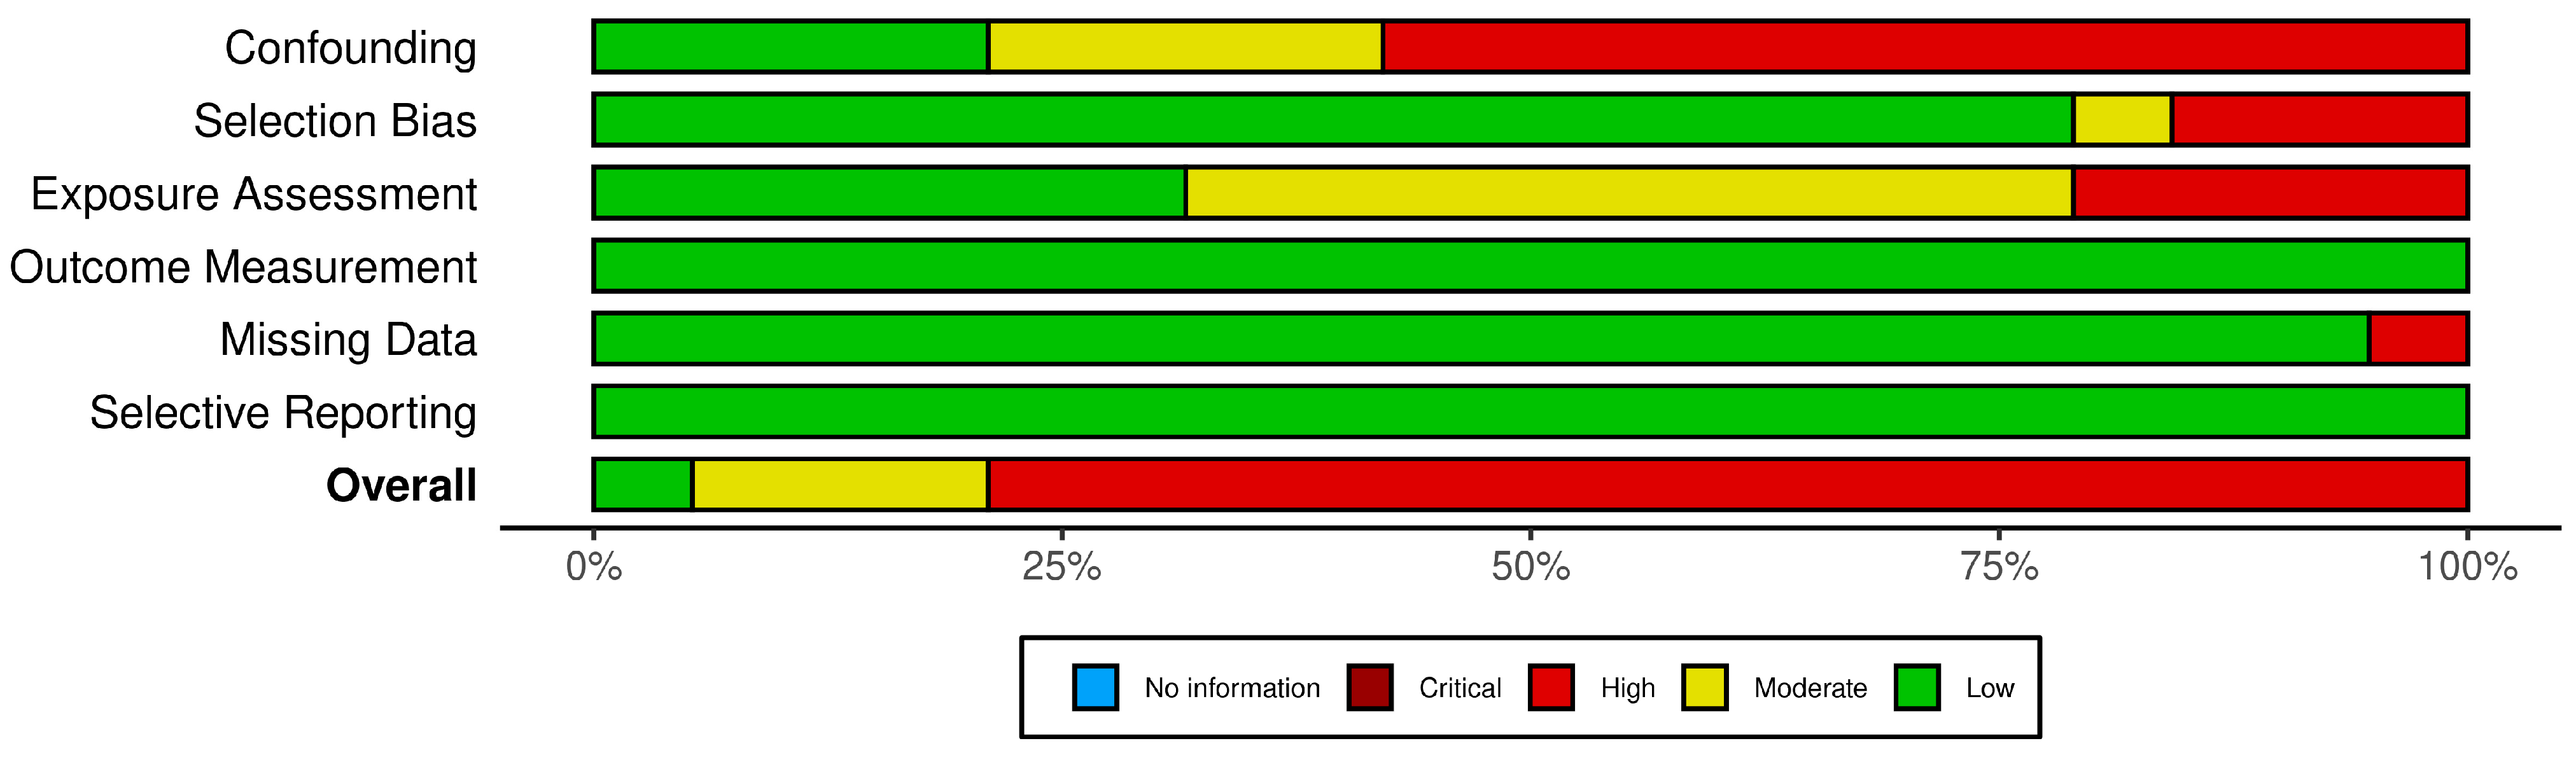
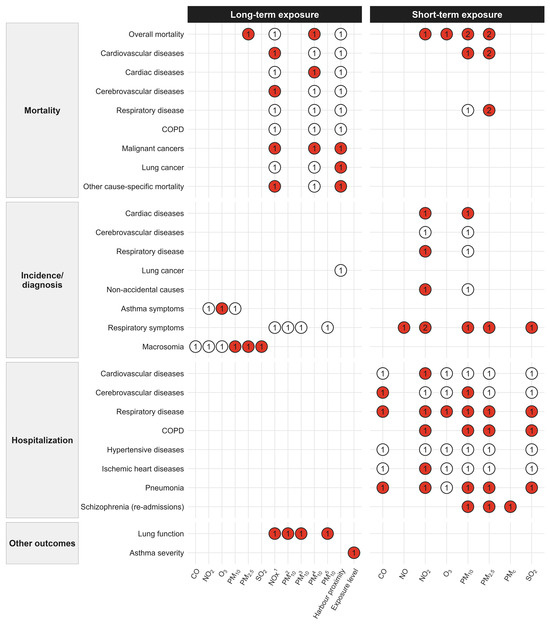
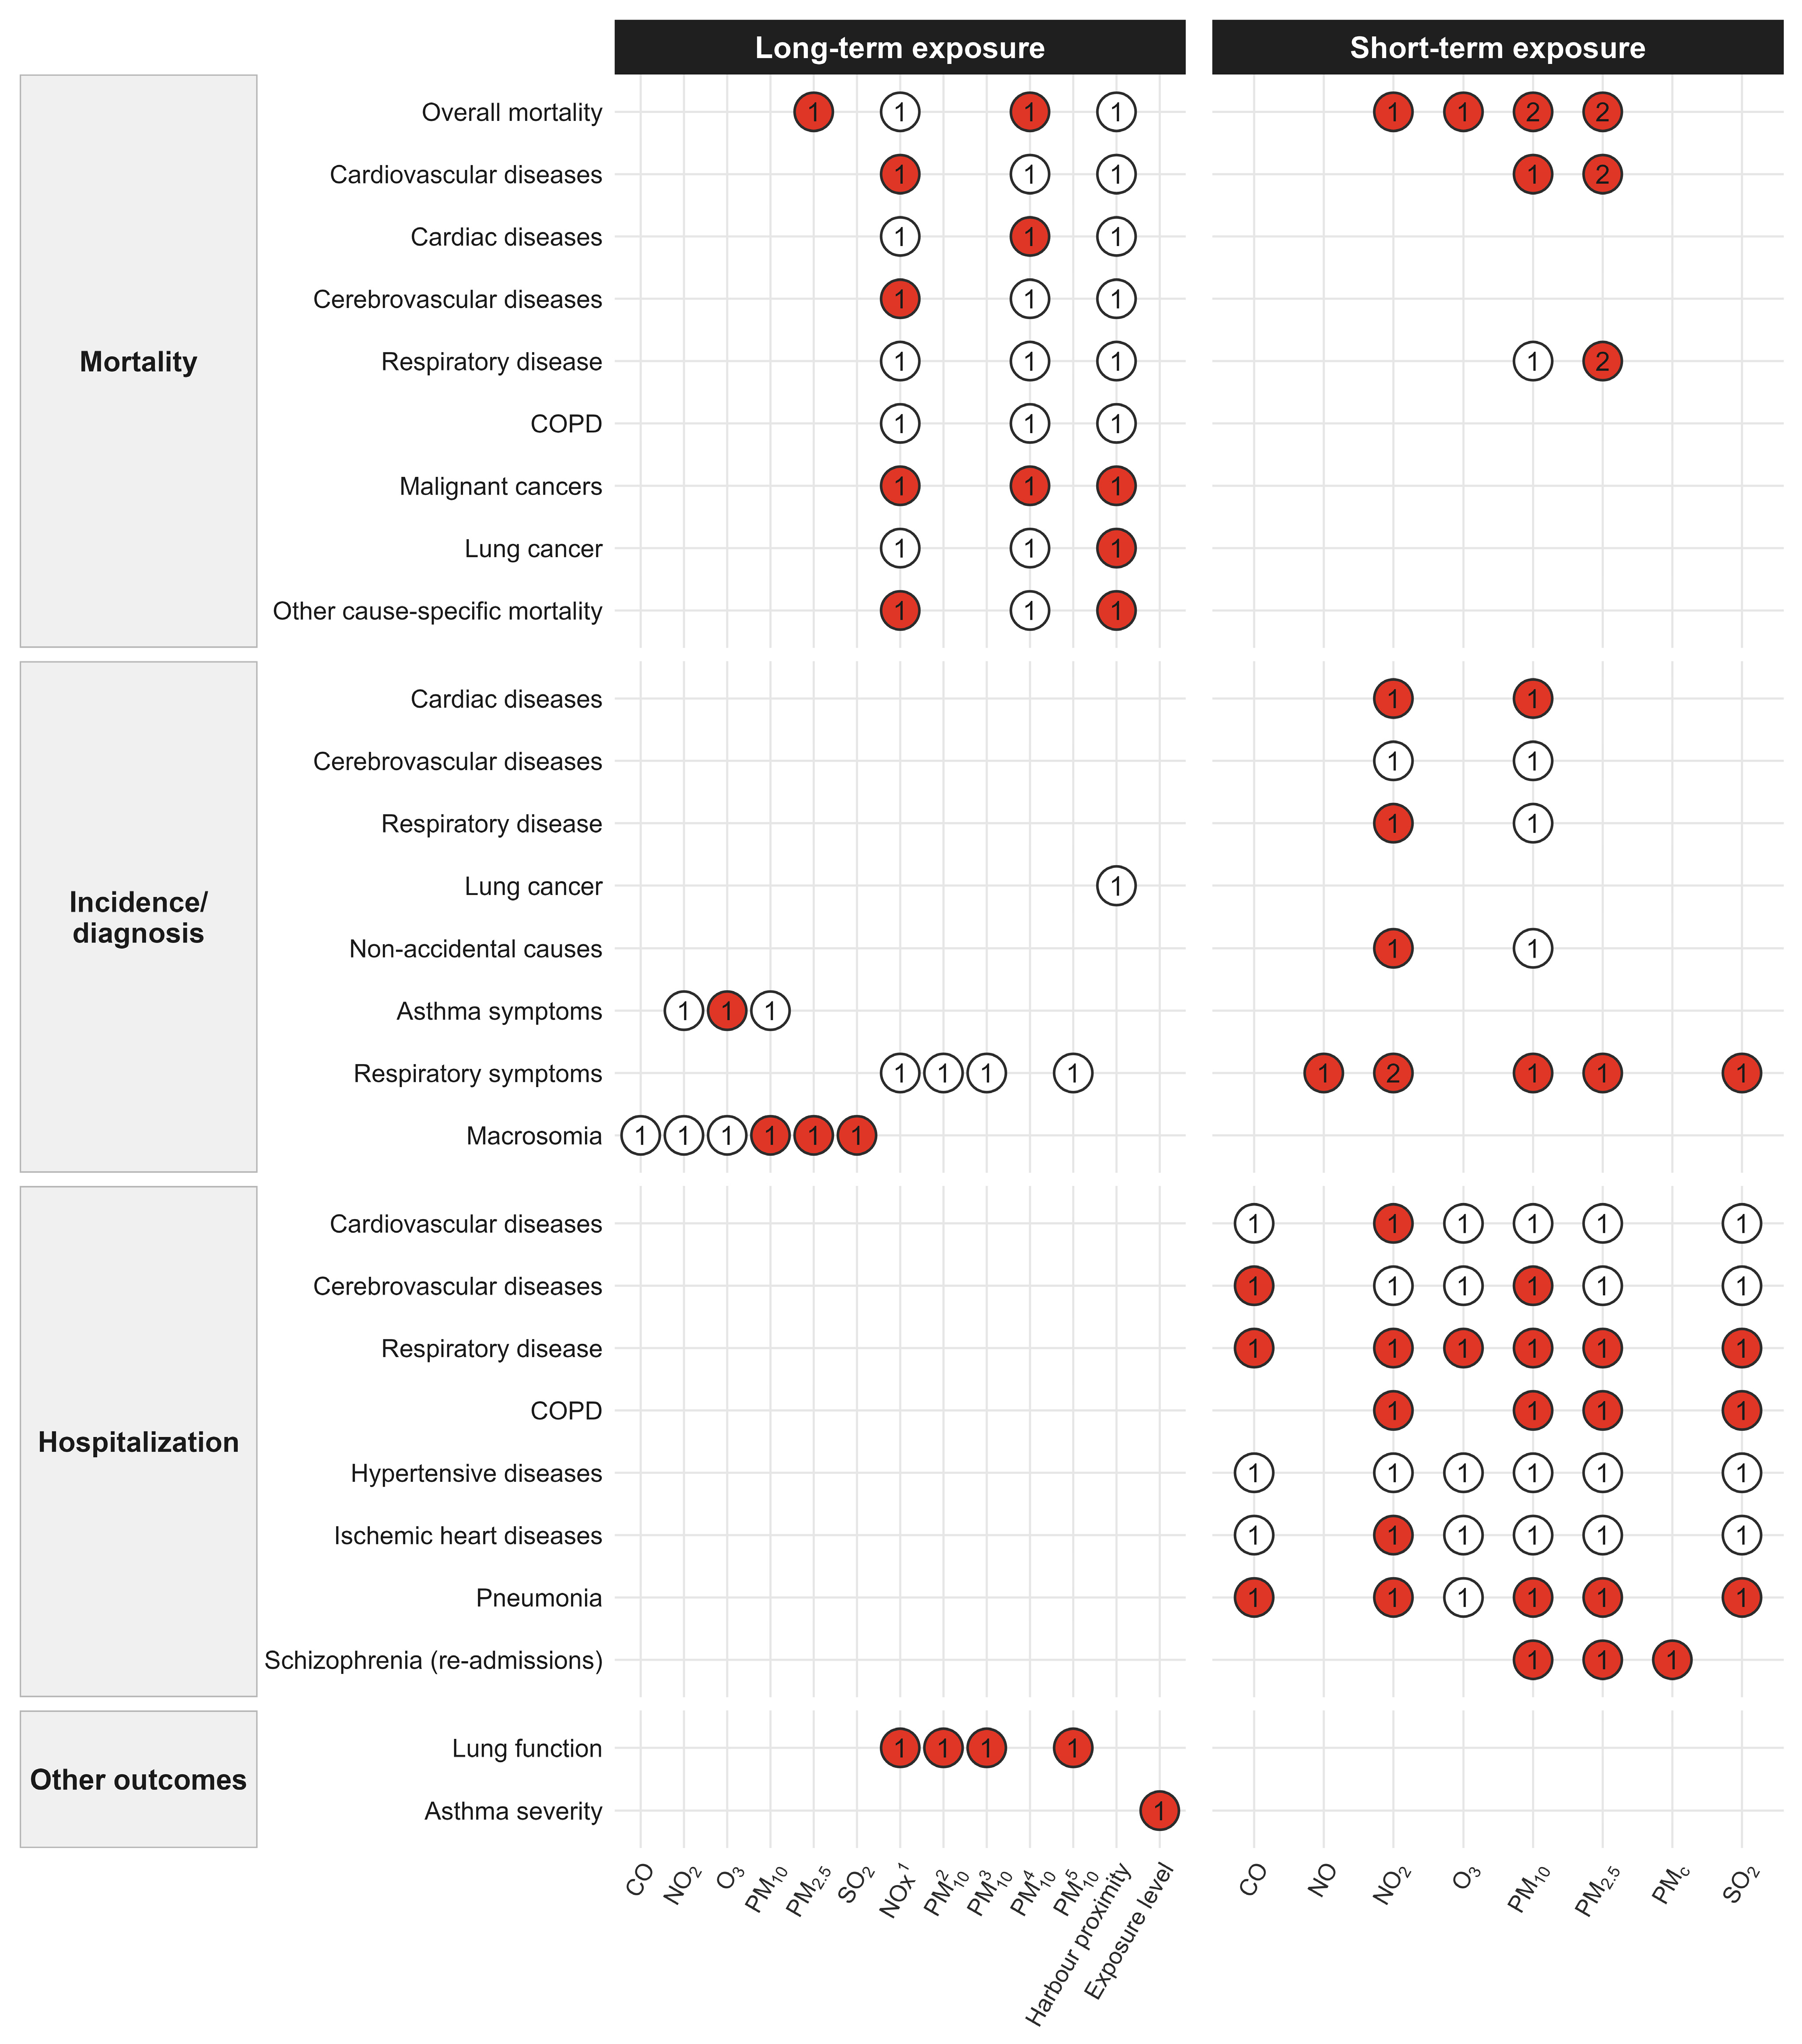
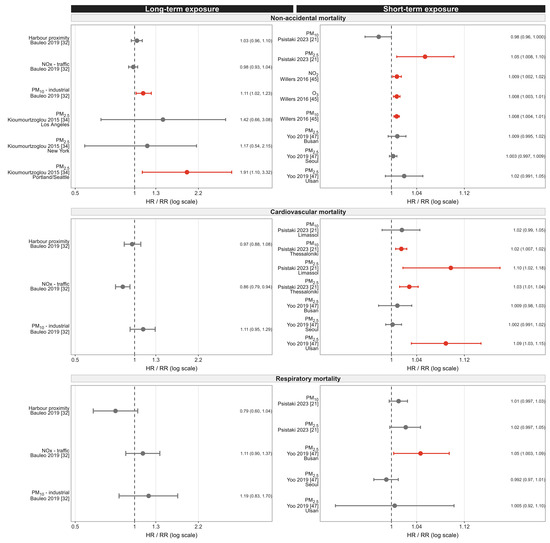
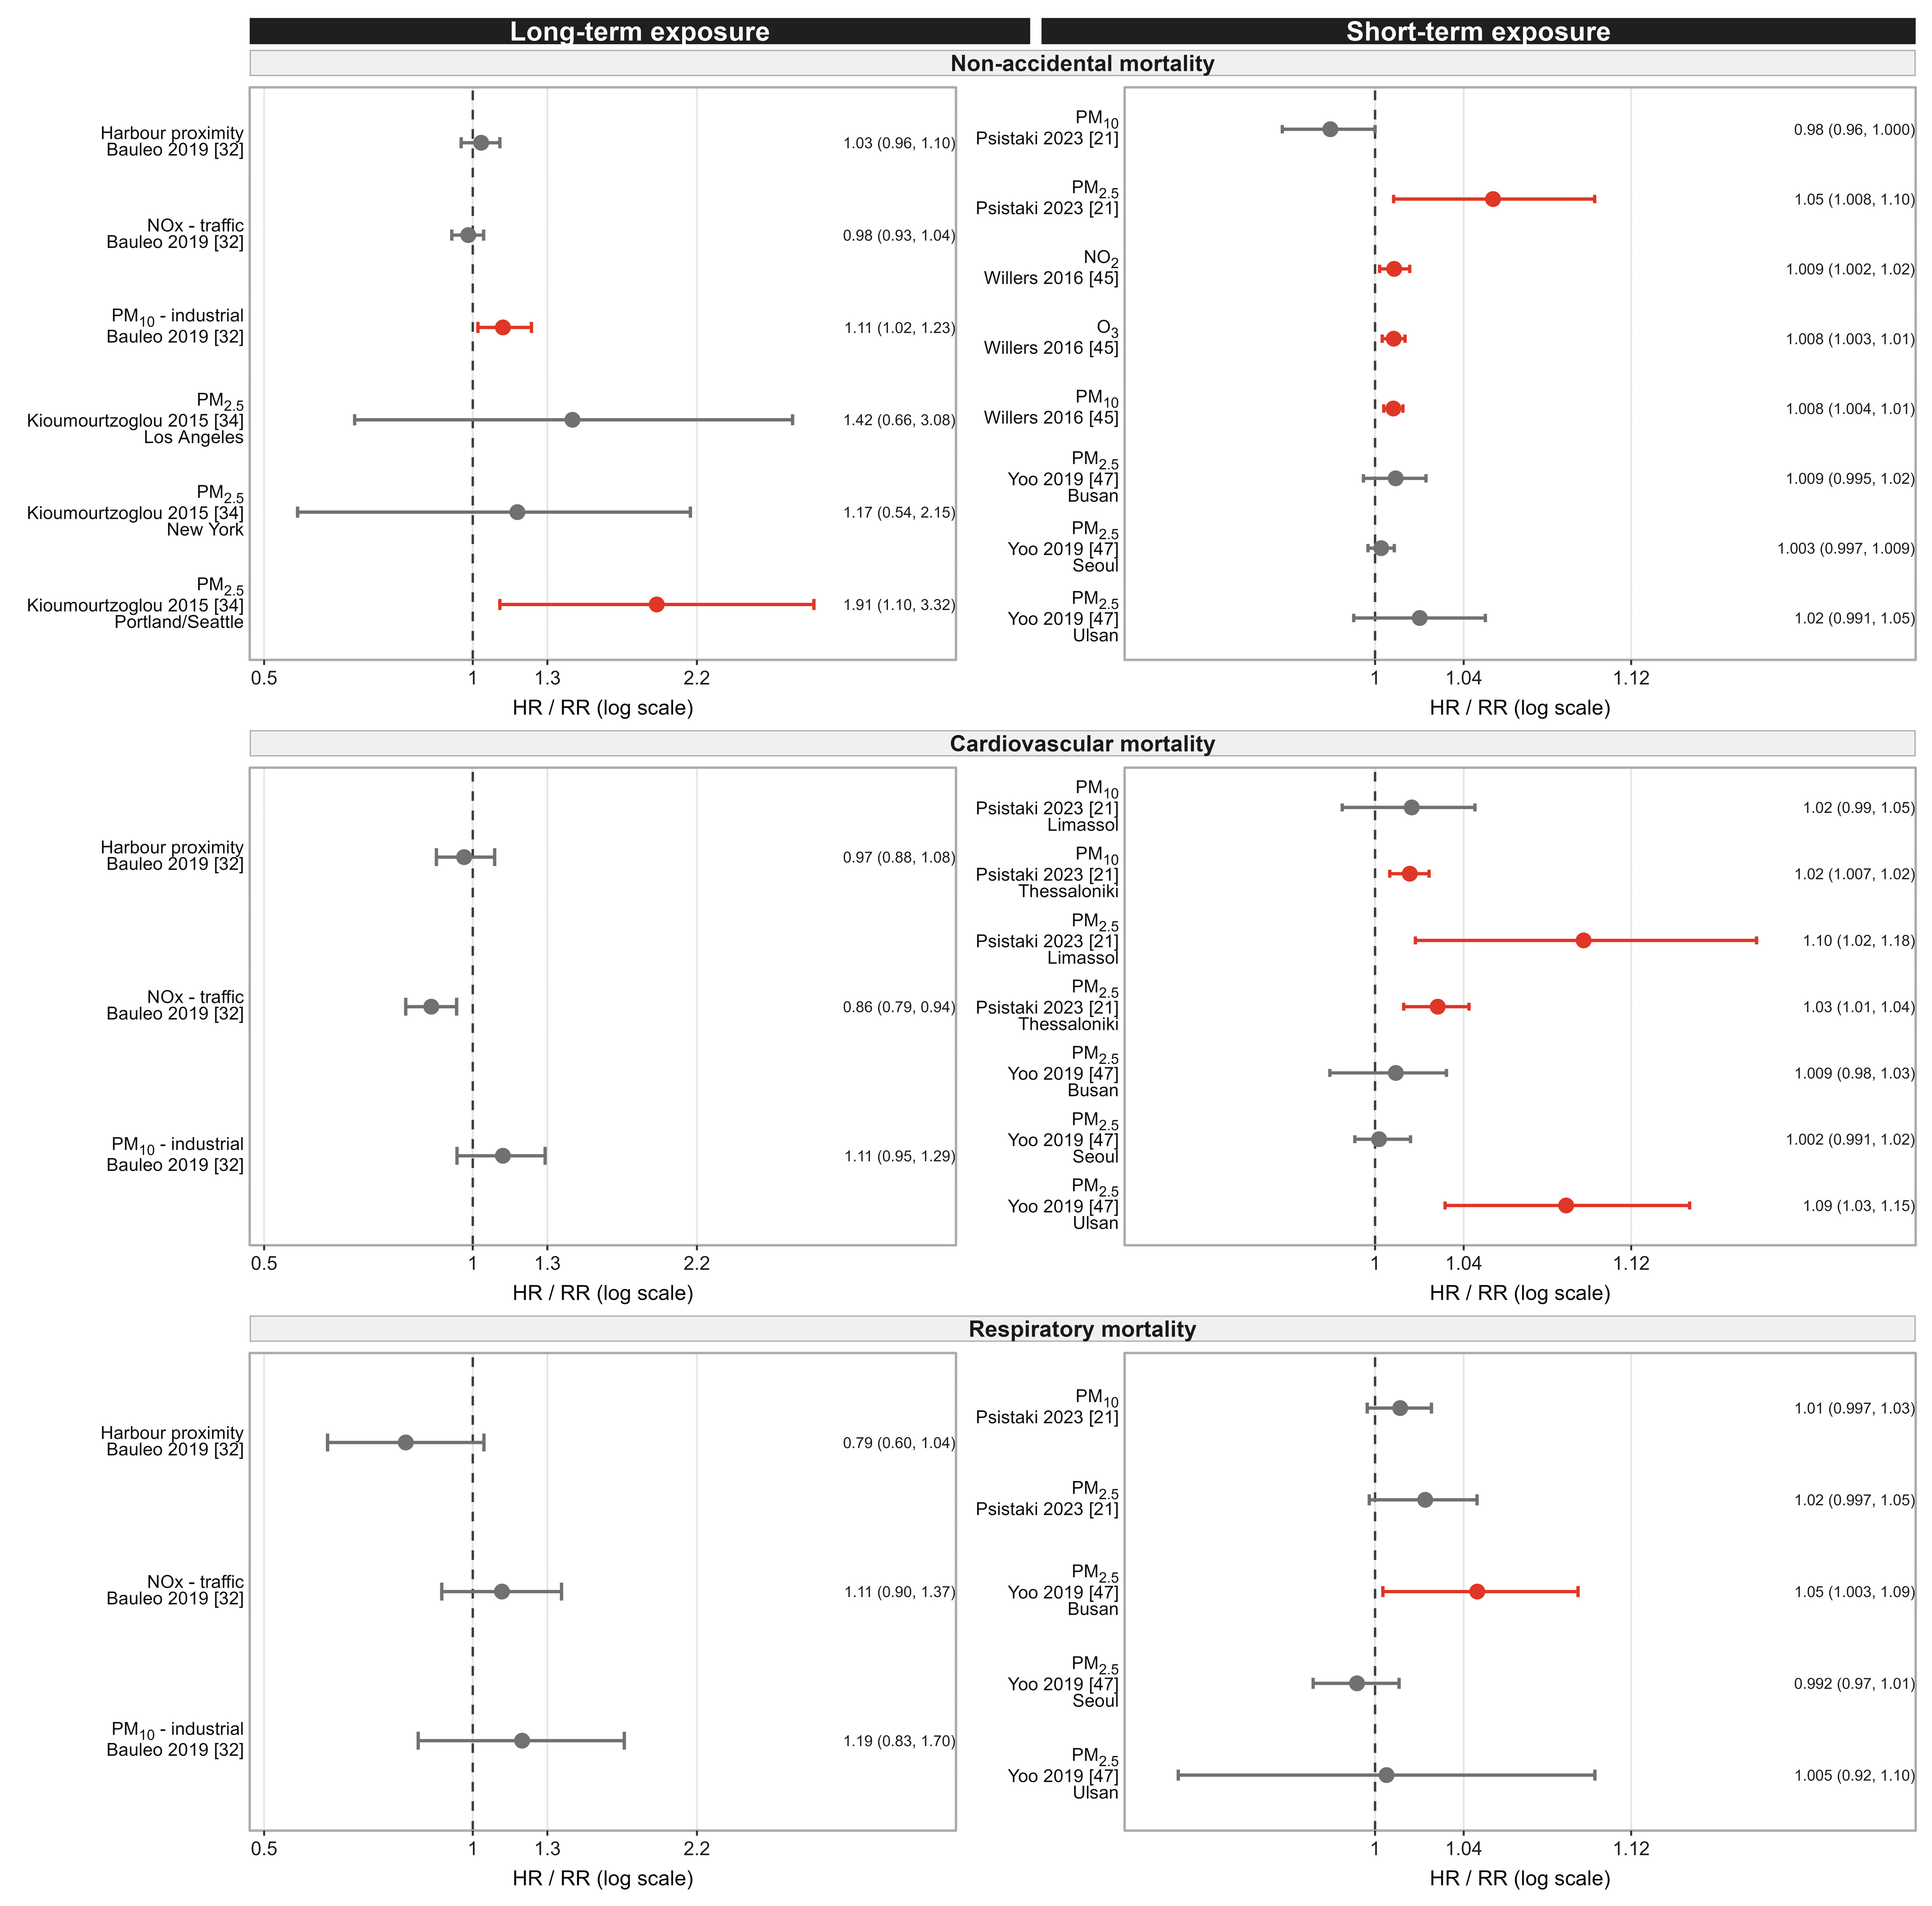

Disclaimer/Publisher’s Note: The statements, opinions and data contained in all publications are solely those of the individual author(s) and contributor(s) and not of MDPI and/or the editor(s). MDPI and/or the editor(s) disclaim responsibility for any injury to people or property resulting from any ideas, methods, instructions or products referred to in the content. |
© 2026 by the authors. Licensee MDPI, Basel, Switzerland. This article is an open access article distributed under the terms and conditions of the Creative Commons Attribution (CC BY) license.