


Abstract
Meteorology drives the day-to-day pollution variation behind short-term health effects, and its misattribution biases exposure estimates and trend normalisation. Wind speed and boundary-layer height (BLH), the main dispersion variables, are strongly collinear (mean r ≈ 0.70, 0.81 on anomalies), with contested relative roles. We quantified their unique variances with semi-partial R2 for NO2, O3, PM10 and PM2.5 in France’s 10 largest cities (2018–2025), across four frames, from pooled levels to deseasonalised, de-trended anomalies, checked with generalised additive models and for wind direction. On pooled levels, BLH carries on average four times the unique variance of wind for NO2 and O3, and eight to ten for particulate matter, whereas their raw correlations with primary pollutants differ only 1.3- to 1.4-fold. This lead is robust for particulate matter, even with direction controlled. For O3, temperature dominates and humidity exceeds BLH on average, plausibly a photochemical signal. For NO2 it is partly seasonal: on anomalies they become comparable, and wind leads significantly only where regional winds are coherent. The NO2 contrasts define three city types, wind-dominated, transitional and BLH-dominated. Both remain significant for NO2 anomalies in every city, so normalisation models should retain both, with city-specific coefficients. BLH should become a first-tier predictor.
1. Introduction
Ambient air pollution is the leading environmental risk to human health. The Global Burden of Disease analysis for 2015 attributes 4.2 million premature deaths that year worldwide to ambient fine particulate matter (PM2.5, particles with an aerodynamic diameter below 2.5 µm) and a further 254,000 to ozone. Most of these deaths are due to cardiovascular and respiratory disease [1]. Its 2021 update confirms ambient particulate matter among the leading global risk factors [2]. For 2015, the corresponding loss of life expectancy is comparable to that of the major behavioural risk factors [3]. In Europe the burden is concentrated in cities. Using 2015 exposure data, a health impact assessment across 969 European cities estimates that compliance with the WHO air quality guidelines then in force would prevent about 51,000 deaths a year from PM2.5 alone [4]. Large European cohorts confirm adverse effects at the low concentrations typical of western European cities and find no evidence of a threshold below which risk disappears [5,6]. Nitrogen dioxide (NO2), ozone (O3) and particulate matter (PM10, particles with an aerodynamic diameter below 10 µm, a fraction that includes PM2.5) remain the regulated pollutants of greatest public-health relevance. The systematic reviews that underpin the current guideline values quantify their short-term and long-term associations with mortality [7,8,9,10], and traffic-related exposure, dominant in city centres, carries its own documented effects [11]. Multi-city time-series analyses show that the day-to-day variation of concentration, and not only its long-term mean, is associated with daily mortality for particulate matter [12], for ozone [13] and for NO2 [14]. This is the variation that meteorology modulates, which is why its correct attribution matters beyond atmospheric science.
While emissions set the source strength, the day-to-day and seasonal variability of surface concentrations is governed substantially by meteorology, through dilution, dispersion, transport and deposition, and, for O3, photochemistry [15,16,17]. Daily meteorological variables alone can explain up to roughly half of the day-to-day variance of fine particulate matter [18]. Two meteorological controls dominate the dilution of primary pollutants. The height of the atmospheric (planetary) boundary layer (BLH) sets the vertical volume into which surface emissions are mixed. A shallow, stable layer concentrates pollutants near the ground, whereas a deep, well-mixed layer dilutes them [15,19,20,21,22]. Horizontal wind speed ventilates the urban canopy and advects pollutants away from their sources [16,23]. Both quantities are inversely related to primary-pollutant concentrations, and pollution episodes typically coincide with shallow boundary layers, weak winds and persistent anticyclonic stagnation [20,24,25]. Their combination, the product of mixing depth and transport wind, called the ventilation coefficient, has indexed a region’s pollution potential since Holzworth [26] and remains in use through formulations based on the ERA5 reanalysis [27]. ERA5 is the fifth-generation global atmospheric reanalysis of the European Centre for Medium-Range Weather Forecasts. It assimilates the historical observing system into a frozen forecast model and delivers a physically consistent, gap-free hourly record of surface and upper-air variables from 1940 onward, on a 0.25° grid [28].
These two controls are, however, strongly and physically coupled, and this coupling is the central problem the present study addresses. Mechanical and convective mixing both deepen the boundary layer on windy, well-ventilated days, so wind speed and boundary-layer height covary on diurnal, synoptic and seasonal timescales [29]. The two variables nonetheless represent physically distinct dispersion pathways, horizontal advection for wind and vertical mixing volume for BLH. The literature remains divided on their relative importance. Some studies emphasise ventilation, others vertical mixing, often on the basis of univariate correlations or variable-importance rankings that do not isolate the variance unique to each driver, and that therefore attribute the shared variance to whichever variable is included [20,30,31,32]. When two collinear predictors compete, a poorly specified model systematically overstates the role of the one it retains [33]. The methodological consequence is that univariate wind regression cannot be read as capturing horizontal advection alone, because a large part of its apparent signal is variance shared with boundary-layer height. Conversely, once that shared part is handled, the wind term becomes usable: isolating the wind contribution to recover the local-source component of a PM2.5 trend has been demonstrated for Paris [34].
A further reason to treat the two pathways separately is that gases and particles are not transported and removed in the same way. For a gas such as NO2 or O3, dispersion is a matter of advection, mixing volume and chemistry, and the atmospheric lifetime is short and set by photochemistry [35]. Particles add mechanisms that have no gaseous counterpart. Their gravitational settling and dry deposition velocities depend on diameter, density and shape [36]. Their removal by precipitation is strongly size-selective, and observations in French cities show that rain scavenges coarse particles efficiently while leaving the accumulation mode almost untouched [37]. Their radiative properties feedback on the boundary layer that disperses them, since absorbing aerosols warm the upper layer and suppress its growth [38,39,40]. Their residence time is consequently longer and more variable than that of the reactive gases [41]. A decomposition of meteorological control should therefore be expected to differ between the gaseous and the particulate species, and this expectation is borne out below.
In addition, boundary-layer height is largely absent from operational and empirical urban air-quality analysis in Europe, although it sets the volume into which pollutants are mixed. Its role in particle accumulation has been documented mainly in Chinese megacities [20,42]. In Europe, its variability has been described chiefly by dedicated lidar, ceilometer and profiling campaigns [43,44,45]. ERA5 now provides a continuous, hourly boundary-layer-height field co-located with every city [28,46], making a systematic continental treatment feasible. Normalisation studies that already include boundary-layer height hint that distinct regimes drive different pollutants [30,47], yet a systematic multi-city decomposition of the unique wind and boundary-layer contributions, across pollutants and frames, is lacking.
The apparent answer is, moreover, sensitive to two analytical choices that are seldom examined together. The first is whether the seasonal co-cycling of meteorology and pollution is controlled. The second is the temporal scale at which the series are aggregated. Over Europe, a few weather regimes alone explain 60 to 80% of the monthly variability of regional pollution [48]. Either choice can flip the apparent driver [49].
Here we quantify the unique contributions of wind speed, boundary-layer height and six other surface meteorological drivers to daily concentrations of NO2, O3, PM10 and PM2.5 across 10 major French cities (Paris, Lyon, Marseille, Toulouse, Lille, Nice, Bordeaux, Montpellier, Nantes and Strasbourg, Figure 1) over 2018–2025. The six other drivers are air temperature, surface pressure, relative humidity, total cloud cover, precipitation and wind direction. We use a validated, harmonised daily dataset (2922 days per city, 341,368 daily values) built from urban-background measurements of the French national air-quality database Geod’air [50], together with ERA5 boundary-layer height and surface meteorology [28], and an hourly record of nearly 8 million values across the four pollutants and eight meteorological variables.
Figure 1.
The 10 study cities and their mean meteorological setting (2018–2025). (a) Marker colour gives the mean boundary-layer height and marker size the mean 10 m wind speed (ERA5, land grid point). Arrows show the most frequent 45° wind sector, pointing downwind, and the second sector when its frequency reaches three quarters of the first. (b) Wind roses of the hourly ERA5 10 m wind: share of hours per 22.5° sector, by the direction from which the wind blows. Outline: Natural Earth, 1:50 m.
We address three questions. (i) Do wind and BLH carry distinct, separable information, and how does their balance differ among pollutants? (ii) To what extent is the dominance of boundary-layer dynamics an artifact of seasonal co-cycling rather than a within-season coupling? (iii) Does the wind/BLH balance organise into an interpretable urban-meteorological typology across cities? We show that the answers revise the simple reading in which boundary-layer dynamics govern day-to-day pollution into a picture specific to each pollutant and each city, with the wind–boundary-layer dissociation as the headline finding and with direct implications for exposure modelling and for the meteorological normalisation of air-quality trends. To our knowledge, no multi-city decomposition of the unique wind and boundary-layer contributions has ever been made for European cities under both seasonal and trend control, and none has been turned into a city typology. That typology is exploratory. It is meteorological rather than merely geographic, and it states which of the two terms, wind or BLH, carries the larger unique share of NO2 variance in a given city, or that neither clearly does.
2. Materials and Methods
2.1. Study Area and Data
2.1.1. Cities and Meteorological Setting
We study the 10 most populous French cities, which span contrasted climatic and topographic settings: flat oceanic plains (Lille, Nantes, Paris), continental valleys and plains (Strasbourg in the Rhine plain, Lyon in the Rhône–Saône corridor, Toulouse in the Garonne plain, reached by the Autan from the south-east and the Tramontane from the north-west), an Atlantic estuary (Bordeaux), Mediterranean coasts with powerful regional winds (Marseille, swept by the Mistral, a strong cold dry north-westerly wind, and Montpellier, by the Tramontane) and a sheltered coastal bay (Nice). The Mistral and the Tramontane are the two coherent regional wind systems of the French Mediterranean, and their climatology and effect on pollution transport and vertical mixing are documented [51,52]. The channelling of the lower Rhône valley and its interaction with the sea breeze around Marseille are equally well characterised [53]. Table 1 lists the 10 cities with their climate class, topographic setting, regional wind regime and prevailing wind. Figure 1 maps their geographic distribution together with the mean boundary-layer and wind climatology and the prevailing winds.
Table 1.
The 10 study cities: climate class, topographic setting, regional wind regime, prevailing wind and number of urban-background stations used. Köppen–Geiger climate classification. The regional wind regime column indicates the presence of a recurrent, near-unidirectional ventilating wind system. Prevailing wind: the two most frequent 45° sectors of the hourly ERA5 10 m wind, 2018–2025, by the direction from which the wind blows, with their share of hours (calms excluded).
2.1.2. Pollutant Data
Daily concentrations of NO2, O3, PM10 and PM2.5 were obtained from Geod’air, the French national air-quality database, for 1 January 2018 to 31 December 2025 (2922 days per city) [50]. Geod’air is managed by the Laboratoire Central de Surveillance de la Qualité de l’Air (LCSQA), on behalf of the ministry in charge of the environment [54]. The LCSQA is the national reference laboratory, a scientific interest group formed by Ineris, the Laboratoire national de métrologie et d’essais (LNE) and IMT Nord Europe [55,56]. Geod’air consolidates the regulatory measurements of the 18 Associations agréées de surveillance de la qualité de l’air (AASQA), the accredited regional monitoring associations [57], which operate nearly 650 measurement stations [55]. The instruments, the siting criteria and the validation procedures follow the requirements of the European ambient air quality directive [58], recast in 2024 [59], and the national implementation guide [60]. The measurements used here are therefore normative regulatory data, not research-grade or low-cost sensor data.
Only urban-background stations were used (influence type = background, setting = urban). In the European framework, urban-background locations are defined as places in urban areas where levels are representative of the exposure of the general urban population [58], and the French classification guide defines a background measurement as one not significantly influenced by any single source, but rather by the integrated contribution of many sources over a spatial scale of several kilometres to several tens of kilometres [60]. Only officially validated measurements (validity flag = 1) were retained. Invalid, zero and negative values were discarded before averaging, a negative concentration being a calibration artefact rather than a measurement. Where a city has several urban-background stations, the daily value is the mean of the available validated, non-null station values. Over the period, as stations closed and opened, the series draw on seven stations in Paris for NO2 and three or four for the other pollutants, never more than six on the same day, on three in Strasbourg (two for PM10, one for O3), on two in Lyon and Marseille (one for O3 at Marseille), and on one elsewhere. The stations, their codes and their years of valid data are listed in Table S1. Every series was checked day by day against the validated hourly data reported to the European Environment Agency, which it reproduces to rounding, except Paris PM10 in 2019 (mean deviation 1.0 µg m−3), a deviation that does not affect the results (Table S1). In Lille, the urban-background station Lille Fives (FR11025), the only one in the agglomeration that measures the four pollutants over 2018–2021, stops in January 2022, so the Lille series covers 2018–2021.
Using urban-background stations only is a deliberate choice, with two consequences. First, it excludes traffic-proximate measurements, which would overstate the apparent local ventilation signal. Second, urban-background sites integrate the urban air mass rather than sampling vehicular plumes, so they track synoptic-scale meteorology more closely, which is the signal this study decomposes.
2.1.3. Meteorological Data
All meteorological variables come from the ERA5 reanalysis [28]. ERA5 is provided on a regular 0.25° × 0.25° grid, about 28 km in latitude and, at the latitudes of the 10 cities (43° N to 51° N), 18 to 20 km in longitude. For each city, a single grid cell was used, the one co-located with the city centre, and all variables were extracted from that same cell and aggregated to daily values. No spatial averaging over the urban area was performed, since a 0.25° cell already covers an area of the order of the agglomeration itself. Units are the same for the 10 cities: air temperature in °C, relative humidity in %, surface pressure in hPa, total cloud cover in %, precipitation in mm, wind speed in km h−1, wind direction in degrees clockwise from north (the direction from which the wind blows) and boundary-layer height in m. Daily values are means over the UTC day, except precipitation, a daily total, and wind direction, the direction of the daily vector-mean wind.
Boundary-layer height in ERA5 is diagnosed from a bulk Richardson-number criterion applied to the model profile [46]. Before use, we verified that each city is represented by a land grid point. For the coastal cities, the grid cell nearest the city centre initially returned by the extraction was in some cases a sea point. A sea point is recognisable by two signatures, a nearly flat diurnal cycle of BLH and a seasonal cycle in opposite phase to the land cycle, with maxima in winter instead of summer. Where such a cell was found, we moved the extraction to the nearest cell whose ERA5 land–sea mask value exceeds 0.5, checked that the diurnal amplitude and the seasonal phase had recovered their land signatures, and used that cell throughout. This correction matters, because a sea grid point inflates the apparent independent effect of wind. The full procedure and the affected cities are documented with the dataset.
The surface meteorological parameters extracted are wind speed at 10 m above the ground (km h−1), air temperature and relative humidity at 2 m, surface pressure, total cloud cover and precipitation. These reanalysis fields enter our statistical regression models as explanatory variables and are referred to as predictors only in that statistical sense. The primary statistical model uses the seven parameters available for all 10 cities: wind speed, BLH, temperature, pressure, cloud cover, precipitation and relative humidity. The eighth variable, wind direction, is circular, so a single linear coefficient cannot represent it. It enters an augmented model through a Fourier block, which also tests whether the wind and BLH results depend on its omission (Section 2.2.5). Table 2 gives the 2018–2025 descriptive statistics of the pollutants and of the main meteorological parameters.
Table 2.
Descriptive statistics, 2018–2025 (mean, with the SD below it), computed from the empirical record at urban-background stations. Wind, 10 m wind speed. T, 2 m temperature. P, surface pressure. BLH, boundary-layer height (ERA5). Pollutants in µg m−3, Lille over 2018–2021. Pressure is a period mean at the ERA5 surface height of the grid cell, which explains the differences between cities.
The concentration levels in Table 2 are moderate by international standards. Period means of PM2.5 range from 8.5 to 13.7 µg m−3 and of PM10 from 14.8 to 19.2 µg m−3 (Lille over 2018–2021). They are several times lower than those of the Asian megacities where the boundary-layer control of particulate matter has mostly been documented [20,42]. They nonetheless exceed the current WHO annual guideline value for PM2.5, 5 µg m−3, in every city, and that for PM10, 15 µg m−3, in nine of the ten, by less than 0.3 µg m−3 in three of them, Toulouse (14.8 µg m−3) being just below [10]. The regime studied here is thus a low-to-moderate concentration regime, which is also the regime of most western European cities.
2.1.4. Data Harmonisation, Quality and Reservations
Because predictors are standardised before fitting, units do not affect the variance metrics or the statistical tests. The meteorological series are complete. Missing-data rates of the pollutant series are below 1% in 14 of the 40 series and below 4% in 30, and highest at Bordeaux (7–14%) and at Lille (8–15% over 2018–2021). Complete cases are used per city × pollutant. The Lille series covers 2018–2021 only, with 1239 to 1346 valid days per pollutant. Complete-case samples therefore range from 1239 (Lille, PM2.5) to 2922 (Paris, Marseille and Lyon). Excluding Lille changes none of the conclusions (Table S2). Because at n ≈ 2900 even very weak effects reach statistical significance, effect size and significance are reported as separate dimensions throughout (Section 2.2.3).
2.2. Statistical Approach
2.2.1. Bivariate Correlation: The Macro-Pattern and the Collinearity
We first computed Pearson correlations between each meteorological variable and each pollutant for every city, a 10 × 7 × 4 matrix. This establishes the macro-pattern (Figure 2) and, above all, the collinearity that motivates everything after it. The ten-city mean correlation matrix of the seven parameters and the four pollutants is given in Table S3. Wind and BLH covary strongly, with a mean r(wind, BLH) ≈ 0.70 across the 10 cities and a range of about +0.58 to +0.80 (Figure 3). Bivariate correlation is blind to confounding. A negative wind–NO2 correlation may reflect direct ventilation, a shared seasonal cycle with temperature, or a shared origin in boundary-layer variation. It cannot, on its own, separate horizontal advection from vertical mixing.
Figure 2.
The bivariate macro-pattern: Pearson correlation of each surface meteorological predictor with each pollutant, for every city (pooled daily levels). For the primary species (NO2, PM10, PM2.5) boundary-layer height and wind speed correlations are negative, and pressure correlations are positive in every city. For O3 the pattern reverses, with boundary-layer height and, above all, temperature strongly positive and relative humidity negative.
Figure 3.
The wind–boundary-layer collinearity that motivates the variance partitioning. (a) Daily 10 m wind speed against boundary-layer height at Paris (hexbin density plot, in which the plane is tiled with hexagons shaded by the number of days they contain; n = 2922 days) with the least-squares line. The two covary strongly (r = 0.72). (b) Pearson r(wind, BLH) for each city in the pooled daily frame (blue bars) and on deseasonalised monthly anomalies (orange bars). Dashed lines mark the ten-city means, 0.70 and 0.81.
2.2.2. Multivariate Variance Partitioning with Semi-Partial R2
Wind speed and boundary-layer height covary strongly. A raw correlation between a pollutant and one of them therefore cannot tell which of the two owns the part of the pollutant variance that both explain equally well. To attribute the variance unique to each driver under this collinearity, we fitted a multivariate model of each pollutant on the seven standardised predictors. Each predictor is credited with its semi-partial R2 (sr2). This is the increase in the R2 of the model obtained when that predictor is added last, all others being already present. It measures the variance that this predictor alone can explain [61]. sr2 is a statistical attribution. It measures the variance a predictor explains beyond all the others, not the causal effect of the process it stands for. The partial R2 (pr2) is reported alongside. It is the same increase expressed as a fraction of the variance still unexplained before the predictor is added, so it is always at least as large as sr2 and answers a different question, namely how much of what is left the predictor accounts for. We avoid relative-importance decompositions such as LMG or Shapley averaging [62], which re-allocate shared variance and overstate a collinear predictor. sr2 assigns the shared wind–BLH variance to neither driver but quantifies it explicitly, which is the diagnostic we need [33,63] (Figure 4).
Figure 4.
Semi-partial R2 as the unique-variance metric under wind–boundary-layer collinearity (schematic). (a) The variance of a pollutant partitioned between the two collinear drivers: sr2(wind) and sr2(BLH) are the variances unique to each (the non-overlapping crescents), while the shared wind–BLH variance (the overlap, reflecting r ≈ 0.70) is assigned to neither. The remainder is other predictors and unexplained variance. (b) The three metrics treat that shared variance differently (see text). Proportions are illustrative.
The primary decomposition uses ordinary least squares, for interpretability and because the significance of each sr2 is then that of a single coefficient (Section 2.2.3). Linear additivity is violated for several known relationships, including the threshold behaviour of PM2.5 at low wind, the non-linear ozone–temperature dependence and the saturation of BLH at high values. We therefore refit every city × pollutant model as a generalised additive model (GAM), in which each predictor enters through a smooth function estimated from the data instead of a single slope [64]. Each smooth is a penalised regression spline with 10 basis functions [65], and the smoothing parameter is selected by minimising the generalised cross-validation score over a grid of 10 values from 1 to 106 [64]. Restricted maximum likelihood is the usual alternative to cross-validation for that choice [66]. Effective degrees of freedom above one flag non-linearity. The two models are compared in explained variance in the Results. The full forty-pair comparison is given in Table S4. Its computation was checked against an independent implementation of the same specification. To check that the ranking of sr2 is not an artefact of the linear form, we also compute the GAM analogue of sr2. The unique contribution of a smooth is the drop in R2 when it is removed, the reduced model keeping the smoothing parameter of the full model. This is done for wind and BLH, for the four pollutants in the pooled frame and on the fourth rung, and for NO2 on the third rung (Table S5). Unless stated otherwise, the sr2 values below are from the linear model.
2.2.3. Significance Versus Effect Size
Statistical significance uses heteroskedasticity and autocorrelation consistent (HAC) standard errors. An HAC estimator corrects the variance of the regression coefficients for two departures from the standard assumptions, non-constant residual variance and serial correlation of the residuals, which are both present in daily air-quality series. We use the Newey–West estimator with a Bartlett kernel [67]. Its truncation lag is selected for each model by the automatic procedure of Newey and West [68], and ranges from 5 to 29 days (median 21). For a single added regressor, the classical nested F-test of sr2 equals the squared ordinary t-statistic of its coefficient and assumes independent, homoskedastic errors. Its robust counterpart is the HAC Wald test, the squared ratio of the coefficient to its HAC standard error, compared with a χ2 distribution with one degree of freedom. We report both (Table S6). Significance and effect size are therefore two separate dimensions. sr2 and pr2 measure how much a predictor explains, the HAC test whether that amount differs from zero. This separation matters at n ≈ 2900, where even very weak effects are statistically significant.
2.2.4. Sequence of Analytical Frames
The unique-variance attribution holds within a given body of data. It does not, on its own, say whether that attribution reflects an immediate physical response or a shared seasonal rhythm. Wind, boundary-layer height and concentration co-cycle over the year. In winter, weak winds, shallow layers, anticyclonic inversions and heating emissions coincide. A pooled decomposition can therefore credit this seasonal coincidence to whichever driver carries the clearest seasonal signal, which is the boundary layer. To separate the immediate coupling from the seasonal one, we recompute the decomposition across four frames, ordered by how much low-frequency covariation each removes.
(i) Pooled levels. All daily values of each city (up to 2922), every season together. This is the baseline and the most exposed to seasonal confounding, since the full annual cycle enters the attribution.
(ii) Season-stratified levels. The model is fitted separately within each meteorological season (DJF, MAM, JJA, SON). This removes the between-season contrast and keeps the day-to-day variation inside each season. It locates where the seasonal signal sits and shows whether a driver’s role survives once the gross seasonal contrast is set aside.
(iii) Deseasonalised monthly anomalies. From each variable we subtract its calendar-month climatological mean, a twelve-cell monthly climatology. This removes the mean seasonal cycle of every variable at once and leaves the synoptic, within-month coupling. No day-of-week cycle and no multi-year trend are removed at this rung. Deseasonalisation is a more stringent test of the wind and boundary-layer separation, not a weaker one. The wind–BLH collinearity rises on anomalies, because within a month windy days have deeper layers, a coupling partly out of phase with the seasonal cycles and so diluted when the two are pooled.
(iv) Deseasonalised anomalies with the multi-year decline removed. Concentrations fell markedly over the study period under emission-control policies. Fitting a linear time trend to each city series gives a mean decline for NO2 of 6.9% of the period mean a year (6.0% without Lille, whose series covers 2018–2021 only), against 3.7% for PM2.5, 3.1% for PM10 and 0.5% for O3. In the nine cities with a complete record, the NO2 level of 2025 is about a third below that of 2018. The meteorological parameters show no comparable drift, since time alone accounts for 0.05% of the variance of wind speed and 0.3% of that of boundary-layer height. The decline therefore does not bias the wind and boundary-layer coefficients through an omitted variable. What it does is enter the denominator of every semi-partial R2, and it does so unequally. Time alone accounts for 8.0% of the variance of NO2 against 0.3% of that of O3, and for 13% of the NO2 variance at Nice against 3.7% at Marseille. Semi-partial values are therefore not strictly comparable between pollutants, nor between cities, as long as this non-meteorological component is left in. On this rung, we subtract the calendar-year mean from the pollutant and from all seven parameters, after the monthly anomaly has been formed. Subtracting the year means from the parameters as well as from the pollutant gives the same coefficients as a model with year indicator variables (Frisch–Waugh–Lovell theorem), but not the same semi-partial values, since the indicator model keeps the decline in the variance being decomposed (Table S7, rows 2 and 3). Year means are used rather than a fitted straight line because the 2020 lockdown lowered concentrations as a step, which a straight line would spread over the neighbouring years.
The four frames are read as a progression, not as alternatives. Each step removes more low-frequency covariation than the last, so the same sr2 decomposition becomes a stricter test of an immediate coupling at each step. A driver whose lead survives the whole sequence is coupled to concentration on the immediate, weather-driven timescale. A driver whose lead appears only in pooled levels and fades along the sequence owed it to seasonal confounding.
2.2.5. Complementary Analyses: Wind Direction and Humidity
Two further analyses extend the decomposition to predictors the primary linear model cannot represent directly.
Wind direction. Direction is a circular variable, so a single linear coefficient cannot represent it [69]. The daily direction θ is that of the daily vector-mean wind, computed from the hourly components. We encode it as a Fourier block (sin θ, cos θ, sin 2θ, cos 2θ), compute its joint sr2 alongside the other predictors, in the pooled frame and on both anomaly rungs, and test the four terms jointly with the HAC Wald test of Section 2.2.3. Because the block uses four degrees of freedom against one for speed, the two are also compared with adjusted R2 and by leave-one-year-out cross-validation, in every frame, which keeps serially dependent days in the same fold [70] (Table S8). Direction and speed encode different physics. Speed measures horizontal ventilation. Direction measures which source sector or air mass is sampled. The augmented model is also a sensitivity analysis of the primary decomposition. Comparing the speed and BLH terms with and without the block shows how much of their unique variance is shared with direction (Table S8).
Humidity. Relative humidity is the seventh predictor of the primary model, and its unique contribution is reported per pollutant. For ozone, the comparison with a six-predictor humidity-free model isolates the shared humidity–BLH variance.
Uncertainty on the per-city NO2 wind and BLH sr2 is quantified by bootstrap resampling of the daily series, with 2000 resamples, using the stationary block bootstrap with a mean block length of 10 days, several times the persistence scale of Section 2.3, to respect the residual serial correlation [71]. The difference between the wind and BLH sr2 is computed in each resample, so that its interval accounts for the correlation between the two estimates [72]. For the ten-city mean the same resampled dates are used for all cities (Table S9).
2.3. Temporal Aggregation and the Choice of the Daily Scale
Geod’air and ERA5 data are available at the hourly and the daily scale. To decide which one is best suited to our work, we take a smaller batch of data and study the intrinsic persistence of the pollutant series, a criterion that depends only on the target, not on any predictor. The logic is that the natural scale at which to analyse a pollutant should be set by its own memory. We then corroborate this with the study of the time-scale dependence of the wind–pollution correlation.
Both diagnostics are computed for two cities from the same hourly record, each series reindexed onto a regular hourly grid and averaged into non-overlapping windows from one hour to thirty days. The two cities are Marseille and Lyon. They were chosen because they are the two cities for which a complete and quality-controlled hourly record was available for all four pollutants over the whole 2018–2025 period at the time of the analysis, and because they represent contrasted regimes, Marseille the most wind-dominated city (Type A) and Lyon a transitional city (Type B). Paris, Lille and Toulouse are part of the hourly study announced in the final section.
We estimate the lag-1 autocorrelation φ(Δ) of the deseasonalised series at each aggregation window Δ and define the memory crossover Δ* as the window where φ(Δ) = 0.5 (Figure 5). Deseasonalisation is essential, since on raw series the seasonal cycle keeps φ above 0.5 at all scales for O3 in both cities and for NO2 at Lyon, leaving Δ* undefined. Raw Marseille NO2 falls below 0.5 at the 36 h window. Averaged over the two cities, the crossovers are at Δ* ≈ 1.2 days for NO2, 1.5 for O3, 2.2 for PM10 and 2.6 for PM2.5, ordered by atmospheric lifetime. The two cities agree on the ordering and differ by at most 0.7 day on any single species. At one day φ is still 0.54 to 0.71, coherent but evolving. One day is therefore the finest resolution that captures weather-driven variability without dissolving into sub-diurnal turbulence.
Figure 5.
Intrinsic persistence φ(Δ), the lag-1 autocorrelation of the deseasonalised series (month-by-hour climatology), against the aggregation window Δ, computed from the hourly record for the two reference cities, Marseille (left) and Lyon (right), for the four pollutants. Filled circles mark the crossover Δ* where φ = 0.5. The crossover orders the four species by atmospheric lifetime and sets the daily window as the finest resolution that retains weather-driven coherence. The rise of the NO2 curve beyond about 10 days is residual low-frequency structure that a month-by-hour climatology does not remove.
These crossovers are estimated on series from which the seasonal cycle has been removed but not the multi-year decline of Section 2.2.4. Since the decline sustains the autocorrelation at long windows, it lengthens Δ*. Removing it as well shortens every crossover by about 0.2 day, from 1.21 to 1.03 days for NO2, 1.54 to 1.36 for O3, 2.20 to 2.01 for PM10 and 2.57 to 2.41 for PM2.5, and leaves the ordering by atmospheric lifetime unchanged. The choice of the daily step rests on the behaviour at short windows. Up to 18 h, φ exceeds 0.5 in every case and under either treatment. At one day it does too, except for Lyon NO2 with the decline removed (φ = 0.49, Δ* = 0.9 day), so the choice is not materially affected.
The scale-sensitivity of the wind–pollution correlation corroborates this choice. On the hourly series (raw data, no deseasonalization), the wind–pollutant correlation was computed from 1 h to 720 h (Figure S1). Sub-daily averaging is dominated by turbulent noise, so for most primary series the correlation is weaker. Ozone is the exception in both cities, its correlation being stronger at sub-daily windows, and at Lyon NO2 and PM2.5, correlate more strongly at 12 h than at 24 h. For Marseille NO2, |r| rises from 0.53 at 1 h to 0.68 at 24 h.
Beyond 24 h the archetypes separate. On the raw hourly series at Lyon the wind–NO2 correlation weakens monotonically and changes sign by 30 days, from −0.39 at one day to +0.16 at thirty, because aggregation loads the seasonal covariation, positive at Lyon, onto the negative synoptic coupling. The O3 correlation also changes sign, but only slightly, while the two particulate species lose their coupling, reaching 0.04 and 0.00 at thirty days. At Marseille the coherent Mistral keeps the three primary species negative at every window from 1 h to 30 days. Ozone is positively correlated with wind up to a few days, plausibly because ventilation reduces its titration by NO, and negatively beyond, a seasonal effect that disappears on deseasonalised series. The reversal is largely seasonal. On deseasonalised anomalies the Lyon NO2 correlation remains negative out to twenty days and only reaches zero at thirty, and the two particulate species stay negative throughout.
The daily window thus lies between a sub-daily noise floor and a supra-daily confounding regime. We therefore focus in this study on the daily data, which is also the averaging period on which the WHO and EU air-quality metrics rely, and the resolution available for the wider population of European cities to which the framework generalises. These diagnostics do not involve BLH. The scale dependence of the wind/BLH balance itself is tested with BLH in the model, on windows of 1 to 30 days (Table S10). The hourly data are analysed in a subsequent article.
3. Results
3.1. Overall Model Performance
Across the forty city × pollutant pairs, the seven-predictor linear model explains the largest share of variance for O3 (pooled R2 0.50–0.76) and NO2 (0.33–0.60) and the smallest for PM10 (0.13–0.41), with PM2.5 intermediate (0.20–0.42). This is consistent with the larger non-meteorological component of particulate concentrations, which combines emission, secondary formation and long-range transport. Generalised additive models outperform the linear model in every one of the forty pairs (Table S4), with a median gain in explained variance of +0.089. The mean improvement is largest for PM2.5 (+0.154) and PM10 (+0.135) and smaller for NO2 (+0.066) and O3 (+0.065). The effective degrees of freedom of the additive fits greatly exceed unity, confirming pervasive non-linearity. For interpretability, the semi-partial decompositions below are reported from the linear model. The GAM preserves the leading term, BLH or wind, in 85 of the 90 comparisons of Table S5, and in nine of the ten cities for the fourth-rung NO2 balance that defines the typology (Section 3.4). The exception is Lille, a transitional city where the two terms are at parity in the linear model. Magnitudes are less stable than rankings when one term is close to zero (Section 3.2.2).
3.2. Boundary-Layer Height Versus Wind
3.2.1. Pooled Dominance and Its Seasonal Structure
In the pooled, all-year analysis, and in the mean across the 10 cities, BLH carries more unique variance than wind for every pollutant (Figure 6). The lead is not of the same size everywhere, and it matters which way it is read. In relative terms it is smallest for NO2 and O3, where the boundary-layer term is about four times the wind term, and largest for the two particulate species, where it is eight to ten times. In absolute terms the picture is flatter and the ordering differs, the boundary layer exceeding wind by 0.03 to 0.05 of explained variance for all four. The species whose wind term is least dominated is therefore NO2, which is the one the rest of this section follows. BLH is significant in all 120 models tested, 10 cities and four pollutants in the pooled frame and on both anomaly rungs (HAC Wald test, p < 0.05), and wind in 66. Every non-significant wind term has sr2 below 0.003 (Table S6). The per-city structure is examined in Section 3.4.
Figure 6.
The central result in the pooled frame: mean unique variance (semi-partial R2) of wind speed and boundary-layer height for each pollutant, across the 10 cities (seven-predictor model). Error bars are the inter-city standard deviation.
This is the empirical basis for the common statement that boundary-layer dynamics, rather than ventilation, govern day-to-day pollution. It is worth setting it against the bivariate picture of Figure 2, which reports a different quantity, the raw Pearson correlation rather than the variance unique to each driver. On that measure the two drivers are close. Averaged over the 10 cities, wind correlates with NO2 at −0.40 against −0.58 for boundary-layer height, with PM10 at −0.28 against −0.36, and with PM2.5 at −0.34 against −0.48, so the boundary-layer term leads by a factor of only 1.3 to 1.4 on the primary species. Once the shared variance is set aside the same comparison becomes a factor of about four for NO2 and of eight to ten for the two particulate species. The distance between the two readings is the dissociation this article is about, and it shows why the bivariate view cannot settle the question. Wind keeps a strong marginal correlation with every primary species while contributing little that boundary-layer height does not already carry. Ozone behaves differently on both measures, its boundary-layer correlation being positive, from +0.37 to +0.67 with a mean of +0.55, for reasons taken up in Section 3.3.1.
3.2.2. Dissociation Under Deseasonalisation
That pooled ordering is not invariant to the analytical frame. Figure 7 shows, for each pollutant, the mean over the 10 cities of the unique variance of wind and of BLH in each of the four frames. For O3 and the two particulate species BLH stays ahead of wind in all four. For NO2 the balance moves once the seasonal cycle is addressed.
Figure 7.
Unique variance (semi-partial R2) of wind and BLH for each pollutant under the four analytical frames: pooled levels, season-stratified levels, deseasonalised monthly anomalies, and deseasonalised anomalies with the multi-year decline removed (mean over 10 cities, seven-predictor model). Error bars are the inter-city standard deviation. The four panels share the same vertical axis.
Season-stratified models locate where the seasonal signal sits. The BLH–pollution coupling peaks in the transition seasons, spring and autumn, for NO2 and the two particulate species. For O3 it is similar in winter, spring and autumn (mean BLH sr2 0.048 to 0.054) and collapses in summer (JJA 0.005), whereas for NO2 and the particulate species it is reduced in both summer and winter without vanishing (NO2 JJA 0.035). The wind–NO2 coupling varies less markedly across seasons and is largest in summer (mean JJA sr2 0.051) and smallest in spring (MAM 0.018). The seasonal signal therefore sits chiefly in the boundary-layer term, while the wind coupling does not peak in the transition seasons. This motivates removing the seasonal cycle entirely.
Removing the mean seasonal cycle, on deseasonalised monthly anomalies, sharpens the test rather than relaxing it. The wind–BLH collinearity increases: the mean cross-correlation r(wind, BLH) for NO2 rises from about 0.70 in the pooled frame to about 0.81 on monthly anomalies and reaches 0.85 to 0.87 in the most strongly coupled cities (Lille, Marseille and Paris). Within a calendar month, windy days have a deeper boundary layer through mechanical mixing, a synoptic coupling partly out of phase with the seasonal cycles and therefore diluted when the two are pooled. Deseasonalisation is thus a more stringent test of the wind/BLH separation, and the semi-partial decomposition still resolves the two drivers under it.
Under this stricter test the NO2 ordering changes. The mean unique variance of wind rises from 0.017 in the pooled frame to 0.039 on anomalies, while the mean unique variance of BLH falls from 0.067 to 0.035. The two therefore become comparable in the mean, and their difference is much smaller than the spread between cities.
Removing the multi-year decline as well, on the fourth rung, leaves that reading intact but restores a small boundary-layer lead. Mean wind sr2 is then 0.039 and mean BLH sr2 0.042 for NO2, so the two remain of the same order and their difference stays well inside the inter-city spread. The other three species barely move, as their trends are weak. BLH keeps a clear lead over wind for the particulates and for O3 (Figure 7, Table S7). Its size depends on the model form where the wind term is close to zero. For the particulates it is twelve- to eighteen-fold in the linear model and about four-fold in the GAM. For O3 it is about three-fold in the linear model and 2.5-fold in the GAM (Table S5). The conclusion of this section is therefore not that wind overtakes the boundary layer once the seasonal cycle is removed, but that the two become comparable, and that which of them leads by a small margin depends on whether the emission-driven decline is removed as well. The robust statement is the convergence, not its sign. A substantial part of the pooled BLH dominance for NO2 reflects the shared seasonal cycle of BLH and concentration rather than a within-season coupling. In some cities with a coherent regional wind regime the ordering does not merely level out, it reverses, and wind clearly leads.
Two points of interpretation follow. First there is an asymmetry between pollutants. Wind matters appreciably mainly for NO2, and only in some cities. For O3 and the two particulate species, the ordering of the ten-city mean is preserved in every frame, and so is that of most cities. The exceptions are O3 at Toulouse, where wind sr2 is 0.056 to 0.085 in every frame and exceeds BLH, O3 at Lyon and Montpellier on both anomaly rungs (wind 0.013 to 0.014, BLH 0.009), and PM10 at Nice in the season-stratified frame (wind 0.050, BLH 0.032). BLH, and for O3 temperature and humidity, remain ahead of wind under deseasonalisation in the ten-city mean, confirming that their balance is not an artefact of the seasonal cycle (Figure 7).
Second, the comparison is qualitative in absolute magnitude, because the within-anomaly variance of the target is smaller than its pooled variance. The direction of the shift, and the wind/BLH balance within each frame, are the robust quantities.
3.3. Other Meteorological Factors
3.3.1. Temperature, Relative Humidity and the Ozone Signal
The wind–BLH pair does not exhaust the meteorological control. Four further parameters carry distinct and, in two cases, decisive information: temperature, relative humidity, wind direction and surface pressure. Temperature is the dominant control on ozone. The temperature–O3 correlation is strong in every city, from about +0.50 to +0.70, reflecting the summertime photochemical regime, and temperature is the first-order meteorological driver of European surface ozone [17,73]. Relative humidity correlates with O3 as strongly or more strongly, with the opposite sign, in seven of the ten cities. Temperature is present in the seven-predictor model throughout, so everything reported for humidity and for BLH below is already adjusted for it.
Relative humidity is also part of the primary model. Its unique contribution is small for NO2 (mean sr2 0.016), PM2.5 (0.011) and PM10 (0.025) but substantial for O3 (0.055). For ozone, humidity and BLH share a large fraction of variance. Including humidity reduces the unique O3–BLH signal from 0.087, in a six-predictor humidity-free model, to 0.035, so that the unique contribution of humidity then exceeds that of BLH on average (0.055 against 0.035). The most economical reading is photochemical. Deep boundary layers, low humidity, high temperature and strong insolation co-occur on clear days, and the model contains no direct radiation term beyond cloud cover. The humidity term therefore most plausibly proxies the residual photochemical drive that temperature does not already capture, a consequence of sunlight rather than a hygroscopic mechanism of its own. We accordingly retain humidity in the model and interpret the ozone response as a joint temperature, humidity and boundary-layer photochemical signal rather than a mixing-depth effect.
Importantly, the wind/BLH ordering for NO2 and the particulate species is unchanged by the inclusion of humidity in all 30 city × pollutant pairs, and wind sr2 changes by at most 0.013, although BLH sr2 changes by up to 0.057 (Montpellier PM10). The headline wind/BLH dissociation is therefore not an artefact of an omitted humidity term.
3.3.2. Wind Direction: A Transport Dimension Distinct from Ventilation
A deliberate simplification of the primary model is the omission of wind direction. Encoding direction as a Fourier block shows that this omission is not innocuous. The directional block carries more unique variance than wind speed for all four pollutants in the pooled frame. For NO2 it reaches a pooled mean of 0.024 against 0.015 for speed (Figure 8). For O3, the directional term (0.042) exceeds even the boundary-layer term in the same model (0.021). The four terms are jointly significant (HAC Wald test, p < 0.05) in 116 of the 120 models (Table S8). The advantage is not an artefact of the four degrees of freedom of the block. It survives adjustment for degrees of freedom and leave-one-year-out cross-validation. In the pooled frame, the direction terms still jointly exceed speed out of sample for all four pollutants in the ten-city mean (NO2 0.019 against 0.015), in six to nine of the ten cities, and the first harmonic alone in five to nine. On deseasonalised anomalies, they still do for O3 and particulate matter, but not for NO2, for which speed leads out of sample (0.034 against 0.011 on the third rung, Table S8).
Figure 8.
Unique variance of wind speed versus the wind-direction Fourier block (sin θ, cos θ, sin 2θ, cos 2θ) for each pollutant, θ being the direction of the daily vector-mean wind (pooled frame, mean over 10 cities). Both terms are added last in the seven-predictor model augmented with the direction block, so the comparison is like-for-like. Error bars are the inter-city standard deviation.
Crucially, direction and speed encode different physics. Speed measures horizontal ventilation, whereas direction measures which source sector or air mass is sampled, that is transport rather than dilution. On the third rung (deseasonalised anomalies), the mean ordering reverses for NO2, speed 0.034 against 0.018 for the block. In the pooled frame, speed leads only in the three cities ventilated by a regional regime, Marseille (Mistral), Montpellier (Tramontane) and Toulouse (Autan and Tramontane). The directional signal is strongest at Lyon, Strasbourg and Nice (0.063, 0.056 and 0.042), where the flow follows a valley axis or the coast (Figure S2). On the anomaly rungs speed also leads at Bordeaux, Lille and Paris, and at Lyon on the third rung.
Controlling for direction also tests the primary decomposition (Table S8). Adding the block lowers the unique BLH term by 28–51% in the ten-city mean, depending on the pollutant and the frame. Part of what the seven-predictor model credits to BLH alone is therefore shared with wind direction, plausibly because the same flow regimes set both the air mass and the mixing depth. In the ten-city mean, the speed term changes little for NO2 (−11% to −13%) and PM2.5 (−5% to +8%), and falls by 37–45% for O3 and PM10. For NO2, it falls more in the three Type A cities (17–39%), where it still leads on both anomaly rungs. The BLH lead over speed survives for the particulates and O3. In the pooled frame, it is 8.3-fold for PM10, 5.1-fold for PM2.5 and 4.5-fold for O3 (8.4, 9.8 and 4.4 without direction). For the particulates, BLH leads speed in every city in the three frames tested, except PM2.5 at Marseille in the pooled frame and on the third rung. For NO2, the lead falls from 3.8-fold to 2.4-fold in the pooled frame. On the fourth rung, the mean balance tips from BLH (0.042 against 0.039) to speed (0.035 against 0.029). On the third, where speed already led (0.039 against 0.035), its lead widens (0.034 against 0.025). Both terms remain significant for the NO2 anomalies in every city, on both rungs (HAC Wald test, p < 10−5), and BLH remains significant in all 120 augmented models (p < 0.05).
Two caveats temper these results. The first is representational. The Fourier encoding is a lower bound on the true directional dependence, which is often multimodal and would be better captured by a cyclic spline or by a two-dimensional speed × direction smooth. The second is observational. Because these are city-aggregated urban-background series, the directional signal is a correlational proxy for source sector and air-mass origin rather than a manipulable mechanism, and it would be stronger still at source-influenced sites. A dedicated treatment of wind direction is therefore a natural next step.
3.3.3. Pressure
Surface pressure is positively correlated with the particulate species in every city, from about +0.18 to +0.37, consistent with anticyclonic inversion episodes during which low wind, low BLH and high emissions co-occur [24]. This is part of why a univariate wind regression over-attributes particulate variance to wind. Because temperature so strongly controls ozone, any univariate wind analysis of ozone is severely biased, and the residual wind effect after adjustment is small, except at Toulouse (pooled wind sr2 0.056).
3.4. Ten Cities and an Urban Typology
The ten-city mean hides most of the inter-city structure (Figure 9). Deseasonalising and de-trending the data redistributes the decomposition across cities.
Figure 9.
Per-city decomposition of the NO2 wind signal deseasonalised and with the calendar-year means removed: unique variance (semi-partial R2) of wind speed and of boundary-layer height in the seven-predictor model, one row per city, with the ten-city mean at the foot. The ≈ sign marks the three cities, Bordeaux, Lyon and Lille, and the ten-city mean, for which the bootstrap 95% confidence interval of the difference between the wind and BLH sr2 includes zero (Table S9).
Wind leads significantly in the three cities with a coherent regional wind regime, clearly at Marseille (Mistral) and Toulouse (Autan and Tramontane), and narrowly at Montpellier, whose difference interval only just excludes zero. At Bordeaux, Lyon and Lille the two terms cannot be told apart. The interval of their difference includes zero on both rungs, and the leading term changes between the third and the fourth rung. BLH leads in the sheltered or oceanic cities, clearly at Paris, Nantes and Nice, and narrowly at Strasbourg. Per-city values are listed in Table 3.
Table 3.
Typology of the 10 cities by the NO2 wind/BLH balance on anomalies deseasonalised and with the calendar-year means removed. D is the difference between the wind and BLH sr2, with its bootstrap 95% confidence interval (Table S9). The dominant term is the one with the larger sr2 when this interval excludes zero (narrowly when one bound lies within 0.002 of zero). ≈ equal: the interval includes zero.
This range across cities does not follow the level of NO2. The three cities with the highest mean NO2, Marseille (26.7 µg m−3), Nice (25.4) and Paris (24.1), span almost the whole range of unique wind contribution on the fourth rung, from 0.098 at Marseille to 0.014 at Nice. Across the 10 cities the rank correlation between mean NO2 and the unique wind contribution is close to zero in every frame (Spearman ρ = 0.02, p = 0.96, on the fourth rung). The range follows instead the presence of a coherent regional wind system.
This city-level structure synthesises into a compact, three-type typology of the wind/BLH balance, read on the same fourth-rung anomalies (Figure 10, Table 3). NO2 is the discriminating axis for two reasons. First, as a primary, traffic-sourced, short-lived gas, its day-to-day variance depends mainly on meteorological dispersion, ventilation and vertical mixing, rather than on photochemistry or secondary formation, making it the cleanest tracer of the dispersion regime of a city. Second, and empirically, it is the pollutant whose wind/BLH balance varies most across cities. For the two particulate species BLH leads wind in every city. For ozone, temperature or humidity carries the largest unique share in every city, and wind exceeds BLH only at Toulouse, Lyon and Montpellier.
Figure 10.
Urban-meteorological typology from the fourth-rung NO2 decomposition, deseasonalised and with the calendar-year means removed: wind unique variance (x-axis) against BLH unique variance (y-axis), one point per city, coloured by type.
Type A (wind-dominated) comprises the cities with a strong, coherent regional wind regime: Marseille (Mistral) and Toulouse (Autan and Tramontane), with Montpellier (Tramontane) a weaker member. Here wind carries from about twice the unique NO2 variance of BLH at Montpellier to seven times at Marseille.
Type B (transitional) comprises Bordeaux, Lyon and Lille, where wind and BLH contribute almost equally once the seasonal cycle and the multi-year decline are removed, neither term leading by more than 0.009, and the interval of their difference including zero. Lyon is the clearest example. Channelling of the Rhône valley provides a ventilation signal, but the same valley setting favours shallow, stagnant boundary layers, so neither mechanism dominates. Lille, a flat plain without a regional wind regime, belongs to this class on its urban-background record, which covers 2018–2021 only.
Type C (BLH-dominated) comprises the sheltered or oceanic cities: Paris, Nantes, Nice and Strasbourg. Here BLH carries the larger unique share of day-to-day NO2 variance, and no coherent ventilating wind regime is present.
The typology is meteorological rather than merely geographic. It follows the presence or absence of a recurrent regional wind regime and the propensity for boundary-layer stagnation. Its practical consequence is not a choice between the two covariates. Both carry significant unique variance of the NO2 anomalies in every city (Table S6), so both should be retained. The type indicates which of the two a model can least afford to omit or mis-specify: wind in Type A, BLH in Type C, both alike in Type B. This is an exploratory reading, not a validated rule for selecting predictors.
Four precautions bound this typology. First, it is a descriptive partition of 10 cities, not a validated classification. The type boundaries are read from the position of each city relative to the 1:1 wind/BLH line in Figure 10, not derived from an unsupervised clustering algorithm, and with 10 points and three classes, no formal cluster-validity or out-of-sample test is meaningful. Second, the underlying quantity is continuous. The wind/BLH balance varies smoothly from Marseille to Nantes, so the three types are an organising heuristic rather than evidence of discrete regimes. The transitional class rests on three cities, Bordeaux, Lyon and Lille, all close to the 1:1 line. A bootstrap of the difference between the two terms confirms this formally. Its 95% confidence interval includes zero for the three cities on both rungs (Table S9), which turns their boundary status into a verifiable quantity. On the fourth rung it excludes zero narrowly for Montpellier and Strasbourg, whose assignments are the least firm after the three transitional cities, and clearly for the other five. On the third rung it also includes zero for Strasbourg and excludes it narrowly for Montpellier. The transitional status of Lyon and Lille also depends on the model form. In the GAM, their BLH lead (0.026 and 0.018) is comparable to that of Nice (0.021, against 0.045 in the linear model), a Type C city (Table S5).
Third, the discriminating axis is the deseasonalised NO2 balance alone, read at the daily scale. When the NO2 anomalies are averaged over 10 days or more, wind leads in five to eight of the ten cities (Table S10). Ozone and the particulate species do not separate the cities and so cannot corroborate the partition independently.
Fourth, the balance is read from the seven-predictor model, which omits wind direction. With the direction block in the model, the ranking of the 10 cities by this balance is largely preserved on both anomaly rungs (Spearman correlation 0.90 between the two balances on the fourth rung, 0.92 on the third). The balance moves toward wind, however, because on average the BLH term loses more variance than the wind term (Figure S3). On the fourth rung, wind still leads in the three Type A cities and BLH in the four Type C cities, while Bordeaux and Lyon move to the wind side and Lille stays close to parity (Table S8). The gradient is thus robust to this specification, but the boundary of the transitional class is not. We therefore present the typology as a hypothesis-generating structure rather than a settled classification, a status that a pan-European extension is explicitly designed to resolve.
Finally, wind speed and the wind-direction Fourier block can be compared city by city. On the fourth rung, the balance between them ranks the cities in a similar order to the wind/BLH balance (Spearman correlation 0.76, p = 0.011). Where a coherent ventilating regime exists, speed dominates the block, by a factor of four at Toulouse to twenty-one at Marseille. Elsewhere the balance shifts toward the block. It leads in four of the seven other cities, most clearly at Strasbourg (0.044 against 0.023 for speed, and 0.037 against 0.027 on the third rung), then at Lyon, Nantes and Nice (by 0.008, 0.005 and 0.003). Speed still leads at Paris, a Type C city (by 0.012), and at the transitional Bordeaux and Lille. The correspondence is therefore a gradient and not a partition. Read across the 10 cities, the residual wind information shifts from dilution, which the speed carries, to transport.
4. Discussion
4.1. Boundary-Layer Height and Wind Speed Disentangled
Across 10 cities and four pollutants, the meteorological drivers carry separable information, but the wind/BLH balance is specific to each pollutant and, for NO2, dependent on the analytical frame.
In the pooled frame, BLH dominates wind for every pollutant in the ten-city mean. For particulate matter, in the ten-city mean, this lead holds in all four analytical frames at the daily scale and, on the deseasonalised anomalies, at aggregation windows from one to thirty days (Table S10). For O3, humidity carries the larger unique signal on average, probably as a proxy of the sunlight-driven photochemical reaction. For NO2, the pooled BLH dominance is partly seasonal, and on deseasonalised anomalies, wind and BLH are close in the mean, with large differences between cities. The wind–boundary-layer dissociation is thus best read as a structured, pollutant- and city-specific partition of ventilation, vertical mixing and (for ozone) humidity, recoverable only once seasonal confounding and aggregation scale are handled explicitly.
The robustness of the BLH lead for particulate matter is consistent with its accumulation physics. Deep, well-mixed layers dilute primary particles, and the BLH–PM coupling persists within seasons and on monthly anomalies, consistent with a direct mixing-volume effect rather than a seasonal coincidence [20,22,30,42]. At very high loadings, this coupling becomes bidirectional, as absorbing aerosols warm the upper boundary layer and suppress its growth [38,39,40]. The contrast with the gaseous species is not incidental. It follows from the transport and removal mechanisms specific to particles set out in the introduction, size-dependent deposition, selective wet scavenging and radiative feedback on the layer itself [36,37,41].
For ozone, once temperature is accounted for, humidity carries more unique variance than BLH on average. Deep daytime boundary layers, low humidity and active photochemistry co-occur, so a boundary-layer term in a humidity-free model proxies the photochemical state, and attributing the ozone response to mixing depth alone would be misleading [17].
NO2, by contrast, is a short-lived, locally emitted primary pollutant whose surface concentration responds to ventilation [35]. Where a coherent regional wind regime exists, the Mistral at Marseille, the Autan and Tramontane around Toulouse, horizontal advection dominates the day-to-day dilution [51,52]. This is consistent with the wind dominance found there, already present in pooled levels at Marseille and Toulouse and sharpened once seasonality is removed.
The frame comparison cautions against inferring process from pooled, all-year correlations or variable-importance rankings, and supports deseasonalisation as a prerequisite for mechanistic attribution [47,74,75]. The city-level wind/BLH balance for NO2 tracks an urban-meteorological typology grounded in regional circulation and topography. A comparable modulation of the boundary-layer–pollution relationship by regime and terrain has already been reported for individual case studies, the coupling weakening over complex terrain and differing between cities according to wind regime and transport [20,45,76], and being clearer for secondary species such as ozone than for primary pollutants at heterogeneous sites [32].
The decomposition also omits a transport dimension. Out of sample, the wind-direction block carries more unique variance than speed for O3 and particulate matter in every frame, and for NO2 in the pooled frame only (Section 3.3.2). A fuller account therefore separates three quantities rather than two: direction, speed and BLH, consistent with transport, ventilation and vertical mixing. Omitting direction also enlarges the unique BLH term, because part of the variance that the seven-predictor model credits to BLH is shared with direction. With direction in the model, BLH loses 28 to 51% of its unique variance in the ten-city mean, its lead over speed remains for the particulates and O3, and the NO2 balance on anomalies tilts toward wind (Section 3.3.2). For meteorological normalisation and exposure modelling, wind direction should be retained as an explicit predictor rather than subsumed into a single dispersion term.
These findings have direct implications for exposure assessment and meteorological normalisation. Boundary-layer height should be retained as a predictor, particularly for particulate matter, consistent with its use in normalisation models [30]. For ozone, humidity should be included alongside temperature to avoid attributing a photochemical signal to mixing depth. For NO2, the larger unique share depends on the city type. It is wind in cities with strong regional winds, BLH in the sheltered or oceanic cities, and neither clearly in the transitional ones. A normalisation model should therefore include both terms, and wind direction with coefficients or response functions fitted city by city, rather than one specification pooled across cities. Attribution and trend studies should deseasonalise and select the analytical frame deliberately, because the leading meteorological term can change with the analytical choice. Crediting the unique share of wind to BLH for NO2, or the converse for particulate matter, could bias exposure-misclassification corrections and the interpretation of emission-driven trends.
4.2. Timescale Interpretation
The results for each pollutant admit a unifying reading, which we advance as a hypothesis for scales up to about a week, rather than as a settled reconciliation. The two drivers act on different timescales. Horizontal advection ventilates the urban canopy within the hour, so the wind term is high-frequency and acts largely within the same day, with little carry-over to the next [15,19,23]. The boundary layer acts both on the instantaneous mixing volume and, through the persistence of shallow stagnant layers, on the multi-day buildup [24]. The wind/BLH balance of a pollutant should therefore mirror the temporal composition of its variance.
The results are partly consistent with this reading. Removing the seasonal cycle transfers unique NO2 variance from the boundary layer to wind (Figure 7), and removing the multi-year decline returns a small part of it. In the pooled frame, the persistence ordering of Section 2.3 coincides with the wind-susceptibility ordering, the only species approaching comparable contributions being the shortest-lived, although the two particulate species swap places on anomalies. On the fourth rung, averaging the NO2 anomalies over 2 to 7 days lowers the wind term and leaves the BLH term unchanged, as the reading predicts. On the third rung, both fall, and from 10 days, the balance moves toward wind on both rungs, which the reading does not predict (Table S10). Read this way, part of the divided literature on whether ventilation or vertical mixing controls urban pollution may reflect analytical frame rather than substance [20,31,32,76]. Meteorology–pollutant correlations are scale-dependent and can even reverse sign between daily and monthly windows, as shown for PM2.5 at Nanjing [49] and in the seasonally confounded reversals of Section 2.3. The robust boundary-layer consensus for particulates and the recurrent wind effect for primary gases are then not contradictory but different coordinates in a space spanned by pollutant lifetime, analytical frame and topographic regime.
4.3. Implications for Exposure Assessment and Epidemiological Misclassification
4.3.1. Exposure Error in Cohort and Time-Series Designs
Epidemiological studies of the health effects of air pollution rely on exposure estimates whose accuracy is constrained by the meteorological modulation of concentrations. Exposure measurement error in this literature is well characterised. It combines spatial aggregation error, the difference between ambient and personal exposure, and instrument error, and it generally attenuates the estimated health effect [77,78]. The present analysis bears on that literature [79]. Its relevance depends on the design and the timescale of the study. The variation we analyse is daily and seasonal. It is therefore most pertinent to short-term designs and to wind-based natural experiments, and less so to long-term cohorts.
Long-term cohorts are the least affected. In pooled cohort designs such as the European ELAPSE project [5,6], exposure is not taken from raw station records. It is assigned from Europe-wide hybrid land-use regression models that predict long-term annual means from land use, satellite retrievals and chemical-transport-model output. Meteorology enters only implicitly, through the transport model, and never as an explicit wind or boundary-layer term. Because the exposure metric is an annual average with a mainly spatial contrast, day-to-day meteorological modulation largely averages out. The seasonal coupling we document therefore has little bearing on this class of design. One residual concern remains. If a single model structure is applied to cities with different ventilation and mixing regimes, the spatial prediction can retain city-specific bias.
Short-term multi-city time series are more exposed. Daily time-series and case-crossover studies use daily concentrations, often from monitoring stations, and adjust for meteorology day by day [79]. In the 652-city study of particulate matter and daily mortality [12], each city has its own model, adjusted for temperature and humidity, and the city estimates are then pooled. Wind and BLH are not among the adjustment variables. They need not be if they act on health mainly through concentration, the assumption under which they have served as instruments for it [80] (Section 4.3.2). Our results bear on the exposure side. Where daily exposure is modelled, or concentrations are normalised for meteorology, the meteorological signal in NO2 is not the same everywhere. Wind carries the larger unique share in cities with strong regional winds, BLH in the sheltered or oceanic cities, and neither clearly in the transitional ones. A model that imposes one specification on all such cities can leave city-specific structure in the exposure estimates, a candidate source of differential exposure error.
The COVID-19 period offers a direct illustration of why the meteorological part must be separated before an emission signal can be read. During the 2020 lockdowns, traffic emissions in Paris fell sharply, yet PM2.5 episodes persisted, with concentrations still ranging from about 20 to 60 µg m−3 across the city, because secondary aerosol of regional and agricultural origin continued to form and to be advected [81]. Across Europe, the observed changes in surface air quality attributable to the lockdowns were smaller than expected once meteorology was normalised out [74]. The contrast with NO2, which fell steeply and immediately, is exactly the gas-versus-particle contrast our decomposition recovers, a locally emitted short-lived gas dominated by dispersion against a partly secondary, longer-lived aerosol. The same period also produced evidence that the meteorologically modulated part of exposure matters for health. In western Europe over 2020–2022, peaks in COVID-19 mortality coincided with peaks in PM2.5, with a quasi-linear relation between the two [82], and the association is best resolved when PM2.5 exposure is integrated over about two months and mortality is lagged by about one week, which suggests that a succession of pollution peaks is more harmful than a steady moderate level [83]. A succession of peaks is, in our framework, a meteorological object. It is produced by sequences of stagnant, shallow-layer or poorly ventilated days.
A last concern is seasonal alignment. The BLH–concentration coupling is strongly seasonal, so the meteorological part of exposure peaks at the same times of year as many health outcomes. In time-series models that adjust seasonality with smooth splines, part of this shared seasonal signal can be handled unevenly by the exposure and the outcome model, and mistaken for a health effect [79]. Deseasonalisation or season-specific adjustment on both sides limits this risk. Case-crossover designs are less exposed, since time-stratified referent selection controls season by construction [84].
4.3.2. Wind-Based Natural Experiments
These designs rest on the very link we dissect. A distinct family of studies uses wind as a source of quasi-random variation in pollution. The wind-direction instrumental variable of Deryugina et al. [85] estimates the mortality effect of PM2.5 by assuming that daily wind shifts affect health only through concentration. Two of our results speak directly to that assumption. First, the first-stage relation between wind and concentration depends on the city type. These authors already accommodate this by letting the effect of wind direction on pollution vary with geography, and our decomposition supplies a physical basis for that heterogeneity, namely the presence or absence of a coherent regional ventilating regime. Second, the apparent wind signal is partly shared with boundary-layer dynamics, and both covary with temperature and with stagnation. Wind direction, the instrument of that design, itself shares part of the variance that the seven-predictor model attributes to BLH alone (Section 3.3.2). Since wind is entangled with vertical mixing and with meteorological variables that have health effects of their own, the exclusion restriction, that is the assumption that wind acts on health only through pollution, deserves explicit scrutiny. Designs that use wind patterns at the matching stage rather than in the regression alone offer one way forward [86].
However, we model ambient concentrations, not personal exposure or health outcomes, and the size of any resulting bias is not estimated here. A large comparison across 347 cities found that station-based and model-estimated PM2.5 gave consistent short-term mortality estimates [87], which bounds the practical concern for spatial estimation error. Our point is different and complementary. It concerns the meteorological structure of the temporal and cross-city signal, not the spatial accuracy of a single annual surface.
4.4. Limitations and Reservations
A first reservation is inferential. The semi-partial decomposition attributes variance. It does not identify causal pathways, and it cannot say whether the variance shared by wind and BLH acts through ventilation, through vertical mixing or through both. Apportioning it causally would require a path-analytic design, or situations in which the two variables decouple. What we obtain is a variance-based dissociation, not a causal apportionment.
A second reservation concerns the ERA5 spatial resolution. At 0.25°, about 28 km by 18 to 20 km, ERA5 smooths local wind variability and may therefore underestimate the wind–pollution coupling in cities with strong urban heat island effects or complex terrain. Comparisons against radiosondes and ceilometer networks show that the reanalysis boundary-layer height itself carries a non-negligible uncertainty [45,88]. No other large-scale database with a homogeneous multi-city coverage is currently available, and our use of averaged urban-background station data is consistent with this spatial resolution. The proper remedy is observational. Wind flow inside the urban canopy decouples from the synoptic wind [23], and resolving that decoupling requires dedicated measurement campaigns at a finer spatial scale than the reanalysis grid, whether through dense urban meteorological networks [89], quality-controlled crowdsourced wind observations [90] or profiling campaigns of the urban boundary layer [91]. Such campaigns in the 10 cities studied here would allow the ventilation term to be measured rather than inferred and would test directly whether the Type A cities owe their wind dominance to a canopy-level ventilation that the reanalysis only partly resolves. We regard this as the single most valuable observational extension of the present work.
A third reservation concerns what the fourth frame does not remove. Year indicators absorb the emission decline at annual resolution, but any within-year change in emissions that happens to coincide with particular weather remains attributed to meteorology. The 2020 lockdown is the obvious case, and it is absorbed here as a level shift rather than resolved as an event. A finer treatment would require an explicit emission inventory at the daily scale, which does not exist for these 10 cities over this period.
A further reservation concerns wind direction, which our analysis represents more coarsely than speed or BLH. First, the daily value is the direction of the daily vector-mean wind. On days when the wind turns, this mean is short and its direction describes no single hour. Land–sea breezes, which reverse between night and afternoon, are the main case. In summer, ERA5 shows such a reversal on 41% of days at Nice, 28% at Montpellier and 21% at Marseille, against 10% or less in the other cities (Table S11). On days with a steady wind, the direction block is larger, for NO2 and O3 in every city, consistent with a loss of information on the other days. Second, the 0.25° grid smooths the coastline and the relief. At Nice, where steep relief rises a few kilometres from the sea, the daily ERA5 direction agrees within 45° with the direction observed at the airport [92] on only 78% of days with a daily vector-mean wind of at least 5.4 km h−1, against at least 96% in the other cities. On the same days, the observed direction explains about twice as much NO2 variance as the ERA5 direction. Breezes, channelling and recirculation are therefore only partly represented, and direction effects are likely underestimated where geography matters most. Because direction shares variance with BLH (Section 3.3.2), a finer representation could also take a larger share of the BLH term than the 28 to 51% found with the Fourier block. Third, two Fourier harmonics capture at most two preferred sectors, and the direction effect is not allowed to vary with speed or season. Bivariate polar plots [93,94], which let it vary with speed, are a natural complement. The block is fitted city by city, so each city’s geography sets its own response (Figure S2), and it remains significant in 116 of the 120 models. The hourly study announced in Section 4.5 will treat breezes explicitly, with observed winds.
Finally, the boundary-layer height follows a marked diurnal cycle. This does not affect the daily decomposition but will require explicit treatment in further hourly analyses.
4.5. Further Developments
This study provides the empirical and methodological basis for two complementary research programmes. Both are already underway, and neither would have been feasible without the groundwork established here. That groundwork is threefold: a harmonised daily dataset in which every city is represented by urban-background stations (Lille over 2018–2021 only) and a verified land grid point, a sequence of analytical frames that turns a variance attribution into a test against seasonal and trend confounding, and a typology that states a testable hypothesis about which cities are wind-dominated.
The first is a finer-grained exploitation of the hourly record. The daily resolution adopted for the main analysis was a deliberate choice, justified by the persistence structure of the series, but the underlying hourly data resolve the sub-diurnal dynamics that daily averaging suppresses. Analysing each meteorological driver jointly at hourly resolution, across all 10 cities and the four pollutants, should allow the statistical associations diagnosed here to be connected to the underlying physical mechanisms, pollutant by pollutant. The objective of this strand is mechanistic rather than descriptive. It could eventually lead to quantitative formulations.
The second is a large-scale characterisation of European cities and a finer typology of dispersion regimes. The three-type typology established here rests on 10 French cities. Extending it to the whole of Europe is the natural next step. It would add topographic and climatic settings absent from the French sample, from the Po valley basin to the Nordic coastal cities, and a sample of several hundred cities would make an unsupervised clustering of dispersion regimes statistically well-posed. Such an extension would also test whether the three types found here are a French particularity or a general feature of the European urban network.
5. Conclusions
The meteorological signal in daily urban pollution is best described not by a single dominant variable but by a balance among wind speed, boundary-layer height and, for ozone, temperature and humidity, a balance that is specific to each pollutant and each city and that becomes clear only once seasonal confounding and aggregation scale are handled explicitly.
The central result is a wind–boundary-layer dissociation. On raw correlations, the two drivers look almost interchangeable, the boundary layer leading by a factor of 1.3 to 1.4 on the primary species. On unique variance, it leads by a factor of about four for NO2 and of eight to ten for particulate matter. Surface wind and boundary-layer height are strongly collinear, with a ten-city mean r ≈ 0.70 in the pooled frame rising to a mean of about 0.81 on deseasonalised anomalies and reaching 0.85 to 0.87 in the most strongly coupled cities. The apparent wind effect in a univariate or poorly specified model is therefore, for most cities and pollutants, in large part not unique to wind. It is variance shared with the boundary layer, which the partition assigns to neither driver. These data cannot say which pathway, ventilation or vertical mixing, carries it.
The unique contribution of wind, recovered once the two are separated, is small [19,20,30]. In the pooled frame, boundary-layer height dominates wind for every pollutant in the ten-city mean. For particulate matter, in the ten-city mean, this lead holds in all four analytical frames at the daily scale and, on the deseasonalised anomalies, at aggregation windows from one to thirty days (Table S10), and, in the three frames where it was tested, with wind direction in the model. For ozone the unique signal is carried more by temperature and humidity than by mixing depth, most plausibly an insolation-linked photochemical signal. For NO2, the pooled dominance is partly seasonal, and on deseasonalised anomalies, the two contributions become comparable in the mean, with wind leading significantly only where coherent regional wind regimes exist (Mistral, Autan and Tramontane). This yields a compact three-type city typology, wind-dominated, transitional and BLH-dominated. Its ordering of the cities largely holds when wind direction is controlled, although two of the three transitional cities, Bordeaux and Lyon, then move toward wind.
Non-linearity is pervasive, wind direction adds a transport dimension distinct from ventilation, and each pollutant carries a persistence scale of roughly 1.2 to 2.6 days, ordered by atmospheric lifetime (Section 2.3), that sets its natural analysis window. These results refine how meteorology should be represented in air-quality analysis. Boundary-layer height should be elevated from an occasional covariate to a first-tier predictor. It is made routinely available by ERA5 [28] yet remains largely absent from operational European empirical models outside dedicated campaigns [44,45], and it carries concrete implications for meteorological normalisation and exposure assessment [30,47].
Supplementary Materials
The following supporting information can be downloaded at: https://www.mdpi.com/article/10.3390/environments13110613/s1, Figure S1: Wind–pollution correlation as a function of the temporal aggregation window (Marseille and Lyon). Figure S2: Response of the deseasonalised NO2 anomalies to the daily wind direction, by city. Figure S3: Effect of the wind-direction block on the NO2 wind/BLH balance, by city. Table S1: Stations and day-by-day check of the pollution series. Table S2: Sensitivity of the main statistics to the Lille series. Table S3: Ten-city mean Pearson correlation matrix of the seven meteorological parameters and the four pollutants. Table S4: Linear versus generalised additive model comparison for the forty city × pollutant pairs. Table S5: Unique contributions of wind and BLH in the generalised additive models. Table S6: Significance of the wind and BLH terms, classical F-test and HAC Wald test. Table S7: Sensitivity of the decomposition to the treatment of the multi-year trend. Table S8: Wind speed versus the wind-direction block, in sample and cross-validated, and the wind/BLH balance with and without the block. Table S9: Bootstrap 95% confidence intervals of the NO2 wind and BLH sr2 and of their difference, third and fourth rungs. Table S10: Unique contributions of wind and BLH after averaging the anomalies over windows of 1 to 30 days. Table S11: Diagnostics of the daily wind direction.
Author Contributions
Conceptualization, O.B.; methodology, O.B.; software, O.B.; validation, O.B., J.-B.R., J.S., D.C. and C.M.; formal analysis, O.B., J.-B.R. and J.S.; data curation, O.B.; writing—original draft preparation, O.B.; writing—review and editing, O.B., J.-B.R., J.S., D.C. and C.M.; supervision, J.-B.R. All authors have read and agreed to the published version of the manuscript.
Funding
This research received no external funding.
Institutional Review Board Statement
Not applicable.
Informed Consent Statement
Not applicable.
Data Availability Statement
Daily pollutant concentrations are publicly available from the French national air-quality database Geod’air (https://www.geodair.fr, accessed on 5 August 2026) under the Licence Ouverte/Open Licence. Boundary-layer height and surface meteorology are from the ERA5 reanalysis (Copernicus Climate Data Store, https://doi.org/10.24381/cds.adbb2d47). The validated, harmonised daily dataset analysed in this study (10 cities, 2018–2025, Lille pollutants 2018–2021, four pollutants and eight meteorological variables) is openly available on Zenodo at https://doi.org/10.5281/zenodo.23691227 (version 3) under a CC BY 4.0 licence.
Acknowledgments
During the preparation of this study, the corresponding author used Claude Opus 4.8 and Claude Fable 5.5, by Anthropic, to automate the extraction of some parts of the ERA5 data and implement some statistical analysis. The resulting files were spot-checked by the authors at delivery, and again whenever a specific case was mobilised. During the revision, the corresponding author also used Claude (Anthropic) to check the pollution series against the validated data of the European Environment Agency, to recompute the analyses on the corrected dataset and to produce the new tables and figures. These outputs were checked by the corresponding author. During the preparation of this work, we also used AI in order to improve the clarity of the English text or to translate it from French. After using this tool, the authors reviewed and edited the content as needed and take full responsibility for the content of the published article.
Conflicts of Interest
Author Jeremy Surcin was employed by the company Analysis Mddeling Statistics. The remaining authors declare that the research was conducted in the absence of any commercial or financial relationships that could be construed as a potential conflict of interest.
References
- Cohen, A.J.; Brauer, M.; Burnett, R.; Anderson, H.R.; Frostad, J.; Estep, K.; Balakrishnan, K.; Brunekreef, B.; Dandona, L.; Dandona, R.; et al. Estimates and 25-year trends of the global burden of disease attributable to ambient air pollution: An analysis of data from the Global Burden of Diseases Study 2015. Lancet 2017, 389, 1907–1918. [Google Scholar] [CrossRef] [Scilit]
- Brauer, M.; Roth, G.A.; Aravkin, A.Y.; Zheng, P.; Abate, K.H.; Abate, Y.H.; Abbafati, C.; Abbasgholizadeh, R.; Abbasi, M.A.; Abbasian, M.; et al. Global burden and strength of evidence for 88 risk factors in 204 countries and 811 subnational locations, 1990–2021: A systematic analysis for the Global Burden of Disease Study 2021. Lancet 2024, 403, 2162–2203. [Google Scholar] [CrossRef] [Scilit]
- Lelieveld, J.; Pozzer, A.; Pöschl, U.; Fnais, M.; Haines, A.; Münzel, T. Loss of life expectancy from air pollution compared to other risk factors: A worldwide perspective. Cardiovasc. Res. 2020, 116, 1910–1917. [Google Scholar] [CrossRef] [Scilit]
- Khomenko, S.; Cirach, M.; Pereira-Barboza, E.; Mueller, N.; Barrera-Gómez, J.; Rojas-Rueda, D.; de Hoogh, K.; Hoek, G.; Nieuwenhuijsen, M. Premature mortality due to air pollution in European cities: A health impact assessment. Lancet Planet. Health 2021, 5, e121–e134. [Google Scholar] [CrossRef] [Scilit]
- Strak, M.; Weinmayr, G.; Rodopoulou, S.; Chen, J.; de Hoogh, K.; Andersen, Z.J.; Bellander, T.; Brandt, J.; Forastiere, F.; Fecht, D.; et al. Long term exposure to low level air pollution and mortality in eight European cohorts within the ELAPSE project: Pooled analysis. BMJ 2021, 374, n1904. [Google Scholar] [CrossRef] [Scilit]
- Stafoggia, M.; Oftedal, B.; Chen, J.; Rodopoulou, S.; Renzi, M.; Atkinson, R.W.; Bauwelinck, M.; Klompmaker, J.O.; Mehta, A.; Vienneau, D.; et al. Long-term exposure to low ambient air pollution concentrations and mortality among 28 million people: Results from seven large European cohorts within the ELAPSE project. Lancet Planet. Health 2022, 6, e9–e18. [Google Scholar] [CrossRef] [Scilit]
- Orellano, P.; Reynoso, J.; Quaranta, N.; Bardach, A.; Ciapponi, A. Short-term exposure to particulate matter (PM10 and PM2.5), nitrogen dioxide (NO2), and ozone (O3) and all-cause and cause-specific mortality: Systematic review and meta-analysis. Environ. Int. 2020, 142, 105876. [Google Scholar] [CrossRef] [Scilit]
- Chen, J.; Hoek, G. Long-term exposure to PM and all-cause and cause-specific mortality: A systematic review and meta-analysis. Environ. Int. 2020, 143, 105974. [Google Scholar] [CrossRef] [Scilit]
- Huangfu, P.; Atkinson, R. Long-term exposure to NO2 and O3 and all-cause and respiratory mortality: A systematic review and meta-analysis. Environ. Int. 2020, 144, 105998. [Google Scholar] [CrossRef] [Scilit]
- World Health Organization. WHO Global Air Quality Guidelines: Particulate Matter (PM2.5 and PM10), Ozone, Nitrogen Dioxide, Sulfur Dioxide and Carbon Monoxide; World Health Organization: Geneva, Switzerland, 2021. [Google Scholar]
- Boogaard, H.; Patton, A.P.; Atkinson, R.W.; Brook, J.R.; Chang, H.H.; Crouse, D.L.; Fussell, J.C.; Hoek, G.; Hoffmann, B.; Kappeler, R.; et al. Long-term exposure to traffic-related air pollution and selected health outcomes: A systematic review and meta-analysis. Environ. Int. 2022, 164, 107262. [Google Scholar] [CrossRef] [Scilit]
- Liu, C.; Chen, R.; Sera, F.; Vicedo-Cabrera, A.M.; Guo, Y.; Tong, S.; Coelho, M.S.Z.S.; Saldiva, P.H.N.; Lavigne, E.; Matus, P.; et al. Ambient particulate air pollution and daily mortality in 652 cities. N. Engl. J. Med. 2019, 381, 705–715. [Google Scholar] [CrossRef] [Scilit]
- Vicedo-Cabrera, A.M.; Sera, F.; Liu, C.; Armstrong, B.; Milojevic, A.; Guo, Y.; Tong, S.; Lavigne, E.; Kyselý, J.; Urban, A.; et al. Short term association between ozone and mortality: Global two stage time series study in 406 locations in 20 countries. BMJ 2020, 368, m108. [Google Scholar] [CrossRef] [Scilit]
- Meng, X.; Liu, C.; Chen, R.; Sera, F.; Vicedo-Cabrera, A.M.; Milojevic, A.; Guo, Y.; Tong, S.; Coelho, M.S.Z.S.; Saldiva, P.H.N.; et al. Short term associations of ambient nitrogen dioxide with daily total, cardiovascular, and respiratory mortality: Multilocation analysis in 398 cities. BMJ 2021, 372, n534. [Google Scholar] [CrossRef] [Scilit]
- Seinfeld, J.H.; Pandis, S.N. Atmospheric Chemistry and Physics: From Air Pollution to Climate Change, 3rd ed.; Wiley: Hoboken, NJ, USA, 2016. [Google Scholar]
- Jones, A.M.; Harrison, R.M.; Baker, J. The wind speed dependence of the concentrations of airborne particulate matter and NOx. Atmos. Environ. 2010, 44, 1682–1690. [Google Scholar] [CrossRef] [Scilit]
- Otero, N.; Sillmann, J.; Mar, K.A.; Rust, H.W.; Solberg, S.; Andersson, C.; Engardt, M.; Bergström, R.; Bessagnet, B.; Colette, A.; et al. A multi-model comparison of meteorological drivers of surface ozone over Europe. Atmos. Chem. Phys. 2018, 18, 12269–12288. [Google Scholar] [CrossRef] [Scilit]
- Tai, A.P.K.; Mickley, L.J.; Jacob, D.J. Correlations between fine particulate matter (PM2.5) and meteorological variables in the United States: Implications for the sensitivity of PM2.5 to climate change. Atmos. Environ. 2010, 44, 3976–3984. [Google Scholar] [CrossRef] [Scilit]
- Stull, R.B. An Introduction to Boundary Layer Meteorology; Kluwer Academic Publishers: Dordrecht, The Netherlands, 1988. [Google Scholar]
- Su, T.; Li, Z.; Kahn, R. Relationships between the planetary boundary layer height and surface pollutants derived from lidar observations over China: Regional pattern and influencing factors. Atmos. Chem. Phys. 2018, 18, 15921–15935. [Google Scholar] [CrossRef] [Scilit]
- Schäfer, K.; Emeis, S.; Hoffmann, H.; Jahn, C. Influence of mixing layer height upon air pollution in urban and sub-urban areas. Meteorol. Z. 2006, 15, 647–658. [Google Scholar] [CrossRef] [Scilit]
- Salvador, P.; Pandolfi, M.; Tobías, A.; Gómez-Moreno, F.J.; Molero, F.; Barreiro, M.; Pérez, N.; Marco, I.M.; Revuelta, M.A.; Querol, X.; et al. Impact of mixing layer height variations on air pollutant concentrations and health in a European urban area: Madrid (Spain), a case study. Environ. Sci. Pollut. Res. 2020, 27, 41702–41716. [Google Scholar] [CrossRef] [Scilit]
- Britter, R.E.; Hanna, S.R. Flow and dispersion in urban areas. Annu. Rev. Fluid Mech. 2003, 35, 469–496. [Google Scholar] [CrossRef] [Scilit]
- Garrido-Perez, J.M.; Ordóñez, C.; García-Herrera, R.; Barriopedro, D. Air stagnation in Europe: Spatiotemporal variability and impact on air quality. Sci. Total Environ. 2018, 645, 1238–1252. [Google Scholar] [CrossRef] [Scilit]
- Garrido-Perez, J.M.; García-Herrera, R.; Ordóñez, C. Assessing the value of air stagnation indices to reproduce PM10 variability in Europe. Atmos. Res. 2021, 248, 105258. [Google Scholar] [CrossRef] [Scilit]
- Holzworth, G.C. Mixing depths, wind speeds and air pollution potential for selected locations in the United States. J. Appl. Meteorol. 1967, 6, 1039–1044. [Google Scholar] [CrossRef] [Scilit]
- Soleimanpour, M.; Alizadeh, O.; Sabetghadam, S. Analysis of diurnal to seasonal variations and trends in air pollution potential in an urban area. Sci. Rep. 2023, 13, 21065. [Google Scholar] [CrossRef] [Scilit]
- Hersbach, H.; Bell, B.; Berrisford, P.; Hirahara, S.; Horányi, A.; Muñoz-Sabater, J.; Nicolas, J.; Peubey, C.; Radu, R.; Schepers, D.; et al. The ERA5 global reanalysis. Q. J. R. Meteorol. Soc. 2020, 146, 1999–2049. [Google Scholar] [CrossRef] [Scilit]
- Rigby, M.; Toumi, R. London air pollution climatology: Indirect evidence for urban boundary layer height and wind speed enhancement. Atmos. Environ. 2008, 42, 4932–4947. [Google Scholar] [CrossRef] [Scilit]
- Grange, S.K.; Carslaw, D.C.; Lewis, A.C.; Boleti, E.; Hueglin, C. Random forest meteorological normalisation models for Swiss PM10 trend analysis. Atmos. Chem. Phys. 2018, 18, 6223–6239. [Google Scholar] [CrossRef] [Scilit]
- Grundström, M.; Hak, C.; Chen, D.; Hallquist, M.; Pleijel, H. Variation and co-variation of PM10, particle number concentration, NOx and NO2 in the urban air: Relationships with wind speed, vertical temperature gradient and weather type. Atmos. Environ. 2015, 120, 317–327. [Google Scholar] [CrossRef] [Scilit]
- Geiß, A.; Wiegner, M.; Bonn, B.; Schäfer, K.; Forkel, R.; von Schneidemesser, E.; Münkel, C.; Chan, K.L.; Nothard, R. Mixing layer height as an indicator for urban air quality? Atmos. Meas. Tech. 2017, 10, 2969–2988. [Google Scholar] [CrossRef] [Scilit]
- Dormann, C.F.; Elith, J.; Bacher, S.; Buchmann, C.; Carl, G.; Carré, G.; García Marquéz, J.R.; Gruber, B.; Lafourcade, B.; Leitão, P.J.; et al. Collinearity: A review of methods to deal with it and a simulation study evaluating their performance. Ecography 2013, 36, 27–46. [Google Scholar] [CrossRef] [Scilit]
- Renard, J.-B.; Surcin, J. PM2.5 pollution decrease in Paris, France, for the 2013–2024 period: An evaluation of the local source contributions by subtracting the effect of wind speed. Sensors 2025, 25, 6566. [Google Scholar] [CrossRef] [Scilit]
- Laughner, J.L.; Cohen, R.C. Direct observation of changing NOx lifetime in North American cities. Science 2019, 366, 723–727. [Google Scholar] [CrossRef] [Scilit]
- Farmer, D.K.; Boedicker, E.K.; DeBolt, H.M. Dry deposition of atmospheric aerosols: Approaches, observations, and mechanisms. Annu. Rev. Phys. Chem. 2021, 72, 375–397. [Google Scholar] [CrossRef] [Scilit]
- McMullen, N.; Annesi-Maesano, I.; Renard, J.-B. Impact of rain precipitation on urban atmospheric particle matter measured at three locations in France between 2013 and 2019. Atmosphere 2021, 12, 769. [Google Scholar] [CrossRef] [Scilit]
- Ding, A.J.; Huang, X.; Nie, W.; Sun, J.N.; Kerminen, V.-M.; Petäjä, T.; Su, H.; Cheng, Y.F.; Yang, X.-Q.; Wang, M.H.; et al. Enhanced haze pollution by black carbon in megacities in China. Geophys. Res. Lett. 2016, 43, 2873–2879. [Google Scholar] [CrossRef] [Scilit]
- Petäjä, T.; Järvi, L.; Kerminen, V.-M.; Ding, A.J.; Sun, J.N.; Nie, W.; Kujansuu, J.; Virkkula, A.; Yang, X.; Fu, C.B.; et al. Enhanced air pollution via aerosol–boundary layer feedback in China. Sci. Rep. 2016, 6, 18998. [Google Scholar] [CrossRef] [Scilit]
- Li, Z.; Guo, J.; Ding, A.; Liao, H.; Liu, J.; Sun, Y.; Wang, T.; Xue, H.; Zhang, H.; Zhu, B. Aerosol and boundary-layer interactions and impact on air quality. Natl. Sci. Rev. 2017, 4, 810–833. [Google Scholar] [CrossRef] [Scilit]
- Kristiansen, N.I.; Stohl, A.; Olivié, D.J.L.; Croft, B.; Søvde, O.A.; Klein, H.; Christoudias, T.; Kunkel, D.; Leadbetter, S.J.; Lee, Y.H.; et al. Evaluation of observed and modelled aerosol lifetimes using radioactive tracers of opportunity and an ensemble of 19 global models. Atmos. Chem. Phys. 2016, 16, 3525–3561. [Google Scholar] [CrossRef] [Scilit]
- Miao, Y.; Liu, S.; Guo, J.; Huang, S.; Yan, Y.; Lou, M. Unraveling the relationships between boundary layer height and PM2.5 pollution in China based on four-year radiosonde measurements. Environ. Pollut. 2018, 243, 1186–1195. [Google Scholar] [CrossRef] [Scilit]
- Pal, S.; Lopez, M.; Schmidt, M.; Ramonet, M.; Gibert, F.; Xueref-Remy, I.; Ciais, P. Investigation of the atmospheric boundary layer depth variability and its impact on the 222Rn concentration at a rural site in France. J. Geophys. Res. Atmos. 2015, 120, 623–643. [Google Scholar] [CrossRef] [Scilit]
- Kotthaus, S.; Bravo-Aranda, J.A.; Collaud Coen, M.; Guerrero-Rascádo, J.L.; Costa, M.J.; Cimini, D.; O’Connor, E.J.; Hervo, M.; Alados-Arboledas, L.; Jiménez-Portaz, M.; et al. Atmospheric boundary layer height from ground-based remote sensing: A review of capabilities and limitations. Atmos. Meas. Tech. 2023, 16, 433–479. [Google Scholar] [CrossRef] [Scilit]
- Nguyen, D.-H.; Štefánik, D.; Šedivá, T.; Lin, C. Properties of the mixing layer height retrieved from ceilometer measurements in Slovakia and its relationship to the air pollutant concentrations. Environ. Sci. Pollut. Res. 2023, 30, 115666–115682. [Google Scholar] [CrossRef] [Scilit]
- von Engeln, A.; Teixeira, J. A planetary boundary layer height climatology derived from ECMWF reanalysis data. J. Clim. 2013, 26, 6575–6590. [Google Scholar] [CrossRef] [Scilit]
- Grange, S.K.; Carslaw, D.C. Using meteorological normalisation to detect interventions in air quality time series. Sci. Total Environ. 2019, 653, 578–588. [Google Scholar] [CrossRef] [Scilit]
- García-Herrera, R.; Garrido-Perez, J.M.; Ordóñez, C. Modulation of European air quality by Euro-Atlantic weather regimes. Atmos. Res. 2022, 277, 106292. [Google Scholar] [CrossRef] [Scilit]
- Fu, H.; Zhang, Y.; Liao, C.; Mao, L.; Wang, Z.; Hong, N. Investigating PM2.5 responses to other air pollutants and meteorological factors across multiple temporal scales. Sci. Rep. 2020, 10, 15639. [Google Scholar] [CrossRef] [Scilit]
- Ineris/LCSQA. Geod’air: Base de Données Nationale de la Qualité de l’Air; Institut National de l’Environnement Industriel et des Risques, au Titre du Laboratoire Central de Surveillance de la Qualité de l’Air, Pour le Ministère Chargé de l’Environnement: Verneuil-en-Halatte, France. Available online: https://www.geodair.fr (accessed on 5 August 2026).
- Corsmeier, U.; Behrendt, R.; Drobinski, P.; Kottmeier, C. The mistral and its effect on air pollution transport and vertical mixing. Atmos. Res. 2005, 74, 275–302. [Google Scholar] [CrossRef] [Scilit]
- Obermann, A.; Bastin, S.; Belamari, S.; Conte, D.; Gaertner, M.A.; Li, L.; Ahrens, B. Mistral and Tramontane wind speed and wind direction patterns in regional climate simulations. Clim. Dyn. 2018, 51, 1059–1076. [Google Scholar] [CrossRef] [Scilit]
- Bastin, S.; Drobinski, P.; Dabas, A.; Delville, P.; Reitebuch, O.; Werner, C. Impact of the Rhône and Durance valleys on sea-breeze circulation in the Marseille area. Atmos. Res. 2005, 74, 303–328. [Google Scholar] [CrossRef] [Scilit]
- Laboratoire Central de Surveillance de la Qualité de l’Air (LCSQA). Les Données Nationales de Qualité de l’Air. Available online: https://www.lcsqa.org/fr/les-donnees-nationales-de-qualite-de-lair (accessed on 20 October 2026).
- Laboratoire Central de Surveillance de la Qualité de l’Air (LCSQA). Les Zones Administratives et Stations de Surveillance. Available online: https://www.lcsqa.org/fr/les-zones-administratives-et-stations-de-surveillance (accessed on 20 October 2026).
- Ineris. IMT Nord-Europe, Ineris and LNE Strengthen Their Partnership in the Field of Air Quality Monitoring within the Scientific Interest Group LCSQA. 11 September 2023. Available online: https://www.ineris.fr/en/ineris/news/imt-nord-europe-ineris-and-lne-strengthen-their-partnership-field-air-quality (accessed on 20 October 2026).
- Fédération Atmo France. Les AASQA, l’Expertise de Référence sur la Qualité de l’Air. Available online: https://www.atmo-france.org/article/les-aasqa-lexpertise-de-reference-sur-la-qualite-de-lair (accessed on 20 October 2026).
- European Parliament and Council. Directive 2008/50/EC of the European Parliament and of the Council of 21 May 2008 on ambient air quality and cleaner air for Europe. Off. J. Eur. Union 2008, L 152, 1–44. [Google Scholar]
- European Parliament and Council. Directive (EU) 2024/2881 of the European Parliament and of the Council of 23 October 2024 on ambient air quality and cleaner air for Europe (recast). Off. J. Eur. Union 2024, L 2024/2881. [Google Scholar]
- Mathé, F.; Malherbe, L. Conception, Implantation et Suivi des Stations Françaises de Surveillance de la Qualité de l’Air; Guide méthodologique LCSQA; IMT Lille Douai and Ineris: Douai and Verneuil-en-Halatte, France, 2016; Available online: https://www.lcsqa.org (accessed on 5 August 2026).
- Cohen, J.; Cohen, P.; West, S.G.; Aiken, L.S. Applied Multiple Regression/Correlation Analysis for the Behavioral Sciences, 3rd ed.; Lawrence Erlbaum Associates: Mahwah, NJ, USA, 2003. [Google Scholar]
- Grömping, U. Relative importance for linear regression in R: The package relaimpo. J. Stat. Softw. 2006, 17, 1–27. [Google Scholar] [CrossRef] [Scilit]
- Ray-Mukherjee, J.; Nimon, K.; Mukherjee, S.; Morris, D.W.; Slotow, R.; Hamer, M. Using commonality analysis in multiple regressions: A tool to decompose regression effects in the face of multicollinearity. Methods Ecol. Evol. 2014, 5, 320–328. [Google Scholar] [CrossRef] [Scilit]
- Wood, S.N. Generalized Additive Models: An Introduction with R, 2nd ed.; Chapman and Hall/CRC: Boca Raton, FL, USA, 2017. [Google Scholar] [CrossRef] [Scilit]
- Wood, S.N. Thin plate regression splines. J. R. Stat. Soc. Ser. B Stat. Methodol. 2003, 65, 95–114. [Google Scholar] [CrossRef] [Scilit]
- Wood, S.N. Fast stable restricted maximum likelihood and marginal likelihood estimation of semiparametric generalized linear models. J. R. Stat. Soc. Ser. B Stat. Methodol. 2011, 73, 3–36. [Google Scholar] [CrossRef] [Scilit]
- Newey, W.K.; West, K.D. A simple, positive semi-definite, heteroskedasticity and autocorrelation consistent covariance matrix. Econometrica 1987, 55, 703–708. [Google Scholar] [CrossRef] [Scilit]
- Newey, W.K.; West, K.D. Automatic lag selection in covariance matrix estimation. Rev. Econ. Stud. 1994, 61, 631–653. [Google Scholar] [CrossRef] [Scilit]
- Mardia, K.V.; Jupp, P.E. Directional Statistics; John Wiley & Sons: Chichester, UK, 1999. [Google Scholar] [CrossRef] [Scilit]
- Roberts, D.R.; Bahn, V.; Ciuti, S.; Boyce, M.S.; Elith, J.; Guillera-Arroita, G.; Hauenstein, S.; Lahoz-Monfort, J.J.; Schröder, B.; Thuiller, W.; et al. Cross-validation strategies for data with temporal, spatial, hierarchical, or phylogenetic structure. Ecography 2017, 40, 913–929. [Google Scholar] [CrossRef] [Scilit]
- Politis, D.N.; Romano, J.P. The stationary bootstrap. J. Am. Stat. Assoc. 1994, 89, 1303–1313. [Google Scholar] [CrossRef]
- Schenker, N.; Gentleman, J.F. On judging the significance of differences by examining the overlap between confidence intervals. Am. Stat. 2001, 55, 182–186. [Google Scholar] [CrossRef] [Scilit]
- Colette, A.; Andersson, C.; Baklanov, A.; Bessagnet, B.; Brandt, J.; Christensen, J.H.; Doherty, R.; Engardt, M.; Geels, C.; Giannakopoulos, C.; et al. Is the ozone climate penalty robust in Europe? Environ. Res. Lett. 2015, 10, 084015. [Google Scholar] [CrossRef] [Scilit]
- Shi, Z.; Song, C.; Liu, B.; Lu, G.; Xu, J.; Van Vu, T.; Elliott, R.J.R.; Li, W.; Bloss, W.J.; Harrison, R.M. Abrupt but smaller than expected changes in surface air quality attributable to COVID-19 lockdowns. Sci. Adv. 2021, 7, eabd6696. [Google Scholar] [CrossRef] [Scilit]
- Dai, Y.; Liu, B.; Tong, C.; Carslaw, D.C.; MacKenzie, A.R.; Shi, Z. Rethinking machine learning weather normalisation: A refined strategy for short-term air pollution policies. Atmos. Chem. Phys. 2025, 25, 13585–13596. [Google Scholar] [CrossRef] [Scilit]
- Miao, Y.; Che, H.; Zhang, X.; Liu, S. Relationship between summertime concurring PM2.5 and O3 pollution and boundary layer height differs between Beijing and Shanghai, China. Environ. Pollut. 2021, 268, 115775. [Google Scholar] [CrossRef] [Scilit]
- Zeger, S.L.; Thomas, D.; Dominici, F.; Samet, J.M.; Schwartz, J.; Dockery, D.; Cohen, A. Exposure measurement error in time-series studies of air pollution: Concepts and consequences. Environ. Health Perspect. 2000, 108, 419–426. [Google Scholar] [CrossRef]
- Sheppard, L.; Burnett, R.T.; Szpiro, A.A.; Kim, S.-Y.; Jerrett, M.; Pope, C.A., III; Brunekreef, B. Confounding and exposure measurement error in air pollution epidemiology. Air Qual. Atmos. Health 2012, 5, 203–216. [Google Scholar] [CrossRef] [Scilit]
- Bhaskaran, K.; Gasparrini, A.; Hajat, S.; Smeeth, L.; Armstrong, B. Time series regression studies in environmental epidemiology. Int. J. Epidemiol. 2013, 42, 1187–1195. [Google Scholar] [CrossRef] [Scilit]
- Schwartz, J.; Bind, M.-A.; Koutrakis, P. Estimating causal effects of local air pollution on daily deaths: Effect of low levels. Environ. Health Perspect. 2017, 125, 23–29. [Google Scholar] [CrossRef] [Scilit]
- Renard, J.-B.; Marchand, C. High resolution mapping of PM2.5 concentrations in Paris (France) using mobile Pollutrack sensors network in 2020. Atmosphere 2021, 12, 529. [Google Scholar] [CrossRef] [Scilit]
- Renard, J.-B.; Surcin, J.; Annesi-Maesano, I.; Delaunay, G.; Poincelet, E.; Dixsaut, G. Relation between PM2.5 pollution and Covid-19 mortality in Western Europe for the 2020–2022 period. Sci. Total Environ. 2022, 848, 157579. [Google Scholar] [CrossRef] [Scilit]
- Renard, J.-B.; Surcin, J.; Annesi-Maesano, I.; Poincelet, E. Temporal evolution of PM2.5 levels and COVID-19 mortality in Europe for the 2020–2022 period. Atmosphere 2023, 14, 1222. [Google Scholar] [CrossRef] [Scilit]
- Janes, H.; Sheppard, L.; Lumley, T. Case-crossover analyses of air pollution exposure data: Referent selection strategies and their implications for bias. Epidemiology 2005, 16, 717–726. [Google Scholar] [CrossRef] [Scilit]
- Deryugina, T.; Heutel, G.; Miller, N.H.; Molitor, D.; Reif, J. The mortality and medical costs of air pollution: Evidence from changes in wind direction. Am. Econ. Rev. 2019, 109, 4178–4219. [Google Scholar] [CrossRef] [Scilit]
- Zabrocki, L.; Alari, A.; Benmarhnia, T. Improving the design stage of air pollution studies based on wind patterns. Sci. Rep. 2022, 12, 7917. [Google Scholar] [CrossRef] [Scilit]
- Yu, W.; Huang, W.; Gasparrini, A.; Sera, F.; Schneider, A.; Breitner, S.; Kyselj, J.; Urban, A.; Al-Aly, Z.; Xu, R.; et al. Ambient fine particulate matter and daily mortality: A comparative analysis of observed and estimated exposure in 347 cities. Int. J. Epidemiol. 2024, 53, dyae066. [Google Scholar] [CrossRef] [Scilit]
- Guo, J.; Zhang, J.; Yang, K.; Liao, H.; Zhang, S.; Huang, K.; Lv, Y.; Shao, J.; Yu, T.; Tong, B.; et al. Investigation of near-global daytime boundary layer height using high-resolution radiosondes: First results and comparison with ERA5, MERRA-2, JRA-55, and NCEP-2 reanalyses. Atmos. Chem. Phys. 2021, 21, 17079–17097. [Google Scholar] [CrossRef] [Scilit]
- Muller, C.L.; Chapman, L.; Grimmond, C.S.B.; Young, D.T.; Cai, X. Sensors and the city: A review of urban meteorological networks. Int. J. Climatol. 2013, 33, 1585–1600. [Google Scholar] [CrossRef] [Scilit]
- Droste, A.M.; Heusinkveld, B.G.; Fenner, D.; Steeneveld, G.-J. Assessing the potential and application of crowdsourced urban wind data. Q. J. R. Meteorol. Soc. 2020, 146, 2671–2688. [Google Scholar] [CrossRef] [Scilit]
- Barlow, J.F. Progress in observing and modelling the urban boundary layer. Urban Clim. 2014, 10, 216–240. [Google Scholar] [CrossRef] [Scilit]
- Smith, A.; Lott, N.; Vose, R. The Integrated Surface Database: Recent developments and partnerships. Bull. Am. Meteorol. Soc. 2011, 92, 704–708. [Google Scholar] [CrossRef] [Scilit]
- Carslaw, D.C.; Carslaw, N. Detecting and characterising small changes in urban nitrogen dioxide concentrations. Atmos. Environ. 2007, 41, 4723–4733. [Google Scholar] [CrossRef] [Scilit]
- Carslaw, D.C.; Ropkins, K. Openair—An R package for air quality data analysis. Environ. Model. Softw. 2012, 27–28, 52–61. [Google Scholar] [CrossRef] [Scilit]
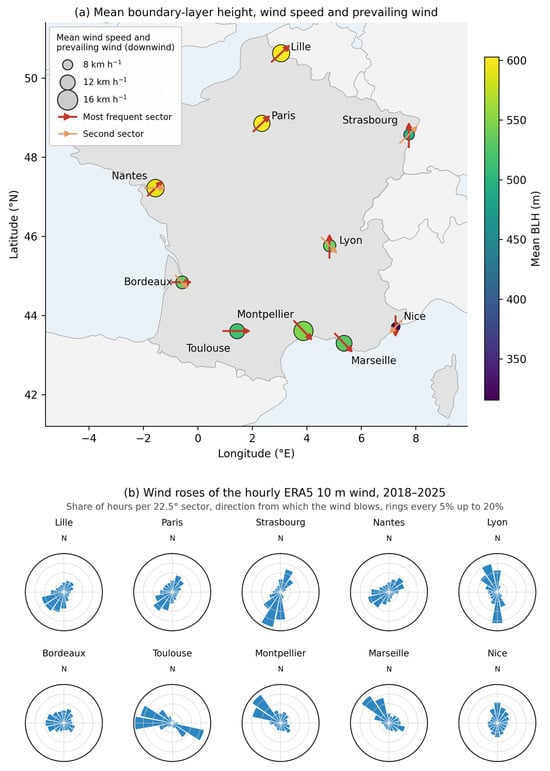
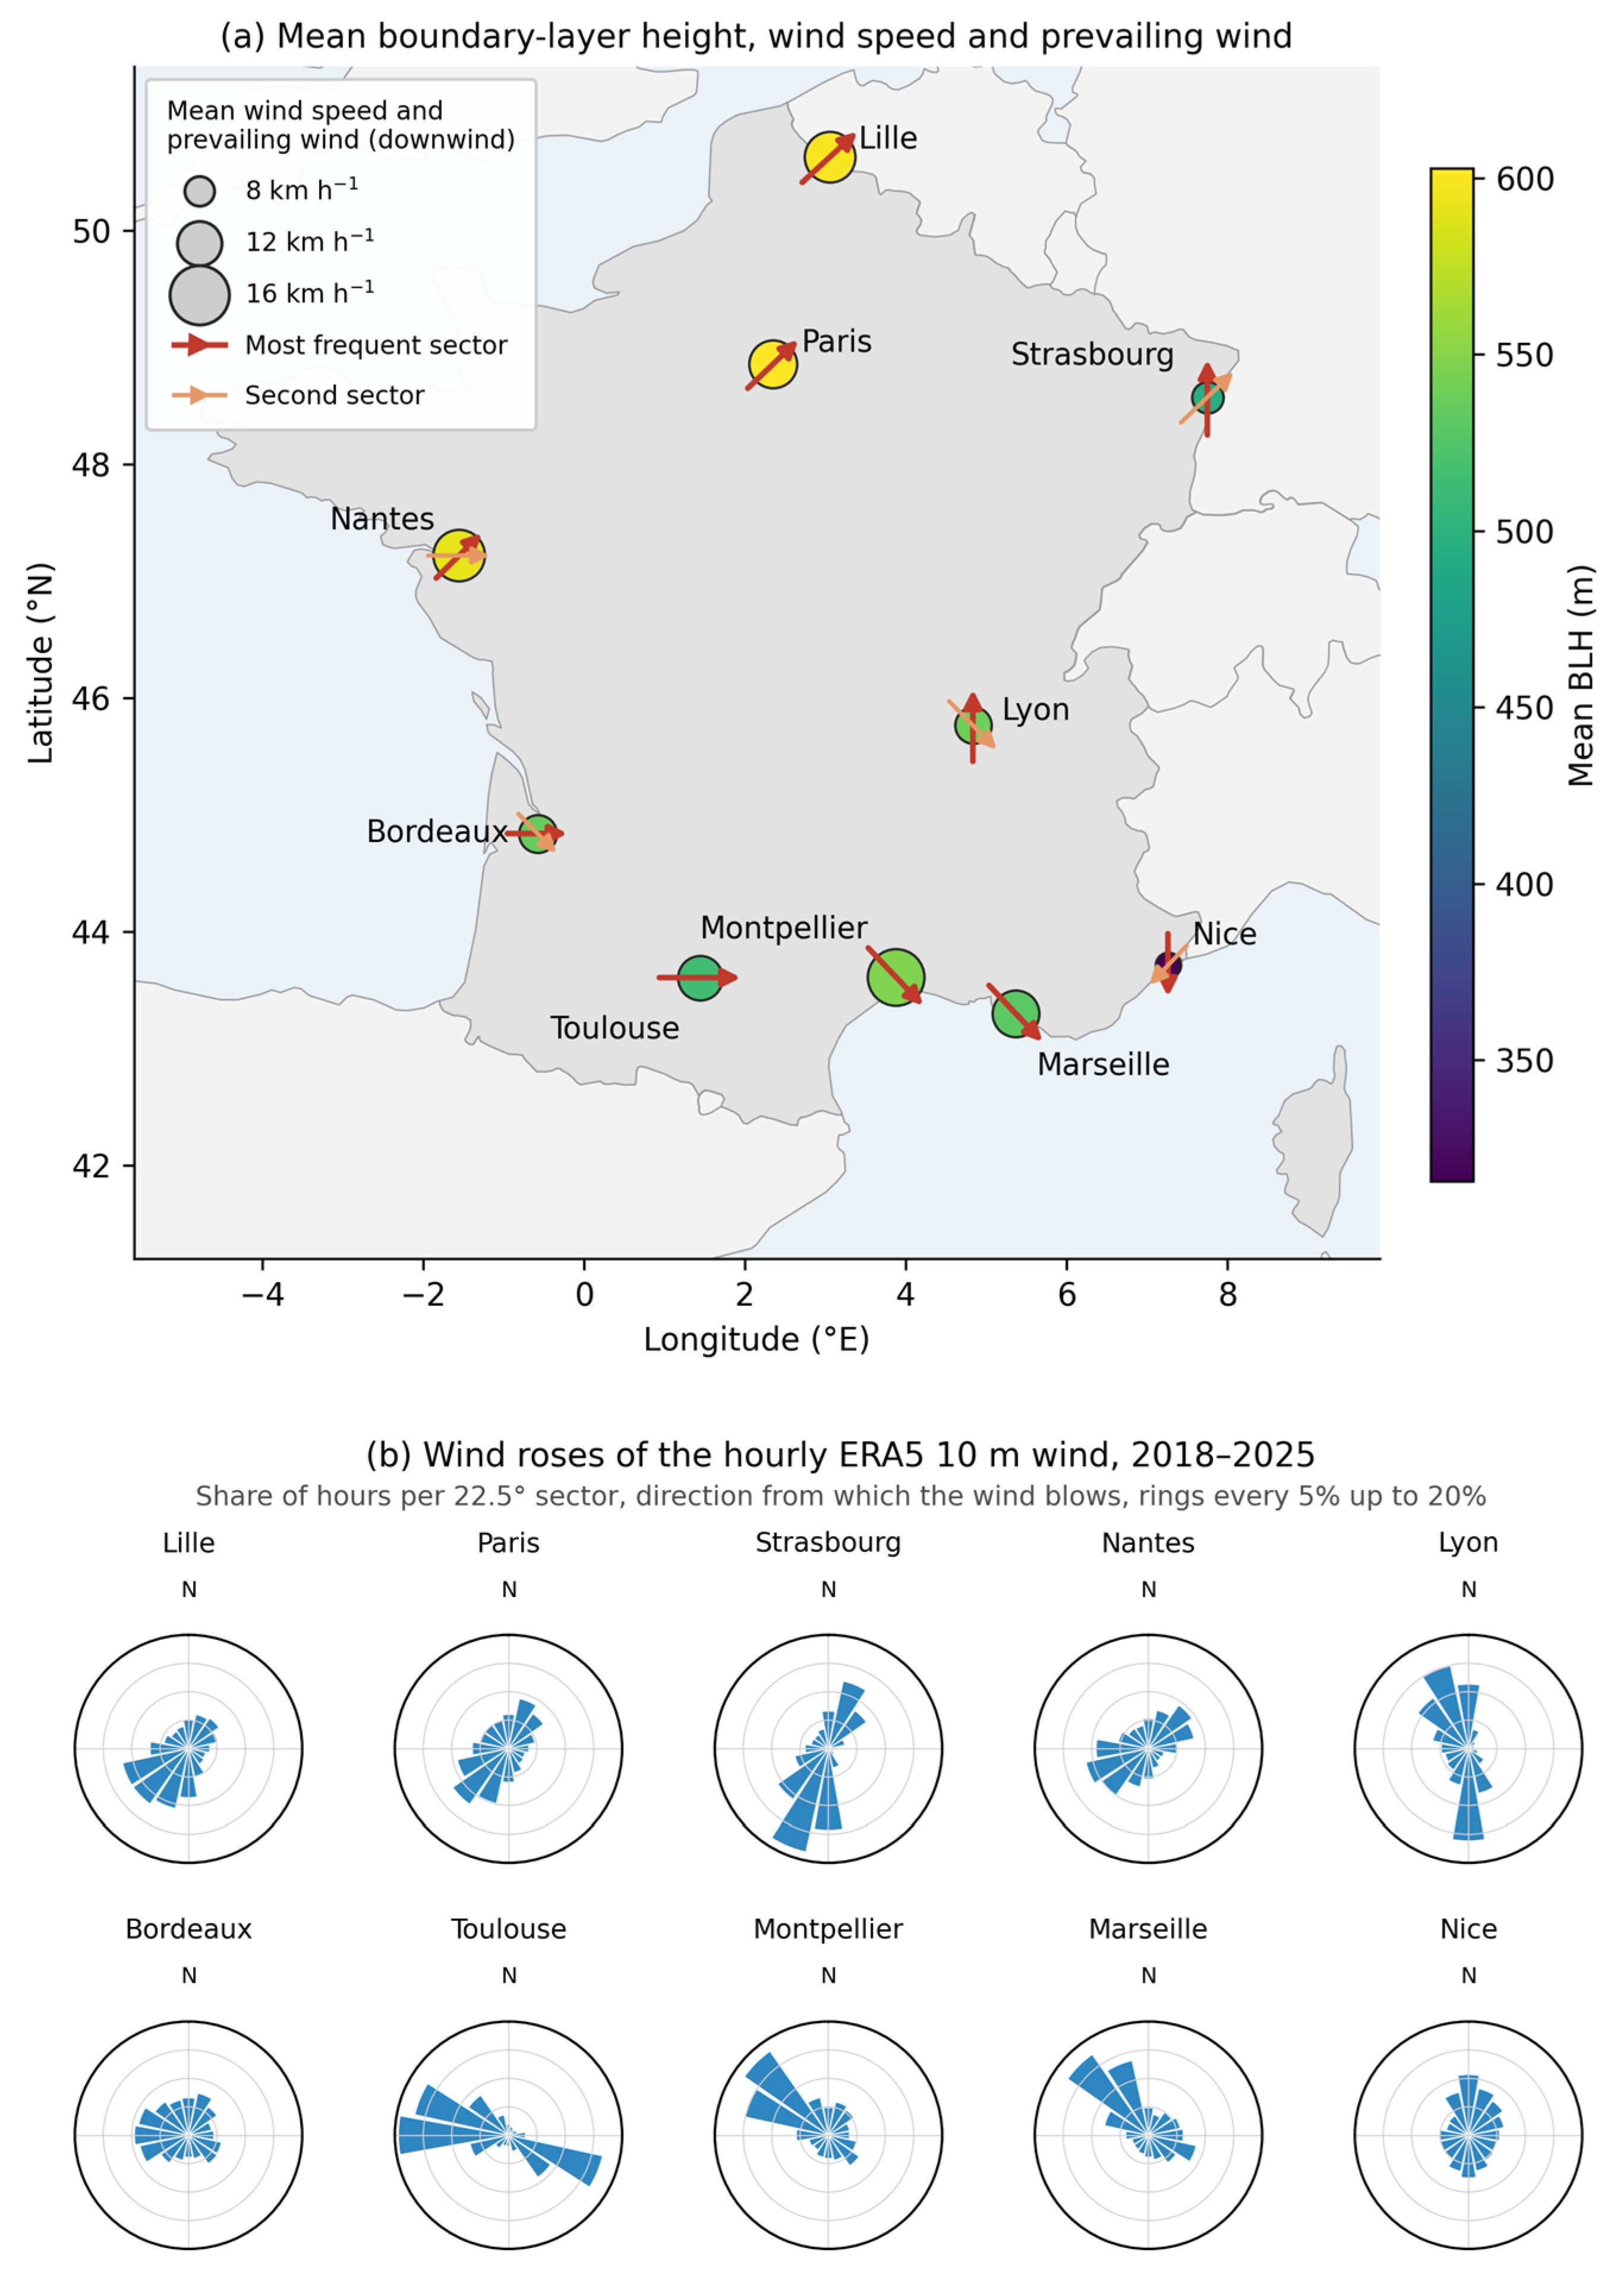
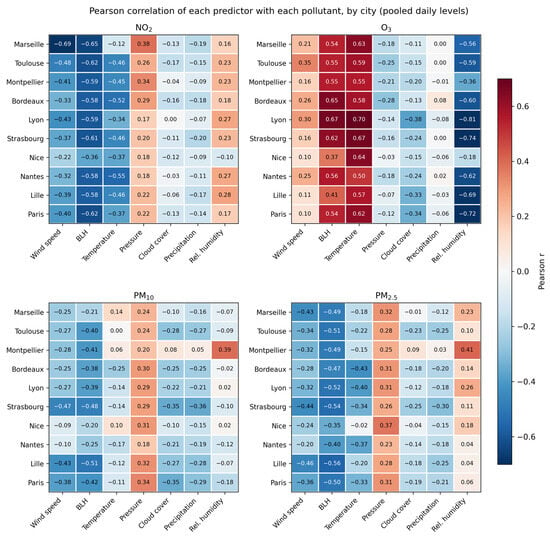
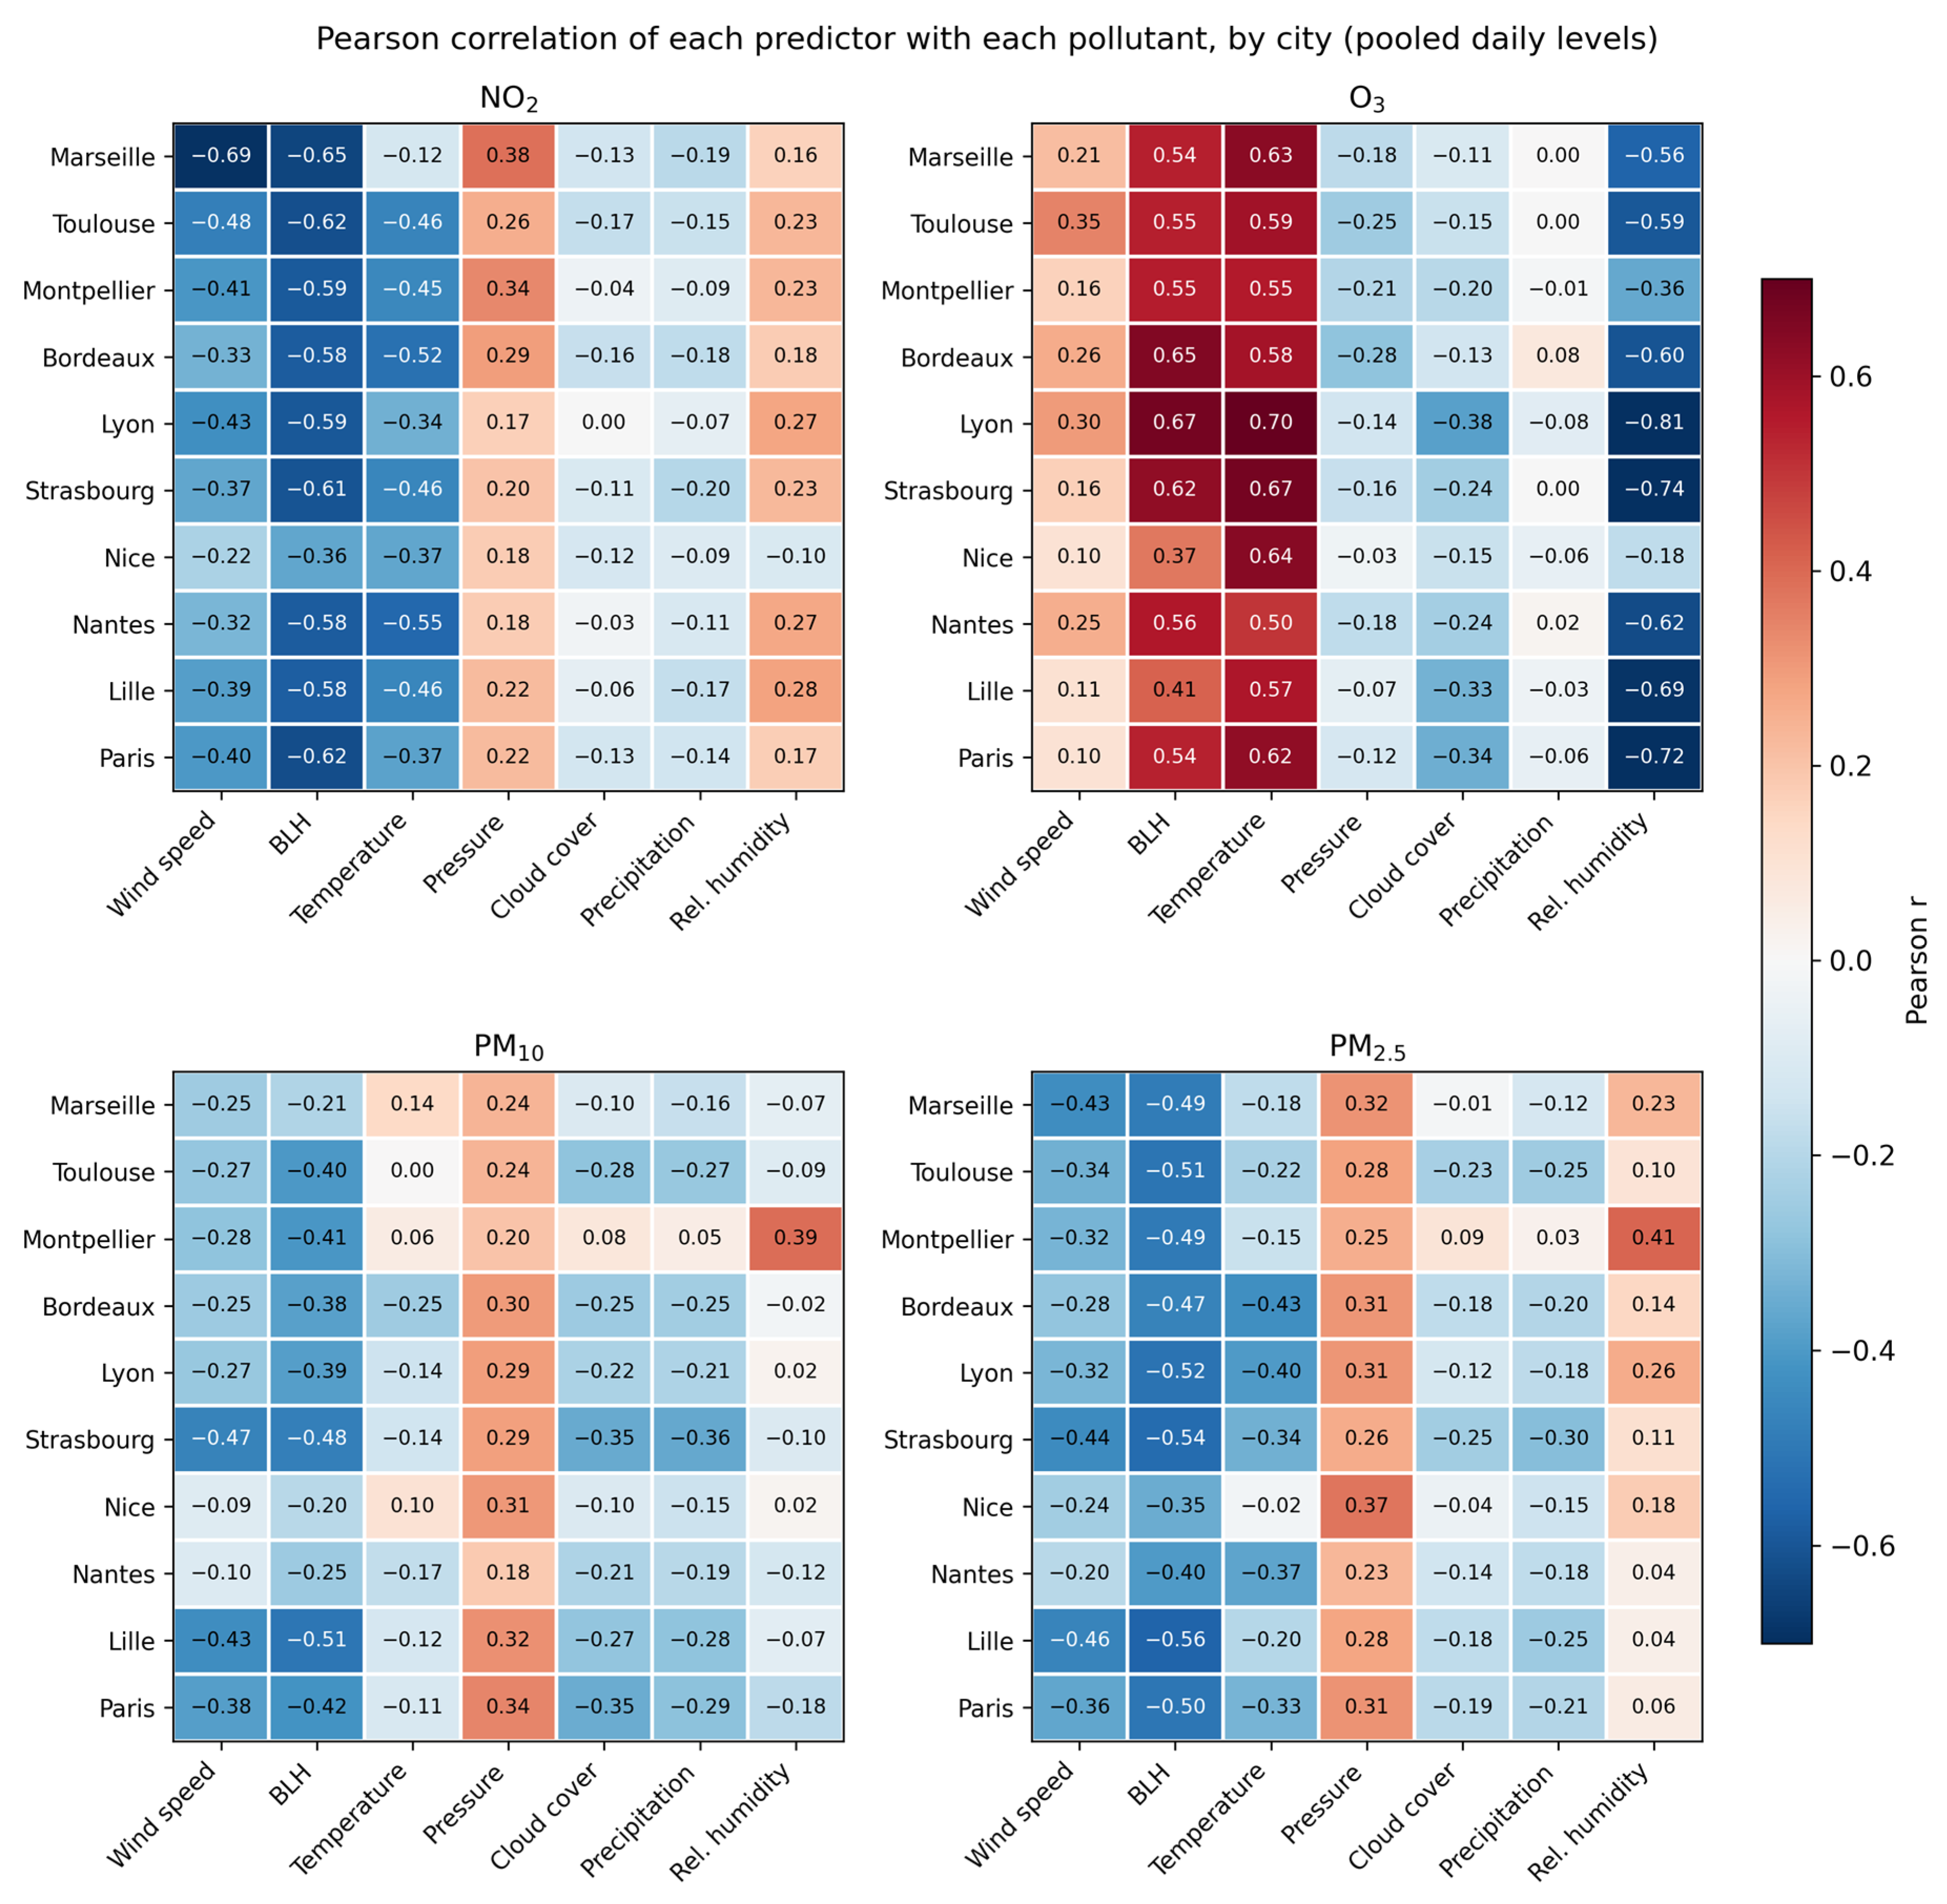
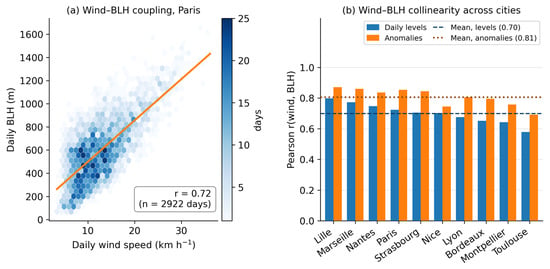
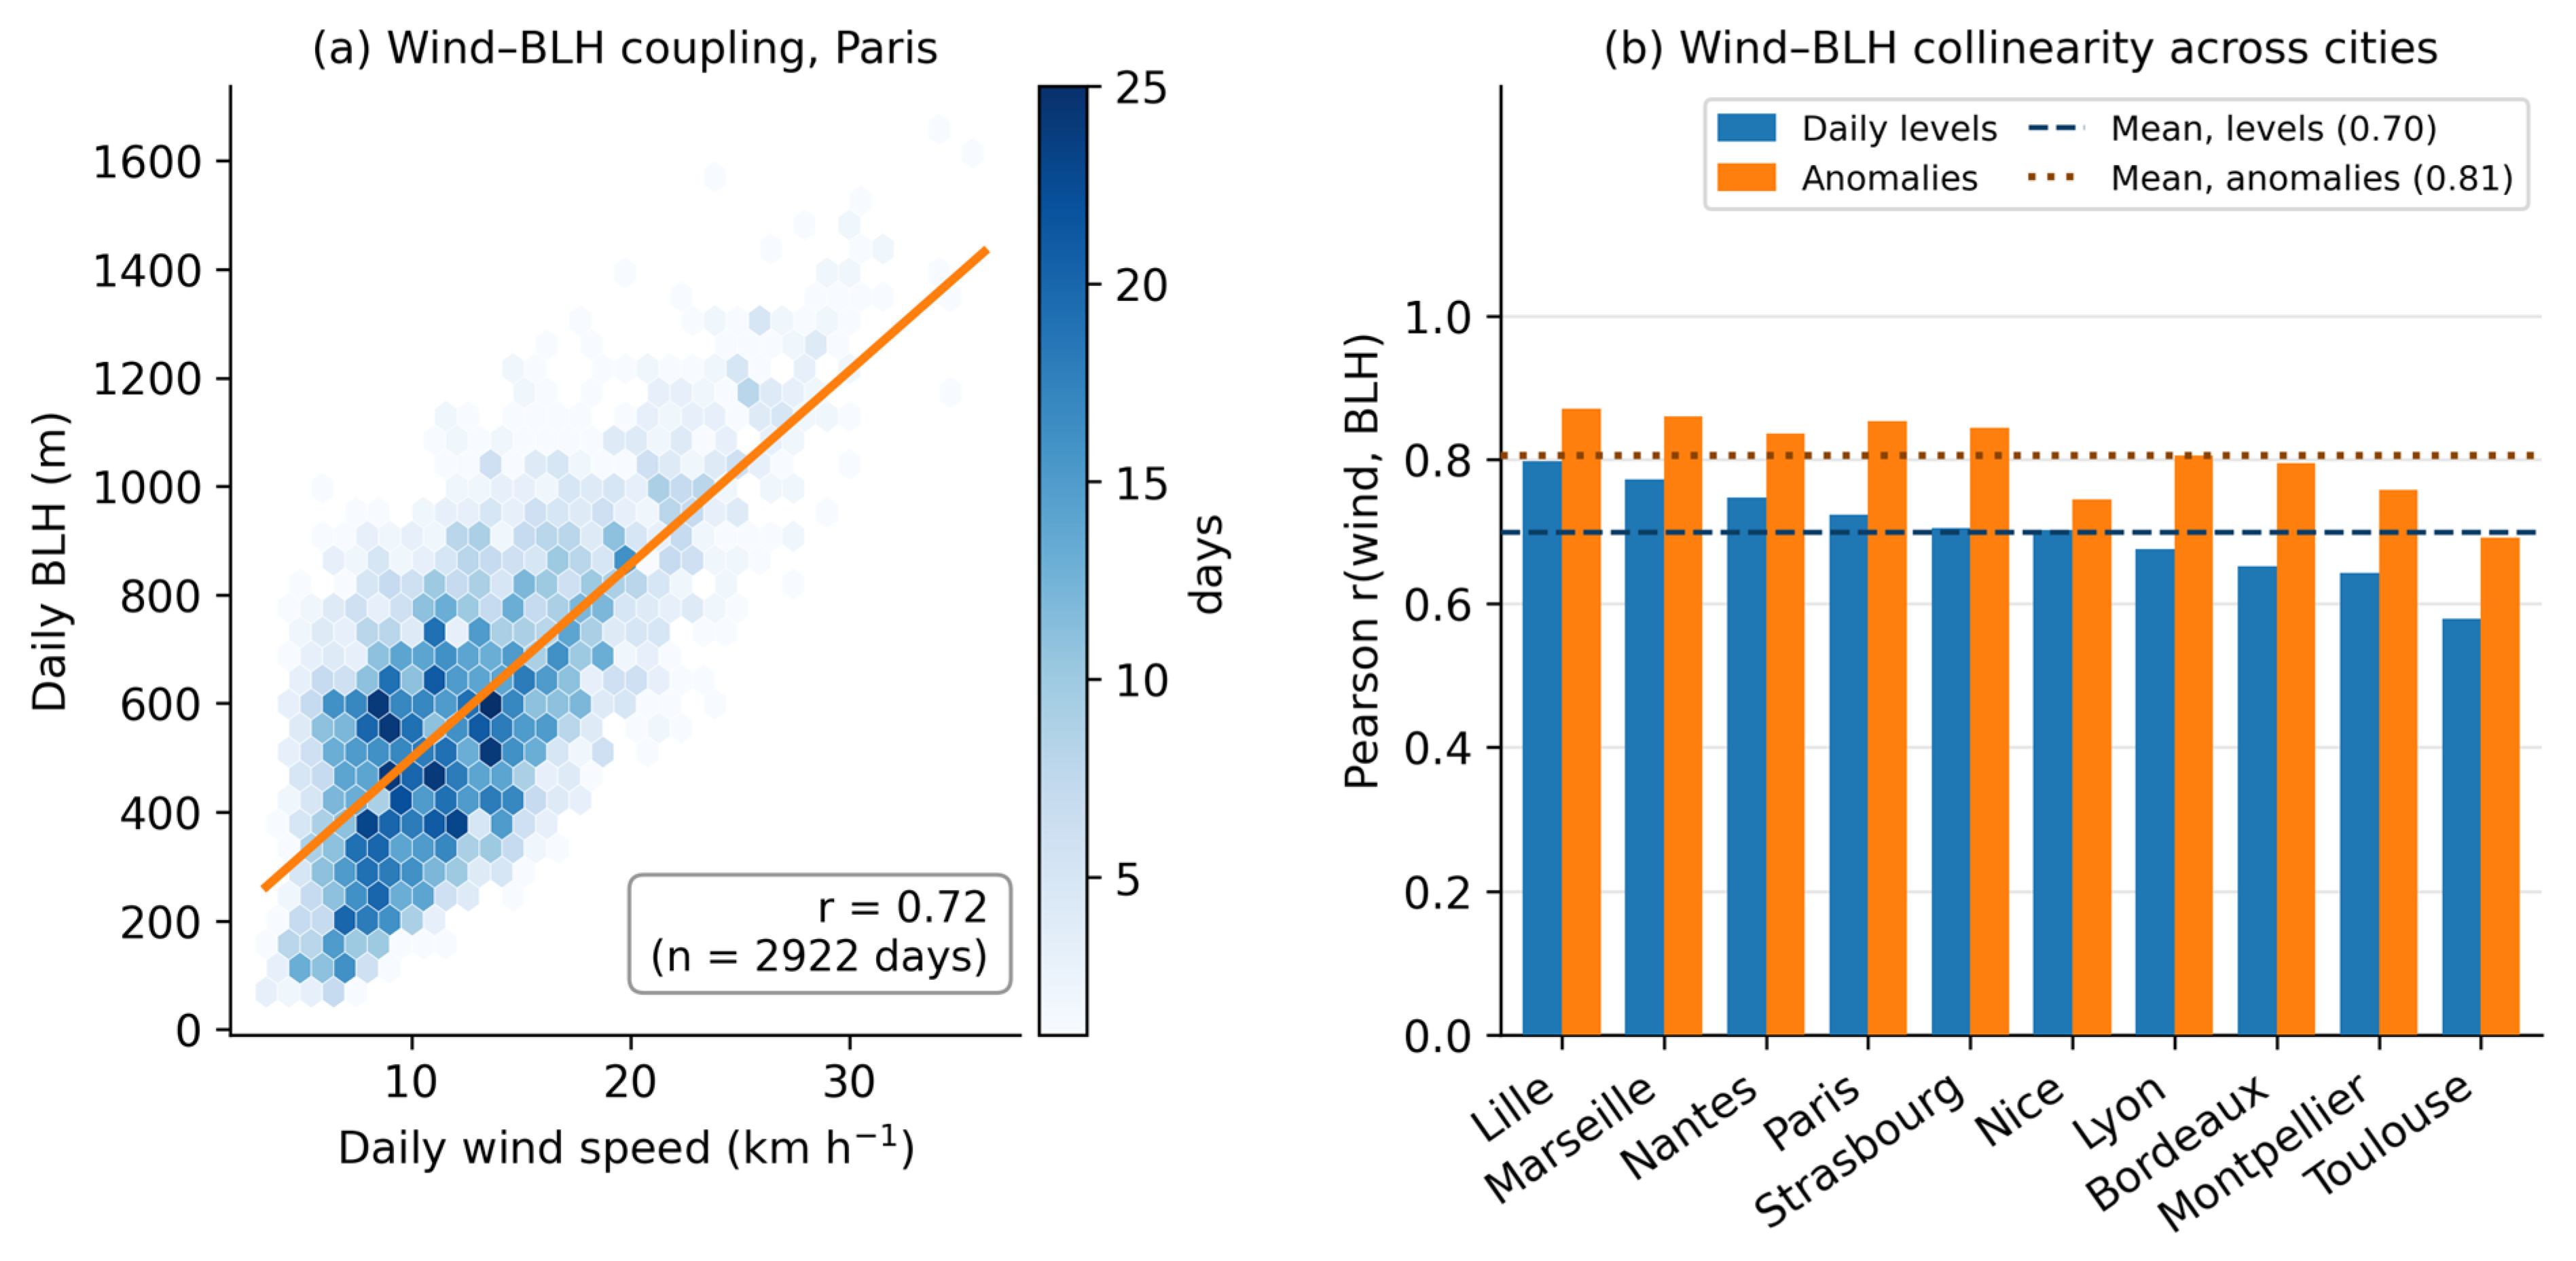
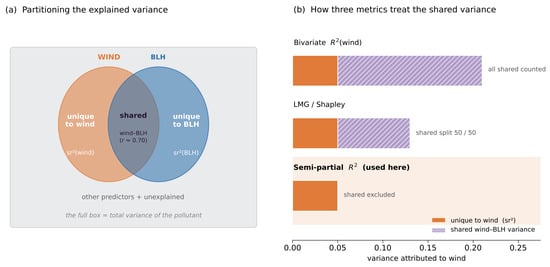
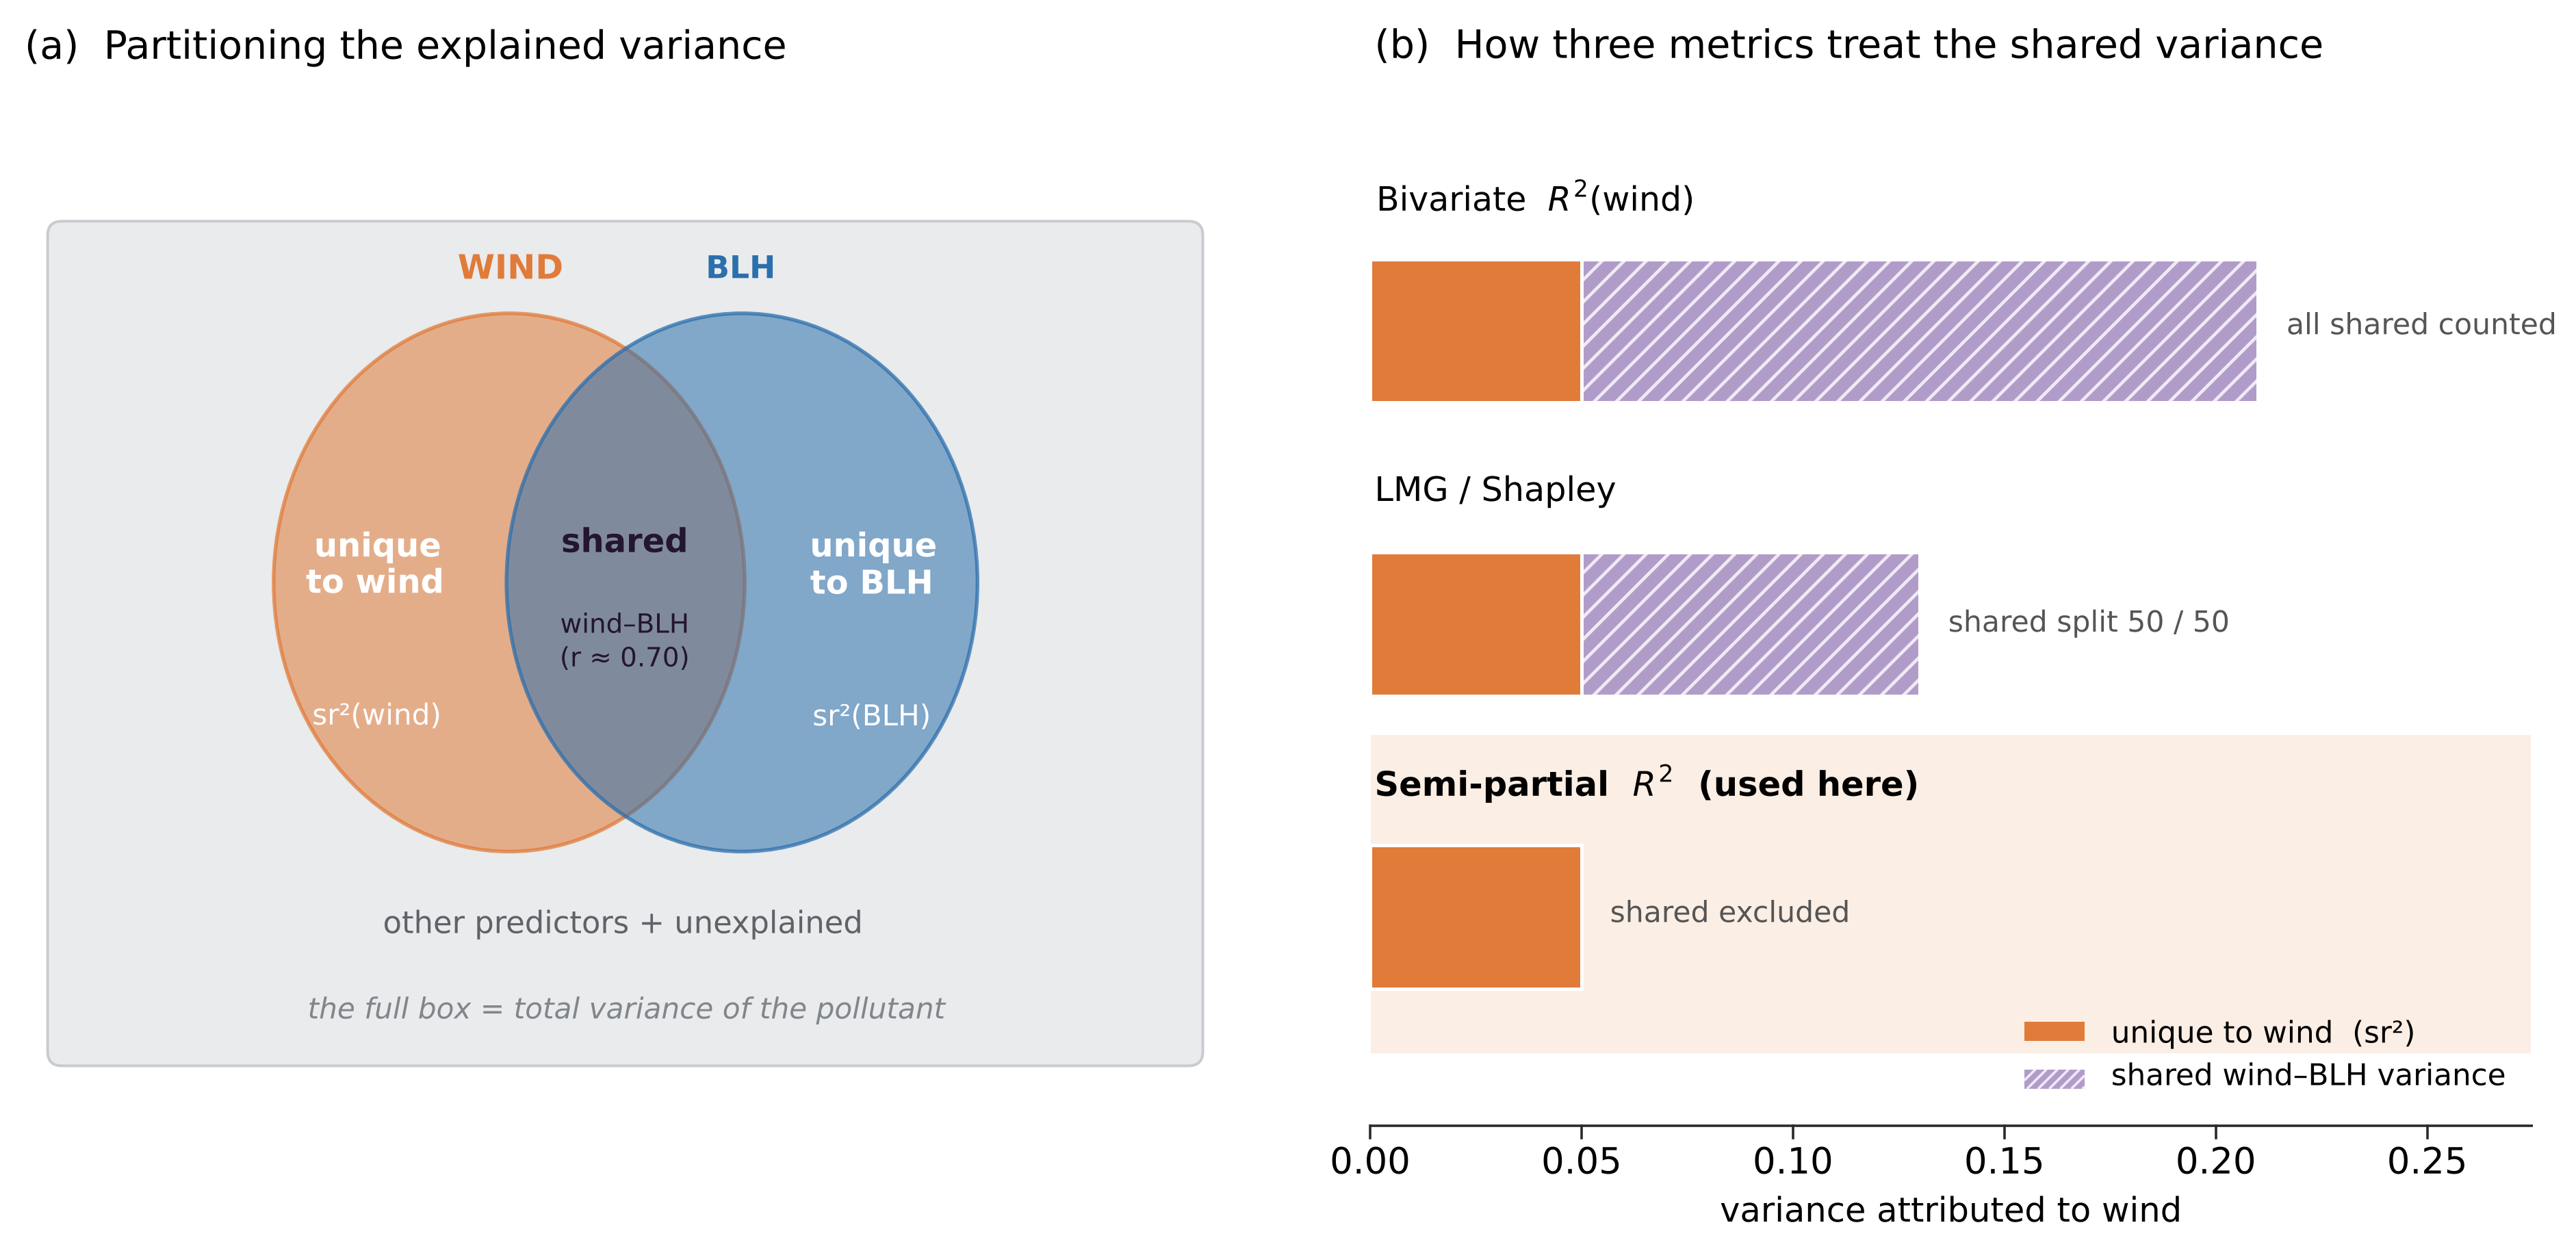
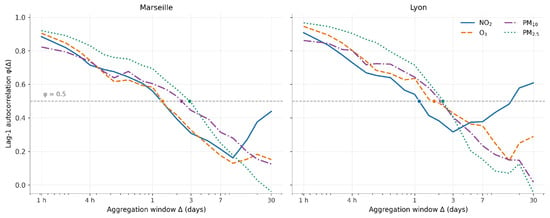
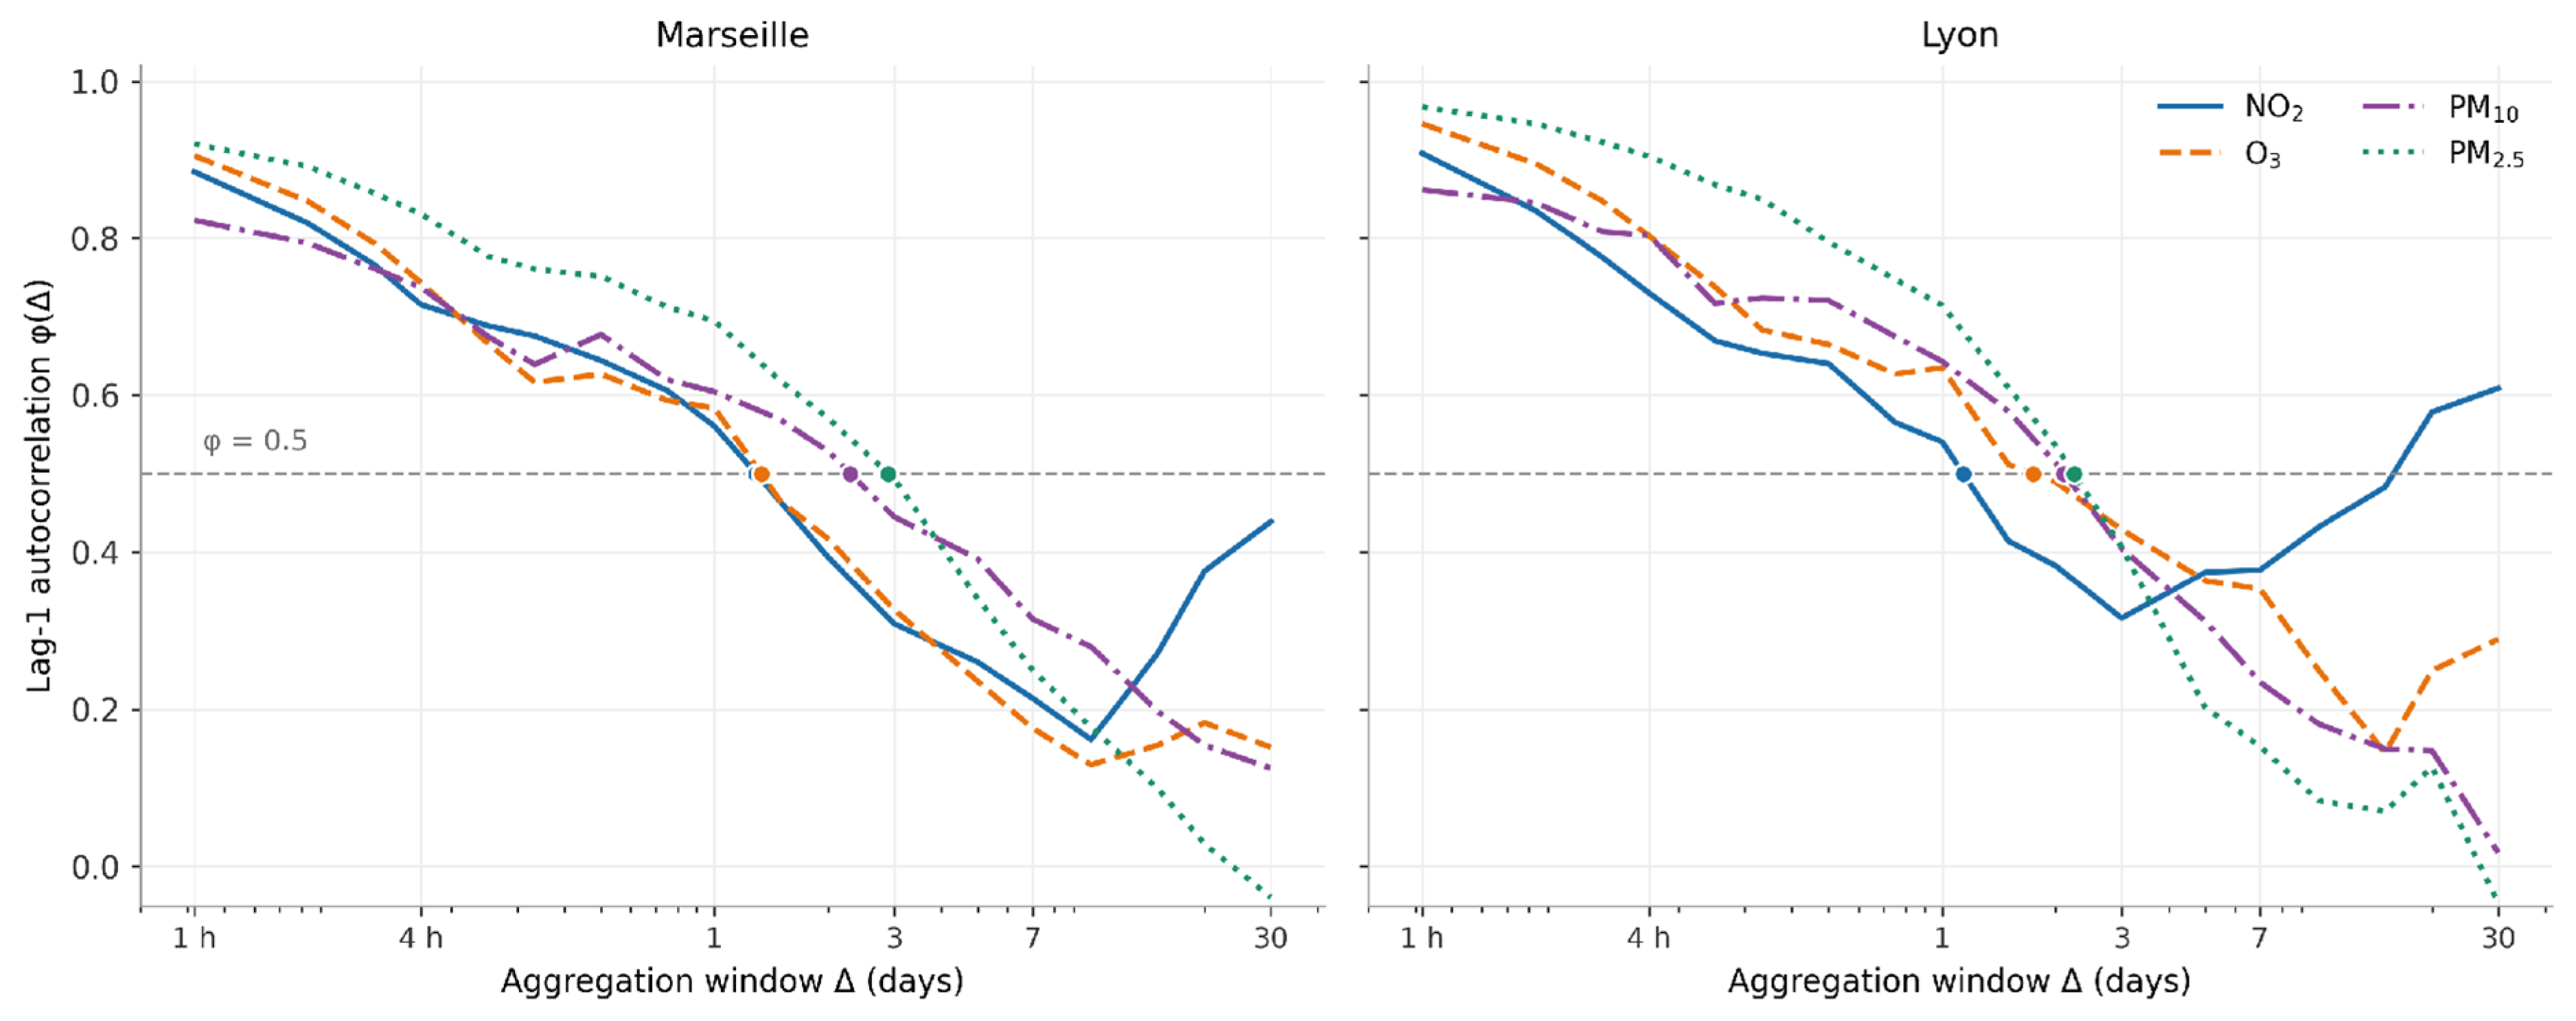
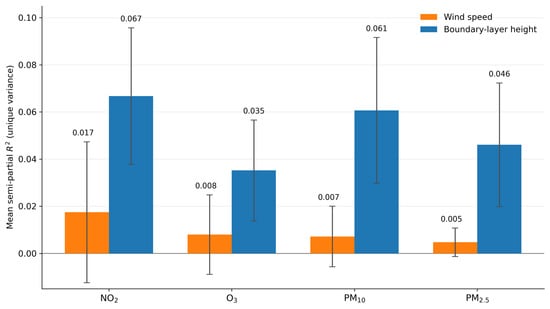
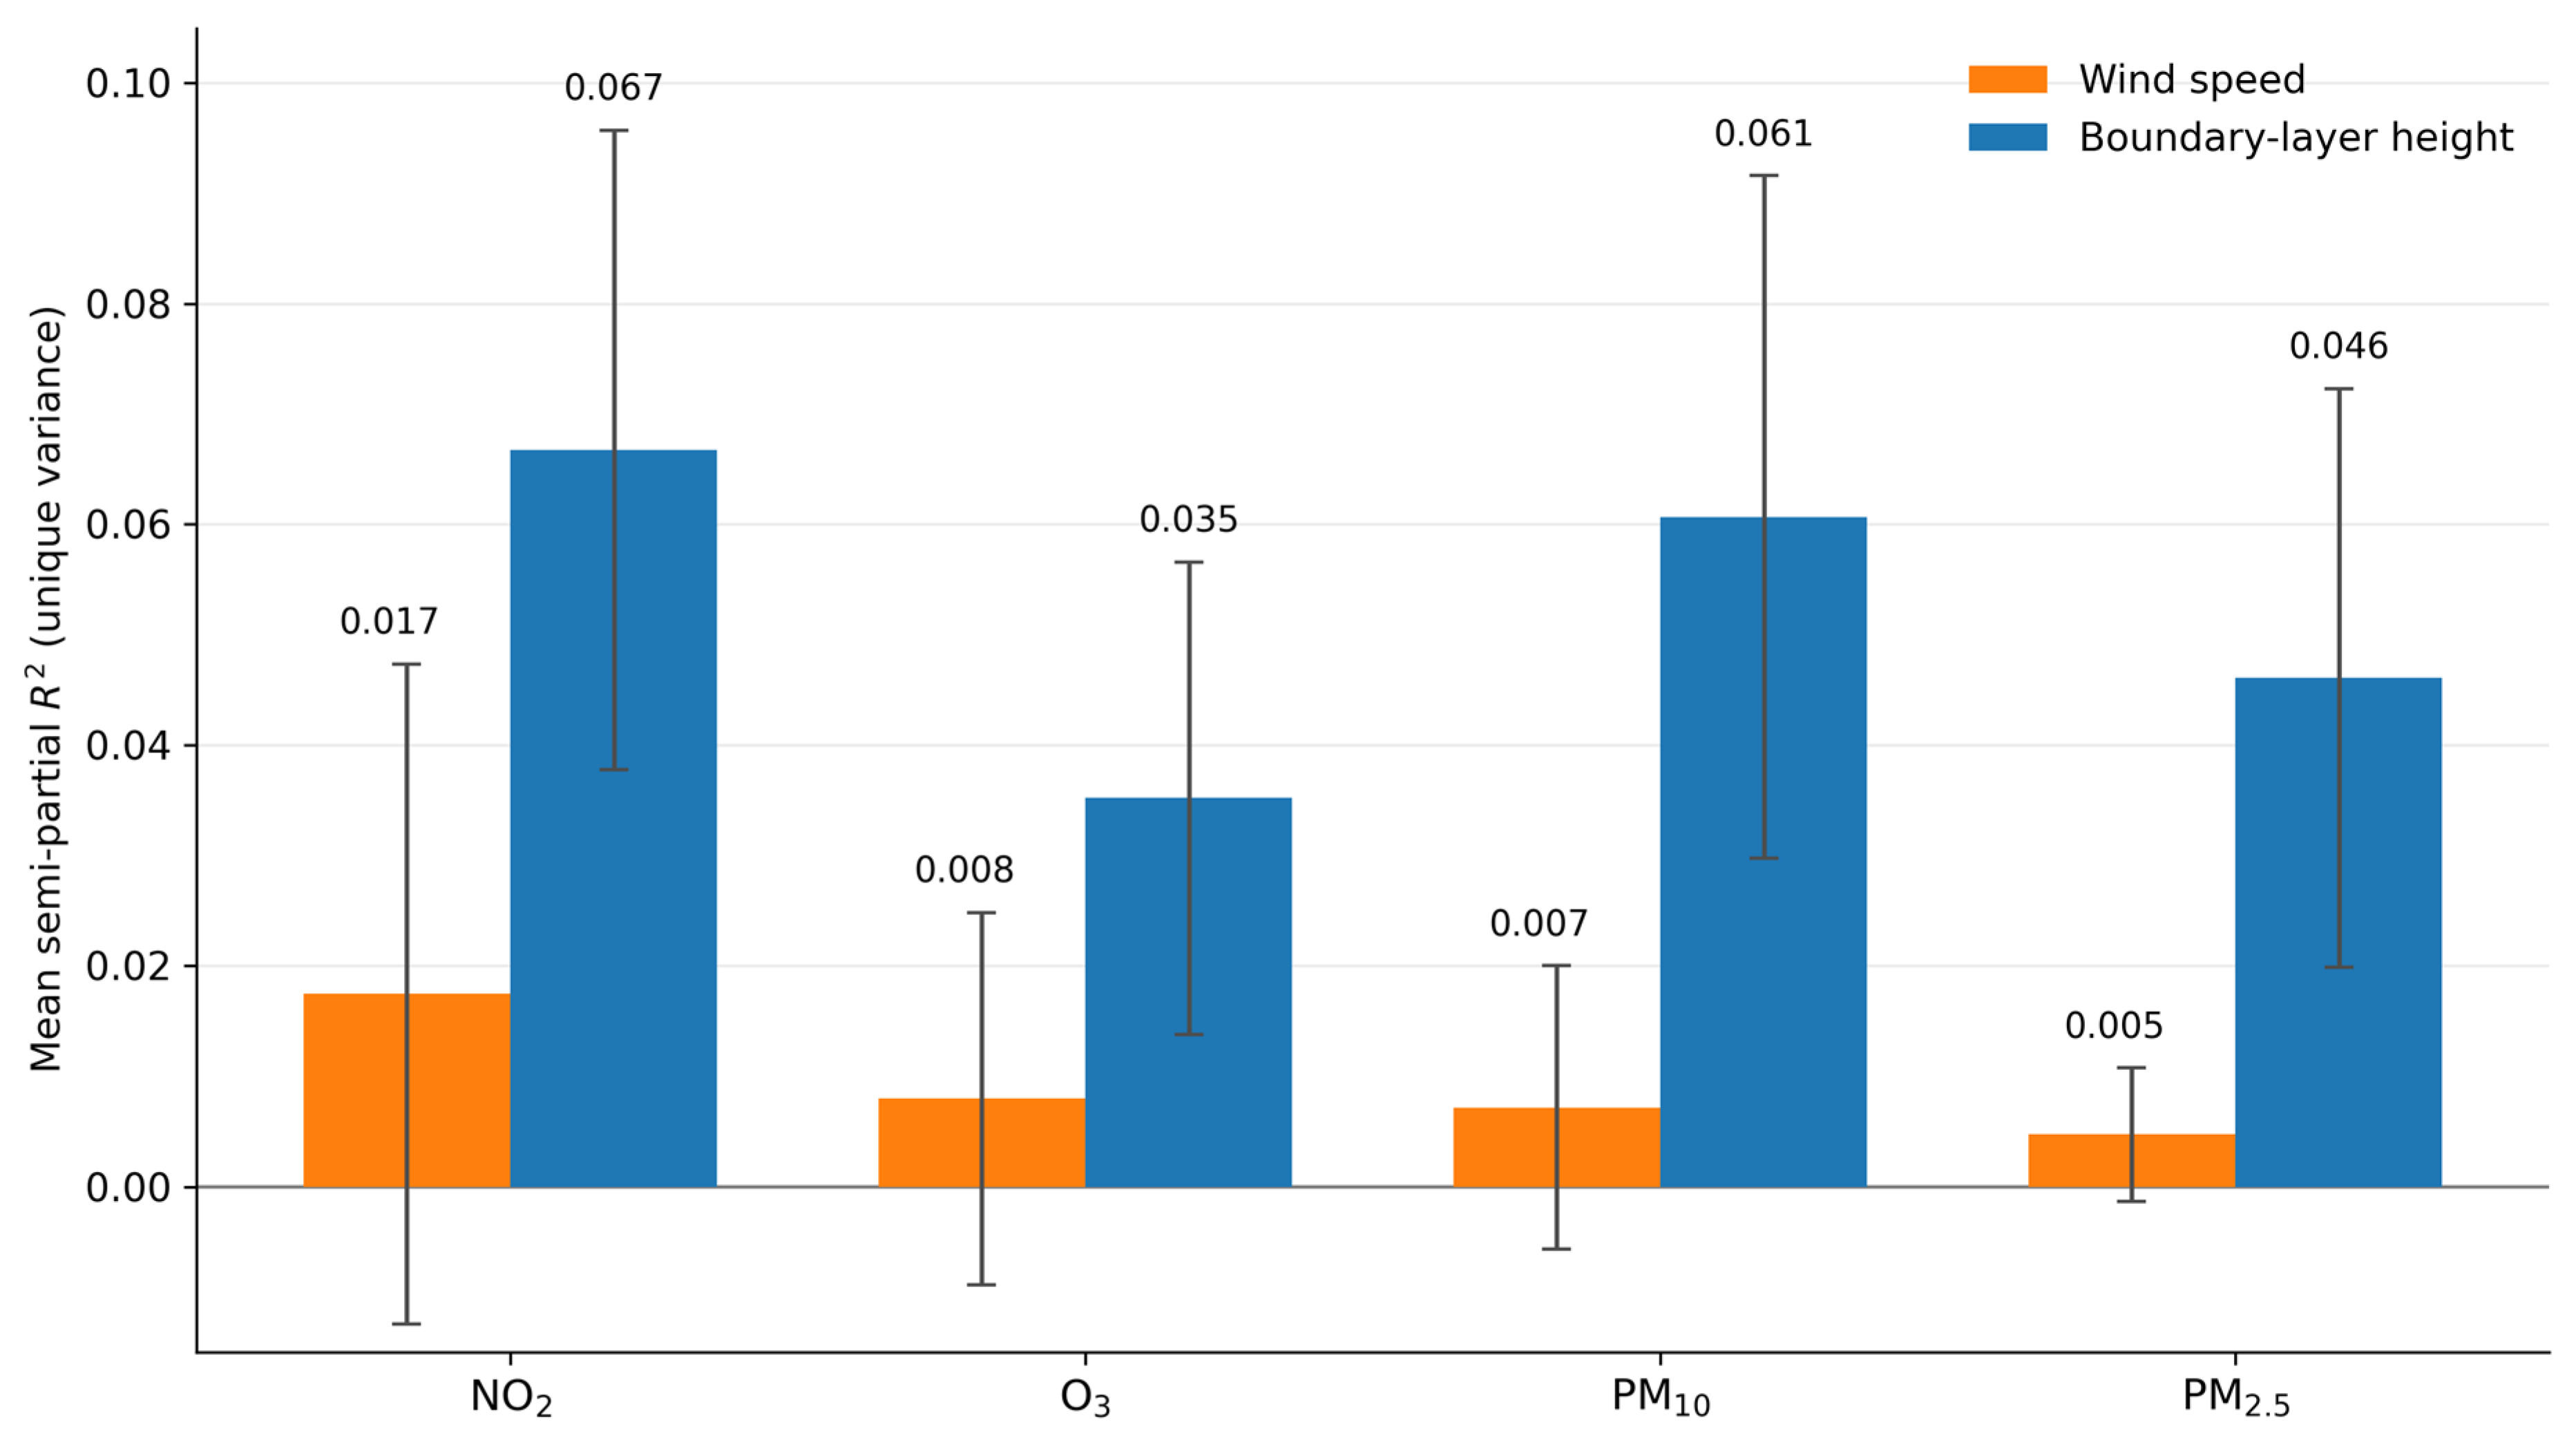
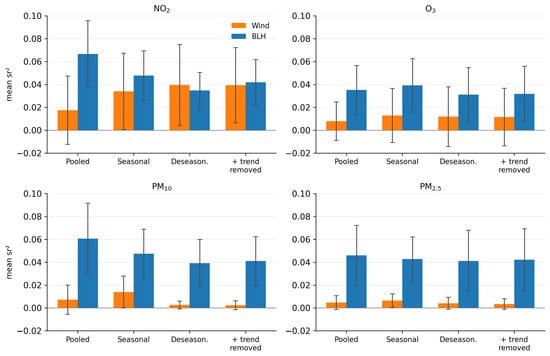
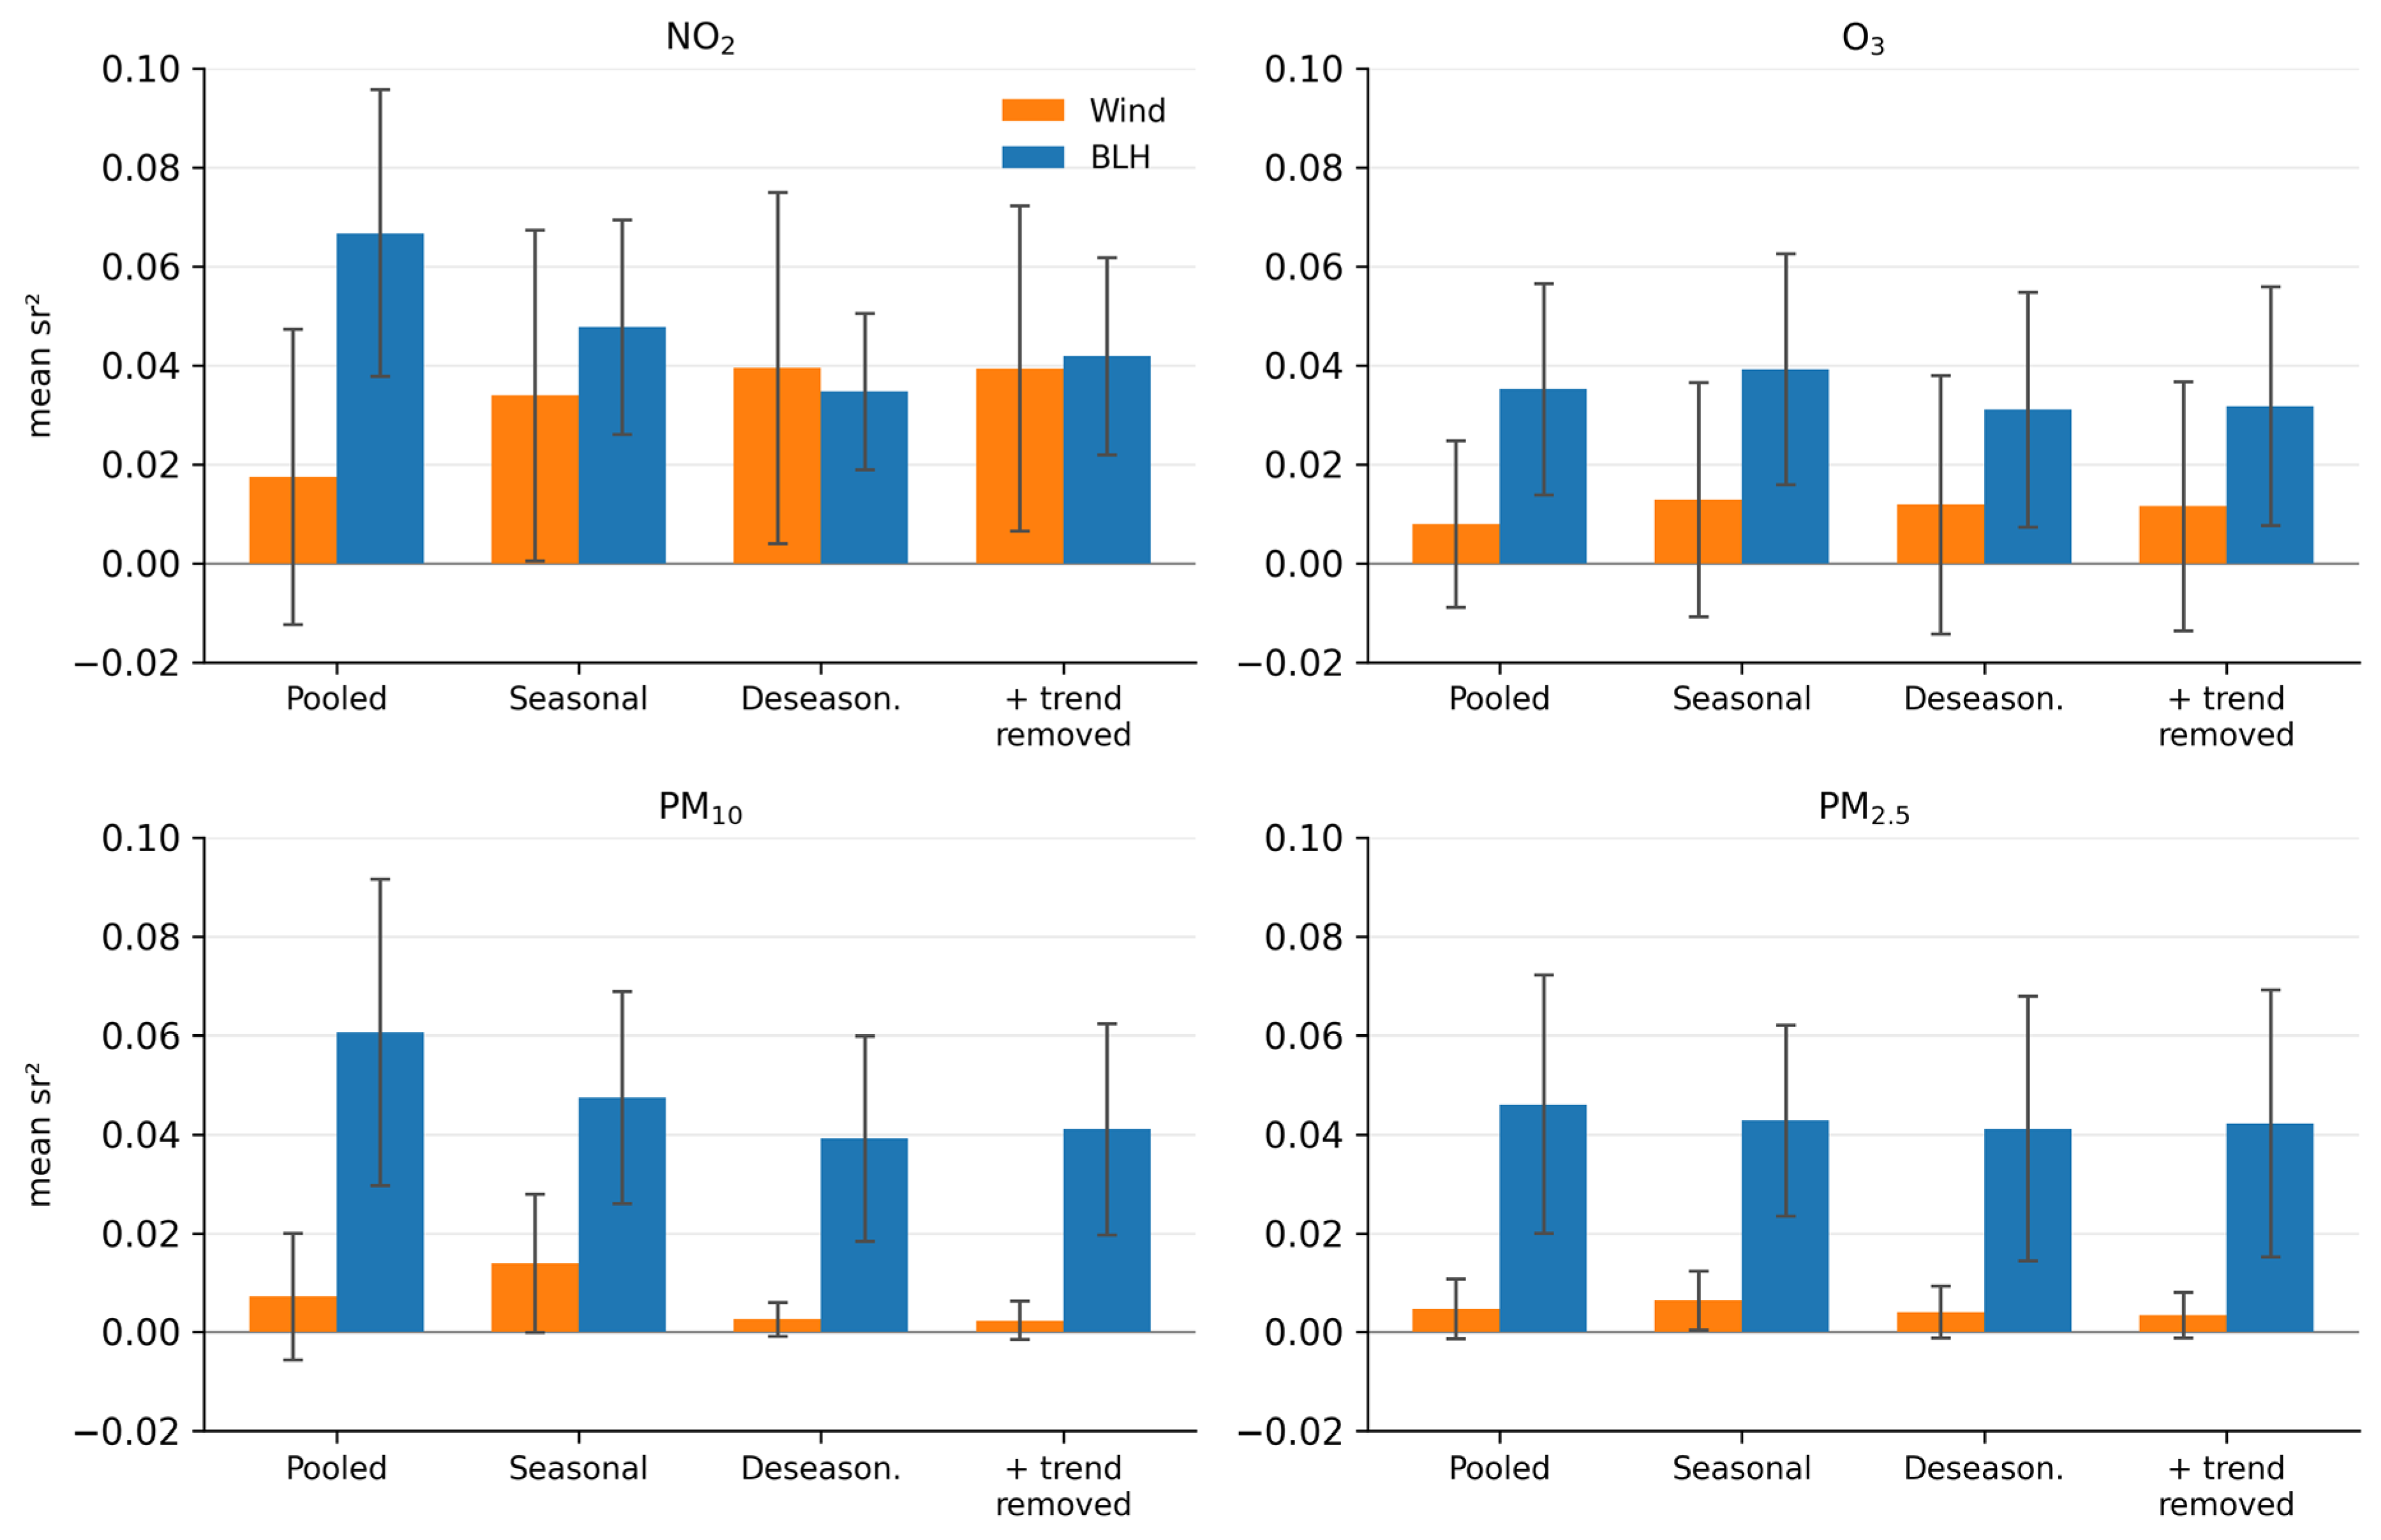
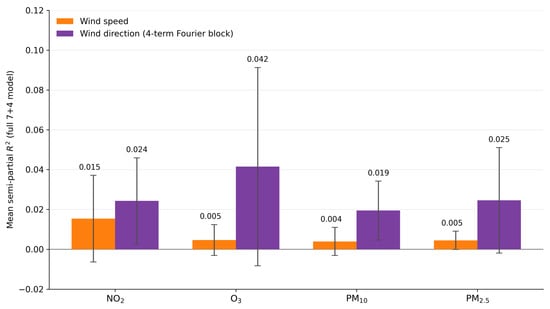
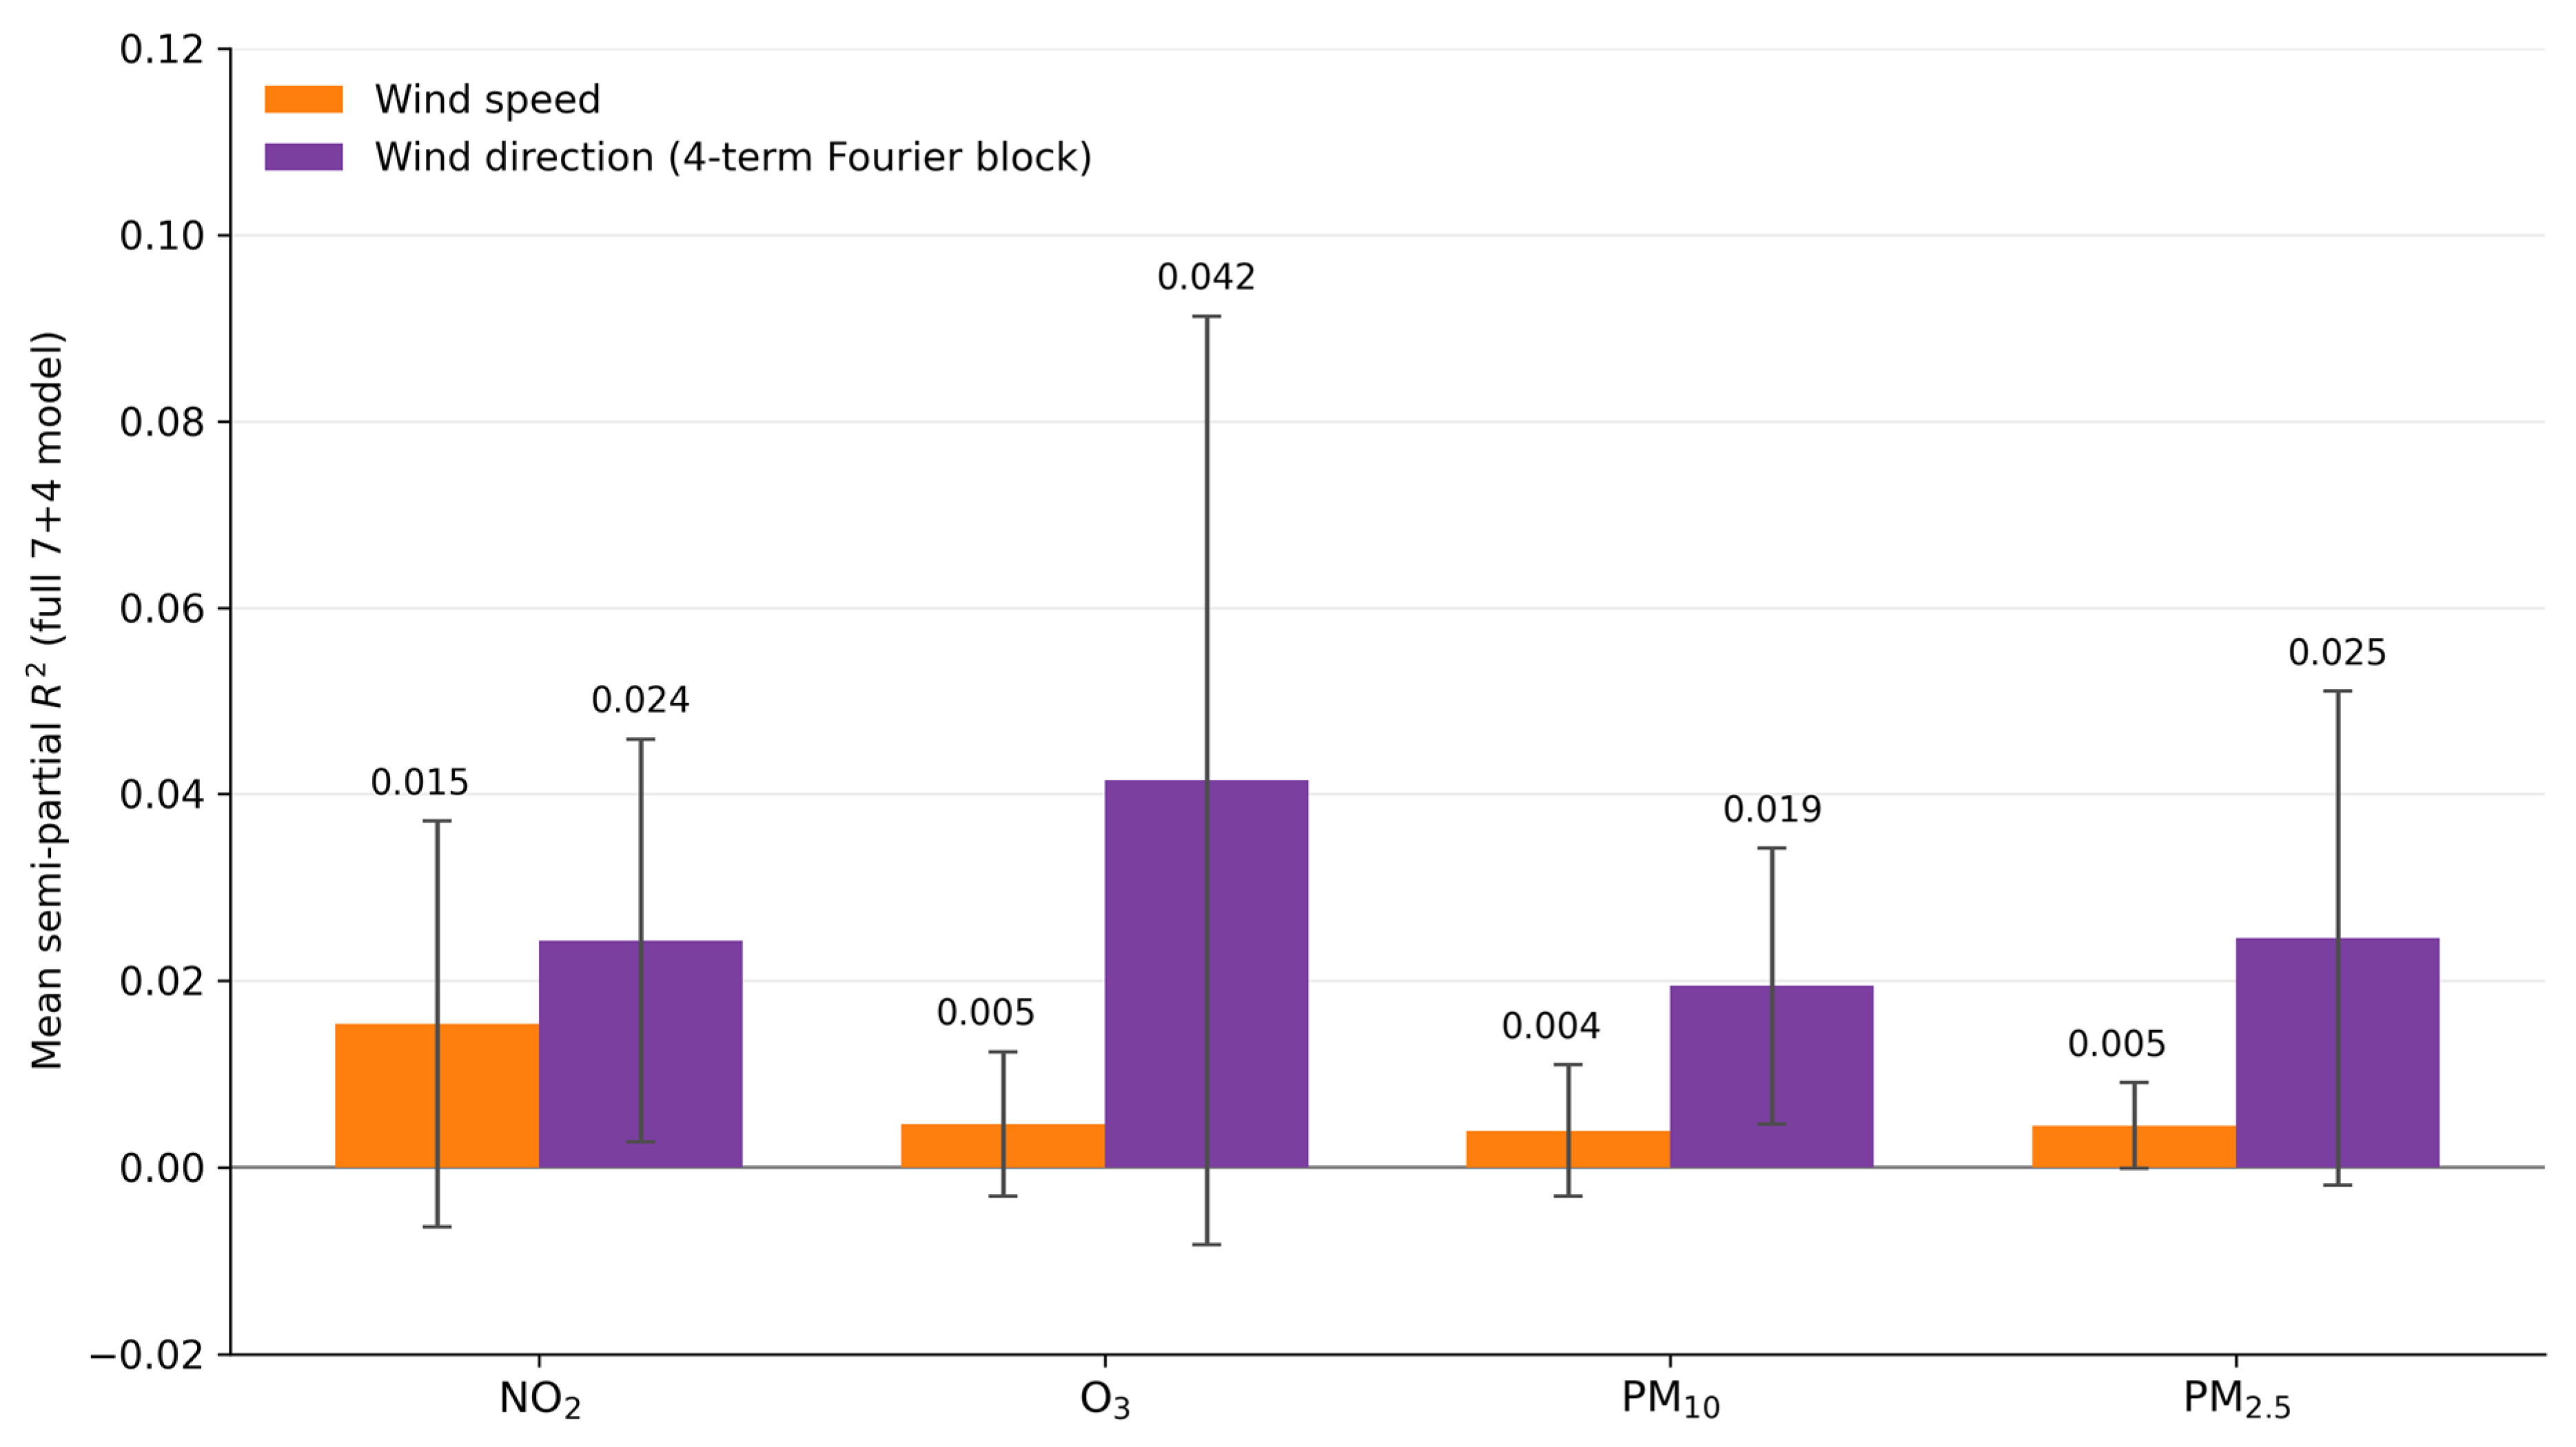
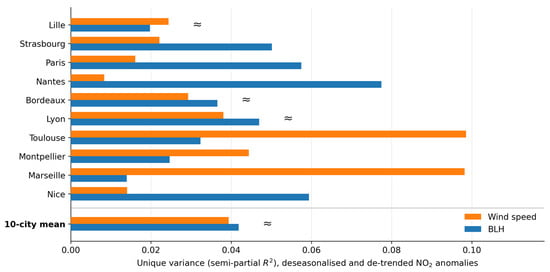
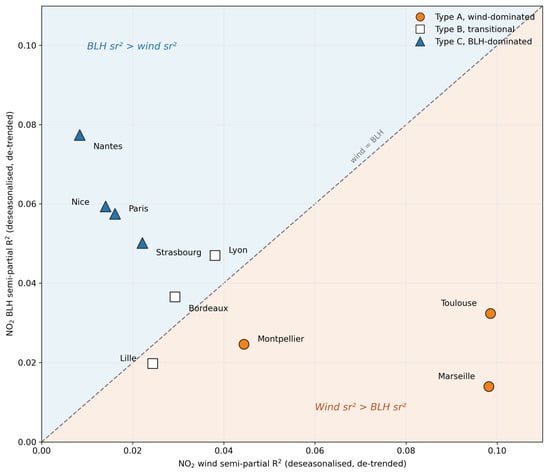

Disclaimer/Publisher’s Note: The statements, opinions and data contained in all publications are solely those of the individual author(s) and contributor(s) and not of MDPI and/or the editor(s). MDPI and/or the editor(s) disclaim responsibility for any injury to people or property resulting from any ideas, methods, instructions or products referred to in the content. |
© 2026 by the authors. Licensee MDPI, Basel, Switzerland. This article is an open access article distributed under the terms and conditions of the Creative Commons Attribution (CC BY) license.