


Abstract
Coral reefs throughout the Caribbean are increasingly exposed to climate-driven thermal variability, yet long-term coral growth records remain scarce for Haiti. This study examined long-term growth variability in four massive coral colonies (Siderastrea siderea and Diploria labyrinthiformis) collected from three Haitian reef systems: Léogâne, Caracol, and Belle-Anse. Annual growth bands were identified from X-radiographs, and linear extension and skeletal density were quantified using sclerochronological and densitometric analyses, while calcification was derived from their product. Relationships between annual growth parameters and site-specific sea surface temperature (SST) anomalies were assessed using Pearson correlations, while annual mean Niño 3.4 anomalies were used to characterize El Niño–Southern Oscillation (ENSO) variability. Composite analyses were also used descriptively to examine growth responses during selected El Niño and La Niña conditions. The four colonies exhibited substantial interannual variability in skeletal growth. Mean linear extension ranged from 0.47 ± 0.16 to 0.64 ± 0.14 cm yr−1, skeletal density from 0.82 ± 0.11 to 1.47 ± 0.24 g cm−3, and calcification from 0.53 ± 0.21 to 0.81 g cm−2 yr−1. Pearson correlations revealed colony-specific SST–growth relationships, with the strongest positive associations observed for skeletal density in B82 (r = 0.318) and calcification in Diploria labyrinthiformis SE1 (r = 0.302), whereas other relationships were weaker or differed in direction. ENSO composites likewise showed heterogeneous responses among colonies and climatic phases. Overall, these results highlight pronounced colony-specific growth variability and heterogeneous associations with SST and ENSO, providing an important long-term sclerochronological baseline for Haitian reefs.
1. Introduction
Massive corals, the principal framework builders of coral reefs, play a fundamental role in shaping reef three-dimensional structure, calcium carbonate production, and vertical reef accretion potential [1]. Over recent decades, however, coral reefs have become increasingly threatened by a wide range of abiotic stressors, particularly rising sea temperatures, contributing to the global decline of coral reef ecosystems [2]. Several of these stressors negatively affect coral calcification rates [3,4], resulting in reduced reef carbonate production [1] especially in the Caribbean, where coral cover has already undergone substantial declines [5].
Projected changes in these abiotic drivers at both global and local scales are expected to exert both positive and negative effects on coral growth [4]. At the global scale, increasing seawater temperature generally promotes coral growth up to a critical threshold, typically around +2 °C above the mean annual sea surface temperature [4]. Beyond this threshold, corals experience reduced or even complete suppression of calcification [6], may undergo bleaching, and can ultimately suffer mortality [7]. Furthermore, even when corals appear to recover visually following bleaching events, calcification rates may remain depressed for several months [8]. Coral growth rates also exhibit considerable variability among different biogeographic regions [9].
Understanding the sensitivity of coral growth to changes in both global and local environmental conditions is therefore essential for predicting future trends in reef calcification and vertical accretion potential. Since the 1970s, Caribbean coral reefs have experienced substantial declines in growth and carbonate production as a consequence of coral cover loss and shifts in coral community composition [5,10]. Nevertheless, information on coral growth remains unevenly distributed throughout the Caribbean. While relatively extensive long-term datasets are available for regions such as Florida and the U.S. Virgin Islands, other areas remain poorly documented, particularly countries such as Haiti [11,12]. This geographical imbalance complicates accurate estimates of reef carbonate production across the Caribbean and highlights the need for a broader spatial approach to coral growth studies in order to reduce existing geographic biases.
Within this context, the present study aims to characterize the spatial and interspecific variability in the calcification of massive corals from Haiti using sclerochronological signatures preserved within their skeletons. Specifically, we investigate variations in linear extension rate, skeletal density, and calcification in two massive coral species, Diploria labyrinthiformis and Siderastrea siderea, collected from several Haitian reefs in order to identify growth differences associated with local environmental conditions and species-specific biological characteristics. We also examine the relationships between these growth parameters and major regional climatic drivers, particularly sea surface temperature (SST) and climate variability associated with the El Niño–Southern Oscillation (ENSO), to assess their influence on coral growth performance. By integrating sclerochronological, densitometric, and climatic approaches, this study seeks to improve our understanding of the mechanisms regulating calcification in massive corals from Haitian reef ecosystems. These methods exploit the growth records preserved within coral skeletons to investigate the spatial and interspecific variability of growth parameters and to evaluate their responses to climatic and environmental forcing.
2. Materials and Methods
2.1. Study Sites
The study was conducted at three representative coral reef locations along the Haitian coastline: Belloc (Léogâne) on the western coast, the Parc National Naturel du Lagon des Huîtres (Belle-Anse) on the southeastern coast, and the Aire Protégée des Trois Baies (Caracol) on the northeastern coast. These sites encompass contrasting geomorphological, oceanographic, and environmental conditions, providing an opportunity to investigate spatial variability in the growth of massive reef-building corals. Their differences in hydrodynamics, freshwater influence, habitat composition, and reef development make them well suited for evaluating the environmental controls on coral calcification and sclerochronological records.
The Belloc site (Figure 1 (18°28′44.68″ N, 72°40′7.64″ W) is an emergent reef measuring approximately 90 m in length and 70 m in width, located 100–150 m offshore. This reef supports numerous corals that have developed as microatolls [13]. Most observed microatolls around one (1) meter deep display bowl-shaped or mushroom-like morphologies of varying intensity. Such morphologies are generally considered characteristic of relative submergence or emergence settings [14].
Figure 1.
Satellite map showing the location of the coral colonies B82, B10, NE2, and SE1 within the coastal reefs of Haiti. Colonies B82 and B10 (Siderastrea siderea) were collected from the reefs of Léogâne (Gulf of Gonâve), colony NE2 from the reefs of Caracol (northeastern Haiti), and colony SE1 (Diploria labyrinthiformis) from the reefs of Belle-Anse (southeastern Haiti).
Coral colony SE1 (Figure 1) is located within the Parc National Naturel du Lagon des Huîtres (PNN-LdH) on the southeastern coast of Haiti. The site is characterized by a shallow coastal platform consisting of a mosaic of benthic habitats, including coral reefs, seagrass meadows, gorgonian and soft coral assemblages, and extensive sandy bottoms [15]. Coral reefs, mainly concentrated in the western sector of the park, cover approximately 180 ha, whereas seagrass meadows occupy nearly 430 ha [15]. The PNN-LdH experiences a tropical sub-humid climate, with a mean annual temperature of 26.1 °C and annual rainfall ranging from 605 to 650 mm, distributed according to a bimodal regime with two rainy seasons [16,17]). Colony SE1 grows at shallow depth (approximately 5 m) in an environment characterized by high light availability, moderate hydrodynamic conditions, and high habitat diversity. These environmental conditions are favorable for the growth and calcification of massive corals, making this site particularly suitable for investigating the relationships between environmental variability and coral biological performance [15,16,17].
Coral colony NE2 (Figure 1) is located within the Aire Protégée des Trois Baies (AP3B) on the northeastern coast of Haiti, one of the country’s most biologically diverse marine regions. The site forms part of an extensive reef complex that includes the Caracol barrier reef found at 3 to 5 m deph, the longest reef along the northern coast of Hispaniola (approximately 20 km), together with fringing reefs in Caracol Bay and Fort-Liberté Bay [18,19]). Holocene reefs cover approximately 1100 ha, representing nearly 10% of the AP3B shallow coastal platform. The protected area is characterized by the presence of coral reefs, mangrove forests (4274 ha), and seagrass meadows, which collectively support remarkable marine biodiversity comprising more than 180 fish species, 51 species of scleractinian corals, and over 140 sponge species [18]. Dominant coral taxa include Porites astreoides, Porites porites, species of the genus Diploria, and Siderastrea siderea, while Acropora palmata, Acropora cervicornis, and several Orbicella species are also present in certain reef sectors. The area receives freshwater and sediment inputs from several watersheds, particularly the Grande Rivière du Nord, as well as from a major coastal aquifer, influencing salinity, turbidity, and nutrient availability [18]). Local oceanographic conditions are dominated by the Antilles Current and prevailing northeasterly winds, whereas underwater visibility generally remains below 15 m owing to terrestrial runoff and high coastal productivity [18].
2.2. Coral Colony Sampling
Four (4) massive coral cores were analyzed in this study. They were collected from three distinct coastal sites in Haiti, as described above (Table 1): Belloc–Léogâne, AP3B–Caracol, and the Parc National Naturel du Lagon des Huîtres (PNN-LdH) at Belle-Anse. Two cores belonged to the species Siderastrea siderea and were collected at Belloc–Léogâne (B10 and B82), whereas two cores of Diploria labyrinthiformis were obtained from AP3B–Caracol (NE2) and PNN-LdH–Belle-Anse (SE1), respectively. Core lengths ranged from 16.6 to 45.4 cm, while thicknesses varied between 0.8 and 1.5 cm, providing suitable material for comparative sclerochronological and densitometric analyses (Table 1).
Table 1.
Identification and characteristics of the coral colonies analyzed in this study.
2.3. Slab Thickness and Densitometric Measurements
Coral slabs were sectioned at predefined thicknesses using the calibrated settings of the cutting saw employed for sample preparation. The resulting slab thickness was incorporated into the radiographic density calculations. Densitometric regions of interest (ROIs) were selected along the main skeletal growth axis where successive high- and low-density bands were clearest and most readily distinguishable. Radiographic intensity was extracted from these regions using ImageJ and converted to skeletal density using the aluminum-step-wedge calibration. Because repeated independent thickness measurements along each slab were not available, uncertainty associated with possible within-slab thickness variation could not be propagated quantitatively into annual density estimates and is therefore considered a methodological limitation.
Three (3) growth transects were initially examined on each coral slab to assess the visibility and continuity of the annual density bands. For the quantitative analyses, a single transect was retained for each colony. The selected transect corresponded to the region where successive high and low-density bands were most clearly and continuously expressed along the measured growth axis. This approach was used to minimize uncertainty in annual band-boundary identification and reduce potential errors associated with poorly defined or discontinuous growth bands. All annual linear extension and density measurements used in the subsequent analyses were therefore obtained from this selected transect.
2.4. Sclerochronological Analysis of Coral Samples
To examine the internal skeletal structure of the corals, slabs of Diploria labyrinthiformis and Siderastrea siderea were analyzed using X-ray radiography. Radiographic imaging was performed at the MRI and Medical Imaging Department of Jean Verdier Hospital (Bondy, France) using exposure parameters of 140 kV (kilovolts) and 2 mAs (milliampere-seconds). These acquisition settings provided radiographs with sufficient spatial resolution to clearly distinguish the fine skeletal structures of the coral colonies.
As shown in Figure 2, the coral slab exhibits spatial variations in skeletal density, represented by different grayscale intensities on the radiograph. The densest skeletal regions, corresponding to growth ridges and the walls separating adjacent corallite valleys, appear as lighter (whitish) bands [20]. In contrast, less dense skeletal regions, generally located within the valleys between successive growth ridges, appear as darker (grayish) bands. These low-density bands are associated with periods of relatively rapid skeletal accretion, during which calcium carbonate was deposited more rapidly, likely under favorable environmental conditions, including moderate sea surface temperatures and adequate light and nutrient availability [20].
Figure 2.
Densitometric analysis of a coral slab using X-radiography (X-ray): extraction of a transect along the main growth axis (bottom to top), grayscale intensity profile (yellow curve) used to identify density banding, sclerochronological profile for linear extension analysis, red stars indicating the boundaries between low- and high-density bands, with an image resolution of 76 pixels cm−1.
Following the identification of alternating high- and low-density bands, a sclerochronological profile was established by measuring the distance between successive high–low density band pairs along the main growth axis. In massive scleractinian corals, one complete pair of high- and low-density bands is generally interpreted as representing one year of skeletal growth, allowing annual linear extension rates to be reconstructed from the distance between consecutive annual density-band boundaries [21,22,23]. This annual banding pattern provides the chronological framework for deriving time-resolved records of skeletal extension, density, and calcification. These measurements were subsequently used to determine the annual linear extension rate using ImageJ software (version 1.54).
2.4.1. Linear Extension Measurements
Annual linear extension (cm yr−1) was determined from calibrated X-radiographs using ImageJ. Annual high- and low-density growth bands were first visually identified along the main skeletal growth axis. For each annual increment, two successive band boundaries were selected, and the distance separating them was measured following the orientation of the main growth axis. When point coordinates were used, the distance between successive points was determined from both the horizontal and vertical components of the image (X and Y coordinates), rather than from the horizontal coordinate alone. Thus, annual extension corresponded to the actual linear distance between successive annual growth-band boundaries and not simply to their horizontal separation. All measurements were converted to centimetres using the spatial calibration of the radiographic images.
The linear extension rate was estimated using the following equation: E = √((Y2 − Y1)2 + (X2 − X1)2) where A(X1, Y1) et B (X2, Y2) represent the coordinates of two points selected on two successive density bands (one dark and one light), respectively [24].
2.4.2. Annual Chronology and Growth-Band Identification
Starting from the known year of coral collection, calendar years were assigned retrospectively by counting successive annual increments from the outermost band toward the oldest portion of the core. Particular attention was given to changes in growth-axis orientation and to ambiguous band boundaries, which were re-examined before year assignment. The complete band sequence was subsequently checked for chronological consistency before annual linear extension, skeletal density, and calcification were calculated.
Calendar years were assigned retrospectively from the collection date. Only complete annual increments were retained; incomplete terminal bands were excluded. Ambiguous boundaries were re-examined, and chronological uncertainty was considered when relating growth records to specific climatic events.
2.5. Densitometric Analysis of Coral Samples
Pixel intensity analysis was performed using ImageJ software to convert radiographic grayscale values into skeletal density through a calibration procedure. ImageJ was used to quantify grayscale intensities, which are proportional to the apparent density of the coral skeleton. Based on the density standard included during X-ray acquisition, a calibration equation was established according to the following linear relationship (Dcorail = a × I + b) where (I) is the measured grayscale intensity, and (a) and (b) are the slope and intercept of the calibration curve, respectively. This calibration enabled the conversion of optical pixel intensity values into actual skeletal density (g/cm3) [25,26]. Radiographic image calibration was performed using reference aluminum step wedges selected for their well-characterized X-ray attenuation properties. Four aluminum standards of known thicknesses (0.0345, 0.0575, 0.092, and 0.115 cm) were radiographed simultaneously with the coral samples under identical acquisition conditions (140 kV and 2 mAs) to ensure the accuracy, consistency, and comparability of the density measurements [25,26].
For each aluminum step wedge, the corresponding grayscale intensity values were extracted, revealing a progressive increase in pixel intensity with increasing wedge thickness, reflecting the greater attenuation of X-rays (Figure 2). Based on these calibration data, a linear regression was established between the known thicknesses of the aluminum standards and their corresponding grayscale intensities, yielding the following calibration equation: Y = 224X + 5.96 with a high coefficient of determination R2 = 0.99 indicating an excellent linear correlation. This relationship enabled the conversion of radiographic grayscale intensity values into quantitative density estimates, which were used as a proxy for coral skeletal density. The calibration procedure therefore constitutes a fundamental step in the densitometric analysis of annual skeletal growth bands [25,26].
The grayscale intensity values measured along the coral growth bands were subsequently converted into equivalent aluminum thickness using the calibration relationship. Coral skeletal density was then calculated by relating the equivalent aluminum thickness to the actual thickness of the coral slab according to the following equation [25]:
This approach enabled the conversion of radiographic information into quantitative measurements of coral skeletal density, where the following apply:
- ρ_corail: physical density of the coral skeleton (g·cm−3).
- ρ_Al: reference density of the aluminum calibration standard (2.70 g·cm−3).
- X_Al: equivalent aluminum thickness (cm) corresponding to the grayscale intensity measured on the coral radiograph, obtained from the calibration relationship between grayscale intensity and aluminum thickness.
- e_corail: actual thickness of the coral slab (cm), measured directly using a graduated ruler.
2.6. Evaluation of Coral Calcification
Coral calcification was evaluated from two fundamental skeletal growth parameters: annual linear extension rate and skeletal density. These parameters were derived from the sclerochronological analysis of annual density bands identified along the main growth axis of each coral core. Together, they provide an estimate of the amount of calcium carbonate (CaCO3) deposited per unit surface area of the coral skeleton each year [21,23,25].
The linear extension rate (E), expressed in cm yr−1, was determined by measuring the distance between successive annual density-band couplets along the main growth axis. Each complete high-density/low-density band pair was considered to represent one year of skeletal growth. Annual extension therefore reflects the vertical increase in coral skeleton produced during a given year.
The skeletal density (D), expressed in g cm−3, represents the mass of skeletal material per unit volume. Density values were obtained from densitometric analysis of the coral X-radiographs and calculated for the corresponding annual growth increments. This parameter provides information on the degree of skeletal compactness and mineral deposition within each annual band.
The annual calcification rate (G) was then calculated as the product of annual linear extension (E) and skeletal density (D) following this equation:
G = E × D
2.7. Composite Analysis of Coral Growth Responses to SST Anomalies and ENSO Events
To assess whether coral growth responses differed across contrasting thermal conditions, SST anomalies were classified into four thermal categories: extreme cold (<−0.30 °C), moderate cold (−0.30 to 0 °C), moderate warm (0 to +0.30 °C), and extreme warm (>+0.30 °C). This categorical approach was used to distinguish growth responses associated with relatively moderate thermal conditions from those occurring during unusually cold or warm conditions, as coral responses to temperature may be non-linear. Mean linear extension, skeletal density, and calcification were then compared among these thermal categories. This analysis was considered complementary to the direct analysis of continuous relationships between SST and coral growth parameters.
Mean composite values were then calculated as the arithmetic mean of all growth anomalies within each thermal category:
where Xc is the mean composite of a given growth parameter for SST category c, Xi represents the annual growth anomaly, and nc is the number of years included in that category. This approach was used to characterize the average direction and magnitude of coral growth responses across different levels of thermal variability.
A complementary composite analysis was conducted to evaluate coral growth responses to extreme ENSO conditions. Extreme El Niño and La Niña years were identified from the Oceanic Niño Index (ONI) using thresholds of ONI ≥ +0.8 for extreme El Niño conditions and ONI ≤ −0.8 for extreme La Niña conditions. The thresholds were selected as operational criteria to identify relatively strong climate anomalies while retaining a sufficient number of years for comparison among colonies. For ENSO, annual mean Niño 3.4 anomalies ≥+0.8 °C and ≤−0.8 °C were used to distinguish pronounced warm and cold conditions from near-neutral years. Anomalies exceeding approximately +0.8 °C or falling below −0.8 °C already represent substantial departures from neutral conditions and are commonly associated with stronger El Niño or La Niña conditions. However, because our analysis is based on annual mean Niño 3.4 anomalies rather than the seasonal ONI classification, this threshold is used here as a study-specific operational criterion rather than as an official definition of ENSO intensity.
Similarly, the ±0.30 °C SST threshold was selected to identify years characterized by pronounced positive or negative local SST anomalies while maintaining an adequate number of observations for composite comparisons. These thresholds therefore provide a practical balance between the magnitude of the climatic anomaly and the number of years available for analysis.
Annual mean ENSO data were obtained from the NOAA Physical Sciences Laboratory (PSL) monthly climate time-series database for the period 1938–2025. For each colony, annual linear extension, skeletal density, and calcification values corresponding to identified El Niño and La Niña events were extracted and first examined individually to preserve event-specific variability. Because ENSO events differ in intensity and duration, individual-event responses were retained in the analysis. Composite means were subsequently calculated for El Niño and La Niña conditions only as complementary descriptive indicators to facilitate comparisons among colonies and ENSO phases. Unlike the SST composites, ENSO responses were expressed as percentage deviations from the long-term mean of each growth parameter:
where XENSO is the mean growth parameter during extreme El Niño or La Niña years and XLT is the corresponding long-term mean for the complete colony record. Positive composite values therefore indicate enhanced growth relative to the long-term mean, whereas negative values indicate growth reduction. Because coral chronologies differed in temporal coverage, ENSO composites were calculated separately for each colony using the ENSO years available within its respective chronology. The specific years and sample size (n) contributing to each composite were reported, and composites based on colony-specific reference periods were interpreted descriptively rather than as directly comparable estimates among colonies.
Together, the SST- and ENSO-based composite analyses provide complementary assessments of coral growth sensitivity to local/regional thermal variability and large-scale climate forcing, allowing inter-colony differences in the magnitude and direction of growth responses to be compared.
2.8. Morlet Wavelet Analysis
A continuous wavelet transform (CWT) based on the Morlet wavelet was applied to the annual ENSO time series to identify dominant periodicities and their temporal variability [14]. Wavelet power was calculated as the squared magnitude of the wavelet coefficients, ∣W(s,t)∣2, and represented as a function of time and period. Particular attention was given to the ~2–8-year periodicity band, which is characteristic of ENSO variability [27]. The cone of influence (COI) was used to identify regions potentially affected by edge effects and where wavelet estimates should therefore be interpreted with caution [28]. Wavelet patterns were subsequently compared with annual anomalies in linear extension, skeletal density, and calcification to assess the temporal correspondence between ENSO variability and coral growth responses. This time–frequency approach is particularly suitable for identifying non-stationary climatic signals and their potential relationships with environmental and biological time series [28,29].
2.9. Environmental and Climatic Data
ENSO data were obtained from the Niño 3.4 index provided by the NOAA Physical Sciences Laboratory (PSL) monthly climate time-series database. (https://psl.noaa.gov/data/timeseries/month/) accessed in 23 May 2026. The dataset, available at monthly resolution for the period 1938–2024, represents sea surface temperature (SST) anomalies in the Niño 3.4 region (5° N–5° S, 170° W–120° W), a commonly used indicator of ENSO variability. To ensure temporal consistency with the annually resolved coral growth chronologies, monthly Niño 3.4 values were aggregated into annual means and matched to the corresponding years of each coral record. These annual values were subsequently used to examine relationships between ENSO variability and annual coral growth parameters (linear extension, skeletal density, and calcification).
Similarly, sea surface temperature (SST) data were obtained from the NOAA Physical Sciences Laboratory (PSL). The time series were available at monthly resolution over the study period. Site-specific SST data were extracted separately for each sampling location using the corresponding geographic coordinates. B82 and B10, both collected at Léogâne, were associated with the Léogâne SST series, whereas NE2 and SE1 were associated with the SST series extracted for Caracol and Belle-Anse, respectively. Thus, SST–growth relationships were evaluated using the thermal conditions corresponding to each collection site.
To ensure consistency with the biological and environmental variables analyzed on an annual basis and to facilitate comparisons using the same temporal resolution, the monthly SST values were averaged into annual means prior to statistical analyses.
2.10. Statistical Analyses
To characterize the variability of coral growth parameters and assess their relationships with climatic drivers, several complementary statistical approaches were implemented. All statistical analyses were performed using parametric methods appropriate for the nature of the data and the objectives of the study.
Differences in the mean values of the coral growth parameters (skeletal density, linear extension rate, and calcification rate) were assessed using a one-way analysis of variance (ANOVA). When significant differences were detected (p < 0.05), Tukey’s Honestly Significant Difference (HSD) post hoc test was applied to identify statistically distinct groups.
Relationships among the different growth parameters were examined using simple linear regression analyses. These analyses were used to evaluate the direction and strength of the associations between the biological and climatic variables investigated.
Pearson correlation analyses were performed to quantify the relationships between annual SST anomalies and each coral growth parameter (linear extension, skeletal density, and calcification) for each colony. Correlation coefficients (r) and associated p-values were used to assess the direction, strength, and statistical significance of these relationships.
Correlations among the growth parameters were evaluated using Pearson’s correlation coefficient. The results were summarized in a correlation matrix to visualize the positive and negative relationships among the variables studied.
Principal component analysis (PCA) was conducted on the growth parameters to reduce data dimensionality and identify the main gradients of variability explaining the observed differences among coral samples.
Finally, a composite analysis was performed to investigate the influence of climatic conditions on coral growth. Coral growth parameters were compared with variations in sea surface temperature (SST) and the El Niño–Southern Oscillation (ENSO) index to identify coral responses to warming and cooling periods, as well as to extreme climatic events associated with interannual climate variability.
2.11. Data Processing, Statistical Analyses, and Software
Radiographic, sclerochronological, and densitometric analyses were performed using ImageJ (version 1.54). The software was used to process coral X-radiographs, identify annual high- and low-density growth bands, calibrate image dimensions, and obtain the measurements required to estimate annual linear extension and skeletal density. GIMP (GNU Image Manipulation Program, version 3.0) was additionally used for image enhancement and preparation to improve the visualization of skeletal density bands. Image enhancement was used only to facilitate visualization and did not modify the underlying quantitative measurements.
Pearson correlation analyses were used to quantify the strength and direction of linear relationships among coral growth parameters and between growth parameters and climatic variables. Linear regression analyses were used to characterize the direction and magnitude of these relationships and to estimate regression coefficients and coefficients of determination (R2). Statistical significance was evaluated using the associated p-values, with a significance threshold of p < 0.05. The assumptions underlying the statistical analyses, including linearity, independence, normality of residuals, homoscedasticity, and the potential influence of outliers, were considered where applicable.
Statistical visualization and scientific figures were generated primarily in Python using Matplotlib (version 3.9). To ensure consistency and reproducibility, statistical results, tables, and figures were generated and cross-checked against the same underlying annual dataset.
3. Results
3.1. Temporal, Spatial, and Interspecific Variability in Coral Growth
The four coral colonies exhibited marked interannual and spatial variability in growth (Figure 3). B82 and B10, the two Siderastrea siderea colonies from Léogâne, showed substantial fluctuations in linear extension and calcification over their respective records, with a generally positive temporal correspondence between these two parameters. NE2 (Diploria labyrinthiformis, Caracol) similarly exhibited coherent variations in extension and calcification, whereas SE1 (Diploria labyrinthiformis, Belle-Anse) displayed greater temporal variability and periods of weaker correspondence between the two growth parameters. Overall, these records indicate substantial colony-specific variability in annual skeletal growth.
Figure 3.
Comparison of the temporal series of growth parameters for four massive coral colonies (B82, B10, NE2, and SE1). The curves represent annual linear extension (blue, cm yr−1) and calcification rate (red, g cm−2 yr−1).
Mean growth parameters also differed among colonies (Figure 4), with distinct patterns observed for linear extension, skeletal density, and calcification. Linear extension was highest in NE2 (0.64 ± 0.14 cm yr−1) and SE1 (0.60 ± 0.17 cm yr−1), followed by B10 (0.57 ± 0.17 cm yr−1), while the lowest mean extension was recorded in B82 (0.47 ± 0.16 cm yr−1). This pattern indicates relatively greater skeletal extension in the Diploria labyrinthiformis colonies (NE2 and SE1) compared with the Siderastrea siderea colonies (B82 and B10).
Figure 4.
Comparison of the mean (±standard deviation) annual linear extension, skeletal density, and calcification of coral colonies B82, B10, NE2, and SE1. Letters above the bars indicate homogeneous groups identified by Tukey’s HSD post hoc test (α = 0.05); groups sharing at least one letter are not significantly different.
In contrast, skeletal density showed an opposite pattern. The highest values were recorded in B82 (1.47 ± 0.24 g cm−3) and B10 (1.42 ± 0.14 g cm−3), followed by SE1 (1.38 ± 0.64 g cm−3), whereas NE2 exhibited the lowest skeletal density (0.82 ± 0.11 g cm−3). Thus, the colony with the highest linear extension (NE2) also exhibited the lowest skeletal density, highlighting differences in growth characteristics among colonies.
Calcification, which integrates linear extension and skeletal density, was highest in B10 and SE1 (both 0.81 g cm−2 yr−1), followed by B82 (0.69 ± 0.23 g cm−2 yr−1), and was lowest in NE2 (0.53 ± 0.21 g cm−2 yr−1). Overall, these results demonstrate that higher linear extension did not necessarily correspond to higher calcification, reflecting variation in the relative contribution of skeletal extension and density to coral growth. Tukey’s HSD tests confirmed significant differences among colonies for these growth parameters (Figure 4).
3.2. Relationship Between Linear Extension and Calcification Across Coral Colonies
Relationships among growth parameters further revealed contrasting patterns among colonies (Figure 5). Linear extension and skeletal density were weakly related, indicating limited covariation between these two skeletal growth properties. In contrast, linear extension showed a positive relationship with calcification across all four colonies, although the strength of this relationship varied considerably among colonies. The strongest relationship was observed in B10 (R2 = 0.942), where calcification increased consistently with increasing linear extension. Relatively strong relationships were also observed in B82 (R2 = 0.766) and SE1 (R2 = 0.706) (Figure 5a,d), although the greater dispersion of observations in SE1 indicated higher variability in calcification at comparable extension rates. NE2 exhibited the weakest relationship (R2 = 0.497), with greater scatter around the fitted regression line. Overall, these results indicate that linear extension accounted for a substantial proportion of the variation in calcification in most colonies, particularly B10 and B82, whereas the relationship was more variable in NE2 and SE1 (Figure 5).
Figure 5.
Relationships between linear extension (cm yr−1) and calcification (g cm−2 yr−1) for the Siderastrea siderea colonies B82 (a) and B10 (b), and the Diploria labyrinthiformis. colonies NE2 (c) and SE1 (d). The dashed lines represent the linear regressions between the two growth parameters. The regression equations and coefficients of determination (R2) are provided for each colony to evaluate the strength of the observed relationships.
3.3. Pearson Correlations Among Coral Growth Parameters Across Colonies
Pearson correlation analyses further highlighted colony-specific relationships among the three growth parameters (Table 2). Linear extension and calcification were strongly and positively correlated across all colonies, with Pearson’s r ranging from 0.70 to 0.91 (p < 0.001). This relationship was strongest in B10 (r = 0.91), followed by B82 (r = 0.83), SE1 (r = 0.74), and NE2 (r = 0.70), indicating a consistent positive association between skeletal extension and calcification across colonies.
Table 2.
Pearson correlation coefficients among linear extension, skeletal density, and calcification for the studied coral colonies.
In contrast, the relationship between linear extension and skeletal density varied considerably among colonies. No significant relationship was detected in B82 (r = −0.12, p > 0.05) or B10 (r = 0.18, p > 0.05), whereas NE2 showed a significant moderate positive correlation (r = 0.54, p < 0.01). SE1 exhibited a significant moderate negative correlation (r = −0.36, p < 0.05), indicating that the relationship between extension and skeletal density was not consistent across colonies.
Skeletal density was also positively correlated with calcification, although the strength of this relationship differed among colonies. Moderate correlations were observed in B82 (r = 0.39, p < 0.01) and B10 (r = 0.42, p < 0.01), whereas stronger positive correlations occurred in NE2 (r = 0.71, p < 0.001) and particularly SE1 (r = 0.81, p < 0.001). Overall, B82 and B10 showed calcification patterns more strongly associated with linear extension than with skeletal density, while NE2 displayed similarly strong positive relationships of calcification with both extension and density. In SE1, calcification was more strongly associated with skeletal density than with linear extension. These colony-specific correlation patterns indicate that the relative associations of linear extension and skeletal density with calcification differed among colonies (Table 2).
3.4. Influence of Sea Surface Temperature (SST) on the Sclerochronological Parameters of the Studied Coral Colonies
Overall, the four coral colonies exhibited marked interannual variability in growth responses to SST anomalies, with distinct patterns among colonies. Variations in linear extension, skeletal density, and calcification generally coincided with changes in thermal conditions, although the magnitude and direction of these responses were not consistent through time. B82 and B10 (Figure 6a,b) showed relatively high interannual fluctuations over their longer records, whereas NE2 and SE1 (Figure 6c,d) displayed pronounced changes during recent decades. These contrasting trajectories indicate that coral growth responses to SST variability are colony-specific and parameter-dependent, suggesting that temperature interacts with local environmental and biological factors in controlling skeletal growth and calcification.
Figure 6.
Temporal variability of coral growth parameters in response to sea surface temperature (SST) anomalies in coral colonies B82, B10, NE2, and SE1.
3.5. Influence of Sea Surface Temperature (SST) on the Linear Extension of Coral Colonies B82, B10, NE2, and SE1
A comparative analysis of the four coral colonies revealed that linear extension showed a heterogeneous response to SST variability, with the strongest reductions generally occurring during pronounced positive thermal anomalies in B82, B10, and NE2, while SE1 (Figure 6a–d) appeared comparatively less sensitive. In colony B82, several episodes of strong warming coincided with reduced linear extension. The positive SST anomalies of 1963 (+0.34 °C) and 1964 (+0.38 °C) were associated with extension anomalies of −0.21 and −0.16 cm yr−1, respectively. Similarly, the pronounced warming recorded in 1998 (+0.44 °C) corresponded to a negative extension anomaly of −0.14 cm yr−1. In contrast, positive extension was maintained under moderate thermal conditions, reaching +0.24 cm yr−1 in 1961 at an SST anomaly of +0.25 °C and +0.27 cm yr−1 in 1977 under near-neutral SST conditions (0.00 °C). These observations suggest that moderate thermal conditions may favor skeletal extension, whereas stronger positive SST anomalies can constrain longitudinal growth.
Colony B10 exhibited a comparable, but more pronounced, thermal response. Strong positive SST anomalies were associated with substantial reductions in linear extension, particularly in 1998, when an SST anomaly of +0.44 °C coincided with an extension anomaly of −0.16 cm yr−1, and in 2010, when an SST anomaly of +0.40 °C was accompanied by an extension anomaly of −0.15 cm yr−1. Conversely, some of the highest positive extension anomalies occurred under cool to moderately warm conditions. Linear extension reached +0.48 cm yr−1 in 1965 at an SST anomaly of −0.13 °C, +0.34 cm yr−1 in 1961 at +0.25 °C, and +0.35 cm yr−1 in 1975 at −0.36 °C. The occurrence of high extension under both slightly warm and relatively cool conditions indicates that the response is not strictly linear, but the reduction observed during stronger warming events suggests that excessive thermal anomalies may constrain skeletal extension.
Colony NE2 also showed evidence of reduced extension during periods of sustained warming. The strongest positive SST anomaly in the series occurred in 2016 (+0.38 °C) and was associated with an extension anomaly of only +0.01 cm yr−1, indicating almost no departure from mean growth. In contrast, the highest positive extension anomaly was recorded in 2008 (+0.40 cm yr−1) during distinctly cooler conditions (SST = −0.21 °C). Extension also remained relatively high in 2010 (+0.31 cm yr−1; SST = +0.10 °C) and 2021 (+0.24 cm yr−1; SST = +0.09 °C). These patterns suggest that NE2 achieved its highest longitudinal growth under cool to moderately warm conditions, whereas stronger positive thermal anomalies were associated with diminished extension.
Colony SE1 displayed a more complex and comparatively stable response to SST variability. Strong cooling during the late 1980s and early 1990s did not consistently suppress extension; for example, SST anomalies of −0.50 °C in 1991 and −0.42 °C in 1992 were both associated with positive extension anomalies of approximately +0.11 cm yr−1. Likewise, extension remained positive during several warm years, reaching +0.33 cm yr−1 in 2013 at an SST anomaly of +0.11 °C and +0.17 cm yr−1 in 2016 at +0.40 °C. Even during the exceptionally warm conditions recorded in 2023 (+0.49 °C) and 2024 (+0.76 °C), extension remained positive at +0.14 and +0.10 cm yr−1, respectively. This persistence of positive growth under pronounced warming distinguishes SE1 from the other colonies and suggests a greater capacity to maintain longitudinal skeletal extension across a broad range of thermal conditions.
Overall, the four colonies indicate that the relationship between SST and linear extension is nonlinear and colony-specific. Strong positive SST anomalies, particularly those exceeding approximately +0.30 °C, frequently coincided with reduced extension in B82, B10, and NE2, whereas SE1 maintained positive extension even during some of the strongest warming events. Conversely, several of the highest extension anomalies occurred under cool, near-neutral, or moderately warm SST conditions. These results suggest that moderate thermal conditions may be more favorable for linear skeletal growth, while extreme warming can impose constraints on extension in some colonies. However, because contrasting responses also occurred within individual records, these temporal patterns should be interpreted together with SST–extension correlation and regression analyses before concluding that SST was the direct driver of the observed growth variability.
3.6. Influence of Sea Surface Temperature (SST) on Skeletal Density of Coral Colonies B82, B10, NE2, and SE1
Skeletal density appeared to be considerably more sensitive to SST variability than linear extension. In colony B82, episodes of intense warming were generally associated with reduced skeletal density. The years 1963 and 1964 (SST anomalies of +0.34 °C and +0.38 °C, respectively) exhibited relatively low density anomalies of 0.27 g cm−3 and −0.01 g cm−3, whereas cooler years such as 1968 and 1969 reached 0.56 g cm−3 and 0.58 g cm−3, respectively. A notable exception occurred in 2010 (SST = +0.40 °C), when skeletal density reached 0.60 g cm−3, suggesting the influence of additional environmental drivers.
A similar pattern was observed in colony B10, where extreme warm anomalies were associated with low or negative density anomalies, indicating a reduced capacity for skeletal densification. In contrast, moderately cool conditions and some cooler years promoted greater skeletal density, particularly in 1965, when overall growth performance reached its maximum.
Colony NE2 exhibited the clearest response to elevated SST. During the extreme warming event of 2016 (SST = +0.377 °C), skeletal density decreased to −0.170 g cm−3, whereas it reached 0.302 g cm−3 in 2012 (SST = −0.167 °C) and 0.233 g cm−3 in 2020. The total variation exceeded 0.47 g cm−3, highlighting the high vulnerability of skeletal densification to thermal stress.
In colony SE1, skeletal density was most strongly affected by extreme cooling events. Strong cool anomalies (mean SST anomaly = −0.43 °C) corresponded to a composite density anomaly of −0.51, whereas moderately cool conditions produced a positive anomaly of +0.21. Moderately warm and strongly warm SST anomalies also resulted in positive density anomalies of +0.08 and +0.11, respectively. The years 2023 and 2024 were characterized by exceptionally high density anomalies of +1.16 and +0.55, associated with SST anomalies of +0.49 °C and +0.76 °C, respectively.
Overall, skeletal density proved to be an excellent indicator of thermal conditions. Extreme warming particularly affected colonies B82, B10, and NE2, whereas in colony SE1, the strongest reductions in density occurred during episodes of intense cooling.
3.7. Influence of Sea Surface Temperature (SST) on Calcification of Coral Colonies B82, B10, NE2, and SE1
Calcification was the sclerochronological parameter most sensitive to SST variability. In colony B82, episodes of extreme warming resulted in substantial reductions in calcium carbonate production. The years 1963 and 1964 exhibited negative calcification anomalies of −0.24 g cm−2 yr−1 and −0.23 g cm−2 yr−1, respectively, while the 1998 El Niño event was associated with a calcification anomaly of −0.18 g cm−2 yr−1. Conversely, SST conditions close to the long-term average promoted positive calcification anomalies, reaching 0.54 g cm−2 yr−1 in 2002.
Colony B10 also displayed high sensitivity of calcification to elevated SST. Extreme warm episodes in 1969, 1998, and 2010 corresponded to calcification anomalies of −0.086, −0.143, and −0.131 g cm−2 yr−1, respectively. In contrast, 1965 (SST = −0.13 °C) recorded the highest calcification value of the series (0.771 g cm−2 yr−1), illustrating the beneficial effect of moderate thermal conditions.
In colony NE2, the influence of SST was particularly pronounced. During the extreme warming event of 2016 (SST = +0.377 °C), calcification became negative (−0.109 g cm−2 yr−1), whereas it reached 0.526 g cm−2 yr−1 in 2008 under moderately cool SST conditions (−0.213 °C). This difference of more than 0.63 g cm−2 yr−1 demonstrates a substantial reduction in carbonate production under thermal stress.
Colony SE1 exhibited a thermal response opposite to that observed in the other colonies. Strong cool SST anomalies produced the lowest composite calcification anomaly (−0.32), whereas moderately cool conditions were close to equilibrium (−0.02). Moderately warm SST anomalies increased calcification to +0.14, while strong warm anomalies resulted in the highest composite value (+0.17). The years 2023 and 2024 contributed substantially to this pattern, with calcification anomalies of +1.06 and +0.53, respectively.
Overall, these results indicate that calcification is the most sensitive indicator of coral responses to SST variability. Colonies B82, B10, and NE2 exhibited marked reductions in calcification during episodes of extreme warming (>+0.30 °C), reflecting a decline in reef-building capacity. In contrast, colony SE1 appeared to benefit from elevated SST and was more vulnerable to episodes of intense cooling. This contrasting response suggests the existence of physiological and/or environmental differences among the study sites, potentially reflecting distinct capacities for thermal acclimatization.
3.8. Relative Responses of Coral Growth Parameters to SST Anomalies
Mean composite values of linear extension, skeletal density, and calcification are presented according to four thermal categories: extreme cool SST anomalies (<−0.30 °C), moderate cool SST anomalies (−0.30 to 0 °C), moderate warm SST anomalies (0 to 0.30 °C), and extreme warm SST anomalies (>0.30 °C). The results reveal contrasting responses among the coral colonies to thermal variability. Colonies B82, B10, and NE2 (Figure 7a–c) generally exhibited their highest growth performance under moderate thermal conditions, whereas extreme warm anomalies were associated with reduced skeletal density and calcification. In contrast, colony SE1 showed a more favorable response to elevated SST and a greater sensitivity to episodes of intense cooling. Overall, calcification emerged as the growth parameter most sensitive to SST anomalies, followed by skeletal density, whereas linear extension remained comparatively stable in response to thermal fluctuations.
Figure 7.
Percentage Responses of Coral Growth Parameters to Sea Surface Temperature (SST) Anomalies in Colonies B82, B10, NE2, and SE1.
The figure above (Figure 7) shows colony-specific changes in linear extension, skeletal density, and calcification across four sea surface temperature (SST) anomaly classes, expressed as percentages relative to each colony’s long-term mean. Overall, the magnitude and direction of the responses varied markedly among colonies and growth parameters.
Colony B82 (Figure 7a) exhibited predominantly negative responses under cold and extremely warm conditions. Extreme cold SSTs were associated with declines of 21% in linear extension, 32% in skeletal density, and 35% in calcification. Moderate warm conditions, in contrast, enhanced all three parameters, with increases of 25%, 15%, and 23%, respectively. Extreme warm SSTs reduced extension, density, and calcification by 12%, 20%, and 15%.
Colony B10 (Figure 7b) showed the strongest positive responses under moderate cold conditions, with linear extension and calcification both increasing by 71%, while skeletal density increased by 16%. Moderate warm SSTs also promoted extension and calcification by 48%, whereas extreme warm conditions caused reductions of 18% in extension and 16% in both density and calcification.
Colony NE2 (Figure 7c) displayed similarly strong positive responses under moderate cold SSTs, including increases of 58% in linear extension, 28% in skeletal density, and 59% in calcification. Moderate warm conditions also enhanced all three parameters. However, extreme cold SSTs reduced skeletal density by 32%, while extreme warm conditions produced only minor changes in extension but decreased density and calcification by 12% and 10%, respectively.
Colony SE1 (Figure 7d) showed comparatively limited changes in linear extension, which varied from +2% to +9% across SST classes. In contrast, skeletal density and calcification were highly sensitive to cold conditions, declining by 40% and 34%, respectively, under extreme cold SSTs. Moderate cold and warm conditions generally stimulated density and calcification, whereas extreme warm SSTs produced a slight decline in density but a 12% increase in calcification.
Taken together, these results indicate that moderate SST anomalies were generally associated with enhanced coral growth, particularly in B10 and NE2, whereas extreme thermal conditions produced more negative and parameter-specific responses. Calcification and skeletal density appeared more sensitive than linear extension in B82 and SE1, highlighting contrasting physiological strategies among the four colonies.
3.9. Pearson Correlation Analyses Between Annual SST Anomalies and Each Growth Parameter (Linear Extension, Skeletal Density, and Calcification) for Each Coral Colony
Pearson correlation analyses showed colony-specific relationships between SST anomalies and coral growth parameters (Table 3). In B82, SST was weakly positively correlated with linear extension (r = 0.038), skeletal density (r = 0.318), and calcification (r = 0.200). In B10, weak negative relationships were observed between SST and linear extension (r = −0.088), skeletal density (r = −0.069), and calcification (r = −0.112). Similarly, NE2 showed negative relationships between SST and linear extension (r = −0.036), skeletal density (r = −0.225), and calcification (r = −0.151). In contrast, SE1 showed positive relationships between SST and linear extension (r = 0.211), skeletal density (r = 0.188), and calcification (r = 0.302). Overall, the direction and magnitude of SST–growth relationships varied among colonies, with the strongest positive relationships observed for skeletal density in B82 and calcification in SE1.
Table 3.
Pearson correlations between annual SST anomalies and coral growth parameters for the four studied colonies. r represents the Pearson correlation coefficient and p the associated probability value.
3.10. Influence of ENSO Signals on the Sclerochronological Parameters of the Studied Coral Colonies
The analysis revealed pronounced interannual variability in ENSO and coral growth parameters across the four colonies (Figure 8A,D). Morlet wavelet analysis identified persistent ENSO variability mainly within the ~2–8-year periodicity band, although its intensity varied through time and among records. Linear extension generally showed rapid year-to-year fluctuations, whereas skeletal density and calcification exhibited stronger multi-year variability, particularly in NE2 and SE1. Overall, the temporal correspondence between ENSO variability and coral growth differed among colonies, indicating that coral responses to large-scale climatic forcing are parameter-, colony-, and site-dependent. Interannual and multi-year variability was observed in the coral growth records; however, these fluctuations were not consistently synchronized with annual SST or ENSO variability. Therefore, no common climatic periodicity can be inferred from these temporal patterns alone. These results suggest that ENSO may contribute to coral growth variability, but its influence is likely modulated by local environmental conditions and colony-specific physiological responses.
Figure 8.
Temporal variability of coral growth parameters in response to ENSO anomalies in coral colonies B82, B10, NE2, and SE1.
3.11. Influence of Extreme El Niño Events on Coral Colonies
Composite analysis of extreme El Niño events (ENSO ≥ +0.8) revealed an overall negative response of coral growth in colonies B82, B10, and NE2, whereas colony SE1 exhibited a more variable response.
In colony B82, El Niño events were associated with mean anomalies of −0.06 for linear extension, −0.11 for skeletal density, and −0.11 for calcification. The strongest events, particularly those of 1941 and 1997, corresponded to simultaneous declines in all three growth parameters, with anomalies reaching −0.26, −0.31, and −0.45, respectively, in 1941.
Colony B10 appeared to be the most sensitive to El Niño events. Composite anomalies reached −0.141 for linear extension, −0.128 for skeletal density, and −0.246 for calcification. Calcification was the most severely affected parameter, with anomalies of −0.351 in 1982 and −0.294 in 1997.
In colony NE2, extreme El Niño events also resulted in reduced growth, with mean anomalies of −0.060 for linear extension, −0.097 for skeletal density, and −0.119 for calcification. The exceptionally strong 2015 El Niño event (ENSO = 1.47) was associated with a skeletal density anomaly of −0.178 and a calcification anomaly of −0.121.
In contrast, colony SE1 exhibited an atypical response to El Niño events. Composite anomalies indicated a slight reduction in linear extension (−0.04), whereas skeletal density (+0.066) and calcification (+0.081) remained positive. The years 1987 and 2023 were characterized by particularly high positive anomalies in skeletal density (+1.12 and +1.16, respectively) and calcification (+0.46 and +1.06, respectively).
Overall, extreme El Niño events primarily affected skeletal density and calcification, indicating reduced calcium carbonate deposition in colonies B82, B10, and NE2. In contrast, colony SE1 appeared to exhibit greater tolerance to these warming events.
3.12. Influence of Extreme La Niña Events on Coral Colonies
Extreme La Niña events (ENSO ≤ −0.8) produced more variable and generally less adverse responses than El Niño events.
In colony B82, composite anomalies reached −0.014 for linear extension, +0.075 for skeletal density, and +0.006 for calcification. Several years even showed favorable responses, particularly 1971, with skeletal density and calcification anomalies of +0.34 and +0.15, respectively, and 2000, when all three growth parameters became positive (+0.19, +0.12, and +0.36, respectively).
For colony B10, the average effects of La Niña were slightly positive, with composite anomalies of +0.018 for linear extension, +0.002 for skeletal density, and +0.017 for calcification. The years 1950 and 1975 exemplify this favorable response, with calcification anomalies reaching +0.415 and +0.468, respectively.
Colony NE2 exhibited an intermediate response. Composite anomalies were −0.039 for linear extension, +0.045 for skeletal density, and −0.008 for calcification. However, the years 2011 and 2022 were characterized by favorable conditions, with skeletal density anomalies of +0.241 and +0.160 and calcification anomalies of +0.106 and +0.080, respectively.
In colony SE1, La Niña events were associated with mean anomalies of −0.02 for linear extension, +0.17 for skeletal density, and +0.11 for calcification. The year 2011 was particularly notable, with exceptionally high anomalies in skeletal density (+1.17) and calcification (+1.12), while 2021 also exhibited positive anomalies for all three growth parameters.
Overall, extreme La Niña events had a more moderate impact than extreme El Niño events. They were generally associated with skeletal density and calcification values that were close to or slightly above the long-term mean, suggesting that cooler conditions did not represent a major constraint on the growth of the studied coral colonies and may even locally promote biomineralization processes.
3.13. Composite Responses of ENSO Signals on the Sclerochronological Variables of the Studied Coral Colonies
The influence of large-scale climate variability on coral growth was assessed by examining the responses of the four coral colonies (B82, B10, NE2, and SE1) to extreme El Niño and La Niña events. Extreme ENSO phases were identified using the Oceanic Niño Index (ONI), and variations in linear extension, skeletal density, and calcification during these events were compared with their respective long-term mean values. This analysis provides an integrated assessment of the sensitivity of coral growth to extreme ENSO conditions and highlights potential differences in growth responses among colonies and between warm and cold ENSO phases.
The composite analyses (Figure 9, Panels B) reveal clear differences in coral sensitivity to extreme ENSO phases. During extreme El Niño events, all colonies exhibited reductions in linear extension, indicating that elevated sea surface temperatures consistently suppressed skeletal elongation. The largest declines were observed in B82 (−26%) and B10 (−25%) (Figure 9, panel B), whereas NE2 (−13%) and SE1 (−10%) showed comparatively smaller reductions. Similar patterns were observed for skeletal density, which decreased in B82 (−6%), B10 (−8%), and NE2 (−10%), suggesting reduced skeletal densification under thermal stress. In contrast, SE1 exhibited a slight increase (+3%), indicating that this colony maintained skeletal density despite extreme warming.
Figure 9.
Summary of the composites responses of the four coral colonies (B82, B10, NE2, and SE1) to extreme ENSO events using three complementary approaches: (A) identification of extreme El Niño and La Niña years, (B) mean composite responses of coral growth parameters expressed as percentages relative to the long-term mean.
Calcification responses followed comparable trends. El Niño reduced calcification in B82 (−17%), B10 (−20%), and NE2 (−19%), demonstrating a decline in annual carbonate production. Conversely, SE1 showed a positive calcification response (+10%), suggesting that this colony maintained or even enhanced calcification during extreme warm events. This contrasting behavior highlights substantial differences in physiological tolerance among colonies.
Responses during extreme La Niña events were generally weaker and more variable than during El Niño. B82 continued to exhibit slight reductions in linear extension (−5%) and calcification (−3%), although skeletal density increased (+5%). B10 showed moderate recovery, with increases in linear extension (+8%) and calcification (+15%), while skeletal density remained nearly unchanged (−2%). NE2 displayed only minor responses, with small decreases in linear extension (−9%) and calcification (−2%) but a slight increase in skeletal density (+2%). The most favorable response was observed in SE1, where skeletal density (+3%) and calcification (+12%) increased, while linear extension was only slightly reduced (−4%).
Overall, the composite responses indicate that extreme El Niño events exerted a substantially stronger negative influence on coral growth than extreme La Niña events. Among the four colonies, B82 and B10 were the most sensitive to thermal anomalies, exhibiting marked reductions across all three growth parameters. In contrast, SE1 consistently showed the highest tolerance, maintaining positive skeletal density and calcification even during extreme El Niño events. Differences in growth responses among colonies should not be interpreted exclusively as responses to environmental conditions. Intrinsic biological variability among individual colonies may also influence linear extension, skeletal density, and calcification. Given the limited number of colonies analyzed per species and site, the present results primarily characterize colony-specific growth histories, and broader species- or site-level generalizations should therefore be made cautiously. These findings suggest pronounced spatial and colony-specific differences in physiological resilience, likely reflecting the combined influence of species-specific traits and local environmental conditions.
4. Discussion
4.1. Spatial and Interspecific Variability in the Linear Extension of Massive Corals
The results show that the Diploria labyrinthiformis colonies (NE2 and SE1) exhibited significantly higher linear extension rates than the Siderastrea siderea colonies (B10 and B82). This interspecific difference is consistent with the growth strategies reported for massive Caribbean corals. Species of the genus Diploria generally invest more in skeletal extension to optimize light acquisition and spatial competition, whereas Siderastrea allocates proportionally more resources to skeletal densification, a strategy often associated with greater resistance to environmental disturbances [12,30].
The interpretation of linear extension in the Léogâne colonies requires consideration of colony morphology and local growth constraints. If B10 and B82 developed as microatolls, upward skeletal growth may have been limited by low-water exposure and the local upper growth limit, potentially favoring lateral rather than vertical expansion [31,32,33]. Coral microatoll morphology is strongly influenced by the upper limit of coral survival relative to local water level, making colony geometry and growth orientation important considerations when interpreting skeletal extension records [31,32,33]. Consequently, the comparatively low linear extension rates observed in the Léogâne colonies cannot be attributed exclusively to temperature-related or physiological responses. Differences in colony geometry, water depth, and orientation of skeletal growth may also contribute to the contrast between the Léogâne records and the deeper colonies from Caracol and Belle-Anse. Therefore, comparisons among these colonies should be interpreted primarily as differences among individual growth records rather than as direct species- or site-level responses.
The mean linear extension rates recorded for colony NE2 at Caracol (0.64 cm yr−1) and colony SE1 at Belle-Anse (0.60 cm yr−1) fall within the range reported for relatively well-preserved Caribbean reefs, where Diploria growth rates generally vary between 0.5 and 0.9 cm yr−1 [6,12]. In contrast, the lower values observed at Léogâne, particularly for colony B82 (0.47 cm yr−1), suggest the presence of local environmental constraints limiting skeletal extension.
The contrasting responses observed between Siderastrea siderea and Diploria labyrinthiformis likely reflect distinct physiological strategies that have evolved to cope with environmental variability. S. siderea is generally recognized as a stress-tolerant, conservative species characterized by relatively slow skeletal extension, high skeletal density, and stable calcification rates. This species possesses an efficient physiological capacity to regulate the chemistry of its calcifying fluid, allowing it to maintain aragonite saturation and skeletal deposition under moderately stressful environmental conditions [12,30]. In addition, S. siderea has demonstrated greater tolerance to elevated temperature and ocean acidification than many Caribbean reef-building corals, maintaining relatively stable calcification until environmental thresholds are exceeded [30]. These physiological characteristics are consistent with the relatively high skeletal density and moderate temporal variability observed in colonies B82 and B10, suggesting that this species primarily invests energy in maintaining skeletal integrity and resisting environmental disturbances rather than maximizing rapid skeletal growth.
In contrast, D. labyrinthiformis appears to adopt a more plastic growth strategy, characterized by greater interannual variability in extension, density, and calcification [34]. Rather than maintaining constant growth under stress, this species appears capable of reallocating energetic resources toward rapid skeletal recovery when environmental conditions improve. Such physiological plasticity has been reported in several massive Caribbean corals, where carbonate production is maintained through compensatory increases in linear extension despite temporary reductions in skeletal density [34,35]. Experimental studies have further shown that Diploria species respond positively to increased energetic availability, exhibiting enhanced calcification and tissue growth under favorable conditions [36].
Overall, the differences observed among sites indicate that coral growth is controlled not only by regional temperature but also by hydrodynamic conditions, trophic availability, and local habitat characteristics. These findings are consistent with those of Okazaki [37], who demonstrated that contemporary Caribbean reefs exhibit highly heterogeneous growth trajectories resulting from the combined influence of climatic and local environmental drivers.
4.2. Temporal Trends in the Linear Extension of the Studied Corals
The temporal trends observed in this study revealed contrasting trajectories among the coral colonies. While colonies B82, NE2, and SE1 exhibited slightly positive trends in linear extension, colony B10 showed a gradual decline over recent decades. This decrease is particularly noteworthy because it coincides with a period of rapid sea surface warming in the Caribbean. Since the 1980s, the region has experienced an average warming rate exceeding 0.20 °C per decade, accompanied by an increasing frequency of marine heatwaves [30,38].
According to the thermal performance model proposed by Castillo [39], coral growth increases with temperature up to a physiological optimum, beyond which growth declines rapidly. Mass bleaching events documented across the Caribbean in 1998, 2005, 2010, 2015–2016, and 2023 have resulted in substantial reductions in growth rates for several massive coral species [8,40].
Nevertheless, colony NE2 exhibited a relatively pronounced positive trend (R2 = 0.282), suggesting a certain degree of acclimatization. This response may be related to the chronic exposure of the Caracol site to fluctuations in temperature and salinity associated with freshwater inputs from Caracol Bay. Several recent studies have shown that coral populations inhabiting naturally variable environments often develop enhanced thermal tolerance through physiological acclimatization and/or local adaptation [41,42]. These findings suggest that some Haitian reefs may harbor coral populations with relatively high resilience to ongoing climate change.
4.3. Spatial Variability in Skeletal Density: A Strategy for Environmental Resistance
In contrast to linear extension, the Siderastrea siderea colonies exhibited the highest skeletal densities (1.42–1.47 g cm−3), whereas Diploria labyrinthiformis displayed significantly lower values, particularly at Caracol (0.82 g cm−3).
This difference most likely reflects distinct biological strategies of skeletal construction. Species of the genus Siderastrea are well known for producing exceptionally compact skeletons that provide greater resistance to mechanical stress, including strong hydrodynamic conditions, tropical storms, and other physical disturbances [43]. Experimental studies have further demonstrated that Siderastrea siderea is among the Caribbean coral species most tolerant to ocean acidification and seawater warming [39,44].
The observed variations in skeletal density and calcification likely reflect complex physiological responses to local environmental fluctuations. In Siderastrea siderea, both growth and calcification vary according to the intensity of thermal stress and ocean acidification, indicating that acclimatization capacity becomes limited once critical environmental thresholds are exceeded [39]. This relatively high tolerance is frequently associated with the species’ ability to maintain substantial skeletal densification even when linear extension rates decline [45,46].
4.4. Calcification as an Integrative Indicator of Coral Physiological Performance
Calcification may represent one of the most robust indicators of overall coral physiological performance because it integrates both linear extension and skeletal density. The results showed that colonies B10 and SE1 exhibited the highest mean calcification rates (0.81 g cm−2 yr−1), whereas colony NE2 displayed the lowest value (0.53 g cm−2 yr−1). These findings confirm that high rates of linear extension do not necessarily result in high calcification when skeletal density remains low. Conversely, a highly dense skeleton does not guarantee high carbonate production when linear extension is limited.
The statistical analyses further demonstrated that calcification was much more strongly associated with linear extension (R2 = 0.50–0.94) than with skeletal density (R2 = 0.02–0.35). This finding is consistent with numerous studies conducted in the Caribbean and the Pacific, where linear extension has generally been identified as the primary determinant of carbonate production in massive corals [4,45].
This strong dependence of calcification on linear extension is of particular concern in the context of ongoing climate warming. Indeed, several studies have shown that reductions in linear extension often constitute one of the earliest detectable physiological responses to thermal stress, occurring before colony mortality or visible bleaching becomes apparent [6,7].
4.5. Regional Climate Forcing of Coral Growth Dynamics
The synchronous fluctuations observed among several coral colonies suggest the influence of a common regional climatic forcing. Peaks and declines in growth frequently occur simultaneously across multiple chronologies, a pattern characteristic of large-scale climate control. Sea surface temperature (SST) is likely the primary environmental driver of these variations. In the Caribbean, elevated SST directly affects coral metabolism and the photosynthetic performance of their symbiotic algae, thereby influencing skeletal growth [47]. When temperatures remain close to the thermal optimum, coral growth is generally enhanced. However, when positive SST anomalies exceed approximately +1 to +2 °C for several consecutive weeks, calcification rates decline markedly and the likelihood of coral bleaching increases substantially [38,47].
The influence of the El Niño–Southern Oscillation (ENSO) is also well documented throughout the Caribbean. El Niño events modify regional atmospheric and oceanic circulation, often generating positive thermal anomalies that promote coral bleaching. In contrast, certain La Niña phases may temporarily provide more favorable conditions for coral growth by alleviating thermal stress [27,48]. The pronounced interannual variability observed at Belle-Anse and Caracol may therefore reflect the combined effects of these regional climatic signals and site-specific environmental conditions.
Overall, our findings indicate that Haitian coral reefs still retain a relatively high growth potential compared with several Caribbean regions where coral calcification has declined by more than 30% since the 1970s [12]. Diploria labyrinthiformis colonies exhibited higher linear extension rates and demonstrated a strong capacity to recover following periods of environmental stress. In contrast, Siderastrea siderea colonies were characterized by higher skeletal density and greater temporal stability, traits that may enhance their resistance to future environmental disturbances. These complementary growth strategies suggest that both species may contribute differently to the persistence and long-term resilience of Haitian coral reef ecosystems under ongoing climate change.
5. Conclusions
This study provides a long-term sclerochronological assessment of massive coral growth across three reef sites in Haiti. The four coral records revealed pronounced interannual and colony-specific variability in linear extension, skeletal density, and derived calcification, highlighting the heterogeneity of skeletal growth within and among the investigated records. Rather than indicating consistent species- or site-level patterns, these differences emphasize the importance of considering individual colony trajectories when interpreting long-term coral growth.
Relationships between coral growth and environmental variability were also heterogeneous. Pearson correlation analyses identified the strongest positive associations between SST and skeletal density in B82 (r = 0.318) and between SST and calcification in SE1 (r = 0.302), whereas other relationships were weaker or differed in direction among colonies. ENSO composites similarly showed contrasting growth patterns during warm and cold conditions, with no uniform response across the four records. These findings indicate that coral growth responses to climatic variability are colony- and growth-parameter-specific, with SST and ENSO explaining partially the observed temporal patterns and suggesting an additional role for local environmental conditions and colony-level biological variability.
Despite differences in temporal coverage, the four long-term coral records provide complementary insights into the diversity of growth trajectories across Haitian reefs, offering a valuable colony-level baseline and a strong foundation for future studies aimed at resolving broader species- and reef-scale patterns. Nevertheless, they provide an important historical baseline for Haitian reefs, where long-term coral growth records remain scarce. Continued sclerochronological monitoring, combined with greater biological replication and additional environmental observations, will be essential for improving our understanding of coral growth variability and its relationship with ongoing climatic and environmental change in the Caribbean.
Author Contributions
M.B., F.L., D.N., J.W.-A. and E.E. contributed equally to this work. All authors participated in the interpretation and discussion of the results, critically revised the manuscript. All authors have read and agreed to the published version of the manuscript.
Funding
This work was supported by the French Embassy in Haiti through the Antenor Firmin Excellence Scholarship Program (Grant no 107982Y), which supports doctoral mobility and promotes research training and scientific cooperation.
Data Availability Statement
The datasets generated and analyzed in this study are part of the corresponding author’s ongoing doctoral research and are therefore not publicly available at this stage. The doctoral thesis is being conducted within the Doctoral School “Sciences de l’Environnement” at Sorbonne Université and the CNRS–Sorbonne Université Observatoire Océanologique de Banyuls-sur-Mer, France, in co-supervision with the Climate Change Research Team (ERC2) at Université Quisqueya. Reasonable requests for access to the datasets should be addressed to the corresponding author.
Acknowledgments
The author sincerely acknowledges all the individuals and institutions whose support and expertise contributed to the successful completion of this study. Special thanks are extended to the IRD Center in Bondy (France) for providing the facilities and infrastructure required for the preparation, treatment, and analysis of coral samples. The author is deeply grateful to the staff of Jean Verdier Hospital (Bondy, France) for their invaluable assistance with the radiographic imaging of coral slabs, an essential step in the sclerochronological analyses, with particular appreciation to Ketty Vadrot for her kindness, warm welcome, professionalism, and constant enthusiasm throughout the study. Sincere thanks are also extended to Hugues Boucher (IRD–LOCEAN) for his expert assistance with image processing and the measurement of coral density bands, which constituted a key component of the sclerochronological analyses. Finally, the author gratefully acknowledges Thierry Pilorge (IRD–LOCEAN) for his technical expertise in preparing and repeatedly sectioning coral cores into thin slabs, a crucial step that ensured the quality and reliability of the observations and subsequent analyses.
Conflicts of Interest
The authors declare no conflicts of interest.
References
- Cornwall, C.E.; Comeau, S.; Kornder, N.A.; Perry, C.T.; van Hooidonk, R.; DeCarlo, T.M.; Pratchett, M.S.; Anderson, K.D.; Browne, N.; Carpenter, R.; et al. Global declines in coral reef calcium carbonate production under ocean acidification and warming. Proc. Natl. Acad. Sci. USA 2021, 118, e2015265118. [Google Scholar] [CrossRef] [Scilit] [PubMed]
- Eddy, T.D.; Lam, V.W.Y.; Reygondeau, G.; Cisneros-Montemayor, A.M.; Greer, K.; Palomares, M.L.D.; Bruno, J.F.; Ota, Y.; Cheung, W.W.L. Global decline in capacity of coral reefs to provide ecosystem services. One Earth 2021, 4, 1278–1285. [Google Scholar] [CrossRef] [Scilit]
- Chan, N.C.S.; Connolly, S.R. Sensitivity of coral calcification to ocean acidification: A meta-analysis. Glob. Chang. Biol. 2013, 19, 282–290. [Google Scholar] [CrossRef] [Scilit] [PubMed]
- Kornder, N.A.; Riegl, B.M.; Figueiredo, J.; Dove, S.; Hoegh-Guldberg, O. Thresholds and drivers of coral calcification responses to climate change. Glob. Chang. Biol. 2018, 24, 5084–5095. [Google Scholar] [CrossRef] [Scilit] [PubMed]
- Perry, C.T.; Murphy, G.N.; Kench, P.S.; Smithers, S.G.; Edinger, E.N.; Steneck, R.S.; Mumby, P.J. Caribbean-wide decline in carbonate production threatens coral reef growth. Nat. Commun. 2013, 4, 1402. [Google Scholar] [CrossRef] [Scilit] [PubMed]
- Carricart-Ganivet, J.P.; Cabanillas-Terán, N.; Cruz-Ortega, I.; Blanchon, P. Sensitivity of calcification to thermal stress varies among genera of massive reef-building corals. PLoS ONE 2012, 7, e32859. [Google Scholar] [CrossRef] [Scilit] [PubMed]
- Baker, A.C.; Glynn, P.W.; Riegl, B. Climate change and coral reef bleaching: An ecological assessment of long-term impacts, recovery trends and future outlook. Estuar. Coast. Shelf Sci. 2008, 80, 435–471. [Google Scholar] [CrossRef] [Scilit]
- Bove, C.B.; Umbanhowar, J.; Castillo, K.D. Meta-analysis reveals reduced coral calcification under projected ocean warming but not under acidification across the Caribbean Sea. Front. Mar. Sci. 2020, 7, 127. [Google Scholar] [CrossRef] [Scilit]
- Pratchett, M.S.; Anderson, K.D.; Hoogenboom, M.O.; Widman, E.; Baird, A.H.; Pandolfi, J.M.; Edmunds, P.J.; Lough, J.M. Spatial, temporal and taxonomic variation in coral growth: Implications for the structure and function of coral reef ecosystems. Oceanogr. Mar. Biol. Annu. Rev. 2015, 53, 215–296. [Google Scholar]
- Gardner, T.A.; Côté, I.M.; Gill, J.A.; Grant, A.; Watkinson, A.R. Long-term region-wide declines in Caribbean corals. Science 2003, 301, 958–960. [Google Scholar] [CrossRef] [Scilit] [PubMed]
- Manzello, D.P.; Enochs, I.C.; Kolodziej, G.; Carlton, R. Recent decade of growth and calcification of Caribbean reef-building corals in the Florida Keys. Nat. Commun. 2018, 9, 5274. [Google Scholar]
- Rippe, J.P.; Baumann, J.H.; De Leener, D.; Aichelman, H.E.; Friedlander, E.B.; Davies, S.W.; Castillo, K.D. Corals sustain growth but not skeletal density across the Florida Keys Reef Tract despite ongoing environmental change. Glob. Chang. Biol. 2018, 24, 5205–5217. [Google Scholar] [CrossRef] [Scilit] [PubMed]
- Weil-Accardo, J.; Feuillet, N.; Jacques, E.; Deschamps, P.; Saurel, J.M.; Thirumalai, K.; Demeza, S.; Anglade, D. Relative sea-level changes during the last century recorded by coral microatolls in Belloc, Haiti. Glob. Planet. Chang. 2016, 139, 1–14. [Google Scholar] [CrossRef] [Scilit]
- Taylor, F.W.; Frohlich, C.; Lecolle, J.; Strecker, M.R. Analysis of partially emerged corals and reef terraces in the central Vanuatu Arc: Comparison of contemporary coseismic and nonseismic with Quaternary vertical movements. J. Geophys. Res. 1987, 92, 4905–4933. [Google Scholar] [CrossRef] [Scilit]
- The Nature Conservancy. Haiti Fact Sheet: Achieving Historic Marine Conservation Goals; The Nature Conservancy: Arlington, VA, USA, 2019. [Google Scholar]
- Céliscar, L. Plan de Gestion du Parc National Naturel Lagon des Huîtres (PNN-LdH), Belle-Anse–Grand-Gosier, Haïti; ANAP/Ministère de l’Environnement: Port-au-Prince, Haiti, 2017. [Google Scholar]
- Hilaire, S. Étude de Caractérisation Écologique et de Biodiversité de la Région de Belle-Anse et du Lagon des Huîtres; ANAP/Ministère de l’Environnement: Port-au-Prince, Haiti, 2015. [Google Scholar]
- Henwood, W.D.; Aucoin, S.; Turner, M. The Protected Area of Managed Natural Resources of the Three Bays (PA3B): Management Plan 2017–2027; FoProBiM; The Nature Conservancy; ANAP: Port-au-Prince, Haiti, 2017. [Google Scholar]
- Kramer, P.; Atis, M.; Schill, S.; Williams, S.M.; Freid, E.; Moore, G.; Martinez-Sanchez, J.C.; Benjamin, F.; Cyprien, L.S.; Alexis, J.R.; et al. Baseline Ecological Inventory for Three Bays National Park, Haiti; The Nature Conservancy: Arlington, VA, USA, 2016. [Google Scholar]
- Duprey, N.; Boucher, H.; Jimenez, C. Digital correction of computed X-radiographs for coral densitometry. J. Exp. Mar. Biol. Ecol. 2012, 438, 84–92. [Google Scholar] [CrossRef] [Scilit]
- Dodge, R.E.; Vaisnys, J.R. Hermatypic coral growth banding as environmental recorder. Nature 1975, 258, 706–708. [Google Scholar] [CrossRef] [Scilit]
- Knutson, D.W.; Buddemeier, R.W.; Smith, S.V. Coral chronometers: Seasonal growth bands in reef corals. Science 1972, 177, 270–272. [Google Scholar] [CrossRef] [Scilit] [PubMed]
- Lough, J.M.; Barnes, D.J. Measurement of density in slices of coral skeleton: Effect of densitometric technique. J. Exp. Mar. Biol. Ecol. 1990, 134, 215–227. [Google Scholar] [CrossRef] [Scilit]
- Anton, H.; Rorres, C. Elementary Linear Algebra: Applications Version, 10th ed.; John Wiley & Sons: Hoboken, NJ, USA, 2010. [Google Scholar]
- Carricart-Ganivet, J.P.; Barnes, D.J. Densitometry from digitized images of X-radiographs: Methodology for measurement of coral skeletal density. J. Exp. Mar. Biol. Ecol. 2007, 344, 67–72. [Google Scholar] [CrossRef] [Scilit]
- Chalker, B.E.; Barnes, D.J.; Isdale, P.J. Calibration of X-ray densitometry for the measurement of coral skeletal density. Coral Reefs 1985, 4, 95–100. [Google Scholar] [CrossRef] [Scilit]
- McPhaden, M.J.; Zebiak, S.E.; Glantz, M.H. ENSO as an integrating concept in Earth science. Science 2006, 314, 1740–1745. [Google Scholar] [CrossRef] [Scilit] [PubMed]
- Torrence, C.; Compo, G.P. A practical guide to wavelet analysis. Bull. Am. Meteorol. Soc. 1998, 79, 61–78. [Google Scholar] [CrossRef] [Scilit]
- Grinsted, A.; Moore, J.C.; Jevrejeva, S. Application of the cross wavelet transform and wavelet coherence to geophysical time series. Nonlinear Process. Geophys. 2004, 11, 561–566. [Google Scholar] [CrossRef] [Scilit]
- Castillo, K.D.; Ries, J.B.; Weiss, J.M.; Lima, F.P. Declining coral skeletal extension for forereef colonies of Siderastrea siderea on the Mesoamerican Barrier Reef System, Southern Belize. PLoS ONE 2011, 6, e14615. [Google Scholar] [CrossRef] [Scilit] [PubMed]
- Smithers, S.G.; Woodroffe, C.D. Microatolls as sea-level indicators on a mid-ocean atoll. Mar. Geol. 2000, 168, 61–78. [Google Scholar] [CrossRef] [Scilit]
- Smithers, S.G.; Woodroffe, C.D. Coral microatolls and 20th century sea level in the eastern Indian Ocean. Earth Planet. Sci. Lett. 2001, 191, 173–184. [Google Scholar] [CrossRef] [Scilit]
- Woodroffe, C.D.; McLean, R.F. Microatolls and recent sea level change on coral atolls. Nature 1990, 344, 531–534. [Google Scholar] [CrossRef] [Scilit]
- Helmle, K.P.; Dodge, R.E.; Swart, P.K.; Gledhill, D.K.; Eakin, C.M. Growth rates of Florida corals from 1937 to 1996 and their response to climate change. Nat. Commun. 2011, 2, 215. [Google Scholar] [CrossRef] [Scilit] [PubMed]
- Lough, J.M.; Barnes, D.J. Environmental controls on growth of the massive coral Porites. J. Exp. Mar. Biol. Ecol. 2000, 245, 225–243. [Google Scholar] [CrossRef] [Scilit] [PubMed]
- Bak, R.P.M. Neoplasia, regeneration and growth in the reef-building coral Diploria labyrinthiformis. Mar. Biol. 1983, 77, 221–227. [Google Scholar] [CrossRef] [Scilit]
- Okazaki, R.R.; Towle, E.K.; van Hooidonk, R.; Mor, C.; Winter, R.N.; Piggot, A.M.; Cunning, R.; Baker, A.C.; Klaus, J.S.; Swart, P.K.; et al. Species-specific responses to climate change and community composition determine future calcification rates of Florida Keys reefs. Glob. Chang. Biol. 2017, 23, 1023–1035. [Google Scholar] [CrossRef] [Scilit] [PubMed]
- Eakin, C.M.; Morgan, J.A.; Heron, S.F.; Smith, T.B.; Liu, G.; Alvarez-Filip, L.; Baca, B.; Bartels, E.; Bastidas, C.; Bouchon, C.; et al. Caribbean corals in crisis: Record thermal stress, bleaching, and mortality in 2005. PLoS ONE 2010, 5, e13969. [Google Scholar] [CrossRef] [Scilit] [PubMed]
- Castillo, K.D.; Ries, J.B.; Bruno, J.F.; Westfield, I.T. The reef-building coral Siderastrea siderea exhibits parabolic responses to ocean acidification and warming. Proc. R. Soc. B Biol. Sci. 2014, 281, 20141856. [Google Scholar] [CrossRef] [Scilit] [PubMed]
- McClanahan, T.R.; Maina, J.; Ateweberhan, M. Relationships between bleaching severity and coral mortality: A meta-analysis. Glob. Chang. Biol. 2015, 21, 286–304. [Google Scholar]
- Camp, E.F.; Schoepf, V.; Mumby, P.J.; Hardtke, L.A.; Rodolfo-Metalpa, R.; Smith, D.J.; Suggett, D.J. Contingency planning for coral reefs in the Anthropocene: The potential of reef safe havens. Emerg. Top. Life Sci. 2022, 6, 107–118. [Google Scholar] [CrossRef] [Scilit] [PubMed]
- Palumbi, S.R.; Barshis, D.J.; Traylor-Knowles, N.; Bay, R.A. Mechanisms of reef coral resistance to future climate change. Science 2014, 344, 895–898. [Google Scholar] [CrossRef] [Scilit] [PubMed]
- Elmqvist, T.; Folke, C.; Nyström, M.; Peterson, G.; Bengtsson, J.; Walker, B.; Norberg, J. Response diversity, ecosystem change, and resilience. Front. Ecol. Environ. 2003, 1, 488–494. [Google Scholar] [CrossRef]
- NOAA Coral Reef Information System (CoRIS). Coral Reef Environmental Data and Monitoring Products; National Oceanic and Atmospheric Administration: Silver Spring, MD, USA, 2025. [Google Scholar]
- Carricart-Ganivet, J.P.; Beltrán-Torres, A.U.; Merino, M.; Ruiz-Zárate, M.A. Skeletal extension, density and calcification rate of the reef-building coral Montastraea annularis in the Mexican Caribbean. Bull. Mar. Sci. 2000, 66, 215–224. [Google Scholar]
- Pisapia, C.; Pratchett, M.S.; Anderson, K.D. Intraspecific variation in physiological and reproductive resilience to bleaching in corals. Coral Reefs 2019, 38, 1085–1097. [Google Scholar]
- Jackson, J.B.C.; Donovan, M.K.; Cramer, K.L.; Lam, V.V. Status and Trends of Caribbean Coral Reefs: 1970–2012; Global Coral Reef Monitoring Network; IUCN: Gland, Switzerland, 2014. [Google Scholar]
- Cai, W.; McPhaden, M.J.; Grimm, A.M.; Rodrigues, R.R.; Taschetto, A.S.; Garreaud, R.D.; Dewitte, B.; Poveda, G.; Ham, Y.-G.; Santoso, A.; et al. Climate impacts of the El Niño–Southern Oscillation on South America. Nat. Rev. Earth Environ. 2020, 1, 215–231. [Google Scholar] [CrossRef] [Scilit]
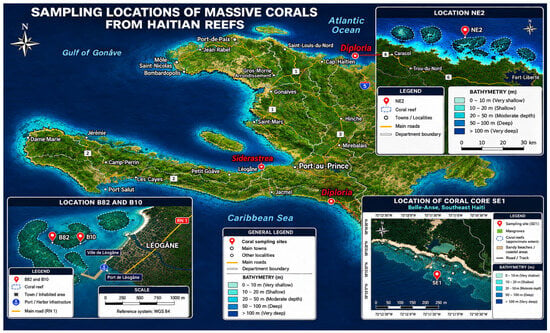
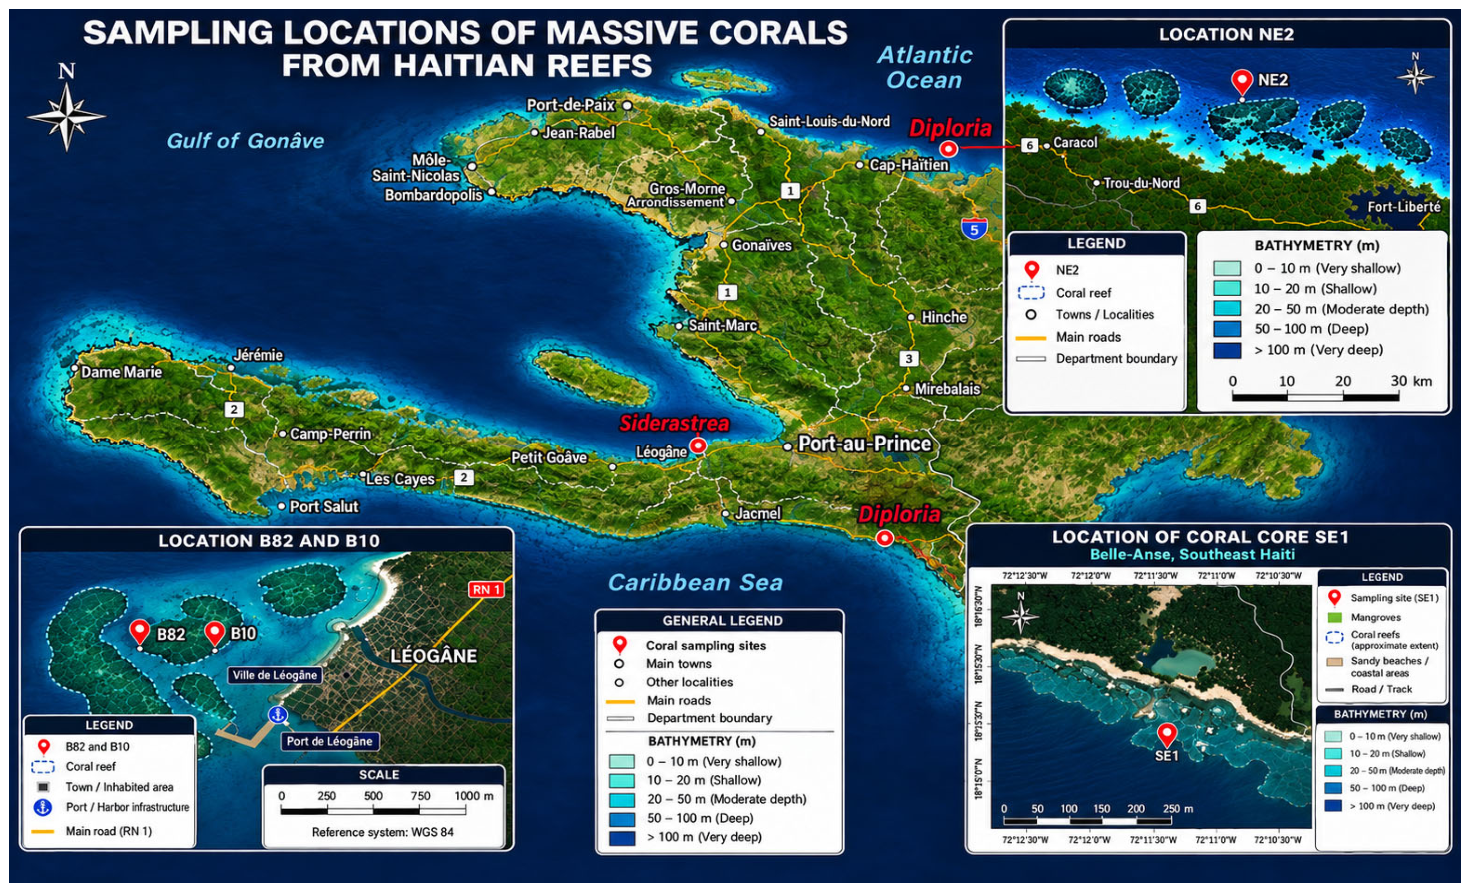
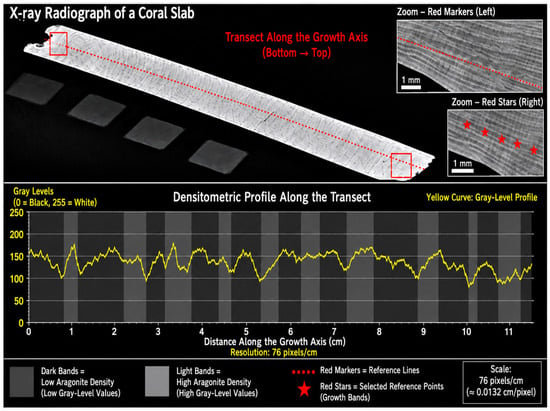
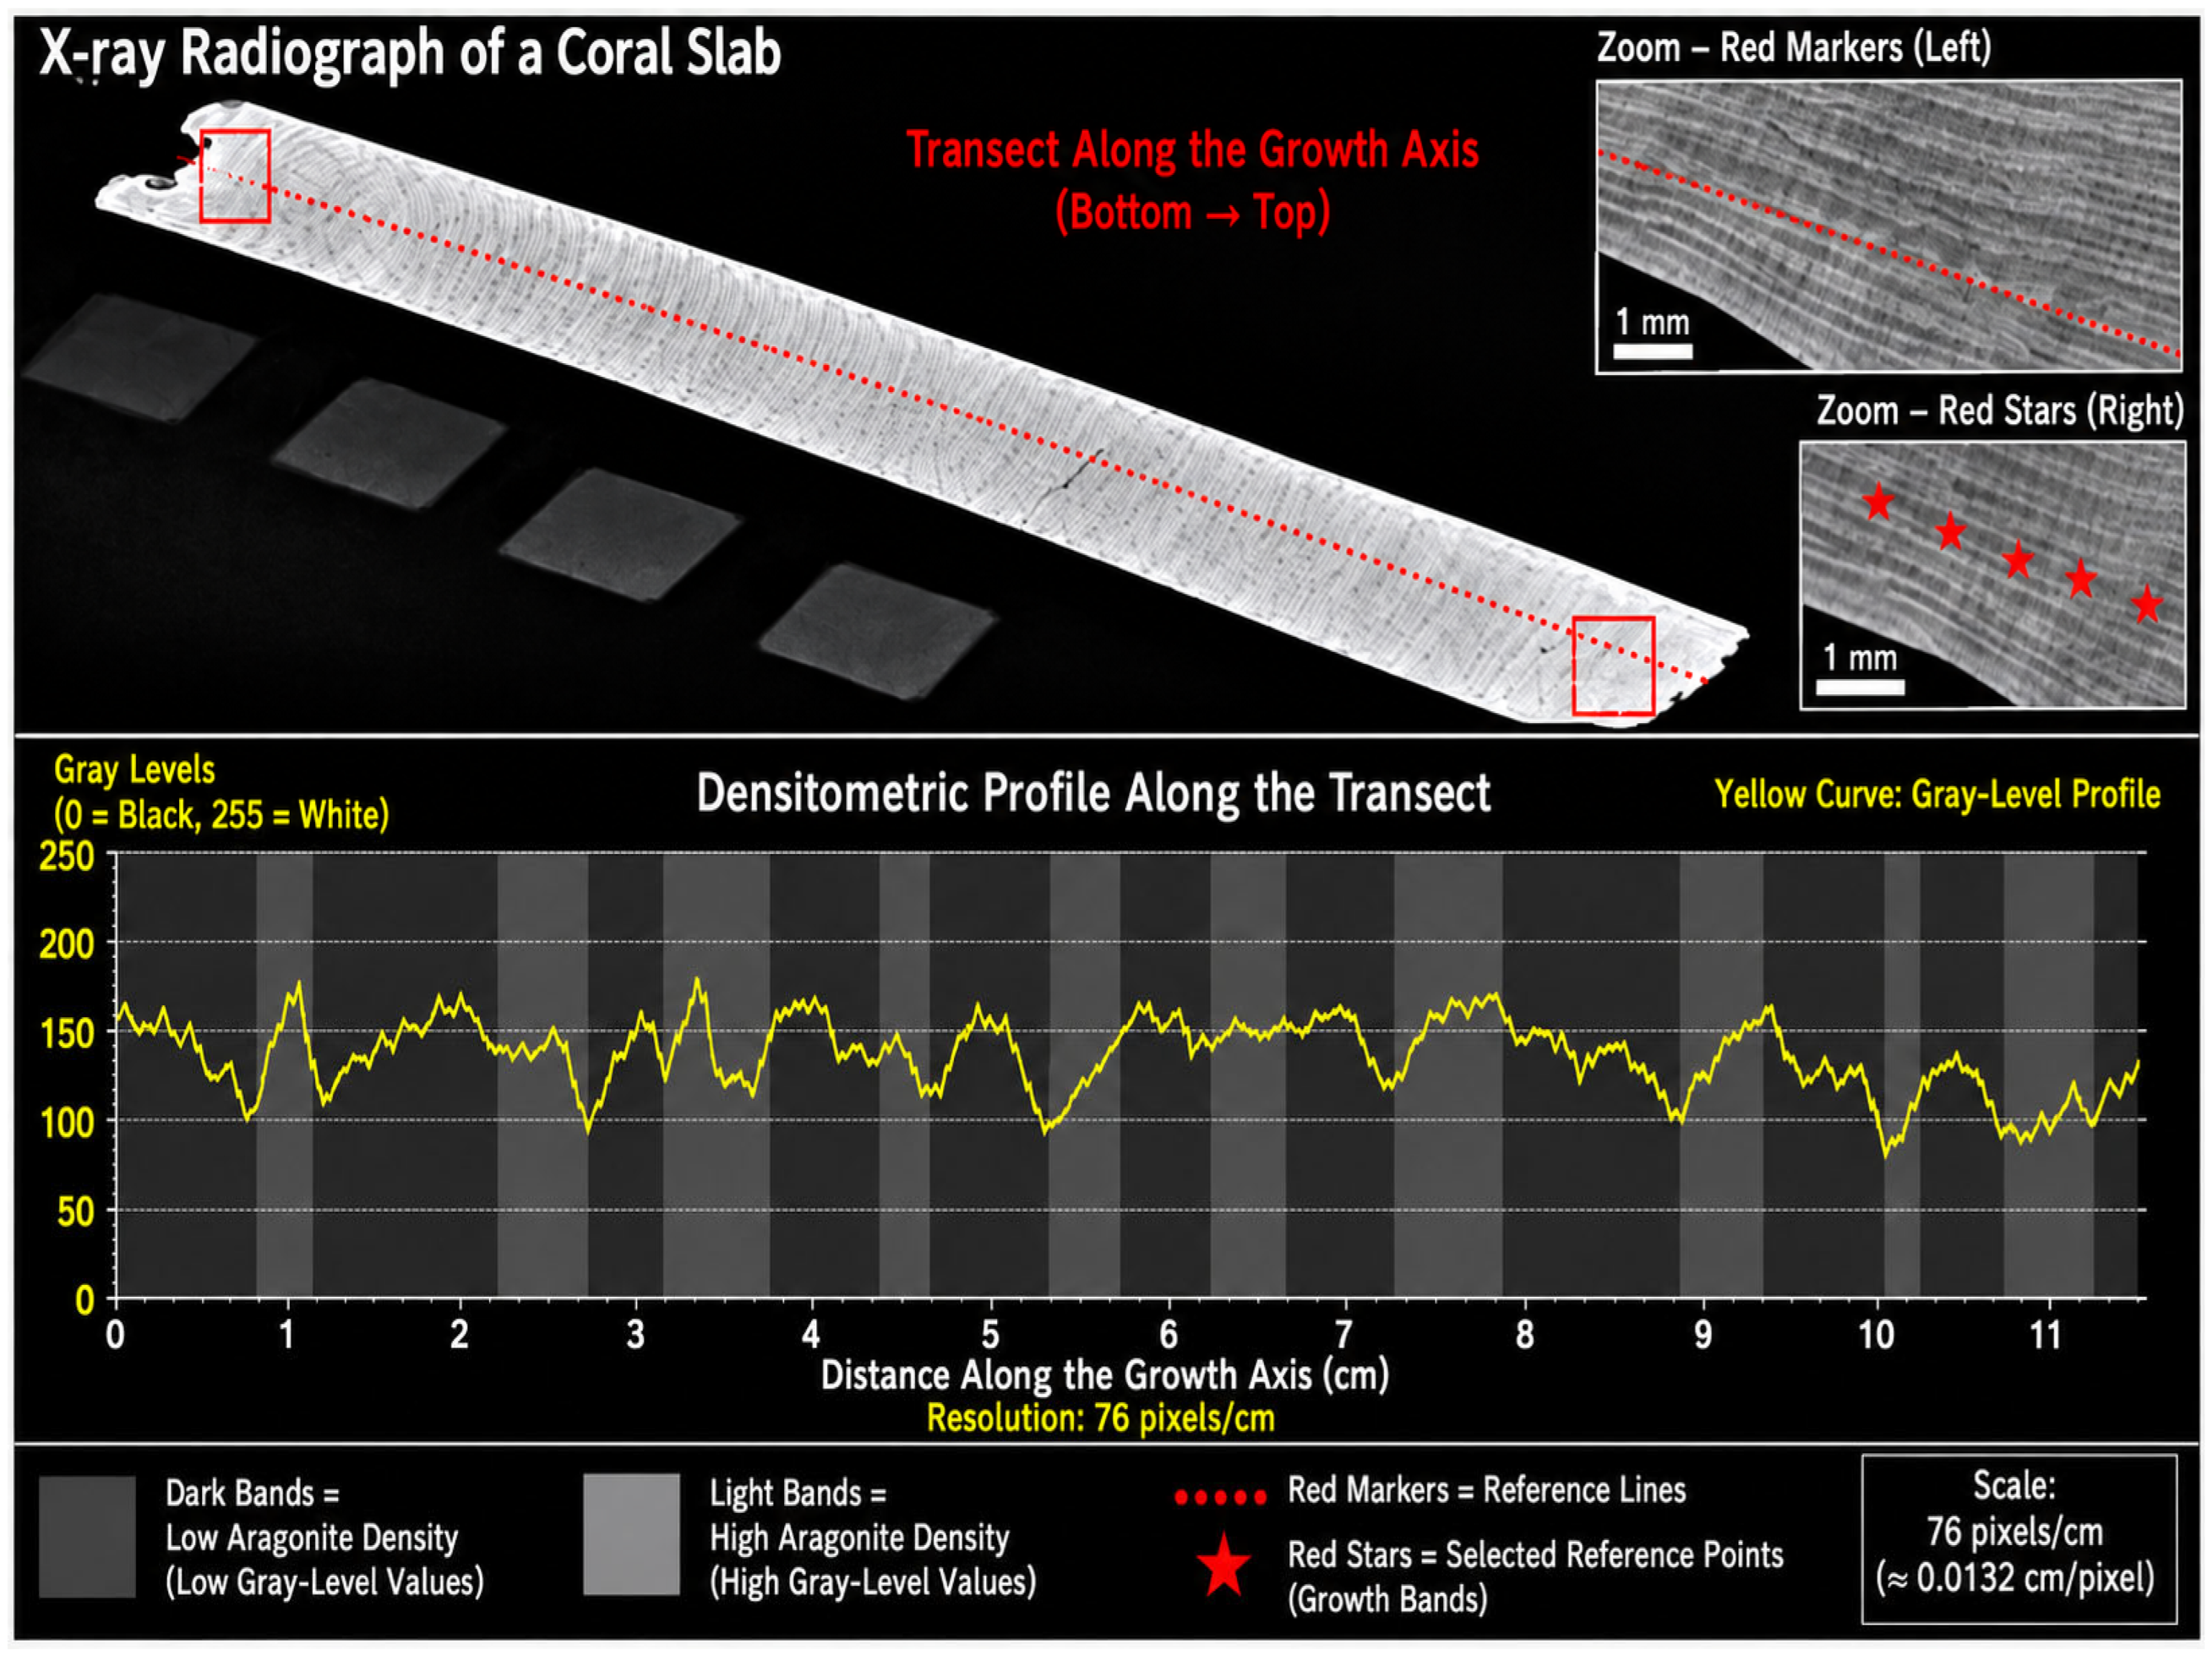
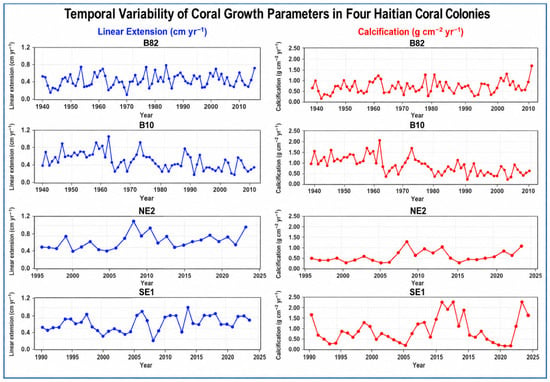
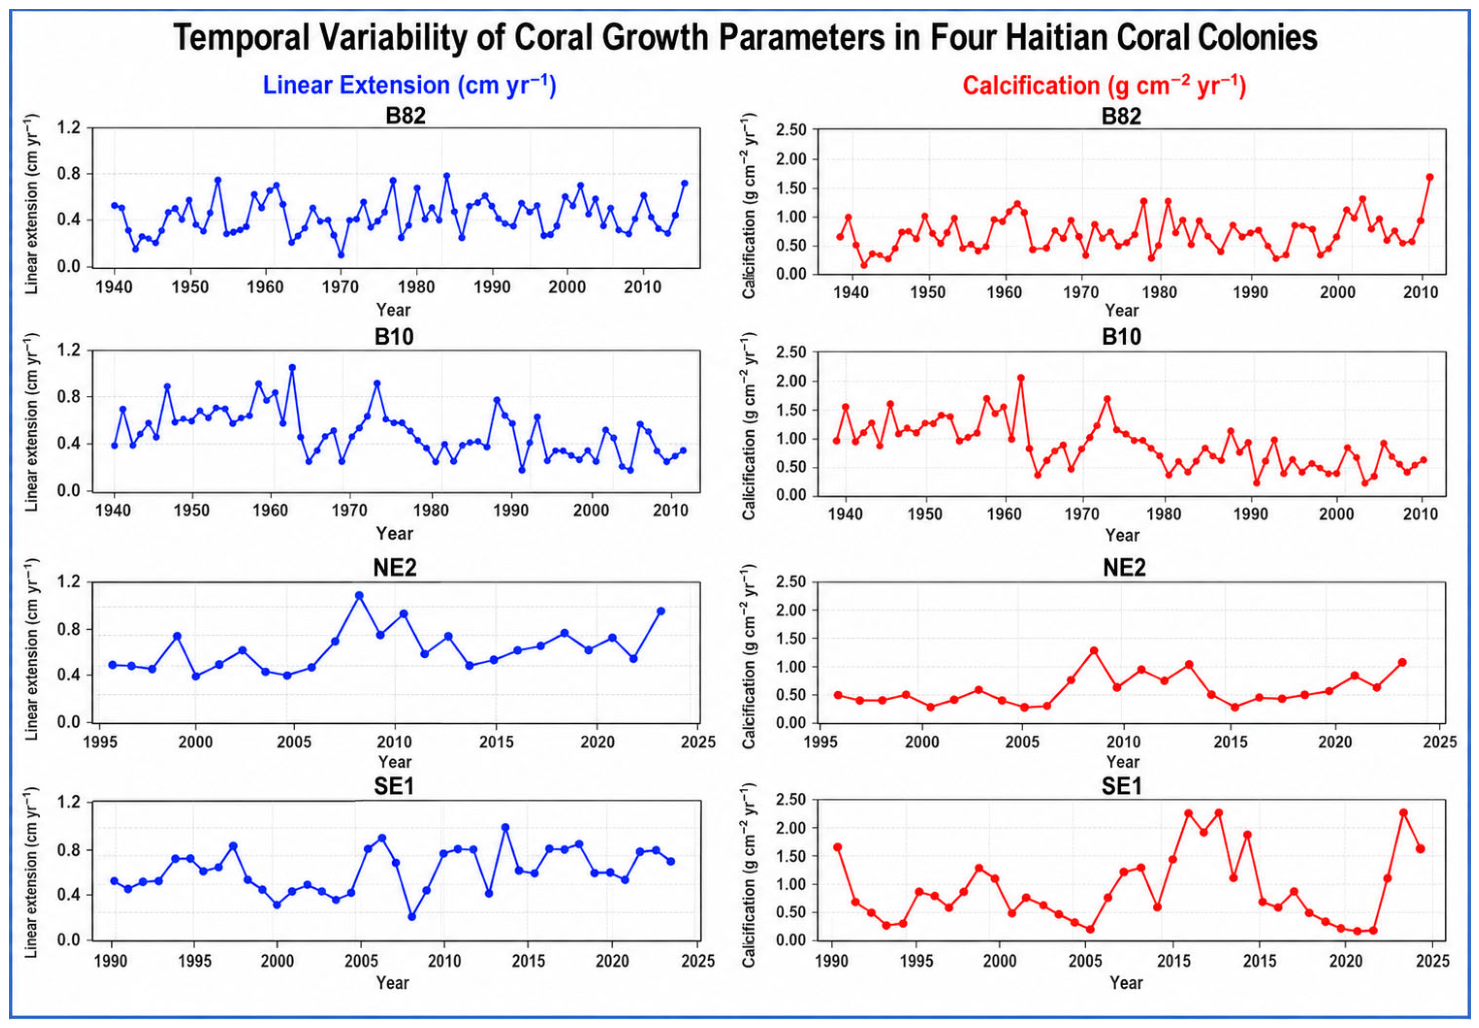
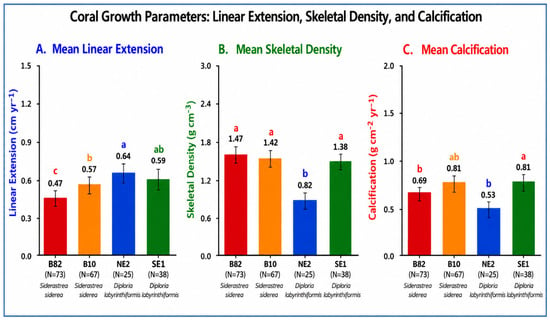
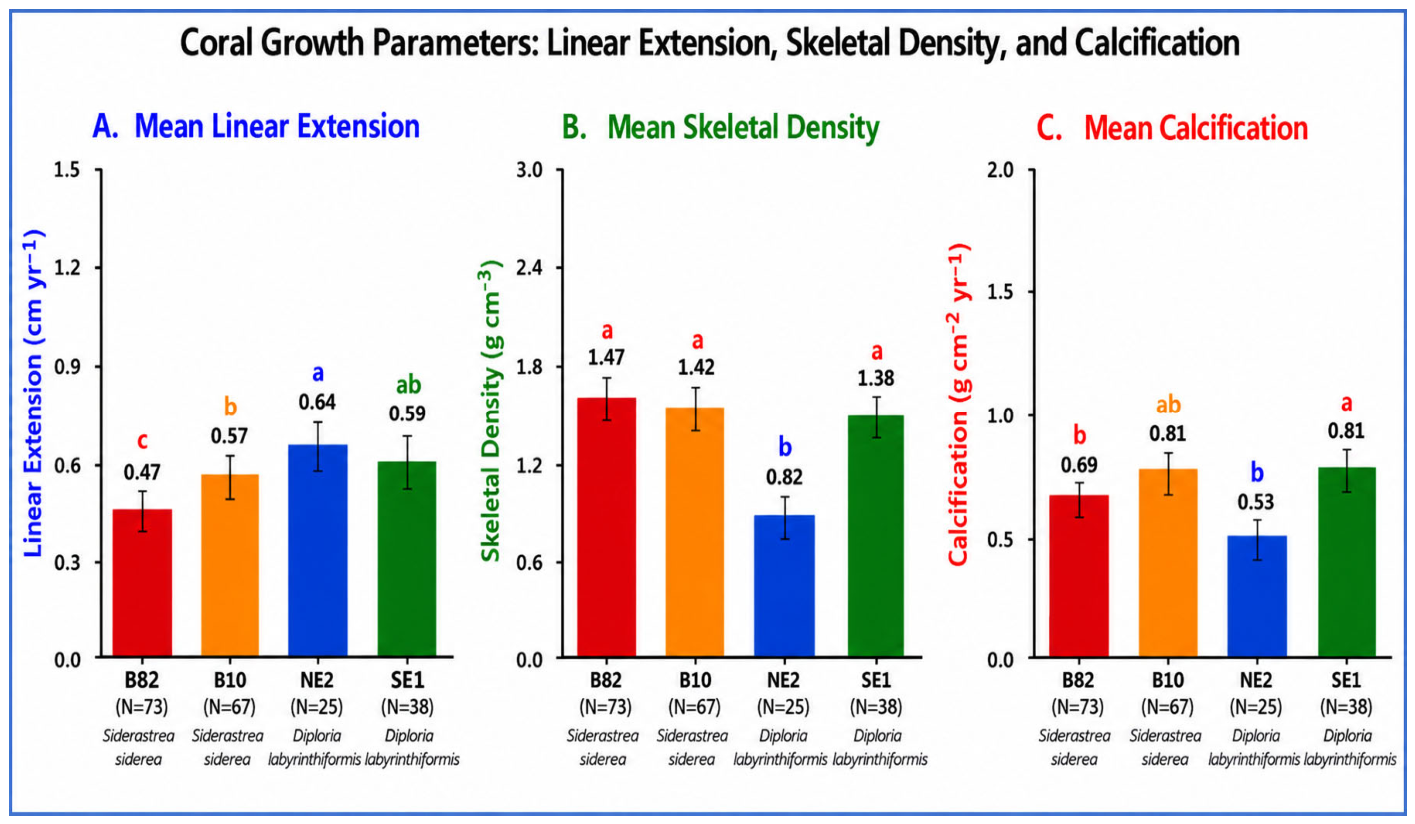
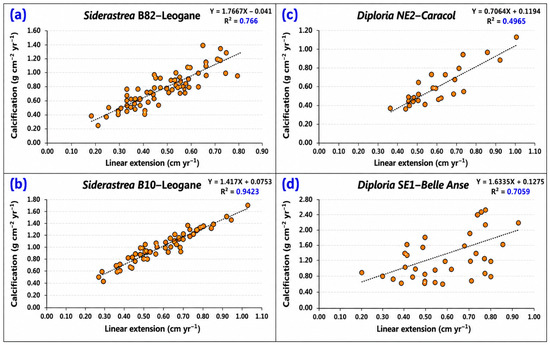
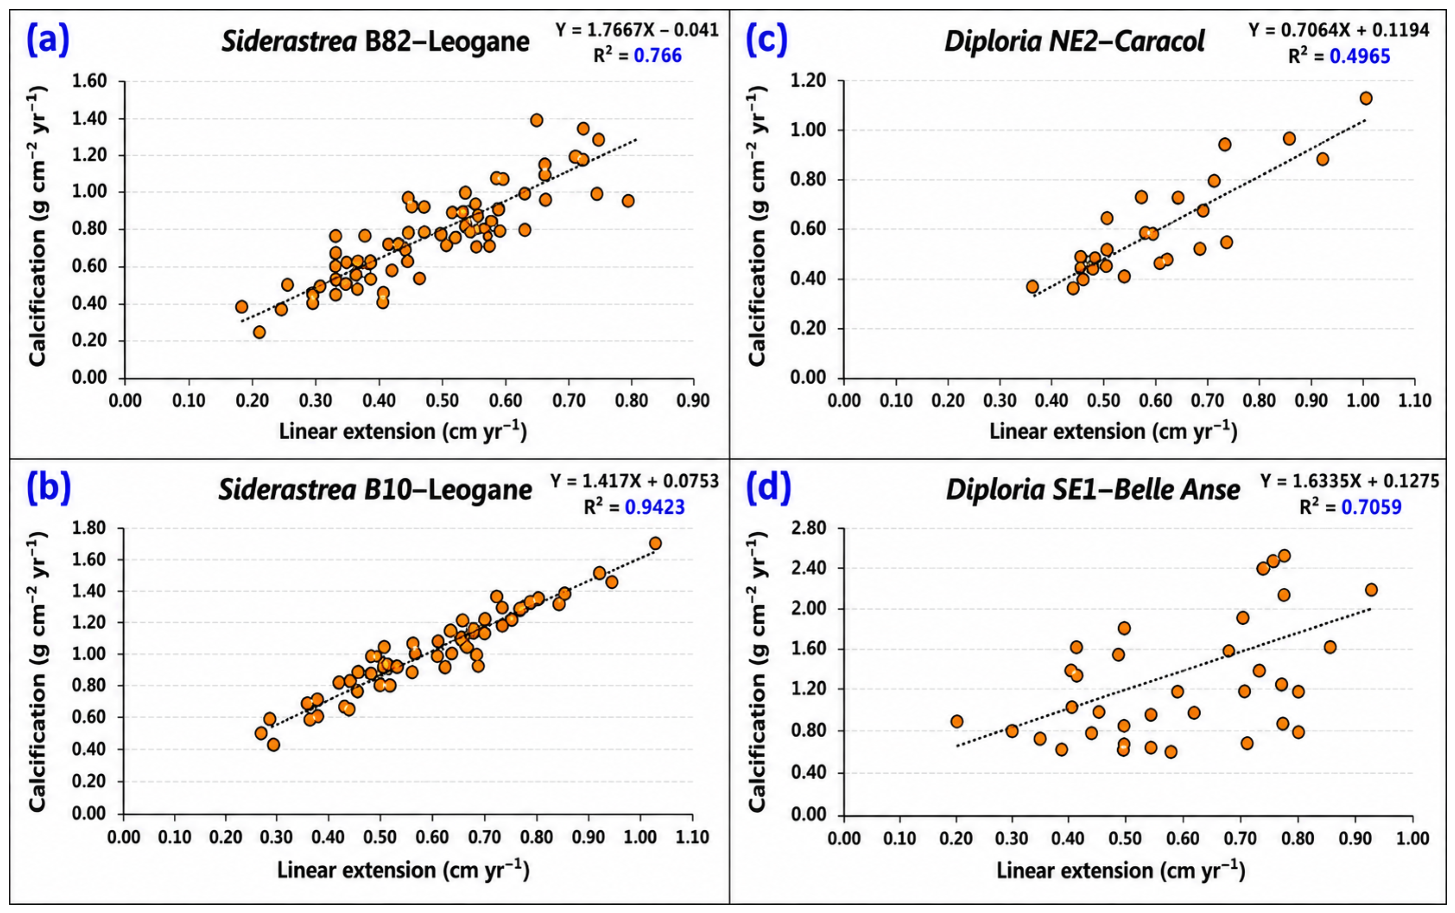
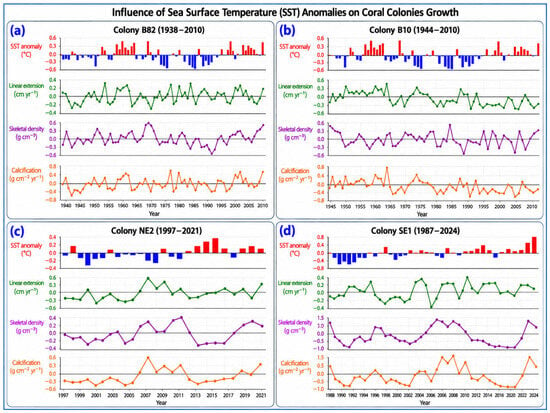
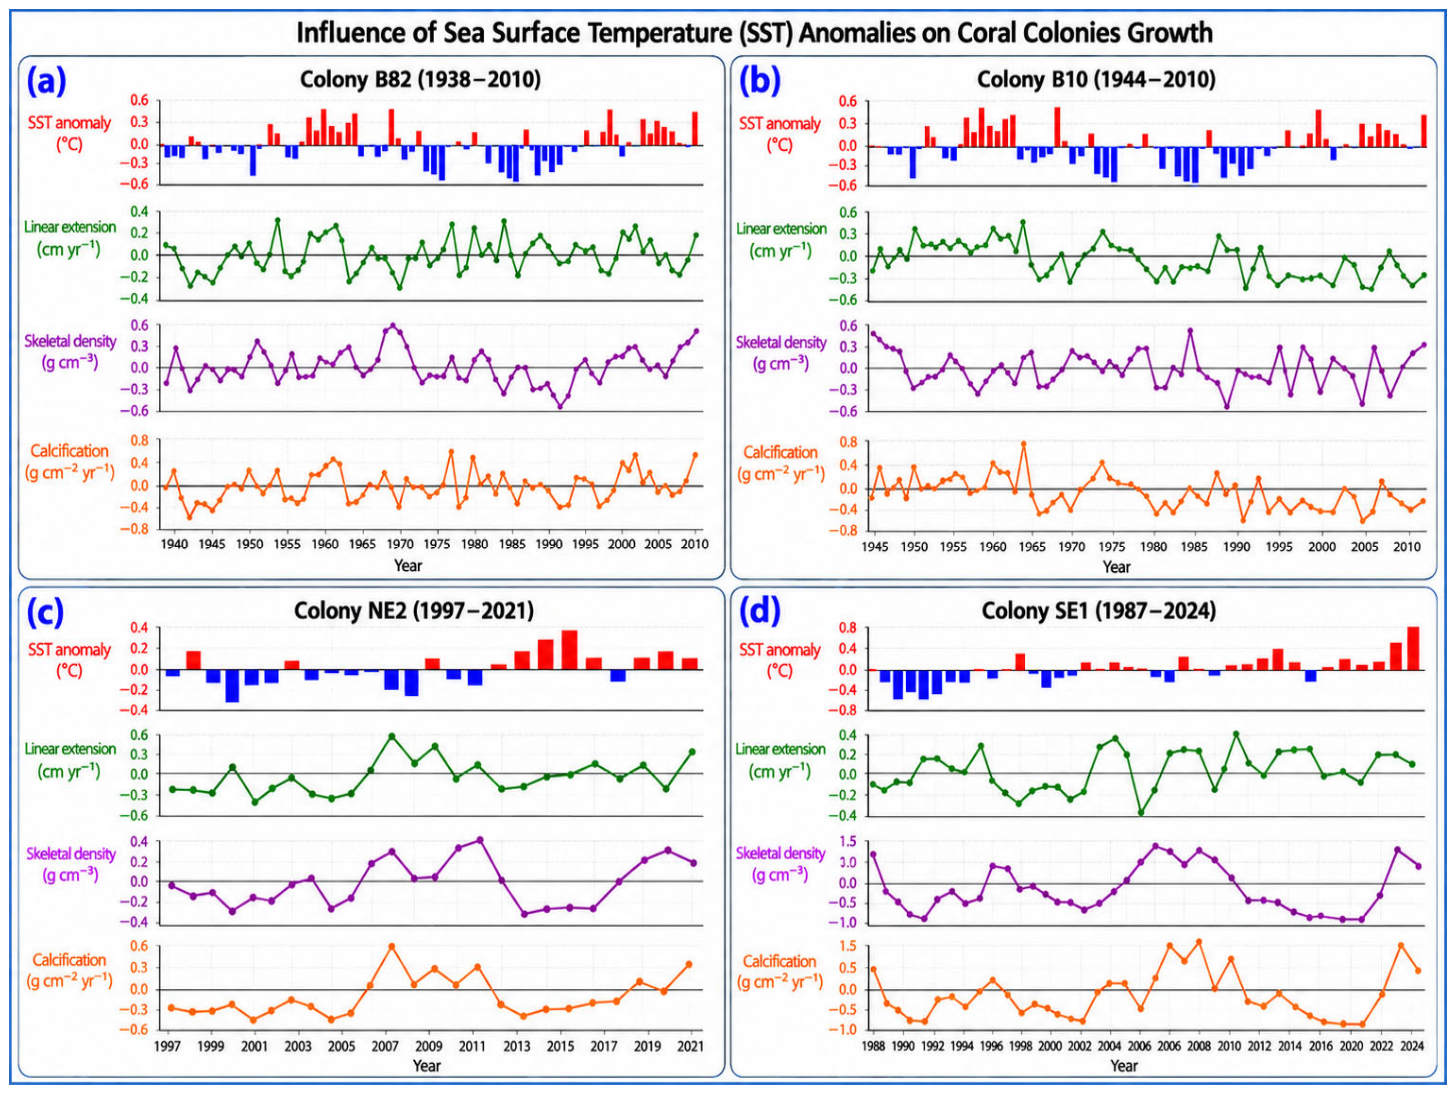
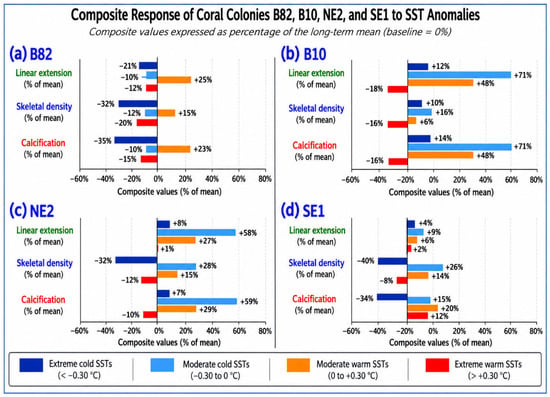
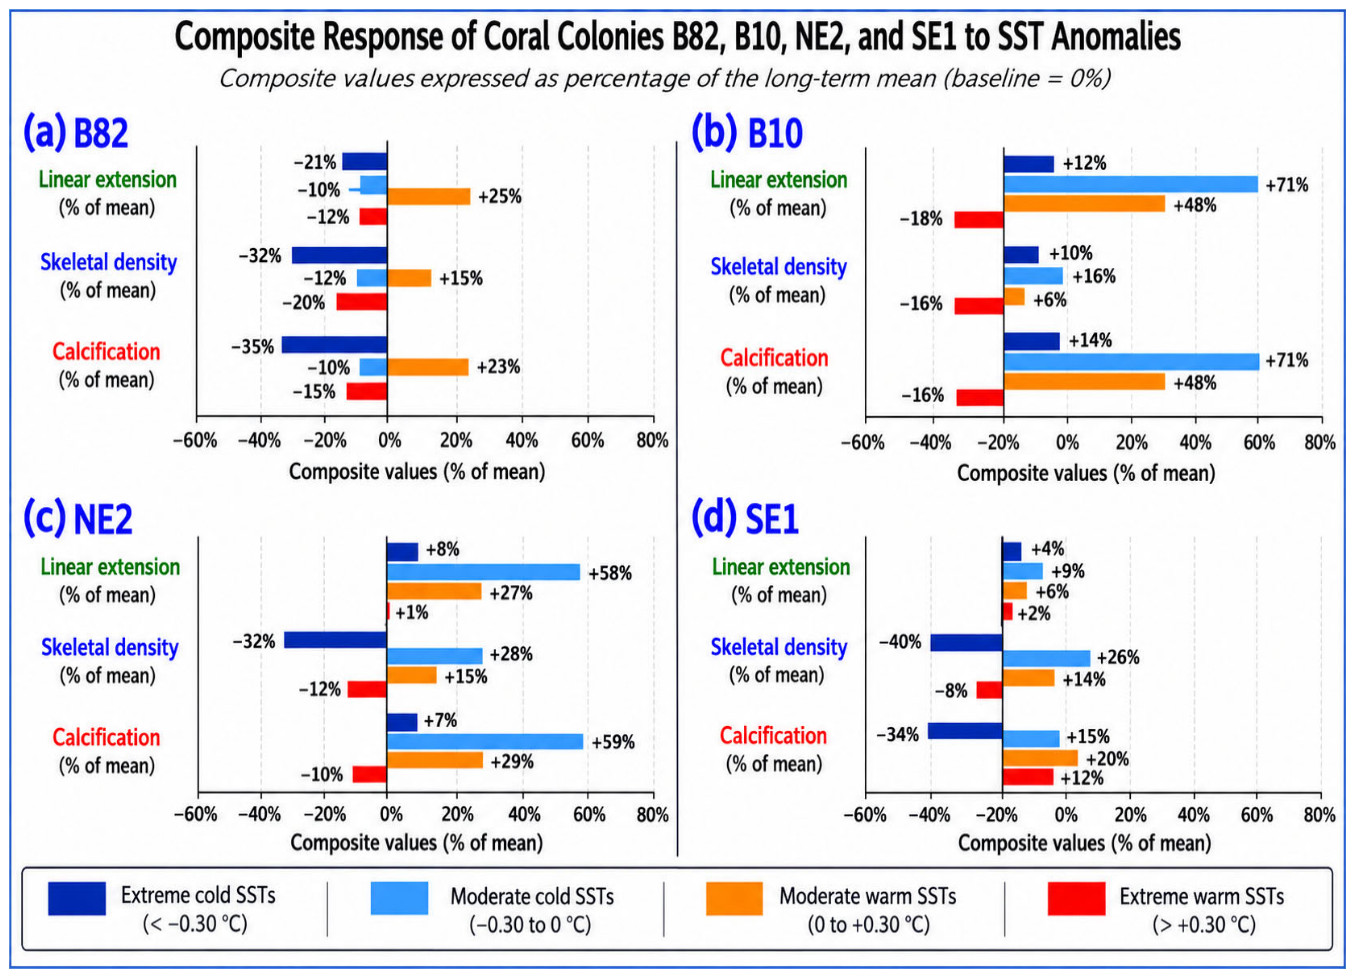
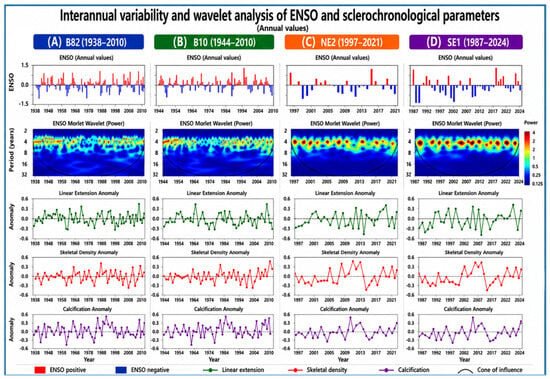
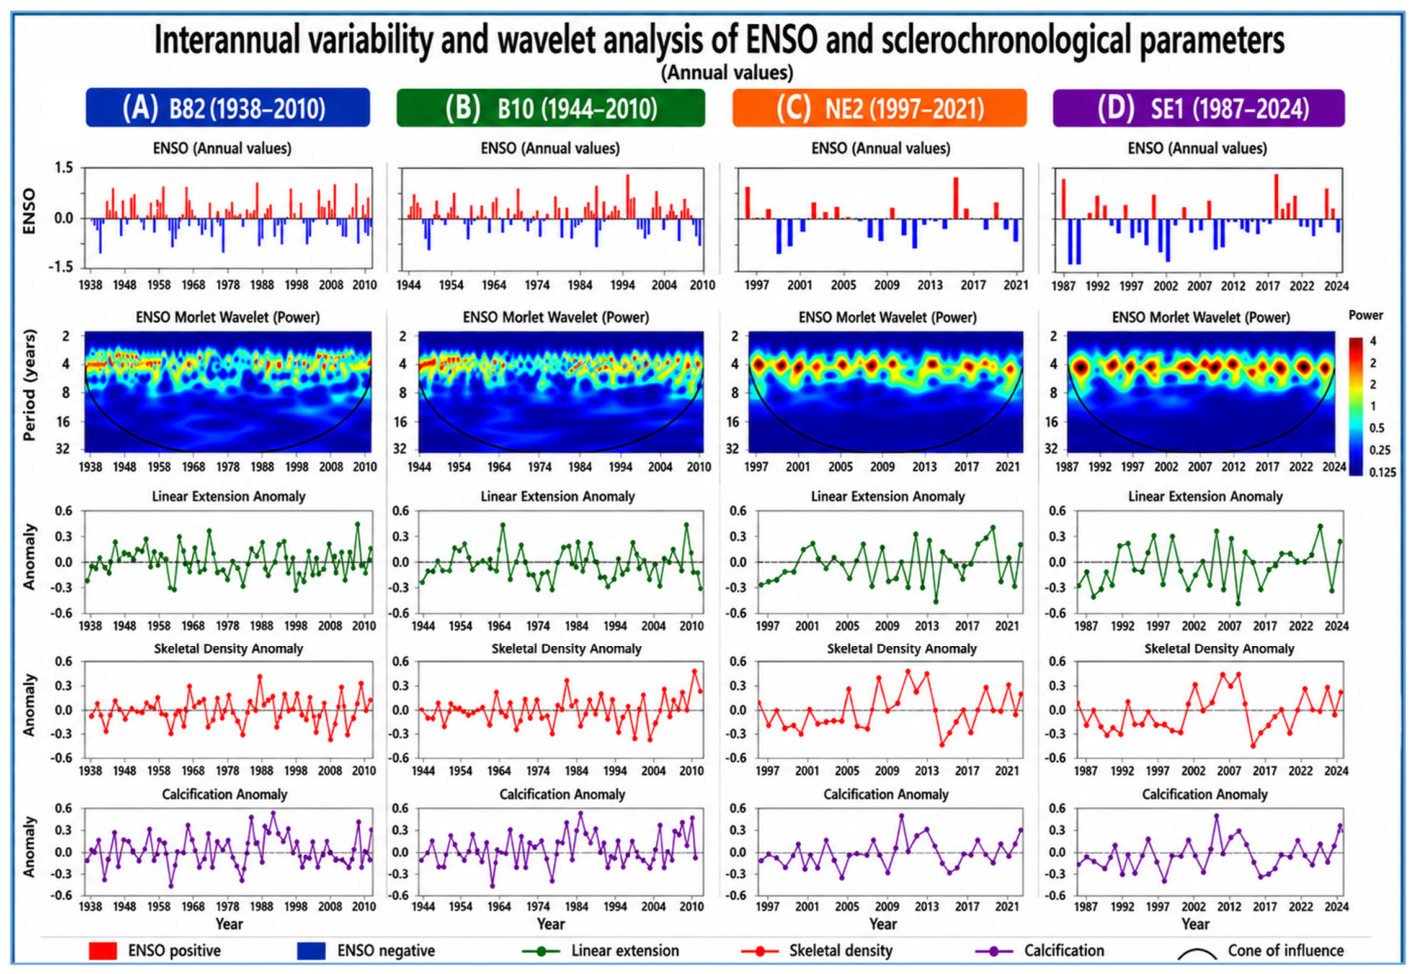
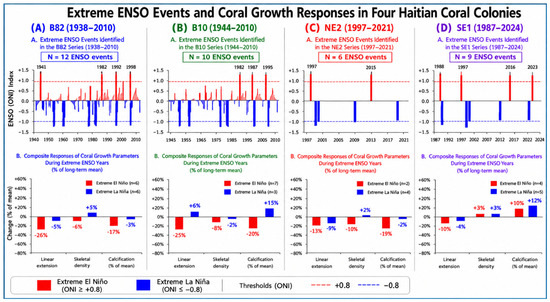
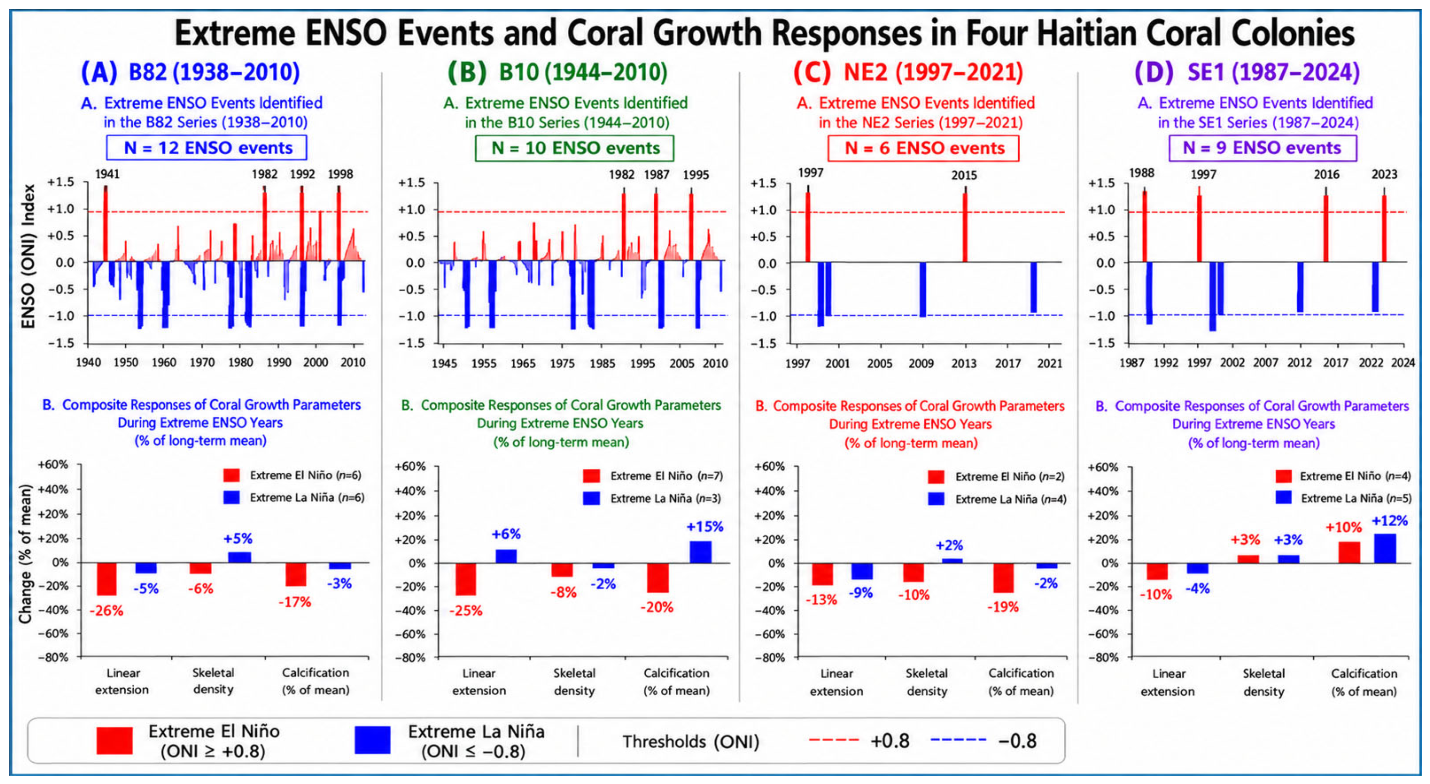

Disclaimer/Publisher’s Note: The statements, opinions and data contained in all publications are solely those of the individual author(s) and contributor(s) and not of MDPI and/or the editor(s). MDPI and/or the editor(s) disclaim responsibility for any injury to people or property resulting from any ideas, methods, instructions or products referred to in the content. |
© 2026 by the authors. Licensee MDPI, Basel, Switzerland. This article is an open access article distributed under the terms and conditions of the Creative Commons Attribution (CC BY) license.