


Abstract
Background: Suicidal behavior is common among adolescents, yet most affected individuals do not receive medical care. Predicting suicidal behavior in school settings may support early prevention. Methods: We systematically reviewed longitudinal studies of machine-learning models predicting future suicidal behavior in adolescent students. Eight databases were searched through September 2026; risk of bias and applicability were assessed using PROBAST + AI. A bivariate random-effects model jointly pooled sensitivity and specificity and generated a summary receiver operating characteristic curve; study-reported AUCs were pooled separately as a supplementary analysis. Results: Seven models were included. Under the bivariate random-effects model, pooled sensitivity was 0.70 (95% CI: 0.52–0.83) and pooled specificity was 0.80 (95% CI: 0.71–0.87); the summary AUC was 0.83. The supplementary univariate analysis yielded a pooled AUC of 0.79 (95% CI: 0.75–0.83; 95% prediction interval: 0.63–0.89). Heterogeneity was substantial (I2 = 95.5% for sensitivity and 99.1% for specificity). Exploratory subgroup and meta-regression analyses identified no statistically significant moderators, but the small number of models limited statistical power. All models were evaluated using internal validation and were judged to be at high overall risk of bias. Conclusions: Current models show moderate discrimination, but their sensitivity remains insufficient for use as standalone early-warning tools. Because the synthesis was based on the final models selected by the original study authors, the pooled performance estimates may be optimistic.
1. Introduction
Suicide is a major public health issue affecting adolescents worldwide. Between 1990 and 2020, adolescent suicide mortality increased in several regions, particularly the United States, Central and Latin America, Australia, and New Zealand (Bertuccio et al., 2024). Suicidal ideation and suicide attempts are key risk factors for adolescent suicide deaths (Morneau-Vaillancourt et al., 2025). Globally, the 12-month prevalence of suicidal ideation and suicide attempts among adolescents is 14.2% and 4.5%, respectively (Lim et al., 2019). Identifying adolescents at risk of suicidal ideation or suicide attempts and providing timely, targeted interventions are therefore essential to suicide prevention.
Suicidal behavior reflects interacting psychological, biological, and environmental factors (Hu et al., 2023; Yang et al., 2013; Yu et al., 2025), making suicide risk difficult to predict. Previous studies have shown that suicide risk prediction models developed using traditional statistical methods have limited predictive performance, with discriminatory power only slightly above chance (Franklin et al., 2017). Compared with classical regression, machine learning (ML) algorithms do not require linearity assumptions, can accommodate large numbers of predictors and their interactions, and are relatively robust to multicollinearity, offering the potential for improved classification (Linthicum et al., 2019).
Although several systematic reviews have examined ML applications in suicide-risk prediction (Corke et al., 2021; Franklin et al., 2017; Large et al., 2016; Schafer et al., 2021), most either pooled mixed-age populations or included cross-sectional designs, so the extent to which their conclusions generalize to prospective prediction in adolescents remains uncertain. Models developed exclusively from clinical or electronic health record data also depend on information that is generally unavailable in schools and include only adolescents who come into contact with healthcare services. Registry data from Denmark indicate that, for every girl with a recorded suicide attempt, approximately two additional girls who attempted suicide have no such record; among boys, the corresponding ratio is approximately 1:6 (Danielsen et al., 2025). School-based research may therefore reach adolescents who would otherwise remain outside clinical services.
To our knowledge, no systematic review has specifically synthesized the performance of ML models for predicting future suicidal behavior among adolescent students. To address this gap, the present study reviewed longitudinal prediction studies in this population and summarized model discrimination, sensitivity, and specificity. Because outcome definitions, modeling approaches, and the interval between prediction and outcome ascertainment varied across studies, we also conducted exploratory analyses of these potential sources of heterogeneity.
2. Materials and Methods
This systematic review and meta-analysis evaluated published models that used longitudinal data to predict future suicidal behavior among adolescent students. We pooled model performance, explored sources of heterogeneity, and assessed the methodological quality of included studies. Performance was summarized with area under the curve (AUC), sensitivity, and specificity. AUC represents the probability that a model ranks a randomly selected positive case above a randomly selected negative case and is therefore unaffected by any single classification threshold. Sensitivity is the proportion of adolescents with subsequent suicidal outcomes who are classified as positive, and specificity is the proportion of those without such outcomes who are classified as negative at the threshold used in each primary study. Positive predictive value (PPV) was also extracted because it is especially informative when outcome classes are imbalanced, but it could not be pooled quantitatively because only a few studies reported it. The DOR was computed as a supplementary measure combining sensitivity and specificity. Accuracy was not adopted as a primary metric because it can mislead at low outcome prevalence: a model may appear accurate by correctly classifying many unaffected adolescents while failing to identify those at risk. This systematic review and meta-analysis was conducted and reported in accordance with the Preferred Reporting Items for Systematic Reviews and Meta-Analysis (PRISMA) 2020 statement (Page et al., 2021). The study protocol was registered with the International Prospective Register of Systematic Reviews (PROSPERO; registration number: CRD420261455249).
2.1. Search Strategy
CNKI, Wanfang, VIP, PubMed, Embase, the Cochrane Library, PsycINFO, and Web of Science were searched from database inception to September 2026. Search strategies combined controlled vocabulary (MeSH, Emtree, and APA Thesaurus where available) with free-text terms, adapted to the syntax of each platform, and were restricted to Chinese- and English-language publications. The search strategy included three key concepts: (1) adolescents and related terms; (2) suicidal behavior and related terms; and (3) prediction modeling and machine learning and related terms. The complete search strings for all databases are provided in the Supplementary Materials.
No study-design filter (e.g., cohort, longitudinal, or prospective terms) was applied at the search stage. Design terms are poorly indexed in the databases, where information on study design is rarely reported in titles, abstracts, or keywords. Eligibility with respect to study design was therefore assessed at the screening stage against the criteria described in Section 2.2.
All records were imported into EndNote, and duplicates were removed. Title/abstract and full-text screening were performed manually by two independent reviewers; no automated or machine-learning-assisted screening tools were used at any stage of study selection, and disagreements were resolved through discussion with a third reviewer. This deviates from the registered protocol (PROSPERO: CRD420261455249), in which a study-design search filter was specified.
2.2. Eligibility Criteria
Studies were eligible if they: (1) included school-attending adolescents aged 10–19 years, consistent with the World Health Organization definition of adolescence (World Health Organization, 2019); studies whose samples extended beyond this age range were excluded unless results for the eligible subgroup could be extracted separately; (2) used a longitudinal design in which predictor measurement preceded outcome event; (3) developed a prediction model using at least one machine-learning algorithm, with the outcome being suicidal ideation, suicide attempt, or suicidal behavior; and (4) reported at least one quantitative performance estimate (such as AUC, sensitivity, or specificity) or provided confusion matrix data from which sensitivity and specificity could be calculated. Studies that developed models exclusively from clinical or electronic health record data were excluded because the required clinical information is generally unavailable in schools, limiting their applicability to school-based risk assessment.
Because no study-design filter was applied during the search, the longitudinal or prospective requirement was operationalized during screening. Records were retained for full-text assessment when the abstract indicated follow-up data, a prospective cohort, or a clear temporal separation between predictor assessment and outcome ascertainment; where this could not be determined from the abstract, the full text was retrieved and assessed.
2.3. Data Extraction and Analysis
Two researchers independently extracted the following information from each included study: first author and year of publication; country or region; study population; sample size; number of outcome events and the incidence rate; prediction time window; machine learning algorithms; model performance metrics reported for the test set or in cross-validation (AUC, PPV, sensitivity, and specificity); and model validation methods.
Where a study reported more than one eligible model, the model identified by the original authors as their final or primary model was selected. This rule avoided selecting a model solely because it had the highest observed performance, but it could not eliminate optimism introduced by model selection within the primary study.
For each model without a published confusion matrix but with the required data, we reconstructed the classification table from the reported sensitivity, specificity, and numbers of cases and non-cases in the evaluation sample: true positive (TP) = sensitivity × cases; true negative (TN) = specificity × non-cases; false negative = cases − TP; and false positive = non-cases − TN. The reconstructed counts for each model are reported in Table S1, and all pooled analyses used these counts.
Sensitivity and specificity were pooled jointly with a bivariate random-effects model on the logit scale, which accounts for their correlation across studies, including that arising from differences in classification thresholds, and yields the summary receiver operating characteristic (SROC) curve and its summary AUC directly. The summary AUC of the bivariate SROC curve is taken as the primary pooled AUC, because it derives from the same parameter estimates as sensitivity and specificity (Reitsma et al., 2005). As a supplementary analysis, study-level AUCs were pooled using a univariate random-effects model on the logit scale, with the DerSimonian–Laird estimator for between-study variance. Because none of the included studies reported a standard error for the AUC, the variance of each logit-transformed AUC was derived from its reported 95% confidence interval as [(logit upper − logit lower)/(2 × 1.96)]2. Models without a reported confidence interval were included only in the descriptive synthesis. Given the small number of models, 95% confidence intervals were calculated on the logit scale and back-transformed to the proportion scale, and 95% prediction intervals were derived using the t distribution with k − 2 degrees of freedom. Heterogeneity was assessed using the Q-test and I2 with I2 > 50% or a Q-test p < 0.10 indicating significant heterogeneity.
Because the included models differ in cohort, outcome, algorithm, and threshold, the pooled bivariate estimates provide a descriptive and potentially optimistic summary of the central tendency of reported performance, not the expected accuracy of any single deployable screening tool in a new school setting. A bivariate meta-regression examined outcome category as a moderator of the joint logit sensitivity–specificity random-effects distribution, with two-sided p < 0.05 indicating moderation; all subgroup and meta-regression findings were treated as hypothesis-generating rather than confirmatory.
We assessed the methodological quality, risk of bias, and applicability of each included prediction model at the level of the individual model using PROBAST + AI (Moons et al., 2025), the updated version of PROBAST that was developed specifically for prediction models based on regression or on artificial intelligence and machine learning methods. Data extraction was guided by the CHARMS checklist (Moons et al., 2014), and the reporting of this review follows PRISMA 2020 in combination with TRIPOD-SRMA (Snell et al., 2023). Two reviewers independently rated all models, and disagreements were resolved by discussion; a third reviewer arbitrated when consensus could not be reached.
Publication bias and small-study effects were assessed using Deeks’ funnel plot, with asymmetry tested by regression at p < 0.05. All analyses were performed using Stata 18.0.
3. Results
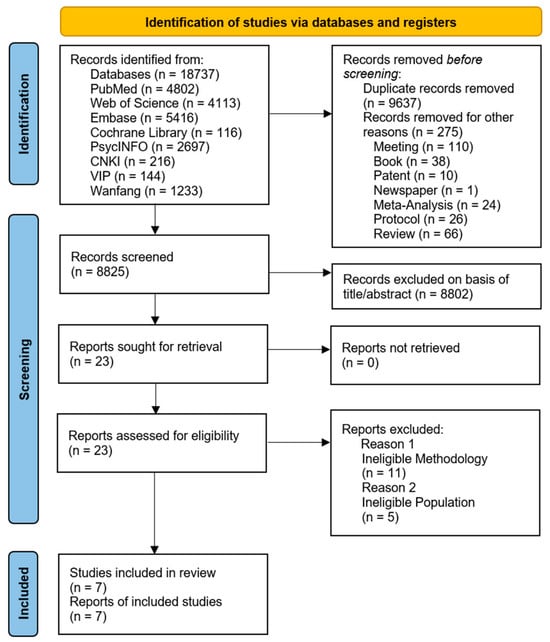
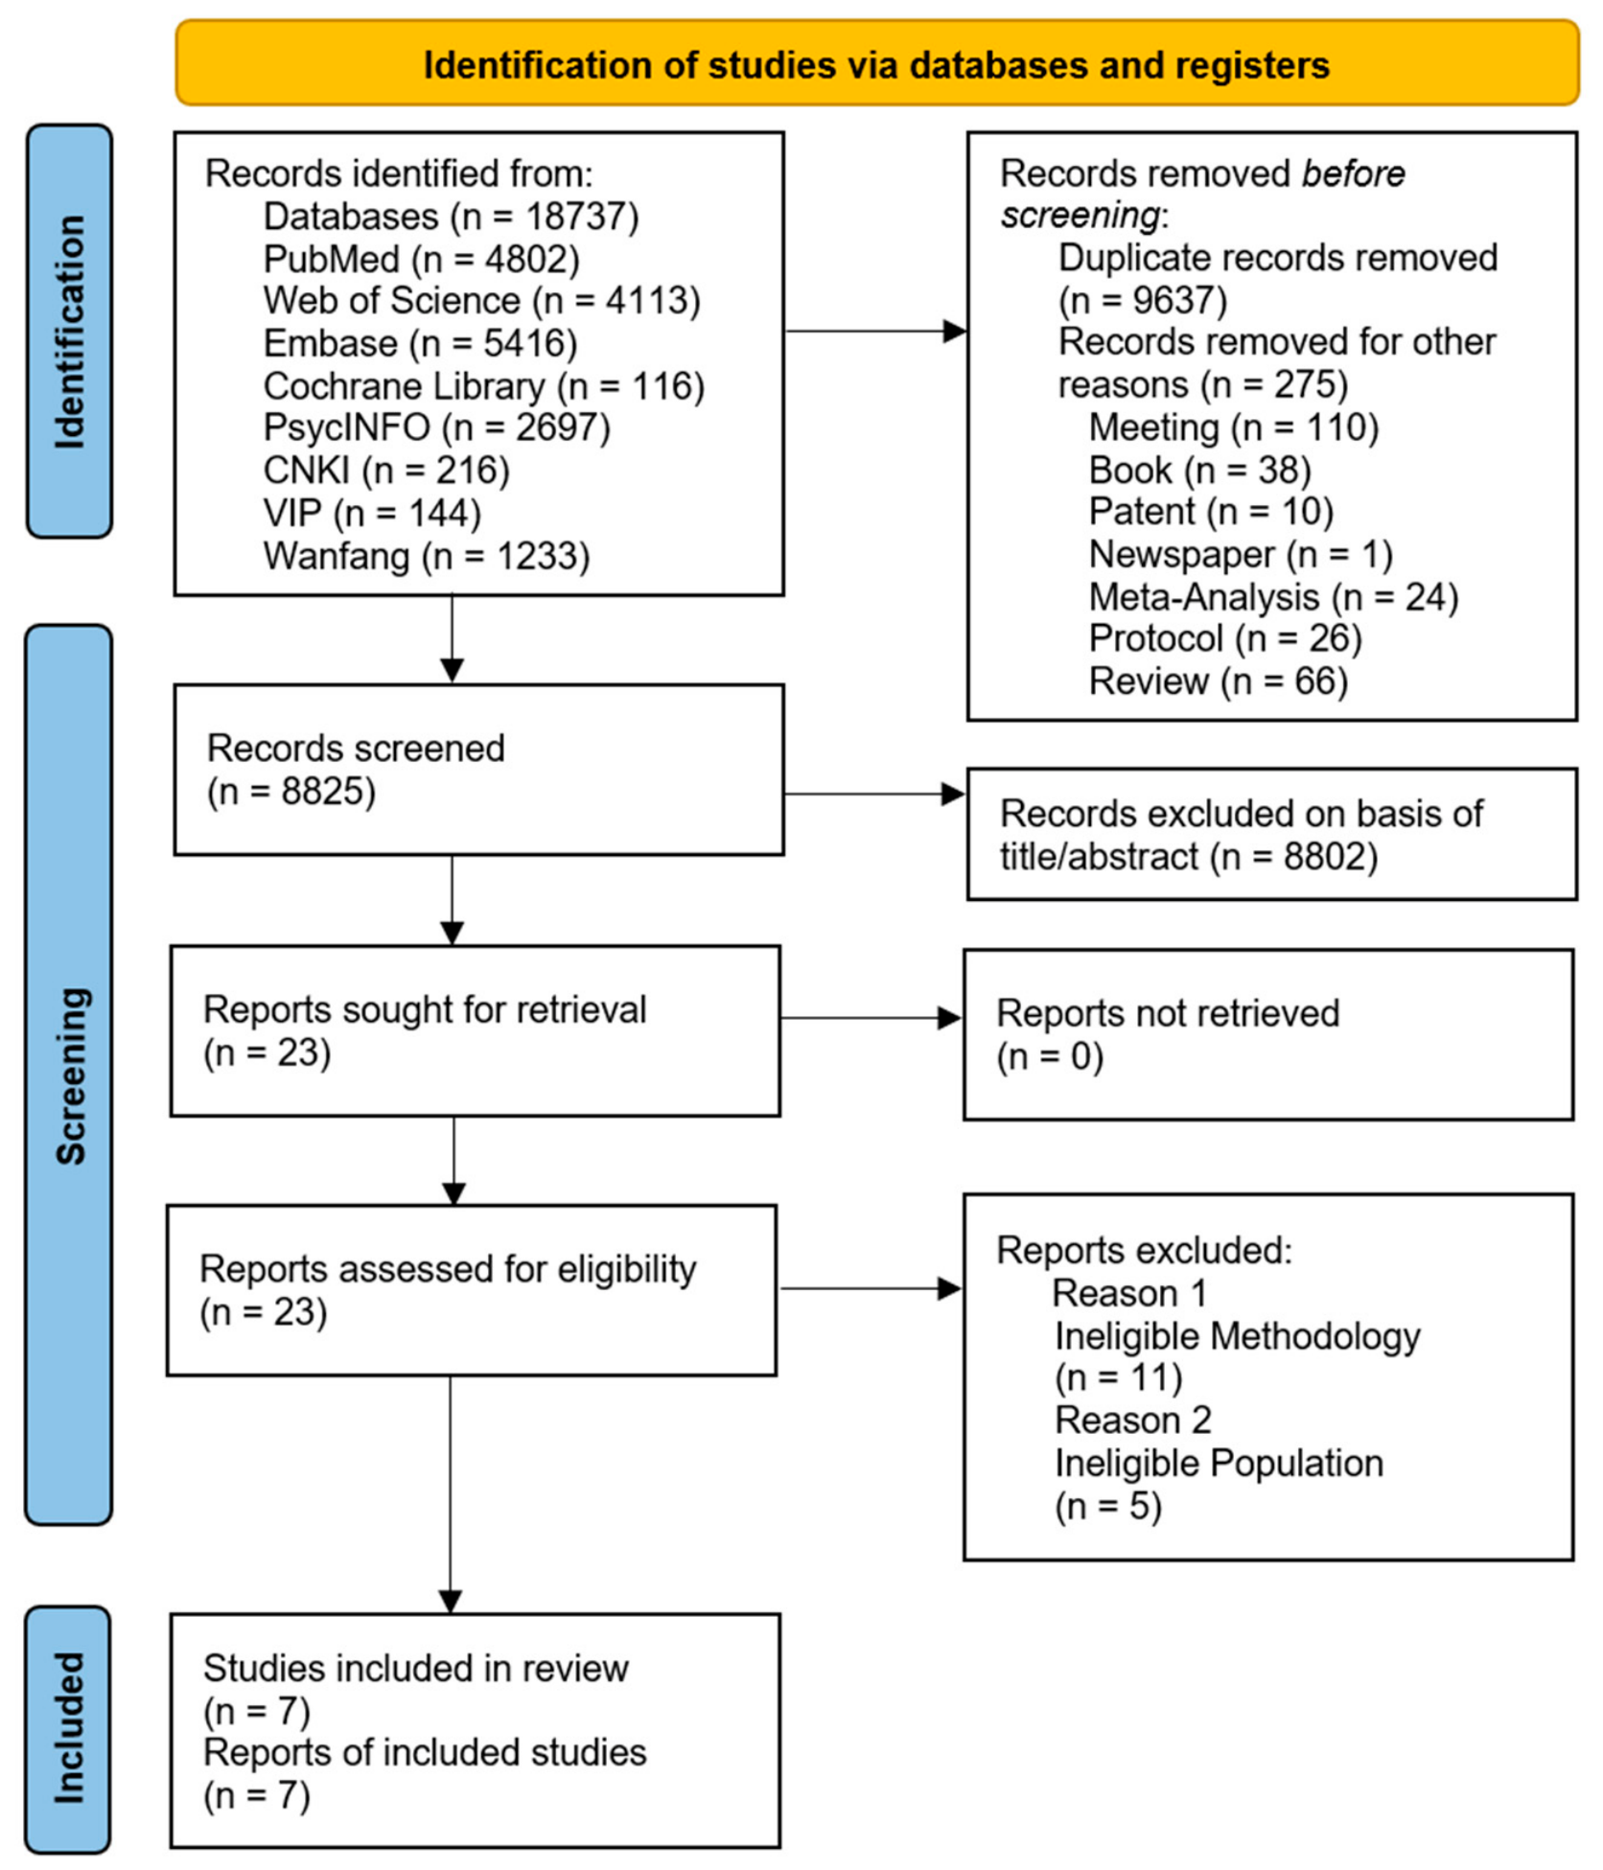
Of the 18,737 records identified across the eight databases, 9637 duplicates and 275 records removed for other reasons were excluded, leaving 8825 records for title and abstract screening. Of these, 8802 were excluded; the remaining 23 reports were sought for retrieval and assessed for eligibility, of which 11 were excluded for ineligible methodology and five for ineligible population, leaving seven studies that met the inclusion criteria. The selection process is summarized in Figure 1.
Figure 1.
PRISMA flow diagram.
3.1. Key Study Characteristics
As shown in Table 1, seven studies met the eligibility criteria. These studies were published between 2020 and 2026, with sample sizes ranging from 939 to 7347. Five studies predicted suicide attempt, and the remaining two predicted broader suicidal outcomes: suicidal behavior (van Vuuren et al., 2021) and suicide risk (Li et al., 2026). Only one study restricted its outcome to incident suicide attempt (Huang et al., 2025), and the others did not distinguish first-onset from recurrent events. Jankowsky et al. (2024) contributed the model in which all 357 predictors were assessed at age 14 (wave 6) and lifetime suicide attempts were assessed three years later at age 17 (wave 7). Another two models reported in that study, which added predictors at age 17, were not extracted. The original authors acknowledged that the timing of individual outcome events could not be verified, and assumed on the basis of age-specific prevalence and national mortality data that the large majority of attempts occurred between ages 14 and 17 years. The shortest prediction horizon was 3 months, and the longest was 3 years. All studies used internal validation. Five of the seven studies evaluated model performance on a held-out subset of the same dataset. Three used a 7:3 training–test split (Kusuma et al., 2024; Su et al., 2023; van Vuuren et al., 2021), and two used an 8:2 split (Jankowsky et al., 2024; Li et al., 2026). The other two studies used cross-validation: nested cross-validation in Huang et al. (2025) and 10-fold cross-validation in Hill et al. (2020).
Table 1.
Key Characteristics of Studies Included in the Meta-Analysis.
In terms of model performance, each study contributed one prediction model identified by the original authors as their final or primary model (Table 2). All of these contributed extractable performance data to at least one quantitative synthesis. Reported AUCs ranged from 0.72 to 0.88, sensitivity from 0.36 to 0.91, and specificity from 0.65 to 0.91. Reported PPVs ranged from 0.10 to 0.22 across the four studies that provided them.
Table 2.
Model performance and predictor characteristics of the included studies.
Regarding predictors, prior suicidal behavior or self-harm was the predictor domain most frequently represented among the leading variables reported by individual studies (Hill et al., 2020; van Vuuren et al., 2021). Other recurring domains included mental health, family and school factors, and personality and behavioral characteristics. Detailed performance metrics, classification thresholds, and the predictors of each model are also presented in Table 2.
3.2. Risk of Bias and Applicability
Seven models from seven studies were assessed (Table 3); the complete item-level ratings are given in Supplementary Tables S2–S4. For model-development quality, no model was rated as low concern overall: two models (Kusuma et al., 2024; Su et al., 2023) were rated as high concern and five as unclear. The high-concern ratings primarily reflected the small number of outcome events relative to the number of candidate predictors: 1020 candidate features for 94 events (events per variable, EPV ≈ 0.09) in Kusuma et al. (2024), and 315 selected predictors for approximately 145 events (EPV ≈ 0.46) in Su et al. (2023). The remaining five models were rated as unclear, mainly because of incomplete reporting of predictor preprocessing (item 2.2) and of the methods used to address class imbalance and the corresponding recalibration of predictions (item 4.4). Across all models, concerns in the first three domains (participants and data sources, predictors, and outcomes) were generally low, reflecting the use of prospective population-based or school-based cohorts in which questionnaires or interviews were administered uniformly.
Table 3.
The risk of bias and applicability of the included models, assessed with PROBAST + AI.
All seven models were judged to be at high overall risk of bias. Concerns in domains 1–3 were low for five models and unclear for two (Jankowsky et al., 2024; van Vuuren et al., 2021); the domain driving the overall judgment was domain four, which was rated as high risk for all seven models. Three recurrent problems accounted for this finding. First, no model was evaluated with the full set of performance measures recommended by PROBAST + AI: six of seven studies reported no calibration whatsoever (neither calibration-in-the-large, nor a calibration slope, nor a Brier score), and none reported a decision curve or net benefit. Kusuma et al. (2024) was the only study that calibrated the predicted probabilities (isotonic regression) and provided a calibration plot in the appendix. Second, in two studies the reported performance was likely to be optimistically biased: in Su et al. (2023) both multiple imputation and recursive feature elimination were carried out before the 70/30 data split, and feature selection was not repeated within the resampling procedure; in van Vuuren et al. (2021), the position of synthetic minority oversampling relative to cross-validation was not reported. Third, several models were evaluated in data sets that were too small to support precise estimates: the test set of Kusuma et al. (2024) contained approximately 28 events and that of Su et al. (2023) approximately 43, and each outer cross-validation fold of Huang et al. (2025) contained approximately 33 events. In addition, Hill et al. (2020) selected one of 26 candidate trees on the basis of its performance in the same sample used for development and reported only sensitivity and specificity, and Li et al. (2026) evaluated the model in a subset in which high-risk adolescents had been deliberately oversampled, so that the outcome prevalence no longer reflected that of the target population.
Applicability concerns were low for six of the seven models in the development part and for five of the seven in the evaluation part. Unclear concerns related to the measurement of lifetime suicide attempts with no fixed window in Jankowsky et al. (2024) and to the deliberately over-sampled evaluation subset in Li et al. (2026).
None of the studies included external validation; every reported performance estimate was obtained by internal validation, either by a random split of the development sample, by cross-validation, or by evaluation in a non-random subset of the same cohort.
3.3. Meta-Analysis of Model Performance
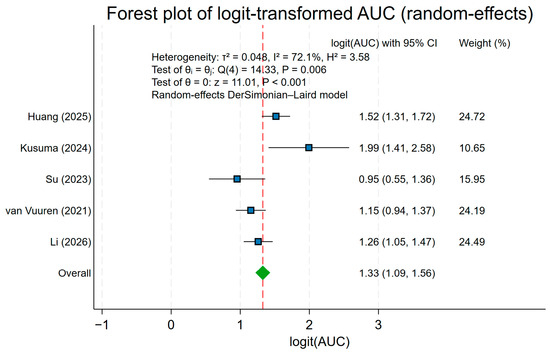
Not every model contributed to every pooled estimate. Six models contributed to the bivariate pooling of sensitivity and specificity and the summary receiver operating characteristic (SROC) analysis, and five models contributed to the pooled AUC. Jankowsky et al. (2024) did not report specificity and therefore did not enter the bivariate model, the SROC analysis, and Deeks’ test (k = 6), all of which were restricted to models with a 2 × 2 table. The pooled results are presented in Figure 2, Figure 3, Figure 4 and Figure 5.
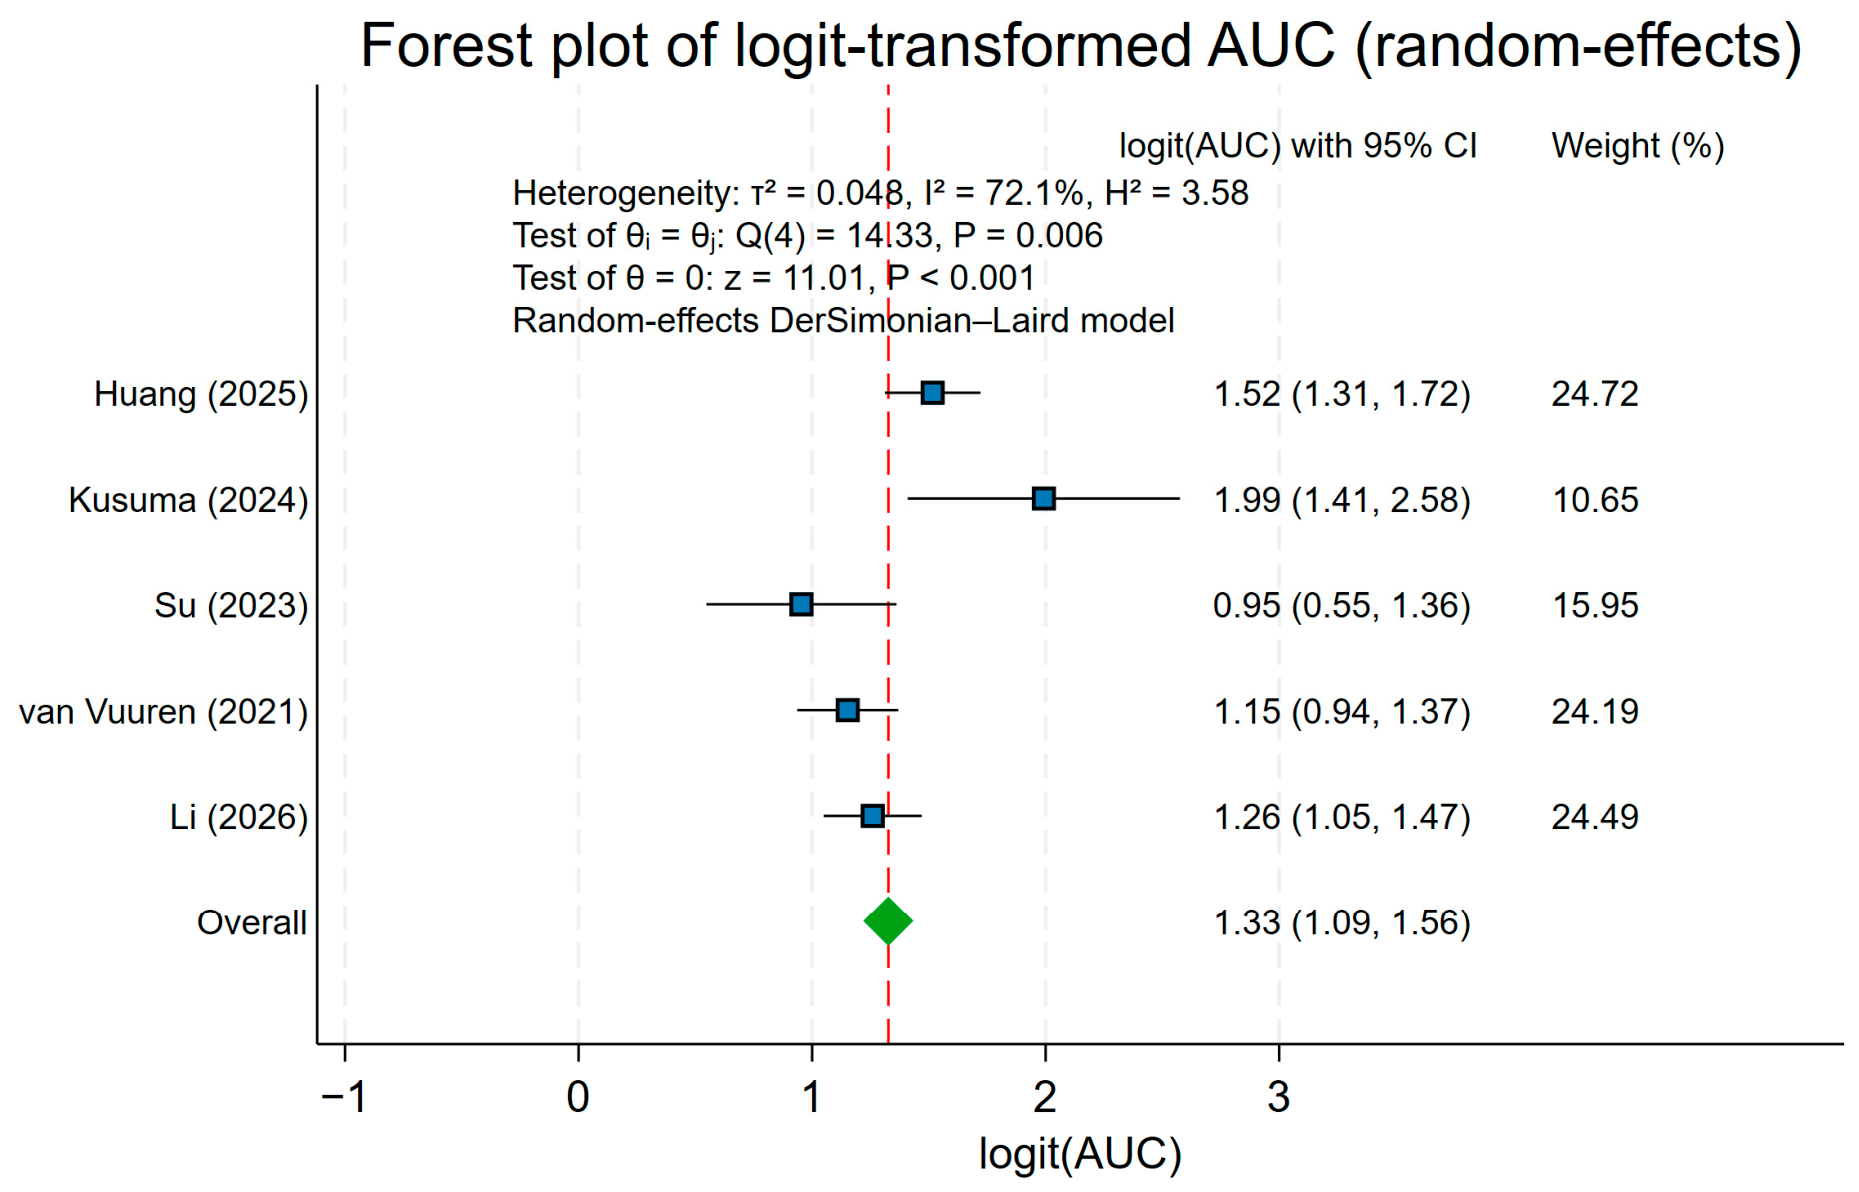
Figure 2.
Forest plot of the pooled area under the receiver operating characteristic curve (AUC), from a random-effects meta-analysis on the logit scale (k = 5). Note: The study labels refer to the first author and publication year of the included studies, e.g., Huang et al. (2025), Kusuma et al. (2024), Li et al. (2026), Su et al. (2023), and van Vuuren et al. (2021); full citations are provided in the reference list.
Figure 3.
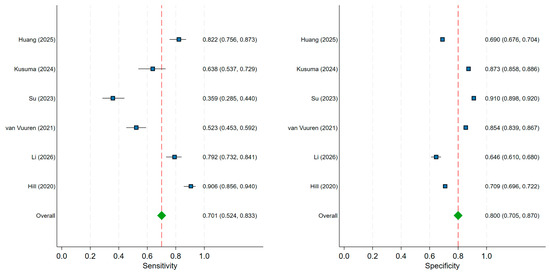
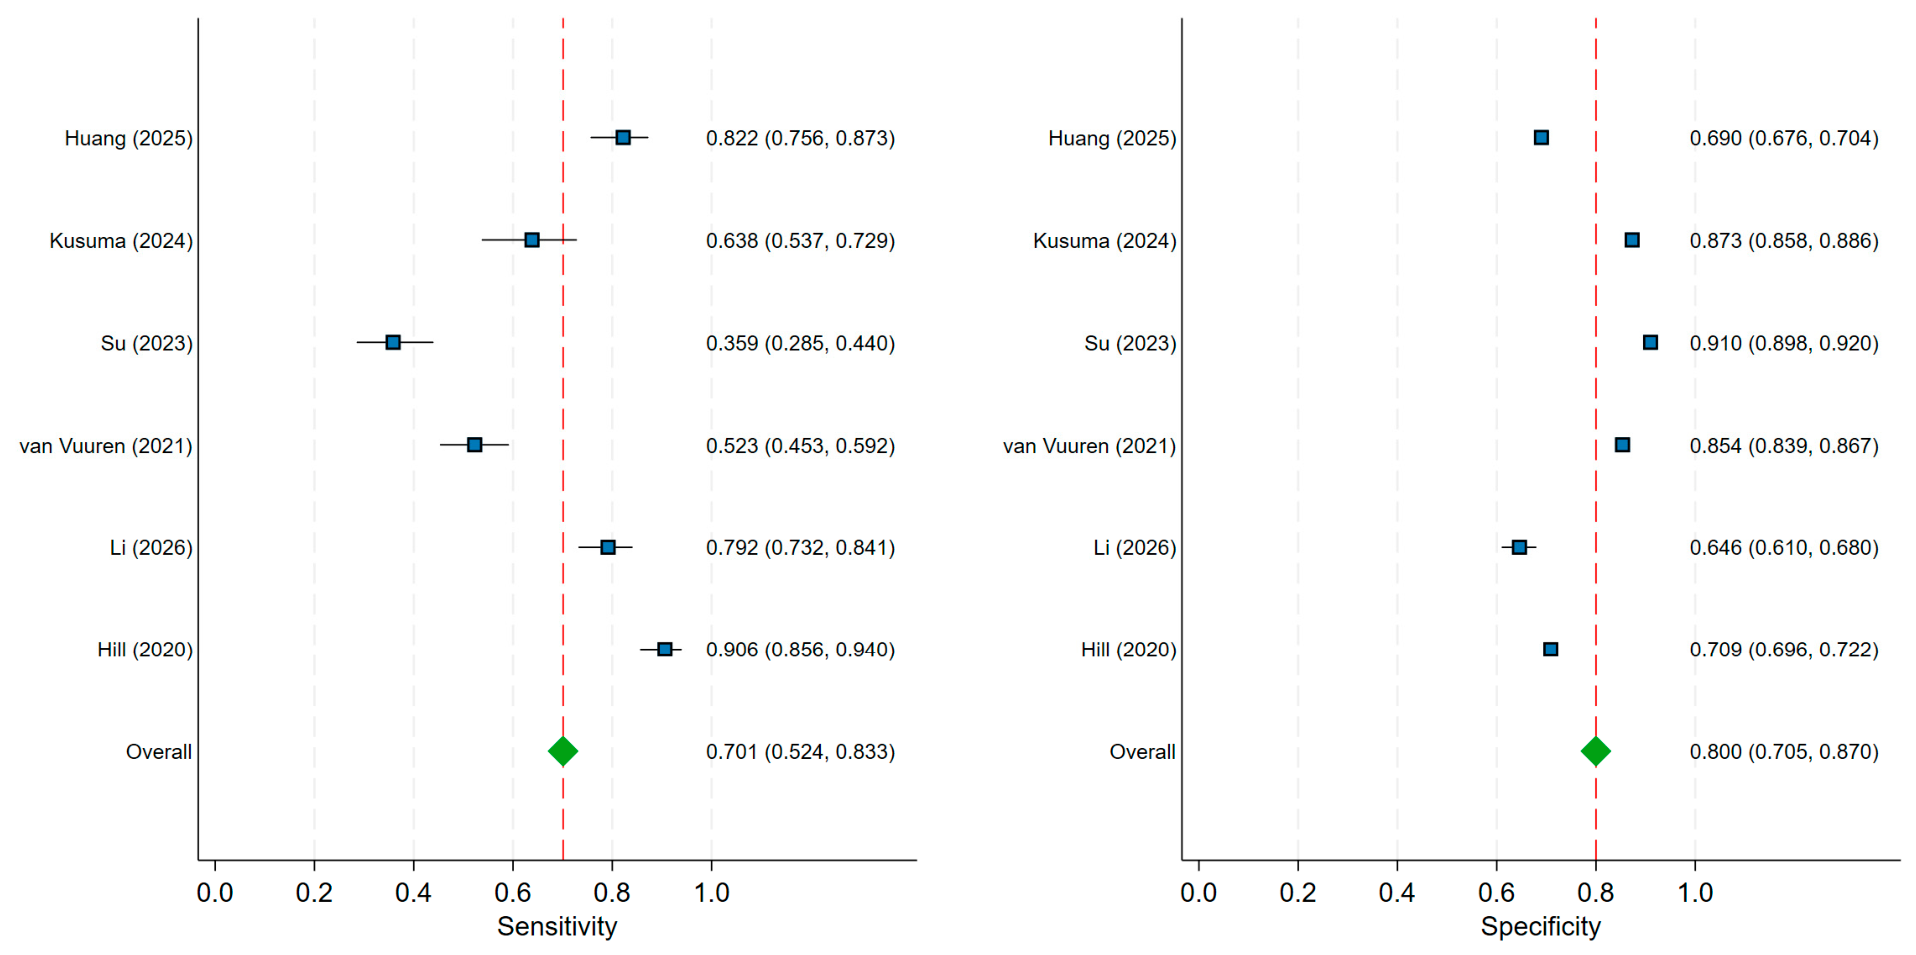
Forest plot of pooled sensitivity and specificity from the bivariate random-effects model (k = 6). Note: Square size represents study weight, horizontal lines represent 95% confidence intervals, and the diamond represents the pooled estimate and its 95% confidence interval. The study labels refer to the first author and publication year of the included studies, e.g., Huang et al. (2025), Kusuma et al. (2024), Su et al. (2023), van Vuuren et al. (2021), Li et al. (2026), and Hill et al. (2020); full citations are provided in the reference list.
Figure 4.
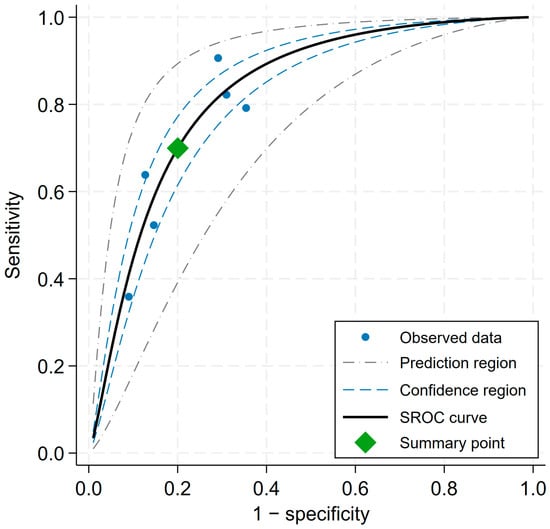
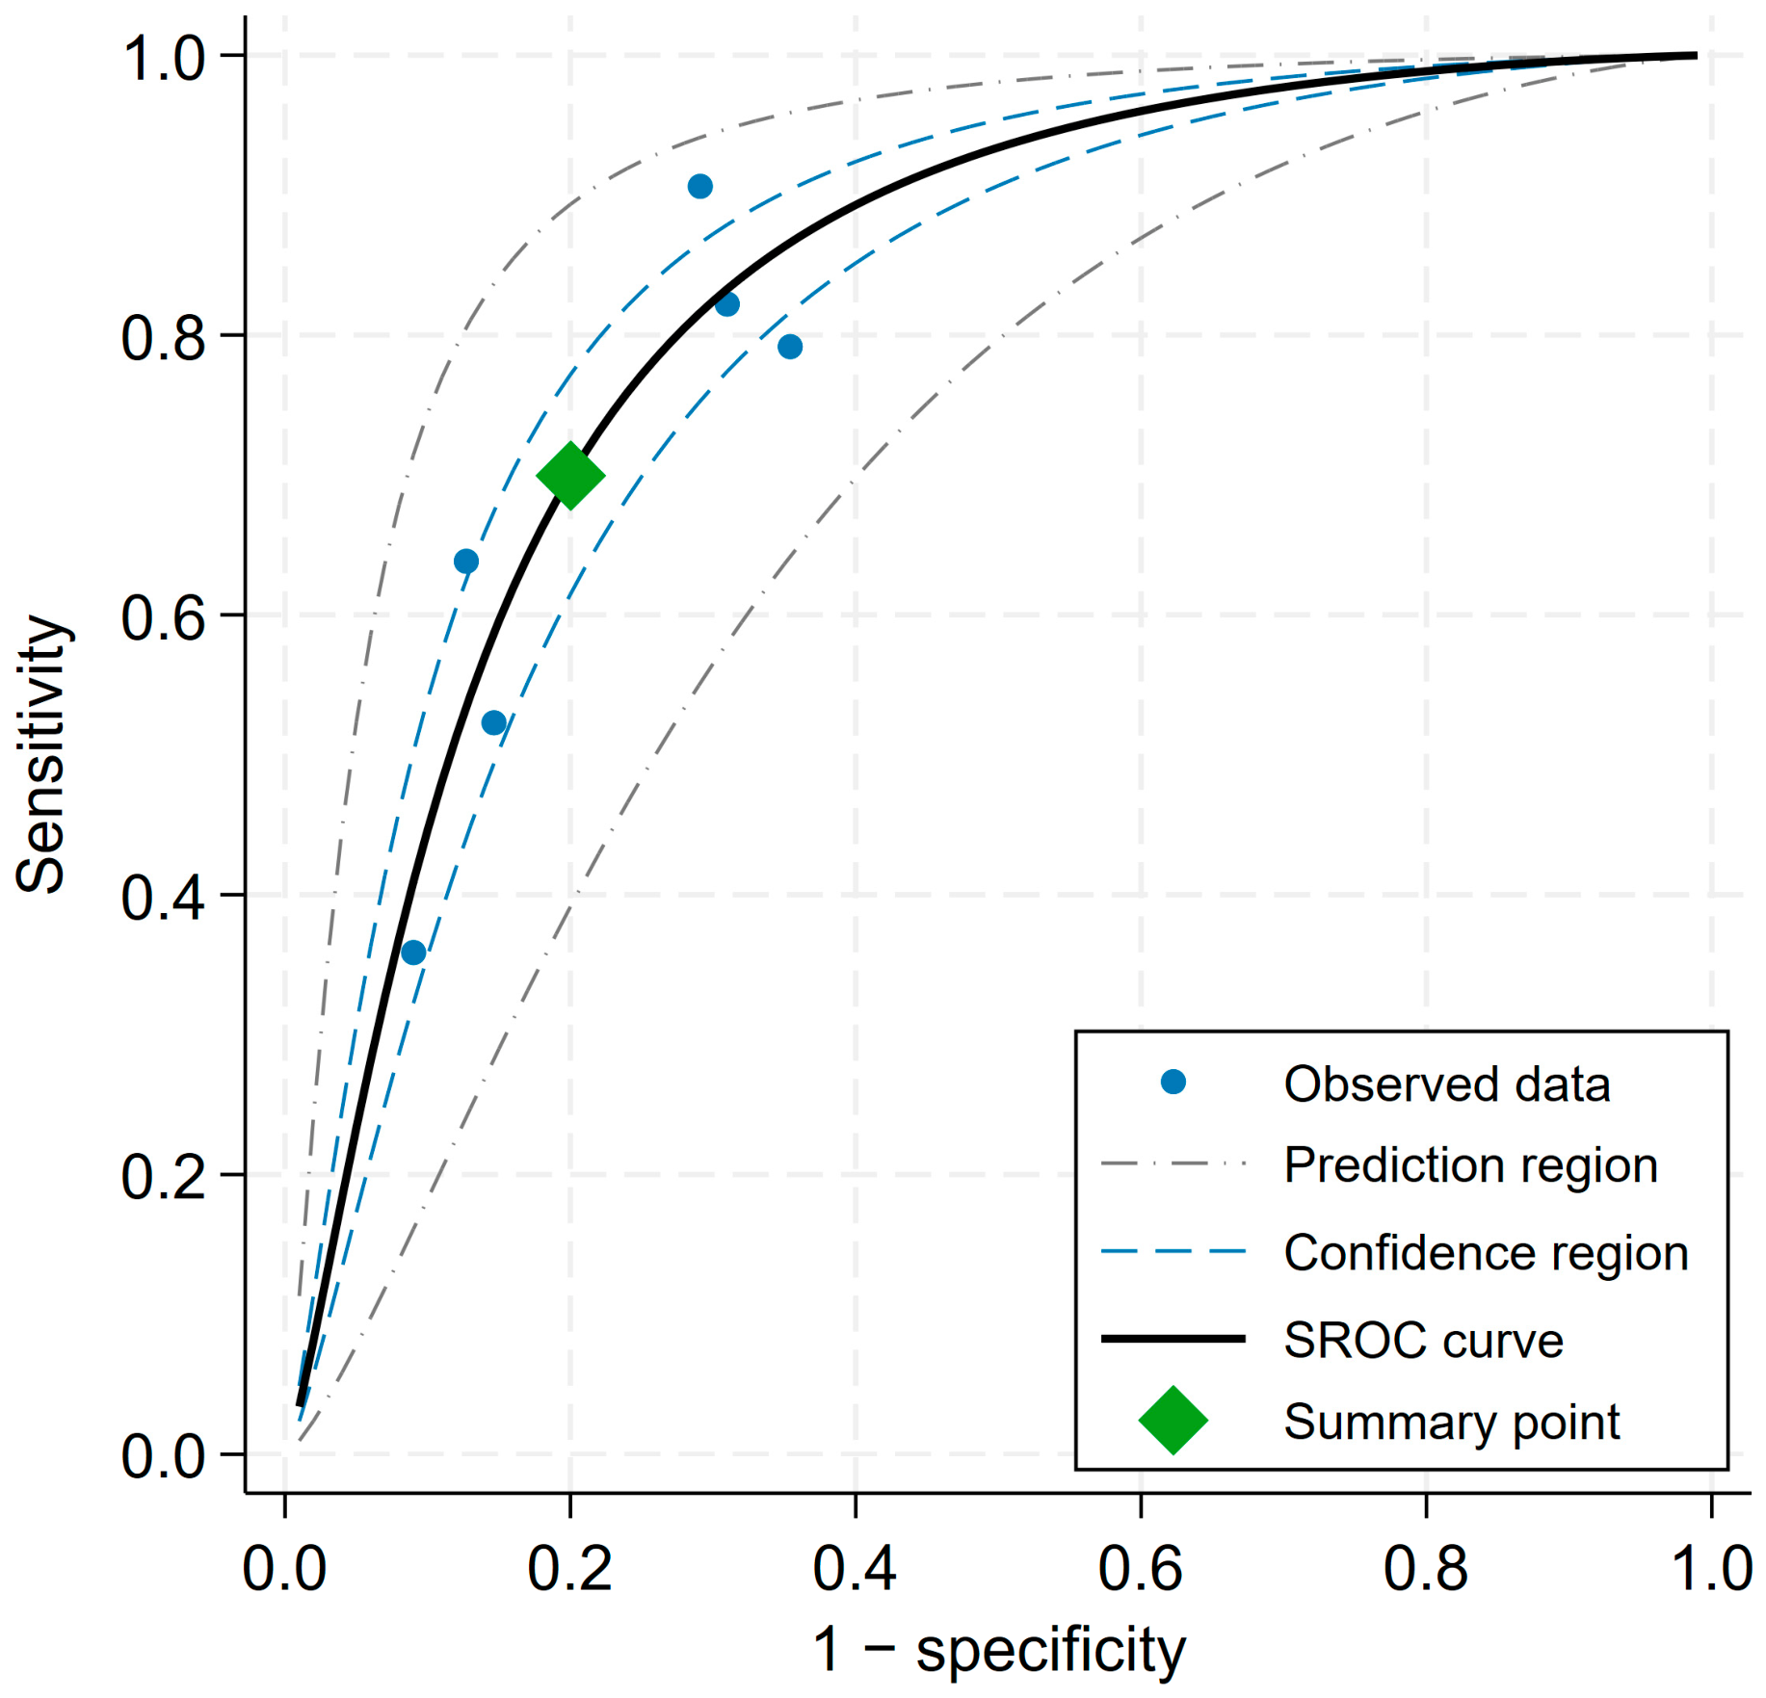
Summary receiver operating characteristic (SROC) curve from the bivariate random-effects model (k = 6), with the 95% prediction region.
Figure 5.
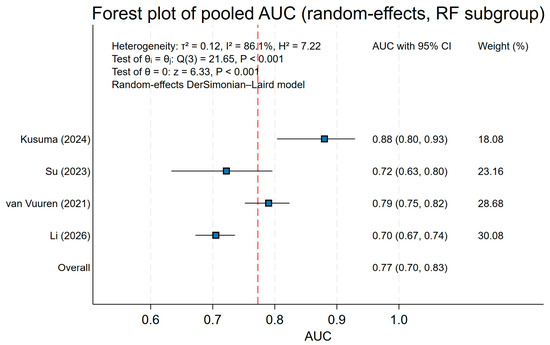
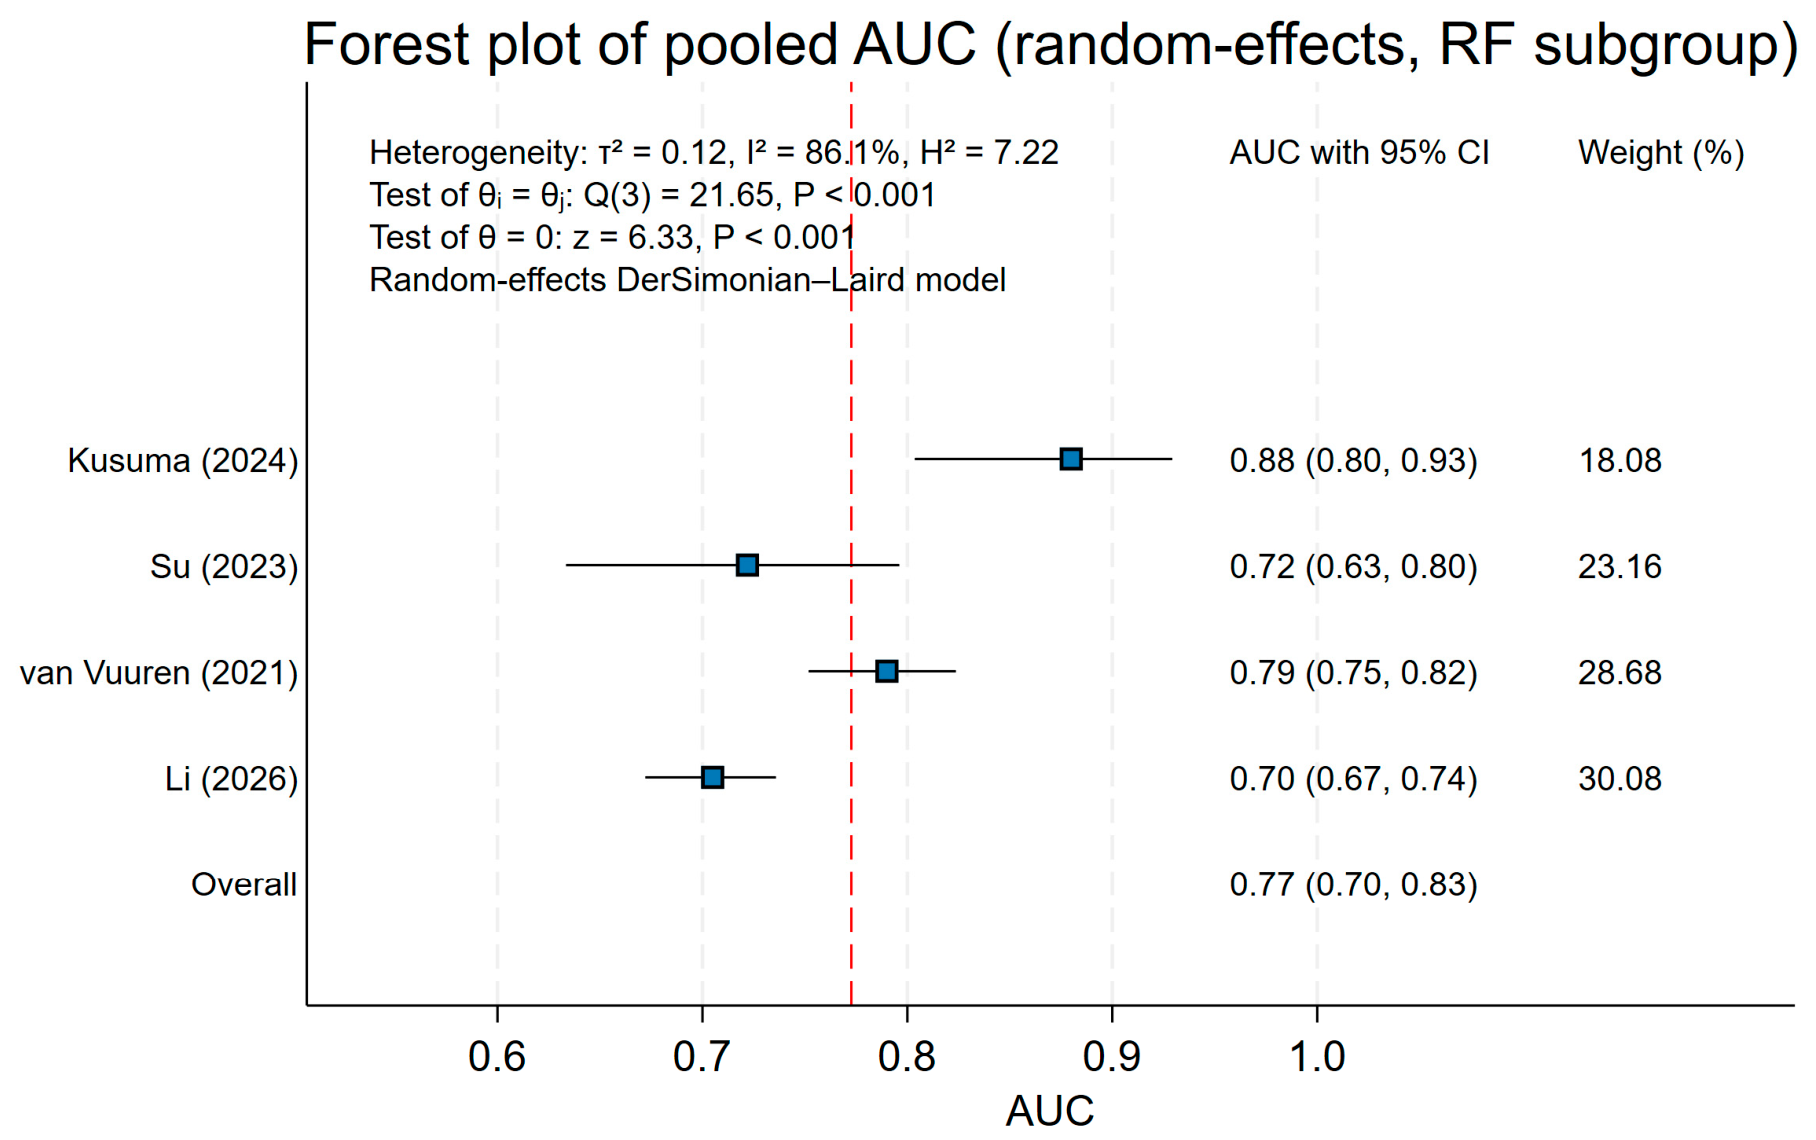
Forest plot of the random-forest subgroup pooled AUC (k = 4). Note: The subgroup pooled the RF models reported by the original studies rather than the models selected for the primary synthesis. The study labels refer to the first author and publication year of the included studies, e.g., Kusuma et al. (2024), Su et al. (2023), van Vuuren et al. (2021), Li et al. (2026); full citations are provided in the reference list.
The summary AUC of the bivariate SROC curve was 0.83 (k = 6), derived directly from the bivariate random-effects model and therefore sharing its parameter estimates with sensitivity and specificity. For reference, the AUC was additionally pooled with a univariate random-effects model on the logit scale (Figure 2); this yielded a pooled AUC of 0.79 (95% CI: 0.75–0.83; 95% prediction interval: 0.63–0.89), based on logit-transformed AUC values (logit AUC = 1.33, 95% CI: 1.09–1.56), and five of the seven models reported an AUC and contributed to this estimate. The bivariate SROC summary AUC (0.83) and the univariate pooled AUC (0.79) are derived from distinct models (joint bivariate modeling of sensitivity and specificity versus univariate inverse-variance pooling of study-level AUCs) and therefore should not be directly compared. Model-level logit AUC values ranged from 0.95 (Su et al., 2023) to 1.99 (Kusuma et al., 2024). Between-study heterogeneity was substantial (τ2 = 0.048; I2 = 72.1%; H = 1.89 [1.00–3.27]; Q (4) = 14.33, p = 0.006).
Under the bivariate random-effects model (Figure 3), sensitivity and specificity were pooled jointly. The summary sensitivity was 0.70 (95% CI: 0.52–0.83) and the summary specificity 0.80 (95% CI: 0.71–0.87); study-level estimates varied widely: sensitivity from 0.36 (Su et al., 2023) to 0.91 (Hill et al., 2020), specificity from 0.65 (Li et al., 2026) to 0.91 (Su et al., 2023). Between-study heterogeneity was substantial (I2 = 95.5% for sensitivity, 99.1% for specificity), and the correlation between the logit transforms of sensitivity and specificity was strongly negative (ρ = −0.91), reflecting the threshold effect across models. Outcome prevalence differed markedly across evaluation samples (3.9%–23.0%) (Huang et al., 2025; Li et al., 2026; Su et al., 2023; van Vuuren et al., 2021).
Figure 4 presents the summary receiver operating characteristic (SROC) curve derived from the bivariate model (k = 6). Individual model estimates reflect both model performance and the classification thresholds used in the primary studies (Table 2) rather than intrinsic differences in model performance. Under the bivariate random-effects model, pooled sensitivity was 0.70 (95% CI: 0.52–0.83) and pooled specificity was 0.80 (95% CI: 0.71–0.87), with a summary AUC of 0.83. The corresponding diagnostic odds ratio was 9.4, and the positive and negative likelihood ratios were 3.5 and 0.37. The strong negative correlation between logit-transformed sensitivity and specificity (ρ = −0.91) is consistent with a threshold-related trade-off across models.
3.4. Exploratory Subgroup Analysis and Meta-Regression
Subgroup analyses and bivariate meta-regression explored potential sources of heterogeneity in predictive performance. Analyses were stratified by outcome type, algorithm type, and prediction horizon, with AUC, sensitivity, and specificity compared across strata where available. Because no stratum comprised more than five models, all subgroup and meta-regression results were treated as exploratory rather than confirmatory.
3.4.1. Exploratory Subgroup Analysis by Outcome Category
To examine whether outcome category moderated performance, we conducted an exploratory bivariate meta-regression with outcome category as the moderator of the joint logit sensitivity–specificity random-effects distribution (suicide attempt as the reference category). The outcome coefficient was not statistically significant on either axis (logit sensitivity slope = −0.205, p = 0.835; logit specificity slope = −0.296, p = 0.657), and neither was the overall Wald test (Wald χ2 = 3.66, p = 0.161), see Table 4. The estimated correlation between the study-level logit sensitivity and logit specificity random effects was −0.956.
Table 4.
Exploratory subgroup analysis of model performance by outcome category (two-class classification).
3.4.2. Descriptive Comparison by Algorithm
Table 5 presents the descriptive comparison by algorithm (not pooled). Because most individual algorithms were represented by a single model and only one non-ensemble model reported an AUC (van Vuuren et al., 2021), a formal comparison of AUC between ensemble and non-ensemble algorithms was not feasible. The analysis is therefore presented descriptively, listing each algorithm together with its reported discrimination and classification metrics. Among the reported ensemble models, the observed performance varied considerably: specificity ranged from 0.65 to 0.91 and sensitivity from 0.36 to 0.82.
Table 5.
Descriptive performance of the included models by algorithm (six algorithms, not pooled).
Table 5 presents only the final or representative model selected from each study. Random forest (RF), however, was the most frequently evaluated algorithm across the included studies, although this is not apparent from Table 5 because the table does not show all algorithms tested in each study. An exploratory random-forest subgroup meta-analysis was therefore conducted to estimate the pooled discrimination of the reported RF models. For this subgroup a different selection rule was applied: the RF model reported by each contributing study was retained, which for two of the four studies was not the model used in the primary synthesis (the RF model of van Vuuren et al. (2021), rather than their LASSO model; and the longitudinal validation feature-set 1 model of Li et al. (2026), rather than their CatBoost model). Four studies contributed an RF model with a reported AUC and 95% CI (Kusuma et al., 2024; Li et al., 2026; Su et al., 2023; van Vuuren et al., 2021) (Figure 5; Table 6). The pooled AUC for the random-forest subgroup was 0.77 (95% CI: 0.70–0.83). Between-study heterogeneity was substantial (τ2 = 0.12; I2 = 86.1%; Cochran’s Q (3) = 21.65, p < 0.001). Because some RF models were not the models selected for the primary synthesis, this exploratory result is descriptive and should not be interpreted as evidence that RF outperforms other algorithms.
Table 6.
Performance of random-forest models reported by the included studies.
3.4.3. Exploratory Subgroup Analysis by Prediction Horizon
Table 7 presents the descriptive comparison by prediction horizon, dichotomized at one year (≤1 year vs. >1 year). Descriptive medians showed that models with a horizon of ≤1 year (n = 2) yielded a sensitivity of 0.85 (range 0.79–0.91) and a specificity of 0.68 (range 0.65–0.71), whereas models with a horizon of >1 year (n = 5) yielded a sensitivity of 0.64 (range 0.36–0.82) and a specificity of 0.86 (range 0.69–0.91). The ≤1-year stratum contained only one model with AUC data (Li et al., 2026), so a between-group AUC comparison (1 vs. 4) was not estimable; the time-window comparison is therefore descriptive only. An exploratory bivariate meta-regression with follow-up duration as a continuous moderator found no significant association with either axis (logit sensitivity slope = −0.777, p = 0.169; logit specificity slope = 0.657, p = 0.052; Wald χ2 = 3.99, p = 0.136).
Table 7.
Descriptive performance of the included models by prediction horizon (≤1 year vs. >1 year).
3.5. Publication Bias Test
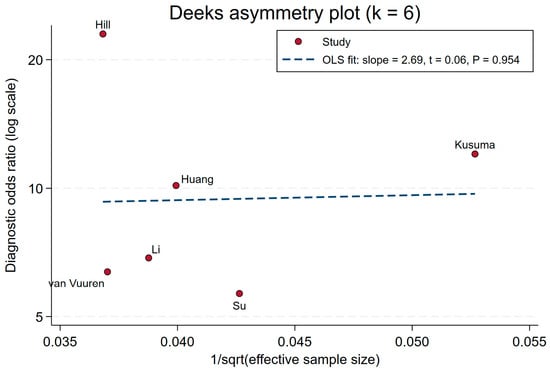
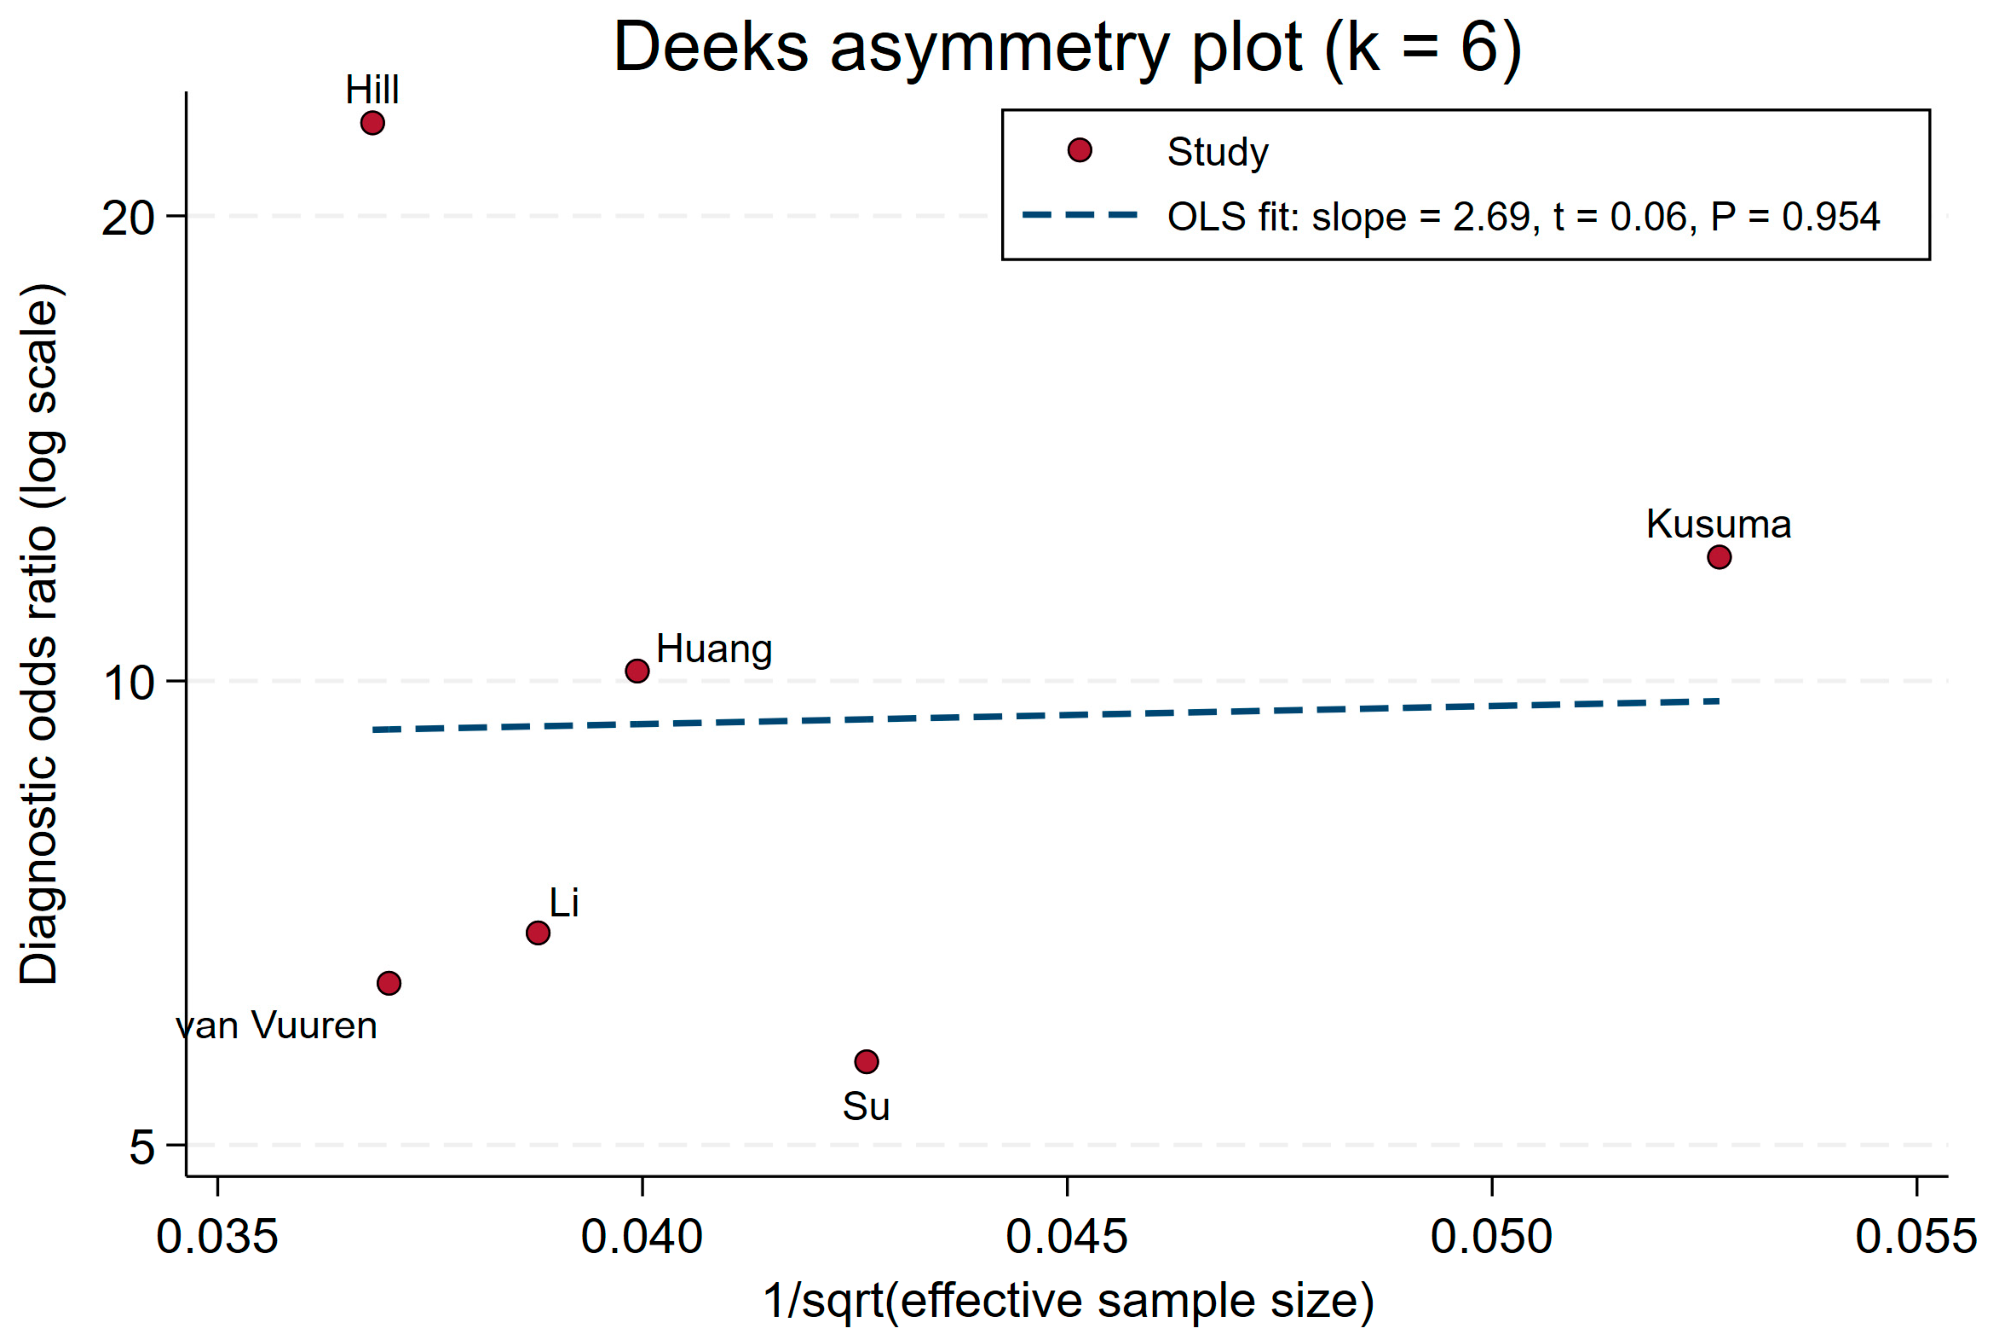
Publication bias was assessed with the Deeks asymmetry test for diagnostic test accuracy (Deeks et al., 2005), in which the log diagnostic odds ratio of each model was regressed on the inverse of the square root of the effective sample size. Six models had the data required for publication bias assessment (Figure 6); the model of Jankowsky et al. (2024), which did not report specificity, could not be included. The regression test did not detect statistically significant asymmetry (slope = 2.69, 95% CI: −119.18 to 124.56, t (4) = 0.06, p = 0.954). However, with only six contributing models and similar effective sample sizes across models (range 360–738), the test had limited resolution and power, and publication bias cannot be excluded.
Figure 6.
Deeks’ asymmetry plot (k = 6).
3.6. Sensitivity Analysis of the Lifetime-Outcome Model
Because Jankowsky et al. (2024) assessed lifetime suicide attempts at age 17 without information on the timing of the outcome events, we assessed whether its inclusion influenced the pooled sensitivity and specificity. The bivariate random-effects model was repeated with this model included (k = 7), deriving specificity from the reported balanced accuracy (0.76) and sensitivity (0.69). The pooled sensitivity was 0.70 (95% CI: 0.55–0.82) and pooled specificity was 0.80 (95% CI: 0.73–0.86), compared with 0.70 (95% CI: 0.52–0.83) and 0.80 (95% CI: 0.71–0.87), respectively, in the primary analysis (k = 6). Thus, adding this model did not materially change the pooled estimates.
4. Discussion
This systematic review and meta-analysis synthesized seven machine-learning prediction models derived from seven longitudinal studies of adolescent students, all of which contributed extractable performance data. Under the bivariate random-effects model, pooled sensitivity was 0.70 (95% CI: 0.52–0.83) and pooled specificity was 0.80 (95% CI: 0.71–0.87), with a summary AUC of the bivariate SROC curve of 0.83; the supplementary univariate pooling of reported AUCs yielded 0.79 (95% CI: 0.75–0.83; 95% prediction interval: 0.63–0.89). Between-study heterogeneity was substantial (I2 = 95.5% for sensitivity and 99.1% for specificity), and exploratory analyses found no statistically significant moderation by outcome category, algorithm type, or prediction horizon. These null findings are inconclusive because each analysis included few models. All seven models were evaluated using internal validation only, all were judged to be at high overall risk of bias, and only one study reported calibration. Prior suicidal behavior or self-harm was the most frequently reported predictor domain; other recurring domains included mental health, family and school factors, personality and behavior, substance use, and other health-risk behaviors.
4.1. Overall Predictive Performance of the Models
Overall, the bivariate model yielded a summary AUC of 0.83, suggesting that the included models, collectively, had some ability to discriminate between adolescents who subsequently experienced the outcome and those who did not. However, because this estimate combines different models, populations, outcomes, and classification thresholds, it should be interpreted as a descriptive summary of the available evidence rather than as the expected performance of a specific model in a new school population. Moreover, the AUC reflects only how well a model ranks individuals according to predicted risk; it does not show whether predicted probabilities are well calibrated or whether the selected thresholds are useful in practice.
At the thresholds used in the primary studies, the pooled sensitivity of 0.70 indicates that approximately 30% of adolescents who later developed an outcome were not classified as positive. These values should not be treated as an intrinsic sensitivity–specificity profile because threshold-selection methods differed across studies. Because all models were evaluated using internal validation and were judged to be at high risk of bias, the pooled estimates may overstate performance in routine school practice.
Performance measures suited to imbalanced outcomes were poorly reported. Most included studies reported conventional discrimination and classification metrics, such as ROC-AUC, sensitivity, and specificity. However, metrics that better characterize performance for the minority outcome class, including PPV, AUC-PR, F-scores, and related precision-oriented measures, were not consistently reported across studies. Because suicidal behavior is uncommon in adolescent students, ROC-AUC and specificity may appear favorable despite poor identification of the minority outcome class. Future studies should report PPV, AUC-PR, and F2 scores, together with outcome prevalence, classification thresholds, confidence intervals, and calibration measures. The absence of decision-analytic measures means that the practical value of using these models to guide school-based decisions remains unknown.
4.2. Differences in Predictive Performance Across Suicidal Outcomes (Exploratory)
The exploratory bivariate meta-regression found no statistically significant moderating effect of outcome category. Nevertheless, the descriptive subgroup results showed numerically higher performance for models predicting suicide attempts than for models predicting broader suicidal behavior or suicide-risk outcomes (0.82 vs. 0.77, 0.69 vs. 0.66, and 0.79 vs. 0.75, respectively). This pattern should be interpreted cautiously. The suicide-attempt subgroup included five studies, whereas the broader suicidal behavior/risk subgroup included only two; thus, the subgroup summaries were based on unequal and small numbers of studies, and the estimates for the latter group may be particularly sensitive to the results of individual studies. Therefore, the numerical differences should not be interpreted as evidence that suicide attempts are inherently easier to predict or that outcome category has a confirmed moderating effect.
One possible explanation is that suicide attempt is a more specific and behaviorally anchored outcome, whereas broader suicidal behavior or suicide-risk categories may combine heterogeneous manifestations that differ in severity, timing, and ascertainment. This interpretation is broadly consistent with the ideation-to-action framework (May & Klonsky, 2016), which distinguishes the development of suicidal ideation from the transition to suicidal action and proposes partly different determinants for these processes. Although predicting suicide attempts may require information on additional volitional factors involved in the transition from ideation to action, such as impulsivity, acquired capability for suicide, and attitudes toward death (O’Connor & Kirtley, 2018), the more specific outcome definition may also make the target easier to operationalize. The observed subgroup pattern may therefore reflect a combination of the clearer definition of suicide-attempt outcomes and the unequal numbers of contributing studies, particularly the small number of studies in the broader suicidal behavior/risk subgroup.
4.3. Algorithm Performance and the Role of Data Quality (Exploratory)
Most algorithms were represented by a single model, and these model-specific estimates were obtained from different cohorts, outcomes, predictor sets, thresholds, and validation procedures. They therefore do not establish that one algorithm performs better than another. Future studies should compare multiple algorithms within the same dataset, outcome definition, preprocessing pipeline, and validation strategy to disentangle algorithm effects from design and data characteristics. The RF subgroup had a pooled AUC of 0.77 and a wide 95% prediction interval (0.38–0.95). With only four studies and substantial heterogeneity, this estimate is too imprecise to support conclusions about the expected performance of RF models in new settings or their performance relative to other algorithms.
Most models relied on questionnaire data. Future research could evaluate whether the incorporation of richer, time-varying data, including intensive longitudinal data collected through ecological momentary assessment and longitudinal social media monitoring could improve the model’s sensitivity (Allen et al., 2019; Kusuma et al., 2024), as well as multimodal data derived from speech, language, facial expressions, and eye movements. Their incremental predictive value should be tested rather than assumed, and their use with minors requires careful attention to consent, privacy, data governance, measurement equivalence, and the risk of labeling or stigmatization.
PROBAST + AI identified a high overall risk of bias for every model, driven mainly by the analysis domain. The pooled estimates may therefore overstate performance in routine practice, although they cannot be interpreted as a formal upper bound. Future studies should report calibration-in-the-large, calibration slopes, and Brier scores alongside discrimination measures, as well as decision curves or net benefit when a model is intended to inform clinical or school-based decisions. Reporting in accordance with TRIPOD + AI would improve transparency, but it would not by itself correct weaknesses in model development or validation.
4.4. Prediction Horizon and Considerations for Real-World Implementation (Exploratory)
The prediction-horizon subgroup analysis compared models with a horizon of ≤1 year against those with a horizon of >1 year. Descriptive medians suggested that shorter-horizon models were associated with numerically higher sensitivity (0.85 vs. 0.64) but lower specificity (0.68 vs. 0.86). Because the ≤1-year stratum contained only one model with AUC data, a formal between-group test of a moderating effect of horizon was not estimable. An exploratory bivariate meta-regression with follow-up duration as a continuous moderator likewise found no significant moderating effect. The observed differences may reflect threshold selection or other study characteristics rather than prediction horizon itself. Longer horizons could weaken the relevance of baseline predictors as psychological state, environmental exposure, and developmental context change, but the present data do not permit a robust test of this hypothesis.
Calibration was rarely reported. Only one of the seven studies calibrated predicted probabilities, and none reported calibration-in-the-large, a calibration slope, or a Brier score. Discrimination and calibration provide different information: a model may rank students correctly while systematically overestimating or underestimating their absolute risk. Without calibration data, appropriate risk thresholds for school-based decisions cannot be established. Furthermore, no model underwent external validation. Several were evaluated in samples containing few outcome events or, in one case, deliberately enriched for adolescents at elevated risk, so the transportability of the reported performance to other school settings remains uncertain.
The heterogeneity observed here was extreme (I2 = 95.5% for sensitivity and 99.1% for specificity) and was not accounted for by outcome type, algorithm type, or prediction horizon. These moderator analyses had limited power because each included only a small number of models; their nonsignificant results do not show that the examined factors are unimportant. The pooled models also differed in country, age group, prediction horizon, outcome instrument, and outcome prevalence (3.9%–23.0%). Differences in sample size, number of outcome events, outcome definition and ascertainment, predictor measurement, classification thresholds, preprocessing, class-imbalance handling, and validation strategy may therefore have contributed to the observed heterogeneity. Future meta-analyses with more independent studies should examine these factors directly.
The Deeks asymmetry test did not detect significant asymmetry (slope = 2.69, 95% CI: −119.18 to 124.56, t (4) = 0.06, p = 0.954). However, with only six models, publication bias and small-study effects cannot be assessed reliably and cannot be ruled out.
4.5. Key Predictive Factors and Their Theoretical Significance
Prior suicidal behavior or self-harm was the factor most frequently identified among the leading predictors across the included studies. This finding is consistent with the Integrated Motivational–Volitional (IMV) model (O’Connor & Kirtley, 2018), in which previous suicidal behavior and self-harm are important volitional factors that may increase the likelihood of progression from suicidal ideation to suicidal action. In schools, these findings support timely assessment and follow-up for students who report suicidal ideation or plans, particularly those with a history of self-harm or suicide attempts. Such measures are most directly relevant to preventing escalation or recurrence among students who are already at risk.
However, the frequent inclusion of prior suicidal behavior and self-harm as predictors also suggests that many of the models primarily estimated the risk of persistence or recurrence of suicidal behavior rather than the risk of its first onset. Because the included studies did not consistently distinguish incident from recurrent outcomes, predictors specifically associated with the first onset of suicidal behavior remain unclear. Most models lacked external validation, limiting their generalizability. Only Huang et al. (2025) excluded adolescents with a history of suicide attempts; no sensitivity analysis of first-onset versus mixed or recurrent outcomes was possible. Moreover, machine-learning algorithms quantify predictor importance in different ways and rankings also depend on the candidate predictor set, participant age, prediction horizon, cultural context, outcome definition, and modeling approach. Predictor rankings are therefore presented as model-specific descriptions; they are not compared directly across models or interpreted as evidence of causal importance. Future studies should define first-onset and recurrent outcomes separately and report predictor measurement and importance methods more consistently. This would help distinguish predictors of onset from predictors of persistence or recurrence and support more appropriately targeted school-based prevention.
4.6. Theoretical and Practical Implications
The findings define a limited current role for ML prediction in schools. Moderate discrimination does not overcome incomplete sensitivity, uncertain calibration, and the absence of external validation. If externally validated, these models might provide additional information for professionally supervised assessment, but the present evidence does not support autonomous screening or decision making. Before school-based use, models require external validation in diverse populations, transparent calibration reporting, and evaluation of decision-analytic performance and potential harms.
4.7. Limitations
This review is subject to several limitations that qualify its conclusions. First, the search was confined to English- and Chinese-language publications, which may have introduced language bias and limited the representativeness of the evidence base. Second, PPV and other measures suited to imbalanced outcomes could not be quantitatively synthesized because they were reported by few models, or the values came from different classification thresholds. Third, with only seven studies contributing seven models and fewer than seven models available for any individual outcome, the statistical power of the subgroup and bivariate meta-regression analyses is necessarily limited; accordingly, non-significant moderating effects should not be read as evidence of no effect. Fourth, for five of the seven models with extractable performance data the 2 × 2 classification counts were reconstructed from the published sensitivity, specificity, and case/non-case counts rather than taken from a reported confusion matrix; because the published estimates are rounded to two decimal places, the reconstructed counts carry minor rounding uncertainty. Fifth, all performance estimates came from internal validation, and the primary studies generally selected a final model from several candidates; the pooled estimates may therefore be optimistic. Sixth, the synthesis combined distinct models developed in different cohorts for different prediction tasks. The pooled estimates summarize this heterogeneous evidence and do not represent the validated performance or expected precision of a particular model in a new setting.
5. Conclusions
This review summarizes the available longitudinal evidence on machine-learning models for predicting suicidal behavior among adolescent students. The pooled estimates indicate moderate discrimination, but they combine different models, cohorts, outcomes, and thresholds. Because sensitivity and specificity are threshold-dependent, their numerical difference should not be treated as an intrinsic property of the models. All included models were evaluated using internal validation and were at high overall risk of bias. External validation, calibration assessment, decision-analytic evaluation, and prospective evidence of benefit and harm are needed before model-informed risk assessment can be considered for routine school use.
Supplementary Materials
The following supporting information can be downloaded at: https://www.mdpi.com/article/10.3390/bs16112104/s1, Figure S1: Calibration curves, Receiver Operating Characteristic curves, and Precision-Recall curves for models as evaluated in the hold-out test data; Figure S2: Calibration curves, Receiver Operating Characteristic curves, and Precision-Recall curves for models as evaluated in the training dataset; Table S1: 2 × 2 classification counts for the included models; Table S2: PROBAST+AI model development part: item-level ratings; Table S3: PROBAST+AI model evaluation part: item-level ratings; Table S4: PROBAST+AI applicability assessment; Table S5: Data splitting and the ordering of imputation and feature selection relative to splitting; Table S6: Handling of missing data; Table S7: Number of outcome events relative to the number of candidate predictors; Table S8: Class-imbalance procedures and whether predictions were recalibrated afterwards; Table S9: Hyperparameter tuning; Table S10: Optimism correction and control of overfitting; Table S11: Assessment of calibration; Table S12: Summary of reporting of the eight methodological elements across the seven included studies; Table S13: PRISMA 2020 checklist; Table S14: Variables used in the linked administrative datasets; Table S15: Hyperparameter grids and final specifications; Table S16: CHARMS-guided data extraction form; Table S17: TRIPOD-SRMA checklist: item-by-item reporting for this review; Section S1: Verbatim source quotations supporting each entry.
Author Contributions
H.X.: Formal analysis, data curation, preparation, writing—original draft, writing—review and editing, and visualization. Z.S.: Formal analysis, writing—original draft, writing—review and editing, and visualization. Z.L.: Conceptualization, funding acquisition, formal analysis, data curation, investigation, writing—original draft, resources, and writing—review and editing. C.Y.: Formal analysis and writing—review and editing. S.J.: Supervision. All authors have read and agreed to the published version of the manuscript.
Funding
This study was funded by the Postdoctoral Stay-in-Jilin Funding Program of the Department of Human Resources and Social Security of Jilin Province.
Institutional Review Board Statement
Not applicable.
Informed Consent Statement
Not applicable.
Data Availability Statement
The data that support the findings of this study are available from the corresponding author upon reasonable request.
Conflicts of Interest
The authors declare no conflicts of interest.
References
- Allen, N. B., Nelson, B. W., Brent, D., & Auerbach, R. P. (2019). Short-term prediction of suicidal thoughts and behaviors in adolescents: Can recent developments in technology and computational science provide a breakthrough? Journal of Affective Disorders, 250, 163–169. [Google Scholar] [CrossRef] [Scilit] [PubMed]
- Bertuccio, P., Amerio, A., Grande, E., La Vecchia, C., Costanza, A., Aguglia, A., Berardelli, I., Serafini, G., Amore, M., Pompili, M., & Odone, A. (2024). Global trends in youth suicide from 1990 to 2020: An analysis of data from the WHO mortality database. eClinicalMedicine, 70, 102506. [Google Scholar] [CrossRef] [Scilit] [PubMed] [PubMed Central]
- Corke, M., Mullin, K., Angel-Scott, H., Xia, S., & Large, M. (2021). Meta-analysis of the strength of exploratory suicide prediction models; from clinicians to computers. BJPsych Open, 7(1), e26. [Google Scholar] [CrossRef] [Scilit] [PubMed]
- Danielsen, S., Strandberg-Larsen, K., Hawton, K., Nordentoft, M., Erlangsen, A., & Madsen, T. (2025). The iceberg model of suicidal ideation and behaviour in Danish adolescents: Integration of national registry and self-reported data within a national birth cohort. European Child & Adolescent Psychiatry, 34(2), 611–621. [Google Scholar] [CrossRef] [Scilit] [PubMed]
- Deeks, J. J., Macaskill, P., & Irwig, L. (2005). The performance of tests of publication bias and other sample size effects in systematic reviews of diagnostic test accuracy was assessed. Journal of Clinical Epidemiology, 58(9), 882–893. [Google Scholar] [CrossRef] [Scilit] [PubMed]
- Franklin, J. C., Ribeiro, J. D., Fox, K. R., Bentley, K. H., Kleiman, E. M., Huang, X., Musacchio, K. M., Jaroszewski, A. C., Chang, B. P., & Nock, M. K. (2017). Risk factors for suicidal thoughts and behaviors: A meta-analysis of 50 years of research. Psychological Bulletin, 143(2), 187–232. [Google Scholar] [CrossRef] [Scilit] [PubMed]
- Hill, R. M., Oosterhoff, B., & Do, C. (2020). Using machine learning to identify suicide risk: A classification tree approach to prospectively identify adolescent suicide attempters. Archives of Suicide Research, 24(2), 218–235. [Google Scholar] [CrossRef] [Scilit] [PubMed]
- Hu, Y., Zeng, Z., Peng, L., Wang, H., Liu, S., Yang, Q., & Fang, X. (2023). The effects of the parent-child relationship and parental educational involvement on adolescent depression, self-injury, and suicidal ideation: The roles of defeat and meaning in life. Acta Psychologica Sinica, 55(1), 129–141. [Google Scholar] [CrossRef] [Scilit]
- Huang, C., Yue, Y. L., Wang, Z. M., Liu, Y. J., Yao, N. S., & Mu, W. T. (2025). Prediction of first attempt of suicide in early adolescence using machine learning. Journal of Affective Disorders, 382, 1–9. [Google Scholar] [CrossRef] [Scilit] [PubMed]
- Jankowsky, K., Steger, D., & Schroeders, U. (2024). Predicting lifetime suicide attempts in a community sample of adolescents using machine learning algorithms. Assessment, 31(3), 557–573. [Google Scholar] [CrossRef] [Scilit] [PubMed]
- Kusuma, K., Larsen, M., Quiroz, J. C., & Torok, M. (2024). Age-stratified predictions of suicide attempts using machine learning in middle and late adolescence. Journal of Affective Disorders, 365, 126–133. [Google Scholar] [CrossRef] [Scilit] [PubMed]
- Large, M., Kaneson, M., Myles, N., Myles, H., Gunaratne, P., & Ryan, C. (2016). Meta-analysis of longitudinal cohort studies of suicide risk assessment among psychiatric patients: Heterogeneity in results and lack of improvement over time. PLoS ONE, 11(6), e0156322. [Google Scholar] [CrossRef] [Scilit] [PubMed]
- Li, W., Cheng, Y., Zhang, Z., Yang, Y., Jin, Y., Cui, Z., Wang, J., Duan, Y., & Chen, R. (2026). Development and validation of a machine learning-based screening tool for early detection of adolescent suicide risk. Journal of Child Psychology and Psychiatry, 67(9), 1576–1589. [Google Scholar] [CrossRef] [Scilit] [PubMed]
- Lim, K.-S., Wong, C. H., McIntyre, R. S., Wang, J., Zhang, Z., Tran, B. X., Tan, W., Ho, C. S., & Ho, R. C. (2019). Global lifetime and 12-month prevalence of suicidal behavior, deliberate self-harm and non-suicidal self-injury in children and adolescents between 1989 and 2018: A meta-analysis. International Journal of Environmental Research and Public Health, 16(22), 4581. [Google Scholar] [CrossRef] [Scilit] [PubMed]
- Linthicum, K. P., Schafer, K. M., & Ribeiro, J. D. (2019). Machine learning in suicide science: Applications and ethics. Behavioral Sciences and the Law, 37(3), 214–222. [Google Scholar] [CrossRef] [Scilit] [PubMed]
- May, A. M., & Klonsky, E. D. (2016). What distinguishes suicide attempters from suicide ideators? A meta-analysis of potential factors. Clinical Psychology: Science and Practice, 23(1), 5–20. [Google Scholar] [CrossRef] [Scilit]
- Moons, K. G. M., Damen, J. A. A., Kaul, T., Hooft, L., Andaur Navarro, C., Dhiman, P., Beam, A. L., Van Calster, B., Celi, L. A., Denaxas, S., Denniston, A. K., Ghassemi, M., Heinze, G., Kengne, A. P., Maier-Hein, L., Liu, X., Logullo, P., McCradden, M. D., Liu, N., … van Smeden, M. (2025). PROBAST+AI: An updated quality, risk of bias, and applicability assessment tool for prediction models using regression or artificial intelligence methods. BMJ, 388, e082505. [Google Scholar] [CrossRef] [Scilit] [PubMed]
- Moons, K. G. M., de Groot, J. A. H., Bouwmeester, W., Vergouwe, Y., Mallett, S., Altman, D. G., Reitsma, J. B., & Collins, G. S. (2014). Critical appraisal and data extraction for systematic reviews of prediction modelling studies: The CHARMS checklist. PLoS Medicine, 11(10), e1001744. [Google Scholar] [CrossRef] [Scilit] [PubMed]
- Morneau-Vaillancourt, G., Orri, M., Ouellet-Morin, I., Geoffroy, M. C., & Boivin, M. (2025). A longitudinal study of adolescent pathways differentiating suicide ideation and attempt in early adulthood. Journal of Adolescence, 97(2), 395–408. [Google Scholar] [CrossRef] [Scilit] [PubMed] [PubMed Central]
- O’Connor, R. C., & Kirtley, O. J. (2018). The integrated motivational-volitional model of suicidal behaviour. Philosophical Transactions of the Royal Society B: Biological Sciences, 373(1754), 20170268. [Google Scholar] [CrossRef] [Scilit] [PubMed] [PubMed Central]
- Page, M. J., McKenzie, J. E., Bossuyt, P. M., Boutron, I., Hoffmann, T. C., Mulrow, C. D., Shamseer, L., Tetzlaff, J. M., Akl, E. A., Brennan, S. E., Chou, R., Glanville, J., Grimshaw, J. M., Hróbjartsson, A., Lalu, M. M., Li, T., Loder, E. W., Mayo-Wilson, E., McDonald, S., … Moher, D. (2021). The PRISMA 2020 statement: An updated guideline for reporting systematic reviews. International Journal of Surgery, 88, 105906. [Google Scholar] [CrossRef] [PubMed]
- Reitsma, J. B., Glas, A. S., Rutjes, A. W., Scholten, R. J., Bossuyt, P. M., & Zwinderman, A. H. (2005). Bivariate analysis of sensitivity and specificity produces informative summary measures in diagnostic reviews. Journal of Clinical Epidemiology, 58(10), 982–990. [Google Scholar] [CrossRef] [Scilit] [PubMed]
- Schafer, K. M., Kennedy, G., Gallyer, A., & Resnik, P. (2021). A direct comparison of theory-driven and machine learning prediction of suicide: A meta-analysis. PLoS ONE, 16(4), e0249833. [Google Scholar] [CrossRef] [Scilit] [PubMed]
- Snell, K. I. E., Levis, B., Damen, J. A. A., Dhiman, P., Debray, T. P. A., Hooft, L., Reitsma, J. B., Moons, K. G. M., Collins, G. S., & Riley, R. D. (2023). Transparent reporting of multivariable prediction models for individual prognosis or diagnosis: Checklist for systematic reviews and meta-analyses (TRIPOD-SRMA). BMJ, 381, e073538. [Google Scholar] [CrossRef] [Scilit] [PubMed] [PubMed Central]
- Su, R. Y., John, J. R., & Lin, P. (2023). Machine learning-based prediction for self-harm and suicide attempts in adolescents. Psychiatry Research, 328, 115446. [Google Scholar] [CrossRef] [Scilit] [PubMed]
- van Vuuren, C. L., van Mens, K., de Beurs, D., Lokkerbol, J., van der Wal, M. F., Cuijpers, P., & Chinapaw, M. J. M. (2021). Comparing machine learning to a rule-based approach for predicting suicidal behavior among adolescents: Results from a longitudinal population-based survey. Journal of Affective Disorders, 295, 1415–1420. [Google Scholar] [CrossRef] [Scilit] [PubMed]
- World Health Organization. (2019). Adolescent health. Available online: https://www.who.int/health-topics/adolescent-health#tab=tab_1 (accessed on 20 September 2026).
- Yang, X., Wang, Y., Li, D., Zhao, L., Bao, Z., & Zhou, Z. (2013). School climate and adolescents’ suicidal ideation and suicide attempts: The mediating role of self-esteem. Psychological Development and Education, 29(5), 541–551. [Google Scholar]
- Yu, C., Ni, X., Liao, X., & Wang, H. (2025). Identifying predictors of suicidal ideation and suicidal attempt in early adolescents using machine learning. Journal of South China Normal University (Social Science Edition), 5, 113–125. [Google Scholar]

Disclaimer/Publisher’s Note: The statements, opinions and data contained in all publications are solely those of the individual author(s) and contributor(s) and not of MDPI and/or the editor(s). MDPI and/or the editor(s) disclaim responsibility for any injury to people or property resulting from any ideas, methods, instructions or products referred to in the content. |
© 2026 by the authors. Licensee MDPI, Basel, Switzerland. This article is an open access article distributed under the terms and conditions of the Creative Commons Attribution (CC BY) license.