


Abstract
Researchers have long known that scores from Likert-style self-report measures of psychological traits are affected by both item wording (negative and positive) and multiple sources of measurement error (specific-factor, transient, and random-response), but the magnitude of such effects is rarely separated and individually estimated within research studies. When these effects are not distinguished, as is the case when reporting conventional reliability estimates (e.g., alpha, omega, split-half, test–retest), they are confounded with trait variance and/or each other, typically resulting in overestimation of score accuracy. We demonstrate how to quantify and separate trait, wording, and multiple measurement error effects within extended bifactor models using data from a large sample of respondents (n = 1796) who completed the Physical Appearance subscale from the Self-Description Questionnaire-III on two occasions. Results revealed that models including item wording effects for both single and multiple occasion designs provided noticeably superior fits to the data in comparison to models excluding such effects, with item wording accounting for 8.5% to 8.8% of total score variance across designs. We further demonstrate how to extend analyses to the individual item level to identify items that are most and least affected by wording and measurement error effects and provide code in R to enable readers to apply these techniques to their own data.
1. Introduction
Handling item wording effects when using Likert-style self-report measures that contain a mixture of negatively and positively worded items has long been a challenge when interpreting results from such measures. When evaluating model fit using confirmatory factor analyses, common strategies for addressing item phrasing effects include correlating uniquenesses separately for negatively and positively worded items or adding separate orthogonal (i.e., uncorrelated) factors for such items to the model. However, when applying these techniques, the magnitude of wording effects is rarely reported or separated from key sources of measurement error that affect scores at either total or individual item levels.
To set the stage for methods discussed in this article in relation to these issues and align with our illustrations focusing on measures of self-perceptions, we begin by summarizing pertinent findings from Marsh et al. (2010) involving the Rosenberg Self-Esteem Scale (RSES; Rosenberg, 1965, 1989). The goal of the Marsh et al. study was to resolve longstanding questions about the factor structure of responses to the RSES. The three most common representations over the years have been: (1) a strictly unidimensional trait model encompassing all items regardless of phrasing, (2) a model with two separate correlated factors representing negatively and positively worded items, and (3) a unidimensional trait model in which wording effects are treated as nuisance variables by correlating uniquenesses separately for negatively and positively worded items or by including separate orthogonal factors for the trait of interest, negative wording, and positive wording. As already noted, the two models within the third category are common strategies used to address wording effects when testing for model fit, but they were not used in Marsh et al. or in most other studies to estimate the magnitude of trait, wording, and multiple sources of measurement error that can affect scores.
The primary analyses reported by Marsh et al. (2010) involved data taken from the Youth in Transition study (Bachman et al., 2002). Responses to the RSES were collected in waves at four points in time: (1) early 10th grade, (2) late 11th grade, (3) late 12th grade, and (4) one year after normal high school graduation. A variety of confirmatory factor models were analyzed at each time point and across the four waves of data that included the models previously described. At each separate time point, the strictly unidimensional model provided the poorest fit (CFIs ≤ 0.767, TLIs ≤ 0.700, RMSEAs ≥ 0.089) and the unidimensional models with correlated uniquenesses (CFIs ≥ 0.987, TLIs ≥ 0.976, RMSEAs ≤ 0.020) or separate orthogonal wording factors (CFIs ≥ 0.996, TLIs ≥ 0.956, RMSEAs ≤ 0.038) provided the best fits. For the most appropriately constrained longitudinal models, the strictly unidimensional model again fit worst (CFI = 0.859, TLI = 0.844, RMSEA = 0.038), and the unidimensional model with separate orthogonal wording factors fit best (CFI = 0.982, TLI = 0.979, RMSEA = 0.014). From these results, the researchers concluded that the factor structure of RSES scores is best represented by a substantive factor representing overall self-esteem and stable response style effects related to negative and positive item wording, thereby resolving longstanding questions about the factor structure of responses to the RSES. They further speculated that similar results are likely to be found with other self-report measures of psychological traits that include negatively and positively worded items.
In this article, we use data from the Physical Appearance subscale from the adult form of the Self-Description Questionnaire (SDQ-III; Marsh, 1992) to extend the most effective and relevant models for handling wording effects described by Marsh et al. (2010) to estimate proportions of total score variance accounted for by the targeted trait of interest, negative item wording, positive item wording, and multiple sources of measurement error that can affect scores from objectively scored self-report measures. We further show how those analyses can be used to identify items most and least prone to wording and measurement error effects and provide code in R to enable readers to apply these techniques. In sections to follow, we first describe techniques for handling single-occasion data, then move to multi-occasion data, and finally describe how the analyses can be extended to the individual item score level.
2. Background
2.1. Estimating Item Wording Effects Using Single-Occasion Designs
2.1.1. Designs Excluding Wording Effects
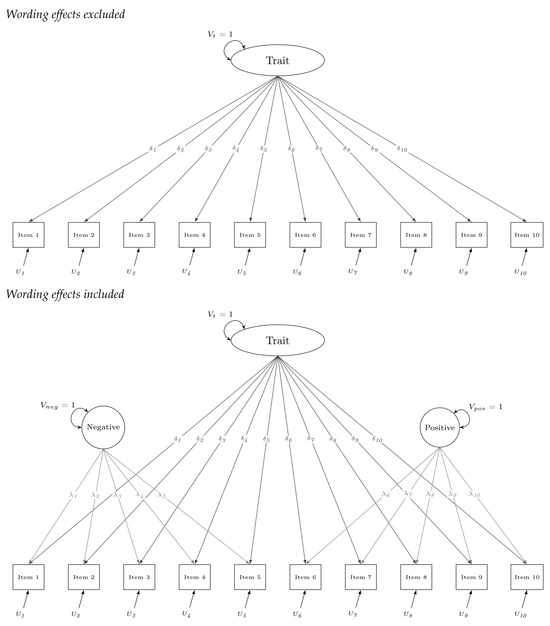
In the top diagram in Figure 1, we depict a unidimensional factor model for a self-report measure with ten items intended to measure a single trait. All items are linked to the trait factor, whose variance is set equal to one for identification and scaling purposes. In total, 20 key parameters are estimated that together represent factor loadings and uniquenesses for all items. Once these parameters are estimated, they can be placed in formulas in Table 1 to derive variance components for the targeted trait of interest and overall measurement error. These variance components, in turn, can be placed in formulas within Table 2 to estimate proportions of total score variance accounted for by trait and overall measurement error effects.
Figure 1.
Single-occasion factor models excluding and including item wording effects. Note. = trait variance; = negative wording factor variance; = positive wording factor variance; = loadings for the trait factor; = loadings for the negative wording factor; = loadings for the positive wording factor; = uniquenesses.
Table 1.
Formulas for estimating variance components within single and multiple occasion designs.
Table 2.
Formulas for partitioning proportions of total score variance within single-occasion designs.
2.1.2. Designs Including Wording Effects
To extend this unidimensional trait model to account for item wording effects, separate orthogonal factors are added for parcels of negatively and positively worded items as shown in the bottom diagram in Figure 1. Only negatively phrased items are linked to the negative wording factor, and only positively worded items are linked to the positive wording factor. This results in one additional factor loading being estimated for each item, and 30 key parameters estimated within the overall model depicted with variances for the trait and each wording factor again set equal to one for purposes of identification and scaling. Once these parameters are estimated, they can be placed in formulas within Table 1 to derive variance components for the trait of interest, negative item wording, positive item wording, and overall measurement error; and these components, in turn, can be placed into formulas in Table 2 to estimate proportions of total score variance accounted for by each effect. If wording parcels vary in numbers of items, their harmonic mean is substituted within the formulas for deriving the variance components described in Table 1 and later applied in Table 2 and Table 3. Examples of computing the relevant harmonic means are included in the notes to each table.
Table 3.
Formulas for partitioning proportions of total score variance within multiple-occasion designs.
In essence, the bottom diagram in Figure 1 represents a bifactor model (e.g., Holzinger & Harman, 1938; Holzinger & Swineford, 1937; Fang et al., 2021; Eid et al., 2018; Rodriguez et al., 2016; Vispoel et al., 2022; Vispoel et al., 2025) in which the targeted trait represents general factor effects, and types of item wording represent group factors. Such models allow for estimation of coefficients that represent proportions of variance explained by general factor effects, group factor effects, and/or both effects combined. In typical applications of bifactor models involving self-report measures, separate subscales within a trait hierarchy are analyzed with the overriding trait across subscales representing general factor effects and uncorrelated unique traits measured by each subscale representing group factor effects. In the present context, the targeted trait measured by a single subscale would represent general factor effects, and uncorrelated negatively and positively phrased item effects measured by corresponding item parcels would represent group factor effects. Total scores within such applications are equivalent to the sum or composite of item scores across the two item wording parcels. An omega hierarchical coefficient at the composite level would represent the proportion of total score variance accounted for by targeted trait effects alone, whereas an omega total coefficient would represent the proportion of total score variance accounted for by trait (general) and item wording (group) effects combined. Additional indices also can be derived to represent the proportion of total score variance accounted for solely by each type of item wording (see Table 2).
2.2. Estimating Item Wording Effects Within Multiple Occasion Designs
2.2.1. Designs Excluding Wording Effects
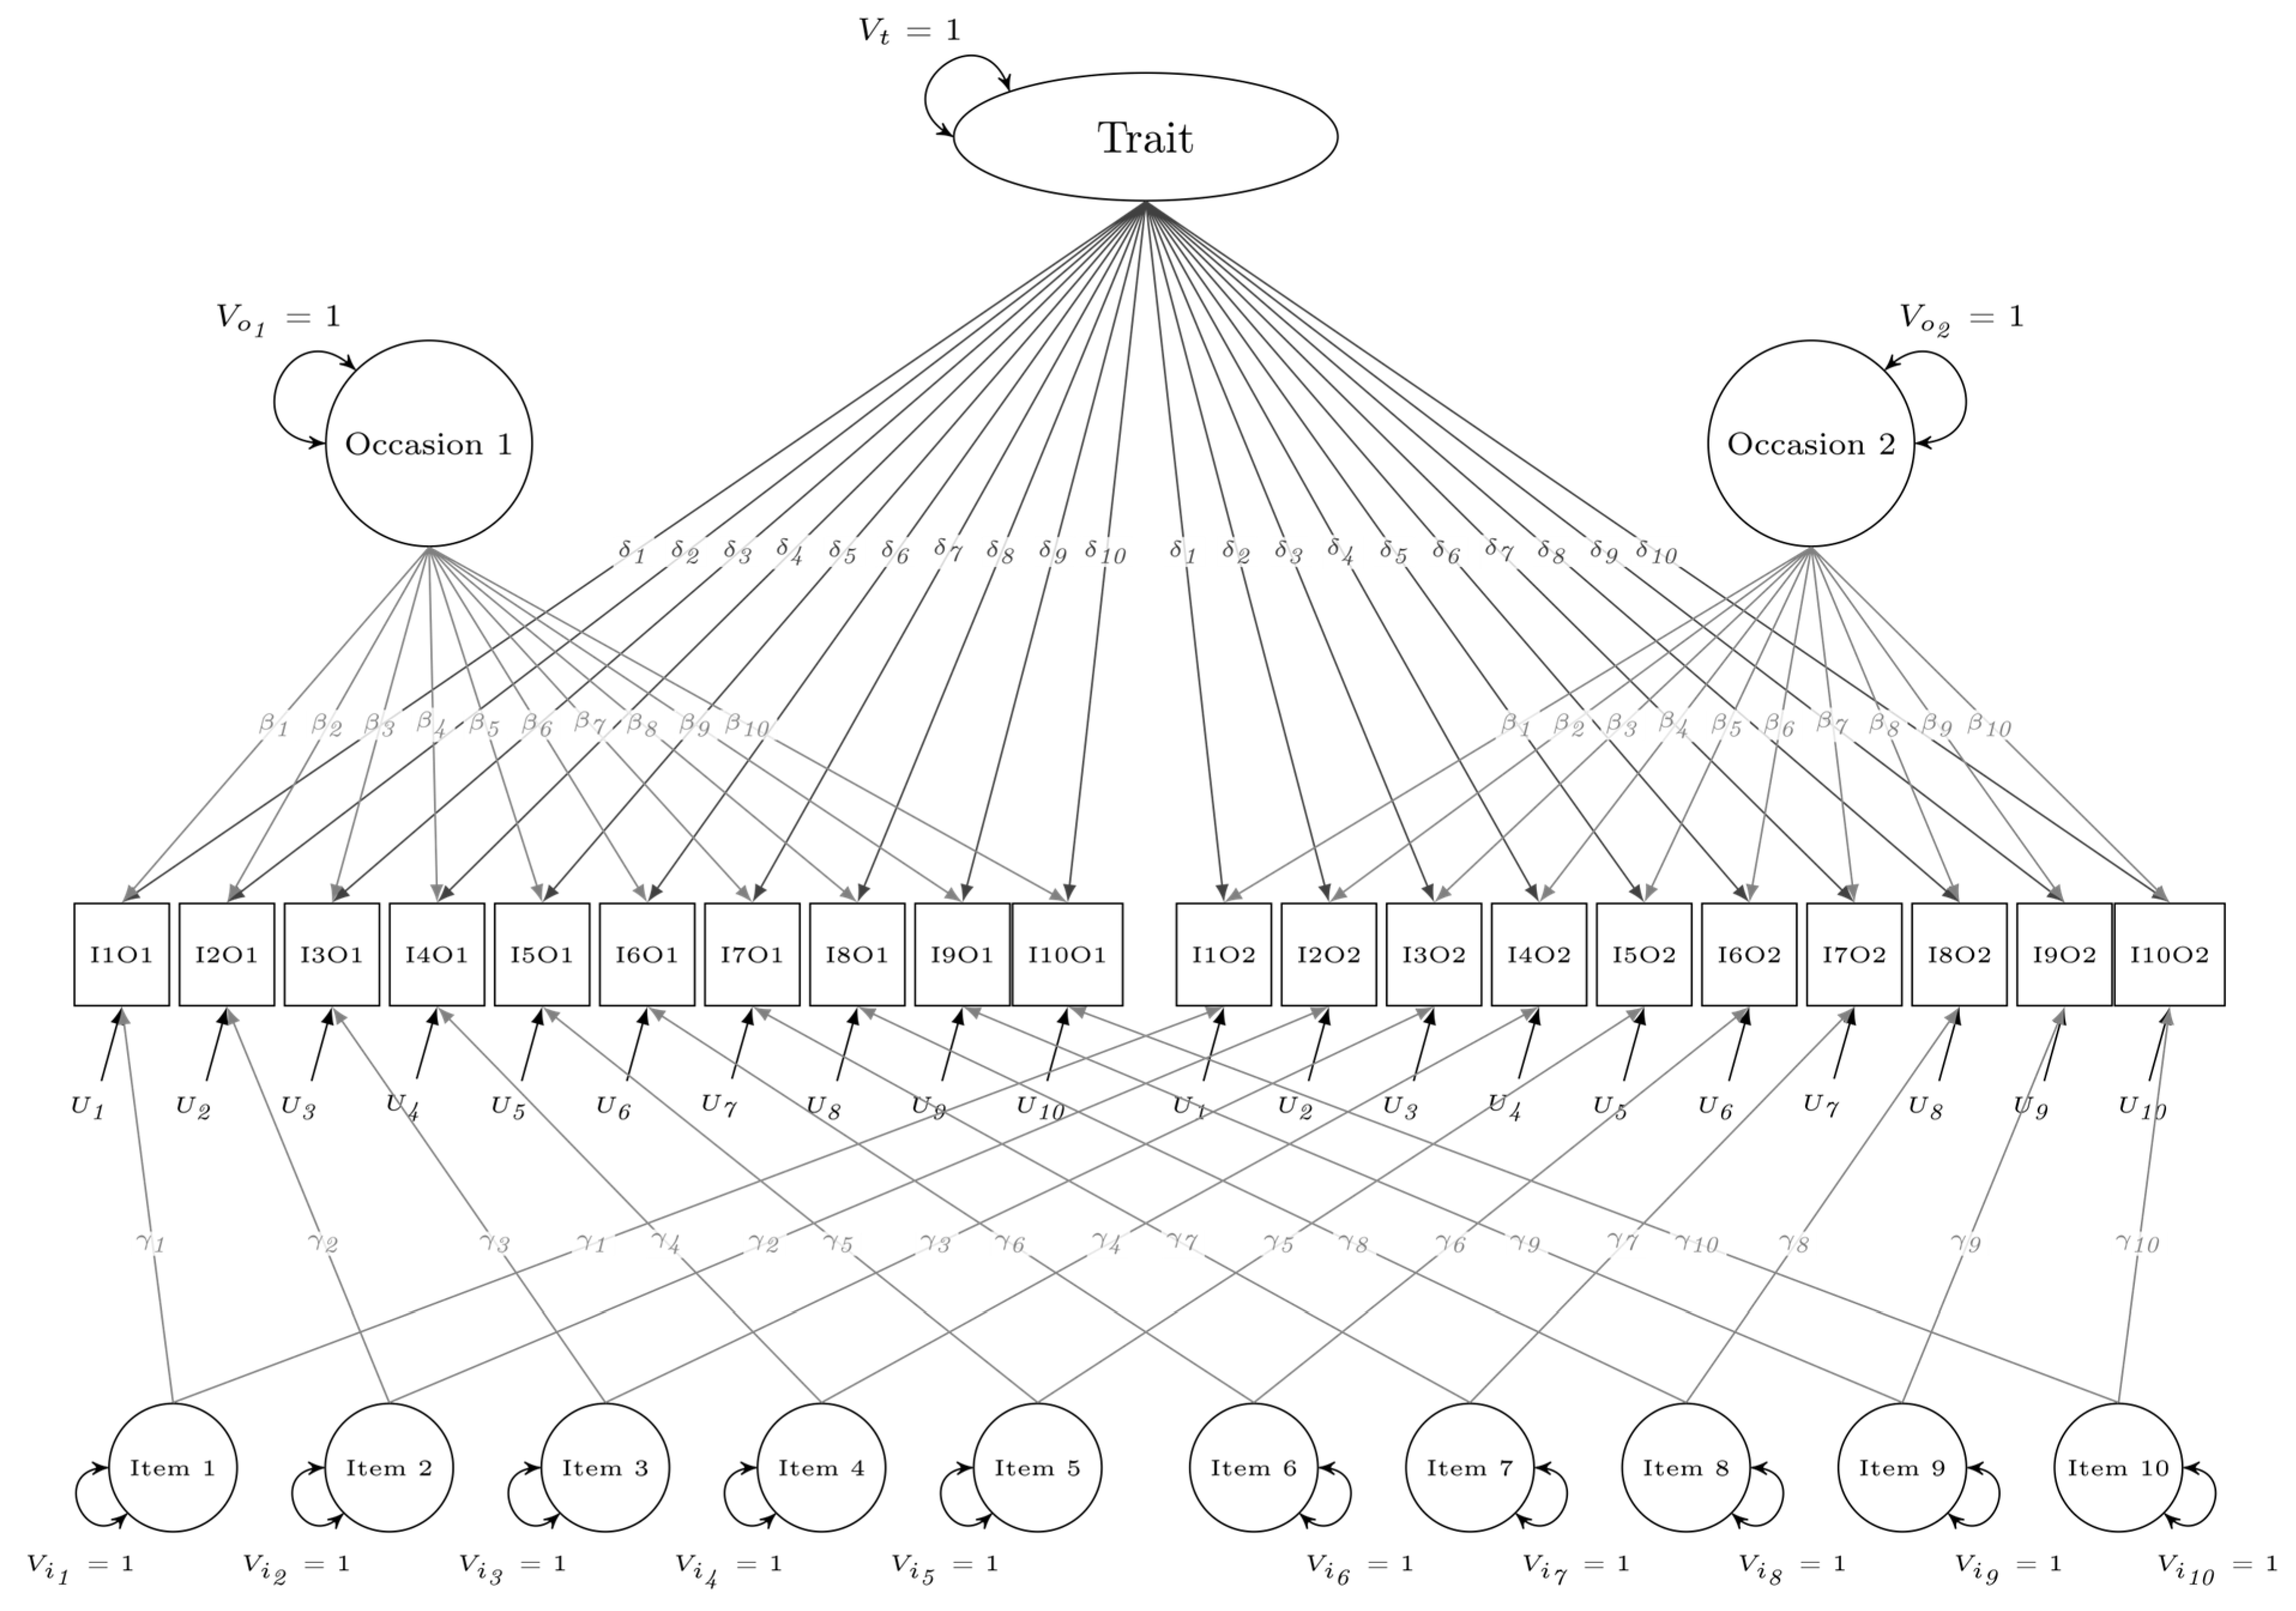
The primary limitations of single-occasion factor models are that (a) trait and state effects are confounded, and (b) key sources of measurement error are not separated and often confounded within measurement error terms. When measuring traits using objectively scored self-report measures, three sources of measurement error are most prominent: specific-factor or method effects related to items, transient error or state effects associated with occasions, and random-response and other error not captured by other effects in the model (see, e.g., Cronbach, 1947; Schmidt & Hunter, 1996; Schmidt et al., 2003; Steyer et al., 1992; Thorndike, 1951; Vispoel et al., 2018a, 2018b). In single-occasion research designs, trait and transient error effects are confounded as are specific-factor and random-response error effects, thereby typically leading to overestimates of score accuracy when reporting conventional alpha, omega, and split-half reliability estimates (Cronbach, 1947; Schmidt & Hunter, 1996; Schmidt et al., 2003; Steyer et al., 1992; Thorndike, 1951; Vispoel et al., 2018a, 2018b). To distinguish specific-factor and transient error from trait and unrelated error effects within a multiple occasion factor model design that excludes wording effects, additional item and occasion factors are added, with uniquenesses now representing error unrelated to trait, specific-factor error, or transient-error effects (i.e., random response error as described here).
This expanded model for two-occasion data is shown in Figure 2. All items on both occasions are linked to the trait factor, and separate factors are included for each item over both occasions and for each occasion over all items. Variances for the trait, item, and occasion factors are set equal to one, and trait factor loadings, item factor loadings, occasion factor loadings, and uniquenesses are allowed to vary within an occasion but not across occasions. Altogether, 40 key parameters are estimated compared to 20 for the corresponding single-occasion model. Variance components for trait, specific-factor error, transient error, and random-response error and the associated proportions of total score variance they account for can be estimated using the formulas provided in Table 1 and Table 3.
Figure 2.
Two-occasion factor model excluding item wording effects. Note. = trait variance; = Occasion 1 factor variance; = Occasion 2 factor variance; = Item 1–10 factor variances; = loadings for the trait factor; = loadings for the occasion factors; = loadings for the item factors; = uniquenesses.
2.2.2. Designs Including Wording Effects
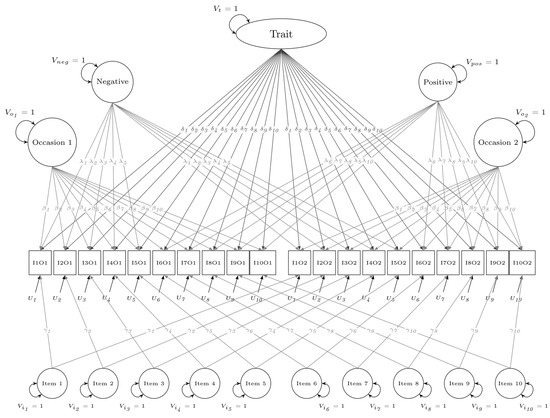
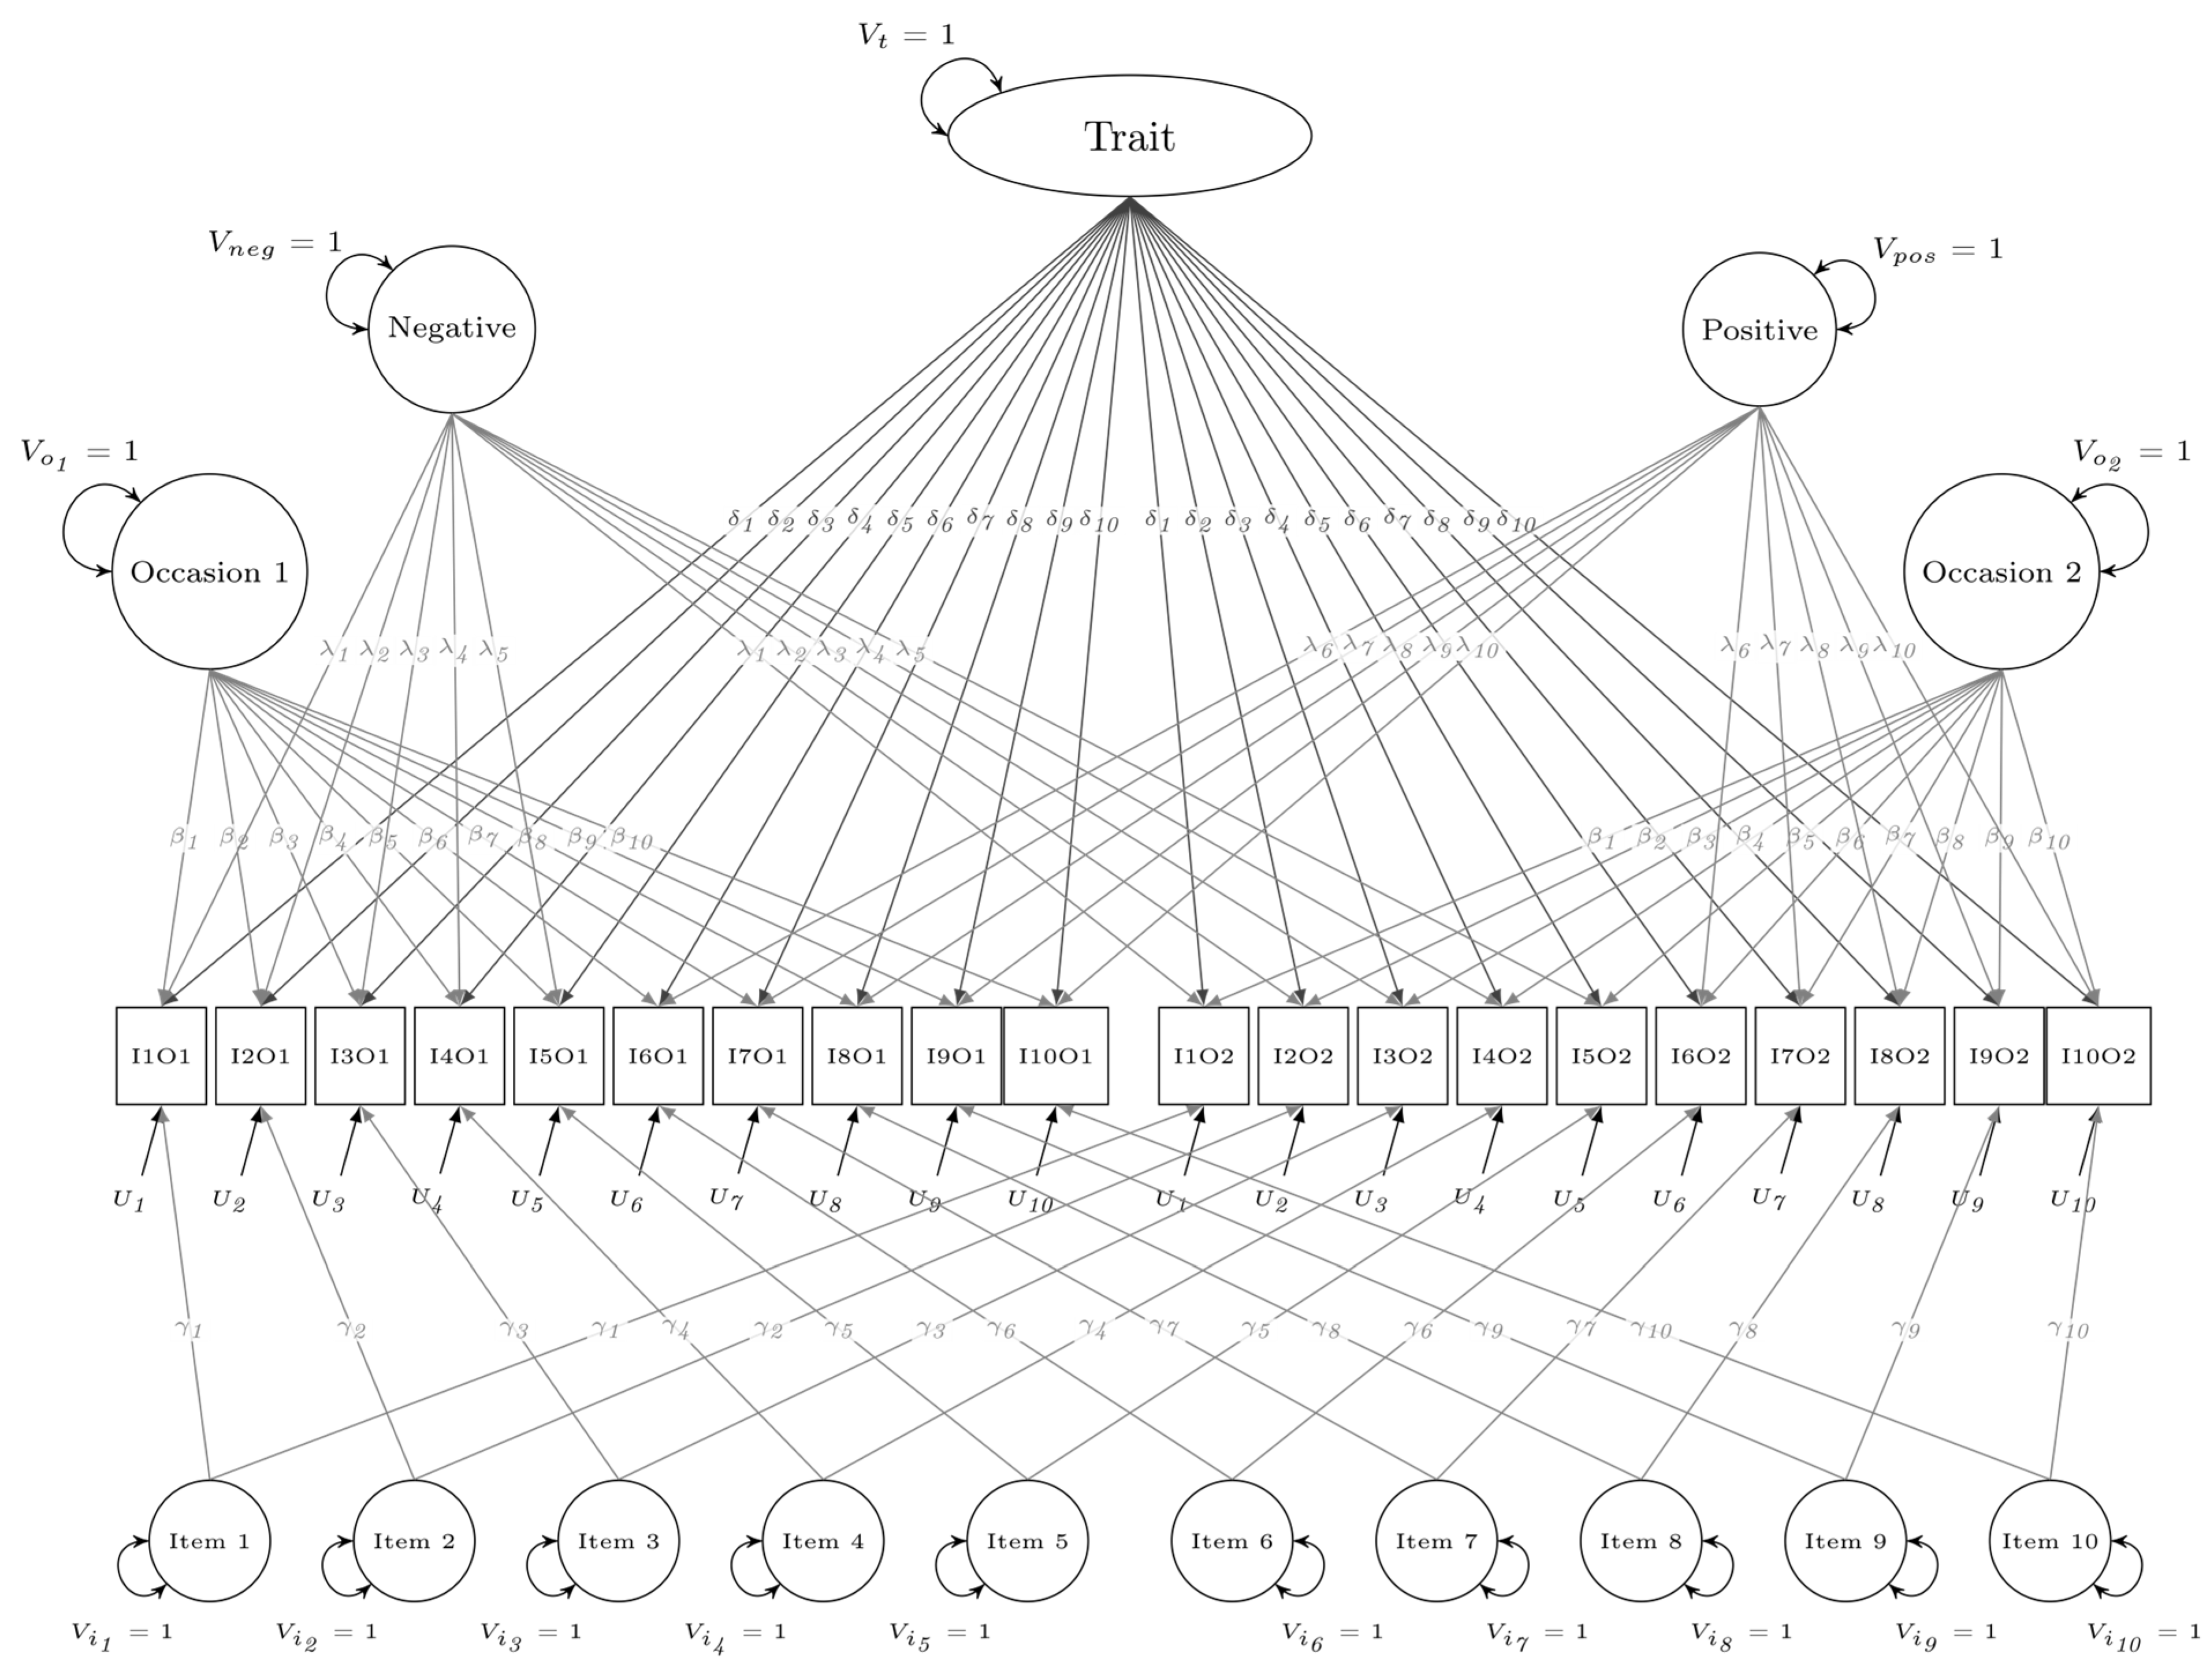
Extending the multi-occasion factor model design to include negative and positive item wording effects again entails adding separate orthogonal factors for each type of wording as shown in Figure 3. The negative and positive wording factors are linked only to relevantly worded items, with factor loadings allowed to vary across items but not across occasions and wording factor variances set equal to one. These modifications result in estimation of 10 additional key parameters or 50 in total compared to the previous model that excludes wording effects. Variance components for trait, item wording, and measurement error effects and the proportions of total score variance they explain again can be estimated from formulas appearing in Table 1 and Table 3.
Figure 3.
Two-occasion factor model including item wording effects. Note. = trait variance; = negative wording factor variance; = positive wording factor variance; = Occasion 1 factor variance; = Occasion 2 factor variance; = Item 1–10 factor variances; = loadings for the trait factor; = loadings for the negative wording factor; = loadings for the positive wording factor; = loadings for the occasion factors; = loadings for the item factors; = uniquenesses.
The two-occasion design with item wording effects included again can be conceptualized as a bifactor model with the trait of interest representing general factor effects and item wording parcels representing group factor effects. However, this model is further extended to allow for separation and quantification of effects for the three primary sources of measurement error affecting scores (specific-factor, transient, and random-response). At the total score level, an omega hierarchical coefficient can be derived to represent the proportion of variance accounted for solely by trait effects, and an omega total coefficient derived to represent trait and item wording effects combined. Additional coefficients also can be derived to represent the proportion of variance accounted for by each individual wording and measurement error effect (see Table 3).
2.3. Partitioning Variance at the Item Score Level
Because factor loadings within the present models can vary across items, partitioning of trait, item wording, and measurement error effects can be further extended to the item level. Such analyses can be extremely valuable in the development and revision of self-report measures in choosing items that represent large proportions of trait variance and small proportions of item wording and measurement error effects. We later show how this can be done using the Physical Appearance subscale from the SDQ-III (Marsh, 1992).
3. Purpose
Our primary goal in this article is to demonstrate how to estimate the magnitude of trait, item wording, and measurement error effects within one- and two-occasion designs when using self-report measures with Likert-style response metrics. We also provide fit tests for all models analyzed and examples of extending partitioning of effects to the item level. When testing and evaluating the present models, we would anticipate that the addition of factors for item wording effects will improve fit for both one- and two-occasion data and that score accuracy in measuring the targeted trait in relation to its proportion of explained total score variance will decrease whenever item wording and additional measurement error effects are estimated within a given model.
4. Methods
4.1. Respondent Sample, Procedures, and Measures
We collected data from 1796 students from a large Midwestern university (73% female; 68% Caucasian; Mage = 21.52) who completed computerized versions of the Self-Description Questionnaire-III (SDQ-III; Marsh, 1992; Vispoel, 2000; Vispoel et al., 2019) on two occasions, a week apart. The one-week interval between administrations was in keeping with that used in the seminal work of Schmidt et al. (2003) into quantifying specific-factor, transient, and random-response measurement errors when using self-report measures of psychological traits. The present study was pre-approved by the university’s Institutional Review Board (IRB; ID# 200809738), and all participants provided informed consent before responding. The SDQ-III consists of 136 items that measure overall self-esteem and twelve domain-specific aspects of self-concept that primarily fall within physical, social, academic, and moral sub-domains (see, e.g., Byrne, 1996; Marsh, 1987; Shavelson et al., 1976; Vispoel, 1995). For sake of brevity, we limit the analyses reported here to the Physical Appearance subscale that includes ten items that are equally balanced for negative and positive phrasing answered along an 8-point response metric (1 = Definitely False, 8 = Definitely True). Negatively phrased items are reverse scored when computing subscale total scores. We considered the Physical Appearance subscale to be a representative measure within the SDQ-III supported by strong evidence of reliability and validity in previous research (see, e.g., Marsh, 1992; Vispoel, 2000; Vispoel et al., 2019; Byrne, 1996; Marsh, 1987; Vispoel, 1995).
4.2. Analyses
Preliminary analyses include estimates of subscale means, standard deviations, conventional alpha reliability coefficients (Cronbach, 1951), and conventional omega reliability coefficients (McDonald, 1970, 1978, 1999) for each occasion, as well as test–retest coefficients across occasions. The main analyses for single-occasion designs encompass model-fit tests excluding and including item wording effects and partitioning of total score variance. The corresponding procedures for the two-occasion designs include these same analyses but with separation of effects for multiple sources of measurement error. We also extend partitioning to the individual item level for designs that include trait, wording, and measurement error effects. Key analyses were conducted using the psych (Revelle, 2025) and lavaan (Rosseel, 2012; Rosseel et al., 2025) packages in R. In keeping with Marsh et al. (2010), we ran factor analyses for the one- and two-occasion designs using robust maximum likelihood estimates (MLR in lavaan) to anchor results to the original observed score metric that users would apply in practical applications of self-concept scores and to adjust fit indices for possible departures from normality. We considered diagonally weighted least squares (DWLS; WLSMV in R) estimation as an alternative, but that approach converts results to a hypothetical continuous, equal-interval latent-response metric rather than the original observed-score metric on which the reliability and variance-partitioning indices described here are defined. Reporting such indices as though they describe observed-score reliability has been criticized in the psychometric literature (e.g., Chalmers, 2018, on the limited usefulness of ordinal alpha). Estimation routines in generalizability theory (Cronbach et al., 1963, 1972), the framework upon which our partitioning indices extend, have historically relied on (co)variance-based estimators comparable to unweighted least squares (ULS) rather than ML-based estimators, but restricted maximum likelihood is now commonly used within that tradition as well, in part to eliminate negative variance-component estimates. These two approaches generally converge closely except in such boundary cases. We accordingly retain MLR here, consistent with Marsh et al. (2010), who used the same estimator with the RSES despite that scale having even fewer (five) response options than the 8-point format used here. (See Rhemtulla et al., 2012 for further recommendations concerning when categorical data can be treated as continuous.)
We evaluated model fit using general guidelines suggested by Hu and Bentler (1998, 1999) and Yu (2002) with adequate fits represented by comparative fit (CFI) and Tucker–Lewis (TLI) indices greater than or equal to 0.90 and root mean square errors of approximation (RMSEAs) less than or equal to 0.08, and with good to excellent fits represented by CFIs and TLIs greater than or equal to 0.95 and RMSEAs less than or equal to 0.06. Nonetheless, the suggested cut-offs serve only as rough guidelines (Marsh et al., 2004, 2005) with the fit indexes reported here being used primarily for comparative purposes in gauging the importance of integrating item wording and multiple measurement error effects into the models.
5. Results
We summarize the results in three ways: first, by providing descriptive statistics and conventional reliability estimates (Section 5.1); then, by comparing model fit and total-score variance partitioning for models that exclude versus include item wording effects (Section 5.2 and Section 5.3); and finally, by extending variance partitioning to the individual item level to identify items most and least affected by wording and measurement error (Section 5.2 and Section 5.3).
5.1. Descriptive Statistics and Conventional Reliability Estimates
Table 4 includes means, standard deviations, and conventional reliability coefficients for the Physical Appearance subscale. Using the item metric for sake of comparison, average endorsement of items is above the scale midpoint of 4.5 (Ms = 5.21 and 5.25) with good variability (SDs = 1.27 and 1.30) within each occasion. Single occasion internal reliability estimates for the two occasions respectively equal 0.921 and 0.932 for alphas and equal 0.922 and 0.932 for omegas with the one-week test–retest coefficient equal to 0.925. In general, these results are highly congruent with recent studies in which computerized forms of the SDQ-III were administered on one or two occasions to similar samples of college students (see, e.g., Vispoel et al., 2019, 2023).
Table 4.
Descriptive statistics and conventional reliability coefficients.
5.2. Single-Occasion Designs
Model fit indices in Table 5 reveal that the single-occasion design with wording effects provides an adequate and noticeably better fit to the data than the corresponding design excluding those effects (CFI = 0.966 vs. 0.829, TLI = 0.939 vs. 0.780, RMSEA = 0.078 vs. 0.148), thereby emphasizing the importance of systematically accounting for item wording. Total score partitioning results in Table 6 indicate that including wording effects reduces the magnitude of trait and total error effects with negative and positive wording effects, respectively, accounting for proportions of 0.044 and 0.043 of explained total score variance. To determine which items are most and least responsible for these effects, we provide item-level partitioning results in Table 7. If items with the highest proportions of trait variances coupled with lowest proportions of wording variance are considered most desirable, the results in Table 7 indicate that Items 1 and 6 are most effective in this regard, and Items 3 and 10 least effective.
Table 5.
Fit indices for one- and two-occasion designs.
Table 6.
Partitioning of SDQ-III Physical Appearance total score variance for one-occasion designs without and with item wording effects.
Table 7.
Single-occasion item-level partitioning for the SDQ-III Physical Appearance subscale.
5.3. Two-Occasion Designs
In keeping with the single-occasion designs, the fit for the two-occasion design is better when wording effects are included rather than excluded (CFI = 0.971 vs. 0.897, TLI = 0.965 vs. 0.885, RMSEA = 0.048 vs. 0.087). Accounting for measurement error effects in the two-occasion design that ignores wording effects compared to the corresponding single-occasion design without such effects does improve model fit (CFI = 0.897 vs. 0.829, TLI = 0.885 vs. 0.780, RMSEA = 0.087 vs. 0.148) but still does not reach an adequate level overall. In contrast, the two-occasion design with wording effects provides an excellent fit (CFI = 0.971, TLI = 0.965, RMSEA = 0.048). Total score partitioning for the two-occasion designs excluding and including wording effects shown in Table 8 both highlight the importance of separating and accounting for multiple sources of measurement error, with respective proportions of explained total score variance equal to 0.034 and 0.022 for specific-factor error, 0.057 and 0.044 for transient error, and 0.033 and 0.032 for random-response error. As in the previous one-occasion design, proportions of negative (0.046) and positive (0.040) wording effects on total score variance are noteworthy and serve to reduce associated proportions of trait and overall measurement error effects.
Table 8.
Partitioning of SDQ-III Physical Appearance total score variance for two-occasion designs without and with item wording effects.
Item-level partitioning results for the two-occasion design with wording effects provided in Table 9 expand those from the associated one-occasion design to show proportions of individual sources of measurement error in addition to trait and wording effects at that level. Ideally, the best items for self-concept measures would represent large proportions of trait variance coupled with small proportions of wording and individual measurement error effects. Based on those criteria, Items 1 and 6 once again appear to be most effective for these purposes and Items 3 and 10 least effective.
Table 9.
Two-occasion item-level partitioning for the SDQ-III Physical Appearance subscale.
6. Discussion
Our goal in this article was to demonstrate how to quantify trait, item wording, and measurement error effects with Likert-style self-report measures that include a mixture of negatively and positively worded items using a representative subscale from the SDQ-III (Marsh, 1992). Within both single- and multiple-occasion designs, inclusion of wording effects noticeably improved model fit while reducing proportions of trait and overall measurement error effects. In general, these findings highlight the importance of accounting for wording effects and how they are confounded with trait and/or measurement error effects when those effects are ignored. Such confounding in the present analyses of single-occasion data, in turn, led to overestimation of score accuracy primarily because transient error and item wording effects were intertwined with targeted trait effects. The results further highlighted the importance of using multiple occasion designs to (a) account for multiple sources of measurement error, (b) eliminate confounding of trait, measurement error, and wording effects, (c) provide an alternative mechanism for evaluating score reliability and construct validity, and (d) serve as a tool for choosing appropriate items in the process of developing and revising measures.
Accordingly, we encourage researchers to use the design depicted in Figure 3 whenever possible because that design allows for separation and estimation of trait, negative wording, positive wording, specific-factor error, transient error, and random-response error effects at both total and individual item score levels. Such analyses are valuable not only for providing better estimates of score accuracy but also for diagnosing the best ways to improve measures. At the total score level, specific-factor error can be reduced by adding additional items, transient error by pooling results over additional occasions, and random-response error by doing either or both. Item-level analyses allow for further precision in improving measures by identifying items most prone to wording and individual measurement error effects.
The single-occasion design represented in the bottom diagram in Figure 1 is also valuable in estimating proportions of total score variance accounted for by trait and wording effects to understand how accurately total scores measure the targeted trait and the extent to which trait effects are confounded with wording and overall measurement effects when wording effects are ignored. The main drawback to such designs is that transient error (i.e., state) effects are treated as trait variance, thereby typically inflating reliability estimates and undermining accurate interpretations of construct validity. These designs also fail to distinguish individual sources of measurement error that can provide useful insights into the best ways to improve measures.
When considering future applications, we emphasize to readers that we encountered no missing data or convergence problems within the analyses reported here. To deal with missing data, R provides a wide variety of pre-analysis procedures including mice (van Buuren & Groothuis-Oudshoorn, 2022), Amelia II (Honaker et al., 2011, 2022), and missForest (Stekhoven, 2022). These packages implement different multiple-imputation approaches that generate plausible values for missing observations, resulting in multiple completed datasets for subsequent analysis. If omitted responses are assumed to be missing at random, pre-analysis procedures can be avoided altogether by using full information maximum likelihood or Bayesian estimation methods.
Bifactor models in general are also sometimes prone to yielding counterintuitive results and/or non-convergence problems (Eid et al., 2017). Bayesian estimation methods again might be applied to reduce these problems (see, e.g., Vispoel et al., 2022; Muthén & Asparouhov, 2012; Liang, 2020; Liang & Yang, 2014; van de Schoot & Depaoli, 2014; Hong, 2022; Hong et al., 2024) or using scale minus one (S − 1) or scale indicator minus one (SI − 1) procedures suggested by Eid et al. (2017). The latter two procedures do reduce problems of non-convergence and counterintuitive results but alter the nature of constructs being measured and typically are not configured to subdivide measurement error into multiple sources. A more recent alternative suggested by Vispoel et al. (2026) that addresses all issues mentioned here simultaneously is to handle wording effects within a multiple occasion generalizability theory-based bifactor model framework. The primary difference between their procedures and the ones applied here is that interpretations are focused on the broader domains from which items and occasions are drawn rather than the specific ones sampled within a given study. Finally, the correlated uniqueness model strategy used by Marsh et al. (2010) described earlier also generally converges well but confounds item wording and measurement error variance (Marsh et al., 2010; Vispoel et al., 2026; Marsh & Bailey, 1991), thereby defeating the goal of the present analyses.
When reviewing the results reported here, we caution readers to interpret them in relation to the single participant sample upon which results were based that consisted of predominantly Caucasian and female college students and inclusion of scores for the single measure used for sake of illustration. These results are further bounded by our focus on a single ten-item subscale administered in an 8-point Likert-type response format with a one-week interval between occasions. Measures with different item counts, coarser or finer response scales, or different retest intervals may show varying proportions of wording and measurement-error variance, and these variations contribute to open empirical questions for future research. Although noteworthy effects were observed for both negatively and positively worded items within the present measure, such effects may not generalize to other Likert-style self-report measures that include a mixture of negatively and positively worded items. For example, in a recent follow-up study to Marsh et al. (2010) using the RSES (Rosenberg, 1965, 1989), a one-week interval between administrations, and students similar to those sampled here, Vispoel et al. (2024) found that negative wording, positive wording, specific-factor error, transient error, and random-response error, respectively, accounted for 6.3%, 0.7%, 1.9%, 7.4%, and 4.8% of total score variance in contrast to 4.6%, 4.0%, 2.2%, 4.4%, and 3.2% within the parallel design analyzed here.
When applying the techniques demonstrated here in future research, additional insights into item wording effects might be gained by examining measures with varying numbers of response options, alternative descriptors for scale points, non-proportionate representations of negative and positive phrased items, and including constructs targeted at psychological states in addition to traits. Of particular importance in such research is to apply these techniques to participant samples and measures commonly administered to younger individuals and those with weaker reading skills given that researchers have found stronger wording effects within those populations (see, e.g., Marsh, 1986; Corwyn, 2000; Schmitt & Allik, 2005; Gnambs & Schroeders, 2020; Bulut & Bulut, 2022). To facilitate such applications, we provide code in R for analyzing the present designs within our online Supplementary Materials and hope that readers will take advantage of these resources to better understand the psychometric properties of scores from self-report measures and to identify situations in which item wording effects and particular sources of measurement error are of special concern.
Supplementary Materials
The following supporting information can be downloaded at https://www.mdpi.com/article/10.3390/bs16091636/s1, Supplementary Materials File S1: Instructional Online Supplement to Quantifying Effects of Item Wording and Multiple Sources of Measurement Error Using Extended Bifactor Models. Table S.1. Formulas for variance components within single and multiple occasion designs; Table S.2. Formulas for partitioning proportions of total score variance within single-occasion designs; Table S.3. Formulas for partitioning proportions of total score variance within multiple-occasion designs; Figure S3.1. Single-occasion design without wording effects; Figure S3.2. Single-occasion design with wording effects; Figure S4.1. Two-occasion design without wording effects; Figure S4.2. Two-occasion design with wording effects.
Author Contributions
Conceptualization, W.P.V., H.L. and T.C.; Methodology, W.P.V., H.L. and T.C.; Software, H.L.; Validation, W.P.V., H.L. and T.C.; Formal analysis, H.L.; Investigation, W.P.V., H.L. and T.C.; Resources, W.P.V.; Data curation, W.P.V. and H.L.; Writing—original draft, W.P.V.; Writing—review and editing, W.P.V., H.L. and T.C.; Visualization, W.P.V., H.L. and T.C.; Supervision, W.P.V.; Project administration, W.P.V.; Funding acquisition, W.P.V. All authors have read and agreed to the published version of the manuscript.
Funding
This project received internal university research assistant support from the Iowa Testing Programs.
Institutional Review Board Statement
The study was conducted in accordance with the Declaration of Helsinki and most recently approved by the University of Iowa Institutional Review Board (ID# 200809738) on 26 January 2026.
Informed Consent Statement
All participants provided informed consent before completing the questionnaires administered in this study.
Data Availability Statement
The dataset used in this study is not readily available due to Institutional Review Board restrictions. Inquiries about accessibility to the data should be forwarded to the lead author.
Conflicts of Interest
The authors declare no conflicts of interest.
References
- Bachman, J. G., Kahn, R. L., Mednick, M. T., Davidson, T. N., & Johnston, L. D. (2002). Youth in transition, volume I: Blueprint for a longitudinal study of adolescent boys (ICPSR 3505). Inter-University Consortium for Political and Social Research.
- Bulut, H. C., & Bulut, O. (2022). Item wording effects in self-report measures and reading achievement: Does removing careless respondents help? Studies in Educational Evaluation, 72, 101126. [Google Scholar] [CrossRef] [Scilit]
- Byrne, B. M. (1996). Measuring self-concept across the life span: Methodological issues and selected instrumentation. American Psychological Association. [Google Scholar]
- Chalmers, R. P. (2018). On misconceptions and the limited usefulness of ordinal alpha. Educational and Psychological Measurement, 78(6), 1056–1071. [Google Scholar] [CrossRef] [Scilit] [PubMed]
- Corwyn, R. F. (2000). The factor structure of global self-esteem among adolescents and adults. Journal of Research in Personality, 34(4), 357–379. [Google Scholar] [CrossRef] [Scilit]
- Cronbach, L. J. (1947). Test “reliability”: Its meaning and determination. Psychometrika, 12(1), 1–16. [Google Scholar] [CrossRef] [Scilit] [PubMed]
- Cronbach, L. J. (1951). Coefficient alpha and the internal structure of tests. Psychometrika, 16(3), 297–334. [Google Scholar] [CrossRef] [Scilit]
- Cronbach, L. J., Gleser, G. C., Nanda, H., & Rajaratnam, N. (1972). The dependability of behavioral measurements: Theory of generalizability for scores and profiles. Wiley. [Google Scholar]
- Cronbach, L. J., Rajaratnam, N., & Gleser, G. C. (1963). Theory of generalizability: A liberalization of reliability theory. British Journal of Statistical Psychology, 16(2), 137–163. [Google Scholar] [CrossRef] [Scilit]
- Eid, M., Geiser, C., Koch, T., & Heene, M. (2017). Anomalous results in G-factor models: Explanations and alternatives. Psychological Methods, 22(3), 541–562. [Google Scholar] [CrossRef] [Scilit] [PubMed]
- Eid, M., Krumm, S., Koch, T., & Schulze, J. (2018). Bifactor models for predicting criteria by general and specific factors: Problems of nonidentifiability and alternative solutions. Journal of Intelligence, 6(3), 42. [Google Scholar] [CrossRef] [Scilit] [PubMed]
- Fang, G., Guo, J., Xu, X., Ying, Z., & Zhang, S. (2021). Identifiability of bifactor models. Statistica Sinica, 31, 2309–2330. [Google Scholar] [CrossRef] [Scilit]
- Gnambs, T., & Schroeders, U. (2020). Cognitive abilities explain wording effects in the Rosenberg Self-Esteem Scale. Assessment, 27(2), 404–418. [Google Scholar] [CrossRef] [Scilit] [PubMed]
- Holzinger, K. J., & Harman, H. H. (1938). Comparison of two factorial analyses. Psychometrika, 3(1), 45–60. [Google Scholar] [CrossRef] [Scilit]
- Holzinger, K. J., & Swineford, F. (1937). The bi-factor method. Psychometrika, 2(1), 41–54. [Google Scholar] [CrossRef] [Scilit]
- Honaker, J., King, G., & Blackwell, M. (2011). Amelia II: A program for missing data. Journal of Statistical Software, 45(7), 1–47. [Google Scholar] [CrossRef] [Scilit]
- Honaker, J., King, G., & Blackwell, M. (2022). Amelia: A program for missing data (R package version 1.8.1). Available online: https://cran.r-project.org/web/packages/Amelia/index.html (accessed on 19 August 2026).
- Hong, H. (2022). Finding optimal factor analytic representations of the structure of personality [Doctoral dissertation, University of Iowa]. [Google Scholar]
- Hong, H., Vispoel, W. P., & Martinez, A. (2024). Applying SEM, exploratory SEM, and Bayesian SEM to personality assessments. Psych, 6, 111–134. [Google Scholar] [CrossRef] [Scilit]
- Hu, L., & Bentler, P. M. (1998). Fit indices in covariance structure modeling: Sensitivity to underparameterized model misspecification. Psychological Methods, 3(4), 424–453. [Google Scholar] [CrossRef]
- Hu, L., & Bentler, P. M. (1999). Cutoff criteria for fit indexes in covariance structure analysis: Conventional criteria versus new alternatives. Structural Equation Modeling, 6(1), 1–55. [Google Scholar] [CrossRef] [Scilit]
- Jorgensen, T. D., Pornprasertmanit, S., Schoemann, A. M., & Rosseel, Y. (2026). semTools: Useful tools for structural equation modeling (R package version 0.5-9). Available online: https://CRAN.R-project.org/package=semTools (accessed on 19 August 2026).
- Liang, X. (2020). Prior sensitivity in Bayesian structural equation modeling for sparse factor loading structures. Educational and Psychological Measurement, 80(6), 1025–1058. [Google Scholar] [CrossRef] [Scilit] [PubMed]
- Liang, X., & Yang, Y. (2014). An evaluation of WLSMV and Bayesian methods for confirmatory factor analysis with categorical indicators. International Journal of Quantitative Research in Education, 2(1), 17–38. [Google Scholar] [CrossRef] [Scilit]
- MacKinnon, D. P., Lockwood, C. M., & Williams, J. (2004). Confidence limits for the indirect effect: Distribution of the product and resampling methods. Multivariate Behavioral Research, 39(1), 99–128. [Google Scholar] [CrossRef] [Scilit] [PubMed]
- Marsh, H. W. (1986). Negative item bias in ratings scales for preadolescent children: A cognitive-developmental phenomenon. Developmental Psychology, 22(1), 37–49. [Google Scholar] [CrossRef]
- Marsh, H. W. (1987). The hierarchical structure of self-concept and the application of hierarchical confirmatory factor analysis. Journal of Educational Measurement, 24(1), 17–39. [Google Scholar] [CrossRef] [Scilit]
- Marsh, H. W. (1992). Self-Description Questionnaire (SDQ) III: A theoretical and empirical basis for the measurement of multiple dimensions of late adolescent self-concept. An interim test manual and research monograph. University of Western Sydney. [Google Scholar]
- Marsh, H. W., & Bailey, M. (1991). Confirmatory factor analysis of multitrait–multimethod data: A comparison of the behavior of alternative models. Applied Psychological Measurement, 15(1), 47–70. [Google Scholar] [CrossRef] [Scilit]
- Marsh, H. W., Hau, K., & Grayson, D. (2005). Goodness of fit in structural equation models. In A. Maydeu-Olivares, & J. J. McArdle (Eds.), Contemporary psychometrics (pp. 275–340). Erlbaum. [Google Scholar]
- Marsh, H. W., Hau, K.-T., & Wen, Z. (2004). In search of golden rules: Comment on hypothesis-testing approaches to setting cutoff values for fit indexes and dangers in overgeneralizing Hu and Bentler’s (1999) findings. Structural Equation Modeling, 11(3), 320–341. [Google Scholar] [CrossRef] [Scilit] [PubMed]
- Marsh, H. W., Scalas, L. F., & Nagengast, B. (2010). Longitudinal tests of competing factor structures for the Rosenberg Self-Esteem Scale: Traits, ephemeral artifacts, and stable response styles. Psychological Assessment, 22(2), 366–381. [Google Scholar] [CrossRef] [Scilit] [PubMed]
- McDonald, R. P. (1970). The theoretical foundations of principal factor analysis, canonical factor analysis, and alpha factor analysis. British Journal of Mathematical and Statistical Psychology, 23(1), 1–21. [Google Scholar] [CrossRef] [Scilit]
- McDonald, R. P. (1978). Generalizability in factorable domains: “Domain validity and generalizability”. Educational and Psychological Measurement, 38(1), 75–79. [Google Scholar] [CrossRef] [Scilit]
- McDonald, R. P. (1999). Test theory: A unified treatment. Erlbaum. [Google Scholar]
- Muthén, B., & Asparouhov, T. (2012). Bayesian structural equation modeling: A more flexible representation of substantive theory. Psychological Methods, 17(3), 313–335. [Google Scholar] [CrossRef] [Scilit] [PubMed]
- Preacher, K. J., & Selig, J. P. (2012). Advantages of Monte Carlo confidence intervals for indirect effects. Communication Methods and Measures, 6(2), 77–98. [Google Scholar] [CrossRef] [Scilit]
- Revelle, W. (2025). psych: Procedures for psychological, psychometric, and personality research (R package version 2.5.6). Available online: https://cran.r-project.org/web/packages/psych/index.html (accessed on 19 August 2026).
- Rhemtulla, M., Brosseau-Liard, P. É., & Savalei, V. (2012). When can categorical variables be treated as continuous? A comparison of robust continuous and categorical SEM estimation methods under suboptimal conditions. Psychological Methods, 17(3), 354–373. [Google Scholar] [CrossRef] [Scilit] [PubMed]
- Rodriguez, A., Reise, S. P., & Haviland, M. G. (2016). Correction to: Evaluating bifactor models: Calculating and interpreting statistical indices. Psychological Methods, 21(2), 137–150. [Google Scholar] [CrossRef] [Scilit] [PubMed]
- Rosenberg, M. (1965). Society and the adolescent self-image. Princeton University Press. [Google Scholar]
- Rosenberg, M. (1989). Society and the adolescent self-image (Rev. ed.). Wesleyan University Press. [Google Scholar]
- Rosseel, Y. (2012). lavaan: An R package for structural equation modeling. Journal of Statistical Software, 48(2), 1–36. [Google Scholar] [CrossRef] [Scilit]
- Rosseel, Y., Jorgensen, T. D., & De Wilde, L. (2025). lavaan: Latent variable analysis (R package version 0.6-21). Available online: https://cran.r-project.org/web/packages/lavaan/lavaan.pdf (accessed on 19 August 2026).
- Schmidt, F. L., & Hunter, J. E. (1996). Measurement error in psychological research: Lessons from 26 research scenarios. Psychological Methods, 1(2), 199–223. [Google Scholar] [CrossRef]
- Schmidt, F. L., Le, H., & Ilies, R. (2003). Beyond alpha: An empirical investigation of the effects of different sources of measurement error on reliability estimates for measures of individual differences constructs. Psychological Methods, 8(2), 206–224. [Google Scholar] [CrossRef] [Scilit] [PubMed]
- Schmitt, D. P., & Allik, J. (2005). Simultaneous administration of the Rosenberg Self-Esteem Scale in 53 nations: Exploring the universal and culture-specific features of global self-esteem. Journal of Personality and Social Psychology, 89(4), 623–642. [Google Scholar] [CrossRef] [Scilit] [PubMed]
- Shavelson, R. J., Hubner, J. J., & Stanton, G. C. (1976). Self-concept: Validation of construct interpretations. Review of Educational Research, 46(3), 407–441. [Google Scholar] [CrossRef] [Scilit] [PubMed]
- Stekhoven, D. J. (2022). missForest: Nonparametric missing value imputation using random forest (R package version 1.5). Available online: https://cran.r-project.org/web/packages/missForest/index.html (accessed on 19 August 2026).
- Steyer, R., Ferring, D., & Schmitt, M. J. (1992). States and traits in psychological assessment. European Journal of Psychological Assessment, 8(2), 79–98. [Google Scholar]
- Thorndike, R. L. (1951). Reliability. In E. F. Lindquist (Ed.), Educational measurement (pp. 560–620). American Council on Education. [Google Scholar]
- van Buuren, S., & Groothuis-Oudshoorn, K. (2022). mice: Multivariate imputation by chained equations (R package version 3.15.0). Available online: https://cran.r-project.org/web/packages/mice/index.html (accessed on 19 August 2026).
- van de Schoot, R., & Depaoli, S. (2014). Bayesian analyses: Where to start and what to report. The European Health Psychologist, 16(2), 75–84. Available online: https://www.ehps.net/ehp/index.php/contents/article/view/ehp.v16.i2.p75 (accessed on 19 August 2026).
- Vispoel, W. P. (1995). Self-concept in artistic domains: An extension of the Shavelson, Hubner, and Stanton (1976) model. Journal of Educational Psychology, 87(1), 134–153. [Google Scholar] [CrossRef]
- Vispoel, W. P. (2000). Computerized versus paper-and-pencil assessment of self-concept: Score comparability and respondent preferences. Measurement and Evaluation in Counseling and Development, 33(3), 130–143. [Google Scholar] [CrossRef] [Scilit]
- Vispoel, W. P., Hong, H., & Lee, H. (2024). Benefits of doing generalizability theory analyses within structural equation modeling frameworks: Illustrations using the Rosenberg Self-Esteem Scale [Teacher’s corner]. Structural Equation Modeling, 31(1), 165–181. [Google Scholar] [CrossRef] [Scilit]
- Vispoel, W. P., Hong, H., Lee, H., & Chen, T. (2026). Estimating item wording effects in self-report measures with generalizability theory-based SEMs: Illustrations using the Self-Description Questionnaire-III. Journal of Personality Assessment, 108(5), 597–613. [Google Scholar] [CrossRef] [Scilit] [PubMed]
- Vispoel, W. P., Lee, H., & Chen, T. (2025). Structural equation modeling approaches to estimating score dependability within generalizability theory-based univariate, multivariate, and bifactor designs. Mathematics, 13(6), 1001. [Google Scholar] [CrossRef] [Scilit]
- Vispoel, W. P., Lee, H., Chen, T., & Hong, H. (2023). Using structural equation modeling to reproduce and extend ANOVA-based generalizability theory analyses for psychological assessments. Psych, 5(2), 249–273. [Google Scholar] [CrossRef] [Scilit]
- Vispoel, W. P., Lee, H., Xu, G., & Hong, H. (2022). Expanding bifactor models of psychological traits to account for multiple sources of measurement error. Psychological Assessment, 34(12), 1093–1111. [Google Scholar] [CrossRef] [Scilit] [PubMed]
- Vispoel, W. P., Morris, C. A., & Kilinc, M. (2018a). Applications of generalizability theory and their relations to classical test theory and structural equation modeling. Psychological Methods, 23(1), 1–26. [Google Scholar] [CrossRef] [Scilit] [PubMed]
- Vispoel, W. P., Morris, C. A., & Kilinc, M. (2018b). Practical applications of generalizability theory for designing, evaluating, and improving psychological assessments. Journal of Personality Assessment, 100(1), 53–67. [Google Scholar] [CrossRef] [Scilit] [PubMed]
- Vispoel, W. P., Morris, C. A., & Sun, L. (2019). Computerized and traditional administration of questionnaires: Psychometric quality and completion time for measures of self-concept. Journal of Experimental Education, 87(3), 384–399. [Google Scholar] [CrossRef] [Scilit]
- Yu, C. Y. (2002). Evaluating cutoff criteria of model fit indices for latent variable models with binary and continuous outcomes [Unpublished doctoral dissertation, University of California]. [Google Scholar]

Disclaimer/Publisher’s Note: The statements, opinions and data contained in all publications are solely those of the individual author(s) and contributor(s) and not of MDPI and/or the editor(s). MDPI and/or the editor(s) disclaim responsibility for any injury to people or property resulting from any ideas, methods, instructions or products referred to in the content. |
© 2026 by the authors. Licensee MDPI, Basel, Switzerland. This article is an open access article distributed under the terms and conditions of the Creative Commons Attribution (CC BY) license.