


Abstract
Food noise refers to persistent and intrusive thoughts about food that may interfere with daily functioning, emotional well-being, and eating behaviors. Although the construct has gained increasing attention in clinical and research contexts, no psychometrically sound tools are currently available in Italian to assess food noise. Therefore, the present study aimed to translate, adapt, and evaluate the psychometric properties of the Italian version of the Food Noise Questionnaire (FNQ). A total of 1087 participants (mean age 37.45 ± 10.35 years; 50.6% female) were enrolled in the investigation. Participants completed the Italian version of the FNQ, along with a convergent measure of food-related preoccupation and self-report measures of depressive symptoms, anxiety symptoms, and perceived stress. Confirmatory factor analysis supported a unidimensional factor structure for the FNQ, with salient standardized factor loadings (range = 0.803–0.919) and strong internal-consistency reliability (categorical ω = 0.917). Evidence of convergent validity was provided by strong associations with food-related preoccupation (r = 0.831, p < 0.001), whereas discriminant validity was supported by smaller, yet significant, correlations with anxiety, depression, and perceived stress (r range = 0.350 to 0.417, p < 0.001). In addition, configural, metric, and scalar invariance across gender was established within a multi-group framework. These findings provide evidence for the FNQ as a reliable and valid measure of food noise in the Italian adult population, demonstrating robust psychometric properties and gender-invariant measurement.
1. Introduction
Obesity is a multifactorial chronic condition characterized by an excess of adipose tissue, in which cognitive and emotional aspects of eating behavior play a significant role, including persistent and intrusive thoughts about food that can impact daily functioning and weight management (Heymsfield & Wadden, 2017). Food noise has been defined as repetitive, unwanted food-related mental activity that may interfere with attention, mood, and eating behavior (Diktas et al., 2025; Hayashi et al., 2023). This construct has recently been conceptualized within the broader framework of food cue reactivity, and proposed as a distinct, measurable phenomenon (Boswell & Kober, 2016; Hayashi et al., 2023; Kanoski & Boutelle, 2022). Within the broader literature on eating-related constructs, food noise shows partial overlap with, but remains conceptually distinct from, constructs such as food craving, food preoccupation, and attentional bias toward food-related stimuli. While food craving typically refers to the motivational and affective desire to consume specific foods (Cepeda-Benito et al., 2000), and food preoccupation captures the frequency and salience of food-related thoughts (Tapper & Pothos, 2010), food noise emphasizes the intrusive, repetitive, and often uncontrollable nature of such cognitions, as well as their perceived impact on daily functioning. Moreover, these cognitive processes can be situated within broader frameworks of food cue reactivity and cognitive load, which have been linked to dysregulated eating behaviors and increased attentional capture by food-related stimuli (Boswell & Kober, 2016; Higgs, 2015). In addition, emerging evidence suggests that eating-related cognitions may interact with higher-order psychological constructs such as internalized weight stigma, which has been associated with psychological distress, disordered eating, and reduced quality of life (e.g., Zagaria et al., 2023). From this perspective, food noise may represent a specific cognitive mechanism at the intersection of cue reactivity, perseverative cognition, and affective vulnerability.
In the context of health psychology, increasing attention has been devoted to cognitive processes that mediate the relationship between environmental food exposure, internal states, and eating behavior. Contemporary food environments are characterized by the constant availability and salience of highly palatable foods, which may promote persistent cognitive engagement with food-related cues (Hayashi et al., 2023; Kanoski & Boutelle, 2022; Swinburn et al., 2011). From this perspective, intrusive food-related thoughts can be conceptualized as a psychological mechanism through which environmental stimuli interact with individual vulnerability factors, such as reward sensitivity, emotion regulation difficulties, and learned eating patterns (May et al., 2010; Tapper & Pothos, 2010). These cognitive processes may contribute to maladaptive eating behaviors not only by influencing food intake directly, but also by increasing psychological burden, attentional capture, and emotional distress in daily life (Boswell & Kober, 2016; Higgs, 2015; Ward & Mann, 2000).
Despite its growing relevance, food noise has only recently been operationalized through the development of the Food Noise Questionnaire (FNQ; Diktas et al., 2025), a brief five-item self-report measure assessing the frequency and impact of intrusive food-related thoughts. In the original validation study (Diktas et al., 2025), the FNQ demonstrated a unidimensional structure, high internal consistency (Cronbach’s α = 0.93), test–retest reliability over a 7-day interval (r = 0.79), as well as evidence of convergent validity with a convergent measure of food-related preoccupation and discriminant validity with respect to stress, anxiety, and depressive symptoms.
However, to the best of our knowledge, no Italian version of the FNQ is currently available. Given the growing scientific relevance of the food noise construct and the lack of a measure in Italian-speaking populations, the present study aimed to translate, culturally adapt, and examine the psychometric properties of the FNQ in a general Italian adult sample. Specifically, the study aimed to examine the dimensionality of the scale, hypothesizing a unidimensional structure in line with Diktas et al. (2025), as well as its internal consistency and convergent and discriminant validity. With regard to construct validity, it was expected that the pattern observed in the original validation study would be replicated (Diktas et al., 2025), with strong correlations with a convergent measure of food-related preoccupation and smaller, yet significant, correlations with anxiety, stress, and depressive symptoms.
2. Materials and Methods
2.1. Study Design and Procedure
The present study is part of a larger observational research project aimed at investigating subjective cognitive experiences related to eating behavior in the Italian adult population, with a specific focus on intrusive food-related thoughts.
A cross-sectional design was adopted, and data were collected through an anonymous, online survey hosted on Google Form platform. Participants were recruited via social media platforms, and participation was voluntary with no incentives. Data were collected between 1 October and 30 November 2025. Prior to accessing the online survey, participants provided electronic informed consent after being informed about the study aims, procedures, data handling, and anonymity. The survey required approximately 10 min to complete. Attention check items (e.g., simple factual questions such as “What is the capital of Italy?”) were included to identify careless responding.
The study protocol was approved by the Ethics Committee of eCampus University (approval number 13/2025), and all procedures were conducted in accordance with the Declaration of Helsinki.
2.2. Participants
Inclusion criteria were being 18 years of age or older, being a native Italian speaker, and providing informed consent; no exclusion criteria were applied. Sample size determination followed two criteria. First, to evaluate the dimensionality and internal consistency of the scale, a minimum ratio of 10 participants per item was adopted, corresponding to a minimum sample size of 50 participants (De Vet et al., 2011). Second, an a priori power analysis suggested that 193 participants were required to detect a practically significant correlation (ρ = 0.20) with 80% power at a significance level of α = 0.05 (Ferguson, 2009).
A total of 1087 participants were thus enrolled. Of these, 49.4% were male and 50.6% were female. The mean age was 37.45 years (SD = 10.35), with an age range of 18 to 78 years. Regarding educational level, 23.6% of participants had completed high school, 54.6% held a university degree, 20.1% had completed postgraduate studies, and 1.7% had a middle-school diploma. In terms of relationship status, 39.4% reported being in a relationship, 28.2% were married, 28.2% were single, 3.9% were divorced, and 0.4% were widowed. The mean body mass index (BMI) was 25.24 kg/m2 (SD = 5.43).
2.3. Measures
2.3.1. Socio-Demographic Variables
Participants reported socio-demographic information using a standardised form, including age, gender, education, relationship status and self-reported height and weight.
2.3.2. Italian Food Noise Questionnaire (FNQ)
Food noise was assessed using the FNQ (Diktas et al., 2025). The scale consists of five items designed to assess intrusive food-related thoughts. Items are rated on a five-point Likert scale ranging from 0 (strongly disagree) to 4 (strongly agree). The questionnaire instructions were as follows: “Please answer these questions by reflecting on your thoughts over the last 2 weeks only.” A total score is obtained by summing item responses, with higher scores indicating greater levels of food noise.
The translation process followed established guidelines for the cross-cultural adaptation of self-report and patient-reported outcome instruments (i.e., forward and back-translation procedure) (Beaton et al., 2000; Wild et al., 2005; Kulis et al., 2011; Zagaria et al., 2022). First, two Italian researchers with expertise in the target construct and in psychological assessment independently translated the original English version of the FNQ into Italian. The two translations were then compared and reconciled into a single Italian version. This version was subsequently back-translated into English by an English-speaking researcher who was blinded to the original version in order to identify and resolve conceptual inconsistencies. Finally, the Italian version was pilot-tested in a sample of 15 participants from the target population to assess the clarity of the items; no issues were reported, and no further revisions were required.
The Italian version of the FNQ can be requested by emailing the corresponding author.
2.3.3. Food Cravings Questionnaire—Trait (FCQ-T)
Trait-level food craving was assessed using the Food Cravings Questionnaire–Trait (FCQ-T) (Cepeda-Benito et al., 2000). Specifically, the Thoughts subscale was administered in order to capture thoughts and preoccupation with food and to provide evidence for the convergent validity of the FNQ (Innamorati et al., 2014). This subscale consists of 7 items, rated on a 6-point Likert scale ranging from never (1) to always (6) (e.g., “I find myself preoccupied with food”). Omega coefficient in the present sample was 0.939, highlighting excellent internal consistency.
2.4. Psychological Distress
Symptoms of anxiety and depression were assessed using the Generalized Anxiety Disorder–7 (GAD-7) (Shevlin et al., 2022) and the Patient Health Questionnaire–9 (PHQ-9) (Shevlin et al., 2022), respectively. The GAD-7 is a seven-item self-report questionnaire assessing generalized anxiety symptoms experienced over the past two weeks, with items rated on a 4-point Likert scale ranging from 0 (not at all) to 3 (nearly every day). The PHQ-9 is a nine-item self-report measure assessing depressive symptoms over the past two weeks, using the same 4-point response format. Omega coefficients in the present sample were 0.896 and 0.862 for GAD-7 and PHQ-9, respectively, indicating strong internal consistency.
Perceived stress was assessed using the Perceived Stress Scale (PSS) (Mondo et al., 2021), a 10-item self-report instrument that assesses the extent to which situations in one’s life are appraised as stressful. Items are rated on a 5-point Likert scale ranging from 0 (never) to 4 (very often). Omega coefficient in the present sample was 0.894, suggesting good internal consistency.
2.5. Data Analyses
Data were analyzed using jamovi (version 2.6.26) and the R package lavaan (Rosseel, 2012). First, descriptive statistics for each item of the FNQ were computed, including mean, standard deviation, skewness, and kurtosis. To determine the most appropriate estimator for the confirmatory factor analysis (CFA), the distributional properties of the items were examined. Specifically, skewness and kurtosis values within the range of −1 to +1 were considered indicative of negligible deviations from univariate normality (Muthén & Kaplan, 1985).
The factor structure of the FNQ was subsequently examined through CFA. Consistent with the original structure proposed by Diktas and colleagues (2025), a unidimensional measurement model was tested. Model fit was evaluated using multiple goodness-of-fit indices (Wang & Wang, 2019): the Comparative Fit Index (CFI) and Tucker–Lewis Index (TLI), with values ≥ 0.90 indicating acceptable fit; the Standardized Root Mean Square Residual (SRMR), with values ≤ 0.08 indicating acceptable fit; and the Root Mean Square Error of Approximation (RMSEA), with values ≤ 0.08 indicating acceptable fit.
Measurement invariance across gender was further assessed using multi-group CFA (MG-CFA) via the stepwise procedure proposed by Meredith (Meredith, 1993), i.e., by sequentially testing nested models including configural invariance (same pattern of free and fixed factor loadings across groups), metric invariance (equality of factor loadings across groups), and scalar invariance (equality of item thresholds across groups). The adequacy of invariance constraints was evaluated by comparing nested models and examining changes in fit indices. Following established guidelines (Cheung & Rensvold, 2002; Chen, 2007), decreases in CFI greater than 0.01 and increases in RMSEA greater than 0.015 were considered indicative of a lack of invariance. All CFA models were estimated using the diagonally weighted least squares (DWLS) estimator with a polychoric correlation matrix, which is recommended for ordinal response data (e.g., Li, 2016).
Internal consistency reliability of the FNQ was assessed using omega coefficients designed for ordered categorical indicators (Green & Yang, 2009), which is considered more robust than Cronbach’s alpha due to less restrictive measurement assumptions, e.g., omega does not require essentially tau-equivalence (Flora, 2020). Omega values ≥ 0.70 were interpreted as evidence of satisfactory internal consistency (Hair et al., 2019).
Finally, construct validity of the scale was examined by calculating zero-order correlation coefficients between FNQ scores and the Thoughts subscale of the FCQ-T, as well as with measures of depressive symptoms (PHQ-9), anxiety symptoms (GAD-7), and perceived stress (PSS). Evidence of convergent and discriminant validity was inferred based on the magnitude and direction of these associations.
3. Results
3.1. Item-Level Descriptive Statistics
Item-level descriptive statistics are reported in Table 1. All response categories of the Likert-type scale were endorsed at least once (range = 0–4). Item means ranged from 1.137 to 1.779. Skewness and kurtosis values ranged from −1.048 to 0.772, indicating negligible departures from univariate normality, as most values fell within the ±1 range (Muthén & Kaplan, 1985). Given that item responses are scored on an ordered categorical scale and considering their distributional properties, the diagonally weighted least squares (DWLS) estimator was employed for the subsequent CFAs using a polychoric correlation matrix (Li, 2016).
Table 1.
Item-level descriptive statistics. Abbreviation: SD, standard deviation.
3.2. Factor Structure
A one-factor CFA model was specified, showing an overall acceptable fit to the data: χ2(5) = 58.509 (p < 0.001), RMSEA = 0.099, CFI = 0.998, TLI = 0.996, and SRMR = 0.035. Although the RMSEA value exceeded conventional cut-offs (Wang & Wang, 2019), indicating suboptimal fit, this index is highly sensitive to model degrees of freedom (df) and may overstate misfit when df are low (Kenny et al., 2015; Shi et al., 2022). As noted by Kenny et al. (2015, p. 503), “using the RMSEA to assess the model fit in models with small df is problematic and potentially misleading” and researchers are advised “not to dismiss models with large RMSEA values with small df without examining other information”; accordingly, RMSEA should be interpreted cautiously in the present model where df = 5 (Kenny et al., 2015; Taasoobshirazi & Wang, 2016; Shi et al., 2022). On the other hand, the incremental fit indices (CFI, TLI) and the residual-based index (SRMR) indicated an excellent fit to the data, thus supporting the unidimensional solution (Hu & Bentler, 1999).
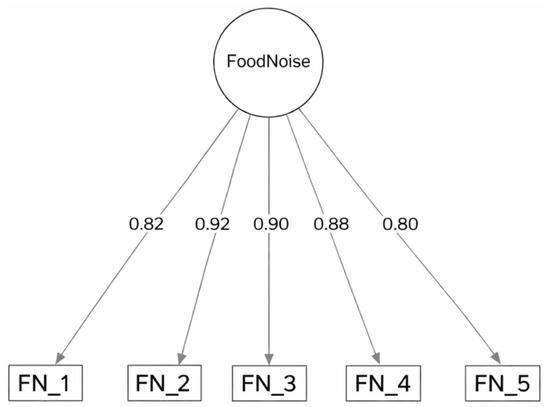
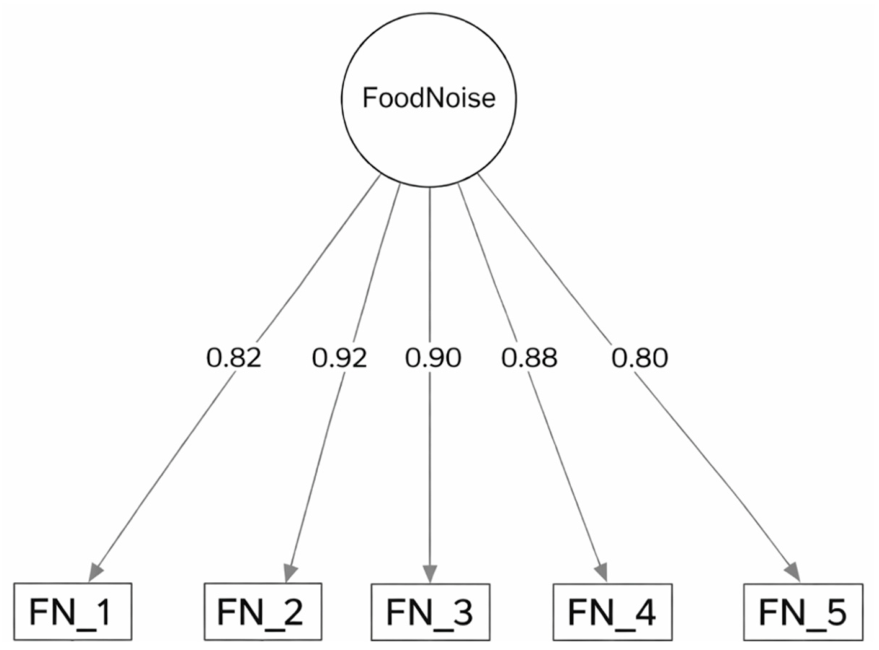
Importantly, the standardized factor loadings of the CFA model were uniformly high, ranging from 0.803 to 0.919 (M = 0.864, SD = 0.050; p < 0.001) and attesting to a substantial proportion of common variance among the indicators. The average variance extracted (AVE) was 0.748, indicating that more than half of the variance in the indicators was accounted for by the construct, exceeding the recommended threshold of 0.50 (Hair et al., 2019).
Detailed results are presented in Figure 1.
Figure 1.
Completely standardized factor loadings from the one-factor confirmatory factor analysis (CFA) model. All factor loadings were statistically significant (p < 0.001). Abbreviation: FN = food noise.
3.3. Factorial Invariance Tests Across Gender
Factorial invariance tests across gender (males vs. females) were carried out using multiple-group confirmatory factor analysis (MG-CFA). The one-factor model examined simultaneously in males and females (i.e., configural invariance), without imposing any constraints, showed an acceptable overall fit to the data: χ2 (10) = 63.546 (p < 0.001), RMSEA = 0.099, CFI = 0.998, TLI = 0.996, SRMR = 0.038. Afterwards, equality constraints were imposed on factor loadings and item thresholds, and no meaningful decline in model fit was observed (ΔCFI < 0.010 and ΔRMSEA < 0.015), supporting both metric and scalar invariance models across gender, respectively. Detailed results are reported in Table 2.
Table 2.
Factorial invariance tests across gender. Note: Models were estimated using diagonally weighted least squares (DWLS).
3.4. Reliability and Validity
The categorical omega coefficient was 0.917, indicating excellent internal consistency reliability of the FNQ total score. Regarding construct validity, convergent validity was supported by an expected large correlation between FNQ and the thoughts subscale of the FCQ-T (r = 0.831, p < 0.001). By contrast, discriminant validity was supported by moderate correlations between FNQ and symptoms of anxiety, depression, and perceived stress, as measured by the GAD-7 (r = 0.350, p < 0.001), PHQ-9 (r = 0.417, p < 0.001), and PSS (r = 0.376, p < 0.001), respectively. Lastly, a moderate positive correlation was observed between FNQ scores and BMI (r = 0.310, p < 0.001).
Descriptive statistics of the psychometric measures are reported in Table 3.
Table 3.
Descriptive statistics (mean, standard deviation, range, skewness, and kurtosis) for Food Noise (FNQ), food-related preoccupation (FCQ-T), depressive symptoms (PHQ-9), anxiety symptoms (GAD-7), and perceived stress (PSS). Abbreviations: FNQ = Food Noise Questionnaire; FCQ-T = Food Craving Questionnaire (Thoughts subscale); PHQ-9 = Patient Health Questionnaire–9; GAD-7 = Generalized Anxiety Disorder–7; PSS = Perceived Stress Scale; SD = Standard Deviation.
4. Discussion
The present study aimed to translate, culturally adapt, and examine the psychometric properties of the Italian version of the FNQ among an adult sample. Overall, the findings support the FNQ as a reliable tool for assessing intrusive food-related thoughts, highlighting a unidimensional structure, strong internal consistency, and theory-consistent associations with convergent measures of food-related preoccupation, as well as anxiety, depression and perceived stress symptom scores.
More specifically, confirmatory factor analysis supported a one-factor structure, consistent with the original conceptualization of the FNQ (Diktas et al., 2025). All items displayed substantial standardized factor loadings, indicating that they contributed meaningfully to a single latent dimension (range 0.80 to 0.92). Importantly, MG-CFA across gender supported configural, metric, and scalar invariance models. These results indicate that the Italian version of the FNQ has the same pattern of free and fixed loadings in males and females and that factor loadings and item thresholds are comparable across gender groups. These results allow meaningful gender-based comparisons of FNQ scores in clinical and research settings, such as latent mean comparisons.
Crucially, the Italian version of the FNQ showed excellent internal consistency (categorical ω = 0.917), suggesting that approximately 92% of the variance in the total score is attributable to true score variance (Flora, 2020). Evidence for construct validity was obtained through bivariate Pearson’s correlation coefficients. Specifically, convergent validity was supported by a strong association between the FNQ and the Thoughts subscale of the FCQ-T (r = 0.83), which assesses a closely related construct of preoccupation with food (Innamorati et al., 2014). The strength of this association indicates that approximately 69% of the variance was shared between the two measures, suggesting a close interrelationship. In contrast, associations between the FNQ and measures of anxiety, depressive symptoms, and perceived stress were smaller in magnitude, yet statistically significant. This pattern is consistent with theoretical expectations and aligns with the original validation study (Diktas et al., 2025), supporting the discriminant validity of the FNQ and indicating that food noise, while related to general psychological distress, represents a distinct construct. Furthermore, the moderate association observed between FNQ and BMI is consistent with evidence showing that food noise is commonly reported among individuals with obesity, with up to 57% endorsing such experiences, thus supporting a plausible positive association (Dhurandhar et al., 2025).
From a broader perspective, these findings contribute to the growing literature on the cognitive dimensions of eating behavior. The availability of a validated Italian instrument will allow for more systematic investigation of food noise in both clinical and non-clinical populations. In particular, the FNQ may be useful for exploring the role of intrusive food-related thoughts in conditions characterized by dysregulated eating, obesity, or heightened food cue reactivity, as well as for evaluating changes associated with psychological or pharmacological interventions. Food noise may be conceptualized as an index of sustained cognitive engagement with food-related cues, reflecting heightened food cue reactivity and increased cognitive load in everyday environments (Boswell & Kober, 2016; Hayashi et al., 2023; Kanoski & Boutelle, 2022; Ward & Mann, 2000; Higgs, 2015). A growing body of literature indicates that enhanced food cue reactivity and attentional capture by food-related stimuli are associated with dysregulated eating patterns, greater subjective hunger, emotional distress, and difficulties in self-regulation, independently of body weight or the presence of formal eating disorder diagnoses (Boswell & Kober, 2016; Ward & Mann, 2000; Higgs, 2015). Persistent intrusive food-related thoughts may therefore represent a clinically relevant source of cognitive and emotional burden, with potential implications for daily functioning, quality of life, and adherence to health-related behavior change (May et al., 2010; Tapper & Pothos, 2010). In this context, the availability of the FNQ may be particularly useful for identifying individuals experiencing elevated food-related cognitive load and for monitoring changes associated with psychological interventions targeting eating-related cognitions and emotion regulation, as well as pharmacological treatments known to reduce food cue responsivity and appetitive drive (Diktas et al., 2025; Ten Kulve et al., 2016). Further, the FNQ might become a useful tool to help clinicians, who daily work with subjects affected by overweight and obesity, to better individualize and target a pharmacological or non-pharmacological therapeutical intervention.
To conclude, several limitations of the present study should be acknowledged. First, the present study employed cross-sectional design; thus, the temporal stability of FNQ scores could not be assessed and test–retest reliability remains to be explored. Second, participants were recruited online, which may have introduced selection biases and limited the representativeness of the sample. Replication in more diverse and representative populations is therefore warranted. Finally, the present study enrolled a non-clinical population; further studies are needed to examine the psychometric properties of the FNQ in clinical samples, such as patients with a formal diagnosis of eating disorders.
5. Conclusions
The FNQ demonstrated overall satisfactory psychometric properties, including a strong unidimensional structure, excellent reliability, and evidence of convergent and discriminant validity. Measurement invariance across gender was further established.
The Italian version of the scale represents a brief and reliable tool for assessing intrusive food-related thoughts in Italian-speaking populations. Its use may facilitate research on the cognitive mechanisms underlying eating behavior and support clinical assessment in contexts where food-related cognitive intrusions play a relevant role. Further research is warranted to explore its longitudinal psychometric properties (i.e., test–retest reliability) and clinical utility.
Author Contributions
Conceptualization, E.M., O.D.V. and A.Z.; methodology, E.M., O.D.V. and A.Z.; validation, E.M., O.D.V., C.D. and A.Z.; formal analysis, A.Z.; investigation, E.M., O.D.V. and C.D.; data curation, O.D.V. and C.D.; writing—original draft preparation, E.M., O.D.V. and A.Z.; writing—review and editing, S.M. and C.B.; supervision, S.M. and C.B.; project administration, E.M. and C.B.; funding acquisition, S.M. and C.B. All authors have read and agreed to the published version of the manuscript.
Funding
This research received no external funding.
Institutional Review Board Statement
The study was conducted in accordance with the Declaration of Helsinki, and approved by the Ethics Committee of eCampus University (protocol code 13/2025, 5 August 2025).
Informed Consent Statement
Informed consent was obtained from all subjects involved in the study.
Data Availability Statement
Data supporting reported results can be obtained upon request.
Conflicts of Interest
The authors declare no conflicts of interest.
Abbreviations
The following abbreviations are used in this manuscript:
| FNQ | Food Noise Questionnaire |
| BMI | Body Mass Index |
| CFA | Confirmatory Factor Analysis |
| MG-CFA | Multiple Group Confirmatory Factor Analysis |
| DWLS | Diagonally Weighted Least Squares |
| CFI | Comparative Fit Index |
| TLI | Tucker–Lewis Index |
| SRMR | Standardized Root Mean Square Residual |
| RMSEA | Root Mean Square Error of Approximation |
| FCQ-T | Food Cravings Questionnaire Trait |
| GAD-7 | Generalized Anxiety Disorder 7 |
| PHQ-9 | Patient Health Questionnaire 9 |
| PSS | Perceived Stress Scale |
| SD | Standard Deviation |
References
- Beaton, D. E., Bombardier, C., Guillemin, F., & Ferraz, M. B. (2000). Guidelines for the process of cross cultural adaptation of self report measures. Spine, 25(24), 3186–3191. [Google Scholar] [CrossRef] [Scilit]
- Boswell, R. G., & Kober, H. (2016). Food cue reactivity and craving predict eating and weight gain: A meta analytic review. Obesity Reviews, 17(2), 159–177. [Google Scholar] [CrossRef] [Scilit] [PubMed]
- Cepeda-Benito, A., Gleaves, D. H., Williams, T. L., & Erath, S. A. (2000). The development and validation of the state and trait food cravings questionnaires. Behaviour Therapy, 31(1), 151–173. [Google Scholar] [CrossRef] [Scilit]
- Chen, F. F. (2007). Sensitivity of goodness of fit indexes to lack of measurement invariance. Structural Equation Modeling, 14(3), 464–504. [Google Scholar] [CrossRef] [Scilit]
- Cheung, G. W., & Rensvold, R. B. (2002). Evaluating goodness of fit indexes for testing measurement invariance. Structural Equation Modeling, 9(2), 233–255. [Google Scholar] [CrossRef] [Scilit]
- De Vet, H. C. W., Terwee, C. B., Mokkink, L. B., & Knol, D. L. (2011). Measurement in medicine: A practical guide. Cambridge University Press. [Google Scholar]
- Dhurandhar, E. J., Maki, K. C., Dhurandhar, N. V., Kyle, T. K., Yurkow, S., Hawkins, M. A., Agley, J., Ho, E. H., Cheskin, L. J., Sørensen, T. I., Wang, X. R., & Allison, D. B. (2025). Food noise: Definition, measurement, and future research directions. Nutrition & Diabetes, 15, 30. [Google Scholar] [CrossRef] [Scilit]
- Diktas, H. E., Cardel, M. I., Foster, G. D., LeBlanc, M. M., Dickinson, S. L., Ables, E. M., Chen, X., Nathan, R., Shapiro, D., & Martin, C. K. (2025). Development and validation of the food noise questionnaire. Obesity, 33(2), 289–297. [Google Scholar] [CrossRef] [Scilit]
- Ferguson, C. J. (2009). An effect size primer: A guide for clinicians and researchers. Professional Psychology: Research and Practice, 40(5), 532–538. [Google Scholar] [CrossRef] [Scilit]
- Flora, D. B. (2020). Your coefficient alpha is probably wrong, but which coefficient omega is right? A tutorial on using R. Advances in Methods and Practices in Psychological Science, 3, 484–501. [Google Scholar] [CrossRef] [Scilit]
- Green, S. B., & Yang, Y. (2009). Reliability of summed item scores using structural equation modeling: An alternative to Cronbach’s alpha. Psychometrika, 74(1), 155–167. [Google Scholar] [CrossRef] [Scilit]
- Hair, J. F., Black, W. C., Babin, B. J., & Anderson, R. E. (2019). Multivariate data analysis (8th ed.). Cengage. [Google Scholar]
- Hayashi, D., Edwards, C., Emond, J. A., Gilbert-Diamond, D., Butt, M., Rigby, A., & Masterson, T. D. (2023). What is food noise? A conceptual model of food cue reactivity. Nutrients, 15(22), 4809. [Google Scholar] [CrossRef] [Scilit] [PubMed]
- Heymsfield, S. B., & Wadden, T. A. (2017). Mechanisms, pathophysiology, and management of obesity. New England Journal of Medicine, 376(3), 254–266. [Google Scholar] [CrossRef] [Scilit] [PubMed]
- Higgs, S. (2015). Manipulations of attention during eating and their effects on later snack intake. Appetite, 92, 287–294. [Google Scholar] [CrossRef] [Scilit] [PubMed]
- Hu, L. T., & Bentler, P. M. (1999). Cutoff criteria for fit indexes in covariance structure analysis: Conventional criteria versus new alternatives. Structural Equation Modeling, 6, 1–55. [Google Scholar] [CrossRef] [Scilit]
- Innamorati, M., Imperatori, C., Balsamo, M., Tamburello, S., Belvederi Murri, M., Contardi, A., Tamburello, A., & Fabbricatore, M. (2014). Food cravings questionnaire trait (FCQ T) discriminates between obese and overweight patients with and without binge eating tendencies: The Italian version of the FCQ T. Journal of Personality Assessment, 96(6), 632–639. [Google Scholar] [CrossRef] [Scilit]
- Kanoski, S. E., & Boutelle, K. N. (2022). Food cue reactivity: Neurobiological and behavioral underpinnings. Reviews in Endocrine and Metabolic Disorders, 23(4), 683–696. [Google Scholar] [CrossRef] [Scilit]
- Kenny, D. A., Kaniskan, B., & McCoach, D. B. (2015). The performance of RMSEA in models with small degrees of freedom. Sociological Methods & Research, 44(3), 486–507. [Google Scholar] [CrossRef] [Scilit]
- Kulis, D., Arnott, M., Greimel, E. R., Bottomley, A., & Koller, M. (2011). Trends in translation requests and arising issues regarding cultural adaptation. Expert Review of Pharmacoeconomics & Outcomes Research, 11(3), 307–314. [Google Scholar] [CrossRef] [Scilit]
- Li, C. H. (2016). The performance of ML, DWLS, and ULS estimation with robust corrections in structural equation models with ordinal variables. Psychological methods, 21(3), 369–387. [Google Scholar] [CrossRef] [Scilit]
- May, J., Andrade, J., Batey, H., Berry, L. M., & Kavanagh, D. J. (2010). Less food for thought: Impact of attentional instructions on intrusive thoughts about snack foods. Appetite, 55(2), 279–287. [Google Scholar] [CrossRef] [Scilit]
- Meredith, W. (1993). Measurement invariance, factor analysis and factorial invariance. Psychometrika, 58(4), 525–543. [Google Scholar] [CrossRef] [Scilit]
- Mondo, M., Sechi, C., & Cabras, C. (2021). Psychometric evaluation of three versions of the Italian perceived stress scale. Current Psychology, 40, 1884–1892. [Google Scholar] [CrossRef] [Scilit]
- Muthén, B., & Kaplan, D. (1985). A comparison of some methodologies for the factor analysis of non normal Likert variables. British Journal of Mathematical and Statistical Psychology, 38(2), 171–189. [Google Scholar] [CrossRef] [Scilit]
- Rosseel, Y. (2012). lavaan: An R package for structural equation modeling. Journal of Statistical Software, 48(2), 1–36. [Google Scholar] [CrossRef] [Scilit]
- Shevlin, M., Butter, S., McBride, O., Murphy, J., Gibson Miller, J., Hartman, T. K., Levita, L., Mason, L., Martinez, A. P., McKay, R., Stocks, T. V., Bennett, K. M., Hyland, P., Vallieres, F., Valiente, C., Vazquez, C., Contreras, A., Peinado, V., Trucharte, A., … Bentall, R. P. (2022). Measurement invariance of the Patient Health Questionnaire 9 (PHQ 9) and Generalized Anxiety Disorder scale (GAD 7) across four European countries during the COVID-19 pandemic. BMC Psychiatry, 22(1), 154. [Google Scholar] [CrossRef] [Scilit]
- Shi, D., DiStefano, C., Maydeu Olivares, A., & Lee, T. (2022). Evaluating SEM model fit with small degrees of freedom. Multivariate Behavioral Research, 57(2–3), 179–207. [Google Scholar] [CrossRef] [Scilit]
- Swinburn, B. A., Sacks, G., Hall, K. D., McPherson, K., Finegood, D. T., Moodie, M. L., & Gortmaker, S. L. (2011). The global obesity pandemic: Shaped by global drivers and local environments. The Lancet, 378(9793), 804–814. [Google Scholar] [CrossRef] [Scilit]
- Taasoobshirazi, G., & Wang, S. (2016). The performance of the SRMR, RMSEA, CFI, and TLI: An examination of sample size, path size, and degrees of freedom. Journal of Applied Quantitative Methods, 11(3), 31–39. [Google Scholar]
- Tapper, K., & Pothos, E. M. (2010). Development and validation of a food preoccupation questionnaire. Eating Behaviors, 11(1), 45–53. [Google Scholar] [CrossRef] [Scilit]
- Ten Kulve, J. S., Veltman, D. J., van Bloemendaal, L., Barkhof, F., Drent, M. L., Diamant, M., & IJzerman, R. G. (2016). Liraglutide reduces CNS activation in response to visual food cues only after short term treatment in patients with type 2 diabetes. Diabetes Care, 39(2), 214–221. [Google Scholar] [CrossRef] [Scilit]
- Wang, J., & Wang, X. (2019). Structural equation modeling: Applications using Mplus (2nd ed.). Wiley. [Google Scholar]
- Ward, A., & Mann, T. (2000). Don’t mind if I do: Disinhibited eating under cognitive load. Journal of Personality and Social Psychology, 78(4), 753–763. [Google Scholar] [CrossRef]
- Wild, D., Grove, A., Martin, M., Eremenco, S., McElroy, S., Verjee-Lorenz, A., & Erikson, P. (2005). Principles of good practice for the translation and cultural adaptation process for patient reported outcomes measures: Report of the ISPOR task force. Value in Health, 8(2), 94–104. [Google Scholar] [CrossRef] [Scilit]
- Zagaria, A., Cerolini, S., Mocini, E., & Lombardo, C. (2023). The relationship between internalized weight stigma and physical and mental health related quality of life in a large sample of women: A structural equation modeling analysis. Eating and Weight Disorders, 28, 52. [Google Scholar] [CrossRef] [Scilit]
- Zagaria, A., Mocini, E., Cerolini, S., Donini, L. M., Castelnuovo, G., Manzoni, G. M., Pietrabissa, G., & Lombardo, C. (2022). A validation study of the Italian version of the attitudes toward obese persons (I ATOP) questionnaire. Obesity Research & Clinical Practice, 16(3), 262–268. [Google Scholar] [CrossRef] [Scilit]

Disclaimer/Publisher’s Note: The statements, opinions and data contained in all publications are solely those of the individual author(s) and contributor(s) and not of MDPI and/or the editor(s). MDPI and/or the editor(s) disclaim responsibility for any injury to people or property resulting from any ideas, methods, instructions or products referred to in the content. |
© 2026 by the authors. Licensee MDPI, Basel, Switzerland. This article is an open access article distributed under the terms and conditions of the Creative Commons Attribution (CC BY) license.