


Abstract
Background/Objectives: Non-invasive markers of primary sclerosing cholangitis (PSC) in patients with inflammatory bowel disease (IBD) are lacking, and serum ceramide species are altered in both diseases. This study investigated whether total and species-specific serum sphingomyelin-to-ceramide (SM/Cer) ratios identify concomitant PSC in IBD and reflect inflammatory activity. Methods: Serum SM and ceramide species were quantified by direct flow injection analysis–mass spectrometry in 16 healthy controls, 57 patients with IBD, 7 patients with PSC, and 13 patients with PSC-IBD. The total SM/Cer ratio and six species-specific ratios were analyzed in relation to IBD, PSC-IBD, inflammation markers, stool consistency, and medication. Results: The total SM/Cer and SM 42:1;O2/Cer 18:1;O2/24:0 ratios discriminated PSC-IBD from those with IBD alone, with areas under the receiver operating characteristic curve of 0.76 and 0.82, specificities of 95% and 91%, and sensitivities of 62% and 69%, respectively. Their diagnostic performance was comparable to that of the corresponding ceramide species. Combining the SM/Cer ratios with alkaline phosphatase and bilirubin levels improved diagnostic performance compared with standard laboratory measures alone. Moreover, multiple linear regression revealed that the SM/Cer ratios were less confounded by age and fecal calprotectin than the individual ceramide species levels. The SM 36:1;O2/Cer 18:1;O2/18:0 and SM 38:1;O2/Cer 18:1;O2/20:0 ratios were lower in patients with IBD, PSC, and PSC-IBD than in controls. Of these, only the latter ratio correlated negatively with inflammatory markers. Associations of SM/Cer ratios with current medication and stool consistency were modest and require further validation. Conclusions: Serum total SM/Cer and SM 42:1;O2/Cer 18:1;O2/24:0 ratios identify concomitant PSC in patients with IBD with high specificity, while fecal calprotectin has little or no effect on these ratios. Because they need only a small serum sample, these ratios are promising non-invasive markers for selecting patients with IBD for cholangiographic evaluation. Validation in larger, prospective cohorts is needed.
1. Introduction
Inflammation profoundly alters the serum lipidome, reflecting the role of lipids in pro- and anti-inflammatory processes [1]. Inflammatory bowel disease (IBD) comprises mainly Crohn’s disease (CD) and ulcerative colitis (UC). Active IBD is associated with low serum lipoprotein and cholesterol levels [2,3,4], and systemic levels of various lipid classes have been analyzed to clarify IBD pathophysiology and to identify diagnostic biomarkers [5,6,7].
Sphingolipids are a diverse class of lipids whose functions depend largely on the length of their N-acyl chains. Among the bioactive ceramides, long-chain species (C16–C20) are considered predominantly harmful and proinflammatory, whereas very-long-chain species (≥C22) may exert opposing, anti-inflammatory effects [8,9,10]. Accordingly, the serum long-chain to very-long-chain ceramide ratio is higher in patients with IBD than in healthy controls, mainly because long-chain ceramide levels are increased [11,12,13,14,15,16].
Ceramide is interconverted with other sphingolipids through several partly reversible pathways. Sphingomyelin synthase transfers phosphocholine from phosphatidylcholine to ceramide, generating sphingomyelin (SM), a key structural membrane lipid, and diacylglycerol, an important signaling molecule. Conversely, sphingomyelinases (SMases) hydrolyze SM to ceramide [7]. Alkaline SMase is expressed in the intestinal mucosa, and its activity is reduced in patients with long-standing chronic colitis [17]. The intestinal mucosa secretes SM, which is transported into the circulation in chylomicrons [18]. Lower activity of this enzyme in colitis [17] may increase systemic SM levels in patients with IBD.
Acid SMase (aSMase) activity increases in macrophages stimulated with lipopolysaccharide or tumor necrosis factor (TNF), and oral administration of the aSMase inhibitor SMA-7 ameliorated dextran sulfate sodium (DSS)-induced colitis in mice [19]. Likewise, the aSMase inhibitor desipramine, given two days after colitis induction, improved disease symptoms [20].
If the elevated systemic long-chain ceramide levels in IBD [11,12,13,14,15,16] were mainly generated by aSMase activity, the corresponding SM species should be reduced. Dietary SM, administered together with DSS, alleviated colitis in mice, in part by reducing inflammation [21], suggesting that low SM levels may promote inflammation. However, plasma SM levels of patients with CD or UC were similar to those of healthy controls [22]; as most of these patients were in remission, serum lipids may differ significantly only in active IBD [22]. In a study of 300 patients with CD and 300 healthy controls, serum SM species bearing very-long-chain fatty acids were lower in CD [13]. Because long-chain, but not very-long-chain, ceramides are increased in the serum of patients with IBD [10,11,12,13,14,15], these data argue against elevated aSMase activity as a major underlying cause.
In human plasma, liver-derived SM is mainly carried in very-low-density lipoproteins, with additional contributions from the intestinal mucosa and other tissues [18]. Accordingly, chronic liver diseases are associated with changes in circulating sphingolipids [9,23,24]. Primary sclerosing cholangitis (PSC) is closely related to IBD, and most patients with PSC also have UC [25,26]. Few studies have compared the blood lipidome of patients with PSC with that of healthy controls [23,27], and PSC has been associated with decreased levels of certain SM species [23]. To our knowledge, systemic SM levels have not been compared between patients with PSC and those with IBD. We recently reported that patients with PSC-IBD had a higher long-chain/very-long-chain ceramide ratio than patients with IBD, mainly due to lower levels of very-long-chain ceramide species. Together, these findings suggest that serum SM/Cer ratios may be altered in PSC. Because PSC is diagnosed by cholangiography and reliable serological markers are lacking [28], non-invasive markers that identify PSC in patients with IBD are needed.
This study therefore aimed to analyze total and species-specific serum SM/Cer ratios in patients with IBD, PSC, and PSC-IBD; relate them to inflammation, stool consistency, and medication; and evaluate whether they identify concomitant PSC-IBD in patients with IBD.
2. Materials and Methods
2.1. Patients and Controls
Patients with IBD and/or PSC treated as inpatients or outpatients at the Department of Internal Medicine I, University Hospital Regensburg, were enrolled between 12 June 2021 and 23 February 2023. CD, UC, and PSC were diagnosed based on clinical, laboratory, histological, radiological, and endoscopic criteria [29,30,31]. Exclusion criteria were coagulopathy, pregnancy, and inability to provide written informed consent. Eighteen patients with PSC were treated with ursodeoxycholic acid. At the time of blood sampling, patients with IBD received corticosteroids (n = 14), mesalazine (n = 14), anti-interleukin (IL)-12/23 antibodies (n = 13), anti-TNF antibodies (n = 15), or azathioprine (n = 7); several patients received more than one drug. Patient spouses, students, and hospital staff served as controls. The study was conducted in accordance with the Declaration of Helsinki and approved by the Ethics Committee of the University Hospital Regensburg (protocol code 19-1309-101, date of approval 20 February 2019).
2.2. Clinical Data and Disease Activity
C-reactive protein (CRP) and fecal calprotectin, measured at blood collection, served as markers of systemic and intestinal inflammation, respectively [32,33]. Fecal calprotectin concentrations were determined using the QUANTA Flash Calprotectin assay (Inova Diagnostics, San Diego, CA, USA), performed on the BIO-FLASH automated analyzer. The assay uses a chemiluminescent sandwich immunoassay principle to quantify calprotectin in samples. C-reactive protein (CRP) concentrations were quantified using a particle-enhanced immunoturbidimetric method. The laboratory measurements for fecal calprotectin and CRP were carried out at the Institute of Clinical Chemistry and Laboratory Medicine, University Hospital Regensburg.
In patients with IBD, patients recorded stool consistency using the Bristol Stool Form Scale and categorized it as constipation, normal stool, diarrhea, or watery stool. Gastrointestinal symptoms were assessed with the Gastrointestinal Symptom Rating Scale (GSRS) [34]. In patients with PSC or PSC-IBD, liver stiffness was measured by acoustic radiation force impulse elastography within six months of blood sampling and graded as F0–F4 [35,36].
2.3. Lipid Extraction and Analysis of SM and Cer Species and Cholesterol
SM 30:1;O2 (Avanti Polar Lipids, Alabaster, AL, USA; 0.39 nmol/sample) was added to the serum as an internal standard. Lipids were extracted from 10 µL of serum according to Bligh and Dyer [37]. The chloroform phase (0.5 mL) was vacuum-dried and dissolved in 7.5 mM ammonium formate in chloroform (Roth, Karlsruhe, Germany)/methanol (Merck, Darmstadt, Germany)/2-propanol (Roth) (1:2:4, v/v/v) [38]. SM species were quantified by direct flow injection analysis (FIA) on a hybrid quadrupole-Orbitrap mass spectrometer (Q Exactive; Thermo Fisher Scientific, Bremen, Germany) in negative ion mode as formate adducts ([M+HCOO]−) in the m/z range 520–960 [38]. Ceramide species in the same serum samples were previously quantified by FIA–tandem mass spectrometry [12]. Free cholesterol, cholesteryl esters, and total cholesterol were quantified by flow injection analysis–high-resolution mass spectrometry as described [39].
2.4. Statistical Analysis
Clinical characteristics are given as median (range) and were compared using the Kruskal–Wallis test, as reported previously [12]. SM/Cer ratios are presented as mean ± 95% confidence interval (CI) in figures and as mean ± standard deviation (SD) in the tables. Normality was assessed using the Kolmogorov–Smirnov test; all SM/Cer ratios were normally distributed in IBD. Groups were compared using one-way analysis of variance (ANOVA) with Bonferroni post hoc tests. Correlations were assessed using Pearson’s correlation coefficient (r), and partial correlation was used to adjust for fecal calprotectin.
Receiver operating characteristic (ROC) curves, the area under the ROC curve (AUROC), and optimal cut-offs (Youden index) were determined. Multiple linear regression and binary logistic regression were performed. Analyses were performed with IBM SPSS Statistics version 31.0 (IBM Corp., Armonk, NY, USA). AUROCs were compared using MedCalc® (https://www.medcalc.org/en/calc/comparison_of_independentROCtest.php (accessed on 27 October 2026)).
The current data are partly based on our recent study of ceramides [12] and now also include analyses of various sphingomyelin species, as well as SM/Cer ratios. Because this study is exploratory, we did not adjust for the false discovery rate, and p-values were not adjusted for multiple testing. A two-sided p < 0.05 was considered statistically significant.
3. Results
3.1. Study Cohorts
The study included 16 healthy controls and 57 patients with IBD (17 with UC and 40 with CD). In addition, 7 patients had PSC without IBD, and 13 had PSC with concomitant IBD (PSC-IBD).
Sex did not differ between the cohorts (p > 0.05). Controls did not differ in age from patients with PSC but were older than patients with IBD (p = 0.003) and PSC-IBD (p = 0.029); the latter two groups did not differ in age. The γ-glutamyl-transferase (GGT) levels were higher in PSC than in IBD (p = 0.005), and alkaline phosphatase (AP) and bilirubin levels were higher in PSC (p = 0.001 and p = 0.002, respectively) and PSC-IBD (p = 0.002 and p = 0.031, respectively) than in IBD (Table 1).
Table 1.
Characteristics of controls and of patients with inflammatory bowel disease (IBD), primary sclerosing cholangitis (PSC), and PSC with concomitant IBD (PSC-IBD). Data are given as median (minimum–maximum); group comparisons are reported in the text.
3.2. Serum SM/Cer Ratios and Identification of PSC-IBD
Because SMases have been implicated in IBD [17], the following SM/Cer ratios were calculated:
- 1
- SM 34:1;O2/ceramide 18:1;O2/16:0;
- 2
- SM 36:1;O2/ceramide 18:1;O2/18:0;
- 3
- SM 38:1;O2/ceramide 18:1;O2/20:0;
- 4
- SM 40:1;O2/ceramide 18:1;O2/22:0;
- 5
- SM 42:1;O2/ceramide 18:1;O2/24:0;
- 6
- SM 42:2;O2/ceramide 18:1;O2/24:1;
- 7
- Total SM/total ceramide.
These ratios are referred to as 34:1, 36:1, 38:1, 40:1, 42:1, 42:2, and total SM/Cer ratio, respectively.
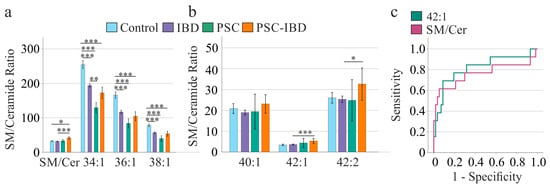
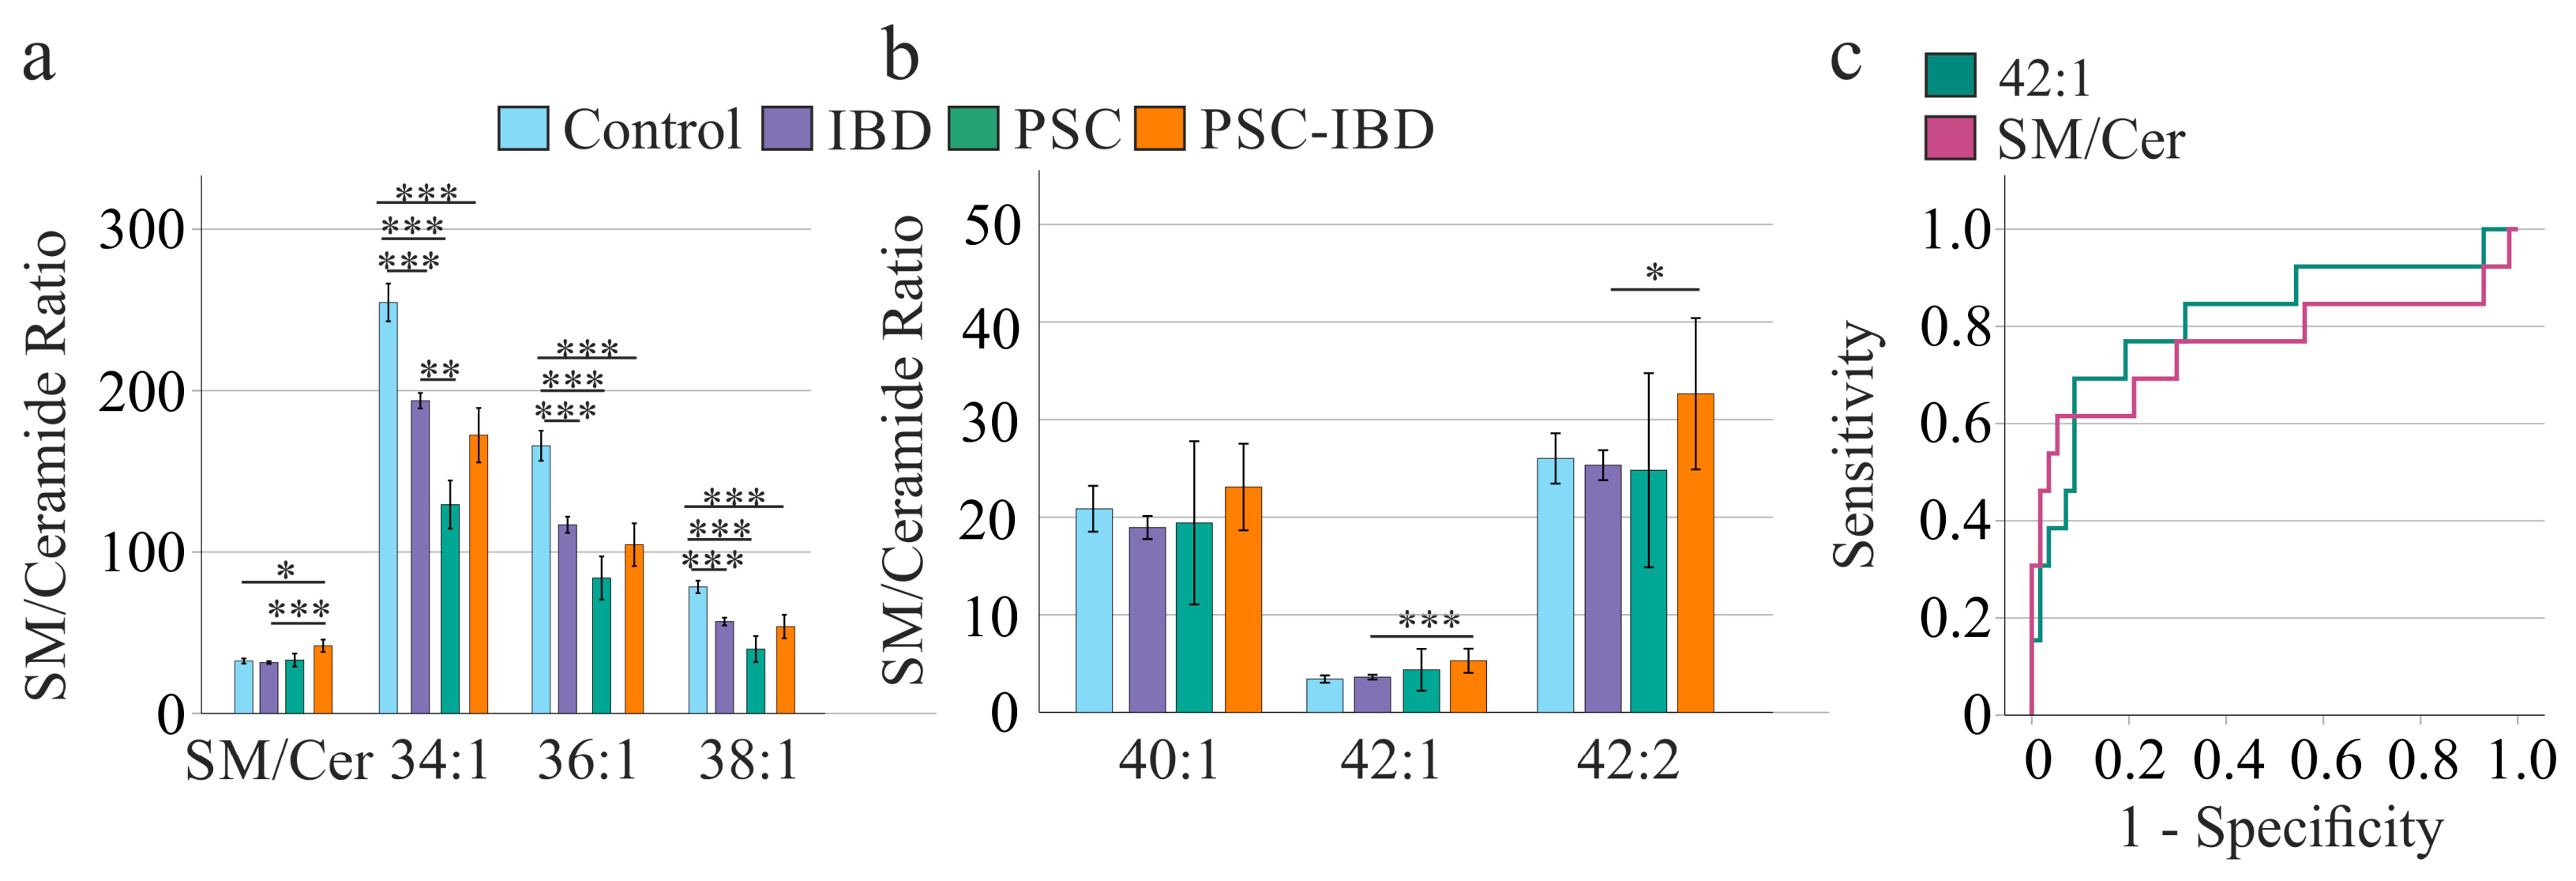
The 34:1, 36:1, and 38:1 ratios were lower in patients with IBD than in controls, and the 34:1, 36:1, and 38:1 ratios were also lower in patients with PSC and PSC-IBD than in controls (Figure 1a). The total SM/Cer ratio was higher in PSC-IBD than in controls. Among patients, the 34:1 ratio was lower in PSC than in IBD, whereas the 42:1, 42:2, and total SM/Cer ratios were higher in PSC-IBD than in IBD (Figure 1a,b). None of the ratios differed between PSC and PSC-IBD. The total SM/Cer and 42:1 ratios of patients with PSC did not differ from those of patients with IBD or controls.
Figure 1.
SM/Cer ratios in controls and in patients with IBD, PSC, or PSC-IBD. (a) Total SM/Cer, 34:1, 36:1, and 38:1 ratios; (b) 40:1, 42:1, and 42:2 ratios; (c) receiver operating characteristic curves of the total SM/Cer and 42:1 ratios for discriminating PSC-IBD from IBD. Data are shown as mean ± 95% confidence interval (CI). * p < 0.05, ** p < 0.01, *** p < 0.001.
Of the 21 SM species quantified, only SM 43:1;O2 differed between groups, being lower in PSC than in controls (p = 0.013; Table S1).
We previously showed that, in this cohort, ceramide 18:1;O2/16:0 and 18:1;O2/18:0 levels are higher in IBD than in controls [12]. Because the corresponding SM species, SM 34:1;O2 and SM 36:1;O2, did not differ between controls and IBD (Table S1), the lower 34:1 and 36:1 ratios in IBD (Figure 1a) are attributable to the higher ceramide levels [12].
The 38:1 ratio was likewise lower in IBD, PSC, and PSC-IBD than in controls (Figure 1a), although neither SM 38:1;O2 (Table S1) nor ceramide 18:1;O2/20:0 [12] differed significantly between groups; the lower ratio therefore reflects a slight decrease in SM 38:1;O2 combined with a non-significant increase in ceramide 18:1;O2/20:0 [12]. The same applies to the lower 36:1 ratio in PSC and PSC-IBD. The lower 34:1 ratio in PSC than in IBD results from higher ceramide 18:1;O2/16:0 levels in PSC [12]. The higher 42:1 ratio in PSC-IBD than in IBD reflects lower ceramide 18:1;O2/24:0 levels in PSC-IBD [12], and the higher 42:2 ratio reflects a non-significant decrease in ceramide 18:1;O2/24:1 [12]. Total SM levels did not differ between groups (Table S1), whereas total ceramide levels tended to be lower in PSC-IBD [12], resulting in a higher total SM/Cer ratio.
The total SM/Cer ratio discriminated PSC-IBD from IBD with an area under the ROC curve (AUROC) of 0.761 ± 0.097; a cut-off of 41 yielded 62% sensitivity and 95% specificity (Table 2, Figure 1c). The AUROC of the 42:1 ratio was 0.816 ± 0.077; a cut-off of 4.7 yielded a sensitivity of 69% and a specificity of 91% (Table 2, Figure 1c). The 34:1, 36:1, and 38:1 ratios did not differ significantly between IBD and PSC-IBD (Figure 1a). The AUROC of the 42:2 ratio was low and was not suitable for identifying PSC-IBD.
Table 2.
Comparison of the diagnostic characteristics of ceramide levels and sphingomyelin/ceramide ratios, as well as alkaline phosphatase and bilirubin, for PSC-IBD diagnosis in IBD.
The AUROC for GGT was 0.622 ± 0.103 (95% CI 0.420–0.823, p = 0.236) and was not significant. The AUROC for AP was 0.764 ± 0.090. A concentration of 101 U/L had a sensitivity of 62% and a specificity of 95% (Table 2). The AUROC for bilirubin was 0.701 ± 0.088. A level of 0.65 mg/dL had a sensitivity of 46% and a specificity of 83% for diagnosis of PSC-IBD (Table 2). The AUROCs for bilirubin and AP did not differ from those of the SM/Cer ratios.
Because the levels of individual SM species and total SM were comparable between patients with IBD and those with PSC-IBD (Table S1), the corresponding ceramide species were considered discriminative lipids, and AUROCs were calculated for the respective ceramide species and total ceramide levels. The AUROC for total ceramide levels was 0.798 ± 0.061; 8.6 nmol/mL had a sensitivity of 69% and a specificity of 82% for PSC-IBD diagnosis (Table 2). The AUROC for ceramide 18:1;O2/24:0 was 0.869 ± 0.045; a concentration of 4.04 nmol/mL had a sensitivity of 85% and a specificity of 74% for diagnosing PSC-IBD (Table 2). The AUROCs of total ceramide and the SM/Cer ratio, as well as of ceramide 18:1;O2/24:0 and the 24:1 ratio, were similar (p > 0.05 for both comparisons).
Binary logistic regression showed that AP and bilirubin correctly diagnosed 84% of the PSC-IBD patients (Table 3). The baseline model, which included none of these predictors, classified 76% correctly. Adding the SM/Cer ratio increased correct classification to 89%. AP, bilirubin, and the 42:1 ratio correctly classified 87% of patients (Table 3). Binary linear regression using AP, bilirubin, and total ceramide correctly classified 87% of patients. AP, bilirubin, and ceramide 18:1;O2/24:0 correctly classified 89% of patients (Table 3). The negative predictive values of all these combinations were comparable, but adding lipid/lipid ratio to AP and bilirubin increased the positive predictive value by about 15% (Table 3).
Table 3.
Binary linear regression for diagnosis of PSC-IBD in IBD. The table lists the negative predictive values (NPV) and the positive predictive values (PPV). The p-values for all analyses were p < 0.001 and are not included in the table. The baseline model, which included none of these predictors, classified 76% (combined with AP and bilirubin) or 81% correctly.
Using only the ceramide or SM/ceramide ratios to predict PSC-IBD, with ceramide 18:1;O2/24:0, 81% of patients were correctly classified, matching the baseline model that included none of these predictors (Table 3). The SM/Cer ratio, the 42:1 ratio, and total ceramide correctly classified 87%, 84%, and 84% of patients, respectively. The negative predictive values were comparable across the analyzed markers, whereas the positive predictive values were below 50% (Table 3). The odds ratios (ORs) indicated associations of varying strength between the lipid markers and PSC-IBD, ranging from a relatively weak association for the SM/Cer ratio (OR = 1.156) to a stronger association for total ceramides (OR = 1.524), with the strongest association observed for the 42:1 ratio (OR = 3.299; Table 3).
3.3. Serum SM/Cer Ratios and Identification of IBD
In ROC analysis, the 34:1, 36:1, and 38:1 SM/Cer ratios discriminated patients with IBD from controls (Table 4). The AUROCs of the SM/Cer ratios did not differ substantially from those of the respective ceramide species (Table 4).
Table 4.
Comparison of the diagnostic characteristics of ceramide and sphingomyelin/ceramide ratios for IBD diagnosis. The p-values for all analyses listed were p < 0.001.
Binary logistic regression showed that the 34:1, 36:1, and 38:1 ratios and the corresponding ceramide do not seem to predict IBD better than the baseline model, which included none of these predictors (Table 5).
Table 5.
Binary linear regression for diagnosis of IBD. Baseline classification without any lipid was 78%.
3.4. Correlation of SM and SM/Cer Ratios with CRP and Fecal Calprotectin
In IBD, total SM and 13 SM species correlated negatively with CRP, and total SM and 15 SM species correlated negatively with fecal calprotectin, indicating that SM levels decline with increasing inflammatory activity. No such associations were observed in PSC-IBD (Table S2).
Correlations of the SM/Cer ratios with CRP and fecal calprotectin, markers of systemic and intestinal inflammation, were analyzed separately in IBD and PSC-IBD (Table 6); these parameters were not available for patients with PSC (Table 1), and this cohort was also considered too small for meaningful correlation analysis.
Table 6.
Pearson correlation coefficients (r) of SM/Cer ratios with C-reactive protein (CRP) and fecal calprotectin in patients with IBD and PSC-IBD; p-values are given for significant correlations. CRP and fecal calprotectin of only 54 and 12 patients, respectively, had been documented at the time of blood collection. Pairwise deletion was used for missing data.
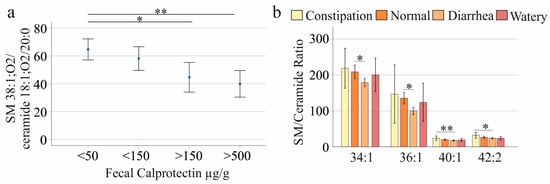
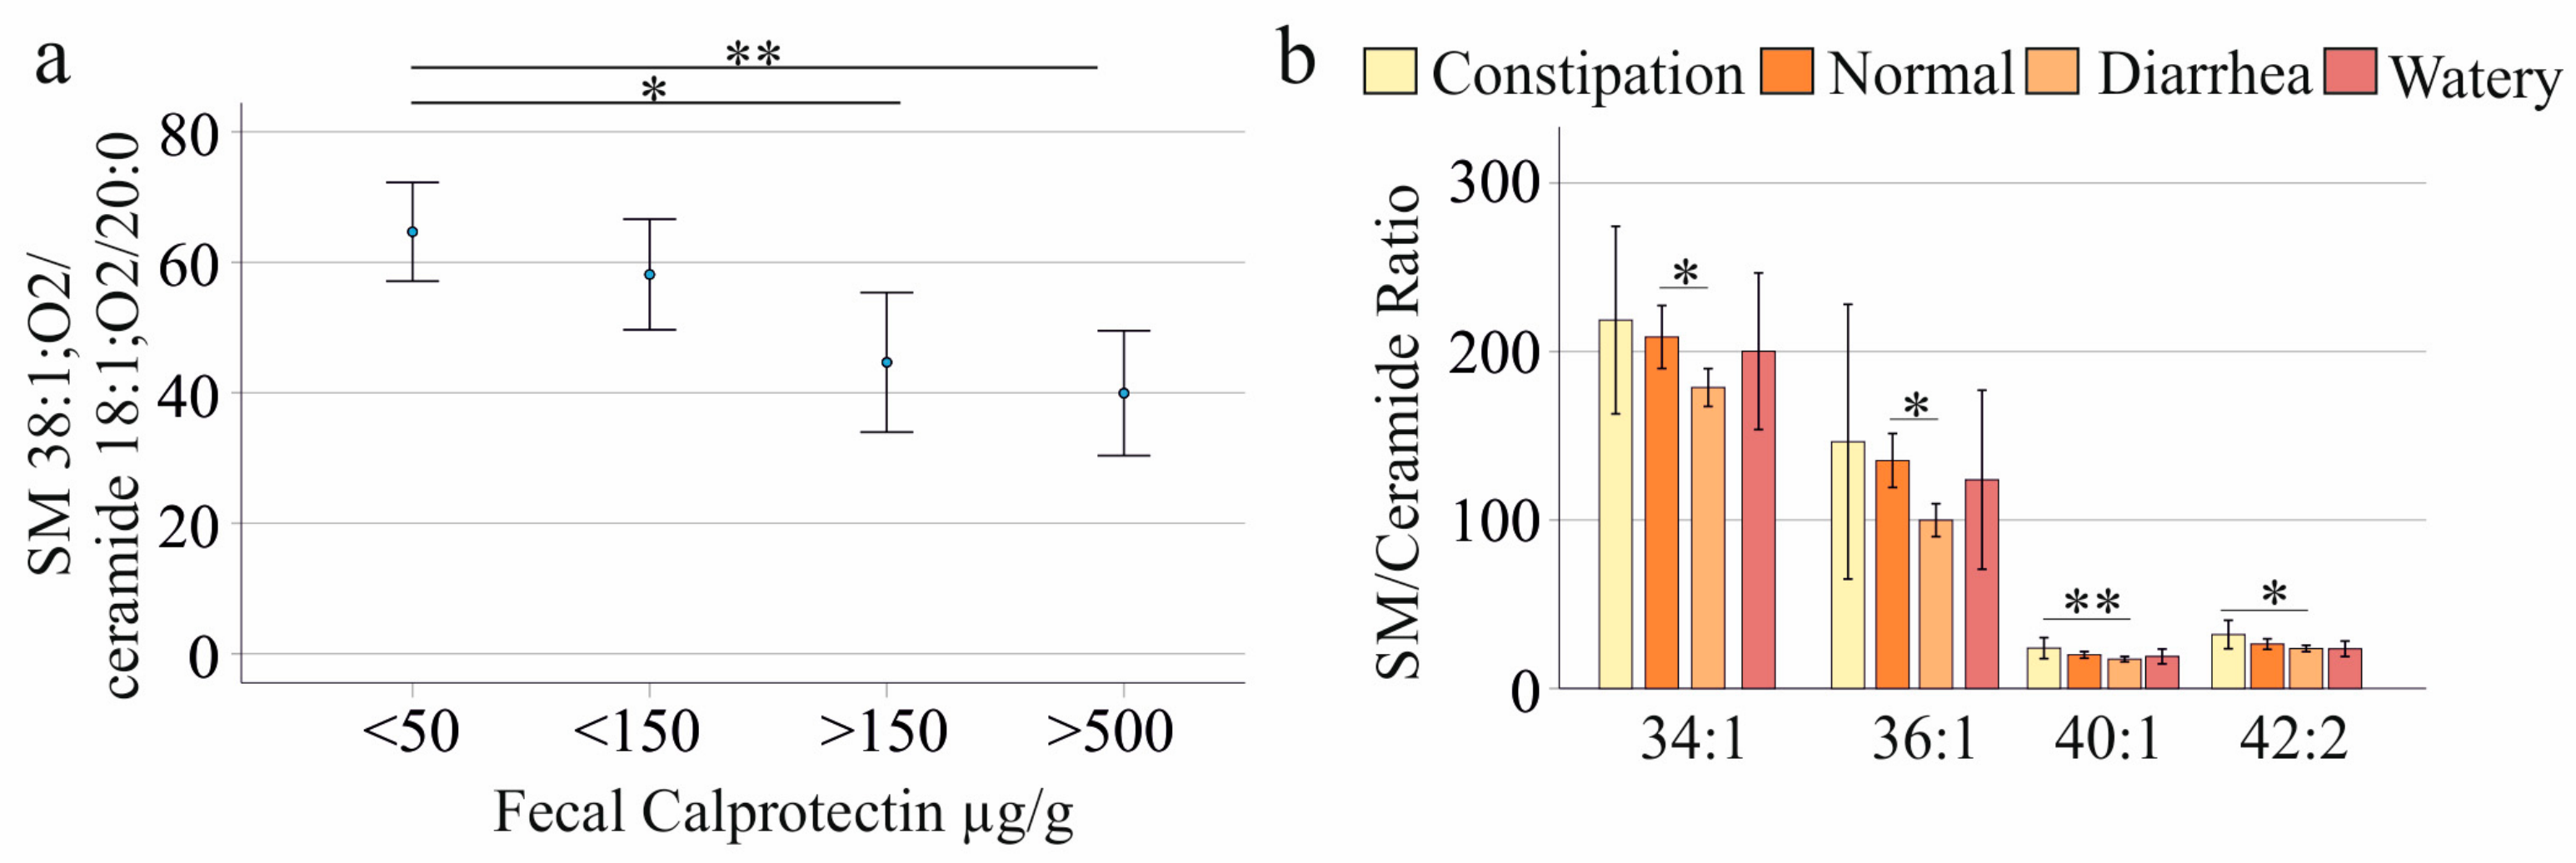
In IBD, the 38:1 ratio correlated negatively with CRP and fecal calprotectin (Table 6) and was lower in patients with fecal calprotectin of 150–500 µg/g (n = 7) and >500 µg/g (n = 7) than in those with <50 µg/g (n = 26; Figure 2a). In PSC-IBD, the 34:1, 36:1, 38:1, and 40:1 ratios correlated negatively with CRP, whereas correlations with fecal calprotectin were not significant (Table 6). Neither the total SM/Cer nor the 42:1 ratio correlated with CRP or fecal calprotectin in IBD or PSC-IBD (Table 6).
Figure 2.
SM/Cer ratios of patients with IBD in relation to fecal calprotectin and stool consistency. (a) 38:1 ratio stratified by fecal calprotectin level (mean ± 95% CI); (b) 34:1, 36:1, 40:1, and 42:2 ratios stratified by stool consistency (mean ± 95% CI). * p < 0.05, ** p < 0.01.
Because the PSC-IBD cohort was small, these analyses require confirmation in larger cohorts. The negative correlation between the 38:1 ratio and CRP has a high p-value and is not significant after multiple-comparison adjustment.
CRP and fecal calprotectin, as well as bilirubin and AP, are highly correlated; in multiple linear regression, we used only fecal calprotectin and AP.
Multiple linear regression showed that in patients with IBD, age, BMI, sex, fecal calprotectin, and AP predicted the SM/Cer ratio (F(5,42) = 3.397, p = 0.011; age p = 0.035, AP p = 0.045). For total ceramide levels this was highly significant (F(5,42) = 5.830, p < 0.001; age p = 0.002, AP p = 0.008). This also applied to ceramide 18:1;O2/24:0 levels (F(5,42) = 6.624, p < 0.001; age p < 0.001, fecal calprotectin p = 0.013, AP p = 0.038). Age, BMI, sex, fecal calprotectin, and AP did not predict the 42:1 ratio (F(5,42)= 1.715, p = 0.152.
Moreover, age, BMI, sex, fecal calprotectin, and AP did not predict the 34:1 (p = 0.294) or 36:1 (p = 0.599) ratios, ceramide 18:1;O2/18:0 (p = 0.145), or ceramide 18:1;O2/20:0 (p = 0.085) levels. For the 38:1 ratio, this was significant (F(5,42) = 2.722, p = 0.032), with fecal calprotectin as a significant contributor (p = 0.012). For ceramide 18:1;O2/16:0 levels this was also significant (F(5,42) = 2.522, p = 0.044) with AP being significant (p = 0.021).
3.5. Association of SM/Cer Ratios with Stool Consistency
Stool consistency was documented in 55 patients with IBD: 5 reported constipation, 17 normal stool, 27 diarrhea, and 6 watery stool. The 34:1 and 36:1 ratios were lower in patients with diarrhea than in those with normal stool, and the 40:1 and 42:2 ratios were lower in patients with diarrhea than in those with constipation (Figure 2b). The p-values were high and would not have been statistically significant after multiple-comparisons correction, which this analysis did not apply.
Individual SM and ceramide species [12] were not associated with stool consistency, and none of the SM/Cer ratios were associated with symptom severity assessed by the GSRS (p > 0.05 for all).
3.6. Association of SM/Cer Ratios with Liver Function Tests
In IBD, the total SM/Cer ratio correlated negatively with AP and GGT, and the 34:1 ratio with AP. In PSC-IBD, the 34:1 ratio correlated negatively with aspartate aminotransferase (AST), GGT, and bilirubin; the 36:1 ratio with AST and bilirubin; and the 38:1 ratio with bilirubin, whereas the 42:1 ratio correlated positively with GGT and AP (Table 7). The total SM/Cer ratio did not correlate with any liver function test in PSC-IBD.
Table 7.
Pearson correlation coefficients (r) of SM/Cer ratios with liver function tests in patients with IBD and PSC-IBD; p-values are given for significant correlations. In IBD, measures of liver function were not documented for all patients, and the number of patients included in the analysis is shown in the table. Pairwise deletion was used for missing data.
SM/Cer ratios were not associated with liver fibrosis, which was graded in 19 patients with PSC or PSC-IBD (F0, n = 3; F1, n = 9; F2, n = 3; F3/F4, n = 4).
3.7. SM/Cer Ratios and Current Medication in IBD
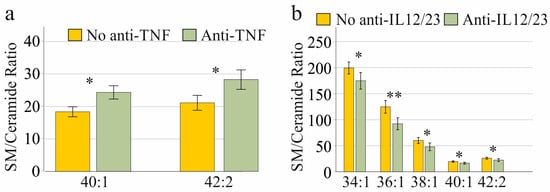
The 40:1 and 42:2 ratios were higher in patients receiving anti-TNF antibodies than in those not receiving anti-TNF therapy (Figure 3a; Table S3).
Figure 3.
SM/Cer ratios of patients with IBD in relation to current medication: (a) 40:1 and 42:2 ratios stratified by anti-TNF therapy; (b) 34:1, 36:1, 38:1, 40:1, and 42:2 ratios stratified by anti-IL-12/23 therapy. Data are shown as mean ± 95% CI. * p < 0.05, ** p < 0.01.
Conversely, the 34:1, 36:1, 38:1, 40:1, and 42:2 ratios were lower in patients receiving anti-IL-12/23 antibodies than in those not receiving this therapy (Figure 3b; Table S3).
The p-values were high and would not have been statistically significant after multiple-comparisons correction, which this analysis did not apply.
CRP and fecal calprotectin levels did not differ between patients with and without anti-TNF or anti-IL-12/23 therapy, and the prevalence of constipation or diarrhea was similar (p > 0.05 for all).
Among individual SM and ceramide species, only ceramide 18:1;O2/18:0 differed, being higher in patients receiving anti-IL-12/23 antibodies (p = 0.023); no ceramide or SM species differed with anti-TNF therapy (p > 0.05 for all). SM/Cer ratios did not differ between patients with and without corticosteroids, mesalazine, or azathioprine (p > 0.05 for all).
3.8. Association of SM/Cer Ratios with Cholesterol
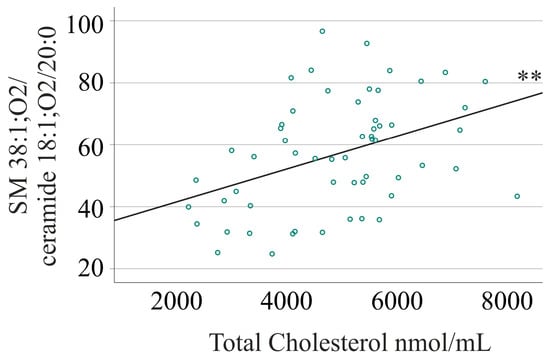
In IBD, only the 38:1 ratio correlated with serum cholesterol, namely with free cholesterol (r = 0.339, p = 0.010), cholesteryl esters (r = 0.424, p = 0.001), and total cholesterol (r = 0.406, p = 0.002; Figure 4).
Figure 4.
Correlation of the SM 38:1;O2/ceramide 18:1;O2/20:0 ratio with total serum cholesterol in 57 patients with IBD (Pearson r = 0.406). ** p < 0.01.
Because serum cholesterol declines with inflammation [2,40], the analysis was adjusted for fecal calprotectin; the correlations of the 38:1 ratio with cholesteryl esters (r = 0.290, p = 0.030) and total cholesterol (r = 0.270, p = 0.044) remained significant.
3.9. Association of SM/Cer Ratios with Sex, Age, and BMI
SM/Cer ratios did not differ between women and men, either in controls or in patients, and did not correlate with BMI in IBD or PSC-IBD. In IBD, the 40:1, 42:1, 42:2, and total SM/Cer ratios correlated negatively with age (Table 8).
Table 8.
Pearson correlation coefficients (r) of SM/Cer ratios with age and body mass index (BMI); p-values are given for significant correlations. n.d., not determined.
4. Discussion
To our knowledge, this is the first study to compare species-specific serum SM/Cer ratios between patients with IBD with and without concomitant PSC. The main finding is that the total SM/Cer and 42:1 ratios identified PSC-IBD among patients with IBD with high specificity. Because sphingolipid functions depend on acyl-chain length [10], the species-specific ratios also showed distinct patterns related to biologic therapy and stool consistency.
The total SM/Cer ratio (AUROC 0.761) and the 42:1 ratio (AUROC 0.816) discriminated PSC-IBD from IBD with specificities of 95% and 91%, respectively. Binary logistic regression analysis revealed 100% and 93% specificity, confirming the findings of the ROC analyses. Both ratios were higher in PSC-IBD because very-long-chain ceramides, in particular ceramide 18:1;O2/24:0, are reduced in these patients [12], whereas SM levels were unchanged. Accordingly, total ceramide levels and the ceramide 18:1;O2/24:0 species also had high specificity for excluding PSC in IBD (82 and 74%, respectively). AP and bilirubin had similar specificities as these lipids and SM/Cer ratios (95% and 83%), and adding the SM/Cer ratios to a binary logistic regression model improved PSC-IBD diagnosis in IBD. The negative predictive values of all markers were similarly high. However, the positive predictive values for the combination of AP, bilirubin, and ceramide or SM/Cer ratio were higher: it was 38% for the laboratory measures, 54% with the SM/Cer ratios, and up to 62% with total ceramide levels.
Several observations indicate that this signal is not merely a consequence of disease activity or liver injury. In PSC-IBD, the total SM/Cer ratio correlated with neither CRP nor fecal calprotectin or liver function tests; none of the ratios was associated with the stage of liver fibrosis, and patients with IBD and PSC-IBD did not differ in age. The total SM/Cer ratio may therefore provide information complementary to AP and GGT. In contrast, the 42:1 ratio correlated positively with AP and GGT in PSC-IBD, suggesting that it partly reflects cholestasis. However, in IBD, AP, age, BMI, sex, and fecal calprotectin did not predict the 42:1 and SM/Cer ratios, or only weakly, suggesting that these measures do not strongly influence their levels. In contrast, AP, age, BMI, sex, and fecal calprotectin strongly predicted total ceramide and the ceramide18:1; O2/24:0 species levels.
These findings are clinically relevant. PSC is closely associated with IBD, particularly UC [25,26], and its diagnosis relies on cholangiographic and histological findings and the exclusion of secondary causes [41,42,43], whereas reliable serological markers are lacking [28]. The best-characterized candidate, anti-integrin αvβ6 autoantibodies, identified PSC in a nationwide Japanese cohort with 82.7% sensitivity and 94.4% specificity [44]. Although the settings differ, the specificities of the total SM/Cer and 42:1 ratios were similar, while their sensitivities were lower (62% and 69%). The ratios therefore appear best suited to identify patients with IBD who should undergo magnetic resonance cholangiopancreatography (MRCP), and their combination with autoantibodies deserves evaluation.
Lipidomic analysis requires only 10 µL of serum and costs relatively little per sample. Although it currently depends on specialized instrumentation, clinical lipidomics is expected to become part of routine diagnostics [45].
Notably, total SM/Cer and 42:1 ratios in patients with PSC without IBD were similar to those in patients with IBD and controls, although they did not differ significantly from those in patients with PSC-IBD. The altered ratios may thus reflect the combination of PSC and IBD rather than cholestatic liver disease alone, which supports their use specifically in patients with IBD. Given the small number of patients with PSC alone (n = 7), this observation requires confirmation.
In contrast to the PSC-related changes, SM/Cer ratios were largely unrelated to intestinal inflammation. The lower 34:1, 36:1, and 38:1 ratios in IBD resulted from elevated long-chain ceramide levels [12] without a corresponding decrease in SM species, in line with the comparable plasma SM levels reported in IBD and controls [22]. Although total SM and several SM species declined with increasing CRP and fecal calprotectin, only the 38:1 ratio correlated negatively with both markers, most likely because of the inflammation-related decline in SM 38:1;O2. Inflammation largely, but not entirely, explained its correlation with serum cholesterol [2,40]. Overall, these data do not indicate systemic SMase activation in IBD and do not support SM/Cer ratios as markers of disease activity.
The 34:1, 36:1, and 38:1 ratios, along with the corresponding ceramide species levels, did not notably discriminate IBD from healthy controls. ROC curve analysis showed very good discriminatory performance of fecal calprotectin in distinguishing IBD from functional disorders (AUC = 0.97). At a cut-off of ≥50 μg/g, fecal calprotectin achieved 97% sensitivity and 74% specificity, with positive and negative predictive values of 37% and 99%, respectively [46]. This suggests that the SM/Cer ratios are not of diagnostic value.
Species-specific ratios also differed with treatment. The 40:1 and 42:2 ratios were higher in patients receiving anti-TNF antibodies. These two ratios, together with the 34:1, 36:1, and 38:1 ratios, were lower in patients receiving anti-IL-12/23 antibodies, although CRP and fecal calprotectin did not differ between patients with and without these therapies. Because TNF activates SMases [47], higher ratios under anti-TNF therapy are biologically plausible. Individual SM and ceramide species were largely unaffected, so these differences probably reflect small, combined shifts in both lipid classes. Whether SM/Cer ratios can support the monitoring of biologic therapy, for which reliable non-invasive markers are lacking [48,49] and biopsies are invasive [50], should be tested longitudinally. Similarly, patients with diarrhea had lower 34:1 and 36:1 ratios than those with normal stool and lower 40:1 and 42:2 ratios than those with constipation. These differences were unrelated to the overall symptom burden assessed by the GSRS, suggesting a specific link to stool consistency [51] whose mechanism remains to be determined. The p-values for associations with current medications and stool consistency were high, and after multiple-comparison correction, the differences are no longer significant. These findings have to be confirmed in different study cohorts, ideally in a longitudinal study in patients taking only one medication.
This study has limitations. It was a cross-sectional, single-center study with small control, PSC, and PSC-IBD groups. The diagnostic cut-offs were derived without an independent validation cohort and are therefore likely to overestimate performance. Controls were older than patients with IBD and PSC-IBD, and p-values were not adjusted for multiple testing. The medication analyses were not adjusted for IBD subtype or disease severity, and SM and ceramides were quantified on different mass spectrometry platforms. Prospective multicenter studies should therefore validate the total SM/Cer and 42:1 ratios for detecting PSC in IBD, ideally in patients undergoing MRCP and in combination with established markers.
5. Conclusions
Species-specific serum SM/Cer ratios provide information not captured by routine markers of inflammatory activity in IBD. The total SM/Cer and SM 42:1; O2/Cer 18:1; O2/24:0 ratios identified concomitant PSC in patients with IBD with high specificity (95% and 91%), and preliminary evidence indicates that this is independent of intestinal inflammation. This makes them promising non-invasive candidates for selecting IBD patients for cholangiographic work-up. Because only 10 µL of serum is required, these ratios could be added to clinical lipidomic panels once they have been validated in larger, prospective, multicenter cohorts.
Supplementary Materials
The following supporting information can be downloaded at https://www.mdpi.com/article/10.3390/medsci14070727/s1, Table S1: Serum levels of 21 SM species and total SM in controls and patients (mean ± SD); Table S2: Correlations of SM species with CRP and fecal calprotectin in patients with IBD and PSC-IBD; Table S3: SM/Cer ratios of patients with IBD with and without anti-TNF or anti-IL-12/23 therapy (mean ± SD).
Author Contributions
Conceptualization, H.C.T., A.K., G.L. and C.B.; formal analysis, G.L., M.H. (Marcus Höring) and C.B.; resources, T.E., M.H. (Muriel Huss), J.L., M.M. and H.C.T.; writing—original draft preparation, C.B.; writing—review and editing, H.C.T., M.H. (Muriel Huss), T.E., G.L., M.H. (Marcus Höring), J.L., A.K., M.M. and C.B. All authors have read and agreed to the published version of the manuscript.
Funding
This research received no external funding.
Institutional Review Board Statement
The study was conducted in accordance with the Declaration of Helsinki and approved by the Ethics Committee of the University Hospital Regensburg (protocol code 19-1309-101, date of approval 20 February 2019).
Informed Consent Statement
Informed consent was obtained from all subjects involved in the study.
Data Availability Statement
The original contributions presented in this study are included in the article and Supplementary Materials. A minimal data set is attached. Further inquiries can be directed to the corresponding author.
Acknowledgments
We gratefully acknowledge the support of Elena Underberg, Birgit Meier, Elisabeta Sepsy, Maria Eichinger, Tanja Fererberger, Stefanie Sommersberger, Stefan Gunawan, Renate Kick, and Doreen Müller.
Conflicts of Interest
The authors declare no conflicts of interest.
Abbreviations
The following abbreviations are used in this manuscript:
| ALT | Alanine aminotransferase |
| ANOVA | Analysis of variance |
| AP | Alkaline phosphatase |
| ARFI | Acoustic radiation force impulse |
| aSMase | Acid sphingomyelinase |
| AST | Aspartate aminotransferase |
| AUROC | Area under the receiver operating characteristic curve |
| BMI | Body mass index |
| CD | Crohn’s disease |
| Cer | Ceramide |
| CI | Confidence interval |
| CRP | C-reactive protein |
| DSS | Dextran sulfate sodium |
| FIA | Flow injection analysis |
| GGT | γ-glutamyl transferase |
| GSRS | Gastrointestinal Symptom Rating Scale |
| IBD | Inflammatory bowel disease |
| IL | Interleukin |
| MELD | Model for end-stage liver disease |
| MRCP | Magnetic resonance cholangiopancreatography |
| PSC | Primary sclerosing cholangitis |
| PSC-IBD | Primary sclerosing cholangitis with concomitant inflammatory bowel disease |
| ROC | Receiver operating characteristic |
| SD | Standard deviation |
| SM | Sphingomyelin |
| SMase | Sphingomyelinase |
| TNF | Tumor necrosis factor |
| UC | Ulcerative colitis |
References
- Feingold, K.R.; Grunfeld, C. Effect of Inflammation and Infection on Lipids and Lipoproteins. In Endotext; Feingold, K.R., Adler, R., Ahmed, S.F., Anawalt, B., Blackman, M.R., Chrousos, G., Corpas, E., de Herder, W.W., Dhatariya, K., Dungan, K., et al., Eds.; MDText.com, Inc.: South Dartmouth MA, USA, 2000; updated 18 June 2025. [Google Scholar]
- Agouridis, A.P.; Elisaf, M.; Milionis, H.J. An overview of lipid abnormalities in patients with inflammatory bowel disease. Ann. Gastroenterol. 2011, 24, 181–187. [Google Scholar] [PubMed]
- Ripollés Piquer, B.; Nazih, H.; Bourreille, A.; Segain, J.P.; Huvelin, J.M.; Galmiche, J.P.; Bard, J.M. Altered lipid, apolipoprotein, and lipoprotein profiles in inflammatory bowel disease: Consequences on the cholesterol efflux capacity of serum using Fu5AH cell system. Metabolism 2006, 55, 980–988. [Google Scholar] [CrossRef] [Scilit] [PubMed]
- Sappati Biyyani, R.S.R.; Putka, B.S.; Mullen, K.D. Dyslipidemia and lipoprotein profiles in patients with inflammatory bowel disease. J. Clin. Lipidol. 2010, 4, 478–482. [Google Scholar] [CrossRef] [Scilit] [PubMed]
- Alhouayek, M.; Ameraoui, H.; Muccioli, G.G. Bioactive lipids in inflammatory bowel diseases—From pathophysiological alterations to therapeutic opportunities. Biochim. Biophys. Acta Mol. Cell Biol. Lipids 2021, 1866, 158854. [Google Scholar] [CrossRef] [Scilit] [PubMed]
- Chen, H.; Li, W.; Hu, J.; Xu, F.; Lu, Y.; Zhu, L.; Shen, H. Association of serum lipids with inflammatory bowel disease: A systematic review and meta-analysis. Front. Med. 2023, 10, 1198988. [Google Scholar] [CrossRef] [Scilit] [PubMed]
- Doll, C.L.; Snider, A.J. The diverse roles of sphingolipids in inflammatory bowel disease. FASEB J. 2024, 38, e23777. [Google Scholar] [CrossRef] [Scilit] [PubMed]
- Garić, D.; De Sanctis, J.B.; Shah, J.; Dumut, D.C.; Radzioch, D. Biochemistry of very-long-chain and long-chain ceramides in cystic fibrosis and other diseases: The importance of side chain. Prog. Lipid Res. 2019, 74, 130–144. [Google Scholar] [CrossRef] [Scilit] [PubMed]
- Buechler, C.; Aslanidis, C. Role of lipids in pathophysiology, diagnosis and therapy of hepatocellular carcinoma. Biochim. Biophys. Acta Mol. Cell Biol. Lipids 2020, 1865, 158658. [Google Scholar] [CrossRef] [Scilit] [PubMed]
- Kong, L.; Shi, J.; Wang, S.; Huang, J.; Ge, Y.; Li, Y.; Li, K.; Zhao, M.; Li, Z.; Jin, X. Sphingolipids in human disease: Organ-specific pathologies, chain-length-dependent effects, and translational implications. J. Transl. Med. 2026, 24, 510. [Google Scholar] [CrossRef] [Scilit] [PubMed]
- Bazarganipour, S.; Hausmann, J.; Oertel, S.; El-Hindi, K.; Brachtendorf, S.; Blumenstein, I.; Kubesch, A.; Sprinzl, K.; Birod, K.; Hahnefeld, L.; et al. The Lipid Status in Patients with Ulcerative Colitis: Sphingolipids are Disease-Dependent Regulated. J. Clin. Med. 2019, 8, 971. [Google Scholar] [CrossRef] [Scilit] [PubMed]
- Elger, T.; Huss, M.; Liebisch, G.; Höring, M.; Loibl, J.; Kandulski, A.; Müller, M.; Tews, H.C.; Buechler, C. Elevated long-to-very-long-chain ceramide ratio correlates with disease severity in inflammatory bowel disease and primary sclerosing cholangitis. Sci. Rep. 2025, 15, 20294. [Google Scholar] [CrossRef] [Scilit] [PubMed]
- Ferru-Clément, R.; Boucher, G.; Forest, A.; Bouchard, B.; Bitton, A.; Lesage, S.; Schumm, P.; Lazarev, M.; Brant, S.; Duerr, R.H.; et al. Serum Lipidomic Screen Identifies Key Metabolites, Pathways, and Disease Classifiers in Crohn’s Disease. Inflamm. Bowel Dis. 2023, 29, 1024–1037. [Google Scholar] [CrossRef] [Scilit] [PubMed]
- Filimoniuk, A.; Blachnio-Zabielska, A.; Imierska, M.; Lebensztejn, D.M.; Daniluk, U. Sphingolipid Analysis Indicate Lactosylceramide as a Potential Biomarker of Inflammatory Bowel Disease in Children. Biomolecules 2020, 10, 1083. [Google Scholar] [CrossRef] [Scilit] [PubMed]
- Kubesch, A.; Neumann, E.; Mohs, K.; Gurke, R.; Zeuzem, S.; Blumenstein, I. P0019 Investigation of the serum sphingolipid and ceramide profile in patients with Crohn’s disease at different stages of the disease. Crohn’s Colitis 2025, 19, i359. [Google Scholar] [CrossRef] [Scilit]
- Tefas, C.; Ciobanu, L.; Tanțău, M.; Moraru, C.; Socaciu, C. The potential of metabolic and lipid profiling in inflammatory bowel diseases: A pilot study. Bosn. J. Basic Med. Sci. 2020, 20, 262–270. [Google Scholar] [CrossRef] [Scilit] [PubMed]
- Sjöqvist, U.; Hertervig, E.; Nilsson, Å.; Duan, R.D.; Öst, Å.; Tribukait, B.; Löfberg, R. Chronic colitis is associated with a reduction of mucosal alkaline sphingomyelinase activity. Inflamm. Bowel Dis. 2002, 8, 258–263. [Google Scholar] [CrossRef] [Scilit] [PubMed]
- Duan, R.D. Alkaline sphingomyelinase (NPP7) in hepatobiliary diseases: A field that needs to be closely studied. World J. Hepatol. 2018, 10, 246–253. [Google Scholar] [CrossRef] [Scilit] [PubMed]
- Sakata, A.; Ochiai, T.; Shimeno, H.; Hikishima, S.; Yokomatsu, T.; Shibuya, S.; Toda, A.; Eyanagi, R.; Soeda, S. Acid sphingomyelinase inhibition suppresses lipopolysaccharide-mediated release of inflammatory cytokines from macrophages and protects against disease pathology in dextran sulphate sodium-induced colitis in mice. Immunology 2007, 122, 54–64. [Google Scholar] [CrossRef] [Scilit] [PubMed]
- Xiong, Y.; Zhu, X.D.; Wan, P.; Ren, Y.P.; Wang, C.; Yan, R.W.; Guo, Y.; Bai, A.P. Inhibition of ASM activity ameliorates DSS-induced colitis in mice. Prostaglandins Other Lipid Mediat. 2019, 140, 26–30. [Google Scholar] [CrossRef] [Scilit] [PubMed]
- Furuya, H.; Ohkawara, S.; Nagashima, K.; Asanuma, N.; Hino, T. Dietary sphingomyelin alleviates experimental inflammatory bowel disease in mice. Int. J. Vitam. Nutr. Res. 2008, 78, 41–49. [Google Scholar] [CrossRef] [Scilit] [PubMed]
- Fan, F.; Mundra, P.A.; Fang, L.; Galvin, A.; Moore, X.L.; Weir, J.M.; Wong, G.; White, D.A.; Chin-Dusting, J.; Sparrow, M.P.; et al. Lipidomic Profiling in Inflammatory Bowel Disease: Comparison Between Ulcerative Colitis and Crohn’s Disease. Inflamm. Bowel Dis. 2015, 21, 1511–1518. [Google Scholar] [CrossRef] [Scilit] [PubMed]
- Banales, J.M.; Iñarrairaegui, M.; Arbelaiz, A.; Milkiewicz, P.; Muntané, J.; Muñoz-Bellvis, L.; La Casta, A.; Gonzalez, L.M.; Arretxe, E.; Alonso, C.; et al. Serum Metabolites as Diagnostic Biomarkers for Cholangiocarcinoma, Hepatocellular Carcinoma, and Primary Sclerosing Cholangitis. Hepatology 2019, 70, 547–562. [Google Scholar] [CrossRef] [Scilit] [PubMed]
- Paul, B.; Lewinska, M.; Andersen, J.B. Lipid alterations in chronic liver disease and liver cancer. JHEP Rep. 2022, 4, 100479. [Google Scholar] [CrossRef] [Scilit] [PubMed]
- Kim, Y.S.; Hurley, E.H.; Park, Y.; Ko, S. Primary sclerosing cholangitis (PSC) and inflammatory bowel disease (IBD): A condition exemplifying the crosstalk of the gut-liver axis. Exp. Mol. Med. 2023, 55, 1380–1387. [Google Scholar] [CrossRef] [Scilit] [PubMed]
- Mertz, A.; Nguyen, N.A.; Katsanos, K.H.; Kwok, R.M. Primary sclerosing cholangitis and inflammatory bowel disease comorbidity: An update of the evidence. Ann. Gastroenterol. 2019, 32, 124–133. [Google Scholar] [CrossRef] [Scilit] [PubMed]
- Bell, L.N.; Wulff, J.; Comerford, M.; Vuppalanchi, R.; Chalasani, N. Serum metabolic signatures of primary biliary cirrhosis and primary sclerosing cholangitis. Liver Int. Off. J. Int. Assoc. Study Liver 2015, 35, 263–274. [Google Scholar] [CrossRef] [Scilit] [PubMed]
- Tornai, D.; Ven, P.L.; Lakatos, P.L.; Papp, M. Serological biomarkers for management of primary sclerosing cholangitis. World J. Gastroenterol. 2022, 28, 2291–2301. [Google Scholar] [CrossRef] [Scilit] [PubMed]
- Kucharzik, T.; Dignaß, A.; Siegmund, B. Aktualisierung der S3-Leitlinie Colitis ulcerosa 2019. Z. Gastroenterol. 2019, 57, 1279–1280. [Google Scholar] [CrossRef] [Scilit] [PubMed]
- Sturm, A.; Maaser, C.; Calabrese, E.; Annese, V.; Fiorino, G.; Kucharzik, T.; Vavricka, S.R.; Verstockt, B.; van Rheenen, P.; Tolan, D.; et al. ECCO-ESGAR Guideline for Diagnostic Assessment in IBD Part 2: IBD scores and general principles and technical aspects. J. Crohns Colitis 2019, 13, 273–284. [Google Scholar] [CrossRef] [Scilit] [PubMed]
- EASL. EASL Clinical Practice Guidelines on sclerosing cholangitis. J. Hepatol. 2022, 77, 761–806. [Google Scholar] [CrossRef] [Scilit] [PubMed]
- Moein, S.; Qujeq, D.; Vaghari Tabari, M.; Kashifard, M.; Hajian-Tilaki, K. Diagnostic accuracy of fecal calprotectin in assessing the severity of inflammatory bowel disease: From laboratory to clinic. Casp. J. Intern. Med. 2017, 8, 178–182. [Google Scholar] [CrossRef] [Scilit] [PubMed]
- Vermeire, S.; Van Assche, G.; Rutgeerts, P. Laboratory markers in IBD: Useful, magic, or unnecessary toys? Gut 2006, 55, 426–431. [Google Scholar] [CrossRef] [Scilit] [PubMed]
- Schafer, S.K.; Weidner, K.J.; Hoppner, J.; Becker, N.; Friedrich, D.; Stokes, C.S.; Lammert, F.; Kollner, V. Design and validation of a German version of the GSRS-IBS—An analysis of its psychometric quality and factorial structure. BMC Gastroenterol. 2017, 17, 139. [Google Scholar] [CrossRef] [Scilit] [PubMed]
- Goertz, R.S.; GaBmann, L.; Strobel, D.; Wildner, D.; Schellhaas, B.; Neurath, M.F.; Pfeifer, L. Acoustic Radiation Force Impulse (ARFI) Elastography in Autoimmune and Cholestatic Liver Diseases. Ann. Hepatol. 2019, 18, 23–29. [Google Scholar] [CrossRef] [Scilit] [PubMed]
- Sporea, I.; Bota, S.; Sirli, R.; Popescu, A.; Danila, M.; Jurchis, A.; Gradinaru-Tascau, O.; Martie, A. The usefulnes of Acoustic Radiation Force Impulse (ARFI) Elastography (ARFI) for evaluation of liver fibrosis—Large monocentric experience. Ultraschall Med. 2013, 34, WS_SL1_07. [Google Scholar] [CrossRef] [Scilit]
- Bligh, E.G.; Dyer, W.J. A rapid method of total lipid extraction and purification. Can. J. Biochem. Physiol. 1959, 37, 911–917. [Google Scholar] [CrossRef] [Scilit] [PubMed]
- Höring, M.; Ejsing, C.S.; Krautbauer, S.; Ertl, V.M.; Burkhardt, R.; Liebisch, G. Accurate quantification of lipid species affected by isobaric overlap in Fourier-transform mass spectrometry. J. Lipid Res. 2021, 62, 100050. [Google Scholar] [CrossRef] [Scilit] [PubMed]
- Höring, M.; Ejsing, C.S.; Hermansson, M.; Liebisch, G. Quantification of Cholesterol and Cholesteryl Ester by Direct Flow Injection High-Resolution Fourier Transform Mass Spectrometry Utilizing Species-Specific Response Factors. Anal. Chem. 2019, 91, 3459–3466. [Google Scholar] [CrossRef] [Scilit] [PubMed]
- Matysik, S.; Elger, T.; Huss, M.; Liebisch, G.; Höring, M.; Loibl, J.; Kandulski, A.; Müller, M.; Tews, H.C.; Buechler, C. Unique sterol metabolite shifts in inflammatory bowel disease and primary sclerosing cholangitis. J. Steroid Biochem. Mol. Biol. 2025, 245, 106621. [Google Scholar] [CrossRef] [Scilit] [PubMed]
- Dave, M.; Elmunzer, B.J.; Dwamena, B.A.; Higgins, P.D.R. Primary sclerosing cholangitis: Meta-analysis of diagnostic performance of MR cholangiopancreatography. Radiology 2010, 256, 387–396. [Google Scholar] [CrossRef] [Scilit] [PubMed]
- Lutz, H.H.; Trautwein, C.; Tischendorf, J.W. Primary sclerosing cholangitis: Diagnosis and treatment. Dtsch. Arztebl. Int. 2013, 110, 867–874. [Google Scholar] [CrossRef] [Scilit] [PubMed][Green Version]
- Modha, K.; Navaneethan, U. Diagnosis and management of primary sclerosing cholangitis-perspectives from a therapeutic endoscopist. World J. Hepatol. 2015, 7, 799–805. [Google Scholar] [CrossRef] [Scilit] [PubMed]
- Yasuda, M.; Shiokawa, M.; Kuwada, T.; Nishikawa, Y.; Nakanishi, R.; Takimoto, I.; Chikugo, K.; Yokode, M.; Muramoto, Y.; Matsumoto, S.; et al. Anti-integrin αvβ6 autoantibody in primary sclerosing cholangitis: A Japanese nationwide study. J. Gastroenterol. 2025, 60, 118–126. [Google Scholar] [CrossRef] [Scilit] [PubMed]
- Meikle, T.G.; Huynh, K.; Giles, C.; Meikle, P.J. Clinical lipidomics: Realizing the potential of lipid profiling. J. Lipid Res. 2021, 62, 100127. [Google Scholar] [CrossRef] [Scilit] [PubMed]
- Kennedy, N.A.; Clark, A.; Walkden, A.; Chang, J.C.; Fasci-Spurio, F.; Muscat, M.; Gordon, B.W.; Kingstone, K.; Satsangi, J.; Arnott, I.D.; et al. Clinical utility and diagnostic accuracy of faecal calprotectin for IBD at first presentation to gastroenterology services in adults aged 16-50 years. J. Crohns Colitis 2015, 9, 41–49. [Google Scholar] [CrossRef] [Scilit] [PubMed]
- Wiegmann, K.; Schutze, S.; Machleidt, T.; Witte, D.; Kronke, M. Functional dichotomy of neutral and acidic sphingomyelinases in tumor necrosis factor signaling. Cell 1994, 78, 1005–1015. [Google Scholar] [CrossRef] [Scilit] [PubMed]
- Alghoul, Z.; Yang, C.; Merlin, D. The Current Status of Molecular Biomarkers for Inflammatory Bowel Disease. Biomedicines 2022, 10, 1492. [Google Scholar] [CrossRef] [Scilit] [PubMed]
- Baldan-Martin, M.; Chaparro, M.; Gisbert, J.P. Systematic Review: Urine Biomarker Discovery for Inflammatory Bowel Disease Diagnosis. Int. J. Mol. Sci. 2023, 24, 10159. [Google Scholar] [CrossRef] [Scilit] [PubMed]
- Hassanein, M.; Xi, L.; Ryan, R.D.; Ye, Z.H.; Tania, N.; Sano, Y.; Varghese, J.; Branquinho, D.; Sapone, A. Advancing IBD Management: A Literature Review on the Role of Non-Invasive Blood-Based Biomarkers in Predicting and Assessing Pharmacodynamic Response to Treatment. Clin. Transl. Sci. 2026, 19, e70562. [Google Scholar] [CrossRef] [Scilit] [PubMed]
- Anbazhagan, A.N.; Priyamvada, S.; Alrefai, W.A.; Dudeja, P.K. Pathophysiology of IBD associated diarrhea. Tissue Barriers 2018, 6, e1463897. [Google Scholar] [CrossRef] [Scilit] [PubMed]

Disclaimer/Publisher’s Note: The statements, opinions and data contained in all publications are solely those of the individual author(s) and contributor(s) and not of MDPI and/or the editor(s). MDPI and/or the editor(s) disclaim responsibility for any injury to people or property resulting from any ideas, methods, instructions or products referred to in the content. |
© 2026 by the authors. Licensee MDPI, Basel, Switzerland. This article is an open access article distributed under the terms and conditions of the Creative Commons Attribution (CC BY) license.