


Abstract
The Paleogene deep tight glutenite reservoirs in the Bohai Sea area feature strong heterogeneity and complex pore structures, posing significant challenges to the seismic prediction of sweet-spot reservoirs. Uncertain reservoir-sensitive factors and insufficient large-angle information from seismic gathers, together with the low accuracy of conventional prestack density inversion, lead to considerable porosity prediction errors and make it difficult to identify high-quality reservoirs. To address these issues, this study proposes a novel prestack density inversion method constrained by an elastic decoupling factor (EDF) for porosity prediction in tight reservoirs. First, rock physics modeling is performed using a variable aspect ratio Xu–White model, based on which a reservoir-type indicator and a porosity-sensitive factor are constructed to establish differentiated solution equations among density, Poisson’s ratio, and porosity. Second, to overcome the strong dependence of density inversion on large-angle information, an EDF is formulated to decouple density from S-wave impedance, thereby reducing inversion non-uniqueness. Simultaneously, compressed sensing technology based on -norm regularization and basis pursuit is introduced to obtain high-resolution P-wave impedance, S-wave impedance, and Poisson’s ratio, providing high-quality inputs for density decoupling. Based on the above methods, the solution equations between density and porosity are integrated to achieve classified and quantitative porosity prediction for tight reservoirs. Application to the deep Kongdian Formation glutenite reservoirs in the Bozhong 28 area, Bohai Sea, shows that the predicted porosity matches measured porosity with an accuracy of 82% (average relative error of 18.5%), and the correlation coefficient of the inverted density is improved from 62% (conventional simultaneous inversion) to 85%. Furthermore, an approximately 10 m thick mudstone interlayer is clearly resolved. Blind well BZ28-L validation confirms good agreement between predictions and actual drilling data. This work provides a valuable reference for sweet-spot prediction in similar deep fan-delta tight reservoirs.
1. Introduction
After more than fifty years of oil and gas exploration in the Bohai Sea, the growth of proven reserves in mid-shallow layers and buried hill zones has gradually slowed down. Consequently, the Paleogene deep to ultra-deep strata have become the key target for current and future reserve and production increases. In recent years, hydrocarbon-bearing structures such as sublacustrine fans and glutenite reservoirs have been discovered in the Paleogene strata of this area. However, due to poor reservoir physical properties and strong heterogeneity, most of these structures have failed to achieve commercial breakthroughs [1]. Among them, fan-delta glutenite reservoirs, as an important reservoir type, are generally characterized by deep burial depth, strong compaction, and complex pore structures [2]. The spatial distribution and quantitative prediction of high-quality reservoirs have thus become a critical bottleneck constraining exploration decisions in deep strata. Traditional prediction methods face the following challenges: (1) rock physical parameters are significantly influenced by mineral composition, cementation, and diagenesis, making it difficult to accurately predict porosity using traditional empirical formulas; and (2) the effective incidence angle range of middle-to-deep seismic data is limited, and conventional prestack inversion methods struggle to accurately invert density parameters. Therefore, developing a targeted reservoir prediction technology system is of great significance for improving the success rate of Paleogene hydrocarbon exploration in the Bohai Bay Basin.
Currently, deep reservoir prediction primarily employs prestack inversion or stochastic inversion methods, utilizing elastic parameters such as wave impedance and density for reservoir identification [3]. In 1997, Goodway et al. [4] introduced parameters such as λρ and μρ into lithology identification using P- and S-wave inversion, achieving good results. In 2007, Chopra S et al. [5] systematically summarized the physical significance, calculation methods, and applications of various seismic attributes in reservoir characterization. Zong et al. [6] developed a method based on the Müller formula to directly invert Lamé parameters from seismic data, avoiding the errors caused by indirect conversion. Zhang et al. [7] proposed a prestack seismic inversion method based on rock physics models and successfully applied it to shale gas reservoir studies. Gong et al. [8] proposed a prestack seismic inversion method for dual-porosity systems based on decoupled equivalent medium theory, providing a reference for pore structure modeling in tight reservoirs. For the quantitative seismic characterization of pore structures, Lian and Zong [9] achieved direct prestack seismic prediction of permeability, pore structure, and other parameters based on rock physics model approximations. Yang et al. [10] established a complex mapping relationship between elastic parameters and porosity using P-wave velocity and density derived from prestack simultaneous inversion, combined with a bidirectional gated recurrent unit and attention mechanism to enable porosity prediction.
For density inversion, conventional methods are based on approximations of the Zoeppritz equation [11], in which the coefficient of the density term contributes very little at small incidence angles. Wu et al. [12] pointed out that when the incidence angle exceeds 30°, routine prestack AVO inversion based on linearized approximation models struggles to yield high-precision results. In addition, Kalashnikova and Øverås [13] noted that routine NMO correction causes amplitude stretching, which distorts critical amplitude information and further degrades the data quality of mid-deep large-angle gathers. The maximum effective angle of middle-to-deep seismic gathers in Bohai Oilfield is typically only around 35°, which theoretically limits the accuracy of density inversion. Therefore, the development of new inversion methods is urgently required.
To address these challenges, this paper proposes a new method for tight reservoir porosity prediction using elastic decoupling factor (EDF)-constrained prestack density inversion. By introducing a variable aspect ratio rock physics model, a reservoir-type indicator and a porosity-sensitive factor are constructed to effectively characterize reservoir heterogeneity, establishing a quantitative mapping relationship among density, Poisson’s ratio, and porosity. To overcome the difficulty in utilizing large-angle reflection information, an EDF is innovatively formulated to establish a solution relationship between S-wave impedance and density, significantly reducing the non-uniqueness of density inversion. Meanwhile, compressed sensing theory is introduced into prestack three-parameter inversion, effectively improving the inversion accuracy and resolution of P-wave impedance, S-wave impedance, and Poisson’s ratio. On this basis, high-precision porosity prediction for tight reservoirs is achieved by integrating the density solution relationship and the quantitative porosity mapping relationship. The proposed method has been successfully applied to the deep Paleogene fan-delta glutenite reservoirs in the Bozhong 28 area, providing an effective solution for sweet-spot prediction in deep glutenite reservoirs under similar geological conditions.
2. Geological Setting
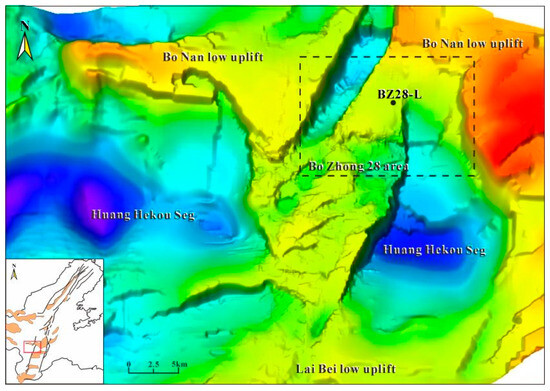
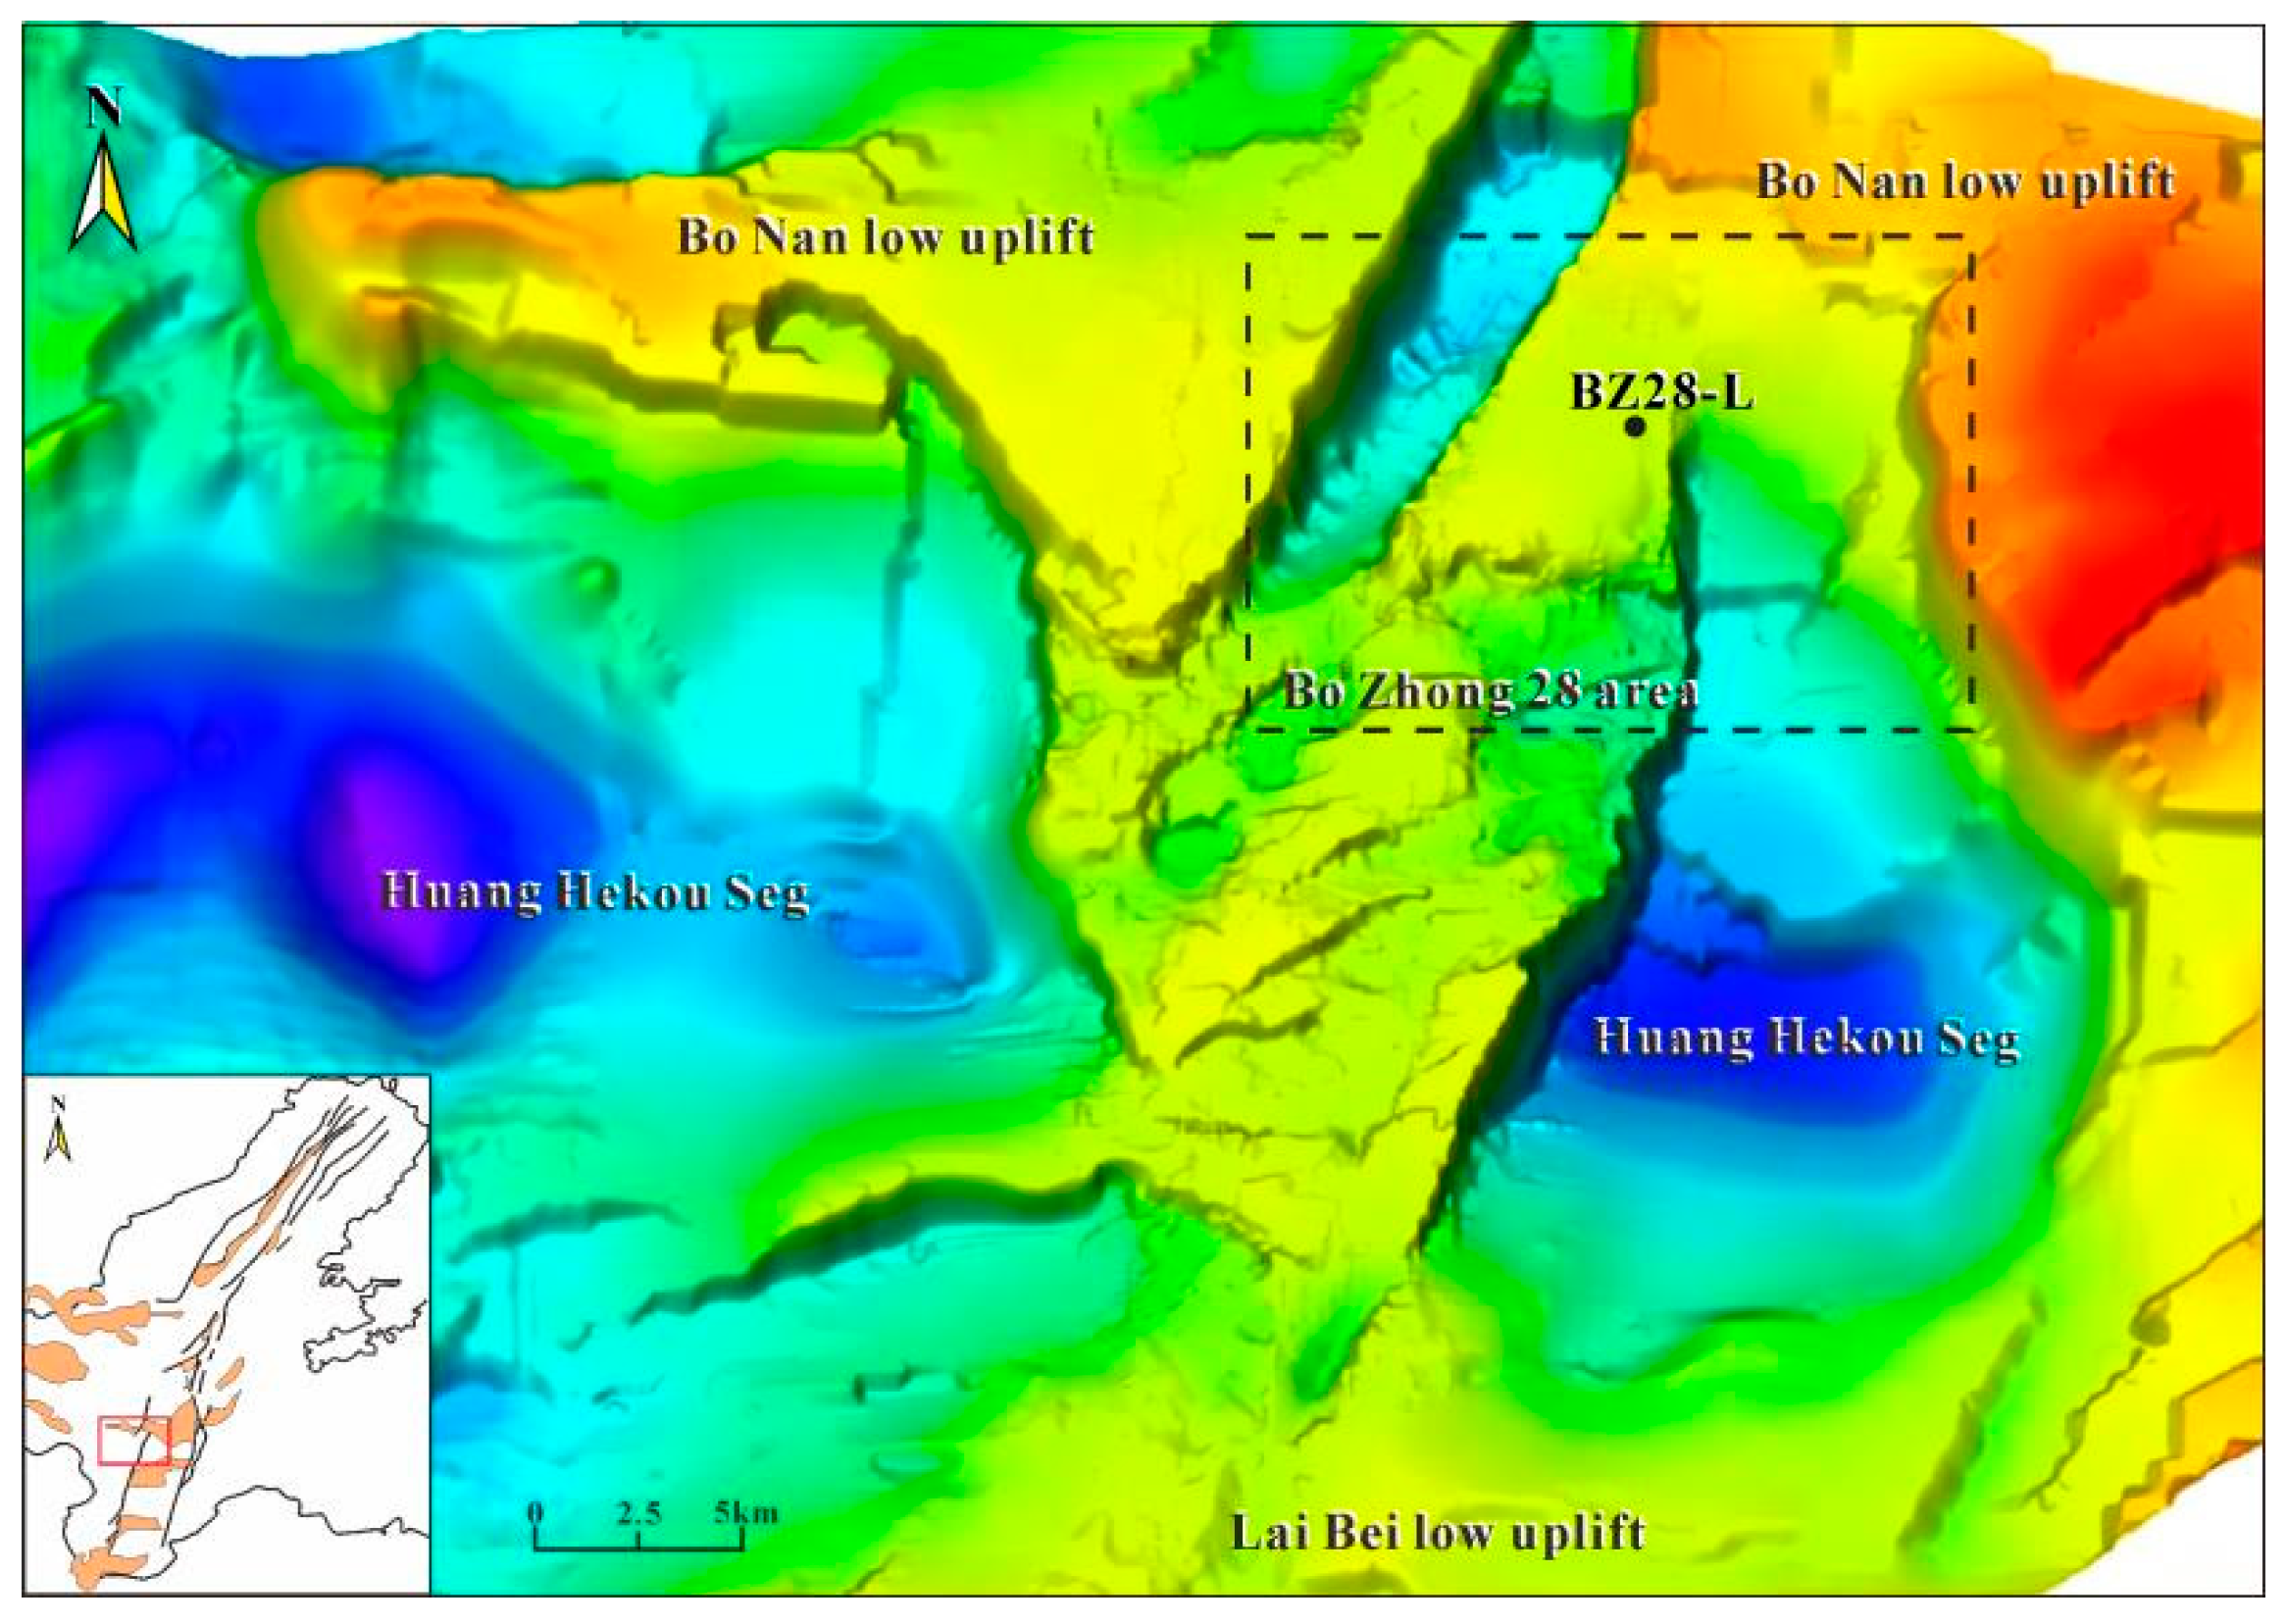
The Bozhong 28 area is located in the Bozhong Depression of the Bohai Bay Basin (Figure 1). It is bounded to the north by the Bonan low uplift and to the south by the Huanghekou Sag, offering favorable conditions for hydrocarbon migration and accumulation. Structurally, two strike–slip faults have developed on the eastern and western sides of the area, forming a horst block that is higher in the north and lower in the south. During the sedimentary period of the Kongdian Formation, clastic materials from northern uplift were transported into the lake and rapidly accumulated, forming large-scale, near-source fan-deltaic deposits. These deposits provided the sediment supply for the widespread development of deep tight glutenite reservoirs.
Figure 1.
Location of Bozhong 28 area in Bohai Bay Basin. Colors denote structural elevation. The dashed box represents the Bozhong 28 area, and the red box in the inset map indicates the geographic extent of this main map within the Bohai Sea.
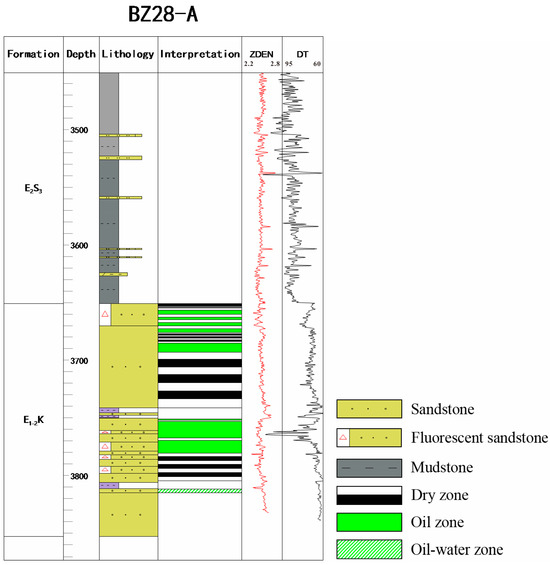
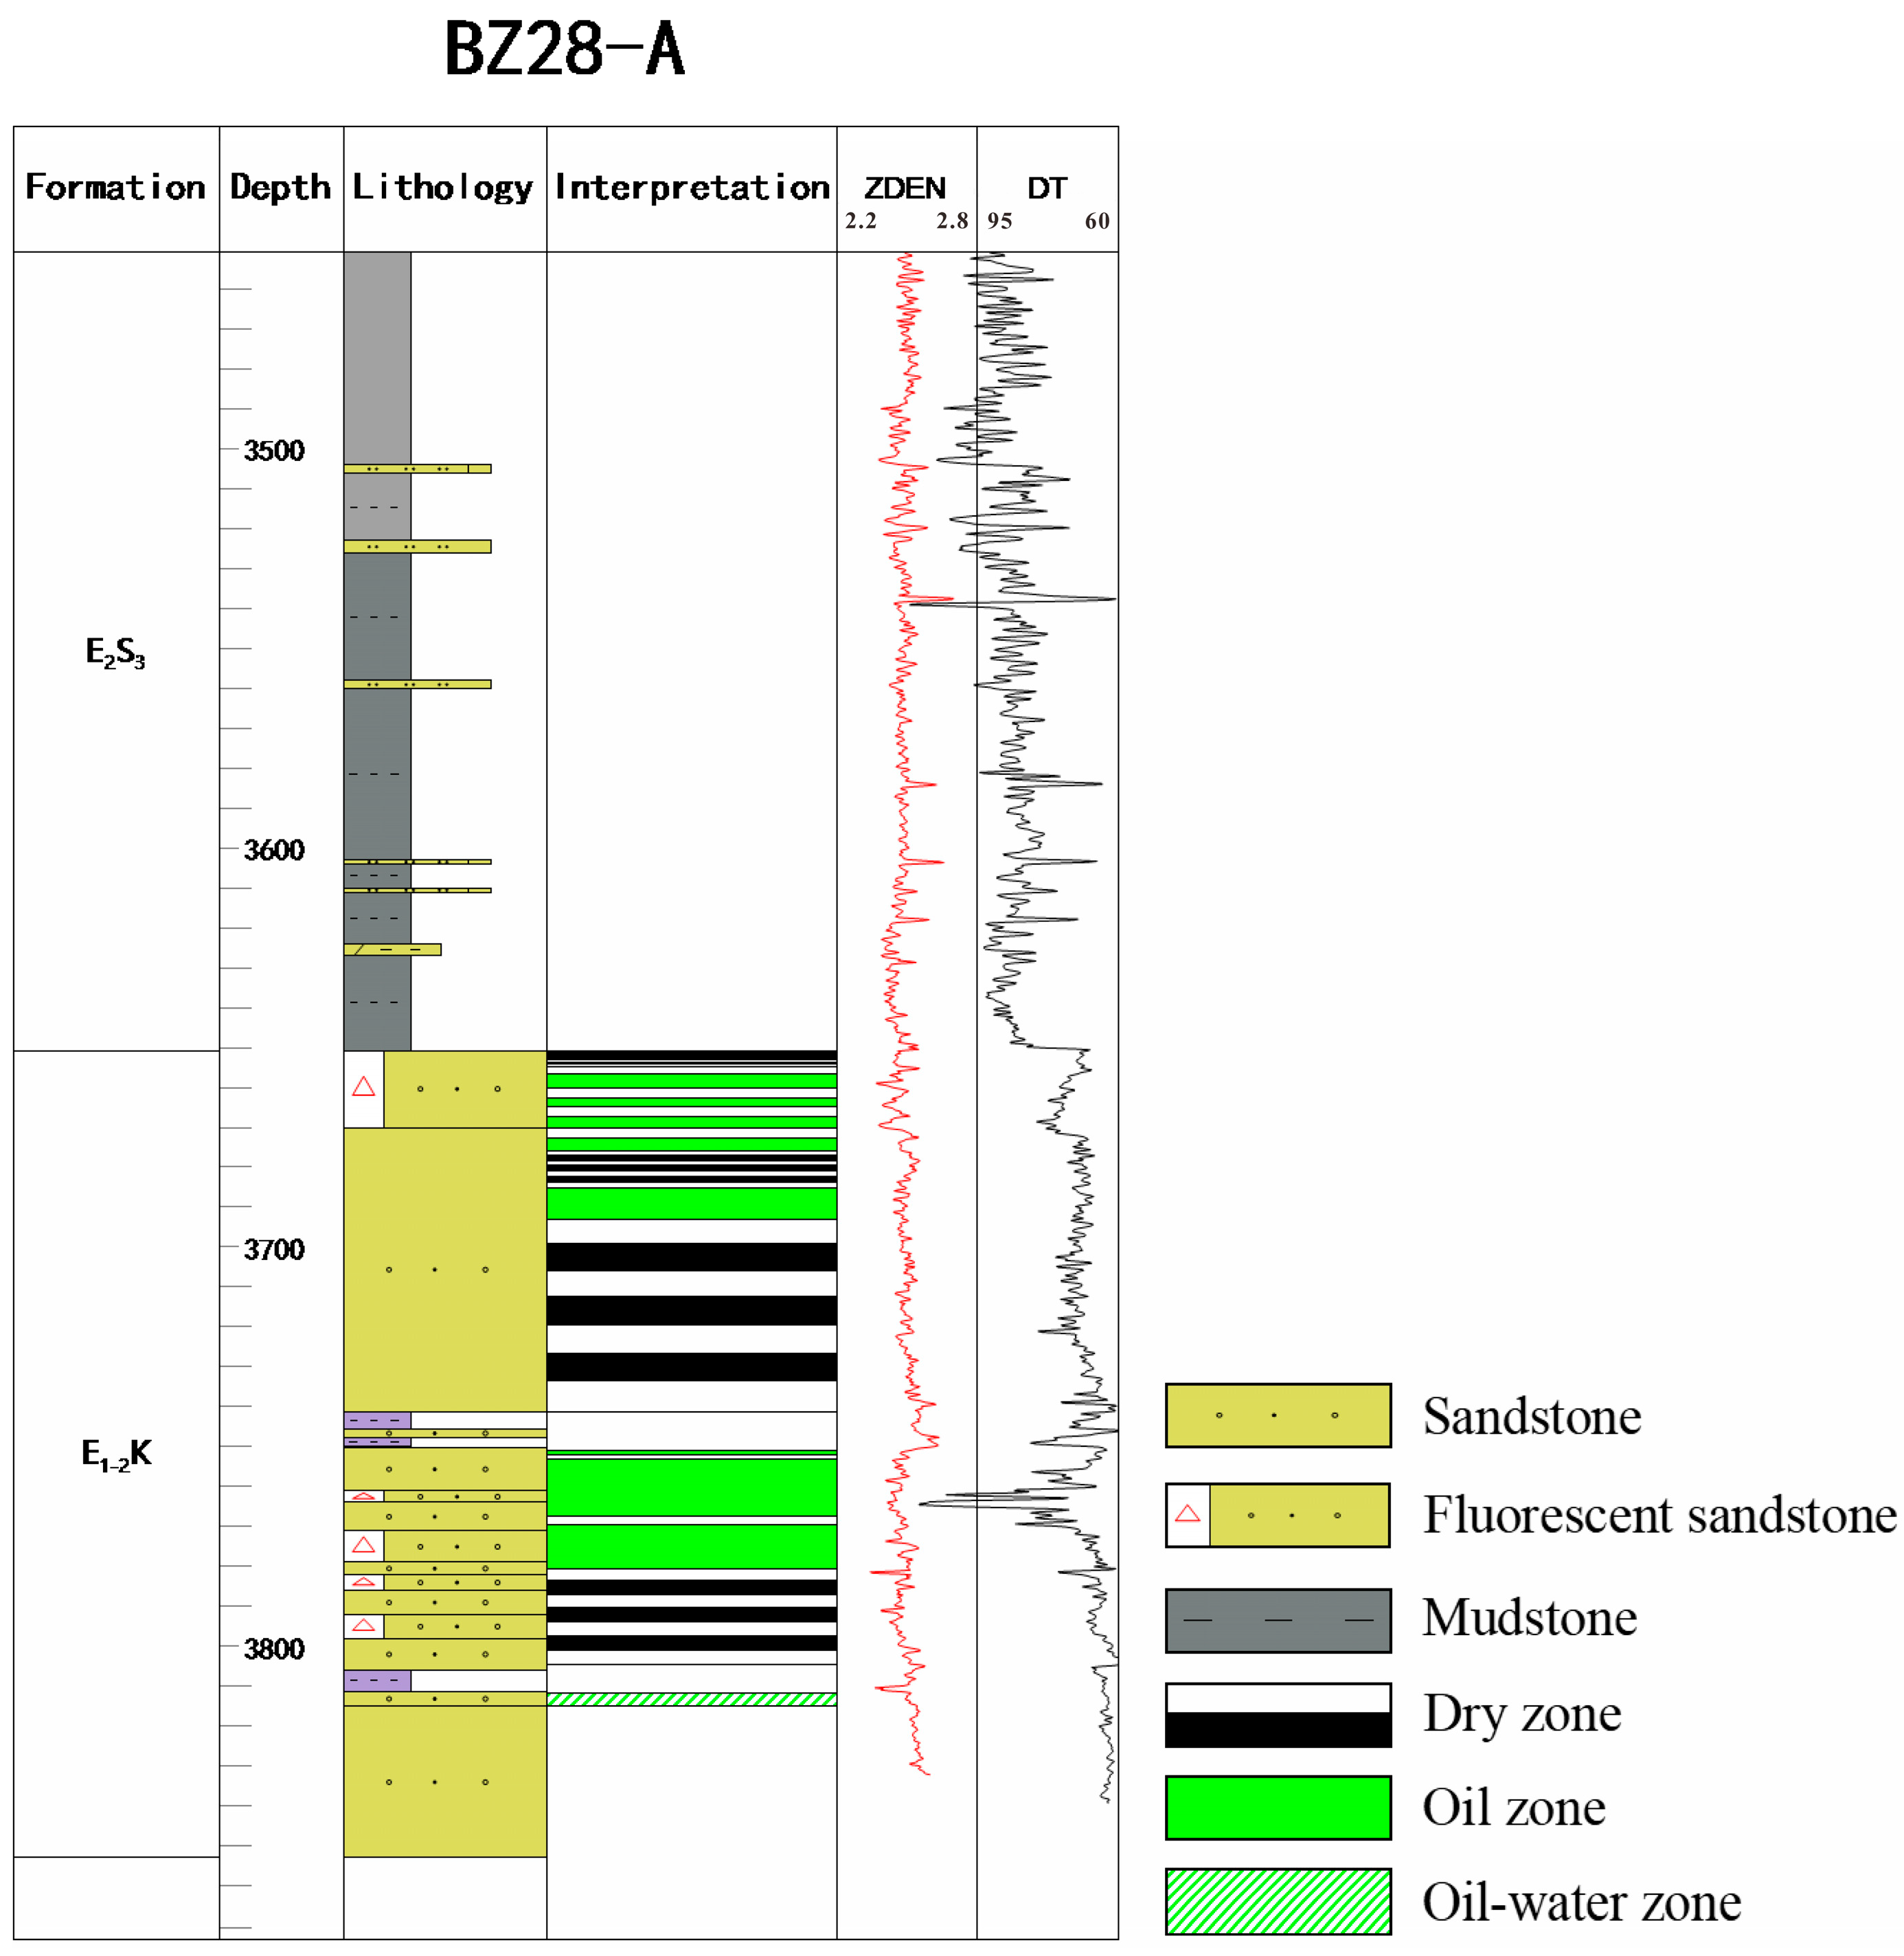
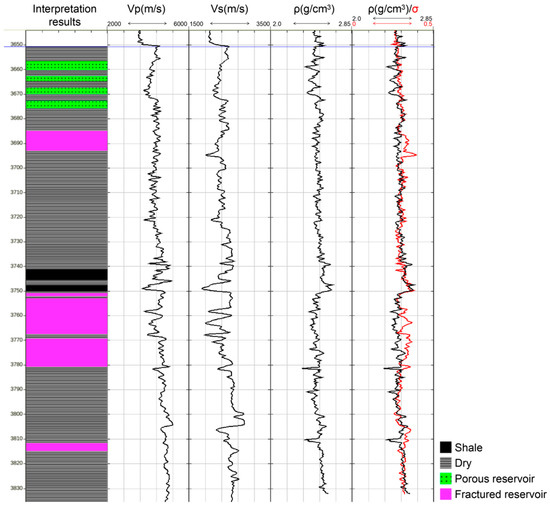
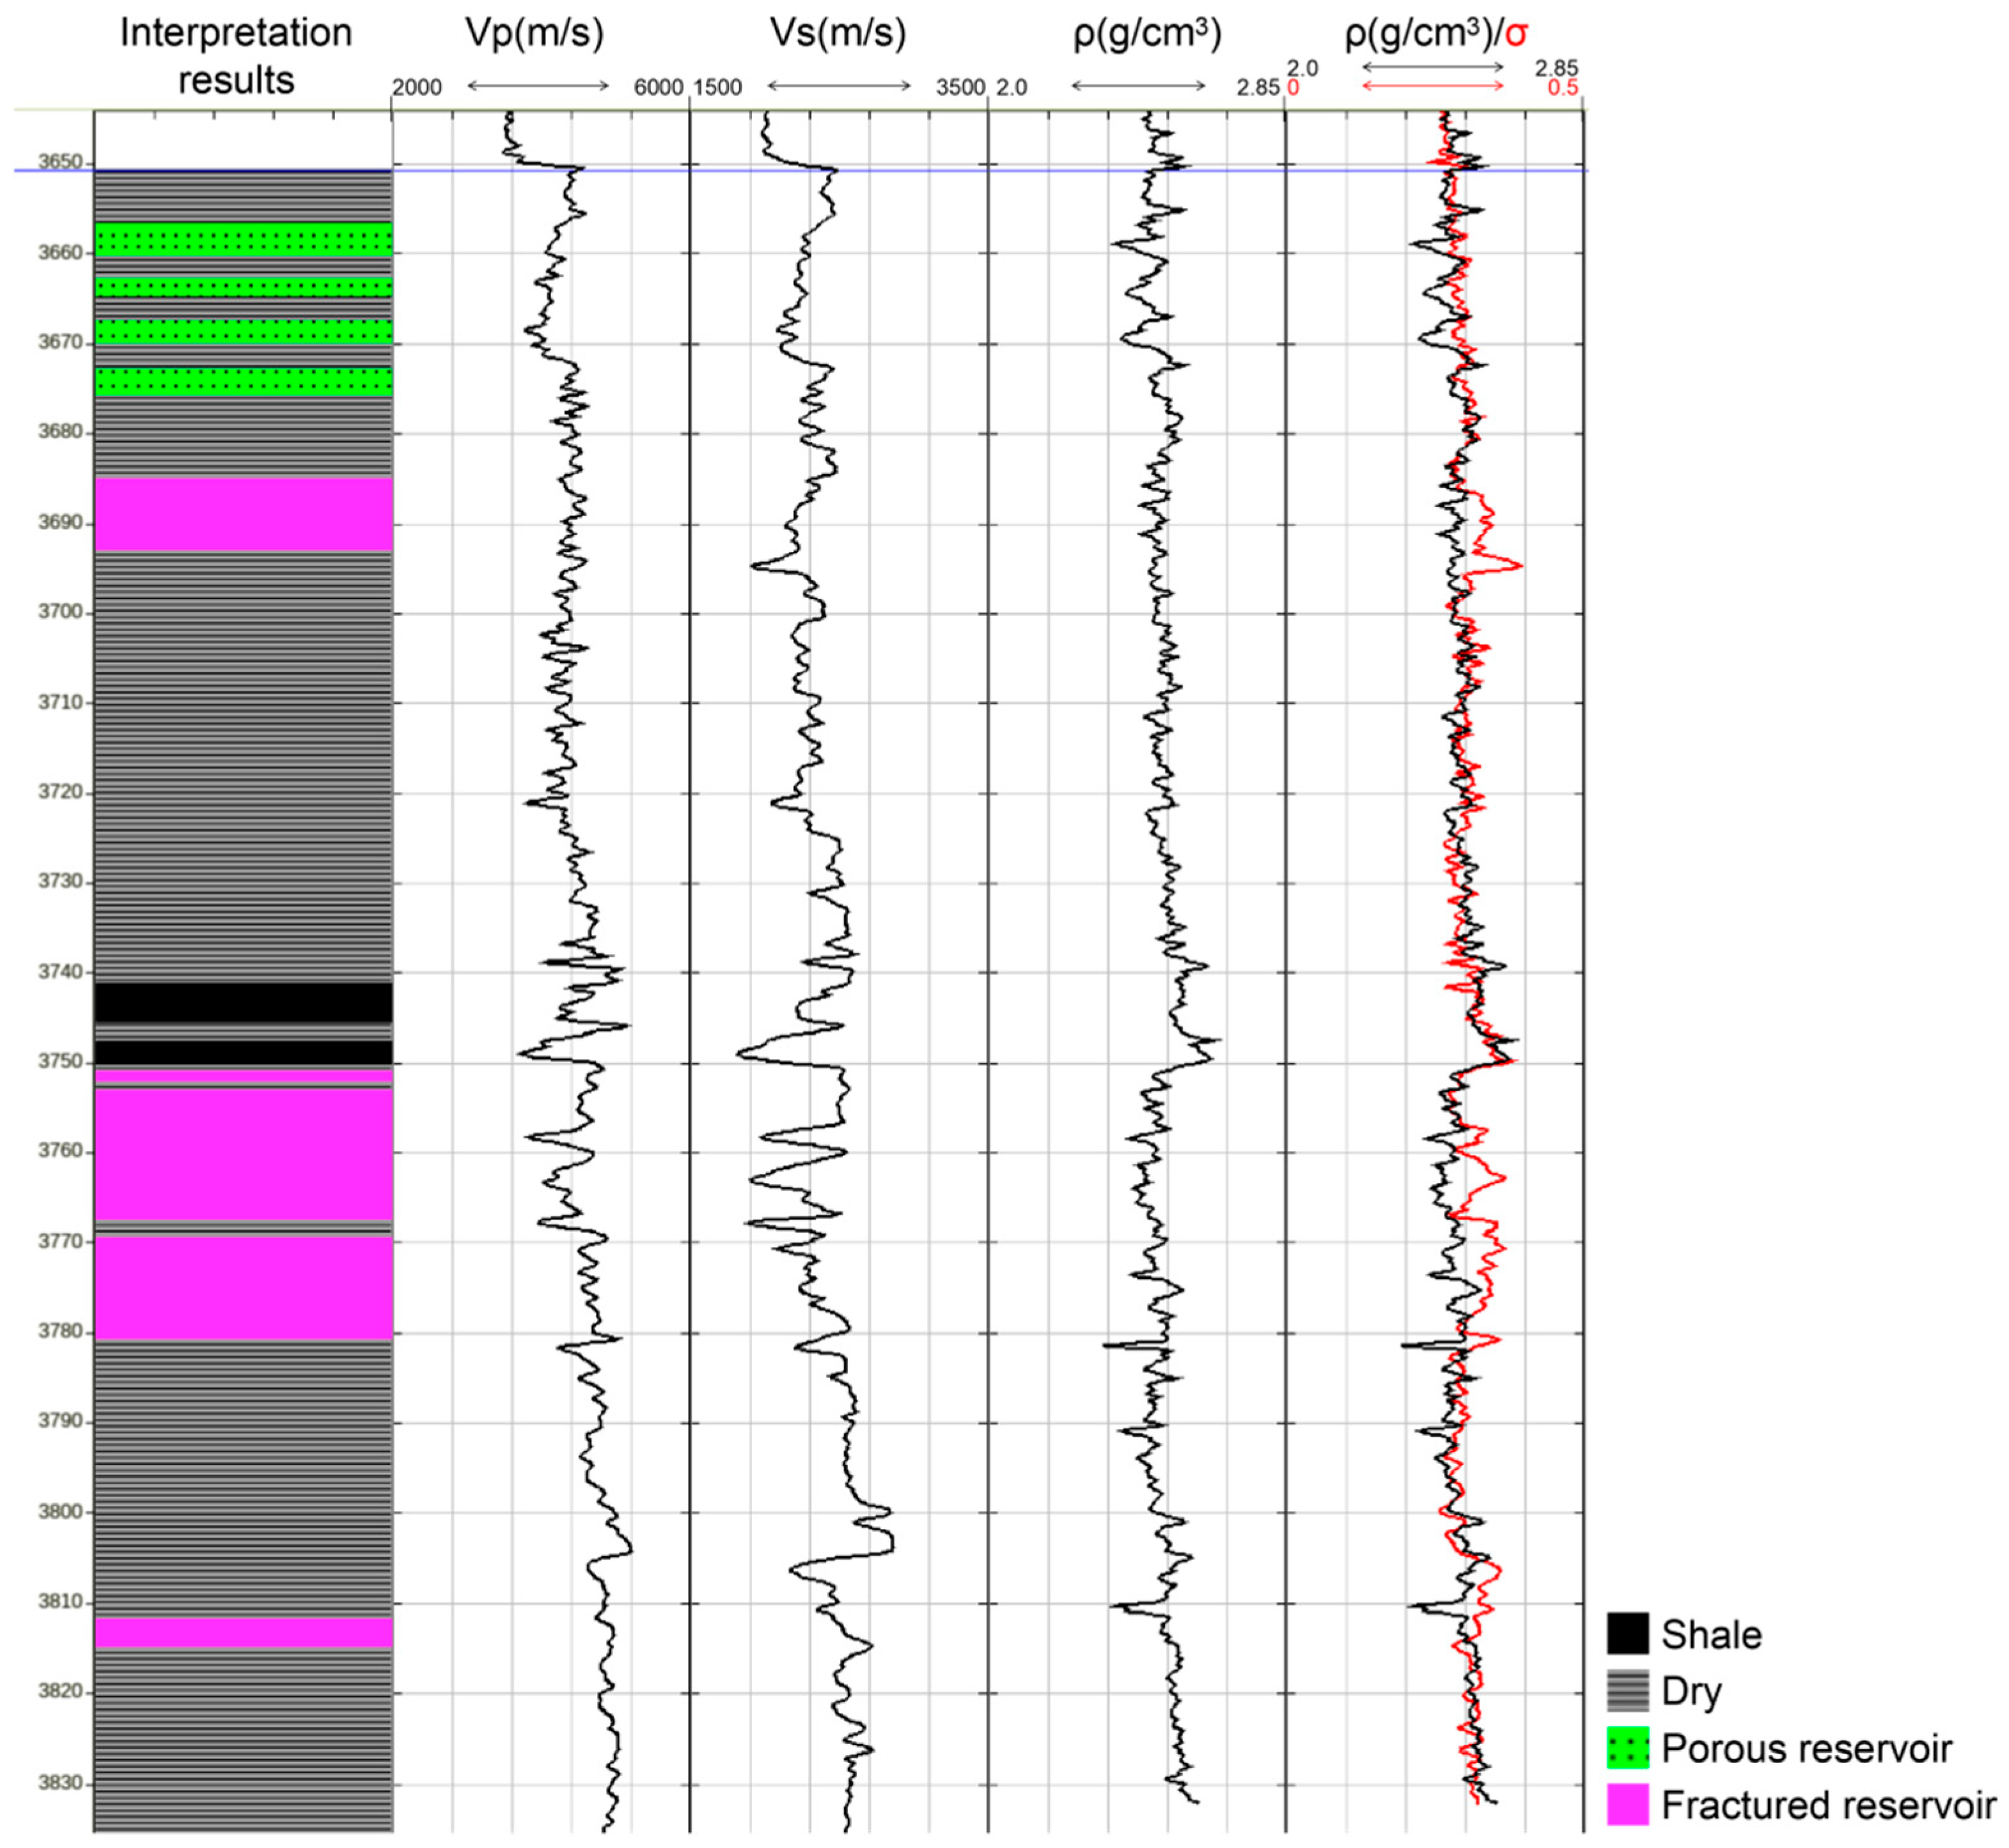
Drilling results reveal that the study area comprises the Kongdian Formation and the Shahejie Formation (Figure 2). The target interval of this study is the Kongdian Formation, which lies at a deep-buried depth and has a thickness of ~200 m. This formation is dominated by glutenite interbedded with dark mudstone and exhibits strong reservoir heterogeneity. The overlying Shahejie Formation consists mainly of stable lacustrine mudstone, forming an effective reservoir-cap assemblage with the Kongdian glutenite reservoirs. However, due to compaction at middle-to-deep burial depths, these glutenite reservoirs are relatively tight with poor physical properties. Therefore, identifying sweet spots with high porosity has become a key challenge in exploration.
Figure 2.
Comprehensive stratigraphic and reservoir column of Well BZ28-A.
3. Materials and Methods
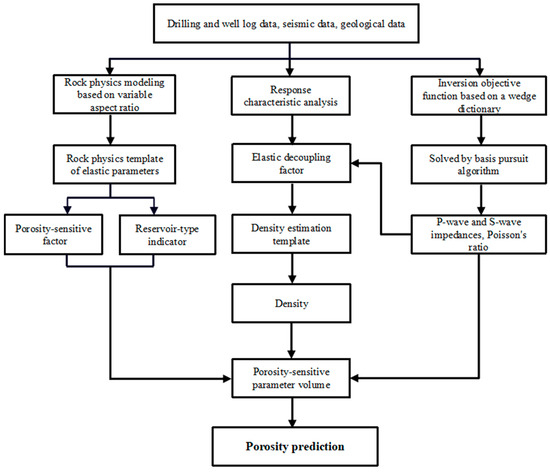
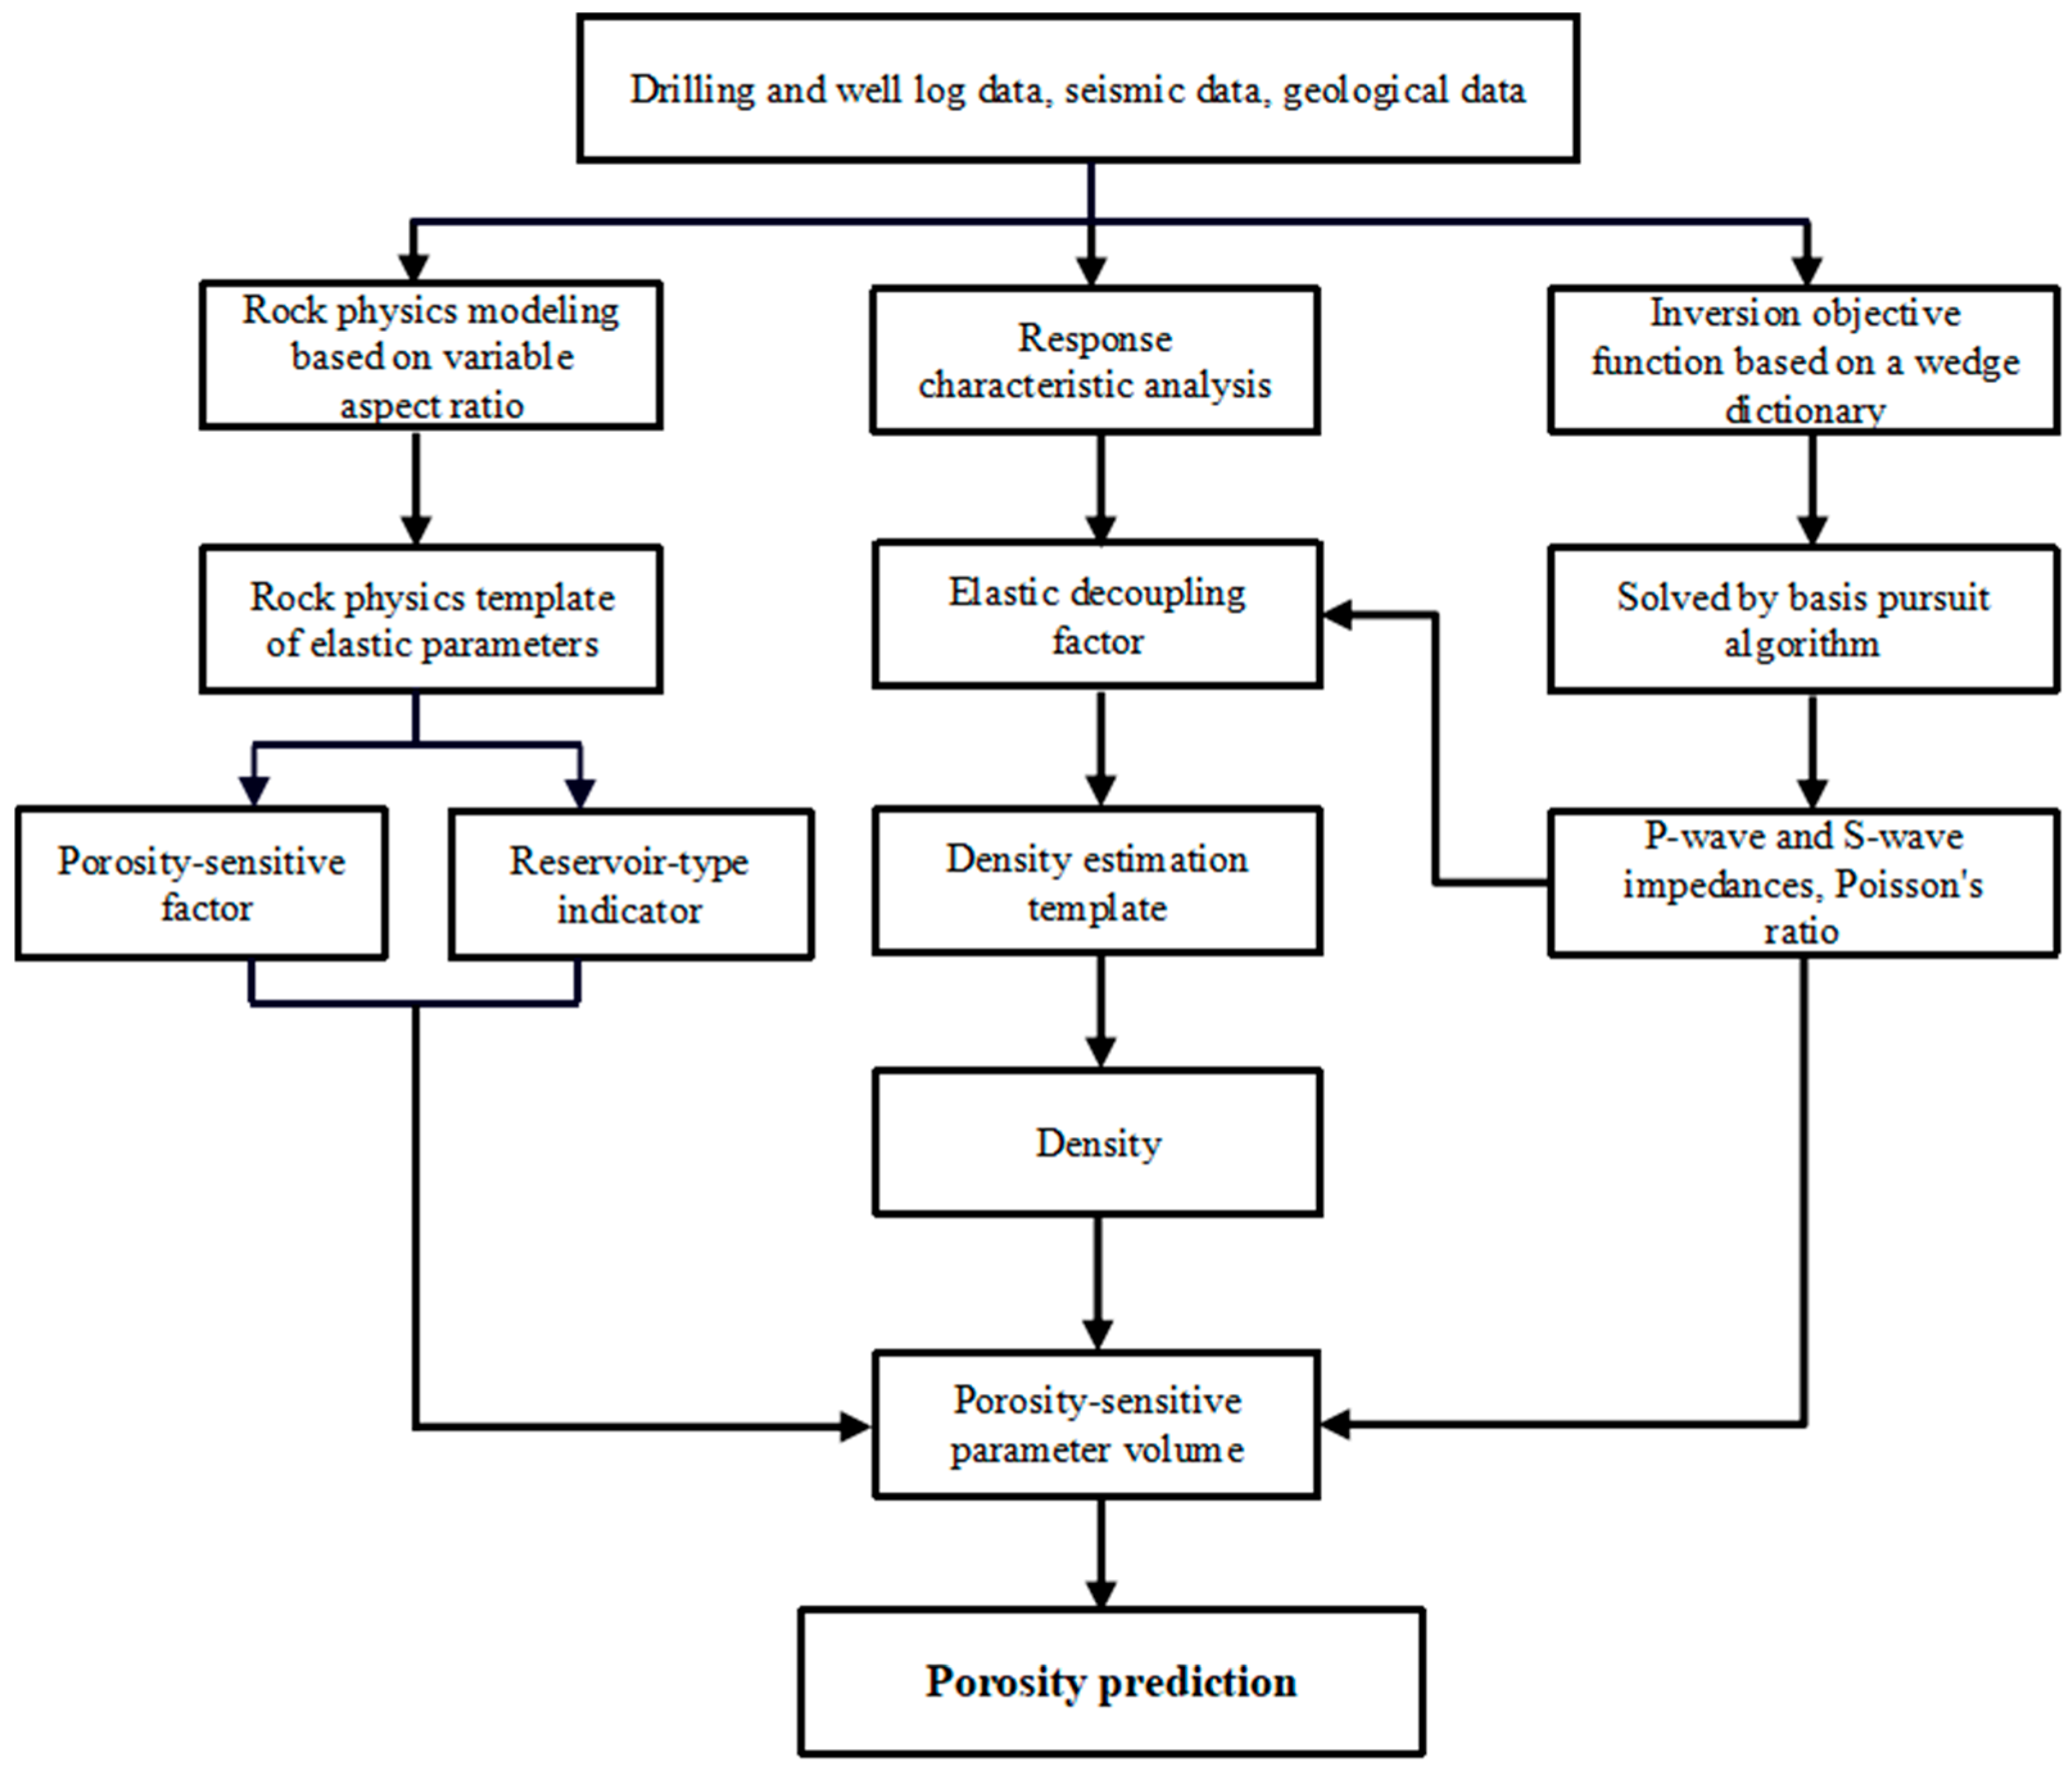
The aim of this study is to construct reservoir prediction technology that integrates rock physics modeling, prestack density inversion, and porosity prediction, enabling high-precision porosity prediction of the Kongdian Formation low-permeability glutenite reservoirs in the research area. The technical workflow follows a stepwise collaborative optimization sequence of “rock physics modeling, compressed sensing, density inversion, porosity prediction” (Figure 3). First, rock physics modeling based on variable aspect ratios is conducted to clarify the elastic response of the two reservoir space types. During this process, a porosity-sensitive factor and a reservoir-type indicator are constructed, providing a rock physics basis for subsequent inversion interpretation and density decoupling. Second, a high-resolution prestack elastic parameter inversion method based on compressed sensing is introduced to overcome the bandwidth limitation of conventional inversion, yielding high-precision P-wave impedance, S-wave impedance, and Poisson’s ratio volumes. On this basis, density parameters are directly decoupled from S-wave impedance using the EDF, thereby overcoming the difficulty in density inversion caused by poor quality of large-angle gathers. Finally, reservoir space types are identified using the reservoir-type indicator, and differentiated porosity-sensitive factor versus porosity mapping relationships are applied to achieve fine, classification-based porosity calculation. This workflow establishes a rigorous data- and model-driven chain, ensuring both accuracy and stability in the final porosity prediction, and provides a reliable technical solution for reservoir evaluation in deep heterogeneous glutenite reservoirs.
Figure 3.
Workflow for porosity prediction of glutenite reservoirs.
3.1. Curve Reconstruction via Variable Aspect Ratio Rock Physics Modeling
The target layer of the study area is fan-delta deposition, with the lithology primarily characterized by glutenite interbedded with mudstone. The rock matrix minerals are mainly composed of quartz and clay. Based on pore structure characteristics, the reservoirs can be classified into two types: pore-type reservoirs, dominated by nearly circular pores; and fracture-type reservoirs, dominated by flattened pores [14]. In response to these reservoir characteristics, this study introduces variable aspect ratios into the Xu–White model to distinguish different types of reservoir space, thereby constructing a rock physics model that better reflects the actual geological conditions [15]. In recent years, digital rock physics has also been employed to characterize the elastic response of complex deep pore structures, providing important insights for multi-type reservoir modeling [16,17,18].
The specific steps for rock physics modeling are as follows: 1. The Voigt–Reuss–Hill average model is used to calculate the equivalent modulus of the mixed minerals composed of clay and quartz. 2. Based on the aspect ratios of pore-type and fracture-type reservoir spaces, the Kuster–Toksöz model and the Differential Equivalent Medium (DEM) model are applied to combine the mixed minerals with the pore space, thereby obtaining the equivalent modulus of the rock skeleton for the two types of reservoir spaces. 3. The Batzle–Wang model is used to calculate the bulk modulus of pure formation fluids [19]. 4. The Wood equation is used to obtain the bulk modulus of the mixed formation fluid. 5. The Gassmann equation is used to incorporate the mixed fluid into the rock frameworks of the two reservoir types, followed by a weighted average based on their respective proportions, ultimately obtaining the elastic modulus of the saturated rock [20].
For any rock, given the percentage content of its constituent components, the exact value of its equivalent modulus depends on the rock’s microscopic geometric details. The hardest and softest pore geometries define the upper and lower bounds of the equivalent modulus after mixing. When the geometric details are unknown, the Voigt–Reuss–Hill bounds can be adopted as the allowable range [21]. The expression is as follows:
In which is the equivalent modulus of the composite mineral; KV and KR are the upper and lower bounds of the equivalent modulus, respectively; Ki and fi are the theoretical values of the elastic modulus and the content of each component, respectively.
The Kuster–Toksöz model describes the equivalent modulus of a rock medium after the introduction of inclusions. However, this model requires extremely low rock porosity. To overcome this limitation, Xu and White introduced the DEM model to construct a rock physics model that better reflects the characteristics of real-world reservoirs. In this method, one component is designated as the primary mineral. Starting from an ideal, pore-free rock matrix, smaller pores are gradually added, and the process is iterated until the cumulative porosity reaches the total porosity of the rock, thereby obtaining the equivalent modulus of the rock–pore mixture. For a dry rock skeleton containing pores, the DEM model can be expressed as follows [22]:
in which represents porosity; and are the equivalent bulk modulus and shear modulus, respectively, after the gradual incorporation of pores into the rock; represents the percentage content of each component; and and are the geometric coefficients of the equivalent bulk modulus and shear modulus, respectively, which are related to the aspect ratio of the pores.
The Kuster–Toksöz model can only simulate the modulus of saturated rock at very high frequencies. Therefore, to simulate the modulus of rock under low-frequency conditions, the equivalent modulus of the rock skeleton, which is the equivalent modulus when the pores are fluid-free, should first be obtained through the Kuster–Toksöz model, and then the Gassmann equation is used to simulate the equivalent modulus of saturated rock under low-frequency conditions. The Gassmann equation is expressed as follows:
in which , , , and represent the equivalent bulk modulus of the rock minerals, rock skeleton, pore fluid, and saturated rock, respectively; represents the porosity; and and represent the equivalent shear modulus of the rock skeleton and saturated rock, respectively [23].
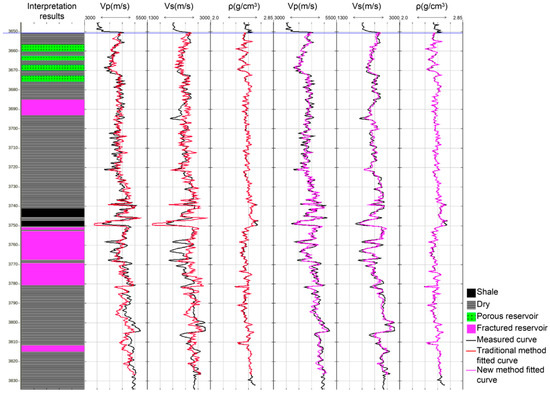
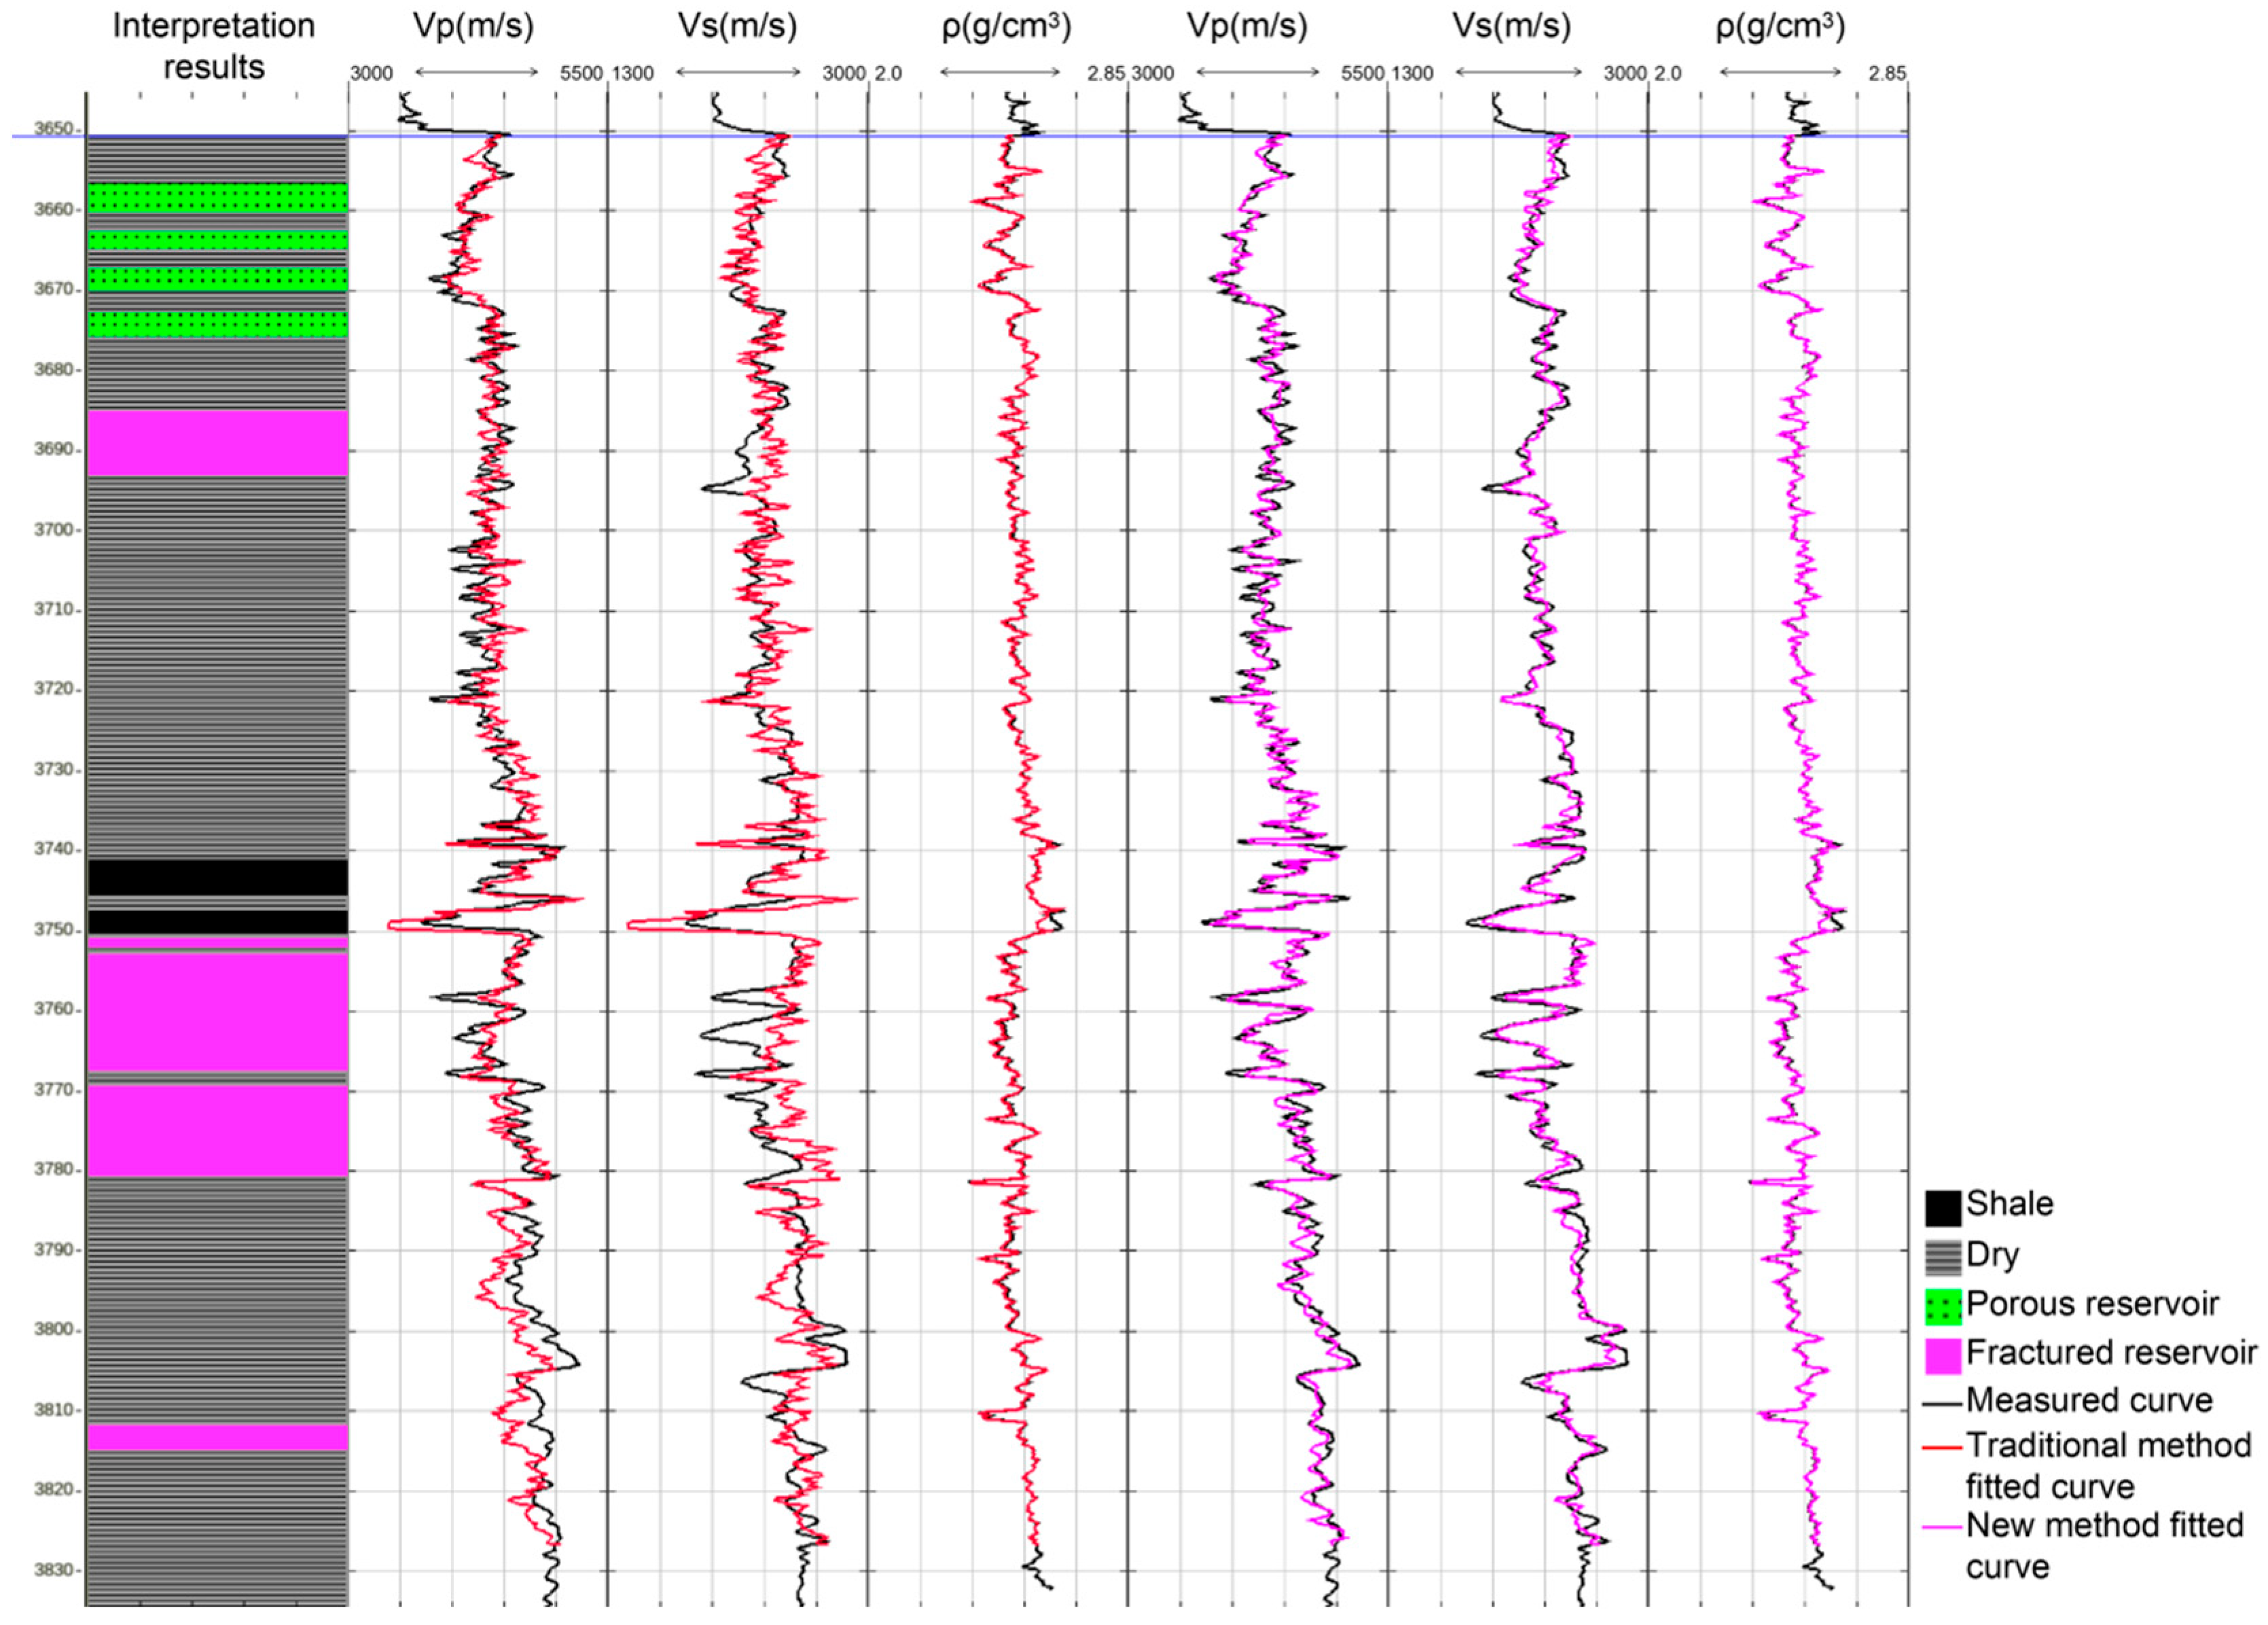
Figure 4 presents a comparison between the P-wave, S-wave, and density curves simulated using the conventional Xu–White model and the proposed method in Well BZ28-A of the study area, along with the measured data. It can be observed that the curves simulated by the proposed method exhibit better agreement with the measured data, which is particularly pronounced in the fracture-type reservoirs. This result demonstrates that, under reservoir conditions characterized by the coexistence of pore-type and fracture-type reservoirs, the rock physics modeling approach using variable aspect ratios can more accurately reflect the actual geological conditions.
Figure 4.
Comparison of curve prediction results between the two methods. The blue line denotes the top boundary of the Kongdian Formation.
The rock physics modeling in this study comprises three core components: mineral mixing, dry rock skeleton construction, and fluid substitution, each grounded in the assumptions of isotropic equivalent medium, geometrically simplified pore structures, and low-frequency fluid saturation. It is worth noting that, compared to the Xu–White model with a fixed aspect ratio, the proposed method improves the accuracy of elastic curve predictions by utilizing variable aspect ratios for the two types of reservoir spaces (Figure 2). This indicates that, in the study area, pore morphology acts as the dominant controlling factor, whereas the influence of anisotropy is relatively minor. Nevertheless, when extending this method to reservoirs with higher fracture density and strongly preferred orientations, it is advisable to incorporate models such as Hudson [24,25] and extend the analysis to anisotropic equivalent medium.
3.2. Construction of Porosity-Sensitive Factor
After calibration based on rock physics modeling, the P-wave velocity, S-wave velocity, and density curves are used to calculate the cross-plot relationship between Poisson’s ratio and density, thereby summarizing the elastic parameter characteristics of different reservoir types. The analysis indicates that pore-type reservoirs are characterized by low density and moderate Poisson’s ratio, with the overlay curve of the two parameters exhibiting a “left-trend cluster” pattern. In contrast, fracture-type reservoirs are characterized by moderate density and high Poisson’s ratio, with the overlay curve of the two parameters exhibiting a “right-trend cluster” pattern (Figure 5).
Figure 5.
Overlay of P-wave velocity, S-wave velocity, density, and Poisson’s ratio for Well BZ28-A.
During the inversion process, to accurately identify the types of reservoir space in subsurface, a reservoir-type indicator is constructed using Equation (8):
in which represents the reservoir-type indicator, and c and d are coefficients. The two types of reservoir can be clearly distinguished based on a specific threshold: reservoir-type indicator values above the threshold correspond to fracture-type reservoir, while those below correspond to pore-type reservoir.
Based on this, the porosity-sensitive factor is further derived using Equation (9):
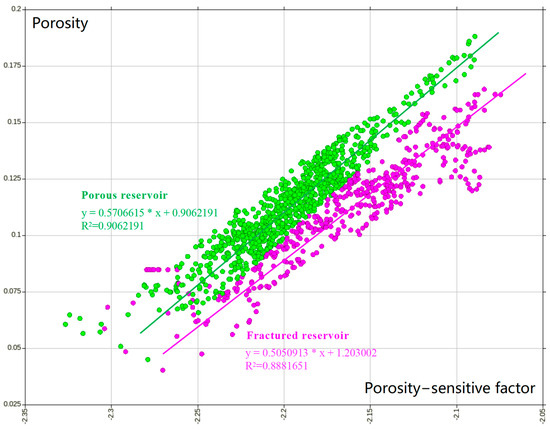
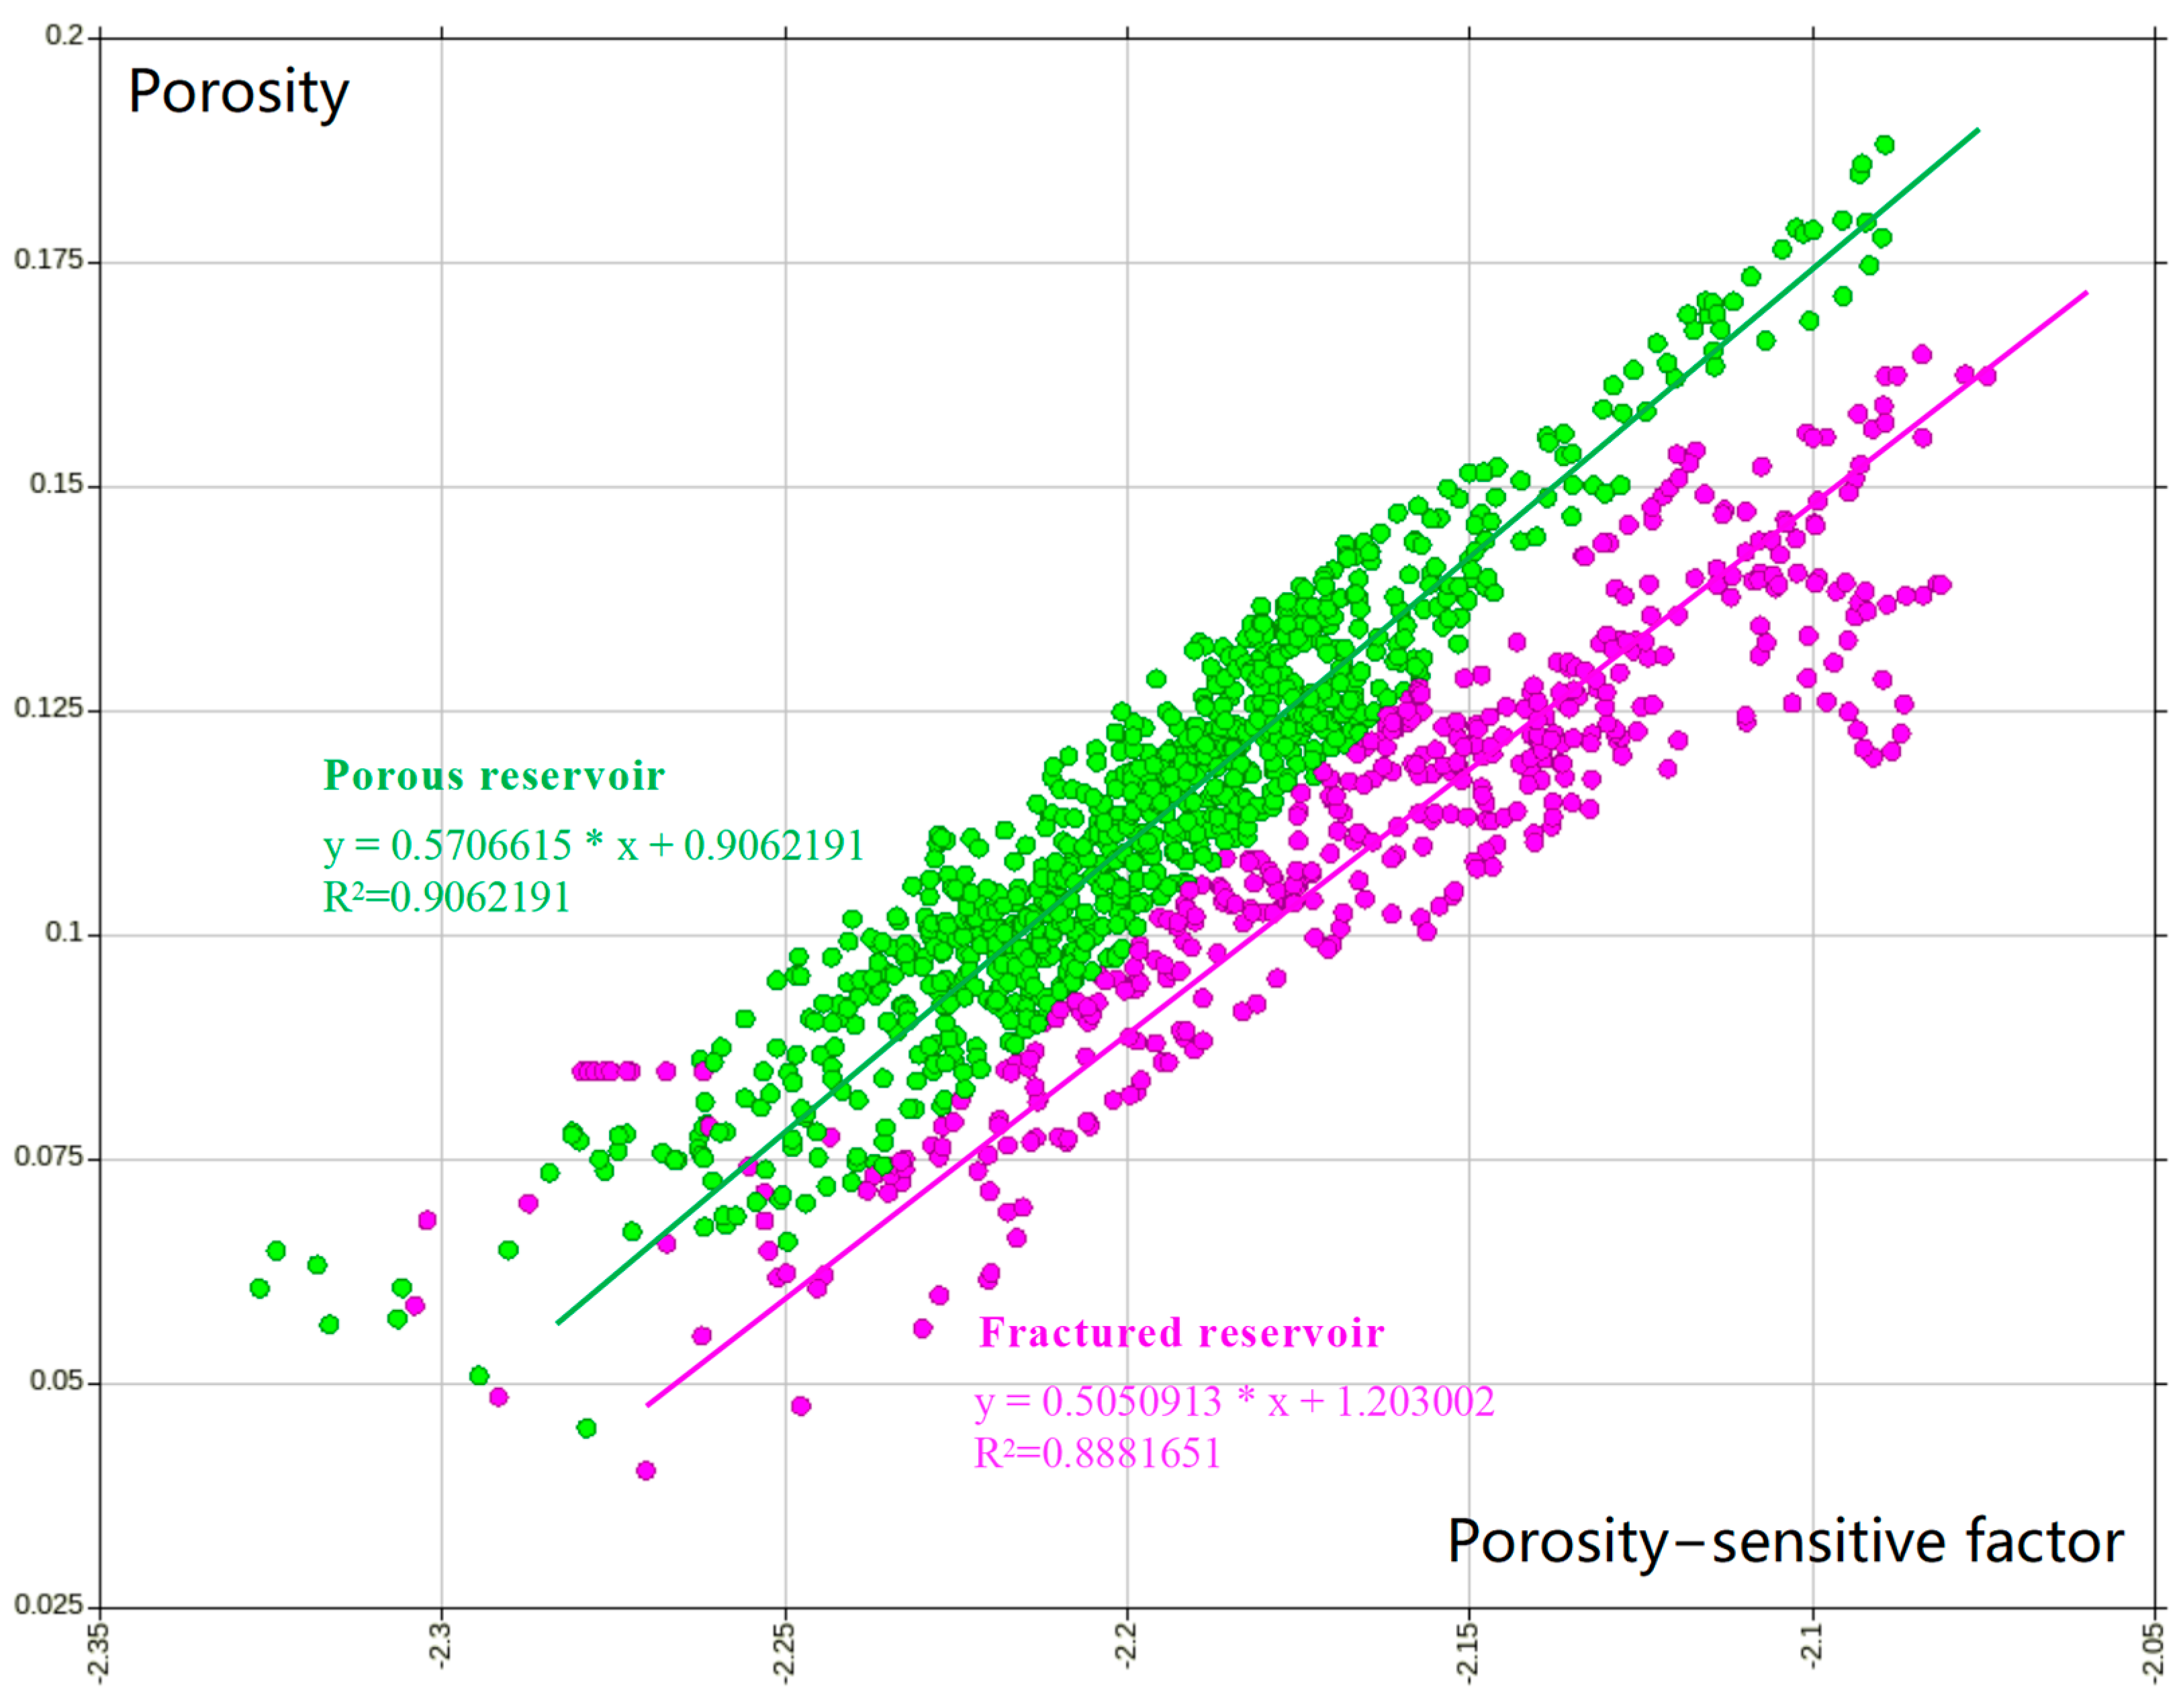
in which represents the porosity-sensitive factor, a and b are coefficients, and σ and represent Poisson’s ratio and density, respectively. Based on Equations (8) and (9), the cross-plot of the porosity-sensitive factor versus porosity exhibits a dual parallel linear trends (Figure 6). The data points are not randomly scattered but converge into two sub-parallel linear trends, indicating that the development of reservoir space is controlled by two distinctly different physical mechanisms. One linear trend represents the dominant contribution of matrix pores, characterizing pore-type reservoirs, while the other reflects the modification effect of microfracture systems on pore structures, characterizing fracture-type reservoirs. Therefore, the regional partitioning based on the geometric distribution characteristics of the data essentially serves as a quantitative response to the reservoir spaces types. Using these two linear relationships, differentiated modeling and the accurate calculation of porosity parameters can be achieved. Following this relationship, we use the Poisson’s ratio and density data volumes obtained through inversion, and select the appropriate mapping relationships according to reservoir type, thus achieving accurate porosity calculation by classification. This method improves the calculation accuracy while maintaining satisfactory stability.
Figure 6.
Cross-plot of porosity-sensitive factor versus porosity for the target interval in Well BZ28-A. Green dots represent porous reservoir samples, pink dots represent fractured reservoir samples, and lines are their linear fitting.
3.3. EDF-Constrained Prestack Density Inversion
To achieve porosity prediction for low-permeability reservoirs in the study area, the porosity-sensitive factor constructed in Equation (9) requires high-precision density and Poisson’s ratio inversion results as input. However, the accurate estimation of density parameters has long been a challenge in geophysics.
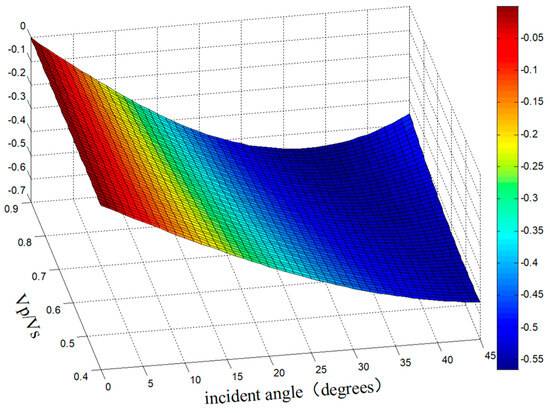
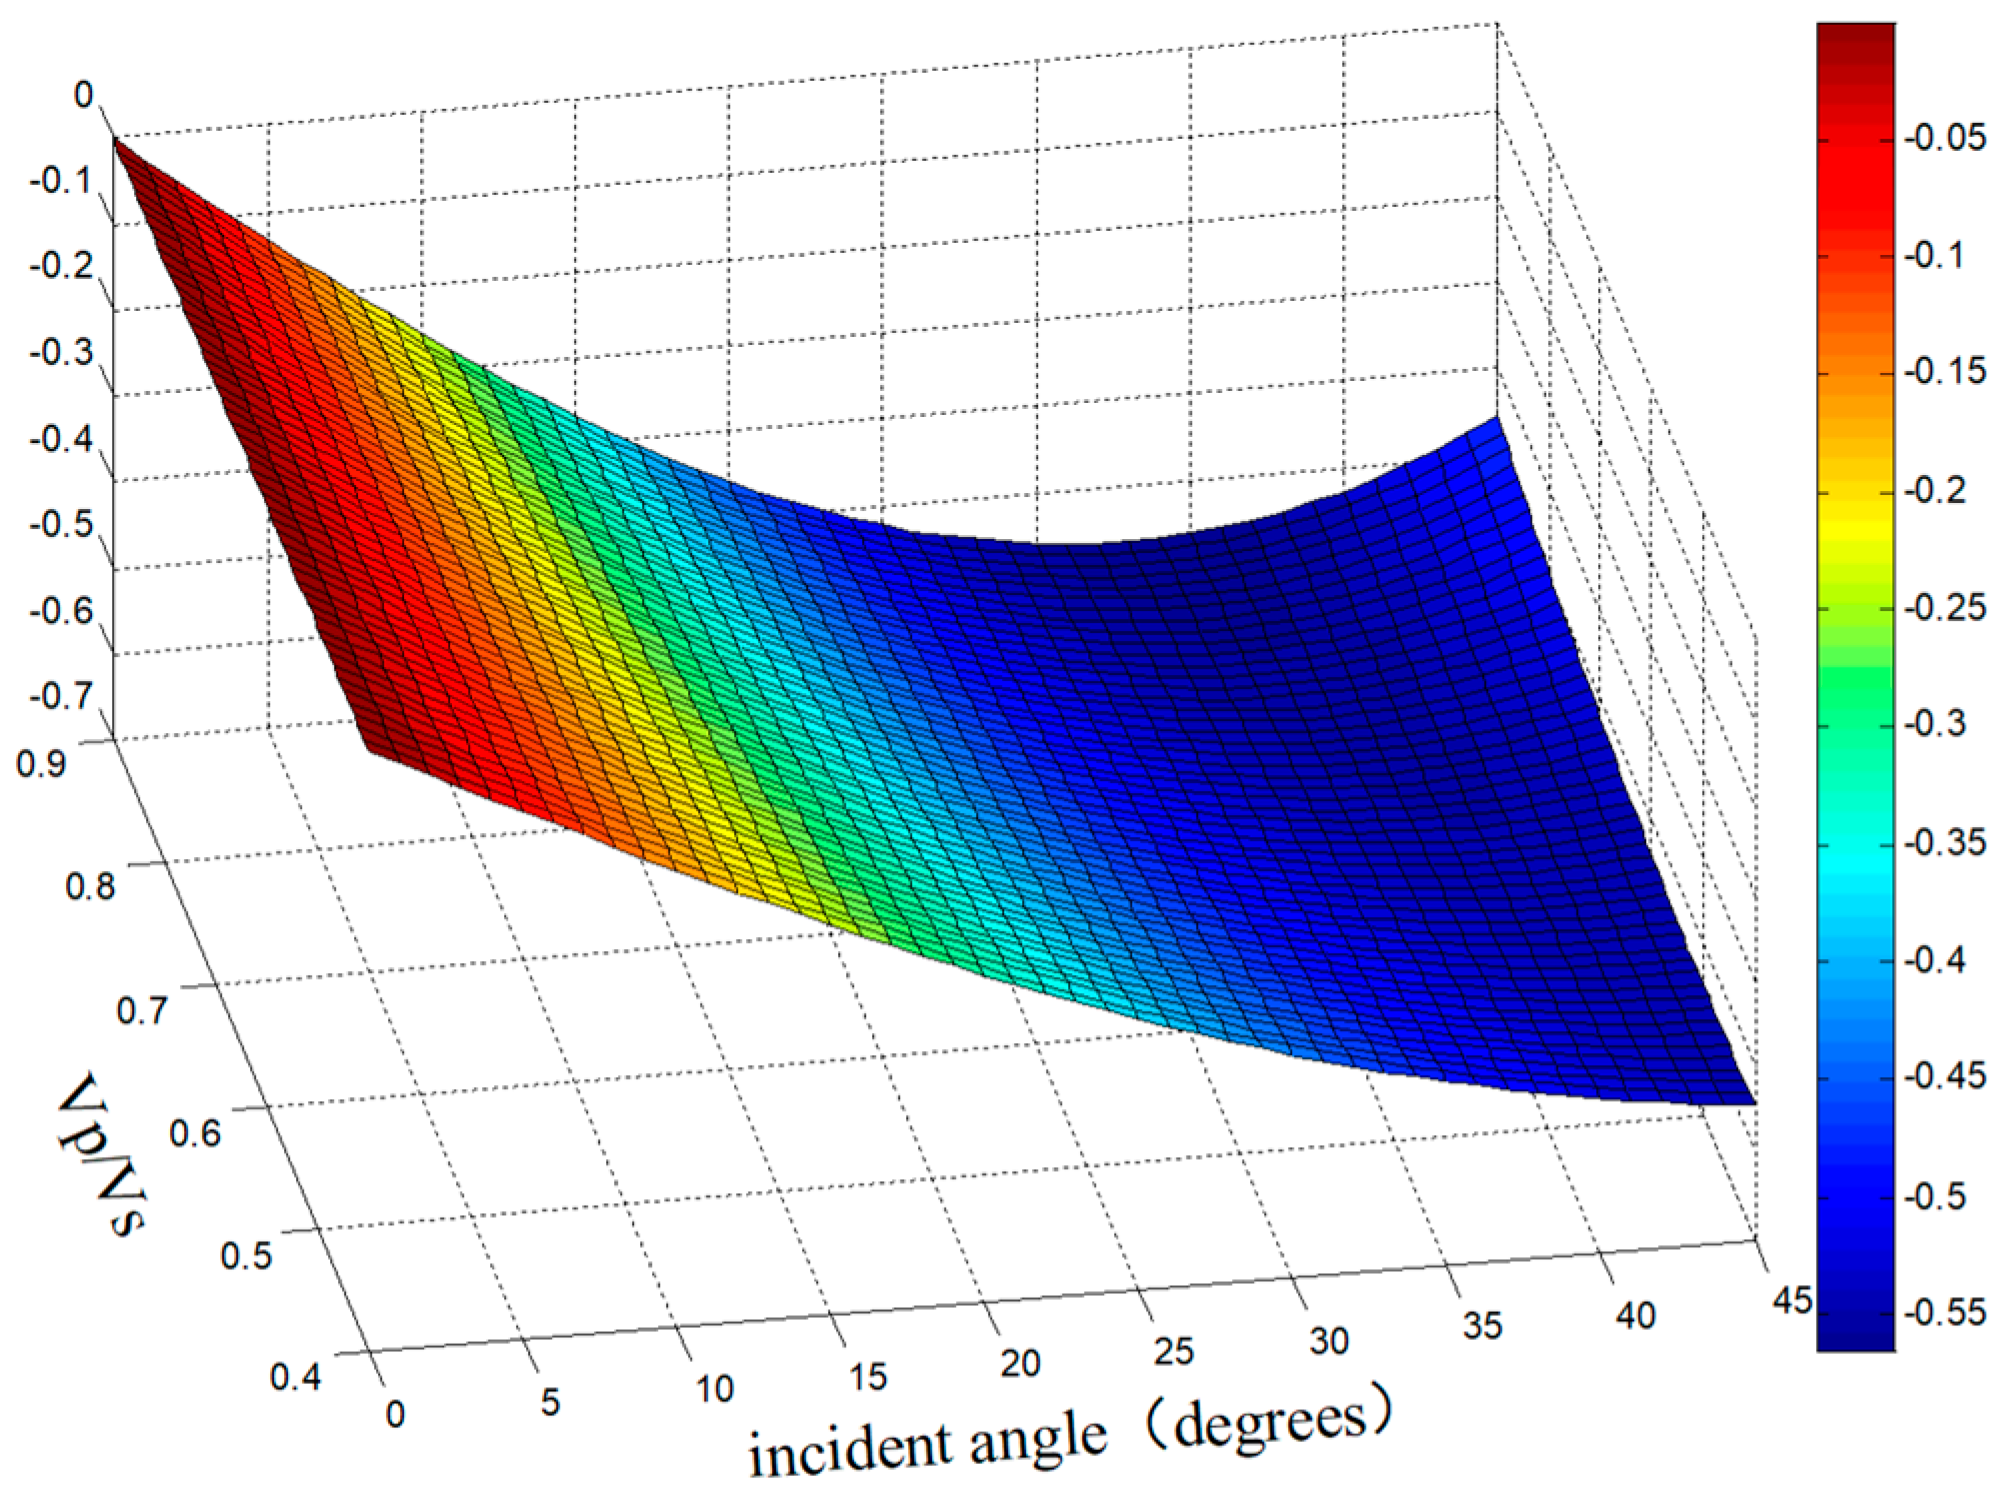
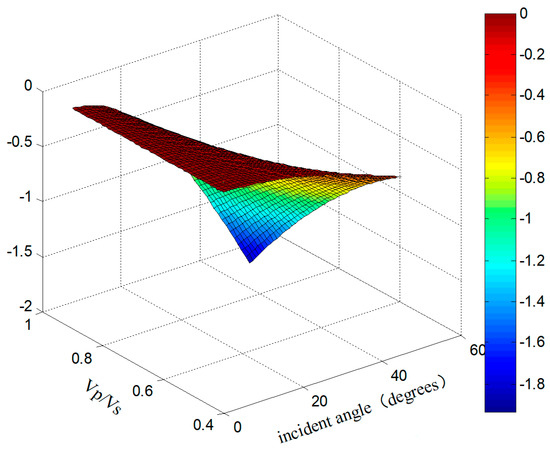
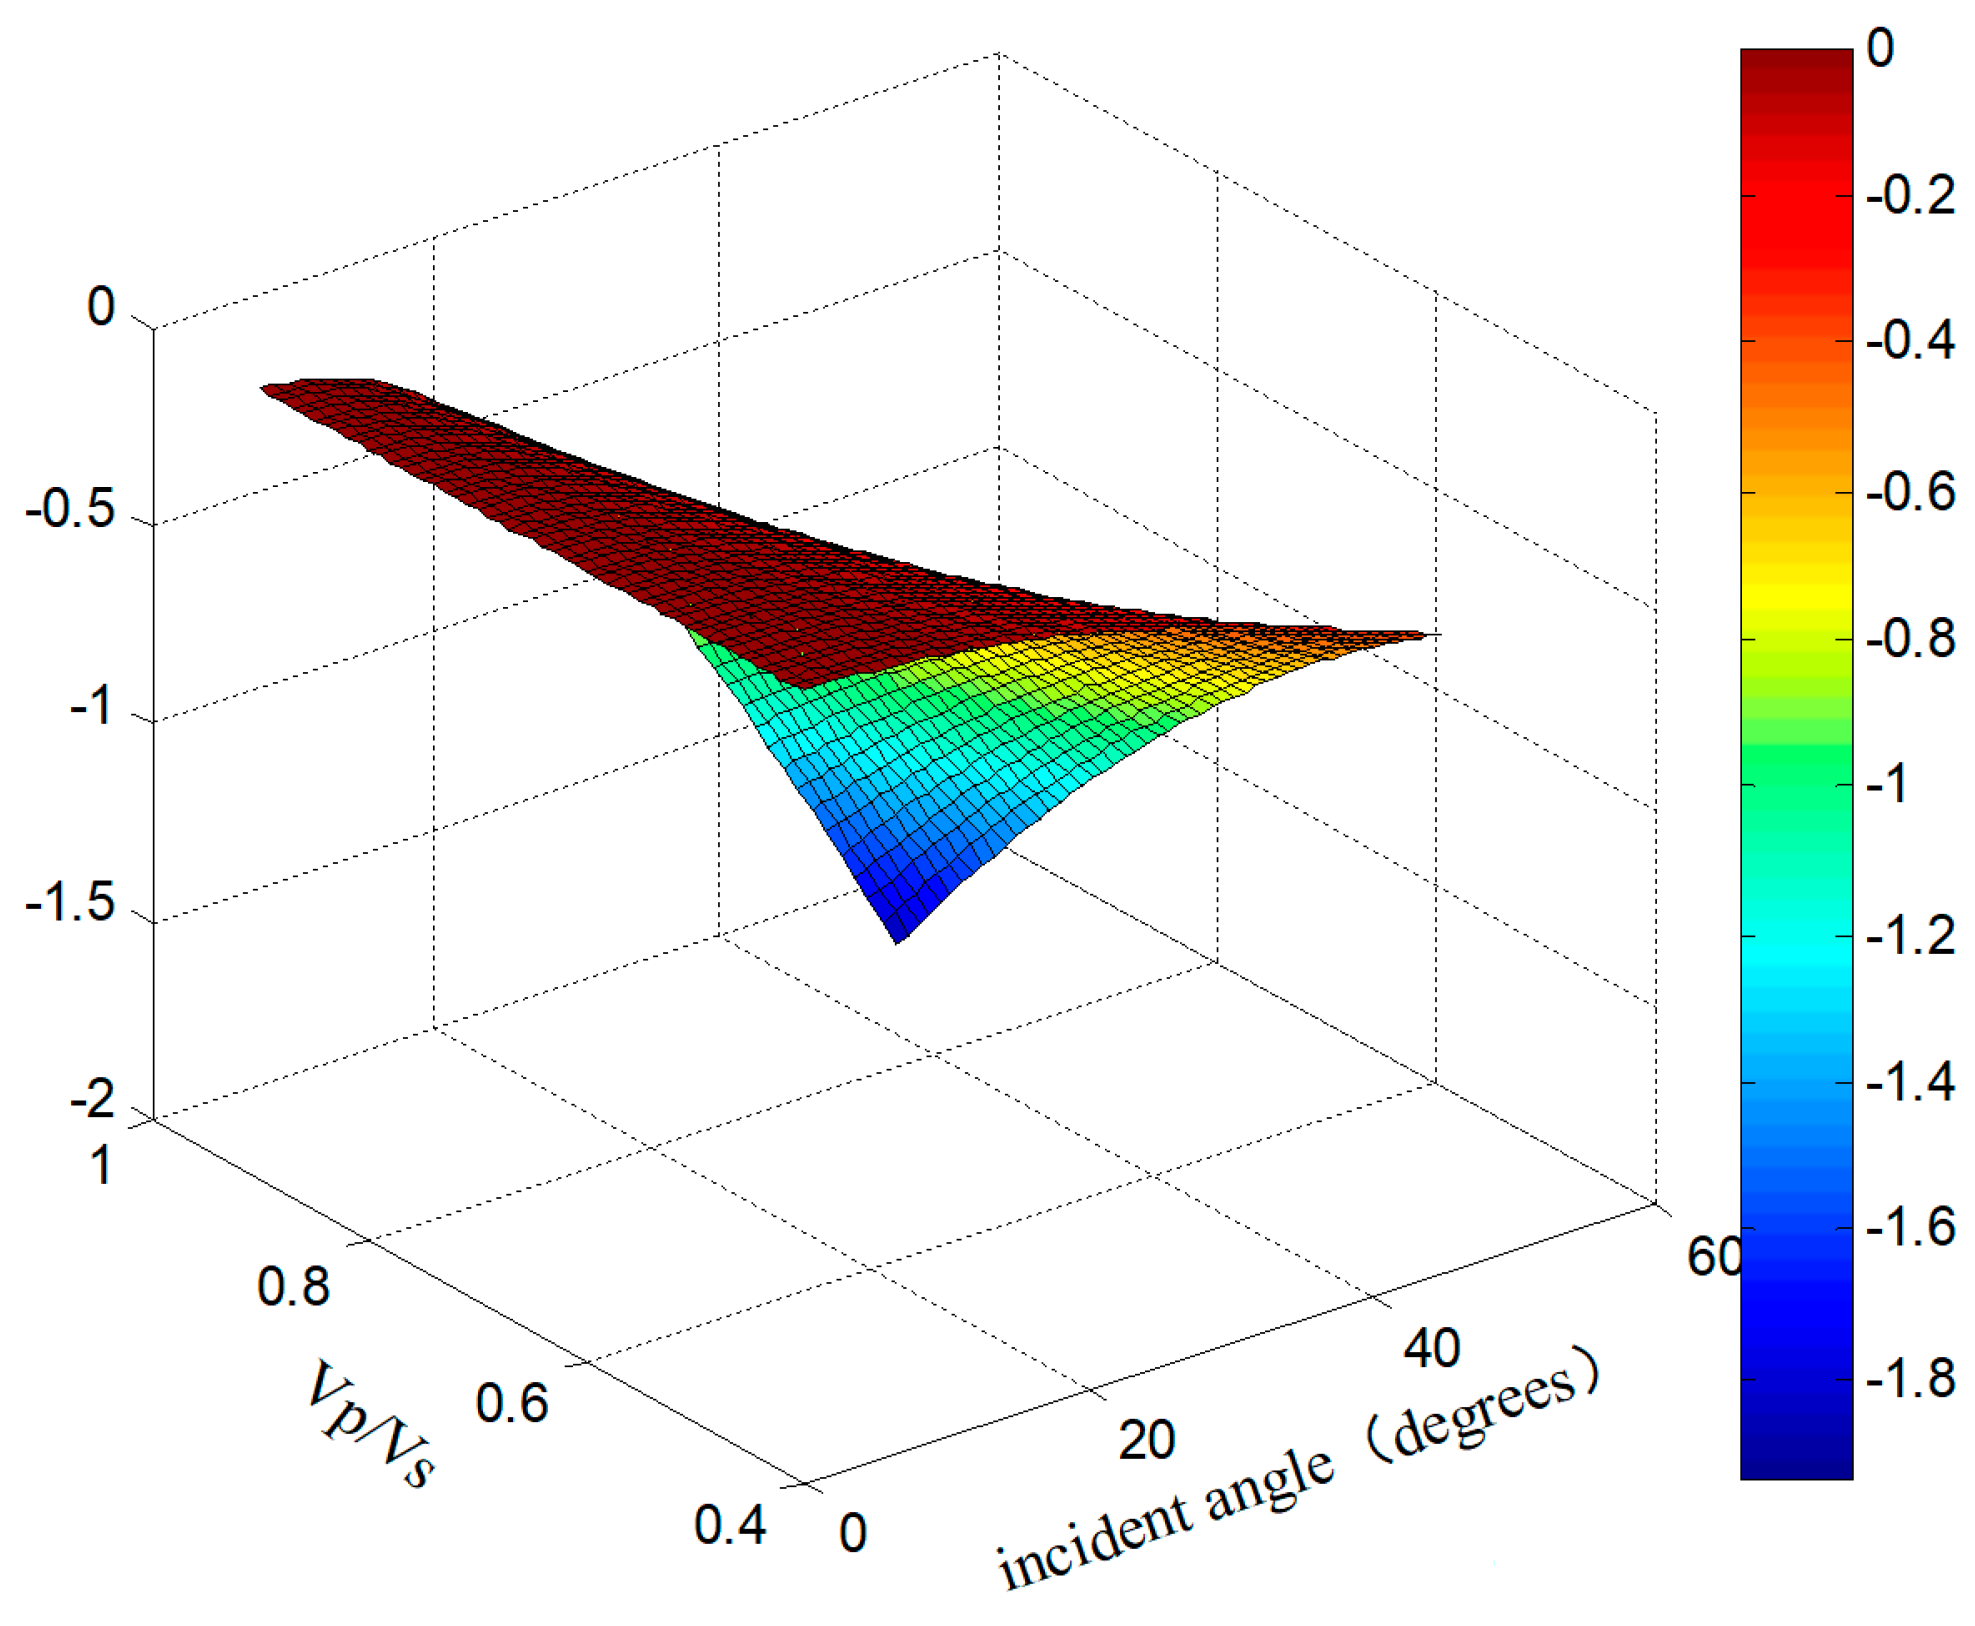
Based on the Aki–Richards approximation of the Zoeppritz equations, we can obtain the first derivative of density, P-wave velocity, and S-wave velocity, which is their sensitivity function. As shown in Figure 7 and Figure 8, as the incidence angle increases, the reflection coefficient becomes more sensitive to various elastic parameters. This implies that high-precision density inversion requires fully utilizing information from large-angle gathers. However, conventional approximate formulas are only valid for small incident angles.
Figure 7.
Density sensitivity of Aki–Richards approximation.
Figure 8.
S-wave velocity sensitivity of Aki–Richards approximation.
Conventional prestack seismic inversion is based on the theory of non-vertical incidence of seismic waves [26], and typically constructs the inversion objective function using the Fatti simplified equation [27]:
where is the P-wave reflection coefficient at an angle of , is the S-wave to P-wave velocity ratio, is the difference in P-wave impedance between the upper and lower layers, is the P-wave impedance of the target layer, is the difference in S-wave impedance between the upper and lower layers, is the S-wave impedance of the target layer, is the difference in density between the upper and lower layers, and is the density of the target layer.
Theoretical analysis indicates that under small-angle incidence conditions, seismic reflection information originates mainly from P-wave impedance, while the contribution of the density term is negligible. Only when the incidence angle increases to ~40° does the contribution of density to the reflection coefficient become apparent. This implies that reliable density estimation is highly dependent on large-angle gather information. However, current middle-to-deep seismic data generally suffer from issues such as poor quality of large-angle gathers, low signal-to-noise ratio, severe NMO stretching, and significant anisotropy [28], making direct density inversion from the wave equation often yield unsatisfactory results. Therefore, decoupling density from the more readily available P- and S-wave impedances represents a promising direction for reliable density estimation at the current stage. Previous studies have attempted nonlinear parameter extraction based on exact reflection coefficient equations [29], and direct prediction of physical properties from prestack data using convolutional neural networks [30], both of which demonstrate the feasibility of decoupling density from impedances.
Based on the above analysis and the Aki–Richards approximation equation, P-wave and S-wave impedance can be obtained through prestack seismic inversion using near- and mid-angle seismic gather amplitudes. These impedances contain information on P-wave velocity, S-wave velocity, and density; however, these three parameters are connected, and currently there is no effective method to separate them. To address this issue, this study constructs a density inversion method based on the EDF. The core idea is to avoid the reliance on direct inversion of large-angle gathers. Specifically, reliable P-wave impedance and S-wave impedance are first obtained through high-precision prestack inversion. Then, using the decoupling factor established through rock physics analysis, the density parameter is separated and converted from the S-wave impedance. The detailed inversion workflow is illustrated in Figure 9.
Figure 9.
Workflow of EDF-based density inversion.
In this method, high-resolution S-wave impedance is first obtained through high-precision prestack inversion. Subsequently, the EDF is introduced to partition the density and S-wave impedance cross-plot into multiple trend clusters, capturing an intrinsic relationship between S-wave impedance and density under different lithology–physical property combinations, thereby significantly improving the accuracy of density estimation. In the density calculation template, the EDF serves as a key parameter, and its expression is as follows:
in which is the Poisson’s ratio, is the S-wave impedance, and is the P-wave impedance; is density, and and are S-wave and P-wave velocities.
Substituting the definition of wave impedance into Equation (11) and isolating the density term yields:
The EDF is decomposed into the product of two physical terms: carries the density information, while primarily reflects the elastic coupling characteristics of the rock skeleton.
Rock physics analysis of well log data in the study area reveals a key statistical regularity: within the same lithofacies or diagenetic facies, as porosity increases, the integrated stiffness of the rock skeleton decreases, leading to a monotonic decrease in , while due to the modulus decoupling effect between pore fluids and the skeleton, changes in the same direction, resulting in a decreasing trend in Poisson’s ratio as well. These two effects are highly synergistic, making the coefficient of variation of the combined term much smaller than that of the density term. Therefore, this term can be approximated as a quasi-constant , which depends only on the intrinsic properties of the rock skeleton:
To quantitatively evaluate the validity of the approximation in Equation (13), we analyzed 1286 log samples from reservoir and non-reservoir intervals in Well BZ28-A. is computed for each sampling, and the coefficients of variation (CV = standard deviation/mean) were calculated by facies. The results are shown in Table 1, the CV for the three facies are all substantially lower than that of the density term for the full dataset (CV = 8.2%), confirming the validity of Equation (13).
Table 1.
Quantitative analysis of F values for Well BZ28-A.
Substituting Equation (13) into Equation (12) yields the deterministic approximate relationship between the EDF and density:
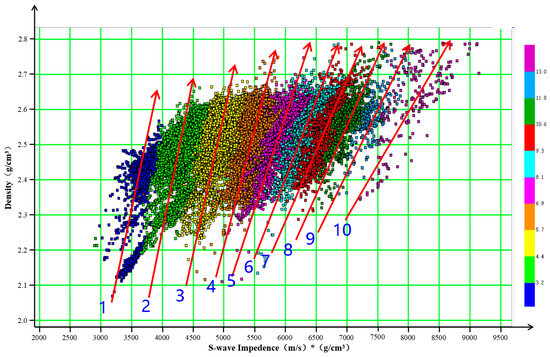
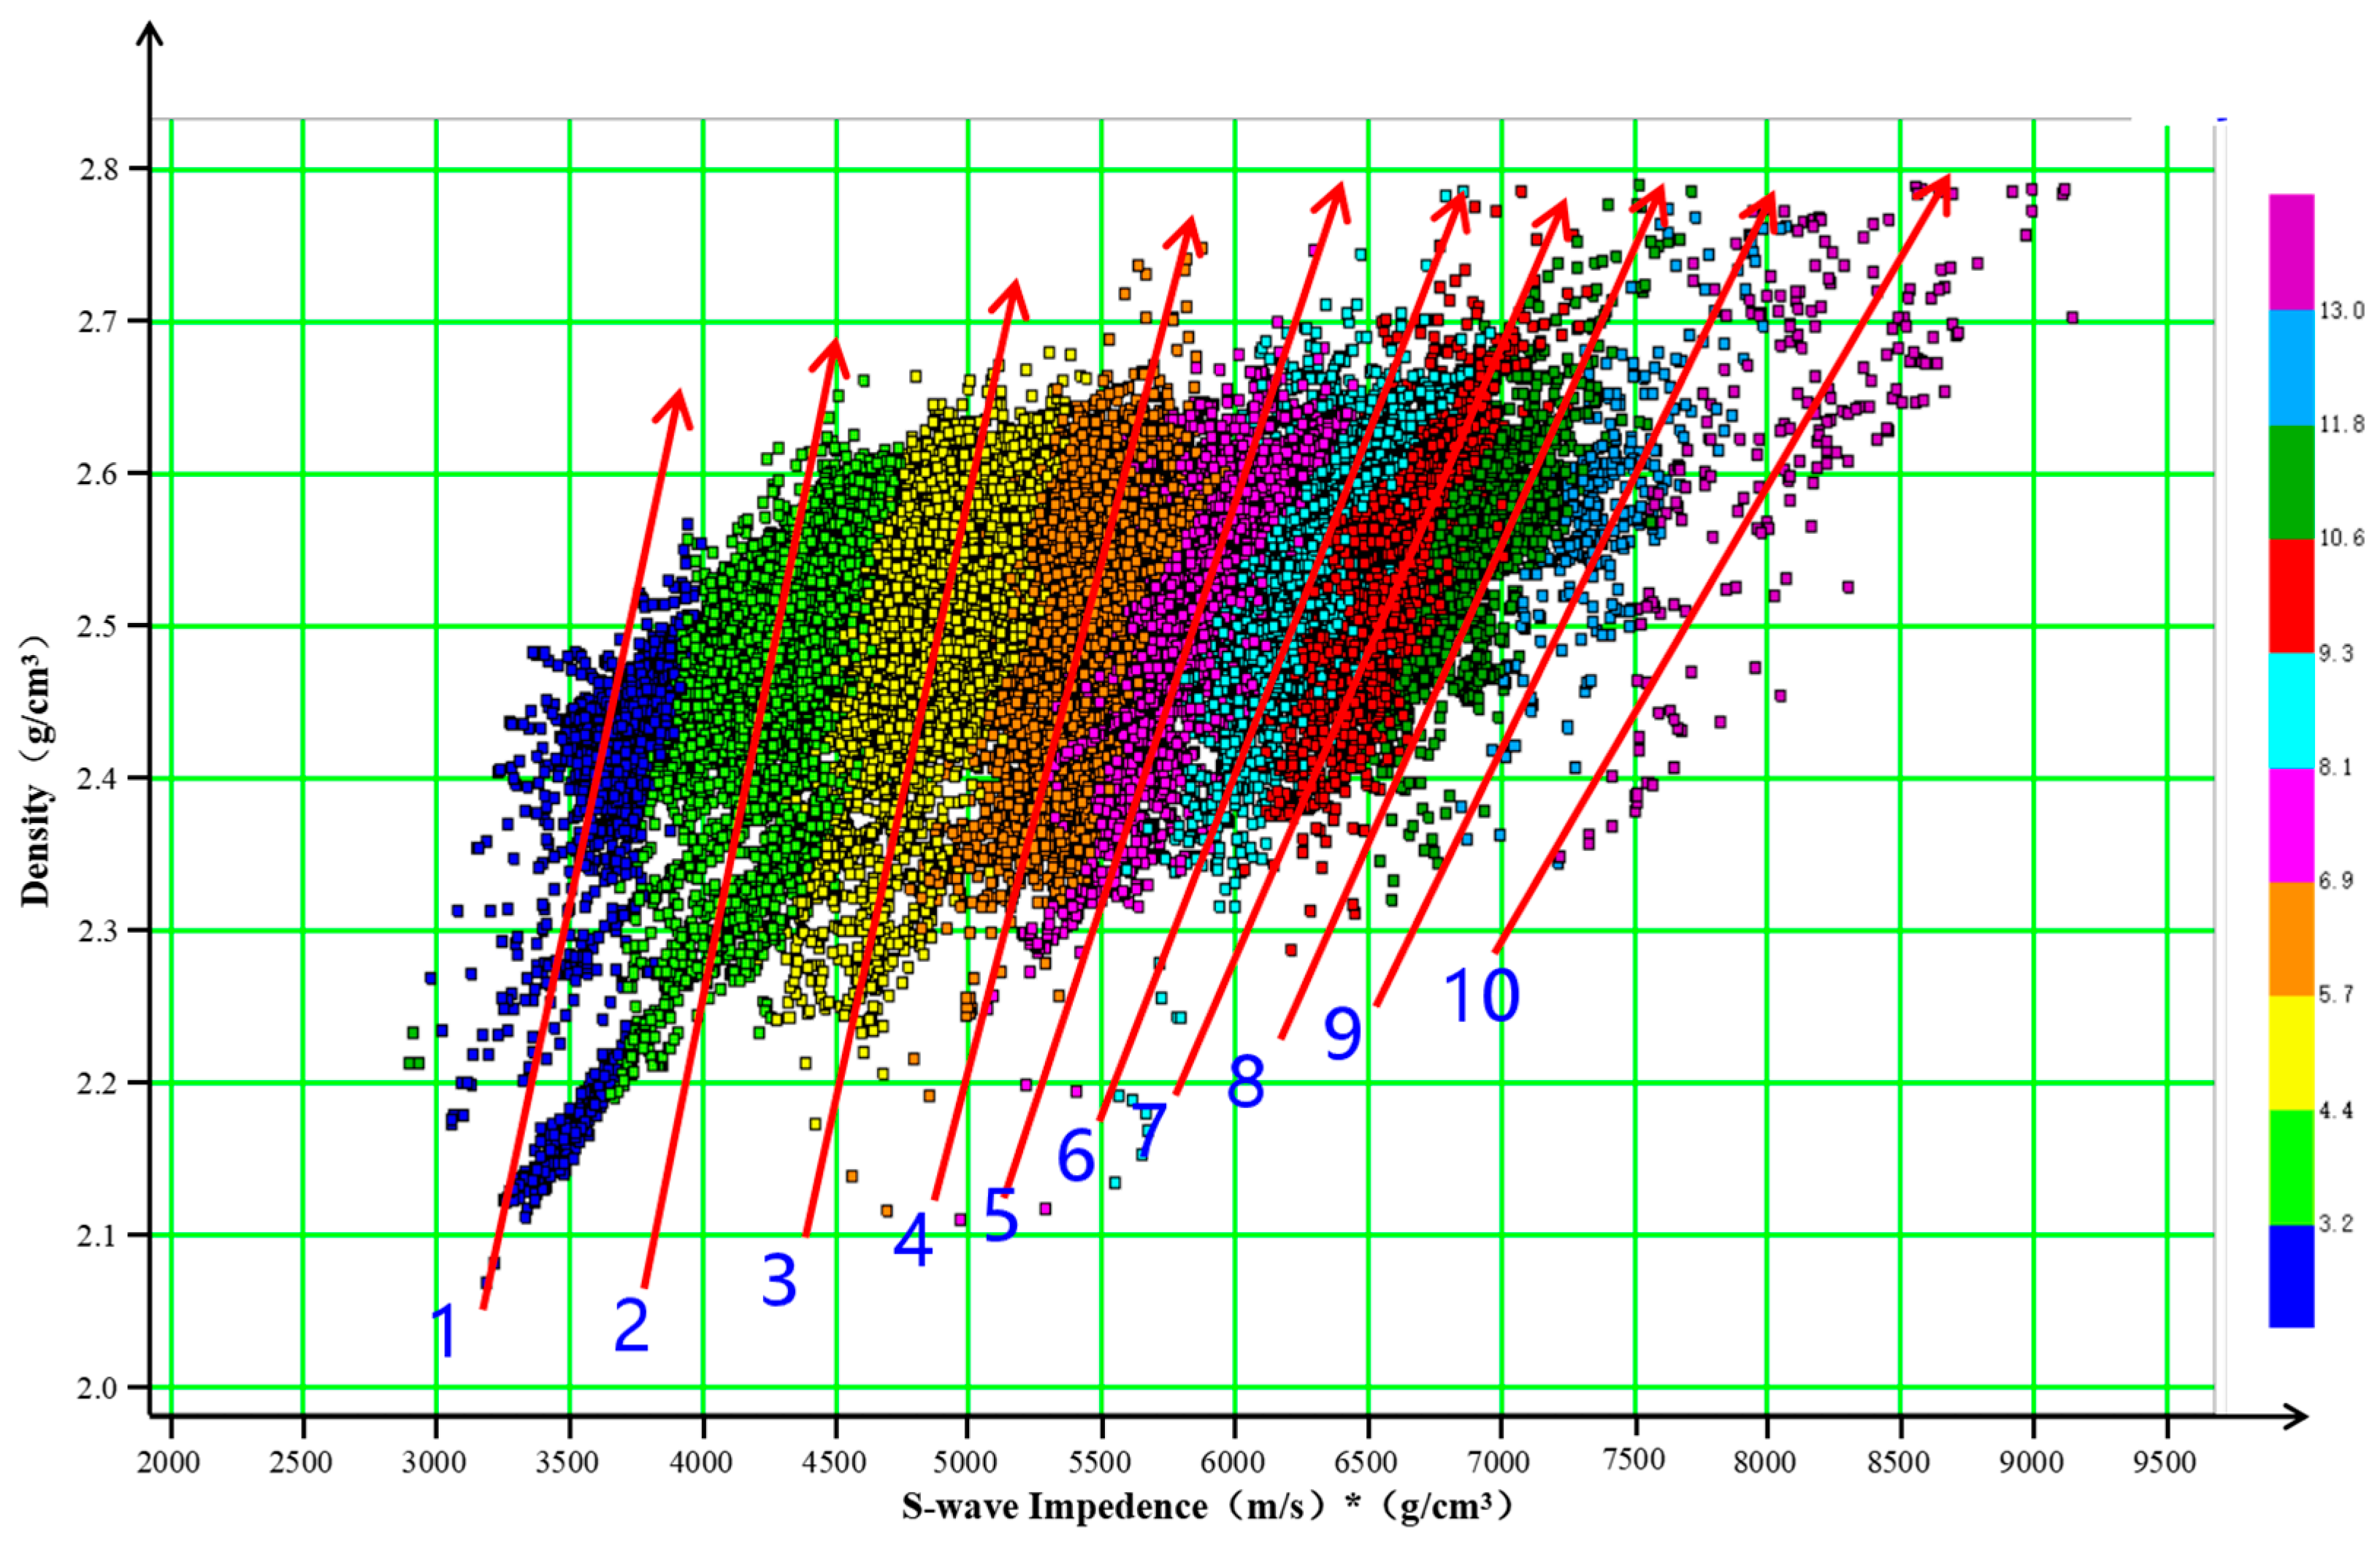
Equation (14), derived from elastic wave theory, reveals that the EDF serves as an indicator that is highly sensitive to density variations. The quasi-constant- in Equation (13) is not globally uniform; differences in mineral composition, cementation degree, and pore structure among different lithofacies cause systematic shifts in the intrinsic values and the stiffness–porosity–evolution trajectory. Such shifts directly result in variations in the magnitude of . In the cross-plot of S-wave impedance and density, the data present zonal linear distribution characteristics.
Analysis of the measured data from Well BZ28-A indicates that, in the cross-plot of S-wave impedance versus density, density generally rises with increasing S-wave impedance. However, when density remains constant, for instance at 2.45 g/cm3, S-wave impedance exhibits a wide range of variation, spanning from 3000 to 7000. By introducing the EDF (Figure 10), the cross-plot can be divided into multiple trend lines, along each of which S-wave impedance and density exhibit a linear relationship, thereby effectively improving the accuracy of density prediction. It is worth noting that this method is highly sensitive to the accuracy and resolution of the input S-wave impedance, thus requiring the support of effective high-resolution inversion methods.
Figure 10.
Cross-plot of density versus S-wave impedance colored by EDF.
3.4. High-Resolution Prestack Elastic Parameter Inversion Based on Compressed Sensing
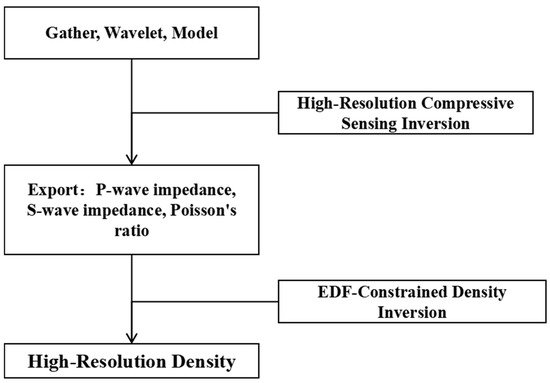
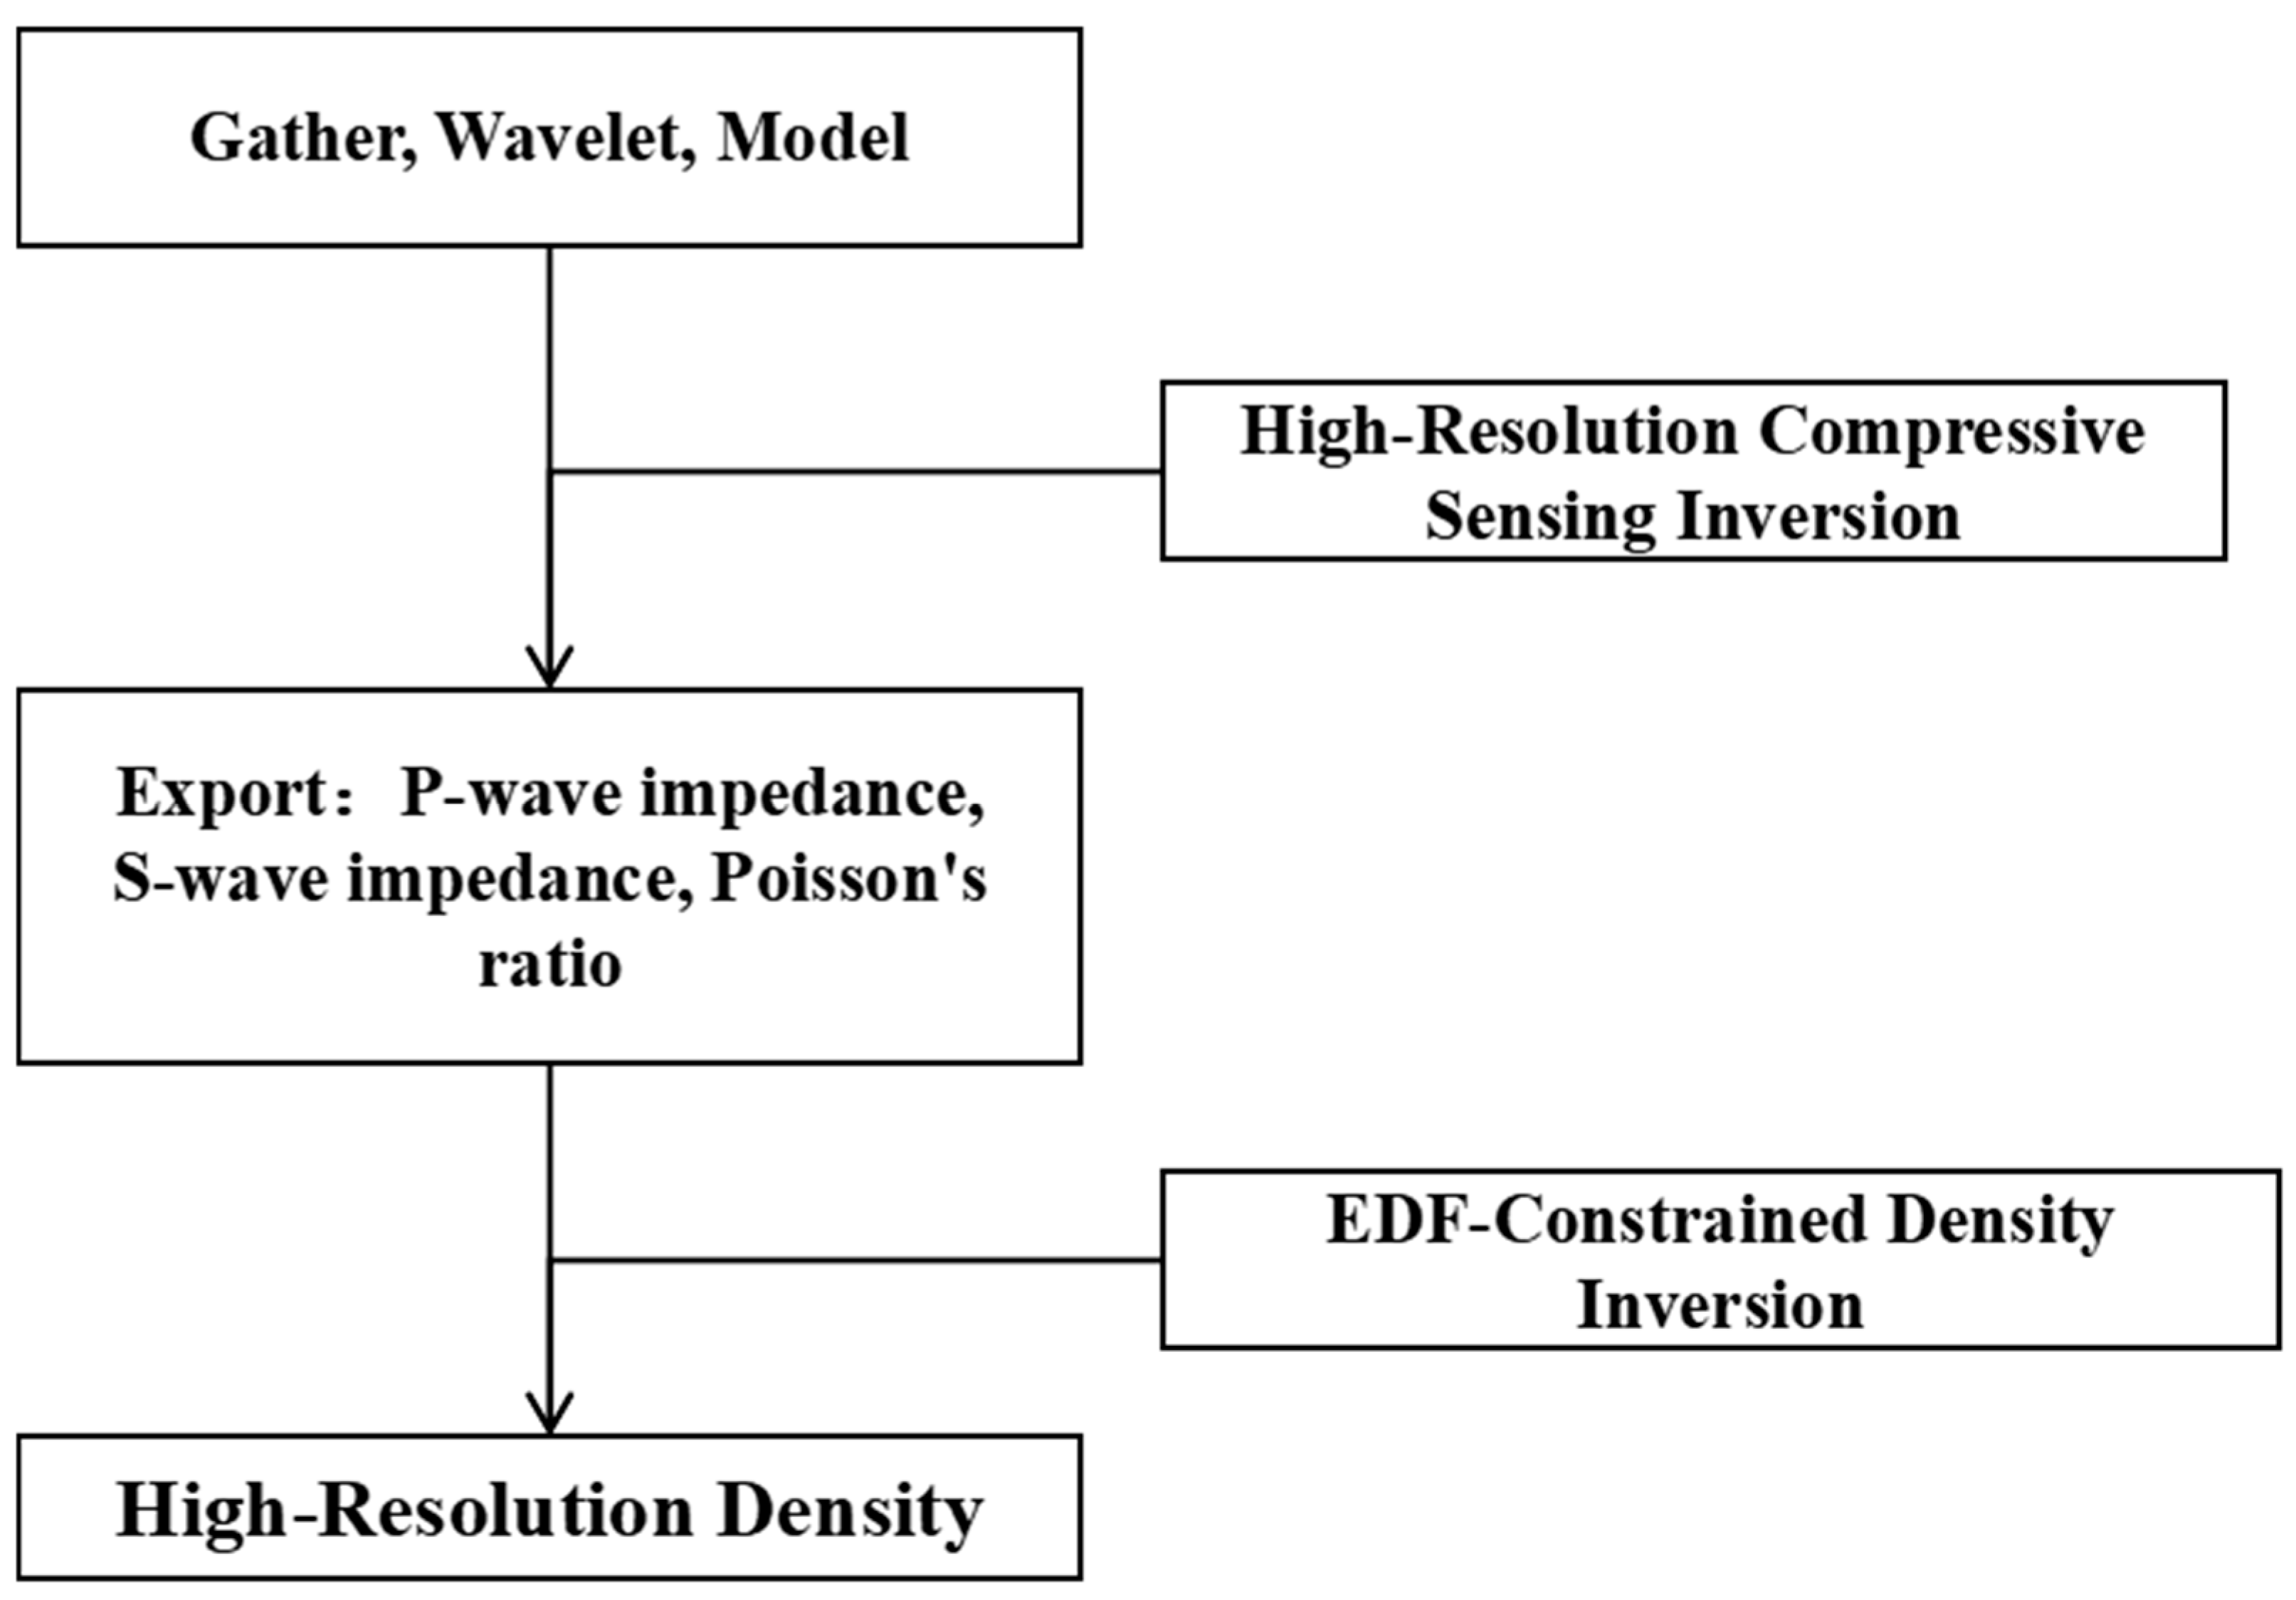
As discussed above, the EDF-based density decoupling method requires the high-precision inversion of P-wave impedance, S-wave impedance, and Poisson’s ratio. To this end, we implement a wedge dictionary deconvolution technique based on a regularization approach. By introducing a wedge dictionary to constrain the wavelet matrix, this method enhances the identification of thin layers from seismic data. Meanwhile, it solves the underdetermined system using a basis pursuit algorithm, effectively improving the noise immunity of reflection coefficient inversion and the resolution of stratigraphic interfaces. The method is applied to prestack gathers, performing computations on angle-stacked data to derive sparse reflectivity coefficients corresponding to each angle component, thereby achieving high-precision inversion of impedance and Poisson’s ratio.
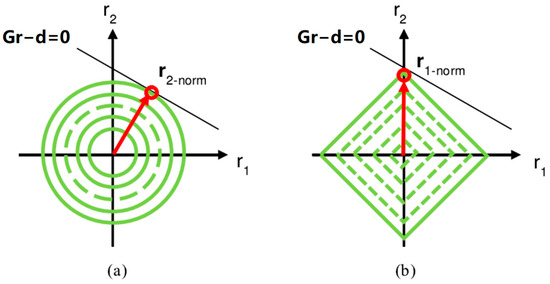
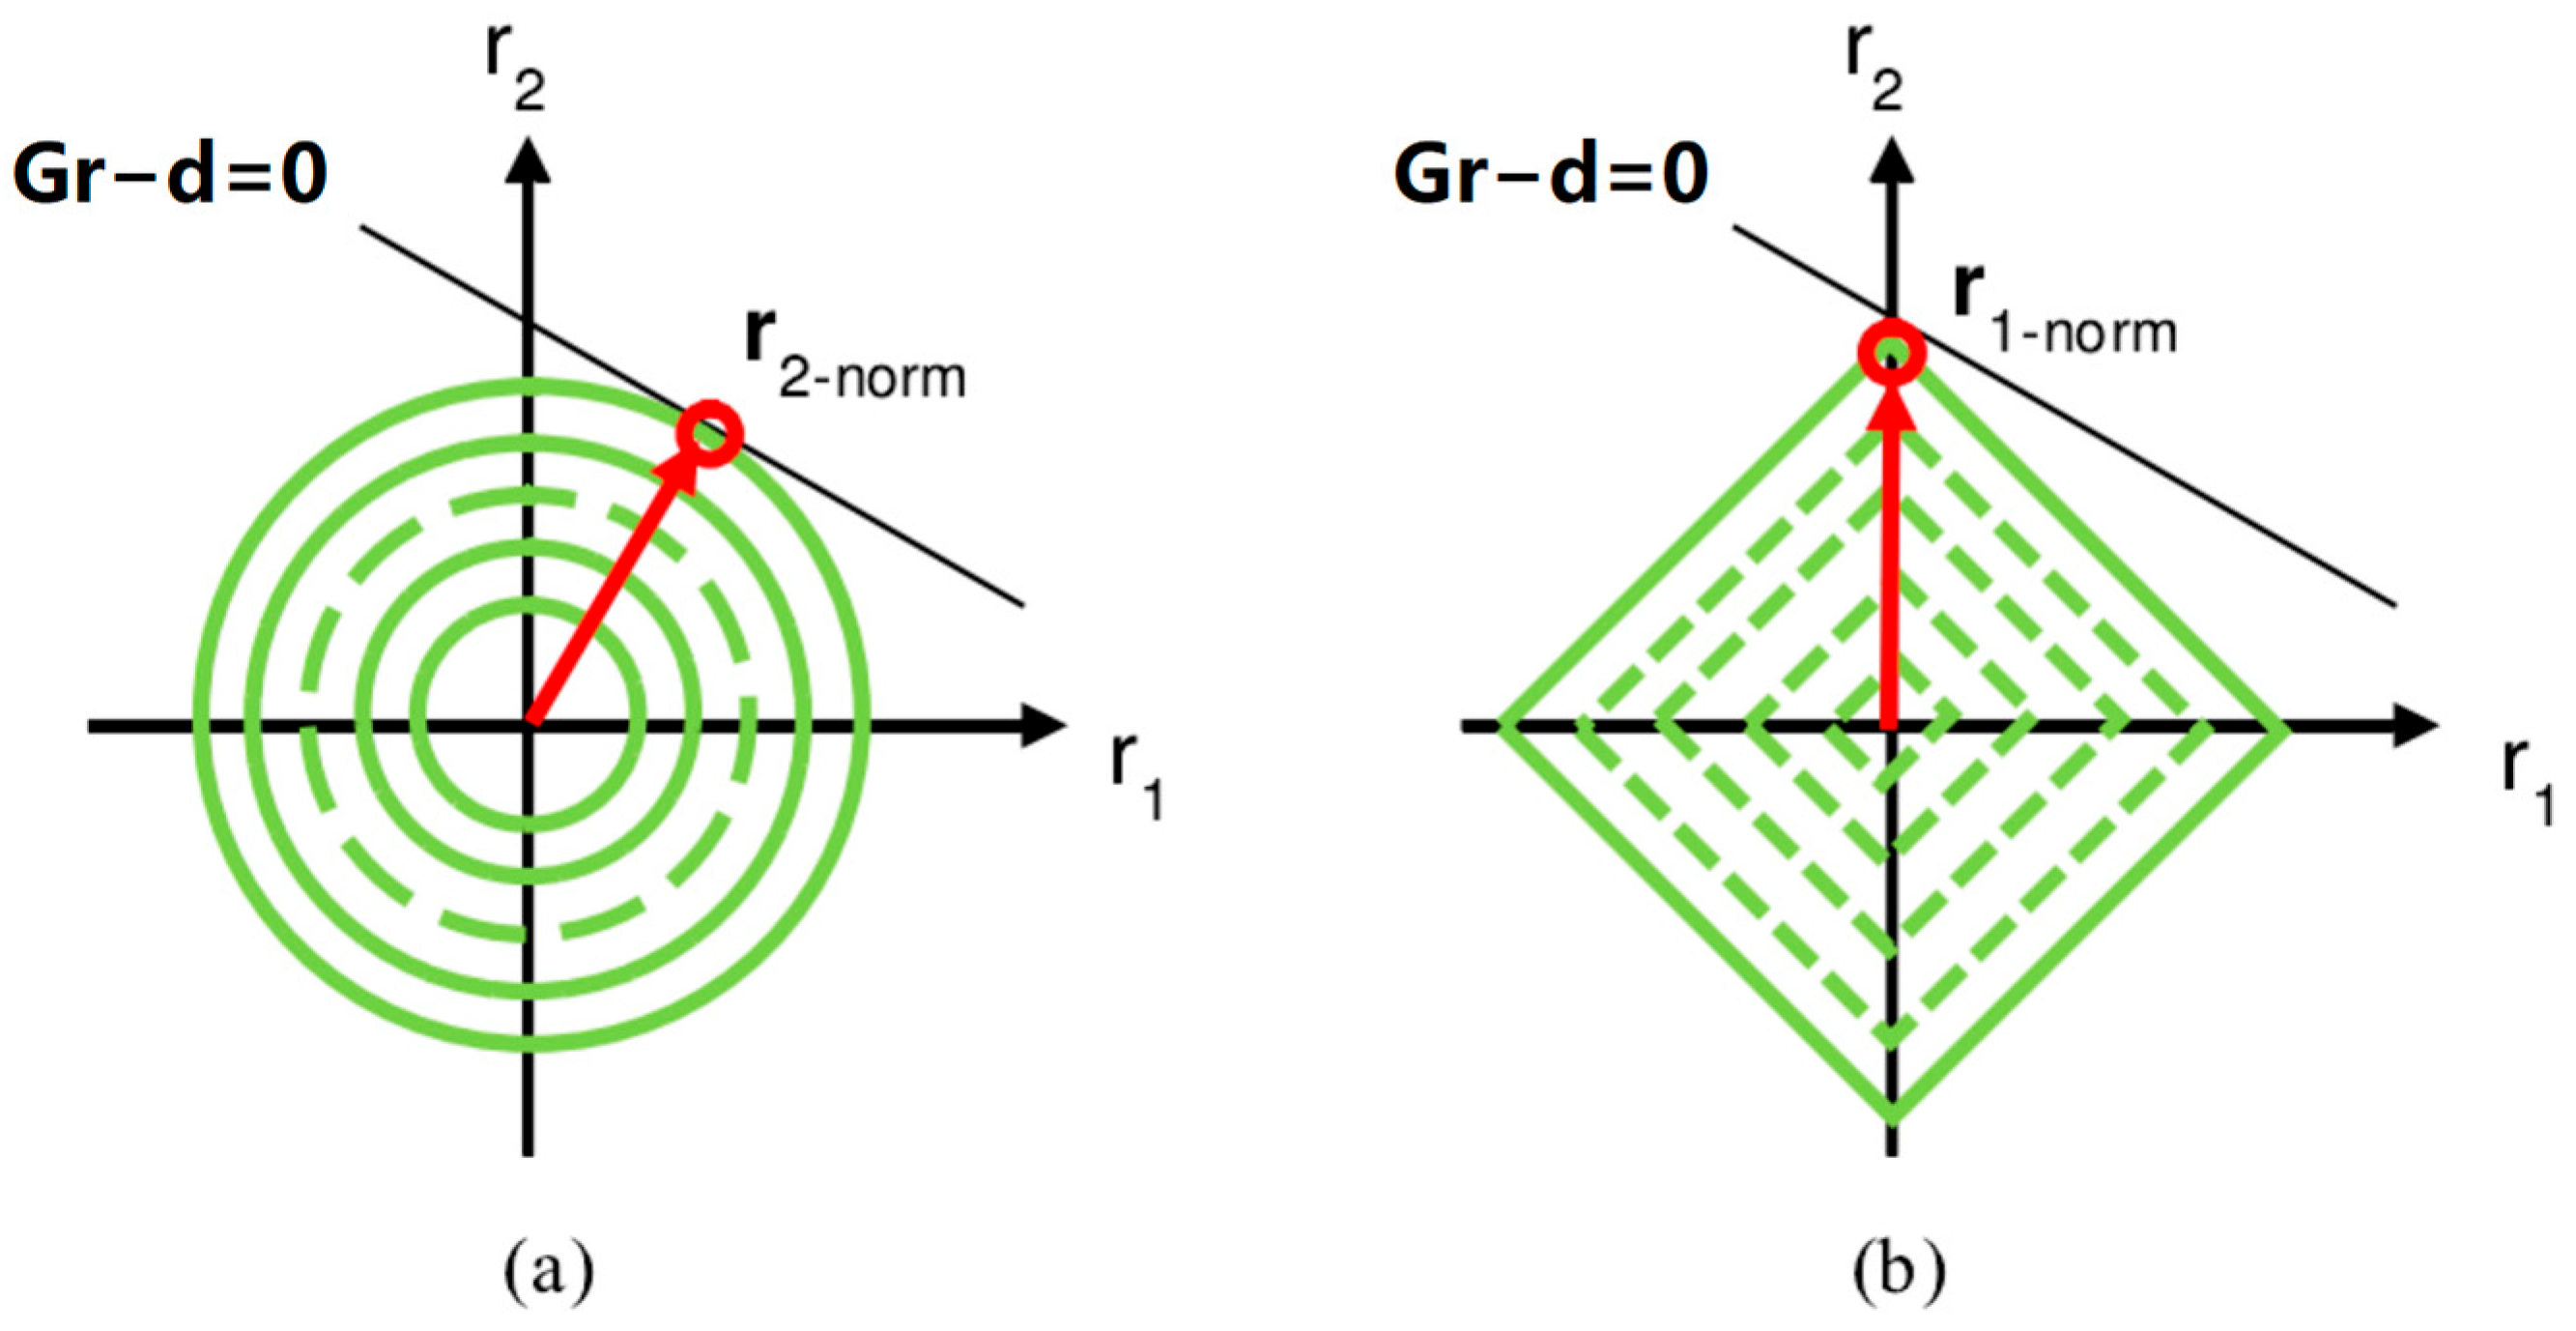
To overcome the ill-posedness of inversion and obtain sparse solutions, the -norm optimization is adopted to replace the conventional -norm constraint [31]. Compared to the norm, the -norm solution exhibits sparsity, as illustrated in Figure 11. The feasible region of the -norm regularization term is circular, whereas that of the -norm is diamond-shaped. When seeking the optimal solution for a constrained problem, the diamond-shaped boundary, characterized by its sharp vertices, is more likely to intersect the feasible region of the unconstrained problem on the axes, resulting in some components of the solution being zero, yielding a sparse solution [32]. This characteristic alleviates the band-limited effect of routine inversion while enhancing the noise immunity of inversion, thereby laying a theoretical foundation for basis pursuit inversion.
Figure 11.
Schematic diagram illustrating the sparsity principle of -norm regularized solutions ((a): -norm, (b): -norm). Green lines are contour lines of regularization terms, black lines are constraint boundary, and red arrows indicate the optimal solutions.
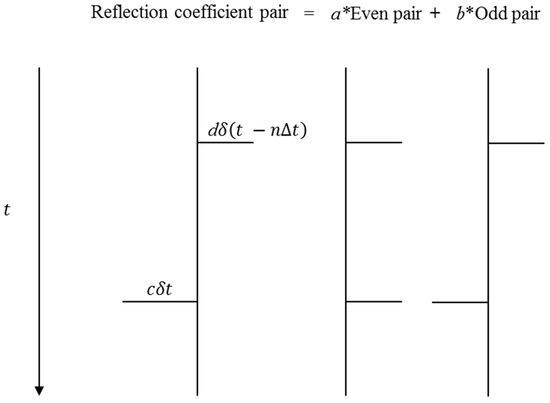
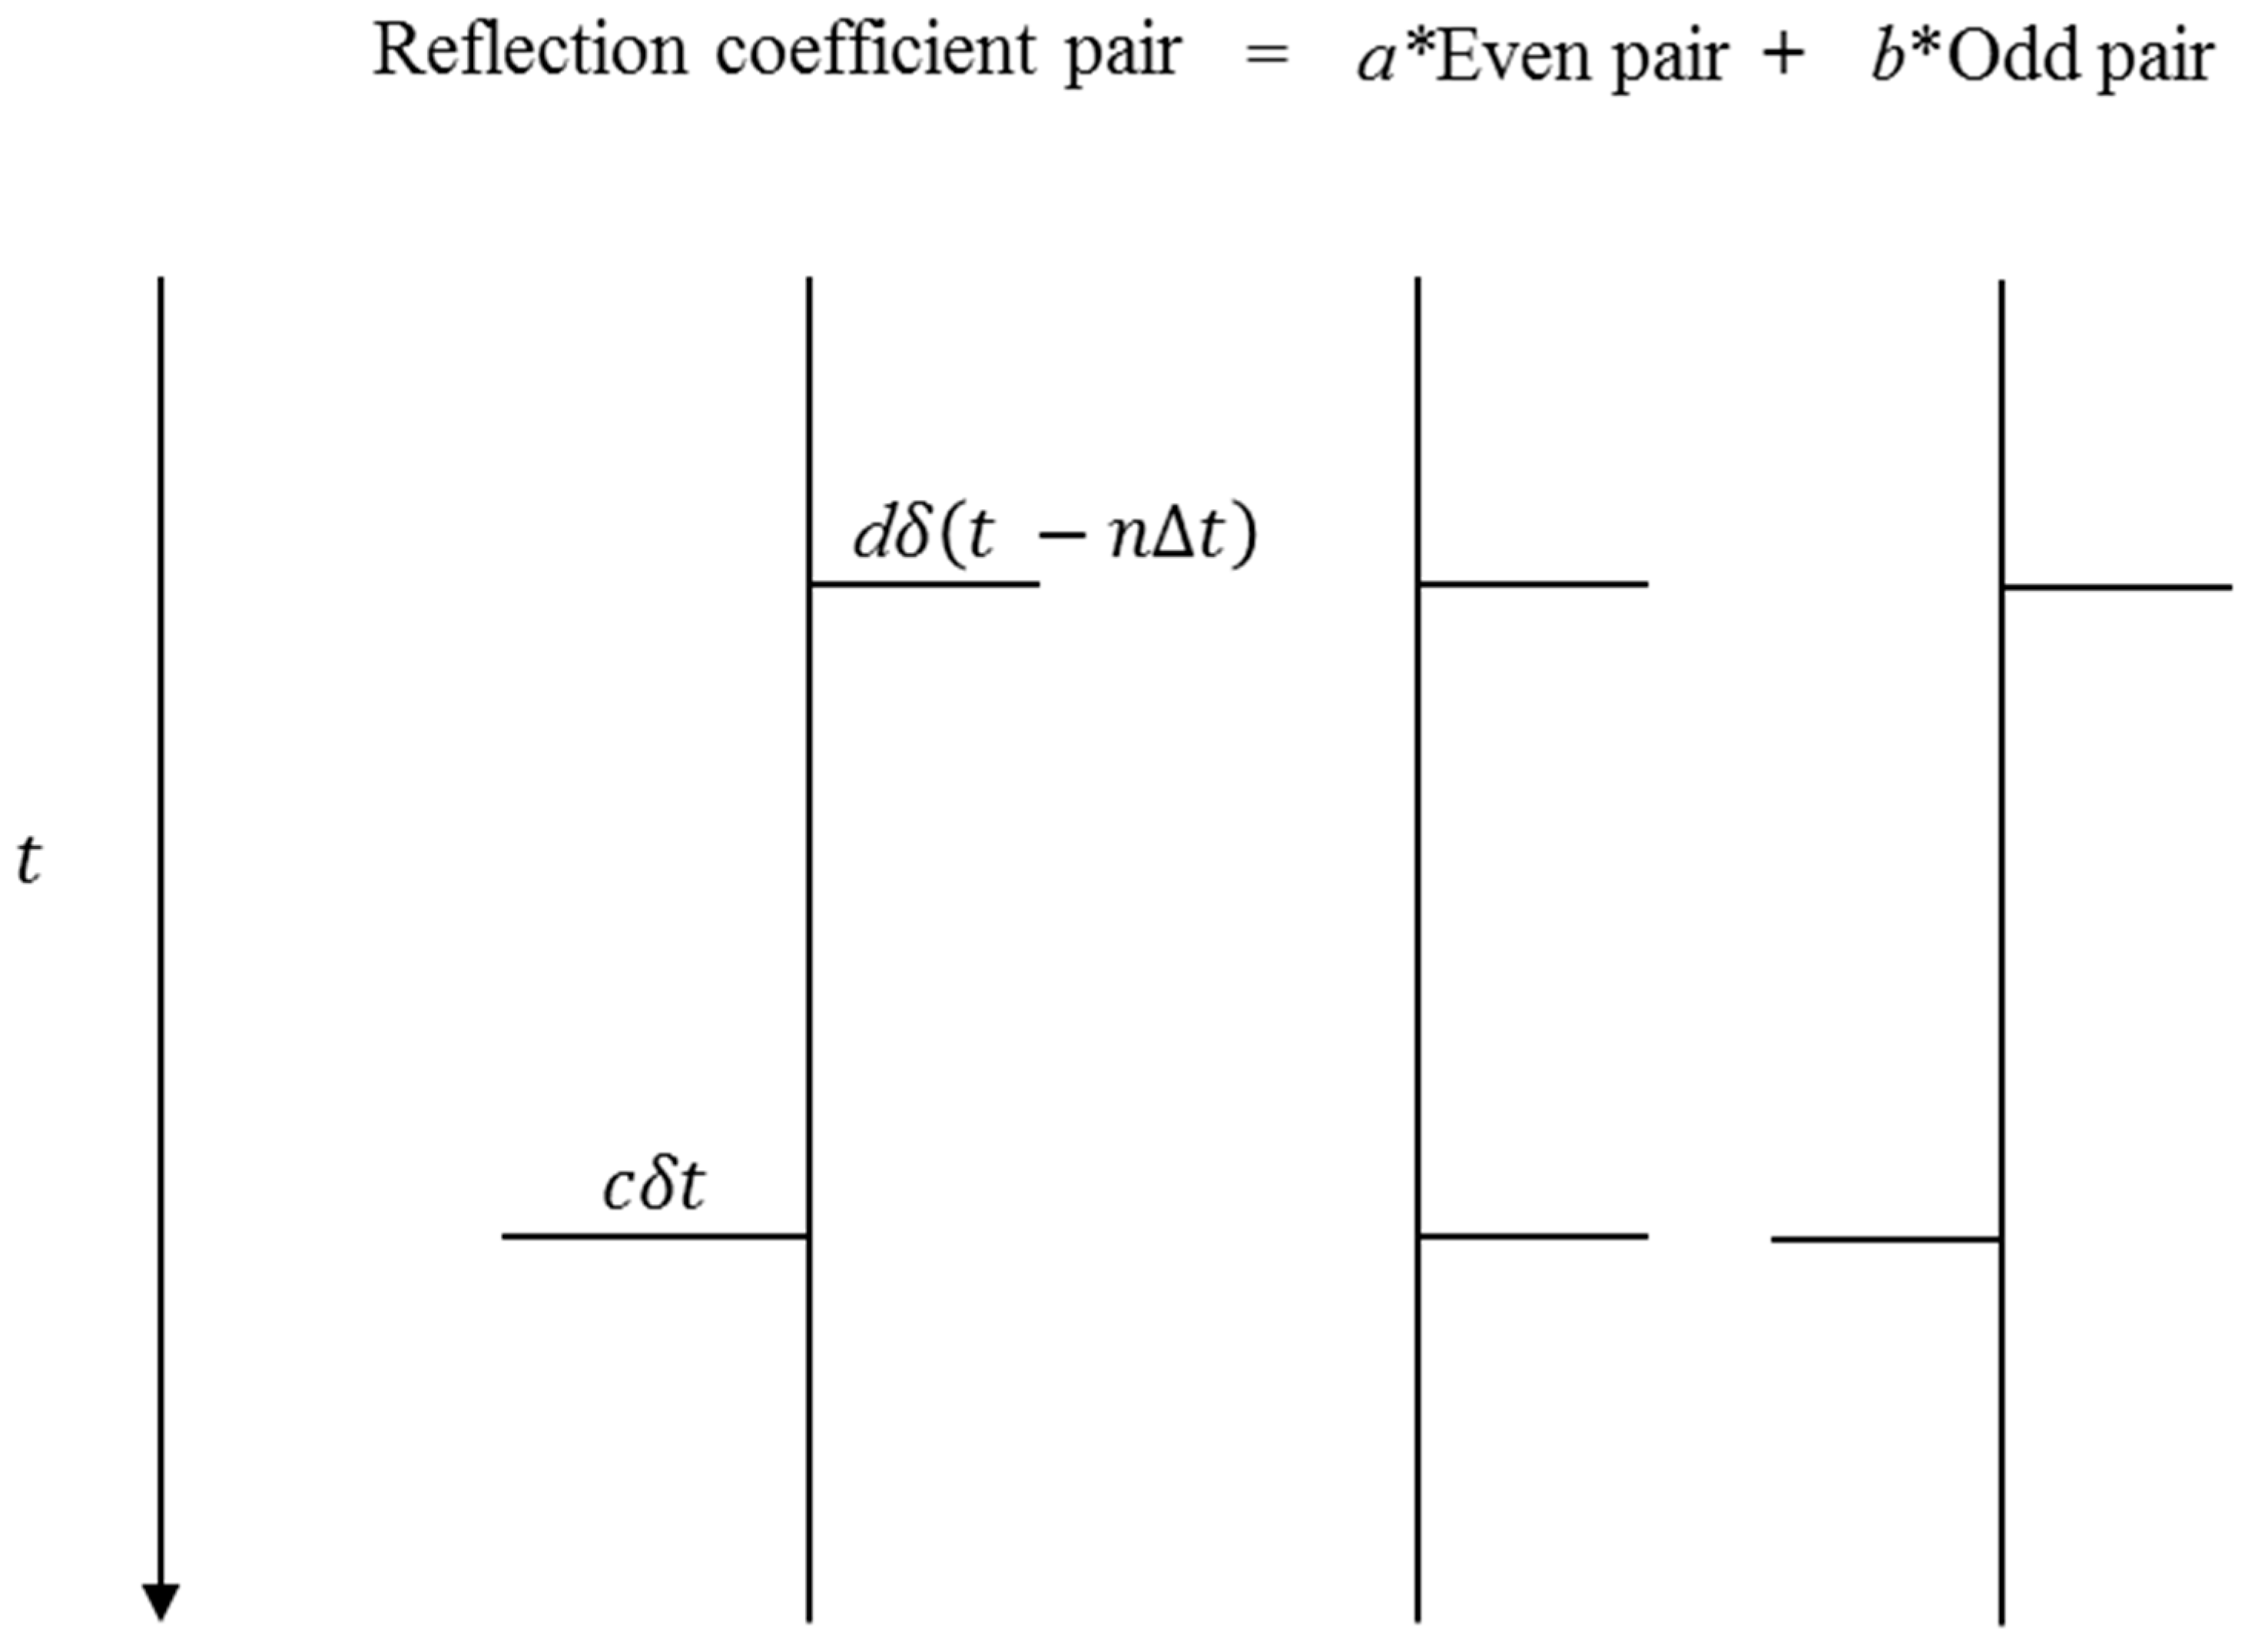
To accurately characterize thin-layer structures, this study adopts the reflection coefficient parity decomposition theory proposed by Zhang et al. [33]. This theory represents the reflection response of a single thin layer as the sum of a pair of reflection coefficients, which can be further decomposed into odd and even components (Figure 12). Such decomposition transforms the multi-parameter estimation problem of thin-layer reflection coefficients into a sparse parity decomposition coefficient solving problem, which is highly consistent with the sparsity constraint of the -norm. On this basis, a wedge dictionary is constructed, and the basis pursuit algorithm is used to solve the parity decomposition coefficients, thereby reconstructing a reflection coefficient sequence with high resolution and fidelity [34,35,36].
Figure 12.
Schematic diagram of the parity decomposition of reflection coefficients. The arrow indicates the direction of increasing two-way travel time.
Assuming that the time corresponding to the top of a thin layer is ( is the seismic time sampling rate), and the time thickness of the thin layer is , then the time corresponding to the bottom of the thin layer is + . Consequently, the odd and even components of the reflection coefficient for this thin layer are given as follows:
The three reflection parameters based on the wedge model can be expressed as:
In which , , , , and represent the dipole decomposition coefficients, is the maximum time thickness of the wedge model, and is the number of time samples in seismic trace. The matrix expressions for the three reflection parameters are given as follows:
Substituting Equations (17)–(19) into Equation (20) yields:
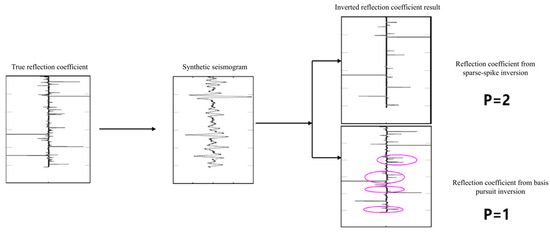
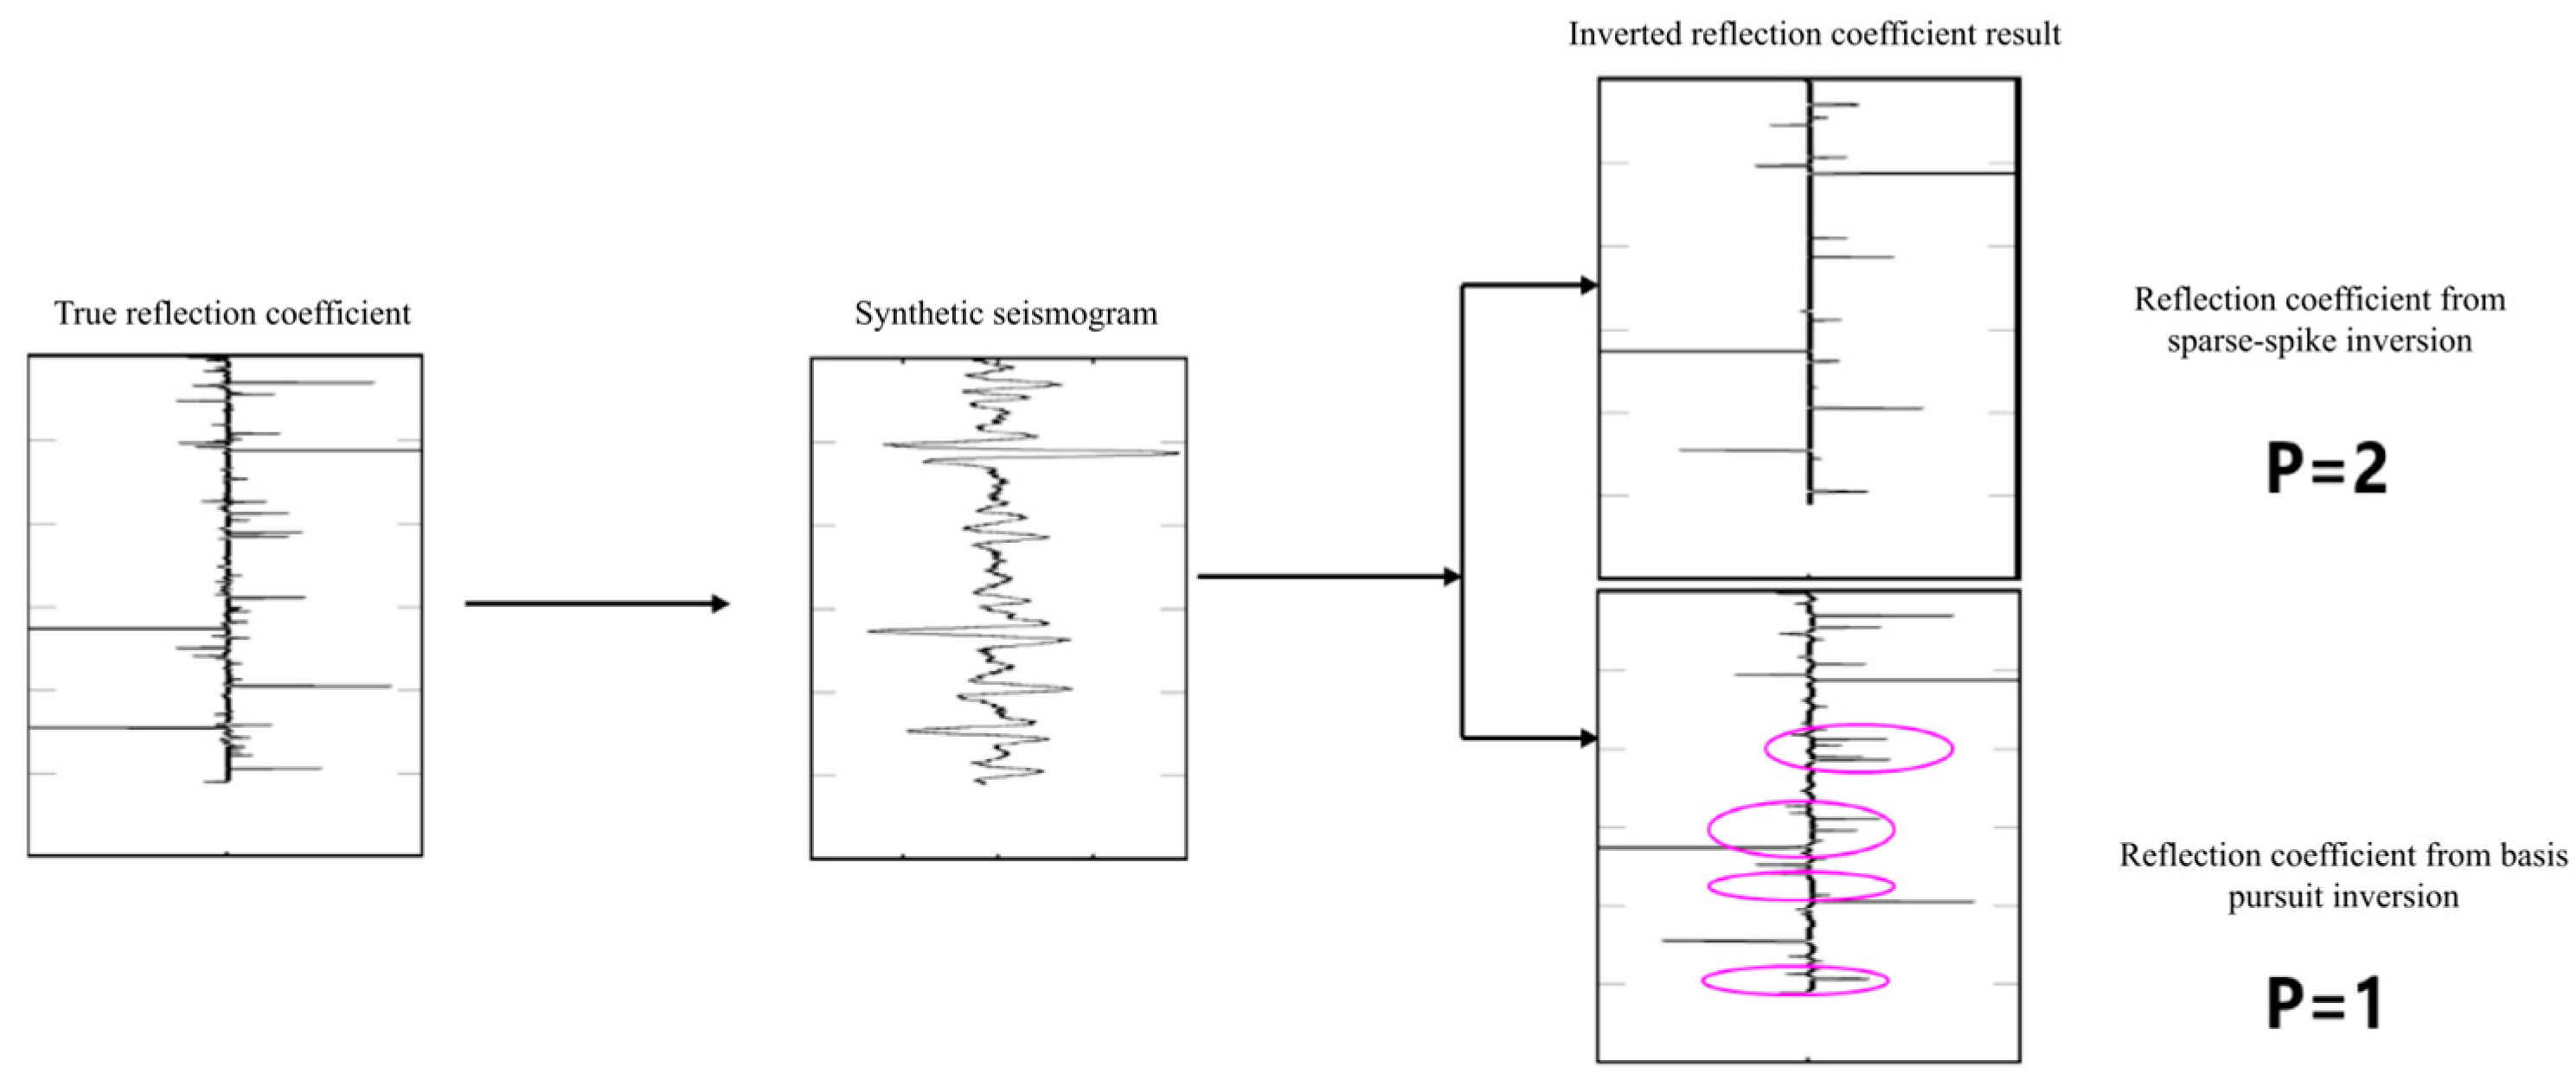
Compared with routine inversion, the reflection coefficient inversion results based on basis pursuit achieve significant improvements in thin-layer identification (Figure 13), providing reliable seismic reflection coefficient inputs for elastic parameter inversion.
Figure 13.
Comparison of reflection coefficient results between the routine method and the basis pursuit-based method. The pink circles mark the target thin reservoir intervals.
The high-resolution sparse reflection coefficients obtained via the basis pursuit algorithm only reflect elastic contrasts across stratigraphic interfaces. Therefore, it is necessary to further combine the approximation theory of prestack seismic reflection coefficients to convert angle-dependent sparse reflection coefficients into core elastic parameters for reservoir evaluation, including P-wave impedance, S-wave impedance and Poisson’s ratio. In this study, the widely used Fatti simplified approximation Equation (10) is employed to establish the quantitative relationship between angle-dependent reflection coefficients and elastic parameters. To overcome the ill-posedness of elastic parameter inversion while fully preserving the high-resolution characteristics of the compressed sensing, a multi-constraint objective function incorporating a data fitting term, a sparse regularization term, and a constraint term is constructed as follows:
where represents the objective function, and and are regularization weight coefficients, whose optimal values are determined through well-seismic calibration and cross-validation. The physical meanings and expressions of each term are as follows.
1. Data fitting term: This term measures the residual between the theoretical reflection coefficients obtained from inversion and the high-resolution sparse reflection coefficients derived from basis pursuit. The -norm is adopted as the metric to ensure overall fitting accuracy:
in which is the observed sparse reflection coefficient vector corresponding to the angle-stacked seismic data; is the theoretical reflection coefficient vector computed from elastic parameters; is the forward operator matrix; and m is the elastic parameter vector to be inverted.
2. Sparse regularization term: This term inherits the -norm sparsity constraint characteristic of compressed sensing and imposes a constraint on the vertical difference in elastic parameters. It is designed to preserve the high resolution of the inversion results and to accurately delineate elastic contrasts at thin-layer interfaces:
where is the first-order vertical difference operator matrix. This constraint effectively suppresses excessive smoothing of the inversion results and preserves the high-frequency information corresponding to thin layers. It complements the high-resolution characteristics of the wedge dictionary deconvolution and resolves the resolution loss issue inherent in conventional -norm constrained inversion.
3. Lateral continuity constraint term: This term applies an -norm constraint to the lateral difference in elastic parameters, ensuring lateral consistency and suppressing isolated noise-induced anomalies:
in which is the first-order lateral difference operator matrix.
The optimal parameter for this study was determined through synthetic seismogram calibration and cross-validation, yielding values of , . The operator D employs a first-order forward difference scheme, and H employs a first-order central difference scheme.
The L1-L2 mixed-norm optimization problem was solved using the alternating direction method of multipliers (ADMM). This algorithm decomposes the complex optimization problem into multiple simpler subproblems and solves them alternately, making it suitable for the elastic parameter inversion of large-scale 3D seismic data. The primary parameters were set as follows: penalty parameter , maximum number of iterations , and convergence threshold . After obtaining the elastic parameters in the logarithmic domain, the P-wave and S-wave impedance volumes in the original domain were recovered through exponential transformation.
Through the above procedure, the high-resolution sparse reflection coefficients derived from compressed sensing are transformed into P-wave impedance, S-wave impedance, and Poisson’s ratio volumes with equivalent resolution. These volumes provide high-quality input parameters for the EDF-based density decoupling method described in Section 3.3, effectively overcoming the decoupling errors and quantitative porosity calculation biases caused by insufficient resolution of routine prestack inversion.
4. Results
Formation porosity prediction is one of the main components of complex reservoir geophysics research. Routine methods obtain P-wave impedance via poststack inversion and then calculate porosity by establishing a regression formula between porosity and P-wave impedance. This approach yields satisfactory results for reservoirs with homogeneous pore types and lithologies. However, when reservoir lithology is complex, especially when pore types exhibit strong heterogeneity, the prediction error of this method increases significantly.
Extensive rock physics analysis indicates that the density log is highly correlated with total formation porosity, making it the optimal curve for porosity calculation [37]. However, density inversion has long been a challenge in reservoir geophysics. In this study, a density inversion method based on the EDF is first applied to obtain a high-precision density volume. Subsequently, using Equations (8) and (9), the porosity-sensitive factor and reservoir-type indicator volumes are calculated from density and Poisson’s ratio. Further, reservoir space types are identified according to the classification thresholds. For each pore type, the differentiated relationships between porosity-sensitive factors and porosity established in Figure 6 are applied separately, enabling a classified calculation of porosity. These results provide data support for the identification of potential target areas.
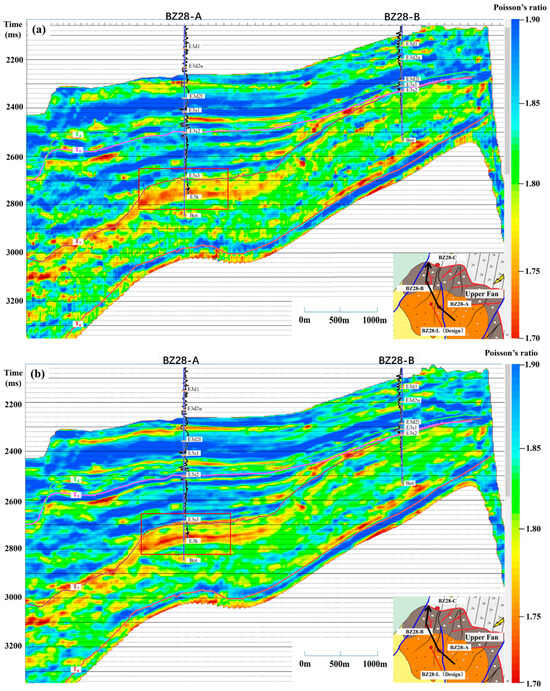
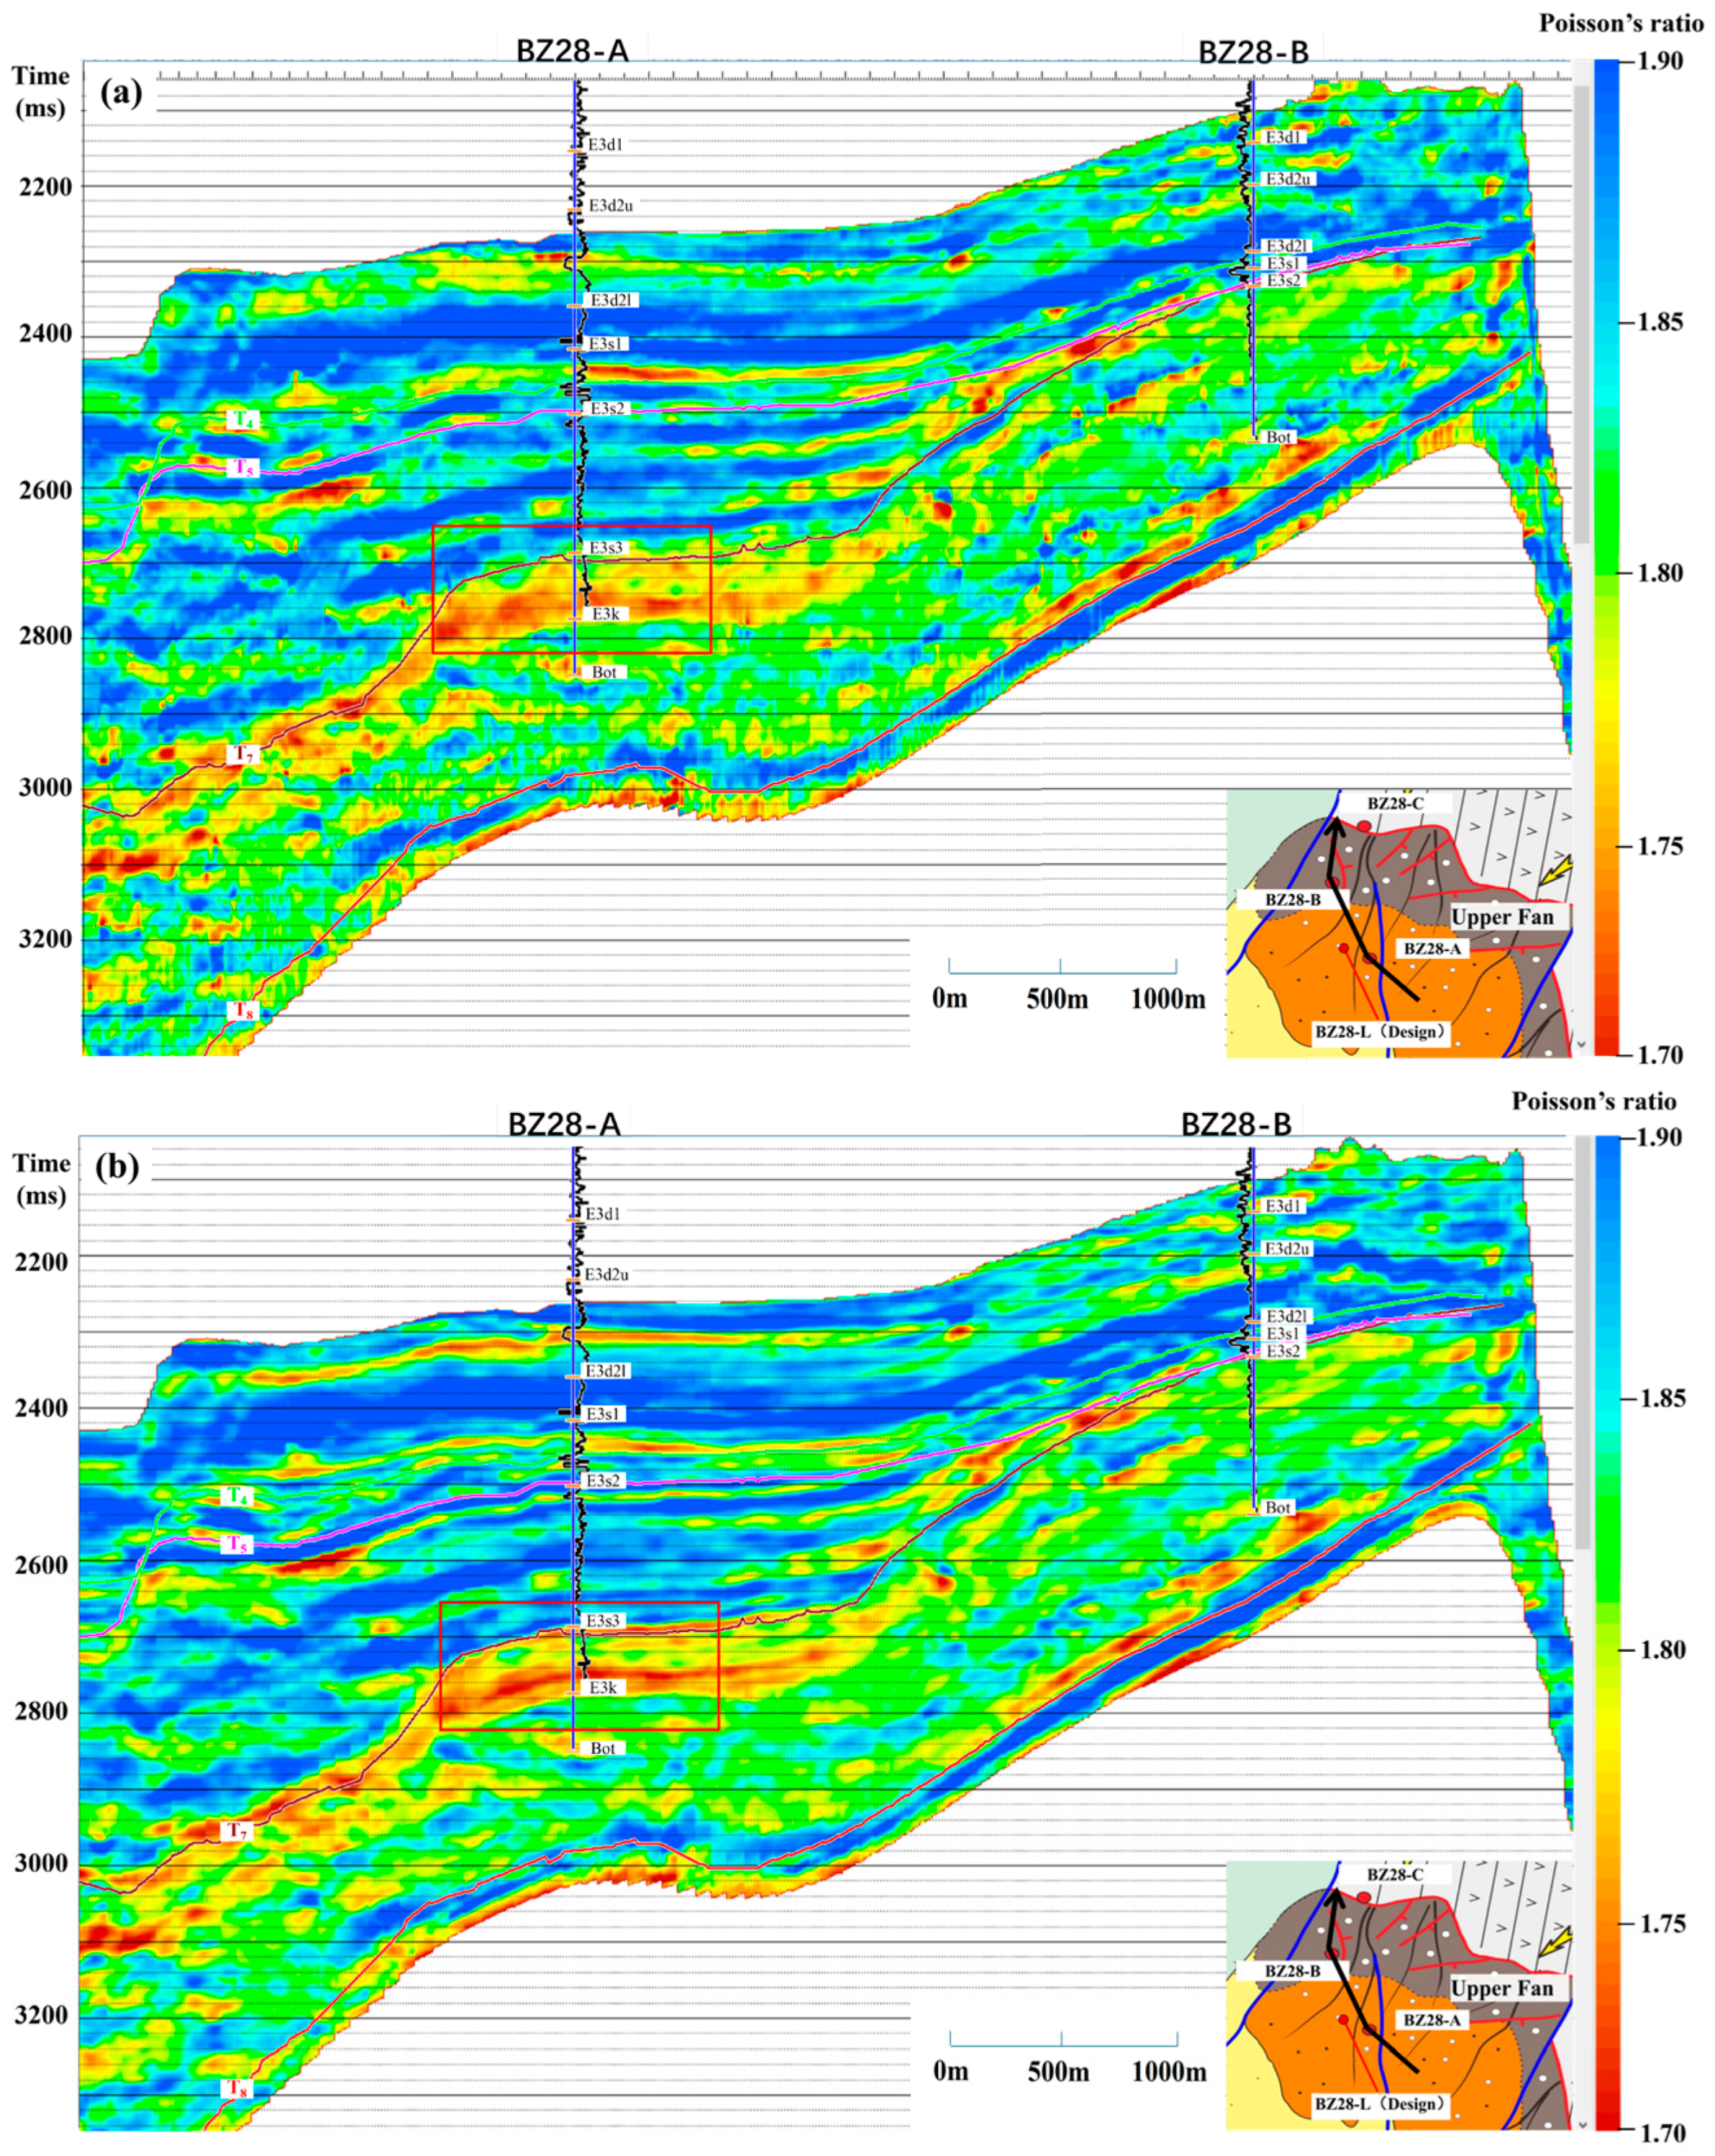
Figure 14 presents a comparison of Poisson’s ratio inversion profiles. The left panel shows the result from prestack simultaneous inversion, and the right panel shows the result from compressed sensing inversion. In Well BZ28-A, two reservoir intervals were drilled in the Kongdian Formation, with log-derived thicknesses of 38 m and 28 m, respectively, separated by a 10 m mudstone interlayer. On the prestack simultaneous inversion profile (Figure 14a), these two reservoirs appear as a vertically connected low Poisson’s ratio anomaly, where the reservoir units overlap and the interlayer cannot be effectively resolved, indicating insufficient vertical resolution. In contrast, on the compressed sensing inversion profile (Figure 14b), two independent low Poisson’s ratio bands are clearly delineated, with their top and bottom boundaries closely matching the lithological boundaries in the well. The mudstone interlayer between the two reservoirs is accurately reproduced, demonstrating an improvement in vertical resolution. Furthermore, the compressed sensing inversion results exhibit better correspondence with seismic reflection characteristics, as manifested by a closer match between reservoir intervals and seismic events. Background noise and sidelobe artifacts are significantly suppressed, further confirming the higher reliability of the inversion results.
Figure 14.
Comparison of Poisson’s ratio inversion results. (a) prestack simultaneous inversion result; (b) compressed sensing inversion result. The red box outlines the target reservoir interval. The black arrows show the location of the seismic profile.
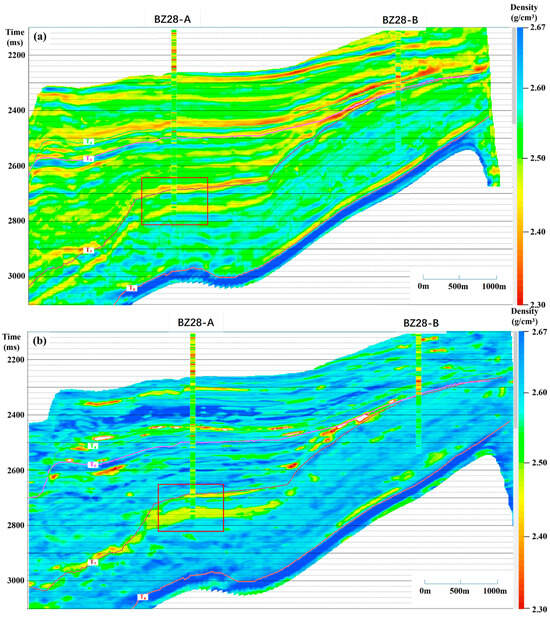
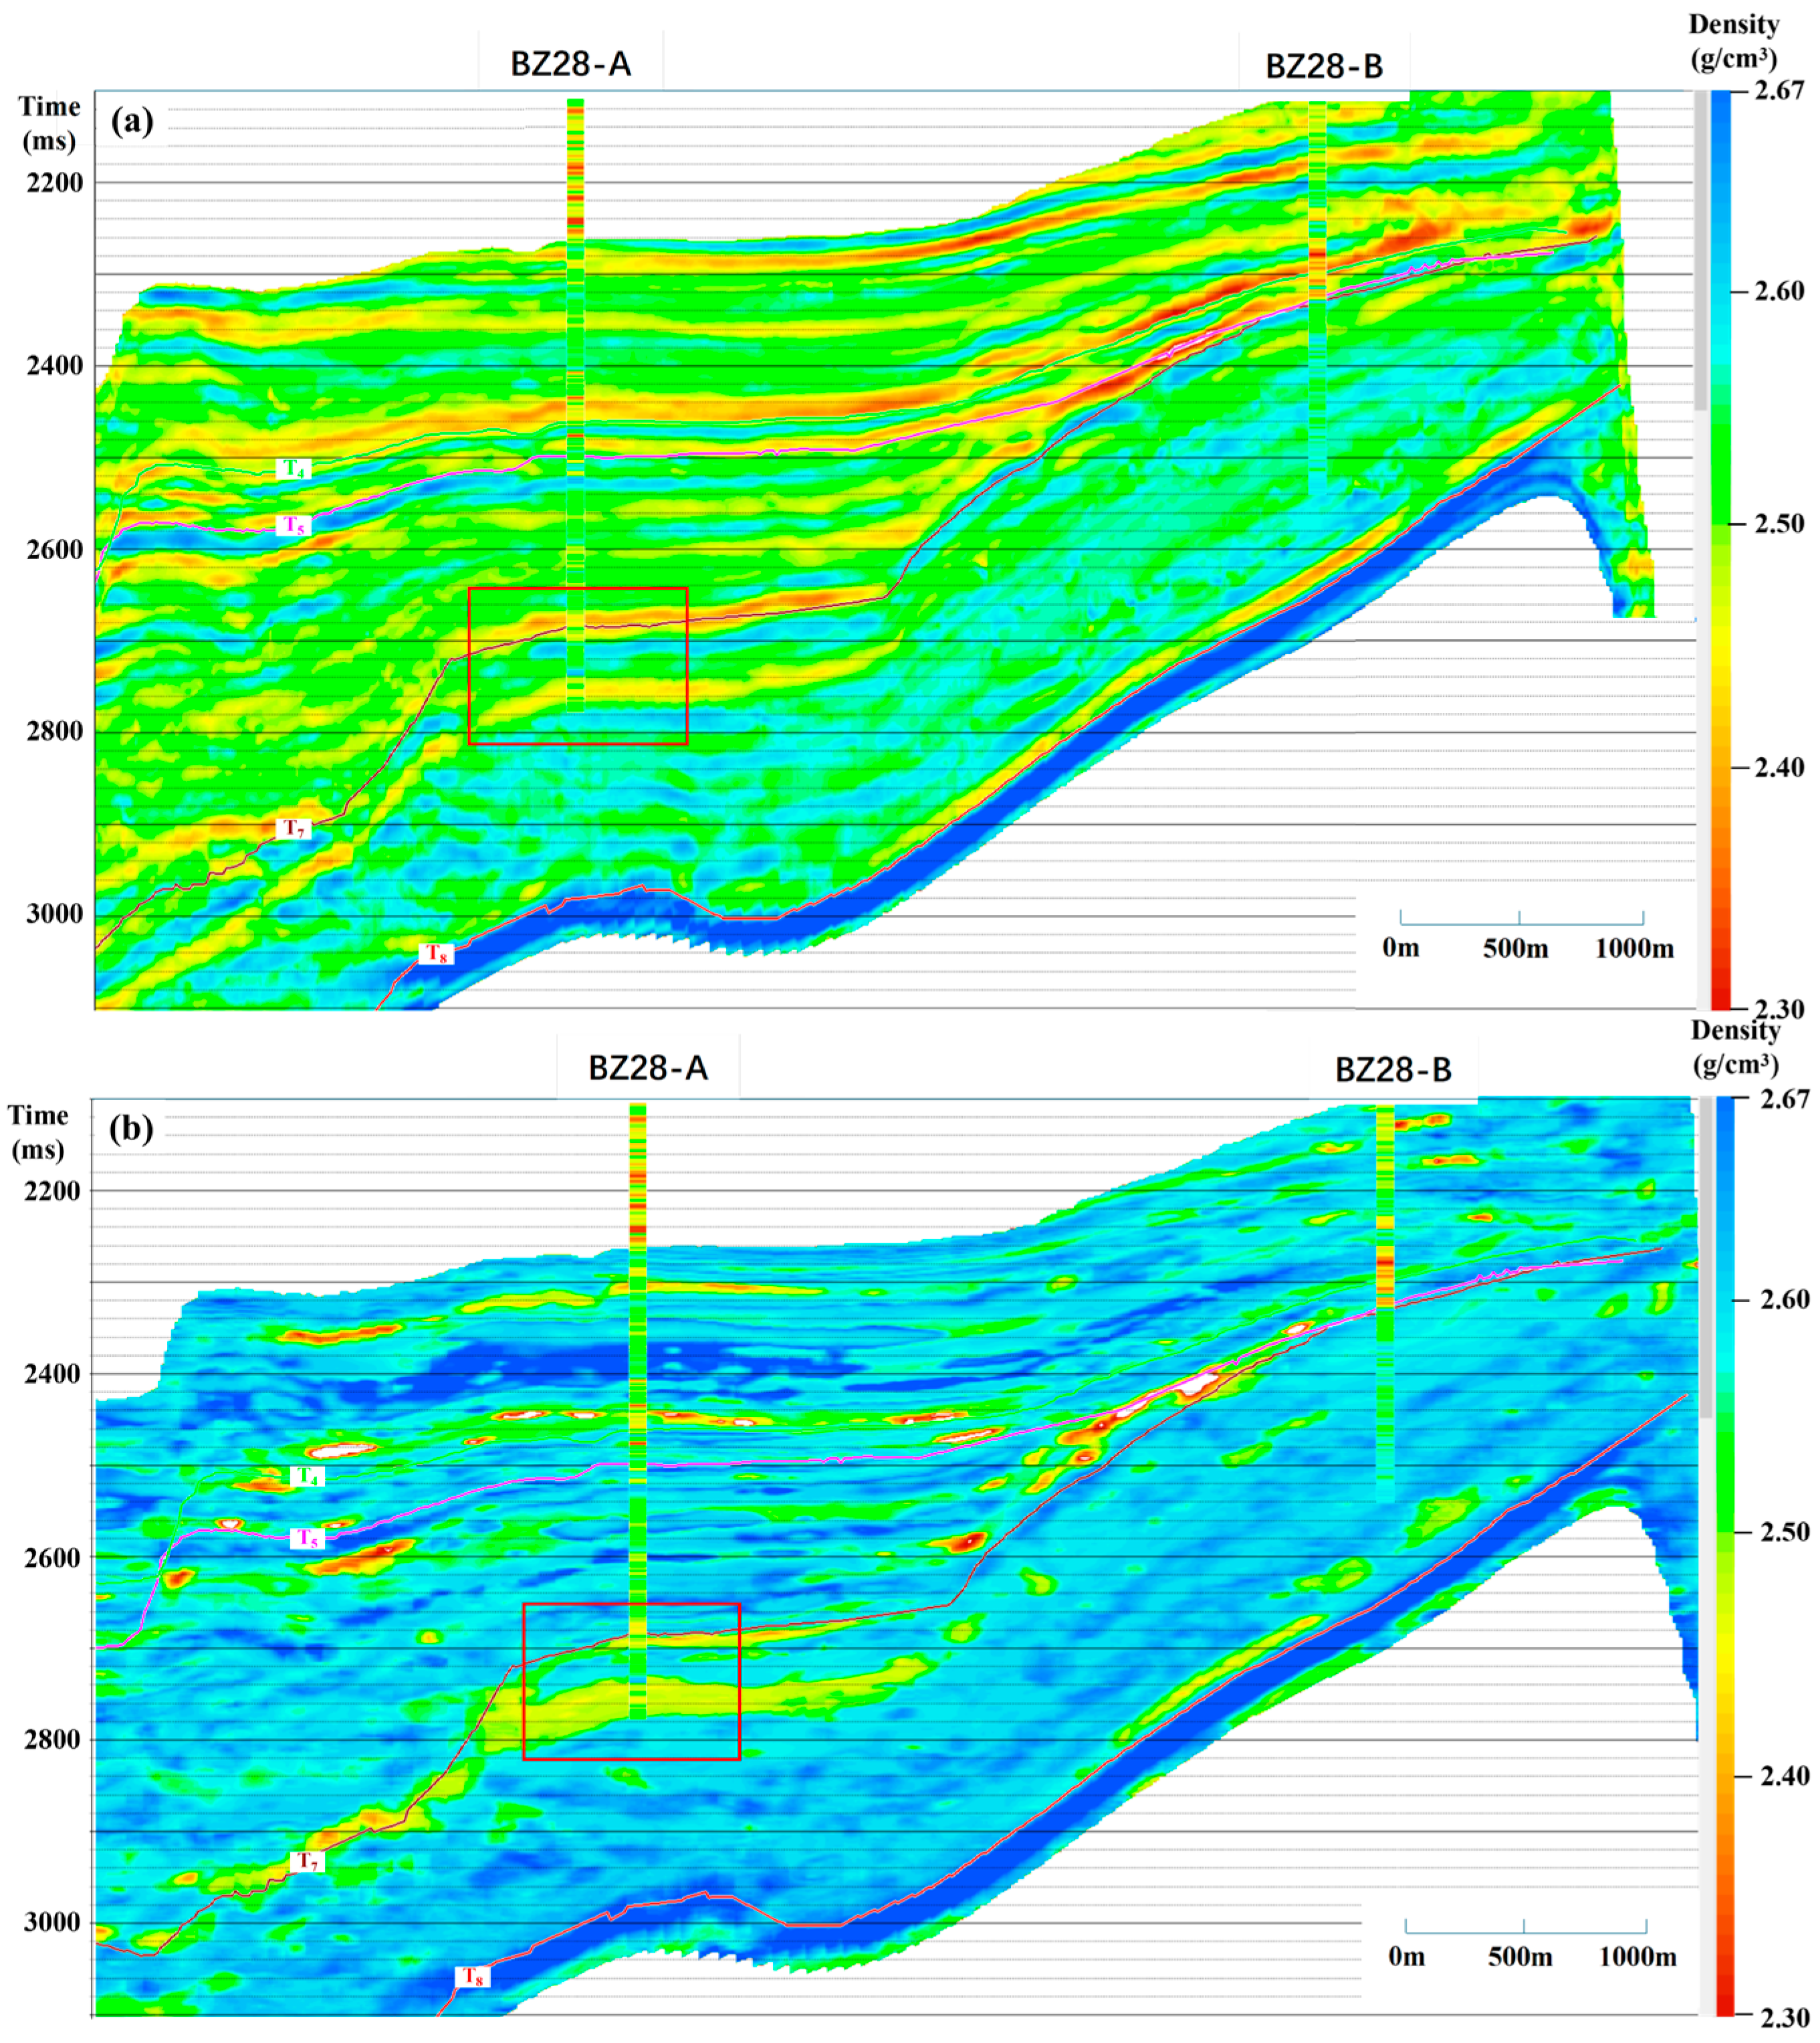
Well log data show that the two reservoir intervals in Well BZ28-A both have a density of ~2.41 g/cm3, with a distinct high-density interlayer between them. In the routine inversion result (Figure 15a), the density of the first reservoir is significantly lower than that of the second, which is inconsistent with the well data. In contrast, on the density profile, calculated using S-wave impedance based on the EDF (Figure 15b), the two low-density reservoir bands are clearly delineated with sharp boundaries. Their top and bottom contacts precisely match the lithological interfaces from the drilled well. More importantly, the inverted density values within the reservoir intervals are highly consistent with the measured logs, and the correlation coefficient rises from 62% for conventional inversion to 85%. In addition, the reflection characteristics and lateral continuity of the density profile are not controlled by the initial inversion model, exhibiting a more natural match with the original seismic reflection events. Background artifacts and model-driven false continuity are effectively suppressed, significantly improving the reliability and geological plausibility of the inversion results.
Figure 15.
Comparison of density inversion results. (a) routine inversion result; (b) EDF-based inversion result. The red box outlines the target reservoir interval.
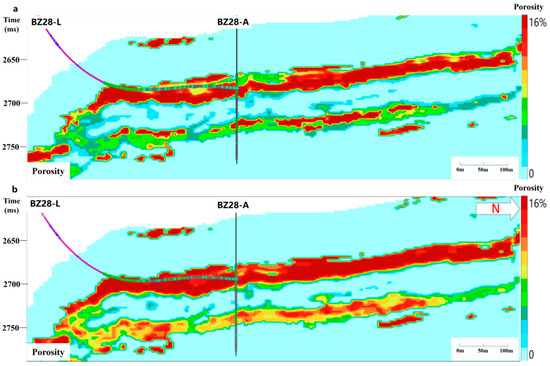
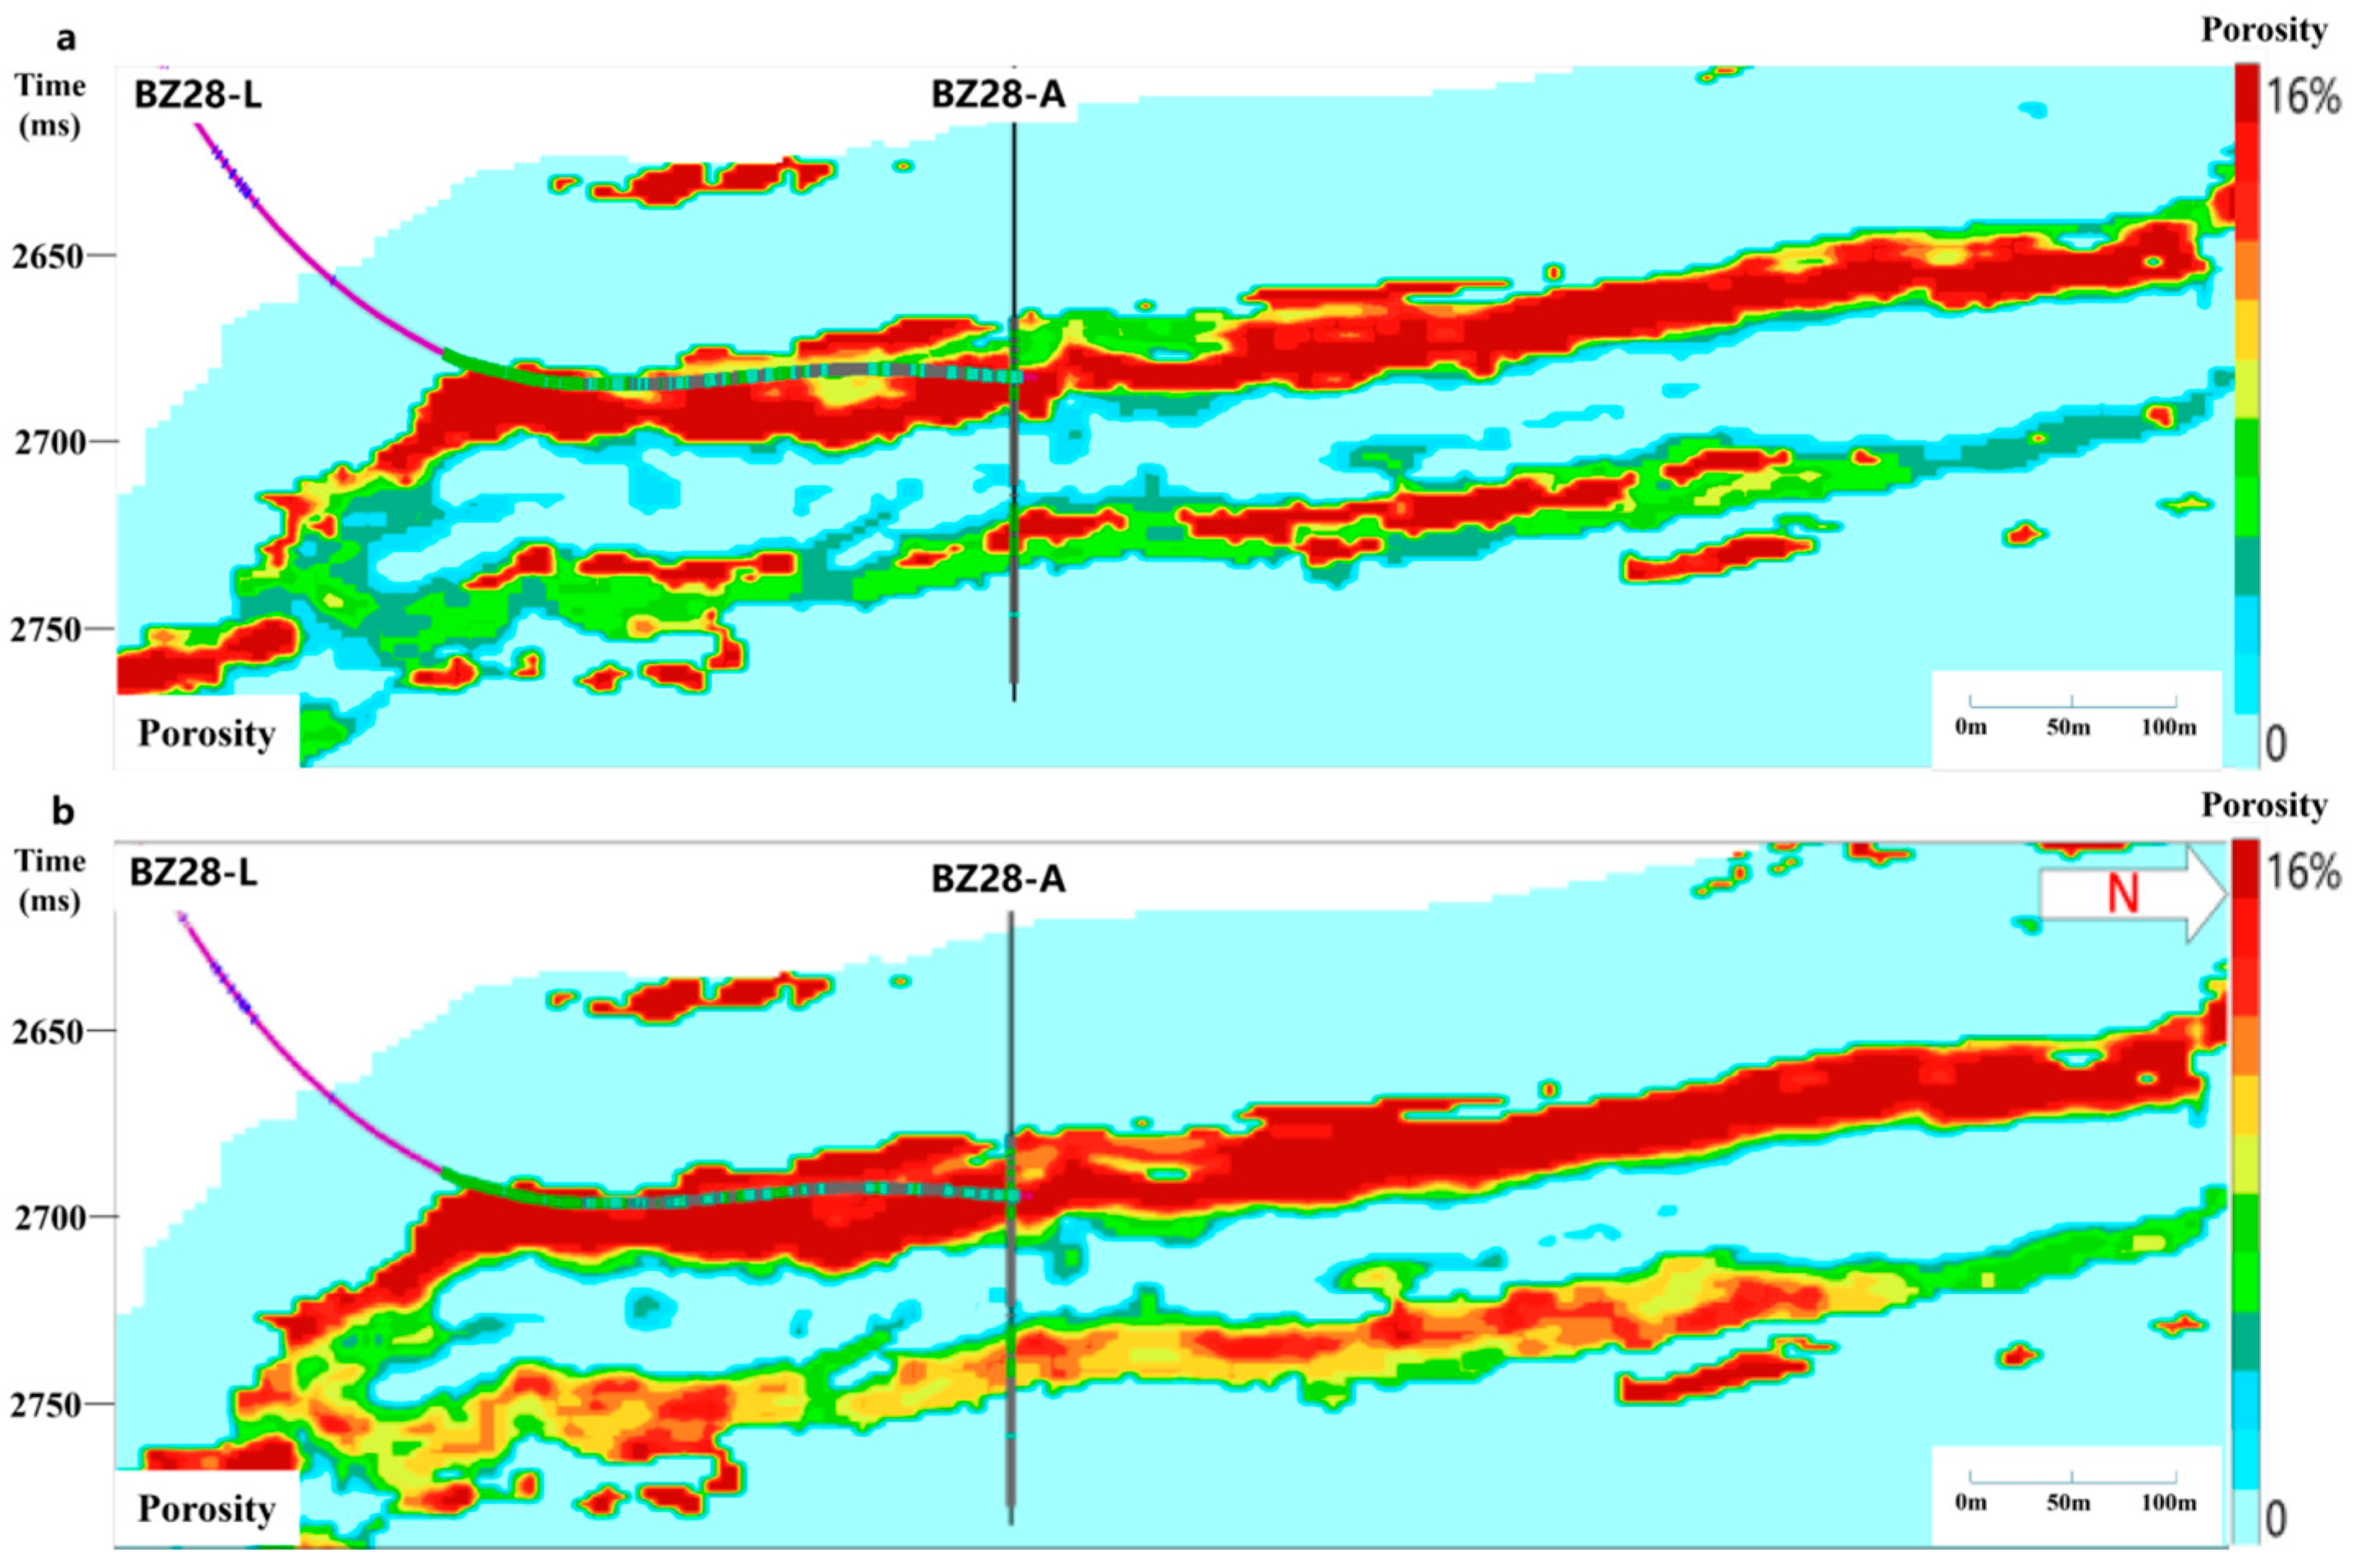
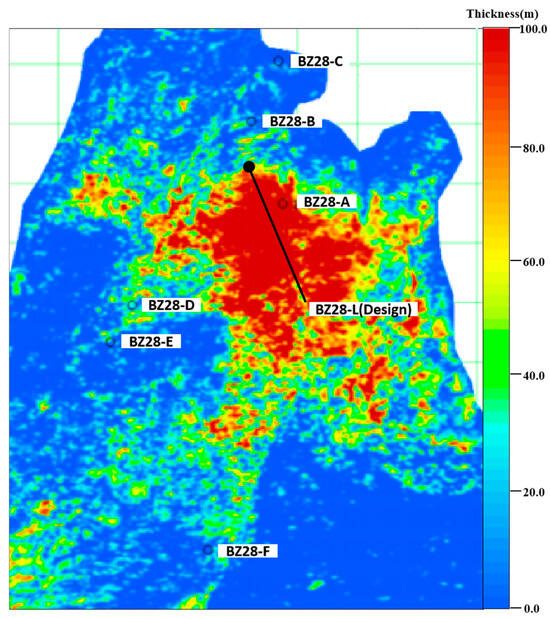
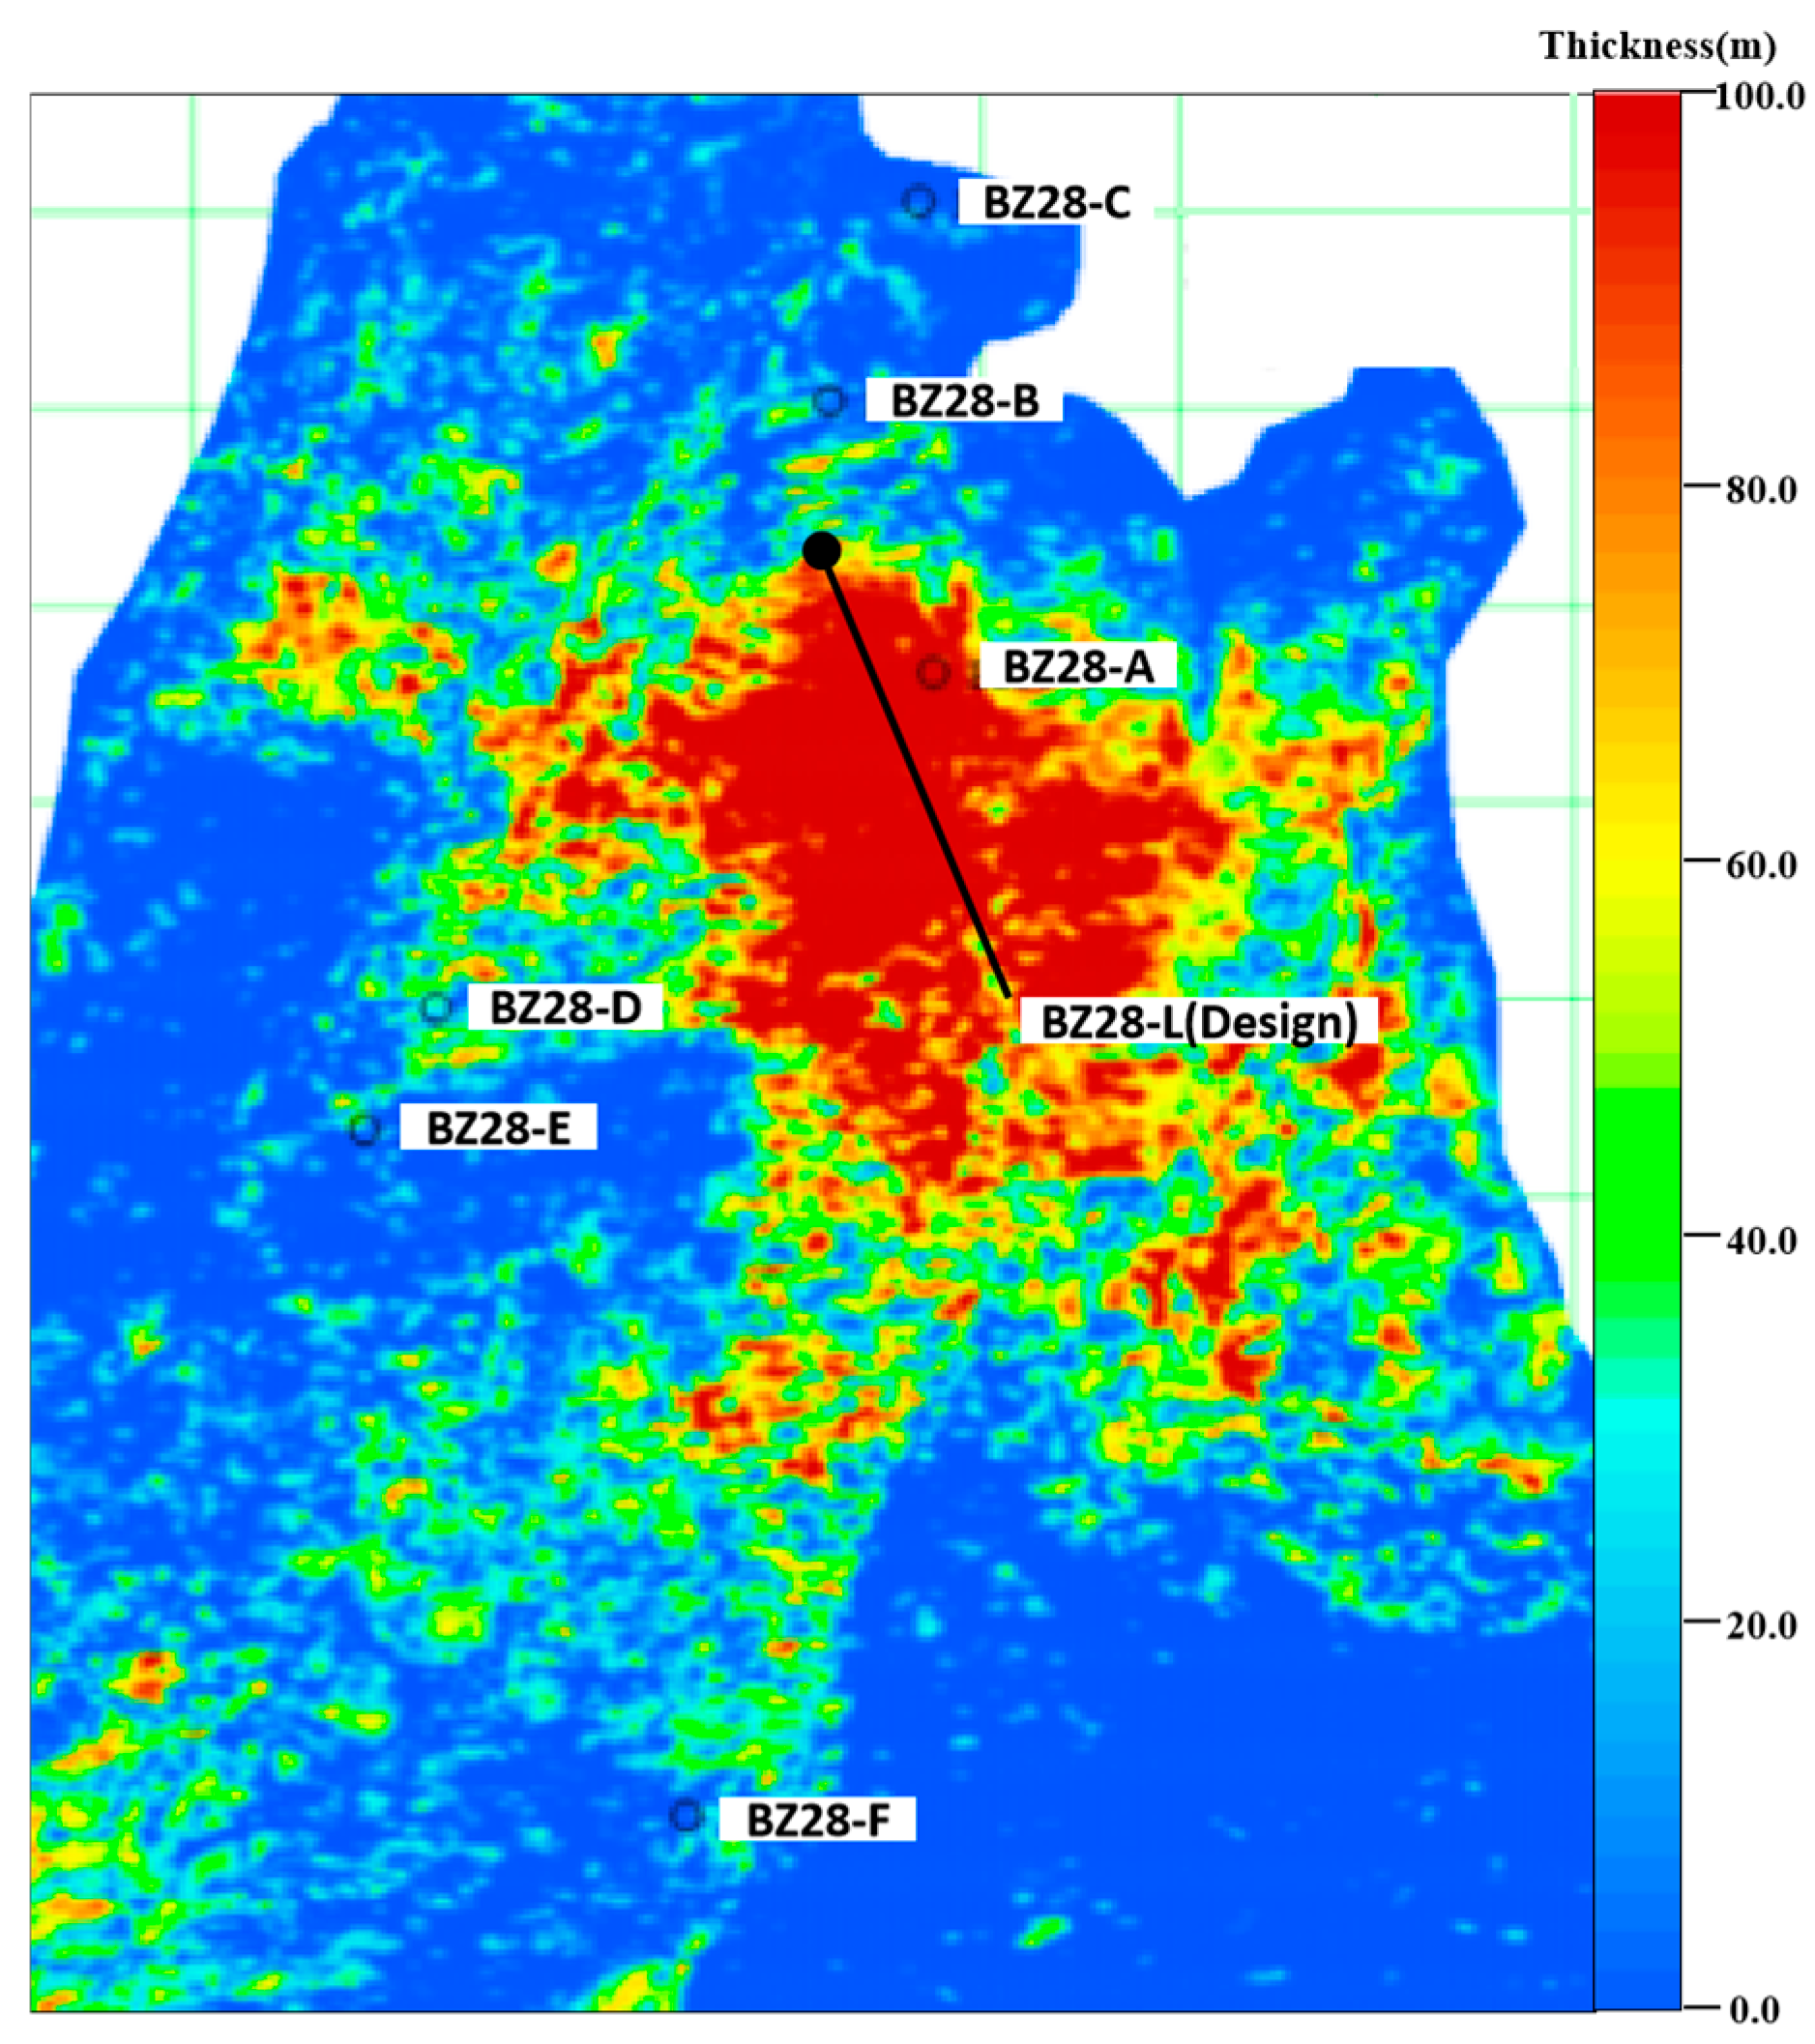
The porosity results obtained using the porosity-sensitive factor and reservoir-type indicator show better agreement with the measured data from Well BZ28-A than those from empirical formulas, yielding a correlation coefficient of 85% and confirming the reliability of the porosity prediction (Figure 16). According to the classification standard for glutenite reservoirs in the study area, reservoirs with porosity greater than 8% in the Kongdian Formation are defined as high-quality reservoirs, and their cumulative thickness is extracted along the layer. From the high-quality reservoir thickness map, two potential zones can be clearly identified (Figure 17). The main zone is located west of Well BZ28-A, trending northwest, covering an area of ~10 km2, where the high-quality reservoir thickness generally exceeds 60 m with a prominent thickness center, indicating superior reservoir physical properties. A secondary zone is located in the south, with a relatively limited area of about 2 km2, and thickness mostly below 30 m. The spatial distribution of these two zones is consistent with the structural and sedimentary facies belts. The western main zone, characterized by large reservoir thickness, good physical properties, and proximity to Well BZ28-A (which has already encountered high-quality reservoirs), is selected as the priority area for further exploration. These prediction results provide a direct quantitative basis for lithological trap identification and well placement in the study area.
Figure 16.
Comparison of porosity prediction results: (a) porosity estimation from empirical equations; (b) porosity estimation from new method.
Figure 17.
Predicted thickness map of reservoirs with porosity >8% in the upper Kongdian Formation.
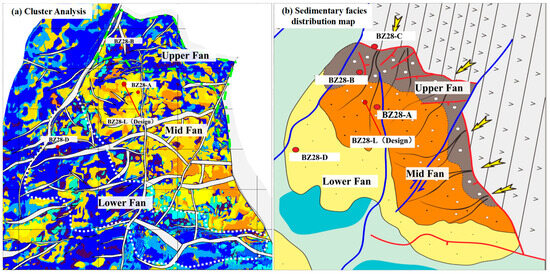
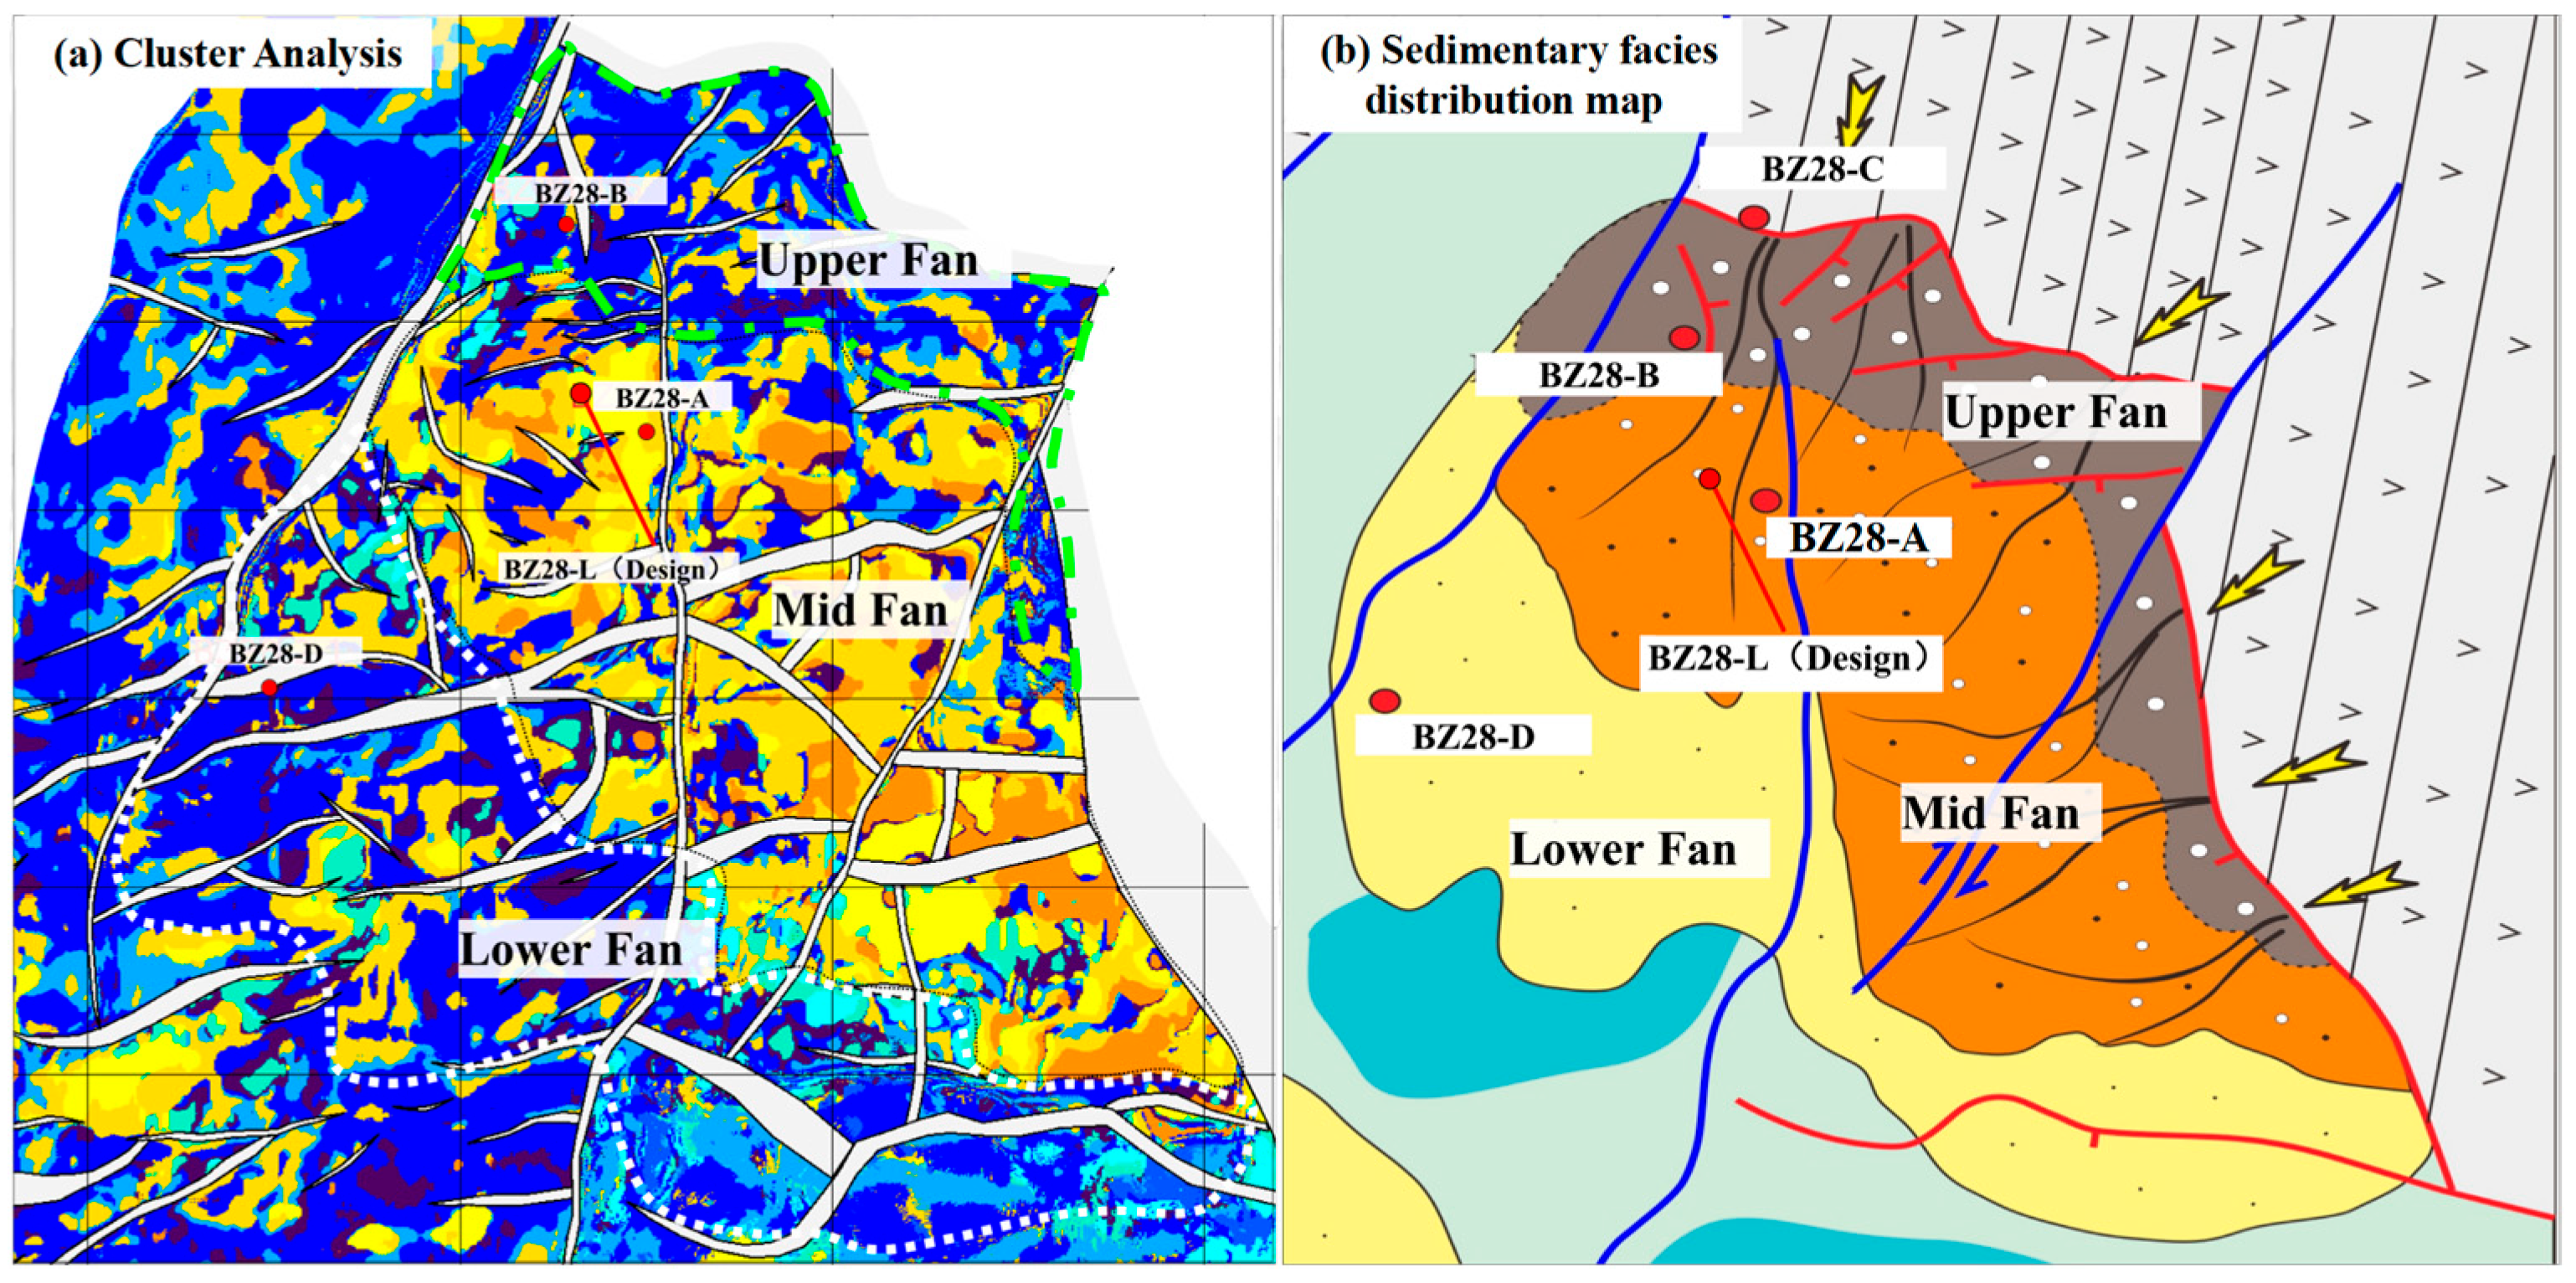
Based on the density and porosity prediction results, combined with seismic attribute analysis and sedimentary facies interpretation (Figure 18), an evaluation well, BZ28-L, was designed and drilled in the mid fan area, where high quality reservoirs are widely developed. This well was not involved in any training process and was reserved solely for independent validation of the final results. Well log interpretation indicates that the oil zone in this well is 202 m thick and the poor-oil zone is 173 m thick, which is in good agreement with pre-drilling predictions. To quantitatively evaluate the porosity prediction accuracy, core and sidewall core porosity data from Wells BZ28-A and BZ28-L were collected and compared with the predicted porosity values at corresponding depths (Table 2).
Figure 18.
Cluster analysis and sedimentary facies distribution map of the Kongdian Formation.
Table 2.
Comparison of measured and predicted porosity values from wells BZ28-A and BZ28-L.
To quantitatively evaluate the porosity prediction performance, three industry standard statistical metrics were adopted: Root mean square error (RMSE), Mean absolute error (MAE) and Mean absolute percentage error (MAPE). These metrics quantify the correlation and error magnitude between predicted and measured porosity values.
For the independent validation dataset from Well BZ28-L (N = 7): RMSE = 1.96%, MAE = 1.93%, and MAPE = 18.1%. For the modeling dataset from Well BZ28-A (N = 10): RMSE = 1.82%, MAE = 1.67%, and MAPE = 18.7%. The close accuracy between the two datasets demonstrates that the constructed model exhibits good generalization capability, with no apparent overfitting.
The statistical results show that for a total of 17 samples from the two wells, the measured porosity ranges from 5.57% to 13.65%, and the predicted porosity ranges from 6.9% to 16.3%, with an average relative error of 18.5%. The predicted values are in good agreement with the measured values in both magnitude and trend. Such prediction accuracy satisfies the requirements for quantitative evaluation of glutenite reservoirs, further validating the reliability and practicality of the “density–porosity” quantitative prediction technical system constructed in this study.
5. Discussion
- The proposed method exhibits good general applicability; however, its extension to other tight reservoirs requires certain conditions to be met. In terms of geological conditions, the study area develops both fracture-type and pore-type reservoir spaces with different elastic responses, which can be distinguished using a variable aspect ratio model. For reservoirs of single pore type, the EDF method can still be simplified and applied to density inversion. Regarding seismic data, the mid- to small-angle gathers need to have sufficient signal-to-noise ratio, amplitude preservation, and resolution to obtain reliable inversion volumes such as S-wave impedance. When extending this method to other reservoir types such as carbonates or shales, the rock physics model needs to be expanded and refined, and the EDF parameters and inversion method require further optimization.
- The method also has certain limitations. When pore types and structures become more complex, the current porosity calculation model may not be applicable and thus requires further investigation. The EDF constructed in this study is statistically derived from the glutenite lithofacies in the study area. Changes in mineral composition, cementation, and pore structure may alter the linear relationship between density and S-wave impedance, thus requiring adjustments based on regional rock physics conditions. In addition, compressed sensing inversion is highly sensitive to the signal-to-noise ratio of prestack seismic data, and the quality of prestack gathers can affect both the stability of the inversion method and the accuracy of the prediction results.
- Compared with previous studies, the method proposed in this paper differs from the direct inversion approaches of Zong et al. [6] and Zhang et al. [7], which rely on linearized Zoeppritz approximations and are highly sensitive to noise and large-angle data quality. It also complements the data-driven methods of Yang et al. [10] and Das et al. [30], which use convolutional neural networks to predict petrophysical properties from prestack data but require extensive training datasets and may lack physical interpretability. In contrast, our method is model-driven and physically constrained, yet it remains computationally efficient and applicable to real seismic data without the need for massive training samples.
- Future research may be pursued in the following directions: optimized prestack amplitude-fidelity seismic processing such as ghost and multiple suppression and Q-PSDM; integration of sedimentary facies, rock physics constraints, and deep learning to develop a more stable prestack inversion method; and strengthening research on permeability prediction models to improve the comprehensive evaluation of reservoir sweet spots.
6. Conclusions
To address the challenges of severe reservoir heterogeneity, complex pore structures, and the difficulty of porosity prediction that restrict the sweet-spot characterization of Paleogene tight glutenite reservoirs in the Bohai Sea, this study proposes a prestack density inversion method constrained by EDF for the quantitative porosity estimation of tight reservoirs.
Based on rock physics modeling with variable aspect ratios, a porosity-sensitive factor and a reservoir-type indicator are constructed. This enables quantitative discrimination between pore-type and fracture-type reservoir spaces and achieves high-precision quantitative porosity calculation, effectively reducing the prediction errors of routine methods.
Compressed sensing theory is applied to prestack seismic data. The norm is used to improve the band-limited issue inherent in conventional -norm constrained inversion, and the basis pursuit-based reflection coefficient inversion method is integrated to enhance the vertical resolution of P-wave impedance, S-wave impedance, and Poisson’s ratio, providing a solid data foundation for subsequent density inversion.
An EDF is innovatively proposed to establish a mapping relationship between S-wave impedance and density. This effectively overcomes the strong non-uniqueness problem in density inversion caused by the scarcity of large-angle reflection information in deep seismic data. Finally, high-precision porosity prediction is achieved based on the density inversion volumes.
Field application to the Kongdian Formation in the Bozhong 28 area and validation with blind well BZ28-L show that the density inversion correlation coefficient improves from 62% (routine method) to 85%. For the validation well BZ28-L, the proposed method yields RMSE = 1.96%, and MAPE = 18.1%. The average relative error between predicted porosity and core-measured values is 18.5%, and the prediction results are in good agreement with post-drill log interpretations. The successful application to real data from the Bohai Bay Basin demonstrates the feasibility and effectiveness of the method, which has potential for promotion and application in areas with similar geological conditions.
Author Contributions
Conceptualization, C.L. and T.Q.; methodology, C.L.; software, T.Q. and T.L.; validation, C.L., T.Q. and D.H.; formal analysis, T.L.; investigation, T.Q.; resources, C.L.; data curation, F.M.; writing—original draft preparation, C.L.; writing—review and editing, D.H. and T.L.; visualization, T.L.; supervision, C.L.; project administration, F.M.; funding acquisition, C.L. All authors have read and agreed to the published version of the manuscript.
Funding
Comprehensive Scientific Research Project of CNOOC China Limited, Grant/Award Number: CNOOC-KJZH-2024-2107.
Data Availability Statement
The datasets presented in this article are not readily available as, due to confidentiality agreements, the raw data cannot be shared publicly.
Acknowledgments
The authors sincerely thank the management of CNOOC Limited-Tianjin for granting permission to present this paper and seismic datasets, and especially thank the team members for their collaboration.
Conflicts of Interest
All authors are employed by the company China National Offshore Oil Corporation China Limited. The authors declare that this employment does not influence the design of the study, the collection, analysis, or interpretation of data, the writing of the manuscript, or the decision to publish the results.
Abbreviations
The following abbreviations are used in this manuscript:
| EDF | Elastic Decoupling Factor |
| DEM | Differential Equivalent Medium |
| CV | Coefficients of Variation |
| ADMM | Alternating Direction Method of Multipliers |
| RMSE | Root Mean Square Error |
| MAE | Mean absolute error |
| MAPE | Mean absolute percentage error |
References
- Wang, W.; Zhang, Z.; Chen, L.; Yang, C. Application of genetic inversion constrained by numerical model of sedimentary evolution in reservoir prediction of Paleogene fan delta in Bohai Bay basin. In Proceedings of the SEG-Society of Exploration Geophysicists, Huston, TX, USA, 28 August–1 September 2023. [Google Scholar] [CrossRef] [Scilit]
- Zou, C.; Tao, S.; Zhou, H.; Zhang, X.; He, D.; Zhou, C.; Wang, L.; Wang, X.; Li, F.; Zhu, R.; et al. Genesis, classification, and evaluation method of diagenetic facies. Pet. Explor. Dev. 2008, 35, 526–540. [Google Scholar] [CrossRef] [Scilit]
- Li, Q. The Road to Precise Prospecting: Analysis of High-Resolution Seismic Exploration System Engineering; Petroleum Industry Press: Beijing, China, 1993. (In Chinese) [Google Scholar]
- Goodway, B.; Chen, T.; Downton, J. Improved AVO fluid detection and lithology discrimination using Lamé petrophysical parameters; “λρ”, “μρ”, and “λ/μ fluid stack”, from P- and S-wave inversions. In Proceedings of the SEG Technical Program Expanded Abstracts 1997, Dallas, TX, USA, 2–7 November 1997; SEG: Huston, TX, USA, 1997; pp. 183–186. [Google Scholar] [CrossRef] [Scilit]
- Chopra, S.; Marfurt, K.J. Seismic Attributes for Prospect Identification and Reservoir Characterization; Society of Exploration Geophysicists and European Association of Geoscientists and Engineers: Tulsa, OK, USA, 2007. [Google Scholar] [CrossRef] [Scilit]
- Zong, Z.; Yin, X.; Zhang, F.; Wu, G. Approximate equation of Young’s modulus and Poisson’s ratio reflectivity and pre-stack seismic inversion. Chin. Geophys. 2012, 55, 3786–3794. (In Chinese) [Google Scholar] [CrossRef]
- Zhang, G.; Du, B.; Li, H.; Chen, H.; Li, Z.; Yin, X. A prestack joint inversion method of PP- and PS-waves for shale gas reservoirs. Chin. Geophys. 2014, 57, 4141–4149. (In Chinese) [Google Scholar] [CrossRef]
- Gong, F.; Zhang, Z.; Peng, S.; Guo, Q.; Wang, G. Pre-stack seismic inversion of dual-porosity geometry in deep coalbed methane reservoirs based on decoupled equivalent medium theory. Geophys. Prospect. 2026, 74, e70131. [Google Scholar] [CrossRef] [Scilit]
- Lian, X.; Zong, Z. Prestack seismic direct prediction of permeability, pore structure, matrix, and fluid parameters based on rock-physics model approximations. Geophysics 2025, 90, M237–M260. [Google Scholar] [CrossRef] [Scilit]
- Yang, F.; Liu, Y.; Chang, S.; Chen, G. Prestack seismic porosity prediction method based on bidirectional GRU and attention mechanism. Geophys. Prospect. Pet. 2024, 63, 598–609. (In Chinese) [Google Scholar] [CrossRef]
- Russell, B.H.; Gray, D.; Hampson, D.P. Linearized AVO and poroelasticity. Geophysics 2011, 76, C19–C29. [Google Scholar] [CrossRef] [Scilit]
- Wu, S.; Wang, Y.; Li, Q.; He, Z.; Geng, J. Joint data-driven and physics-driven prestack amplitude-variation-with-angle elastic parameter inversion. Geophysics 2024, 89, R17–R32. [Google Scholar] [CrossRef] [Scilit]
- Kalashnikova, V.; Øverås, R. Robust subsurface velocity and density estimation via seismic inversion with global misfit minimisation and full-offset moveout. Geophys. Prospect. 2026, 74, e70124. [Google Scholar] [CrossRef] [Scilit]
- Peng, J.; Zhang, H.; Lu, M.; Li, B.; Xia, Q. Diagenesis and porosity evolution of Kepingtage Formation reservoir in Shuntuoguole block. J. Southwest Pet. Univ. Sci. Technol. Ed. 2016, 38, 173–182. (In Chinese) [Google Scholar] [CrossRef]
- Xu, S.; White, R.E. A new velocity model for clay-sand mixtures. Geophys. Prospect. 1995, 43, 91–118. [Google Scholar] [CrossRef] [Scilit]
- Liu, W.H.; Zhao, L.X.; Qiu, X.; Wang, Y.; Wang, Y.; Zhu, W. Use digital rock physics to characterize velocity and attenuation signatures of deep cavity-fracture carbonate reservoirs. J. Geophys. Eng. 2024, 21, 1477–1487. [Google Scholar] [CrossRef] [Scilit]
- Wang, S.; Tan, M.; Zhang, L.; Wang, Q. High-precision digital rock construction and electrical property upscaling in tight sandstone. Geophysics 2024, 90, MR73–MR83. [Google Scholar] [CrossRef] [Scilit]
- Wang, Y.R.; Zhao, L.X.; Beatriz, Q.; Geng, J.H. Characterizing broad-band seismic dispersion and attenuation in carbonates with fractures and cavities: A numerical approach. Geophys. J. Int. 2025, 240, 1404–1425. [Google Scholar] [CrossRef] [Scilit]
- Batzle, M.; Wang, Z. Seismic properties of pore fluids. Geophysics 1992, 57, 1396–1408. [Google Scholar] [CrossRef] [Scilit]
- Gassmann, F. Über die Elastizität poröser Medien. Vierteljahrsschr. Naturforschenden Ges. Zürich 1951, 96, 1–23. [Google Scholar]
- Hill, R. The elastic behaviour of a crystalline aggregate. Proc. Phys. Soc. Sect. A 1952, 65, 349–354. [Google Scholar] [CrossRef] [Scilit]
- Mavko, G.; Mukerji, T.; Dvorkin, J. The Rock Physics Handbook: Tools for Seismic Analysis of Porous Media; Cambridge University Press: Cambridge, UK, 2009. [Google Scholar] [CrossRef] [Scilit]
- Smith, T.M.; Sondergeld, C.H.; Rai, C.S. Gassmann fluid substitutions: A tutorial. Geophysics 2003, 68, 430–440. [Google Scholar] [CrossRef] [Scilit]
- Hudson, J.A. Overall properties of a cracked solid. Math. Proc. Camb. Philos. Soc. 1980, 88, 371–384. [Google Scholar] [CrossRef] [Scilit]
- Hudson, J.A. Wave speeds and attenuation of elastic waves in material containing cracks. Geophys. J. R. Astron. Soc. 1981, 64, 133–150. [Google Scholar] [CrossRef] [Scilit]
- Zhang, F. An novel prestack basic pursuit seismic inversion. In Proceedings of the First International Meeting for Applied Geoscience & Energy Expanded Abstracts, Denver, CO, USA and Online, 26 September–1 October 2021; SEG: Huston, TX, USA, 2021; pp. 277–281. [Google Scholar] [CrossRef] [Scilit]
- Fatti, J.L.; Smith, G.C.; Vail, P.J.; Strauss, P.J.; Levitt, P.R. Detection of gas in sandstone reservoirs using AVO analysis: A 3-D seismic case history using the Geostack technique. Geophysics 1994, 59, 1362–1376. [Google Scholar] [CrossRef] [Scilit]
- Zou, C.N.; Zhu, R.K.; Liu, K.Y.; Su, L.; Bai, B.; Zhang, X.X.; Yuan, X.J.; Wang, J.H. Tight gas sandstone reservoirs in China: Characteristics and recognition criteria. J. Pet. Sci. Eng. 2012, 88–89, 82–91. [Google Scholar] [CrossRef] [Scilit]
- Miao, F.-W.; He, Y.-X.; Wang, S.-X.; Huang, H.-D. An improved inversion method of reservoir parameters is based on the exact reflection coefficient equation. IEEE Geosci. Remote Sens. Lett. 2024, 21, 7503905. [Google Scholar] [CrossRef] [Scilit]
- Das, V.; Mukerji, T. Petrophysical properties prediction from prestack seismic data using convolutional neural networks. Geophysics 2020, 85, N41–N55. [Google Scholar] [CrossRef] [Scilit]
- Donoho, D.L. Compressed sensing. IEEE Trans. Inf. Theory 2006, 52, 1289–1306. [Google Scholar] [CrossRef] [Scilit]
- Chen, X.; Zong, Z.; Qin, D.; Chen, Y. Enhanced estimation of fluid modulus and porosity via novel nonlinear elastic impedance inversion. IEEE Trans. Geosci. Remote Sens. 2024, 62, 5918514. [Google Scholar] [CrossRef] [Scilit]
- Zhang, R.; Sen, M.K.; Srinivasan, S. A prestack basis pursuit seismic inversion. Geophysics 2013, 78, R1–R11. [Google Scholar] [CrossRef] [Scilit]
- Huang, M.; Xu, L.; Zhu, Y.; He, Y.; Li, Z.; Lin, Y. Stochastic inversion method based on compressed sensing frequency division waveform indication prior. Front. Earth Sci. 2025, 12, 1505682. [Google Scholar] [CrossRef] [Scilit]
- Gelboim, M.; Adler, A.; Sun, Y.; Araya-Polo, M. Deep compressed learning for 3D seismic inversion. In Proceedings of the Third International Meeting for Applied Geoscience & Energy Expanded Abstracts, Houston, TX, USA, 28 August–1 September 2023; SEG: Huston, TX, USA, 2023; pp. 1054–1058. [Google Scholar] [CrossRef] [Scilit]
- Corrales, M.; Hoteit, H.; Ravasi, M. Seis2Rock: A data-driven approach to direct petrophysical inversion of pre-stack seismic data. Earth Space Sci. 2024, 11, e2023EA003301. [Google Scholar] [CrossRef] [Scilit]
- Tao, B.-C.; Zhou, H.-L.; Wu, W.-Y.; Zhang, G.; Liu, B.; Liu, X.-Y. Porosity prediction based on improved structural modeling deep learning method guided by petrophysical information. Pet. Sci. 2025, 22, 2325–2338. [Google Scholar] [CrossRef] [Scilit]

Disclaimer/Publisher’s Note: The statements, opinions and data contained in all publications are solely those of the individual author(s) and contributor(s) and not of MDPI and/or the editor(s). MDPI and/or the editor(s) disclaim responsibility for any injury to people or property resulting from any ideas, methods, instructions or products referred to in the content. |
© 2026 by the authors. Licensee MDPI, Basel, Switzerland. This article is an open access article distributed under the terms and conditions of the Creative Commons Attribution (CC BY) license.