1. Introduction
The development of gold deposits remains one of the most strategically important and economically significant sectors of the global mining industry. This importance is driven by the sustained demand for gold, both in the jewelry industry and as an investment and reserve asset widely used by central banks and financial institutions to support the stability of national economies [
1]. Under conditions of global economic uncertainty, the role of gold as a safe-haven asset becomes particularly significant [
2]. Consequently, exploration activities are intensifying, while both conventional mineral deposits and technogenic resources are increasingly being involved in mining operations.
In recent years, mining conditions have become progressively more complex due to increasing extraction depths, declining ore grades, and the necessity of developing deposits characterized by complicated geological structures. These trends create a growing demand for advanced mining and mineral-processing technologies, as well as scientifically grounded geomechanical modeling methods aimed at ensuring the safety, reliability, and economic efficiency of mining operations.
In Kazakhstan, the development of gold deposits is increasingly constrained by complex geological and geomechanical conditions that significantly affect the efficiency and safety of mining operations [
3]. Gold mineralization in the region occurs within heterogeneous structural settings formed under various geodynamic environments, including volcanogenic, sedimentary, and collisional regimes. Consequently, many deposits are located within tectonically disturbed zones and comprise structurally complex ore bodies characterized by highly variable morphology and grade distribution, as well as pronounced anisotropy of the surrounding rock mass. These characteristics considerably complicate mine planning and the assessment of excavation stability.
At the same time, the depletion of readily accessible high-grade reserves has resulted in a gradual transition toward deeper, lower-grade, and geologically more complex deposits. This transition requires the development of new mining areas and the economically feasible extraction of mineral resources that were previously considered marginal [
4].
Kazakhstan remains one of the world’s major gold-producing countries and hosts several large-scale mining operations. These include the Kyzyl deposit, also known as Bakyrchik, which is considered one of the largest refractory gold deposits worldwide, as well as the Varvara and Suzdal deposits and the Akbakay mining district operated by Altynalmas. National gold production is also supported by major projects such as Altyntau Kokshetau and Abyz. The continuing expansion of the country’s mineral resource base, stimulated by favorable market conditions and strategic economic priorities, requires the development of increasingly complex deposits, frequently under conditions of considerable geomechanical uncertainty.
Under these circumstances, the transition toward deeper mining levels and the extraction of structurally complex ore bodies inevitably intensify geomechanical problems. These problems include the redistribution and concentration of stresses caused by the interaction between underground excavations of different geometries and functional purposes [
5].
The presence of numerous underground openings with different shapes and dimensions, including operating mine workings, mined-out stopes, and abandoned voids, represents a potentially significant source of geotechnical risk [
6]. Under high in situ stress conditions, the rock mass surrounding these openings may experience considerable stress concentrations. Such concentrations can initiate local failure and subsequently trigger the progressive instability of larger rock structures [
7].
Inadequately designed mining operations may result in the collapse of underground stopes and the formation of extensive caved zones [
8]. Such collapse may cause continuous displacement of the upper part of the caved rock mass, accompanied by discontinuous fracturing and damage that can propagate toward adjacent stopes and mine workings.
The stability of underground mining systems is also substantially affected by the spatial orientation of ore bodies. Mussin et al. [
9] investigated the problems associated with increasing ore-body dip angles under the geological and mining conditions of the Zhezkazgan deposit in Kazakhstan. An increase in the dip angle changes the stress regime and alters the mechanisms of load redistribution within the rock mass, thereby increasing the probability of rock failure and reducing the stability of stoping chambers and inter-chamber pillars.
The transition to the extraction of ore veins at deeper mining levels requires rigorous geomechanical justification. The increasing operational risks associated with complex geological and mining conditions necessitate a shift from predominantly empirical design approaches toward scientifically grounded predictive methodologies [
10]. This transition is particularly important when introducing new mining technologies, since disturbances in rock mass stability may result in accidents, reduced production efficiency, ore dilution, and increased operating costs [
11].
Various empirical and semi-empirical models have been developed to describe rock mass behavior and assess the stability of underground excavations. Among them, the Modified Trueman–Mawdsley stability graph method continues to be used for selecting stope dimensions and evaluating the stability of exposed rock surfaces [
12]. Despite its practical applicability, this approach has several important limitations arising from its empirical nature, the subjective determination of certain input parameters, and its dependence on the database used for calibration.
A further development of this methodology, known as the Consolidated Mathews Stability Graph [
13], provides an extended empirical framework for open-stope design. Probabilistic approaches based on logistic regression have also been proposed to improve the assessment of excavation and crown-pillar stability [
14].
However, these approaches continue to describe system behavior mainly through excavation geometry and rock mass quality indices. The effects of the in situ stress field, interaction between adjacent excavations, and progressive rock mass failure are generally represented only implicitly. Therefore, stability graph methods are primarily suitable for preliminary or conceptual design rather than for a detailed analysis of the stress–strain state and failure mechanisms developing around a complex system of underground openings.
Numerical methods provide a more flexible framework because they make it possible to reproduce the actual three-dimensional geometry of a mine and minimize the geometric simplifications inherent in empirical and analytical models [
15,
16].
In this context, advanced numerical simulation of geomechanical processes has become a critical tool in modern mining engineering [
17,
18]. Numerical approaches enable a comprehensive assessment of rock mass response under continuously changing mining conditions, the identification of critical stress states, and the optimization of mining-system parameters with respect to both safety and economic efficiency. They are also increasingly used to support the design of deep mining infrastructure and long-term underground excavations [
19].
The importance of numerical approaches for analyzing the transition from open-pit to underground mining has also been demonstrated in [
20]. Recent developments in multiscale numerical modeling additionally allow processes occurring at different structural levels of the rock mass to be incorporated into a unified computational framework [
21].
Dzimunya and Fujii [
22] emphasized that empirical methods remain attractive to practicing engineers because of their simplicity. Nevertheless, such methods are generally reliable only within the range of the original database and the spatial scale for which they were developed. The authors therefore proposed an integrated methodology for substantiating technological parameters, particularly pillar dimensions, based on finite-difference and discrete-element simulations combined with an analytical hierarchy process for geomechanical risk management.
Numerical modeling has also been extensively applied to the assessment of protective pillars and permanent mine workings. Pawelus et al. [
23] investigated the stability of permanent excavations in deep Polish copper mines, where unmined sections of the rock mass are retained as protective pillars around main haulage and ventilation workings. The dimensions of these pillars were evaluated using a two-dimensional finite-element model formulated under plane-strain conditions.
A similar two-dimensional FEM approach, implemented in the RS2 software package, was used to evaluate the stability of a haulage drift near mined-out stopes at the Xinli zone of the Sanshandao Gold Mine in China [
24]. The results revealed the formation of an asymmetrically distributed butterfly-shaped plastic zone around the roadway, with the most severe roof damage occurring on the side adjacent to the mined-out stope. Van Kien et al. [
25] also employed RS2 to investigate the stability of the rock mass surrounding a large underground cavern and a system of adjacent caverns.
Nevertheless, two-dimensional computational schemes are generally appropriate only for long excavations characterized by relatively uniform geometry and loading conditions along their longitudinal axes. The plane-strain assumption becomes less reliable when the object under consideration comprises intersecting workings, irregularly shaped mined-out stopes, inclined access excavations, spatially variable pillars, or openings located at different mining levels. In such cases, two-dimensional models cannot fully reproduce the three-dimensional redistribution of stresses and displacements or the spatial propagation of rock mass failure.
Consequently, increasing attention is being devoted to the development of detailed finite-difference, finite-element, and discrete-element models capable of reproducing the actual geometry and mining sequence of underground operations [
26]. Comparative investigations of two- and three-dimensional approaches confirm that three-dimensional modeling becomes essential when excavation geometry, loading conditions, and failure processes vary substantially in space [
27,
28].
Modern numerical methods are therefore among the most reliable tools for designing both surface and underground mining systems [
29]. They can reproduce the quasi-static evolution of stresses and deformations during the transition from open-pit to underground mining, the development of deeper mining levels, and the progressive formation of new underground openings. In this manner, numerical models reflect the spatial and temporal development of mining operations rather than representing only a single static excavation configuration.
The selection between continuum and discontinuum numerical approaches is also governed by the structural characteristics of the rock mass. Sherizadeh and Kulatilake [
30] applied a three-dimensional distinct-element model to assess roof stability in a room-and-pillar coal mine and demonstrated that bedding planes can exert a governing influence on roof deformation and failure. Their results emphasized the necessity of explicitly representing discontinuities when layered structural features control the geomechanical response. Similarly, Xing et al. [
31] investigated tunnel stability in an underground mine using three-dimensional discontinuum modeling that incorporated complex lithology, persistent and non-persistent faults, and a complex tunnel network. Their study demonstrated the importance of explicitly representing major geological structures when such discontinuities significantly influence stress redistribution, deformation, and failure development. These investigations indicate that discontinuum approaches are particularly appropriate when persistent faults, bedding planes, or other major discontinuities constitute dominant controls on rock-mass behavior, whereas continuum rock-mass models may remain appropriate where such large-scale structural features are absent and smaller-scale jointing is represented through equivalent rock-mass properties.
An additional requirement is the inclusion of previously created openings and zones of natural or mining-induced disturbance in the computational domain. These may include mined-out stopes, collapsed rock filling abandoned voids, backfilled areas, fault zones, and tectonic structures containing brecciated or highly fractured materials [
32]. Where such features are present and sufficiently persistent to control the mechanical response, major fault zones and tectonic discontinuities should be represented explicitly within the numerical model. Incorporating these elements requires the careful preparation of a digital mine model and substantial computational resources, particularly when progressive failure and damage accumulation in the rock mass must be reproduced [
33].
Despite the continuing development of numerical technologies, cave-scale and mine-scale simulations remain challenging because of complex geometry, multiscale discontinuities, nonlinear material behavior, and the computational cost of explicitly representing progressive rock mass damage [
34]. The three-dimensional interaction among interlevel pillars, active mine workings, mined-out stopes, and access excavations is insufficiently investigated for structurally complex gold deposits.
Shnorhokian et al. [
35] investigated the stability of a diminishing ore pillar at the deep Vale Garson Mine using a mine-wide FLAC3D model. Their study focused primarily on the influence of alternative stope extraction sequences and evaluated stability using stress-based indicators, including the brittle shear ratio and principal stresses. Although this work provides an important example of mine-scale 3D modeling at significant depth, its primary objective was the optimization of extraction sequence rather than the determination of a critical inter-stope pillar thickness.
Chen and Mitri [
36] developed a three-dimensional FLAC3D model for a shallow, steeply dipping narrow-vein gold deposit and investigated surface crown-pillar design under complex geological conditions, including faults, in situ stresses, irregular topography, and surface infrastructure. Their work demonstrates the importance of realistic 3D modeling; however, it is concerned with a shallow surface crown pillar and mining-induced surface deformation rather than with deep inter-stope pillars separating adjacent underground stopes. Chen and Mitri also investigated strategic sill-pillar placement in a narrow-vein deposit using a numerical element death-and-rebirth approach to simulate progressive hanging-wall overbreak [
37]. Their results demonstrated that appropriate sill-pillar positioning could substantially reduce overbreak and dilution. Nevertheless, the main design objective was overbreak control and pillar location rather than the identification of a minimum pillar thickness separating globally unstable and stable rock-mass regimes.
Dintwe et al. [
38] used FLAC3D to investigate crown-pillar behavior during transition from open-pit to underground mining. The influence of pillar thickness, span, dip, and open-pit geometry was evaluated. This study provides an important parametric assessment of pillar geometry, but the considered structural setting is fundamentally different from the present case because the pillar separates an open pit from underground workings rather than adjacent stopes within a deep vein-type orebody.
Xu et al. [
39] developed a full-scale three-dimensional finite-element model to compare three sill-pillar recovery schemes in a steeply dipping hard-rock mine. Their analysis addressed stress redistribution and instability associated with recovery of an existing sill pillar. In contrast, the present study focuses on the original design and optimization of inter-stope pillar thickness before mining, rather than on pillar recovery.
Thus, although three-dimensional numerical methods have been successfully applied to crown pillars, sill pillars, diminishing ore pillars, production-sequence optimization, and overbreak control, relatively limited attention has been paid to determining the critical thickness of inter-stope pillars within a deep, geometrically irregular vein orebody using a realistic three-dimensional geological and excavation model.
Recent laboratory studies based on X-ray computed tomography have shown that rock degradation is governed not only by the reduction in intact-rock strength but also by progressive crack initiation, propagation, branching, and coalescence, which ultimately lead to the formation of interconnected fracture networks [
40,
41]. These observations indicate that the mechanical response of a rock mass should be interpreted with consideration of its structural degradation and fracture connectivity rather than solely on the basis of intact-rock properties. These observations are consistent with the use of rock-mass-scale strength criteria, such as the generalized Hoek–Brown criterion, which accounts for the degradation of intact-rock strength at the rock-mass scale through GSI-dependent parameters.
Despite the substantial progress achieved through three-dimensional numerical modeling of crown pillars, sill pillars, diminishing ore pillars, and production sequences, comparatively little attention has been paid to the systematic optimization of inter-stope pillar thickness in deep, geometrically irregular vein deposits. Previous studies have commonly focused on individual design objectives, such as stress redistribution, overbreak, surface subsidence, or pillar recovery, whereas the transition between global instability and localized rock-mass damage has rarely been evaluated using several independent stability indicators simultaneously. The present study addresses this gap by comparing alternative inter-stope pillar thicknesses within a realistic 3D geological and excavation model and by identifying the stability threshold through the combined assessment of displacement magnitude, yielded-zone connectivity, and numerical convergence.
Further research is required to determine how variations in pillar dimensions influence stress redistribution, displacement development, and the formation of yielded zones within a spatially interconnected system of underground openings.
Therefore, the objective of this study is to assess the geomechanical response of an interlevel pillar and the surrounding rock mass during underground extraction of the Akbakay gold deposit using three-dimensional finite-element modeling. The study focuses on reproducing the actual spatial configuration of the mining area, including active workings, mined-out stopes, and access excavations, and on comparing alternative pillar-width configurations. The numerical results are used to identify potentially unstable zones and to substantiate a rational pillar geometry capable of maintaining the stability and operational safety of the underground mining system.
2. Materials and Methods
2.1. Study Area Description
The present study focuses on the Kenzhem area of the Akbakay gold deposit, where the development of a new underground mine is currently at the design stage. Since mining operations have not yet commenced, the project requires comprehensive geomechanical investigations to support the technical feasibility assessment and to optimize the key design parameters of the proposed underground mining system. The results of these investigations provide the basis for selecting safe and economically efficient mining layouts prior to mine construction. The Akbakay gold deposit, located in the Zhambyl region of southern Kazakhstan, represents a structurally complex gold–quartz–sulfide vein-type system hosted within tectonically disturbed zones of the Shu–Ile metallogenic belt. The deposit is characterized by vein and stockwork mineralization associated with quartz and sulfide assemblages, including native gold and pyrite. Ore bodies exhibit irregular geometry and variable thickness. The ore veins range in thickness from 0.5 to 3.0 m, with an average thickness of approximately 1.7 m. Depending on the dip angle, the ore bodies are classified as inclined (up to 55°) or steeply dipping (55–85°). The geological environment is marked by high heterogeneity, intensive fracturing, and anisotropy of host rocks.
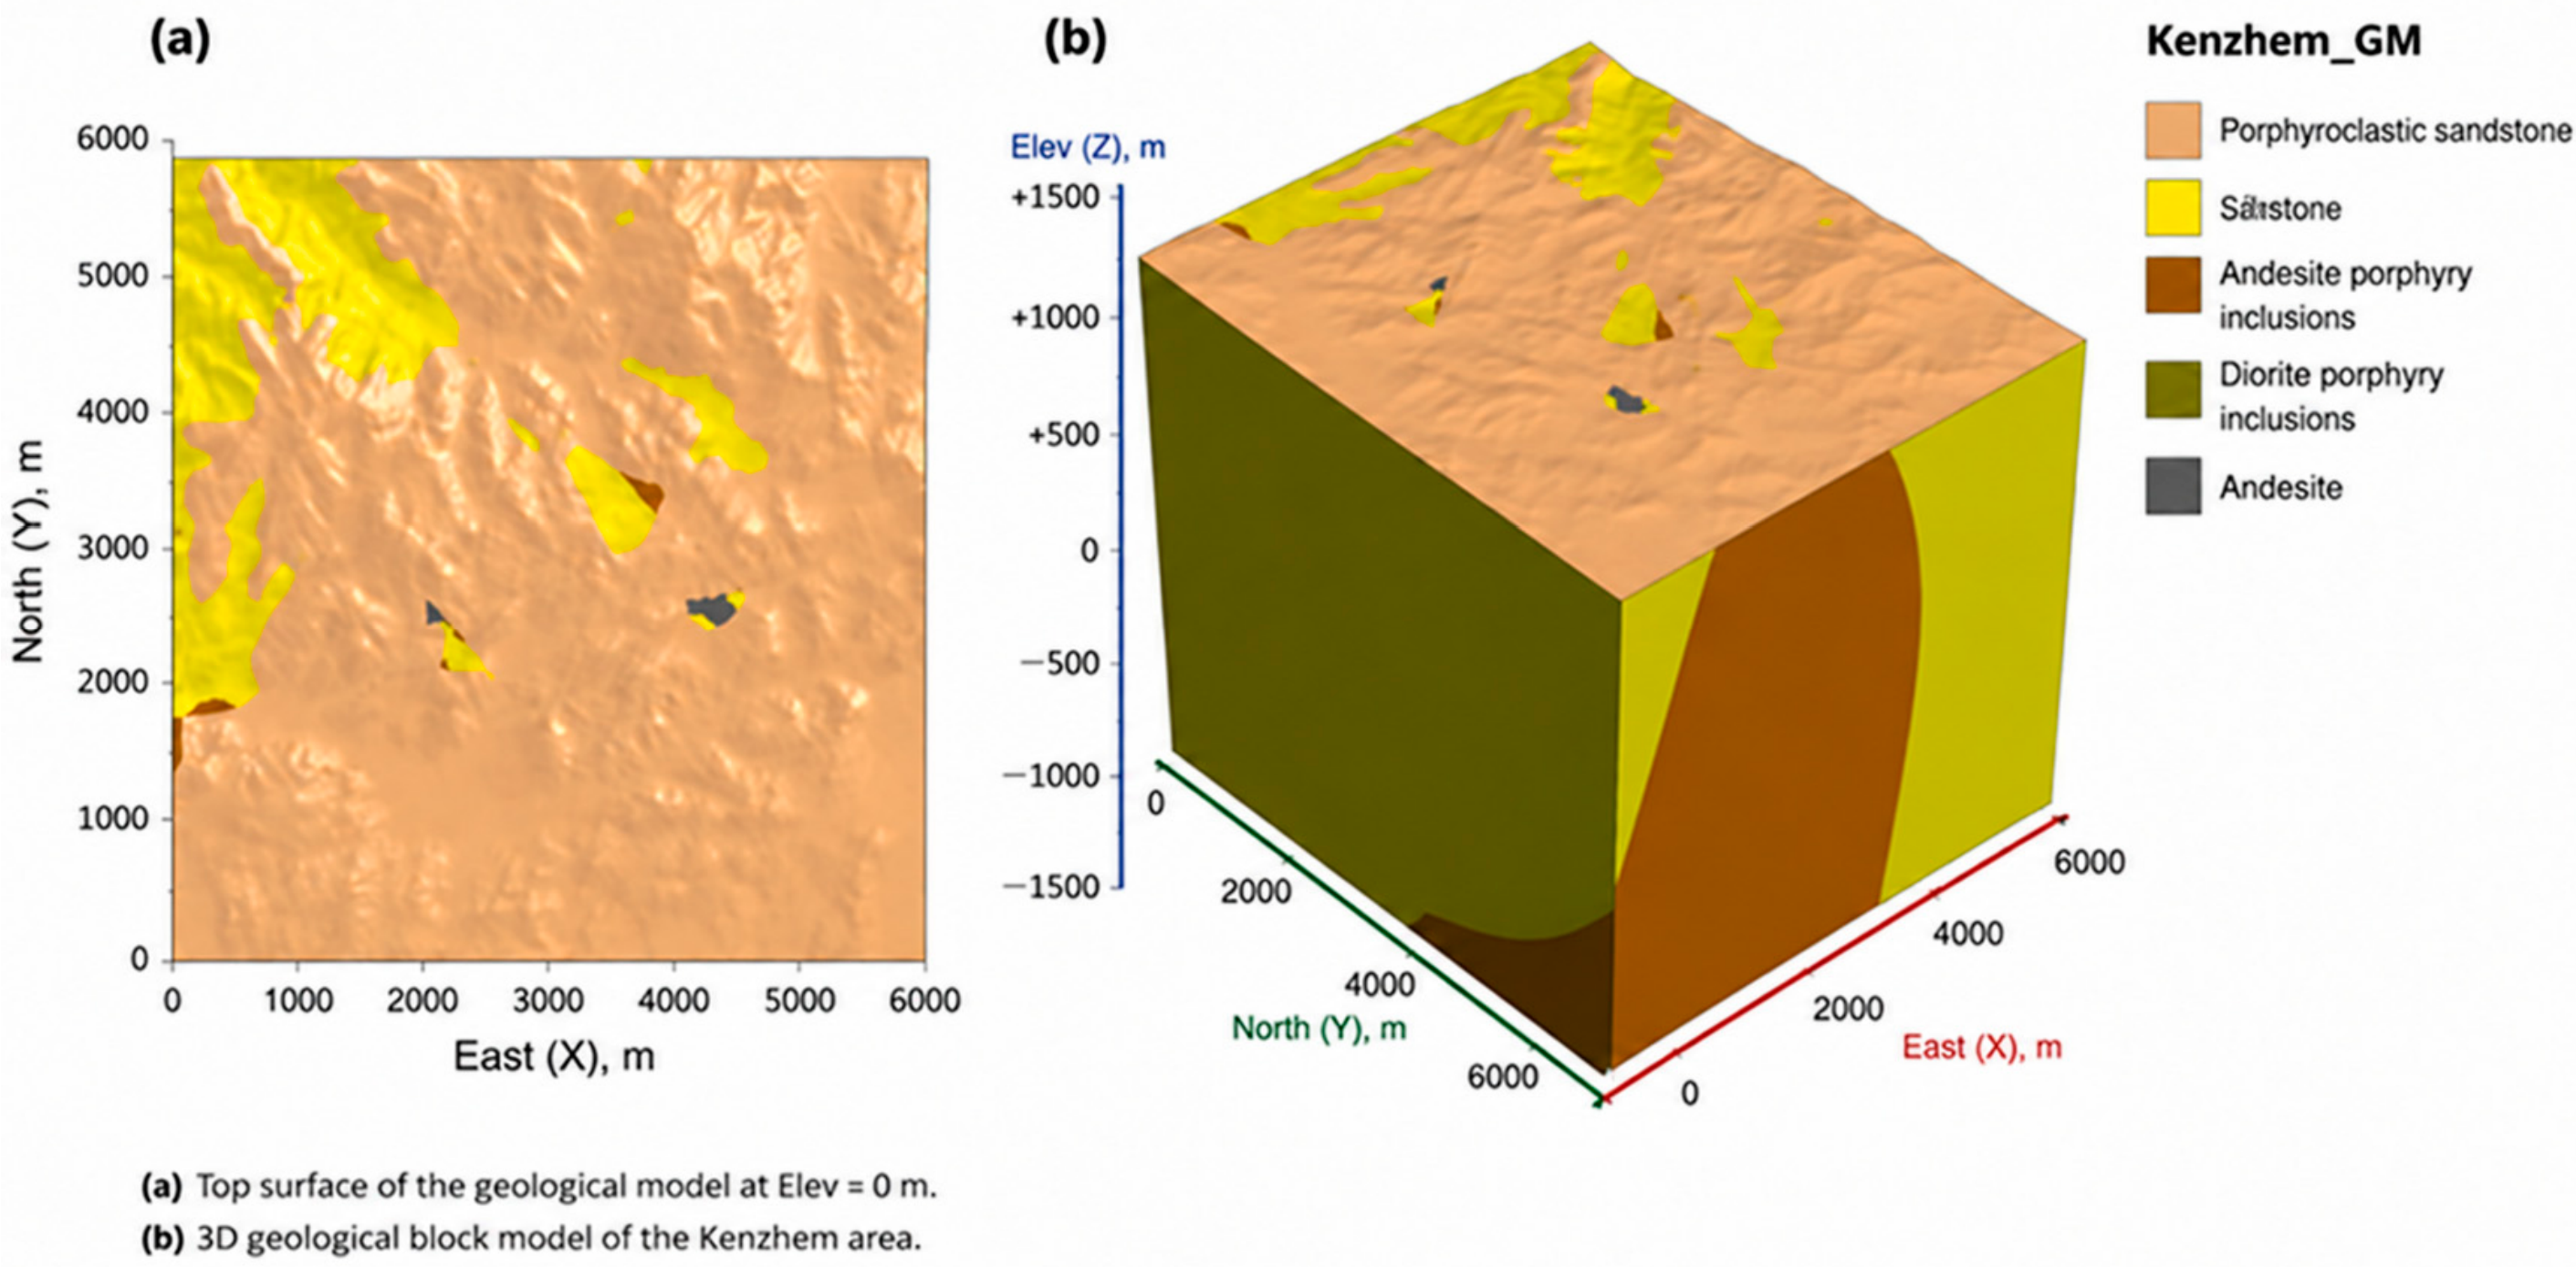
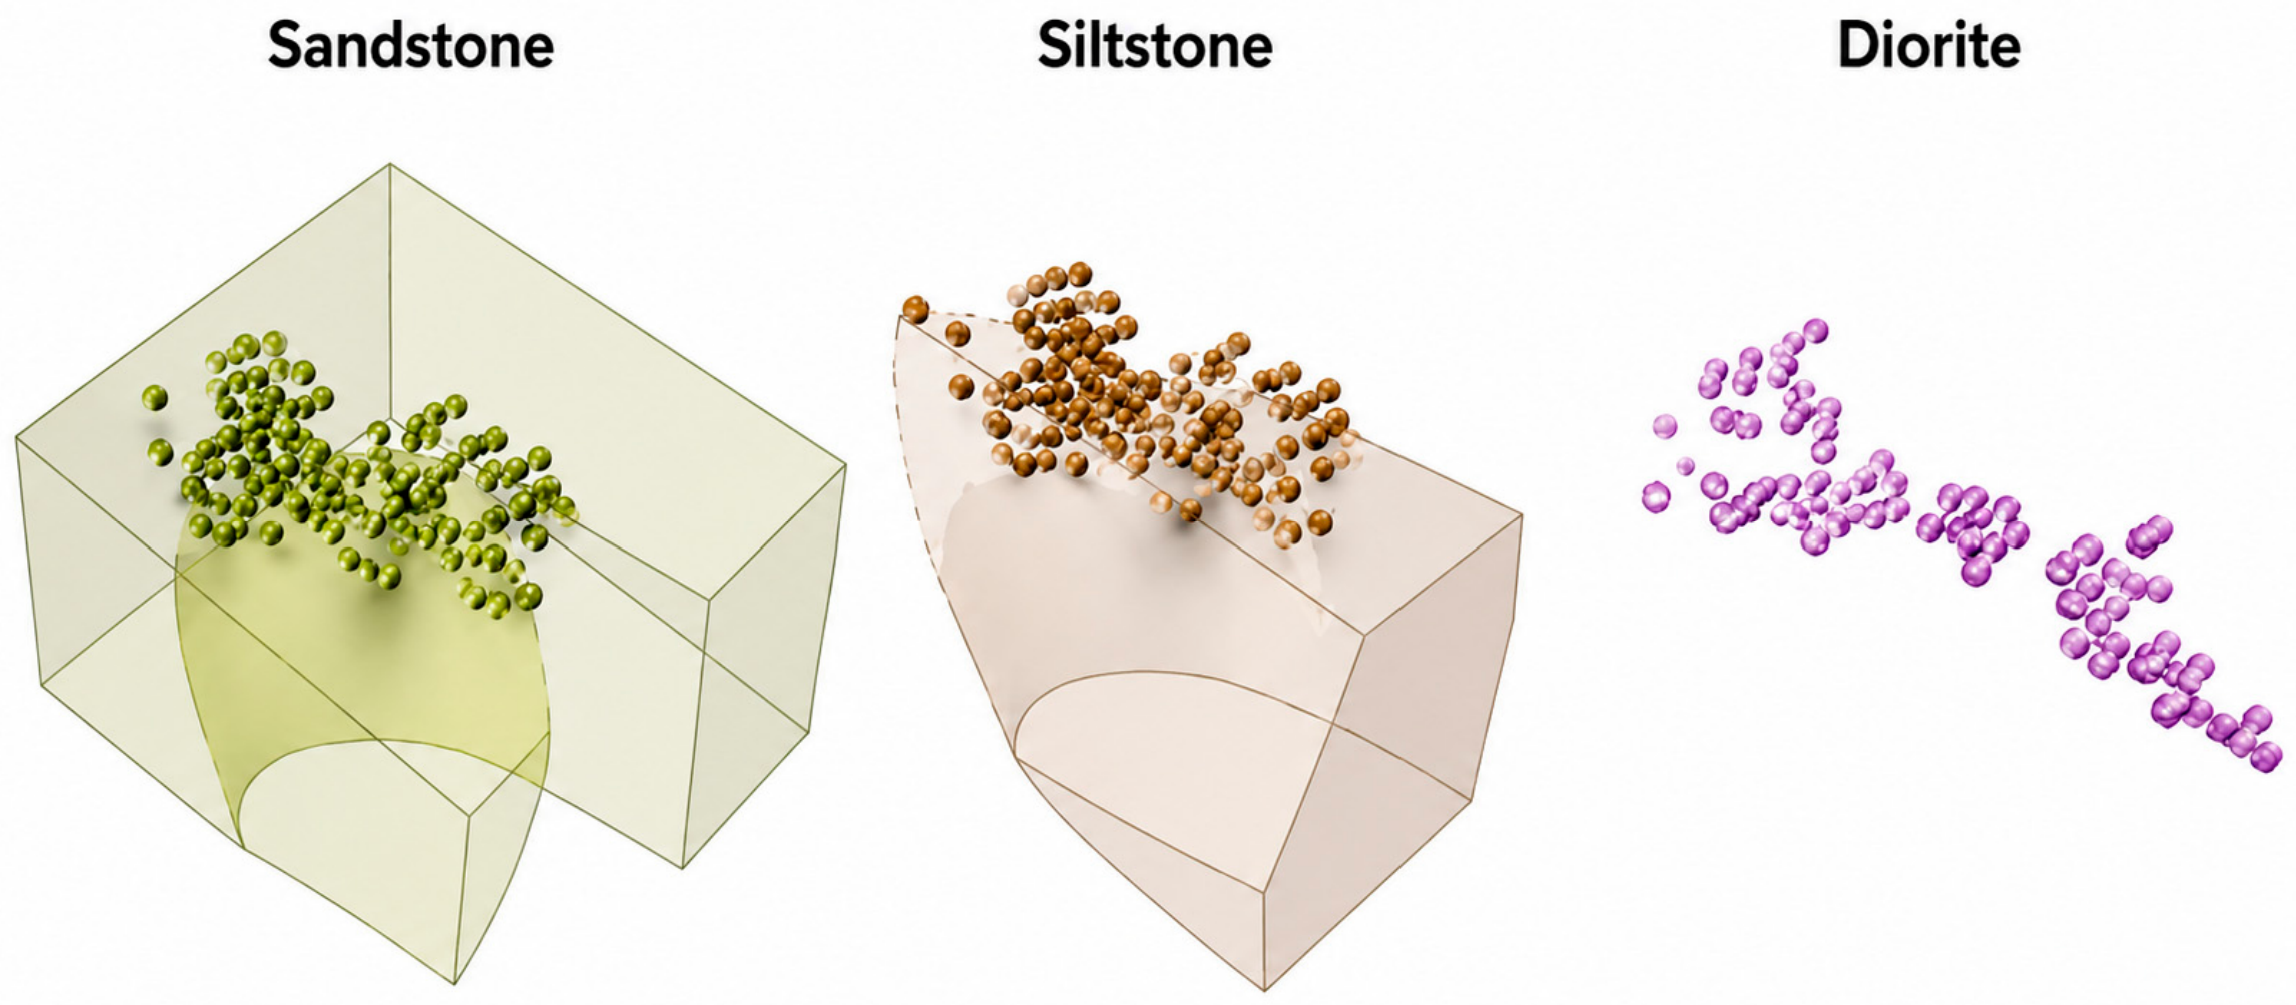
The principal host rocks within the Kenzhem area are sandstone, siltstone, and diorite. Based on detailed core logging, geological mapping, and exploration drilling data, a comprehensive lithological model of the deposit was developed using the specialized geological software Leapfrog Geo, version 2025.3 (
Figure 1).
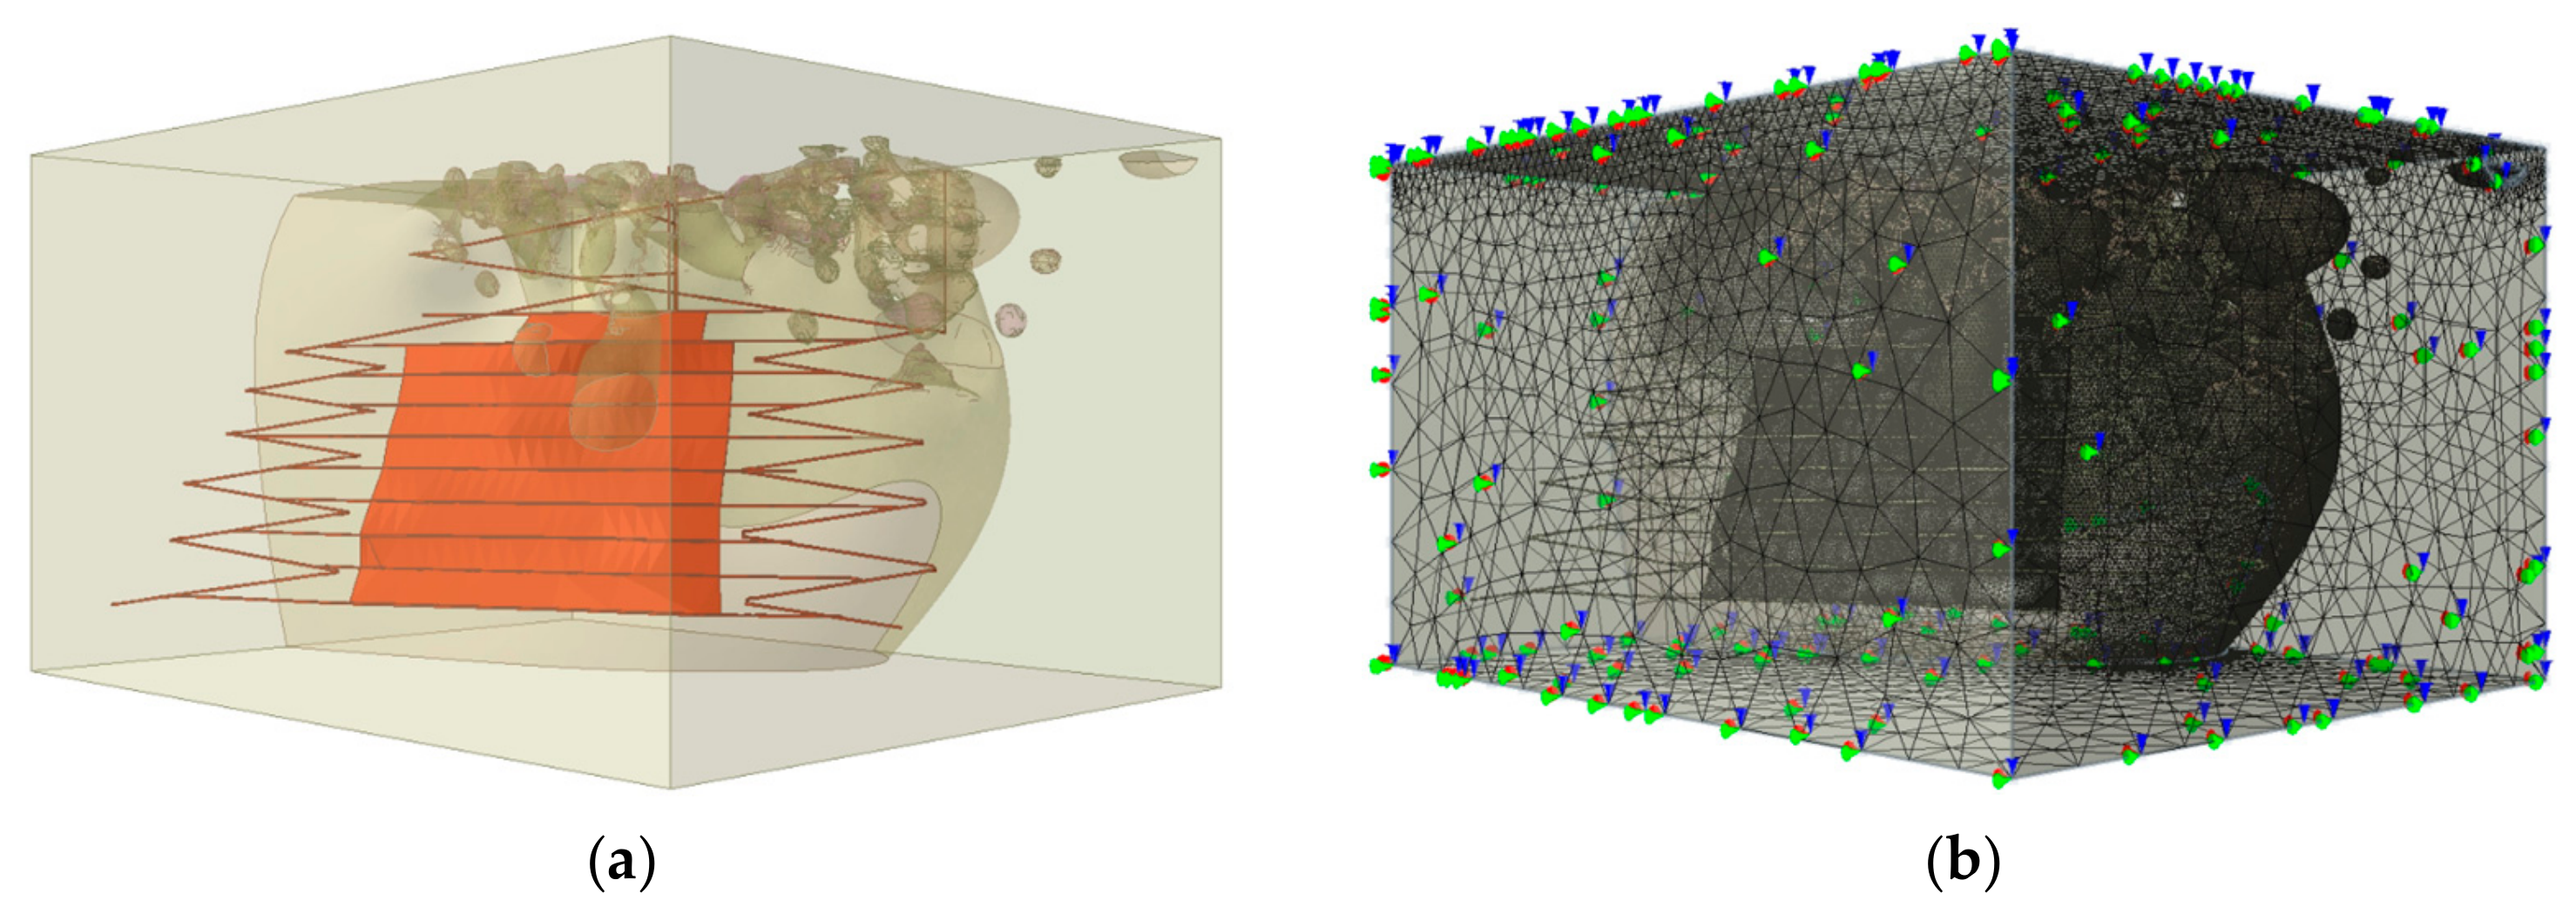
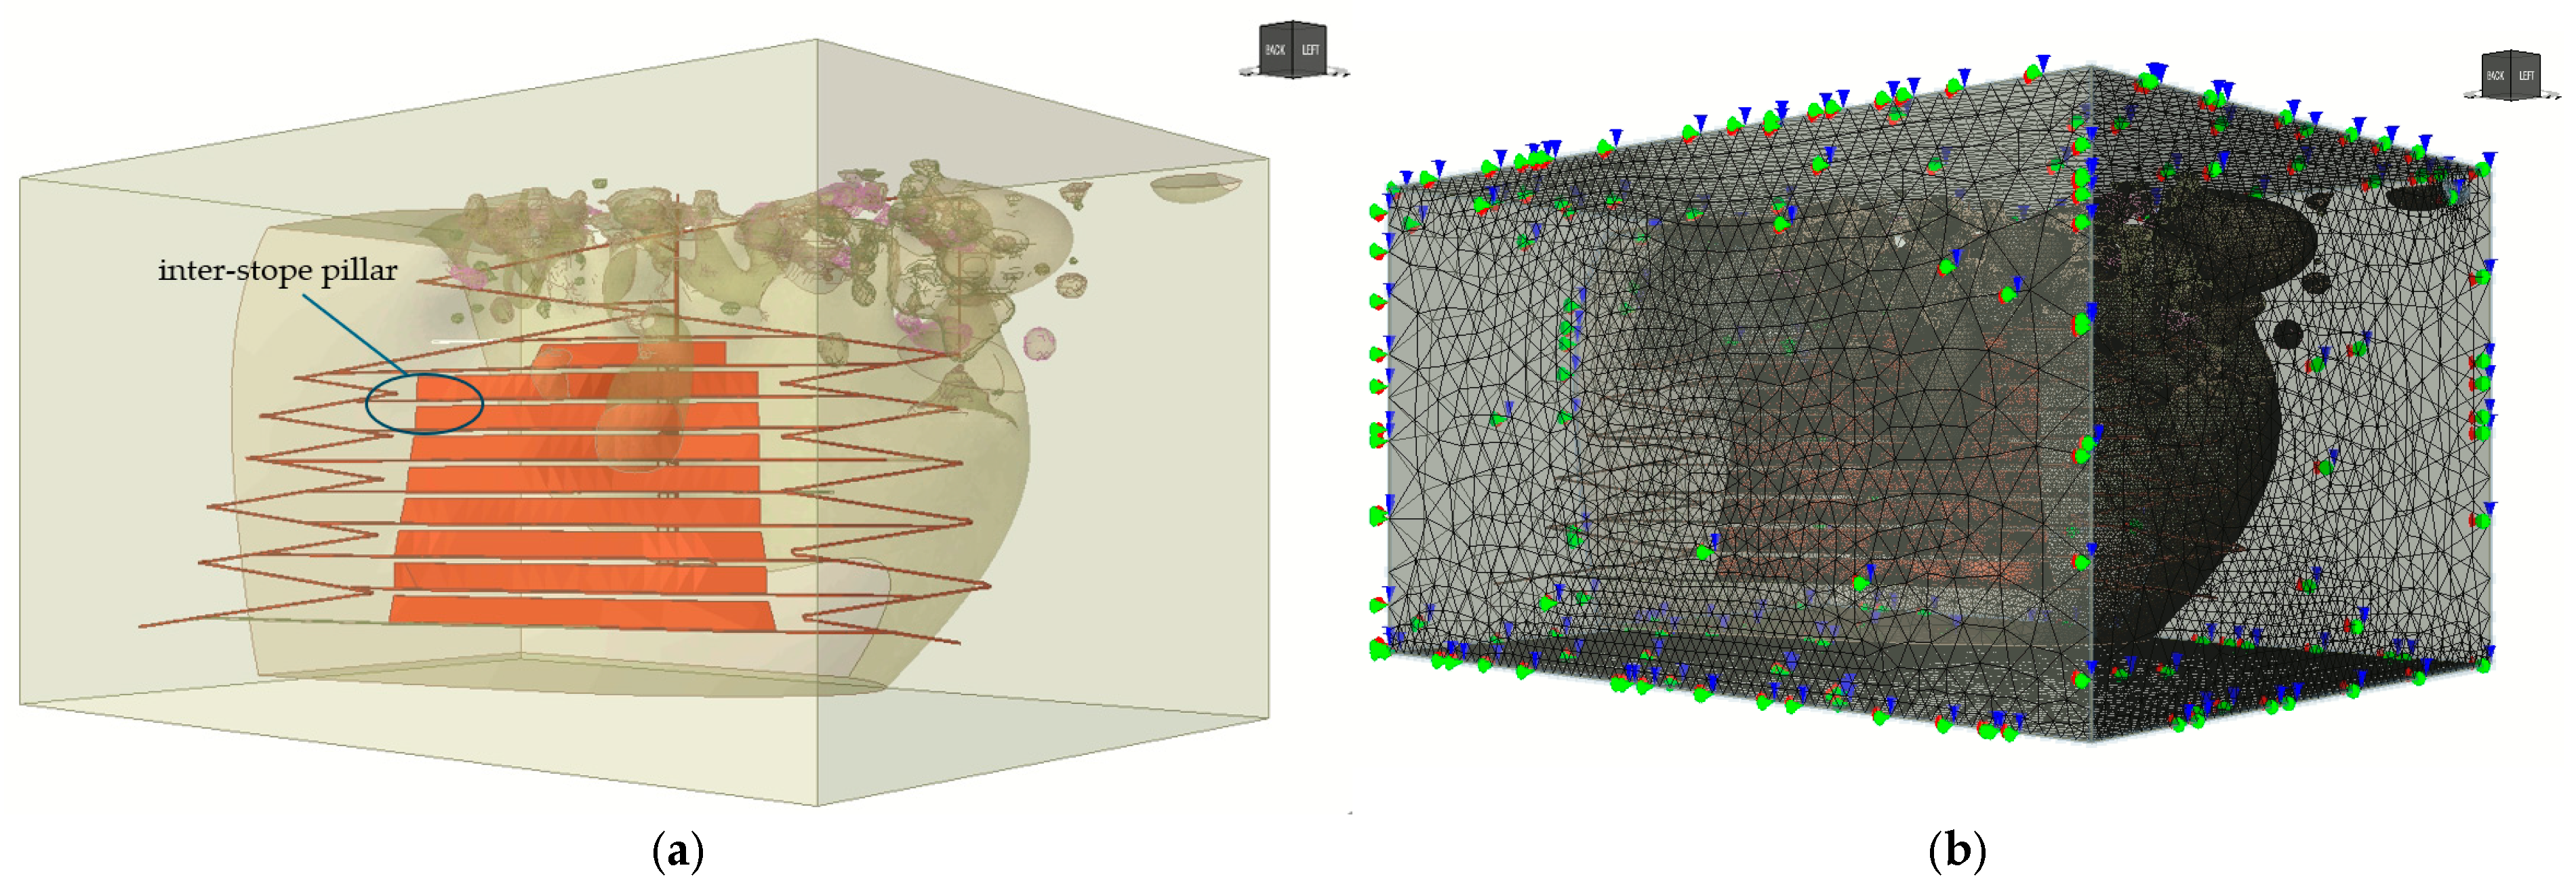
The lithological model served as the basis for the creation of a digital geological model, to which the boundaries of excavations for each ore extraction scenario were subsequently added
Figure 2.
2.2. Technology
Kenzhem site of the Akbakay deposit is planned to be mined using a sublevel drift stoping method with end ore drawing by blasting, which is well-suited for narrow vein-type ore bodies with variable dip angles and thicknesses. At the Kenzhem site, access to the ore body is planned to be provided through a combined development scheme involving both a vertical shaft and a portal entry.
The ore bodies are planned to be subsequently divided into mining blocks extending up to 400 m along strike. The mining blocks extend over the full height of the level along the dip of the ore body, with a level height of 60 m. The total length of the drifts developed along the ore body reaches approximately 5.8 km, reflecting the complex geometry of the ore zones and the configuration of the mineralized structure. The ore reserves considered in this study are located at a depth of approximately 820 m. The main shaft is planned to be sunk to the 776 m level, while access to deeper mining levels will be provided by an inclined haulage decline connecting the lower sublevels.
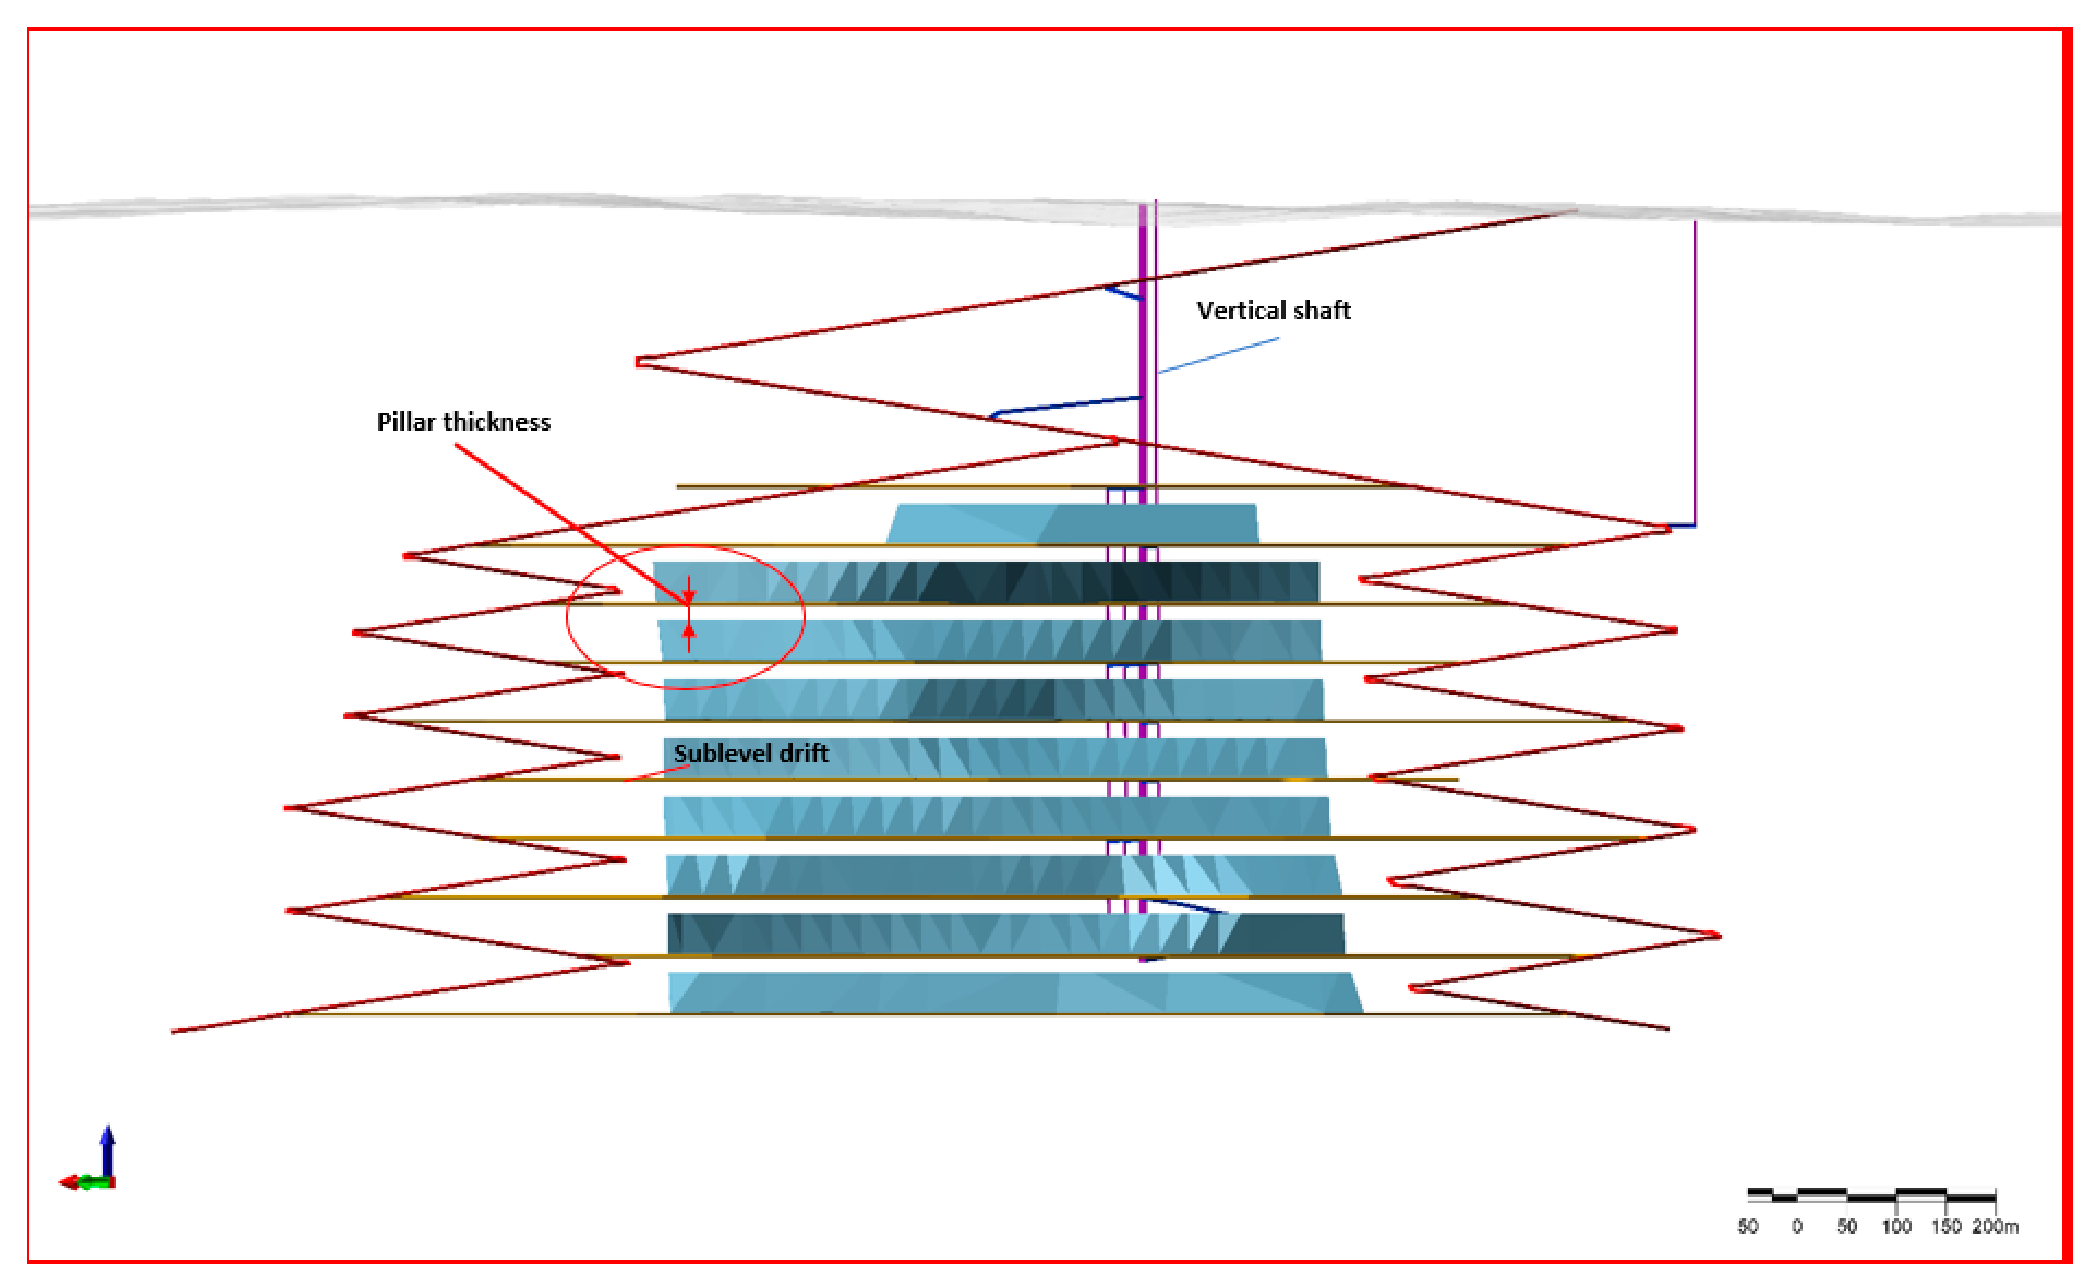
To evaluate the geomechanical response of the rock mass and optimize the mining layout, four alternative extraction scenarios were considered. The first scenario involves complete extraction of the ore zone without leaving any pillars between adjacent stopes. The remaining scenarios involve leaving pillars of different thicknesses, 10 m, 15 m, and 20 m, respectively (
Figure 3). The comparison of these alternatives allows the influence of pillar dimensions on rock mass stability, stress redistribution, and excavation performance to be assessed, thereby providing a basis for selecting the most effective and geomechanically reliable mining strategy.
The level is subdivided into sublevels spaced at intervals of 10–15 m. Mine development includes the construction of haulage declines, access drifts, and sublevel drifts driven within the ore body, allowing simultaneous ore extraction during development. Mining blocks are extracted from the flanks toward the center and toward the access drift. Ore extraction is carried out in a retreating sequence, progressing upward within individual stopes while the overall mining front advances toward the access excavation. Following the completion of development workings, fan-shaped drilling patterns are created using 54 mm blast holes drilled from the sublevel drifts with Simba Junior drilling rigs. Prior to production blasting, a slot raise is developed between adjacent sublevels to serve as a free face and provide compensation space for blasted rock.
The combination of large stopes, closely spaced development workings, and extensive mined-out voids created during extraction results in a complex geomechanical environment characterized by significant stress redistribution and interaction between underground excavations, making geomechanical analysis and numerical modeling essential components of mine design and stability assessment. However, the reliability of any numerical simulation is critically dependent on the quality and representativeness of the input geomechanical parameters. Therefore, a detailed geotechnical investigation program was undertaken at the Kenzhem site of the Akbakay deposit. Core samples of the host rocks surrounding the ore veins were collected in situ and subsequently tested in the Geomechanics Laboratory of the Satbayev University.
2.3. Method and the Input Geomechanical Parameters
The stress–strain state of the rock mass in the Kenzhem area was evaluated using the three-dimensional finite element method (FEM) implemented in the licensed RS3 Rocscience software package, version 4.043 (Rocscience Inc., Toronto, ON, Canada). This method enables the realistic representation of irregular ore body geometry, lithological heterogeneity, complex boundary conditions, and the sequential excavation process. This capability is particularly important for the Kenzhem site, where the mining system involves the development of an extensive network of underground excavations, including haulage declines, sublevel drifts, ventilation raises, ore passes, and large stopes distributed across multiple mining levels. These excavations are constructed in rock masses with contrasting mechanical properties and progressively interact with the extensive mined-out voids created during ore extraction. To develop the three-dimensional numerical model of the underground mine, wireframe models created in Micromine 21.5 software were imported into the RS3 4.043 software. These wireframes accurately reproduced the geometry and spatial distribution of the ore bodies, the design parameters of the mining blocks, the elevation in individual sublevels, and the relative positions of the mine development and production excavations. The resulting digital model provides a realistic representation of the planned underground mining system and serves as the basis for simulating the sequential development of mining operations and the geomechanical interaction between stopes, haulage drifts, declines, raises, ore passes, and the surrounding rock mass.
The three-dimensional computational domain was discretized using 4-noded tetrahedral finite elements. A graded mesh was adopted to accommodate the strongly irregular geometry of the ore bodies, underground excavations, and mined-out stopes while maintaining a computationally feasible model size. The final numerical model contained 14,936,917 finite elements. Mesh quality was assessed using the Shape Quality parameter implemented in RS3. Only 43,225 elements, corresponding to approximately 0.289% of the total mesh, had Shape Quality values between 0 and 0.1, indicating that elements of relatively poor geometric quality represented only a small fraction of the computational mesh.
Mechanical boundary conditions were imposed on the external surfaces of the computational domain to prevent rigid-body motion and to represent confinement by the surrounding rock mass. Zero-displacement restraints were applied in the corresponding X, Y, and Z directions at the external model boundaries. In contrast, the ground surface and the surfaces of underground excavations and mined-out stopes were not artificially restrained, and their deformation was calculated as part of the finite-element solution. The computational domain extended beyond the immediate excavation system so that the external restraints represented the surrounding rock mass rather than the excavation boundaries themselves.
The nonlinear stress analysis was performed using the convergence controls implemented in RS3. A maximum of 500 iterations was permitted per load step, with a convergence tolerance of 0.001. The Absolute Force & Energy convergence criterion was adopted to assess nonlinear equilibrium, while the number of load steps was selected automatically by RS3. A load step was considered converged when the prescribed convergence criterion was satisfied within the specified iteration limit.
A realistic numerical representation of the geomechanical response of the rock mass requires reliable physical and mechanical properties of the host rocks. These parameters directly control the calculated stress redistribution, deformation patterns, extent of yielded zones, and the predicted stability of underground excavations. An extensive series of laboratory experiments was performed to determine the strength and deformation properties of the rocks, including uniaxial compressive strength, tensile strength, Young’s modulus, Poisson’s ratio, cohesion, and internal friction angle (
Table 1). The mechanical characteristics of the rock specimens were determined under natural moisture conditions in accordance with the ASTM D7012–14 standard [
42] using a GCTS UCT-1000 servo-hydraulic rock testing system. The dataset comprised 21 sandstone, 17 siltstone, and 19 diorite specimens.
The relatively high UCS variability observed for sandstone (CV = 40.3%) is attributed to the intrinsic heterogeneity of the rock material. The high coefficient of variation for the diorite Poisson’s ratio (CV = 64.3%) is partly related to its low mean value (ν = 0.14), since even a standard deviation of 0.09 produces a large relative variation when the mean is small.
It should also be emphasized that the laboratory UCS values represent intact-rock strength and were not directly assigned as the strength of the in situ rock mass. Within the generalized Hoek–Brown framework, described below, these values were scaled to the rock-mass level through GSI-dependent parameters, thereby accounting for strength degradation associated with fracturing and structural disturbance. Accordingly, the adopted mean UCS values should be interpreted as baseline intact-rock inputs rather than as direct estimates of field-scale rock-mass strength. Thus, the mechanical behavior of the rock mass was simulated using an elastic–plastic constitutive model based on the generalized Hoek–Brown failure criterion [
43] given by
where
and
are the major and minor principal stresses at failure,
is the uniaxial compressive strength of the intact rock, and
,
, and
are empirical rock mass parameters.
Its application enables the most realistic assessment of the geomechanical response of the host rock surrounding complex underground excavations and mined-out stopes, providing a description of the nonlinear strength characteristics of fractured rock masses through the Geological Strength Index (GSI).
To assess the structural disturbance of the rock mass, a statistical analysis of the geotechnical core logging database for the Kenzhem area was performed in order to determine the key parameters characterizing the rock mass structure. In general, the Kenzhem rock mass is characterized by good-quality rock, with a median RMR value of 61.7. The dominant rock mass class is Class D, corresponding to an RMR range of 60–80, which accounts for 64.26% of the total logged core interval. For subsequent geomechanical calculations, the Geological Strength Index (GSI) is used as the main parameter describing the structural condition of the rock mass.
The Geological Strength Index was derived from the RMR
89 classification proposed by Bieniawski [
44,
45,
46]. The basic RMR
89 value was calculated from intact-rock strength, RQD, discontinuity spacing, discontinuity condition, and groundwater conditions, while the discontinuity-orientation adjustment was set to zero for conversion to GSI [
47]. Since the investigated rock mass was characterized by dry discontinuities, the groundwater rating was taken as 15. For rock masses of sufficiently good quality, GSI was estimated using the Hoek–Brown relationship (GSI = RMR
89–5) [
48,
49]. Based on geotechnical core logging data, the resulting GSI values were 66 for sandstone, 62 for siltstone, and 70 for diorite (
Table 2).
According to the geological documentation and data provided by the mine geological service, no major faults or other persistent large-scale geological discontinuities have been identified within the Kenzhem area considered in the present study. Therefore, discrete fault or joint surfaces were not explicitly introduced into the numerical model. The effect of smaller-scale jointing and structural disturbance of the rock mass was represented implicitly through the GSI-dependent parameters of the generalized Hoek–Brown criterion.
Hydraulic fracturing tests were conducted in three surface boreholes using the MeSy® wireline system equipped with a Perfrac-II packer (MeSy Solexperts GmbH, Bochum, Germany) assembly to determine the natural (initial) in situ stress state.
Hydraulic fracturing measurements at the Kenzhem site were performed in three boreholes with the following coordinates: GTS-KZM-001 (N 45°05.4261′, E 072°44.2219′), GTS-KZM-009 (N 45°05.348′, E 72°45.039′), and GTS-KZM-010 (N 45°05.3254′, E 72°44.3948′), drilled to depths of 619, 700, and 400 m, respectively. During the hydraulic fracturing tests, the following process parameters were recorded: —breakdown pressure; —shut-in pressure during the first cycle; —reopening pressure during the second loading cycle; —shut-in pressure during the second loading cycle; —reopening pressure during the third loading cycle; —shut-in pressure during the third loading cycle.
A fragment of the observation log during hydraulic fracturing testing in borehole GTS-KZM-009 within the 500–600 m interval is presented in
Table 3. The values of the minimum and maximum horizontal stresses obtained from these measurements are presented in
Table 4.
This excerpt demonstrates that with a 95% confidence level, the true mean value of the minimum horizontal stress () lies in the range of 8.89–10.63 MPa, and the maximum horizontal stress () lies in the range of 14.40–17.28 MPa. The lithostatic pressure () for depths between 400 and 600 m is 10.8–16.2 MPa.
As a result of processing the diagrams for all three boreholes, the following stress values acting in the rock mass were determined: , , and . Thus, no excess of the horizontal stress component over the vertical component was recorded. Consequently, the initial numerical model was formulated as a representative baseline model with the hydrostatic stress state.
4. Discussion
4.1. Critical Pillar Thickness
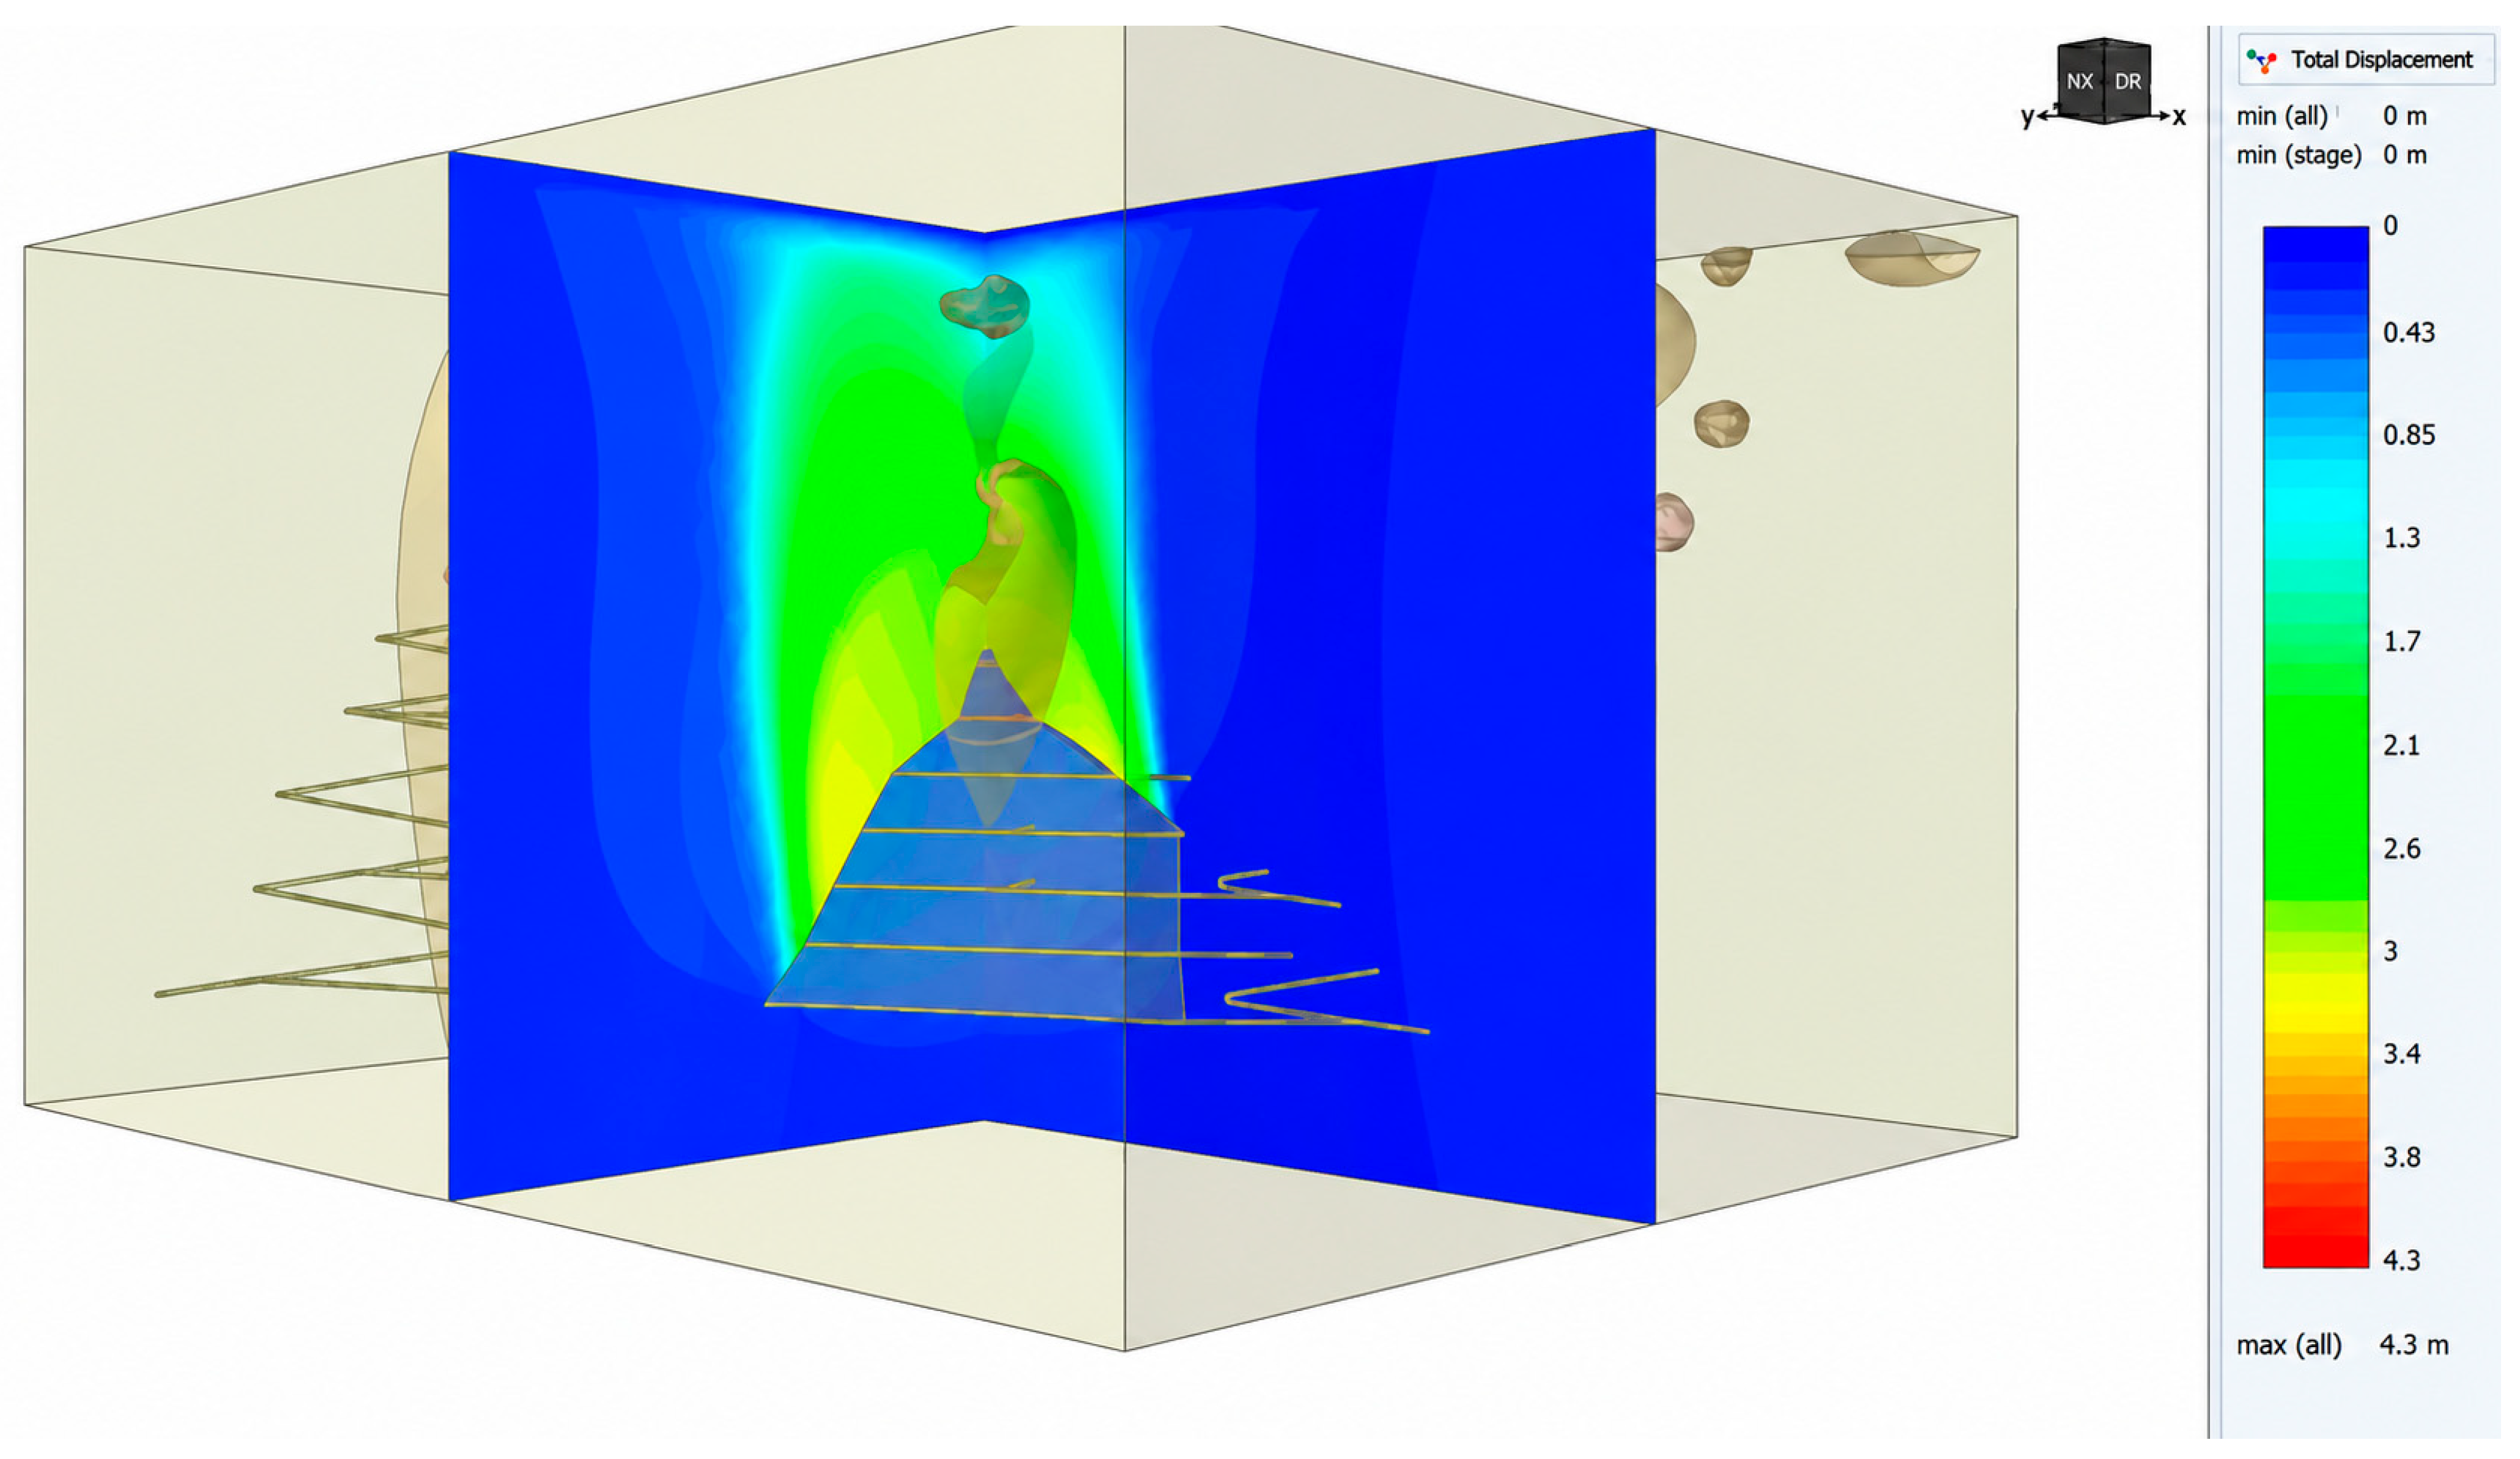
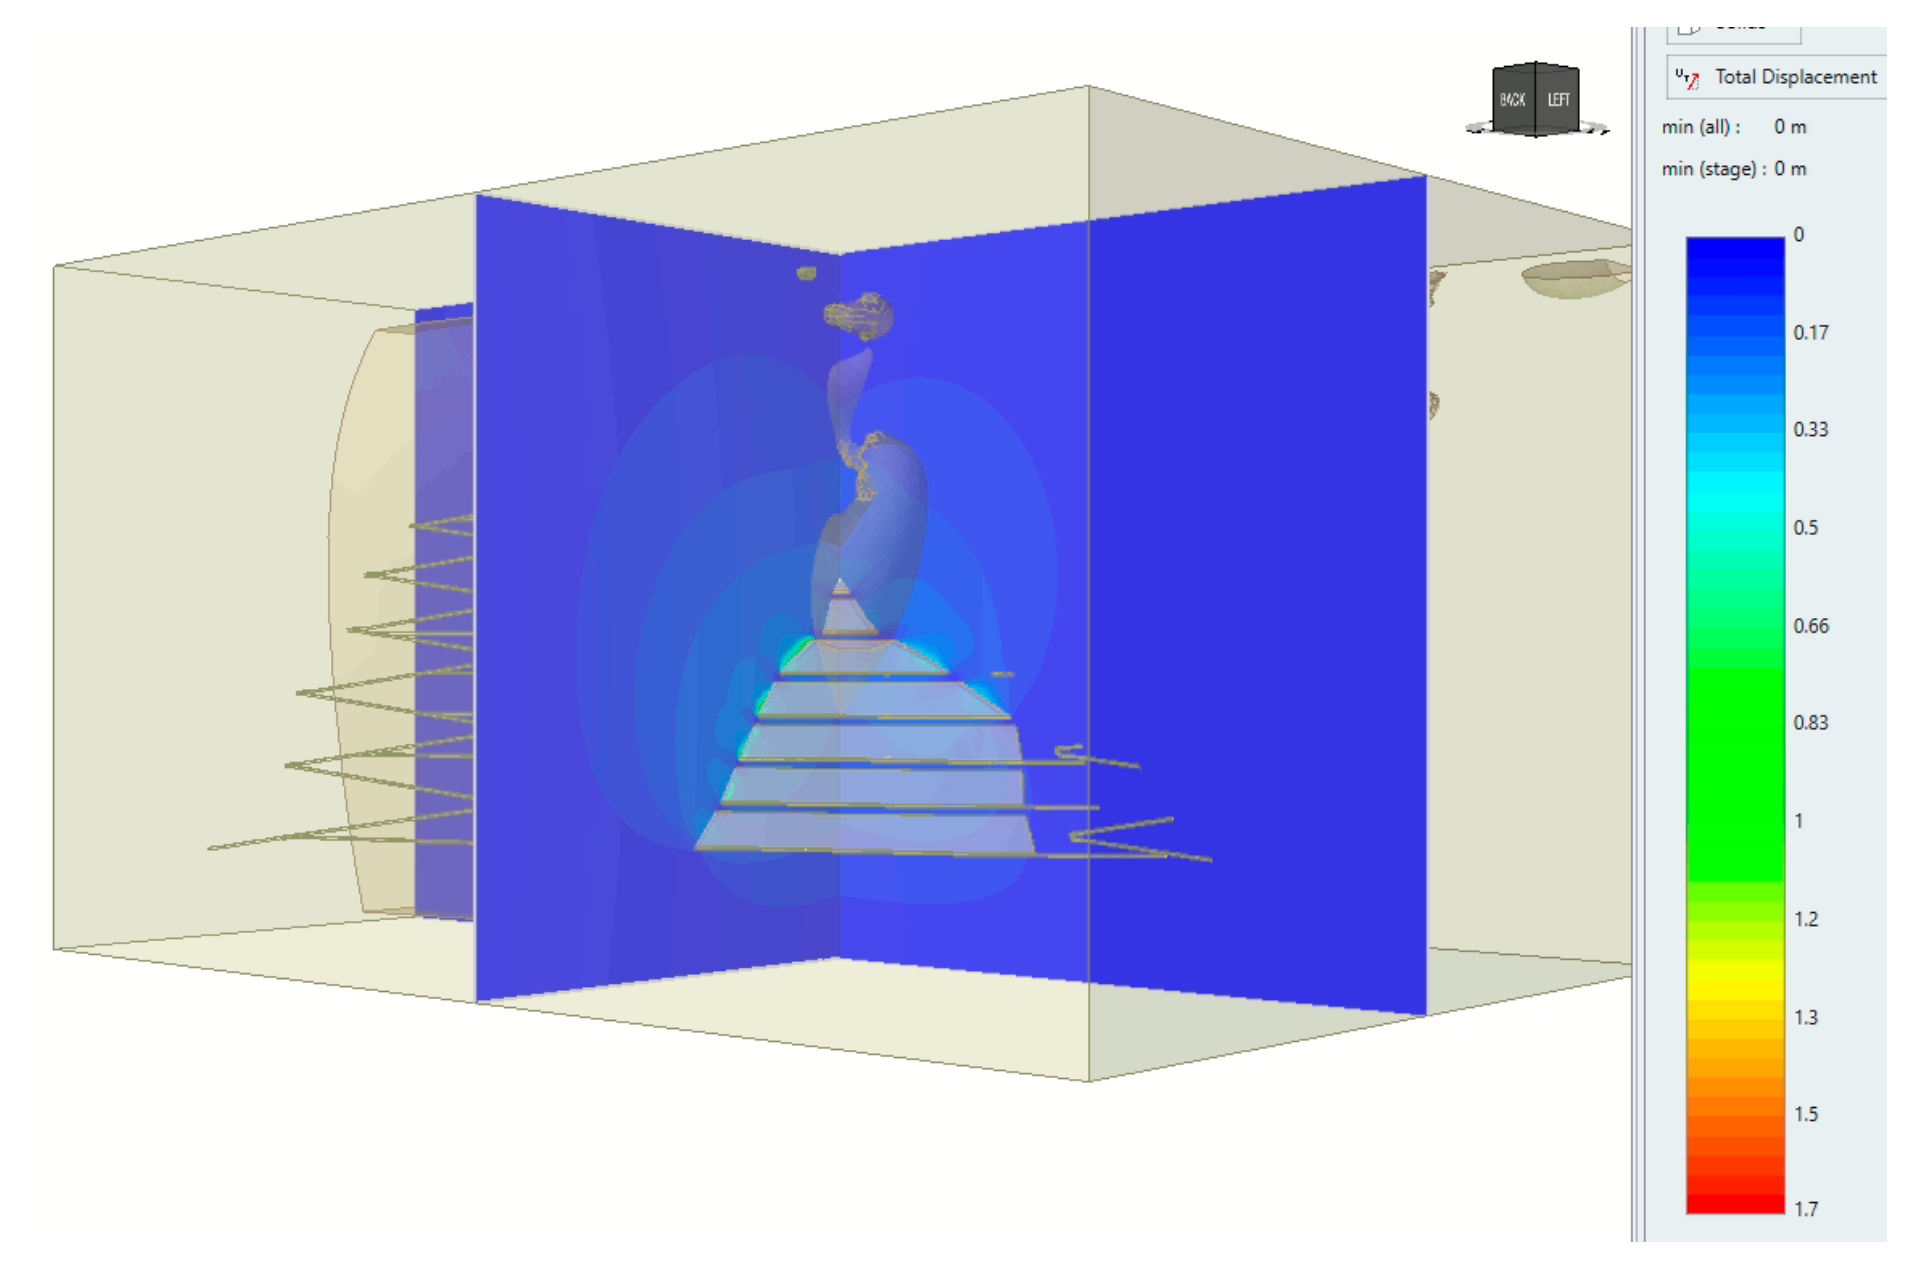
The generalized results presented in
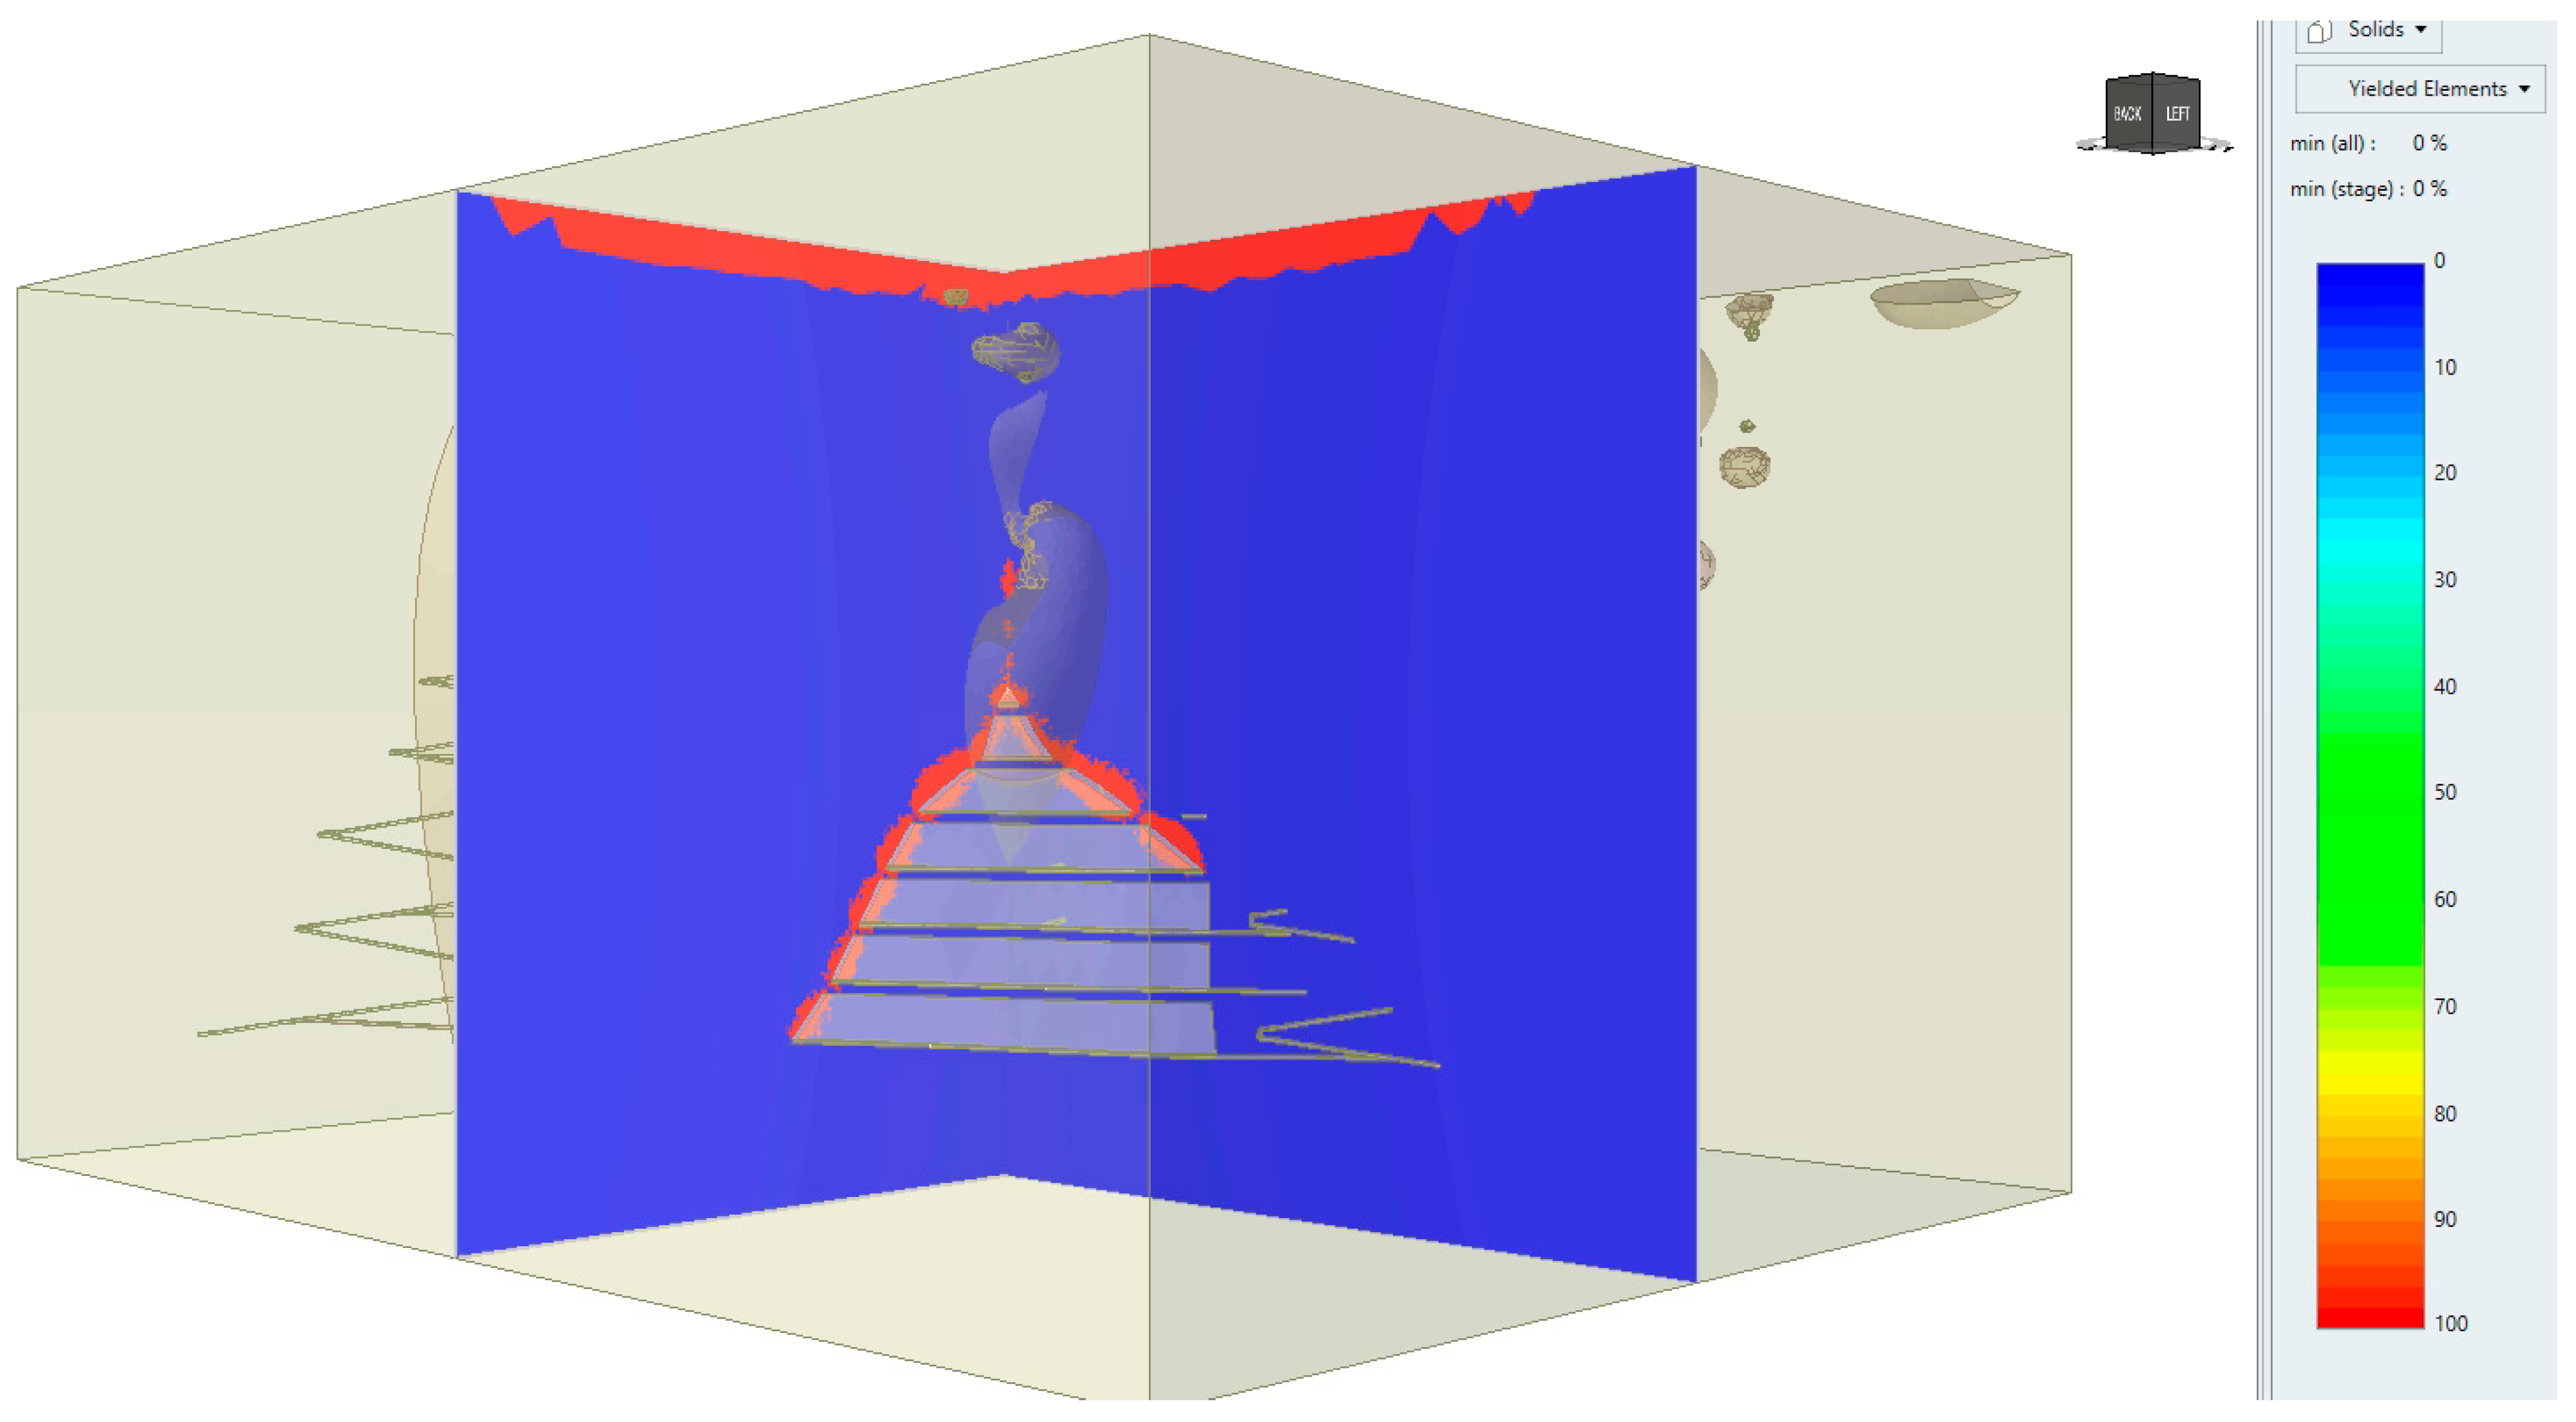
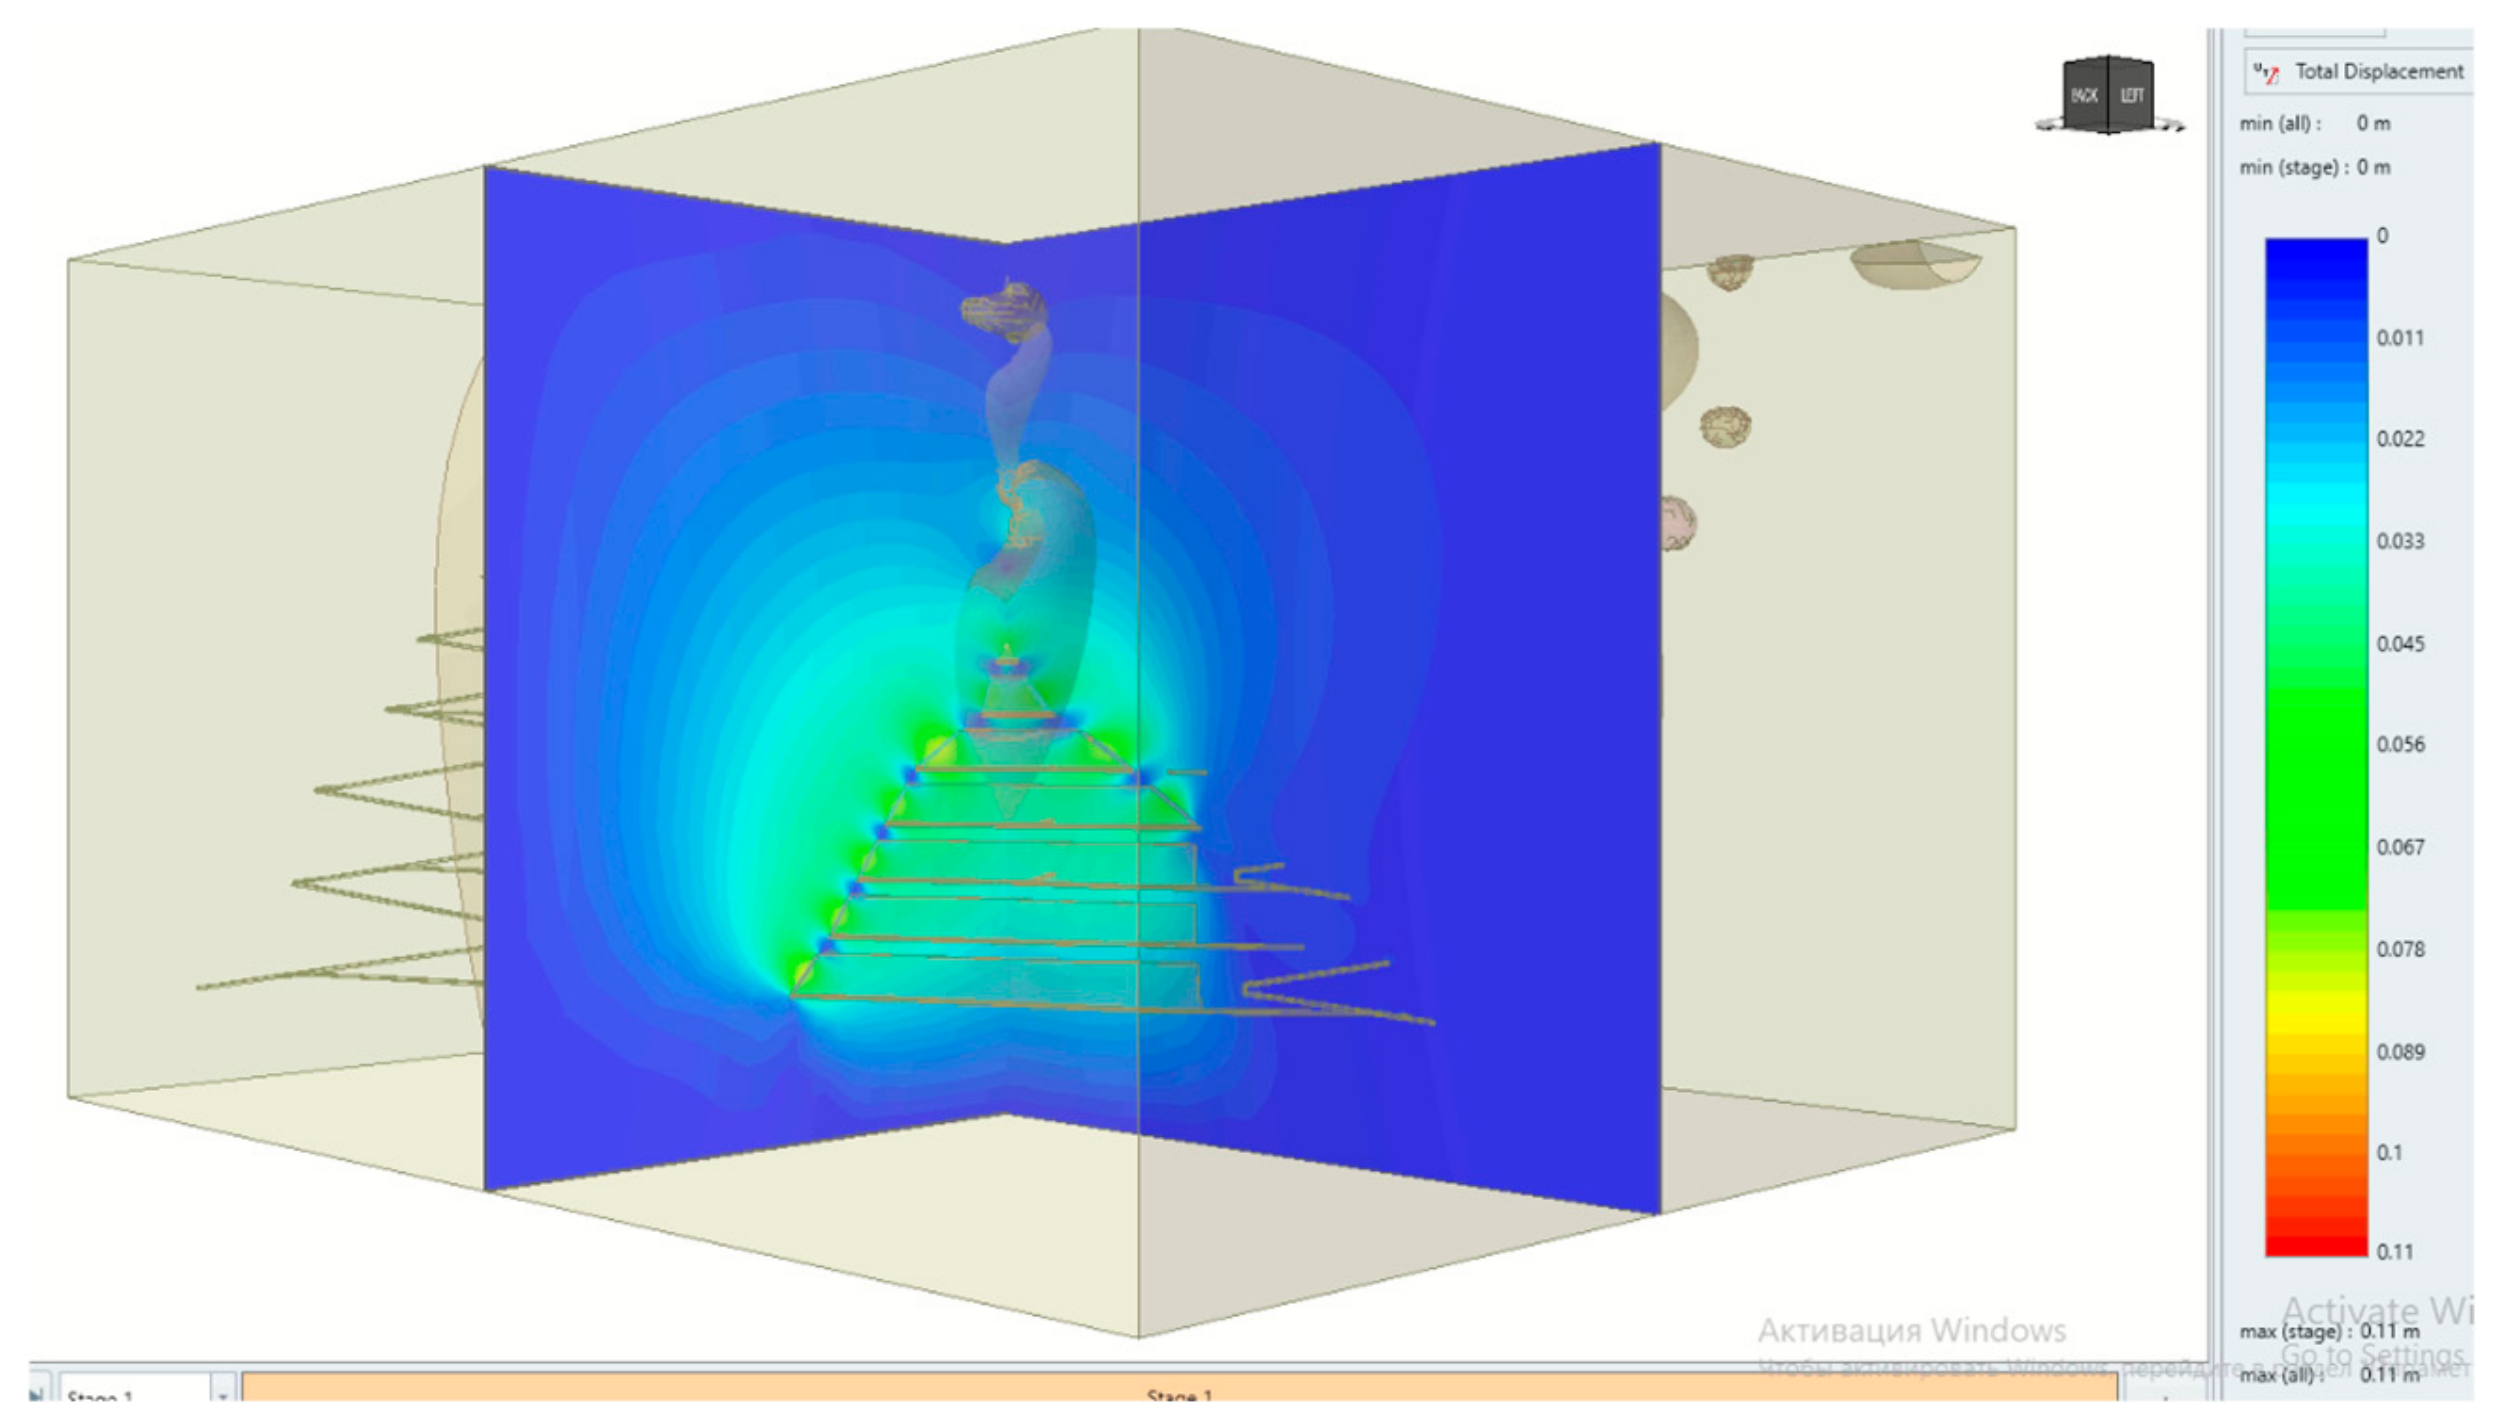
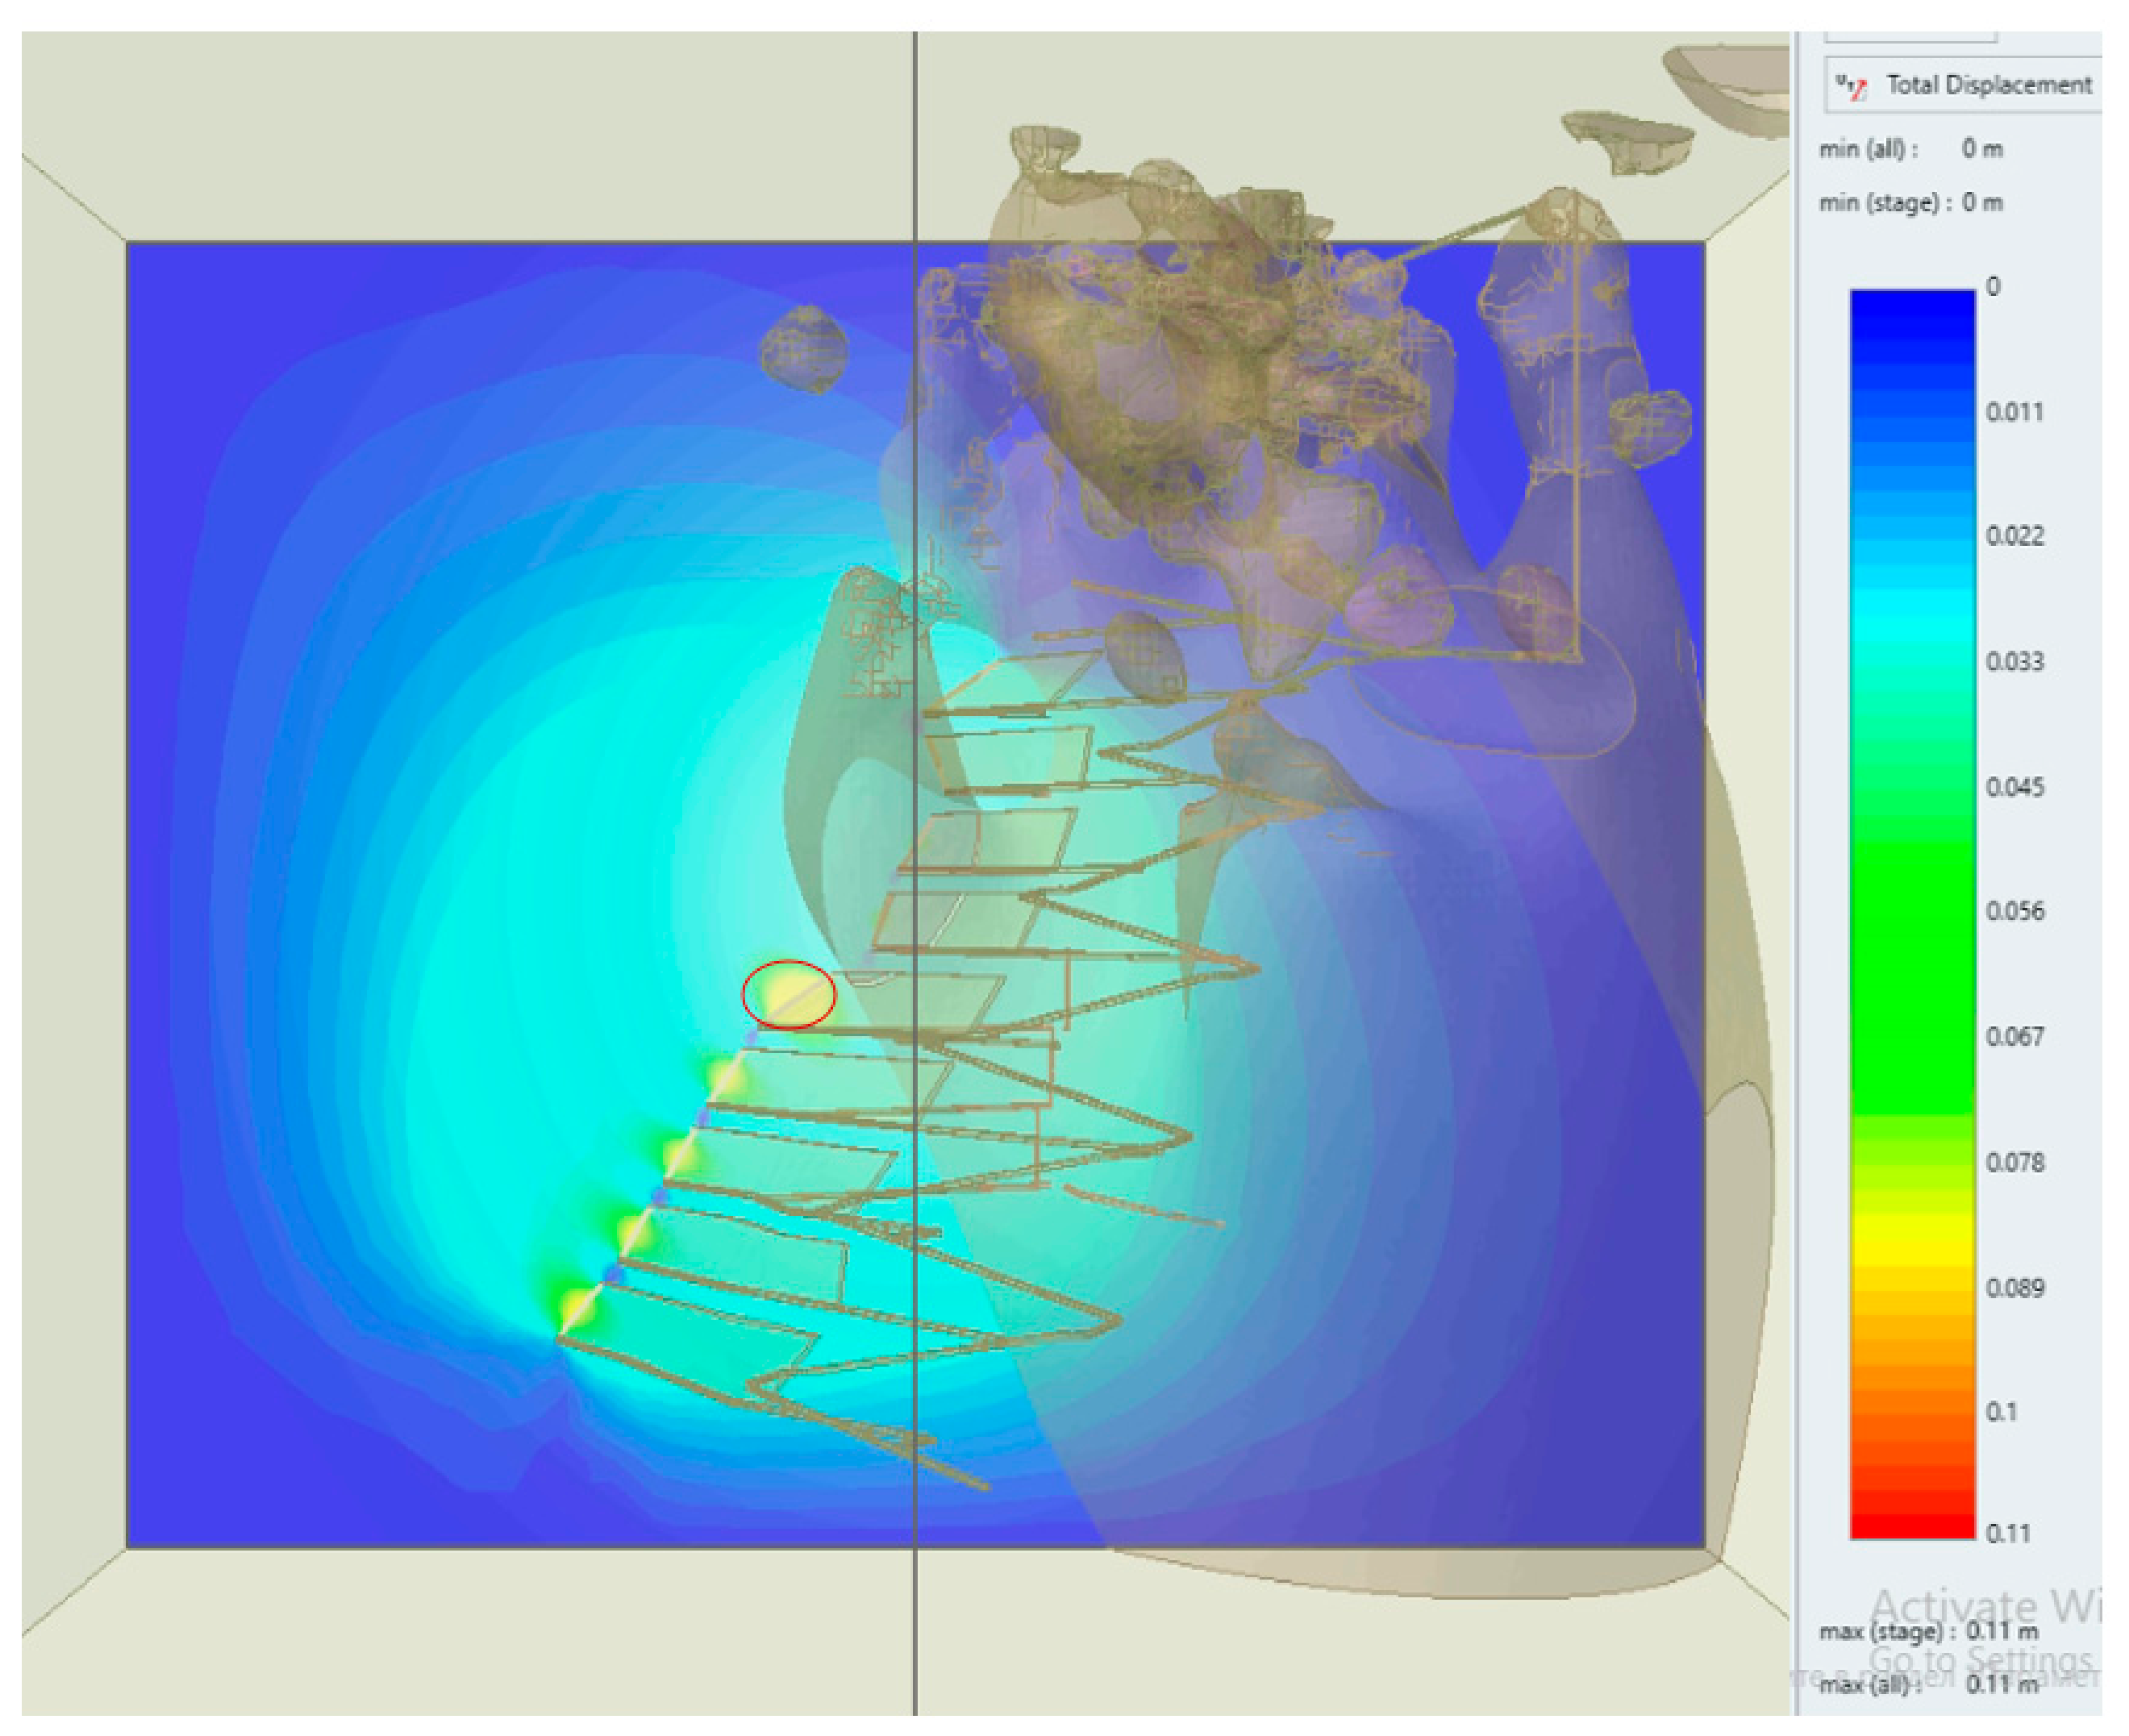
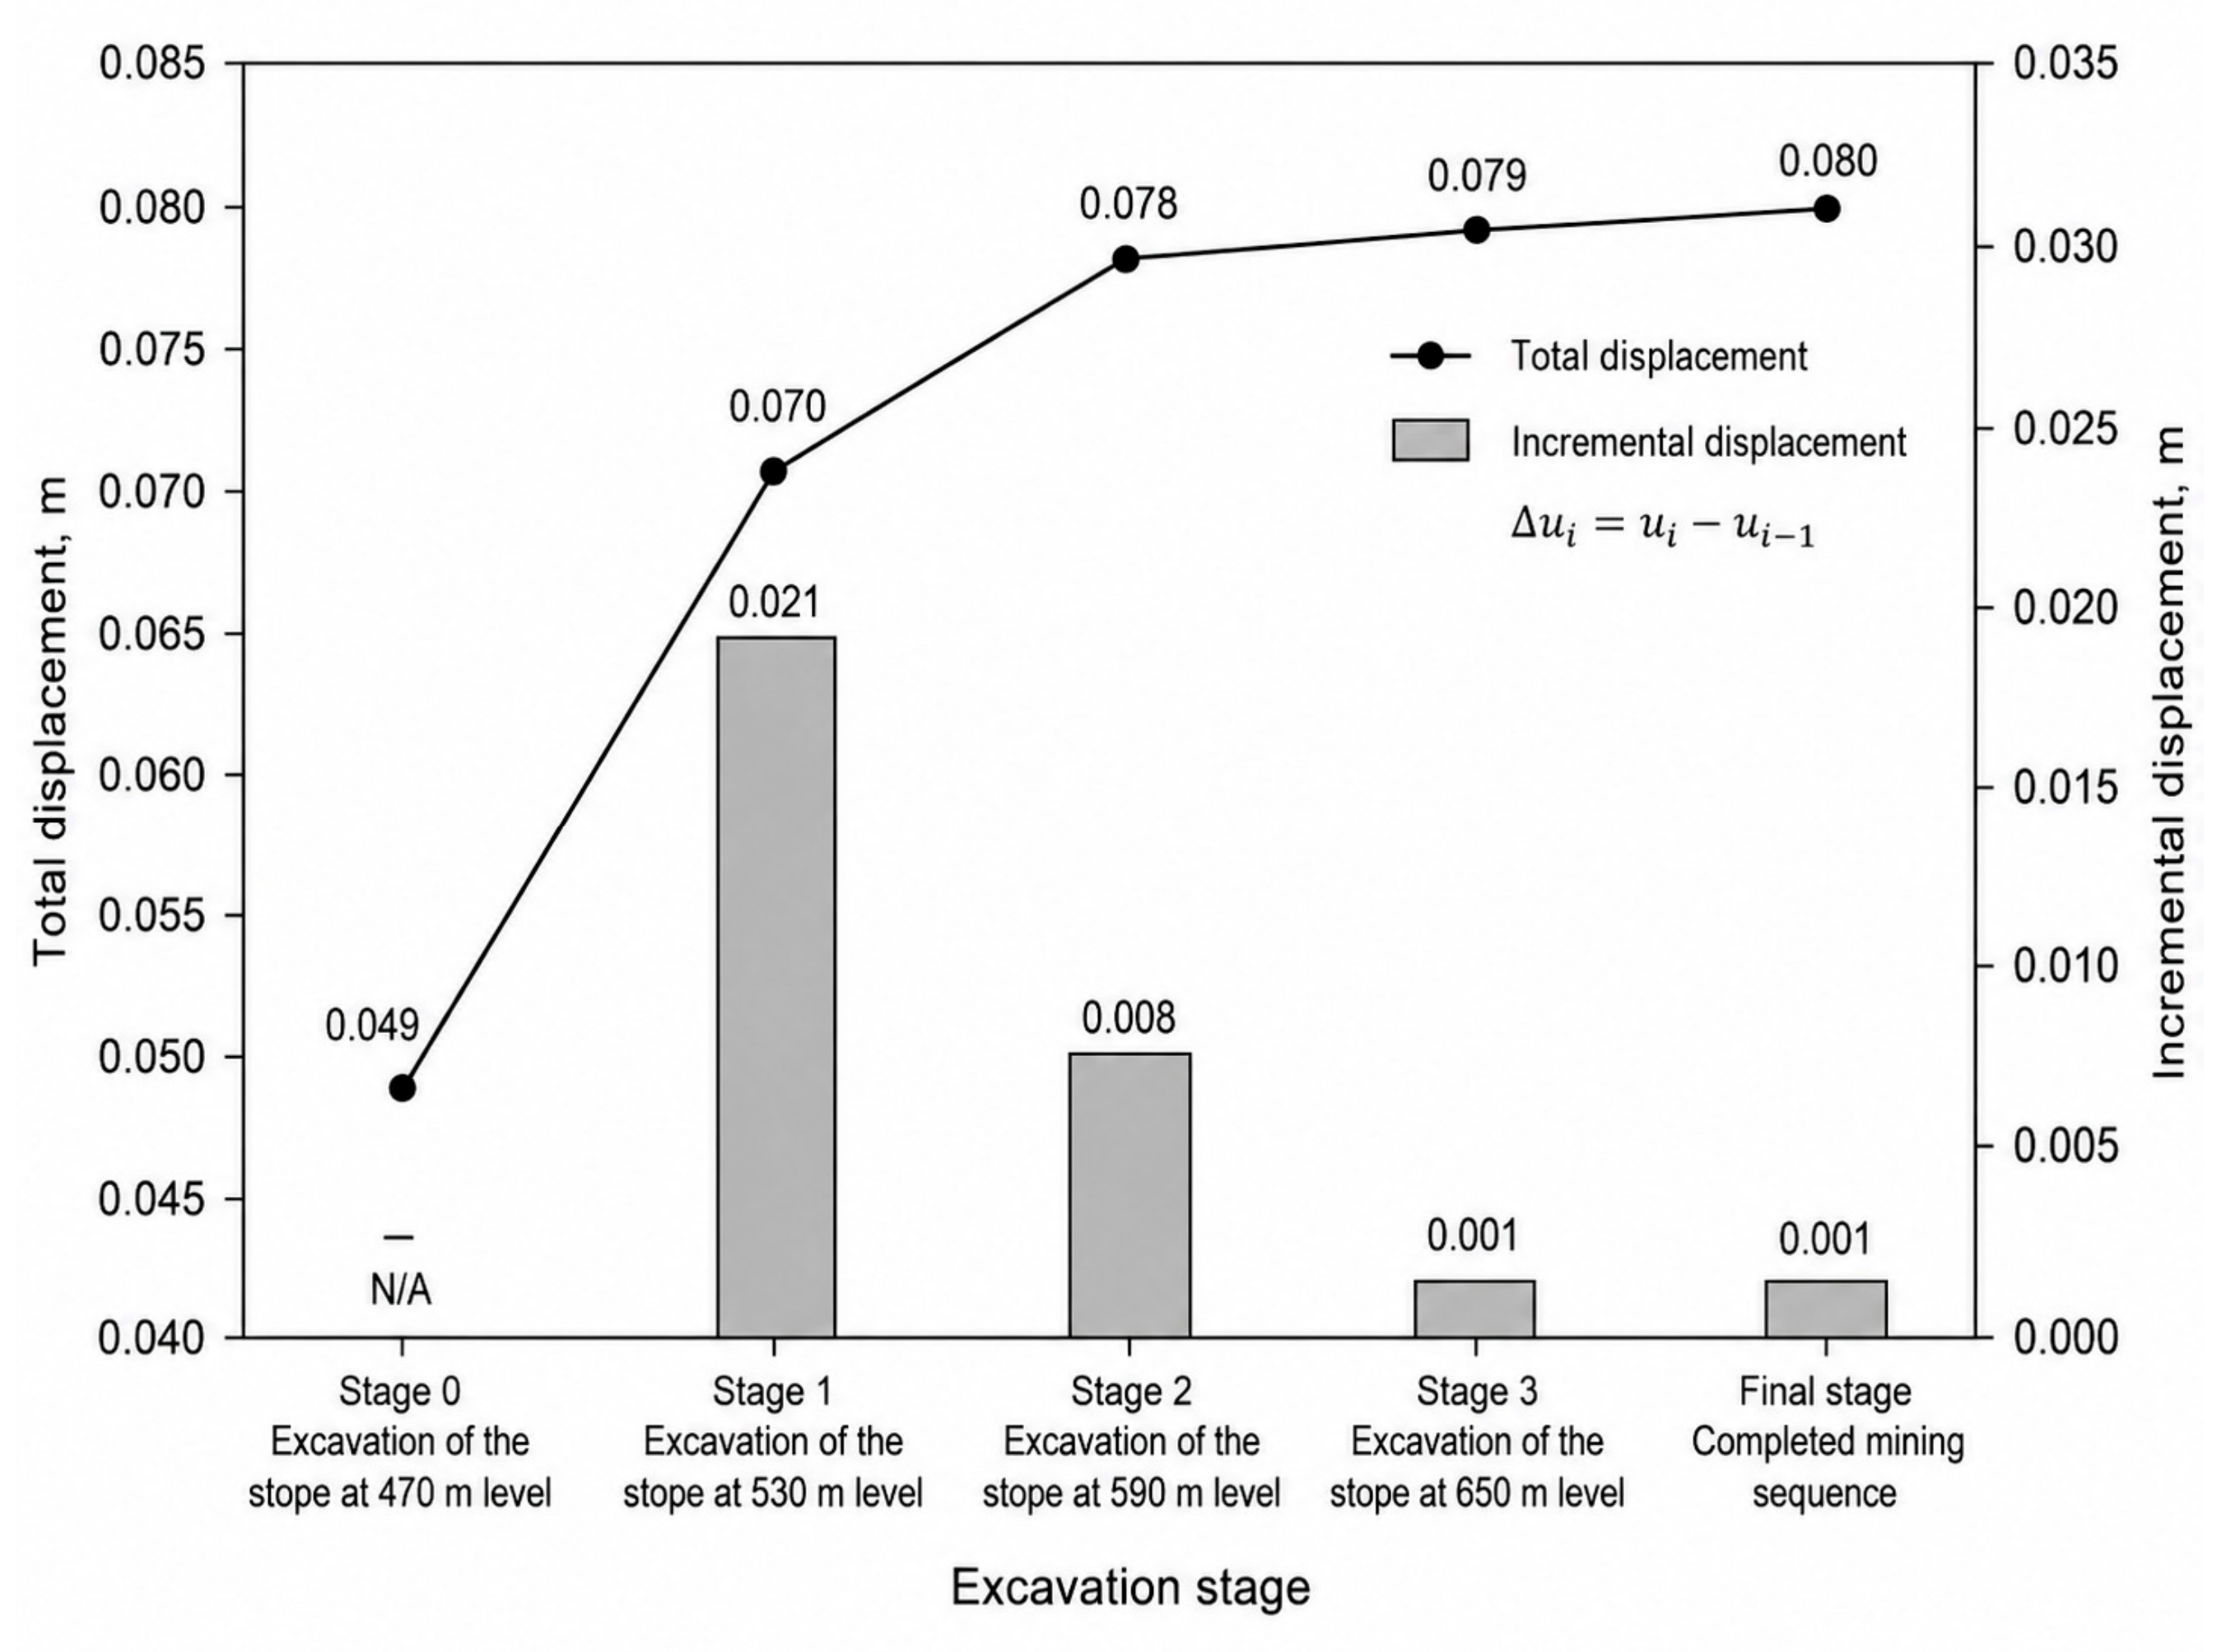
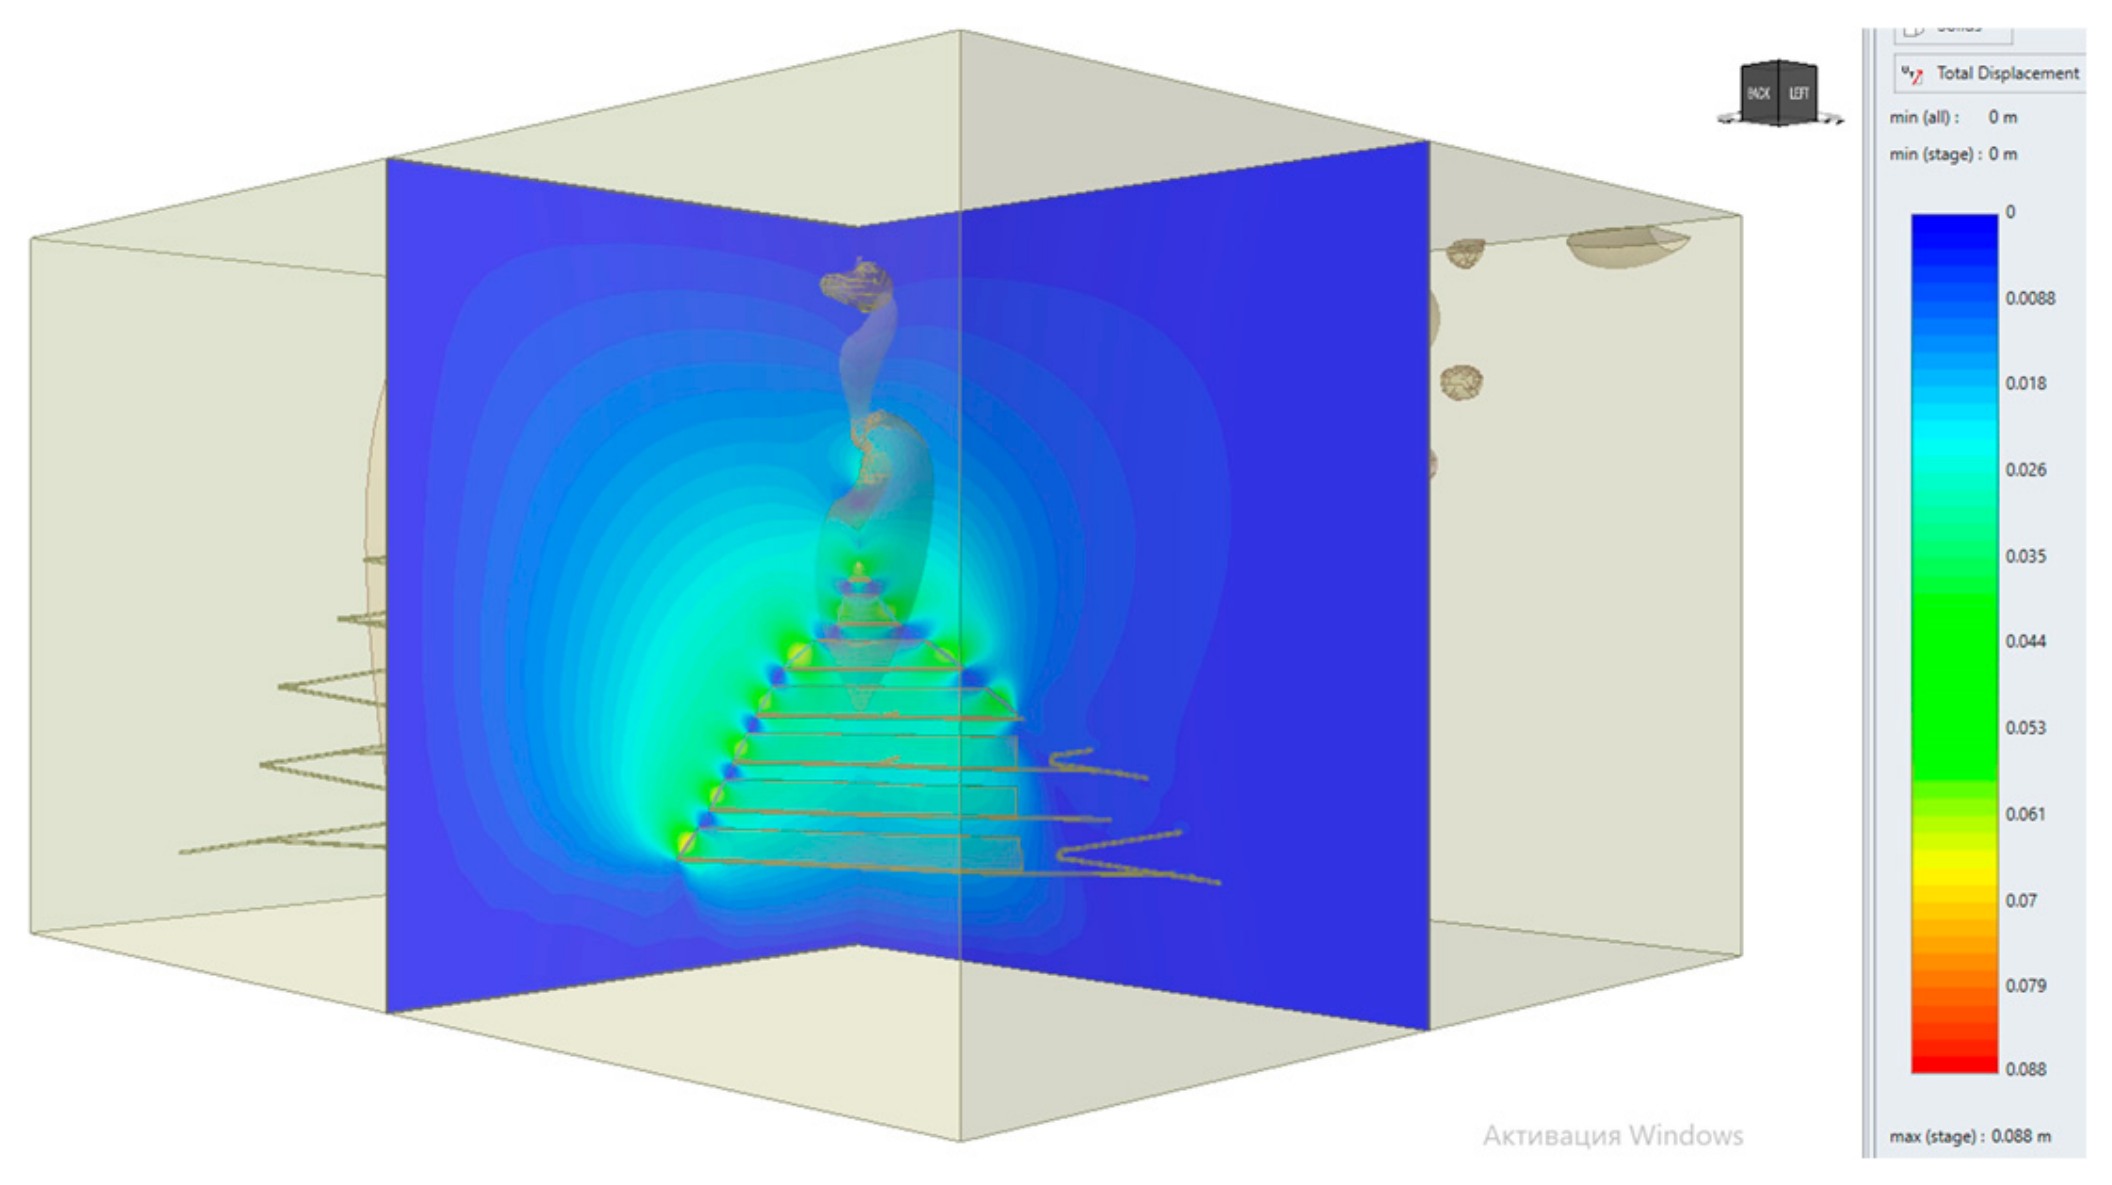
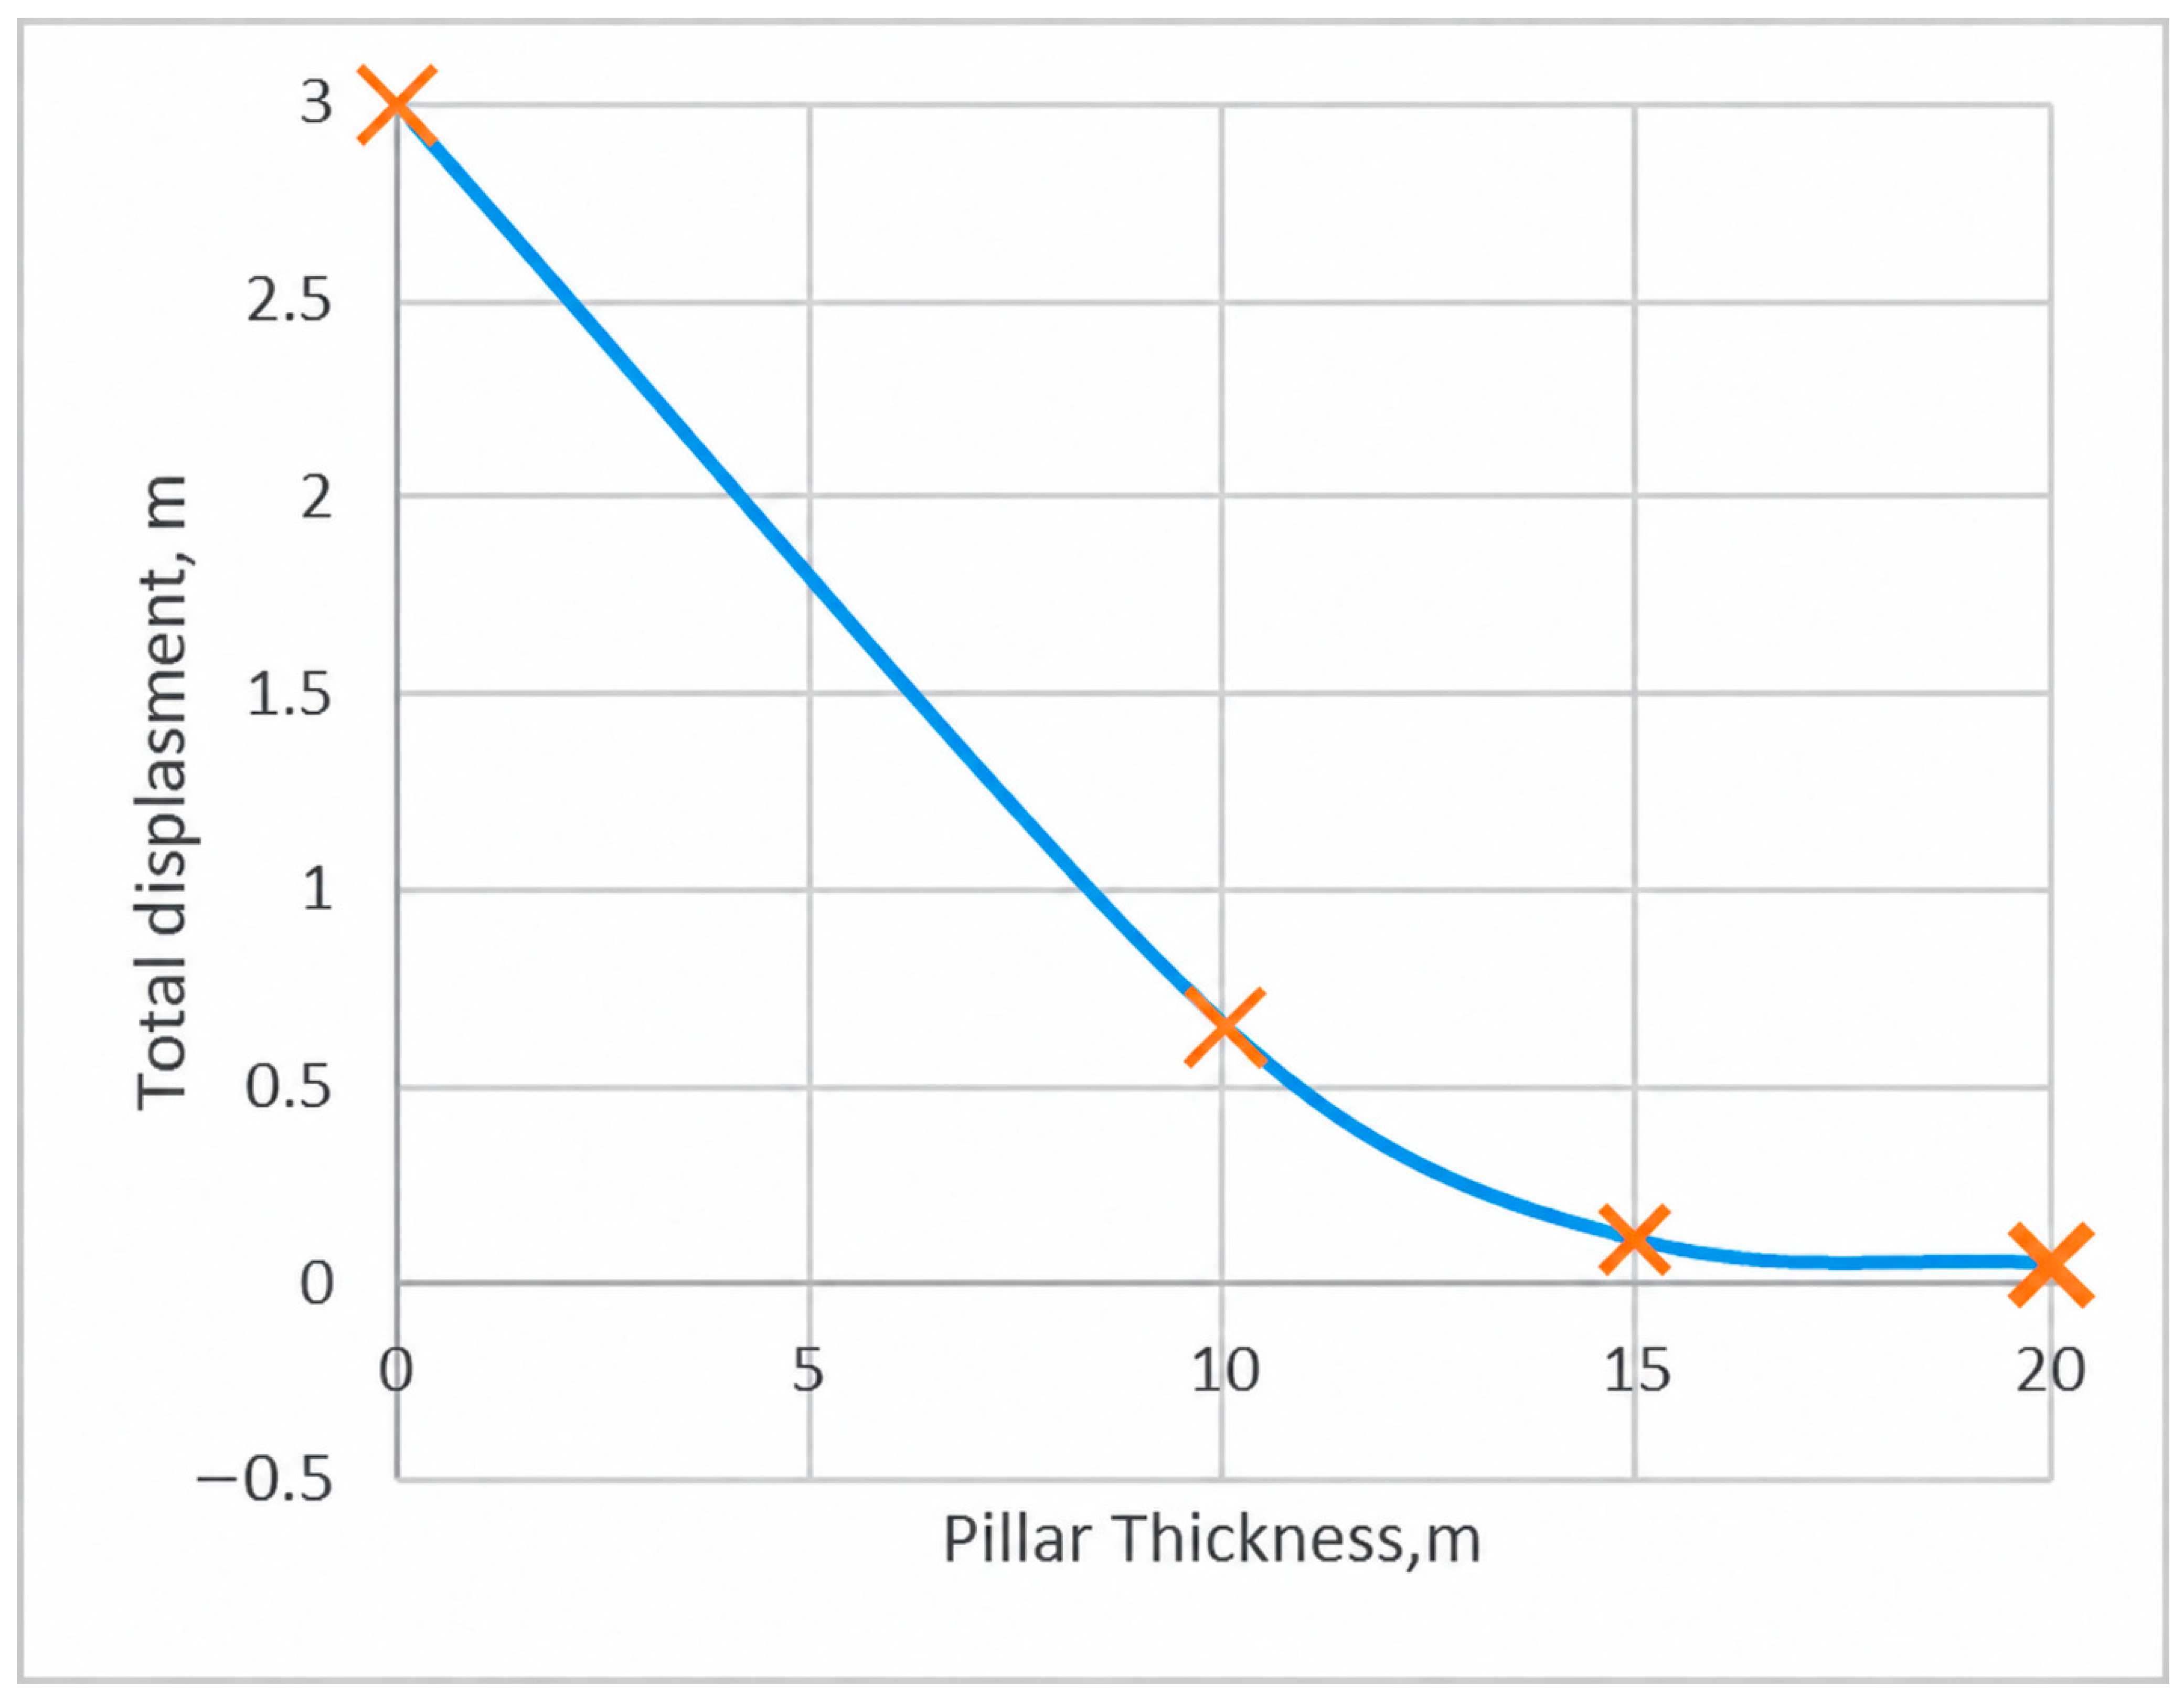
Figure 16 reveal that the relationship between pillar thickness and rock mass deformation is highly nonlinear rather than proportional. A rapid decrease in displacement is observed as the pillar thickness increases from 0 to 15 m, whereas a further increase to 20 m produces only marginal improvements. This behavior indicates that the critical pillar thickness has already been exceeded, and additional increases in pillar dimensions primarily result in ore sterilization rather than further enhancement of geomechanical stability.
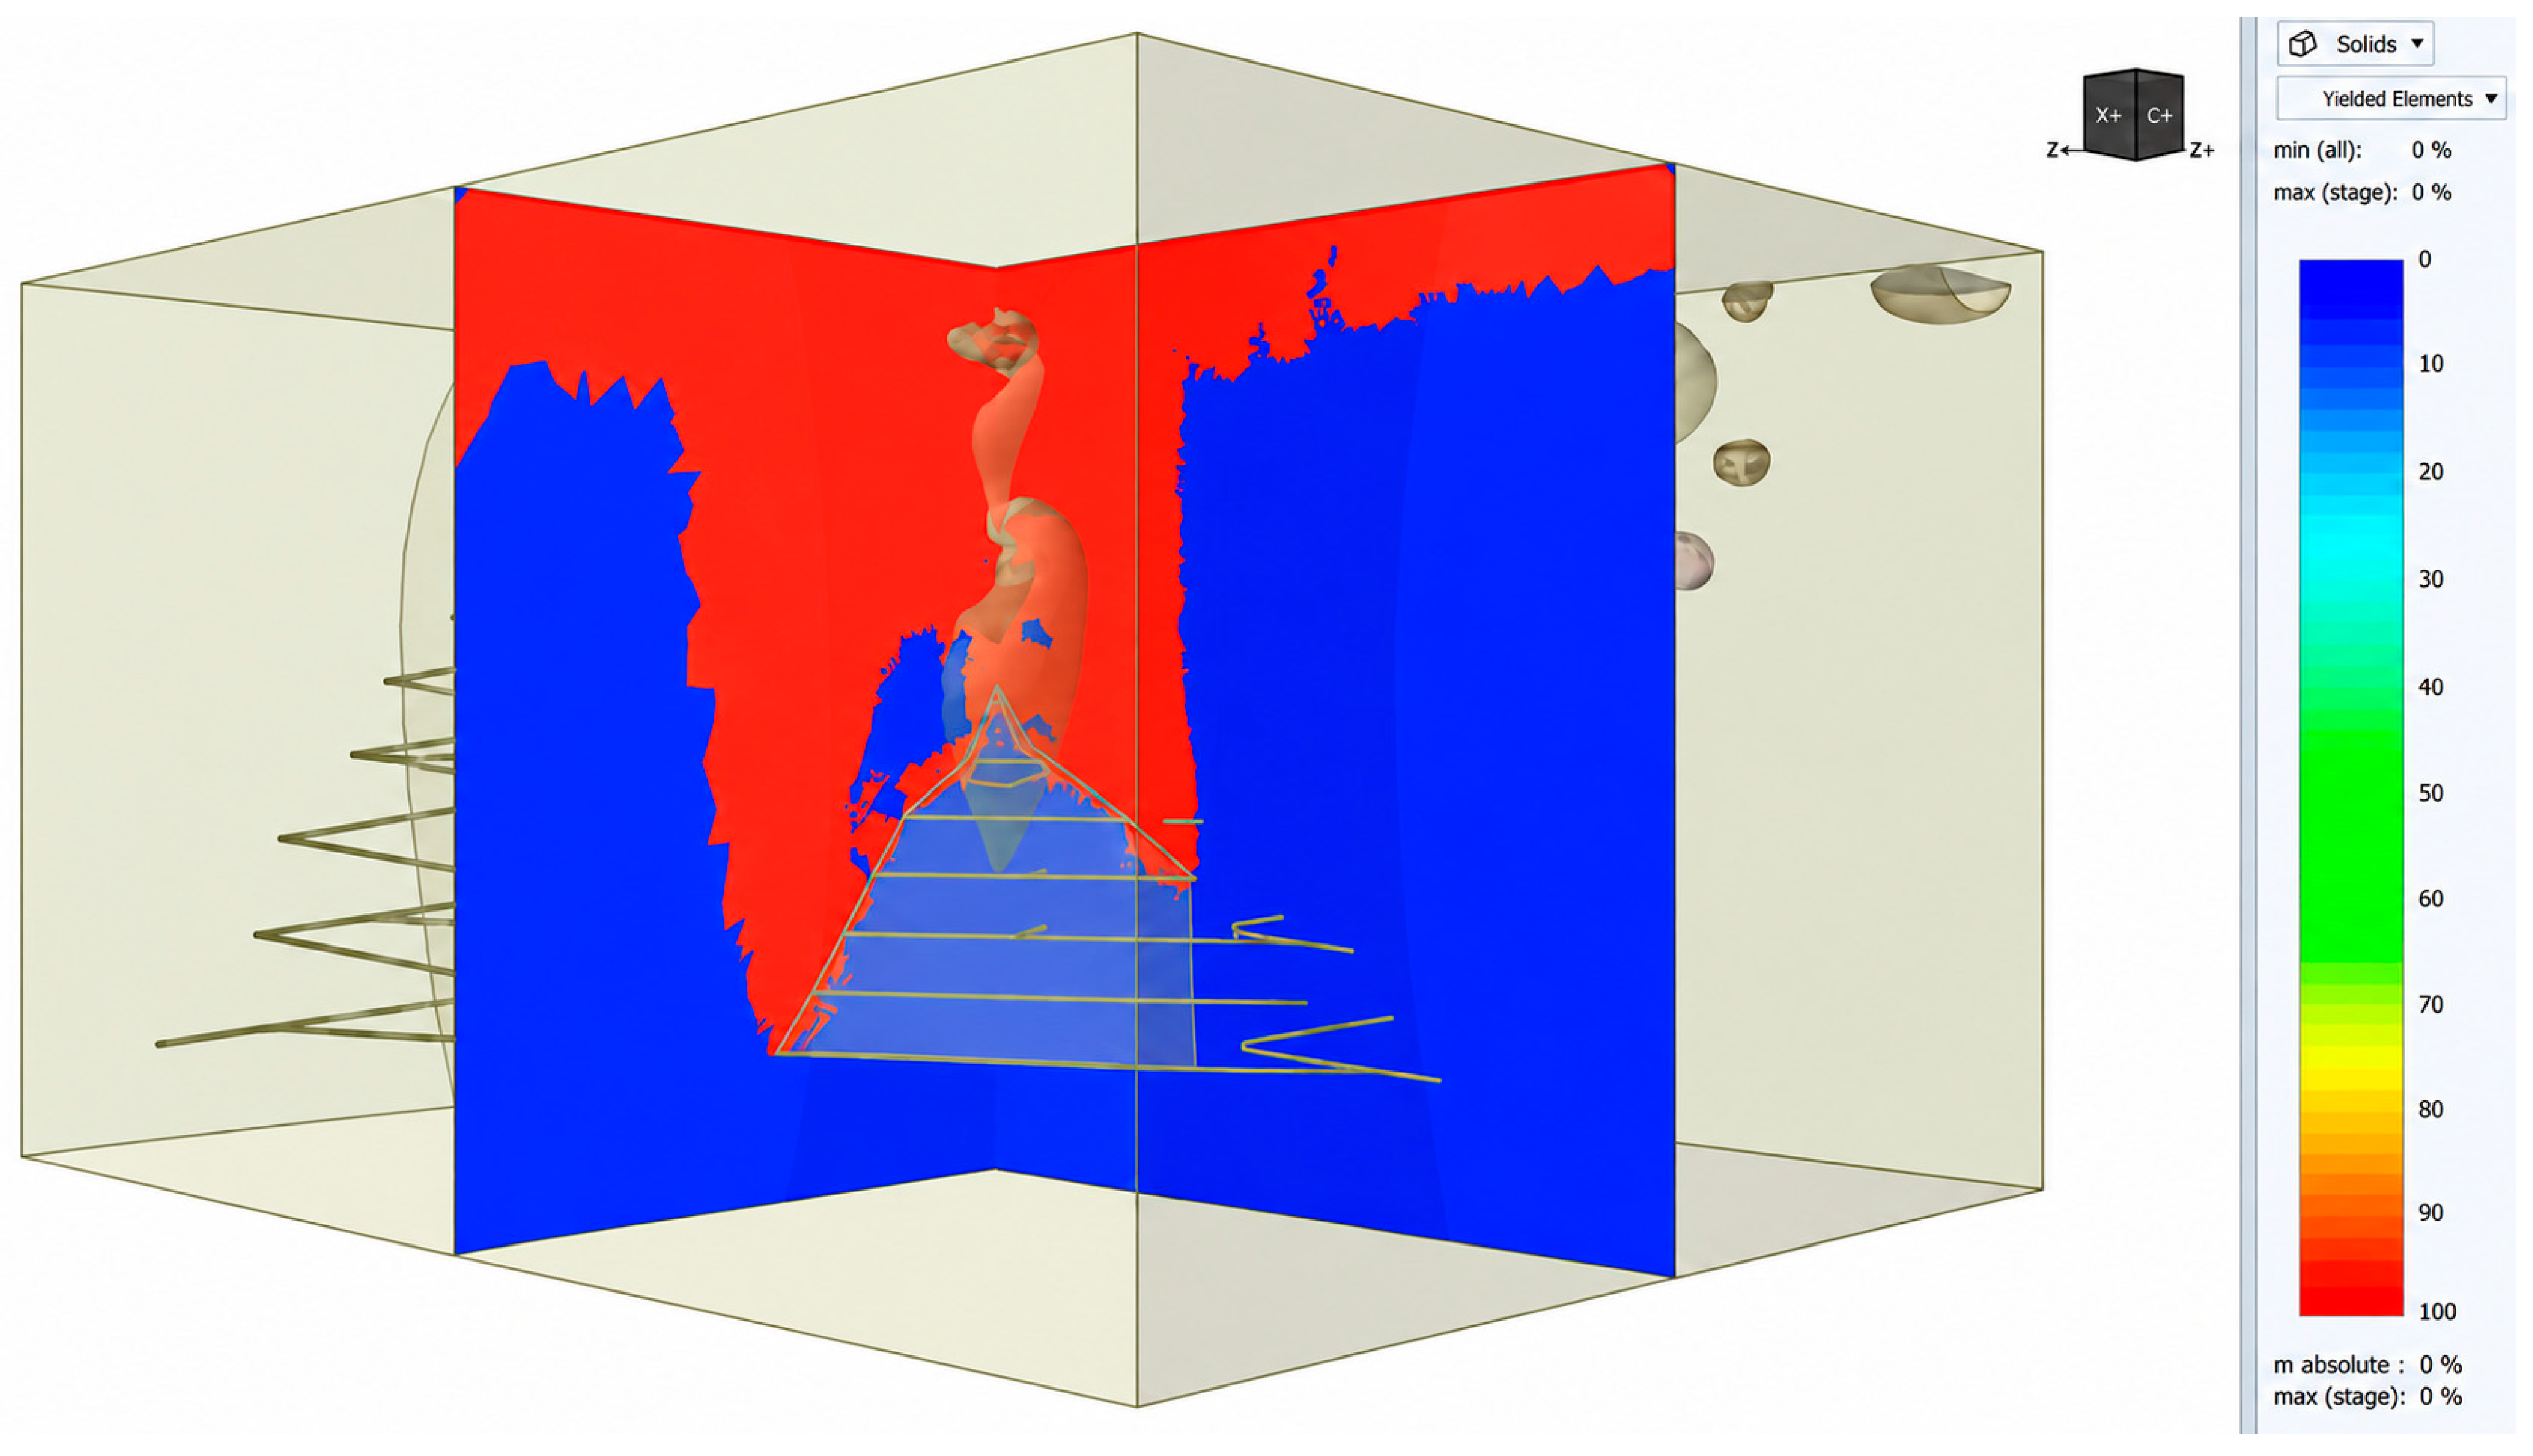
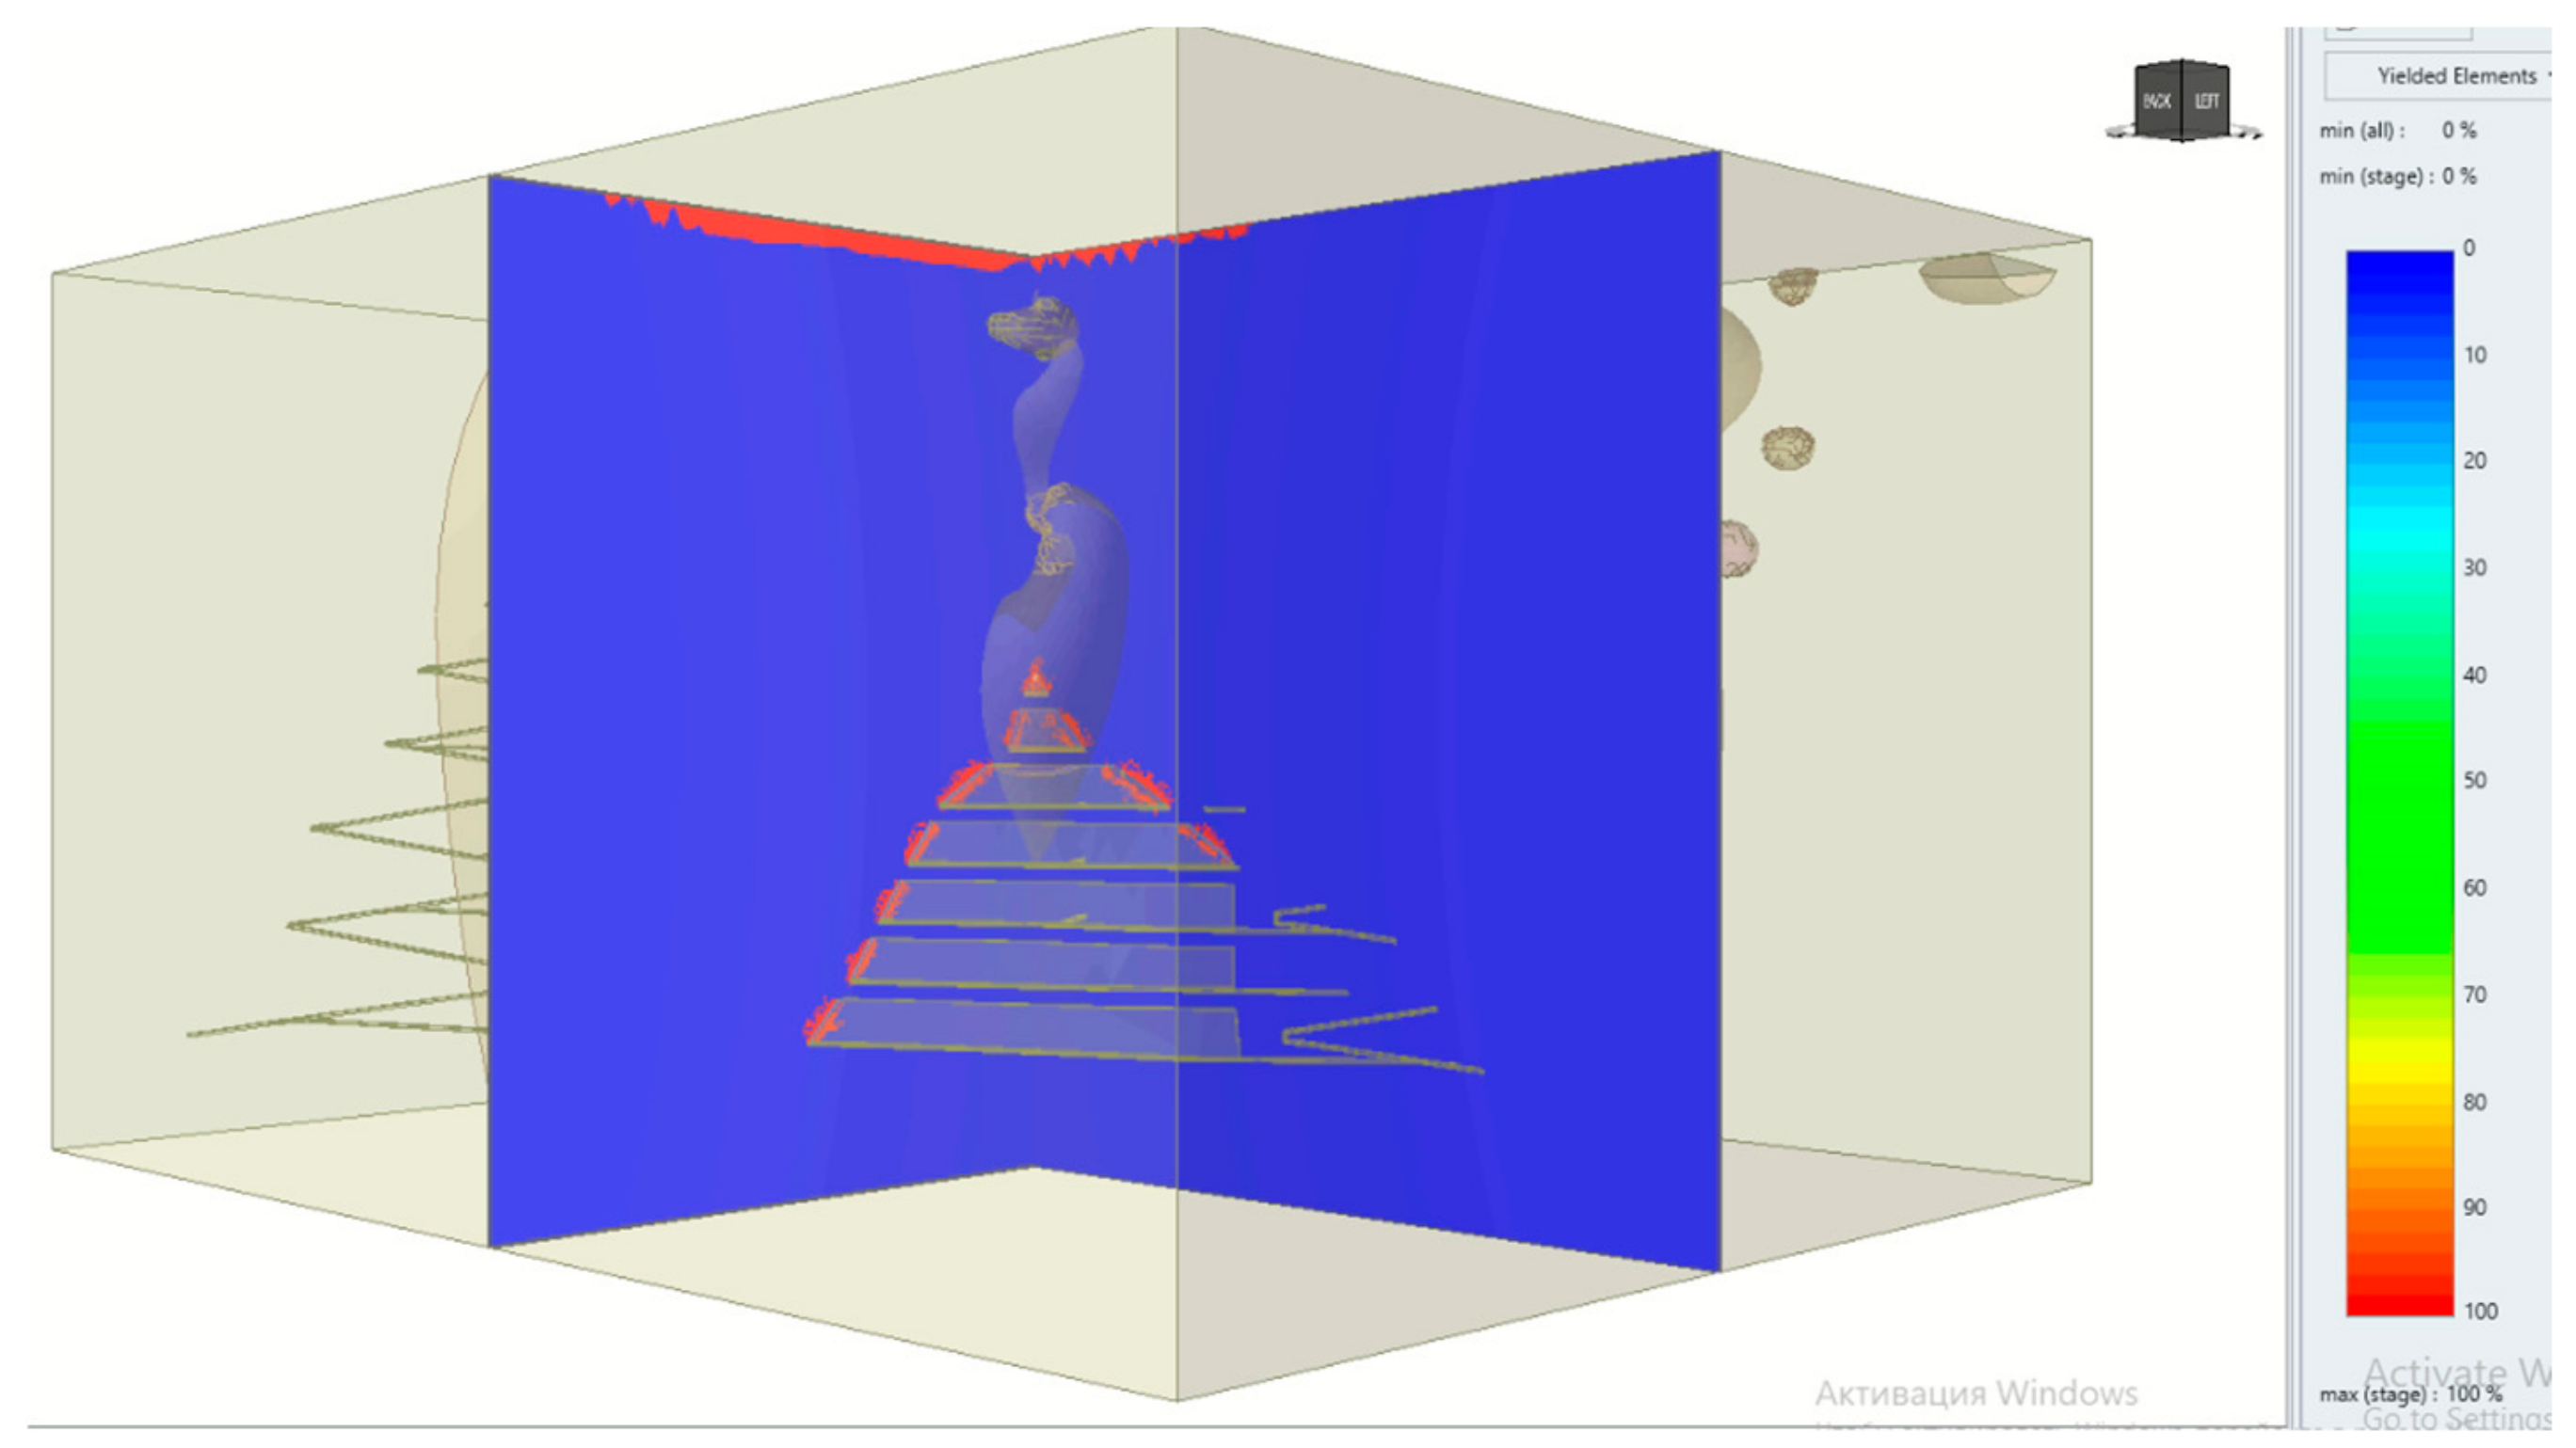
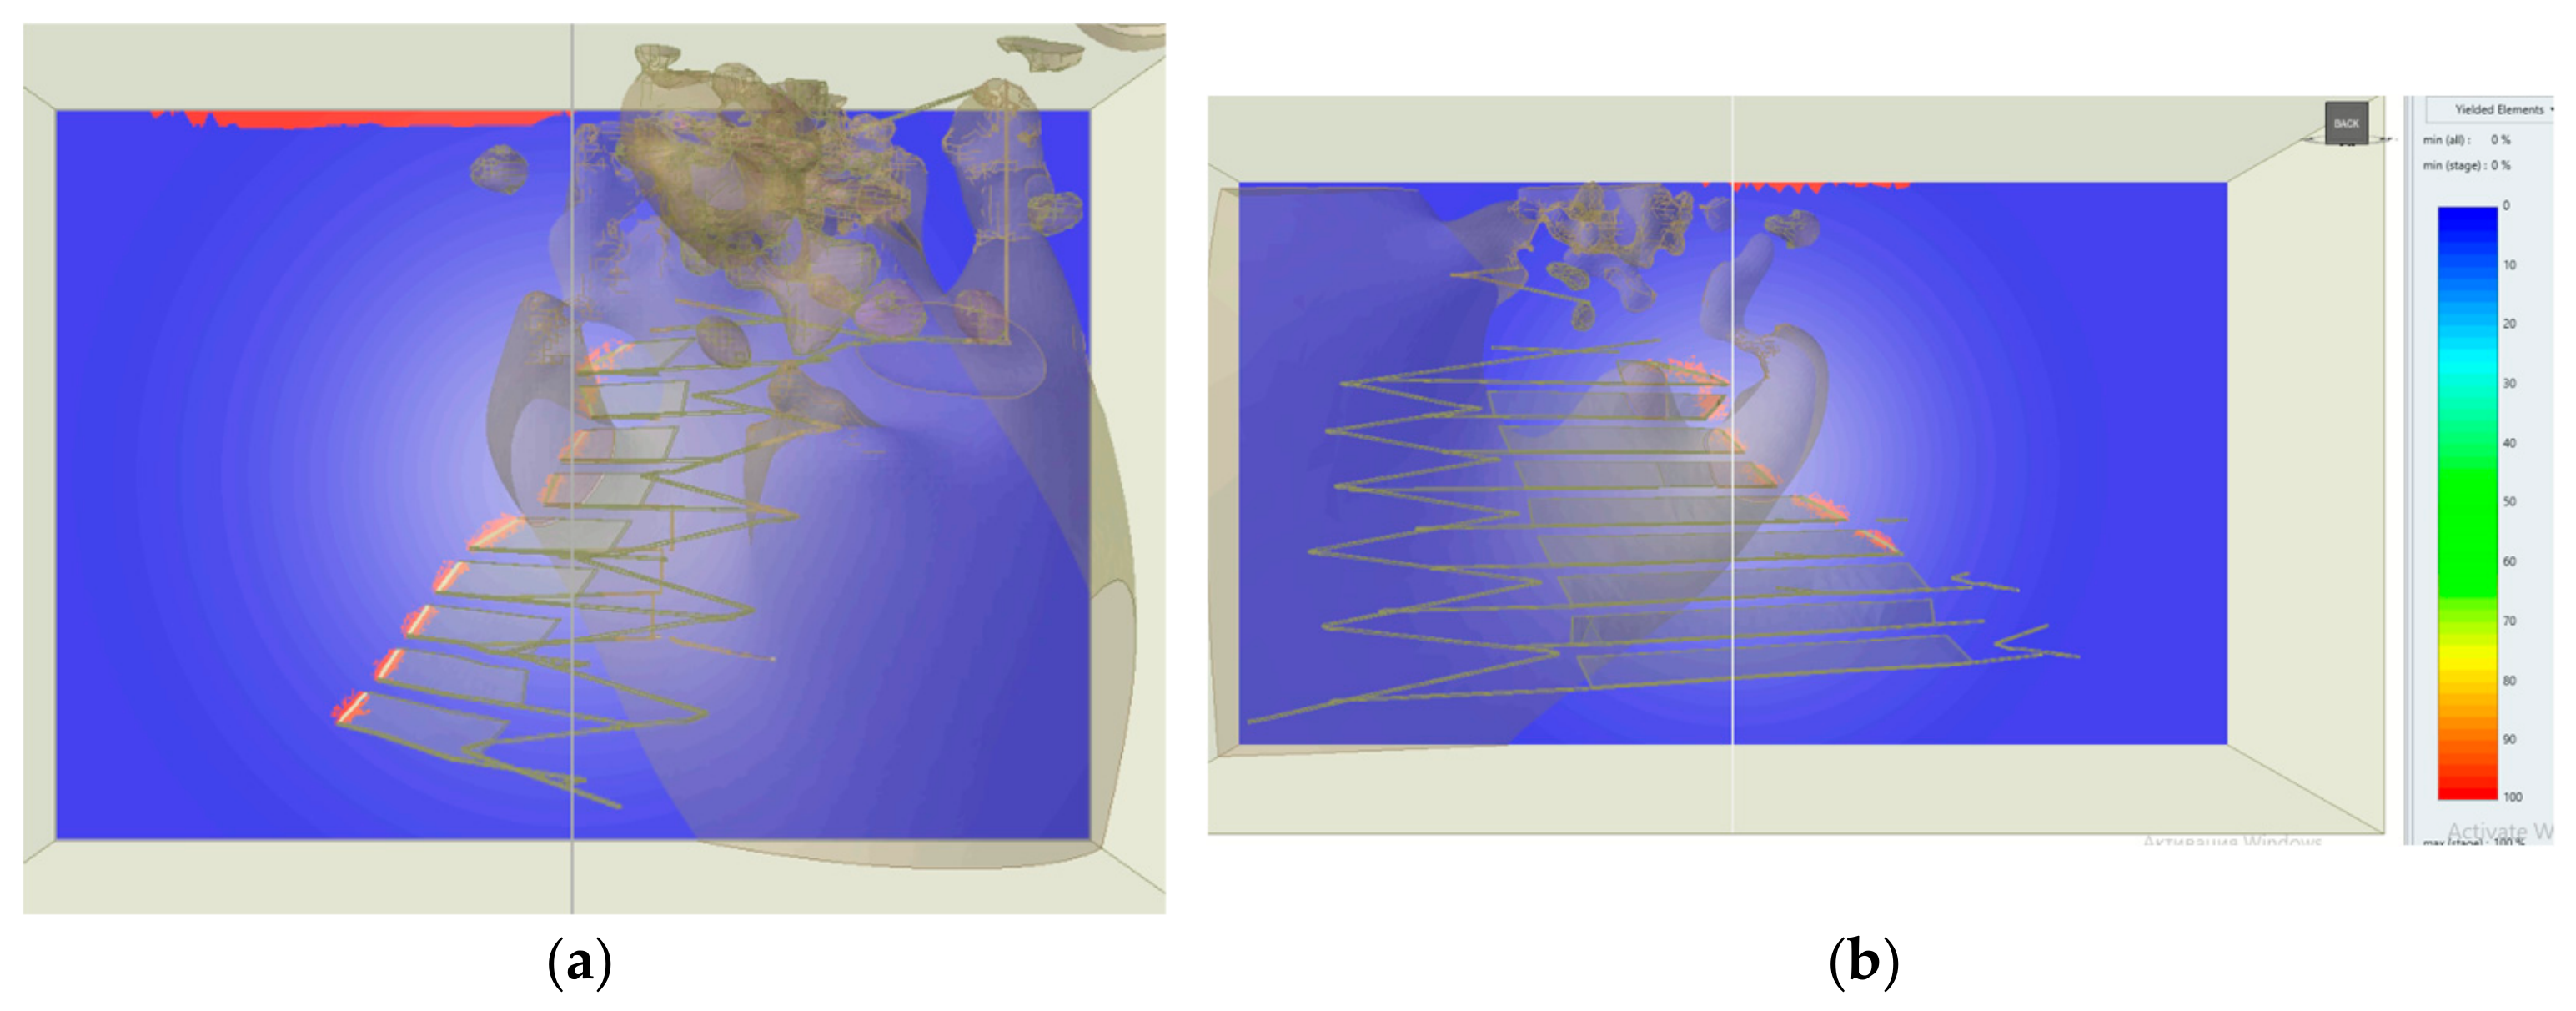
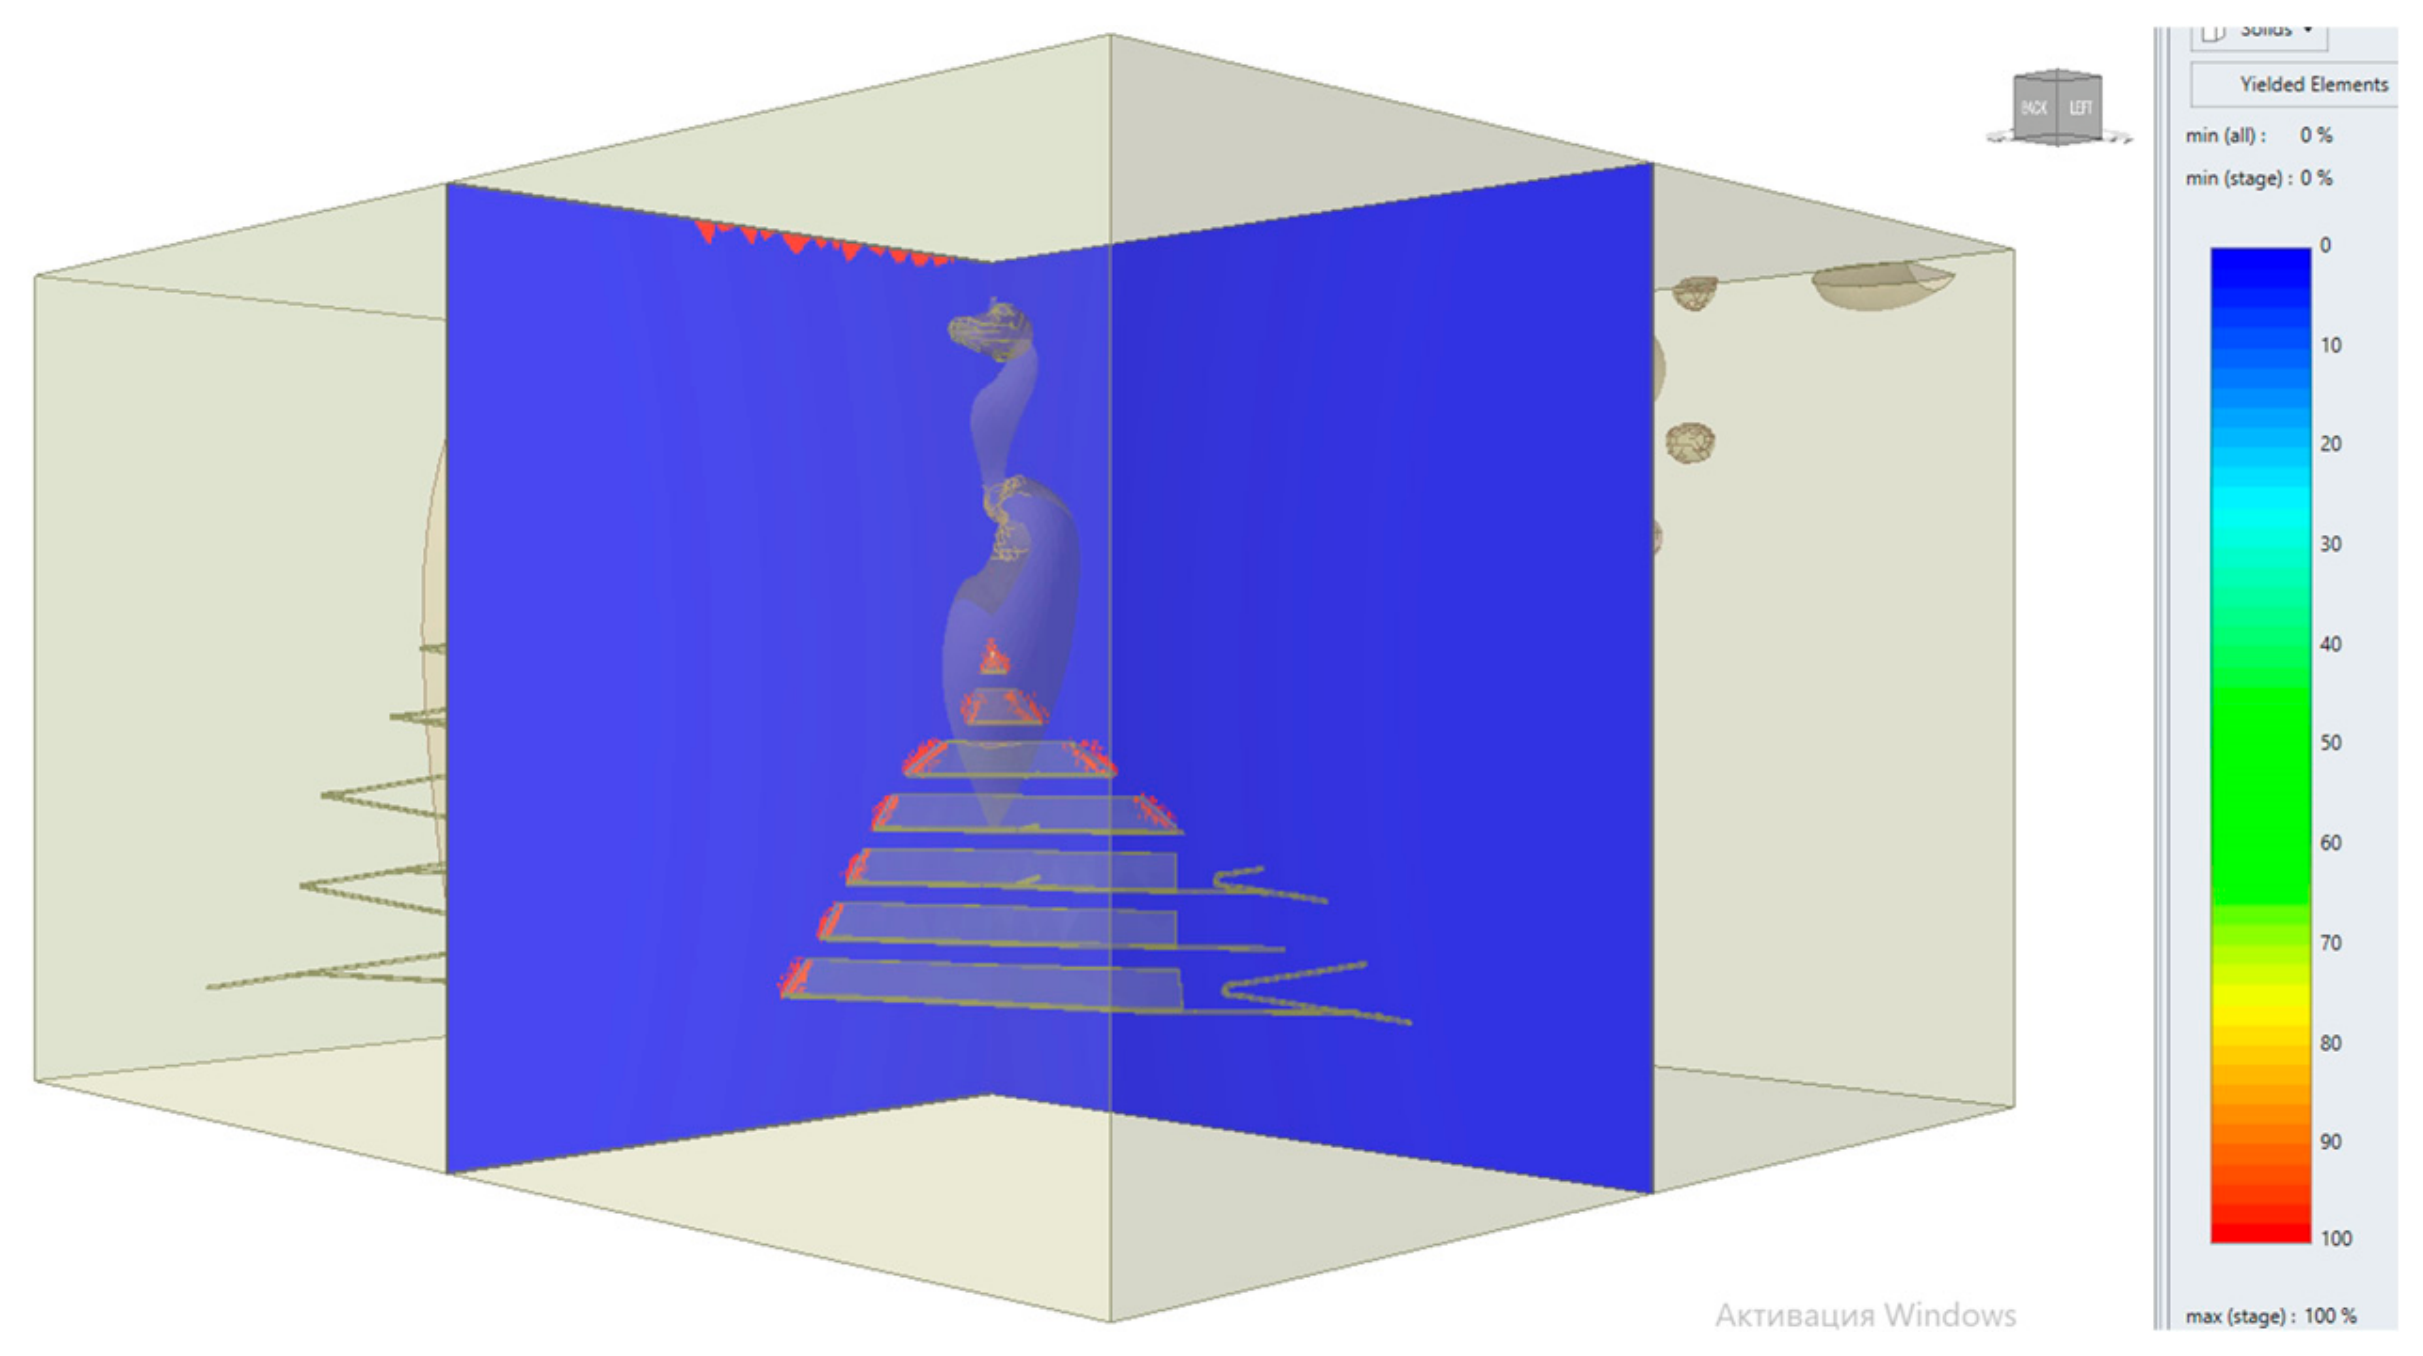
The comparison of all simulated mining scenarios demonstrates the existence of a critical transition in the geomechanical behavior of the rock mass. Increasing the pillar thickness from 10 m to 15 m fundamentally changes the stability regime, transforming a globally unstable rock mass into a globally stable system with only localized failure. A further increase in pillar thickness to 20 m produces only marginal improvements in displacement while leaving the extent and distribution of yielded zones virtually unchanged.
Consequently, under the geological and mining conditions of the Kenzhem deposit, a 15 m inter-stope pillar may be regarded as a rational design solution that provides the required level of geomechanical stability without unnecessary sterilization of ore reserves. Although increasing the inter-stope pillar thickness from 15 m to 20 m results in a slight reduction in rock mass displacements, it does not produce a significant improvement in the overall stability of the rock mass or alter the distribution of yielded zones. Consequently, the additional ore left in a 20 m pillar cannot be justified by a corresponding increase in geomechanical safety. From both engineering and economic perspectives, a 15 m inter-stope pillar represents the most rational design solution, providing the required level of stability while minimizing ore losses. In other words, the optimum pillar thickness should not be selected as the maximum thickness ensuring stability, but rather as the minimum thickness capable of preventing global instability while maximizing ore recovery.
4.2. Independent Stability Criteria
An important feature of the present study is that the stability of the mining system was not evaluated using a single geomechanical indicator. Instead, the conclusions were derived from the combined interpretation of three independent stability criteria: (i) the maximum total rock mass displacement, representing the deformation response of the rock mass; (ii) the spatial extent and distribution of yielded zones predicted by the generalized Hoek–Brown failure criterion, characterizing the development of irreversible failure; and (iii) the convergence behavior of the finite element solution, representing the mathematical existence of an equilibrium stress–strain state. Although these criteria are based on fundamentally different physical and numerical principles, they consistently identify the same transition in rock mass behavior as the pillar thickness increases.
The comparison of the four simulated mining scenarios is summarized in
Table 5. A remarkable consistency is observed among all three indicators. For pillar thickness of 0 m and 10 m, the numerical solution fails to converge, extensive yielded zones develop around the stopes, and large rock mass displacements indicate the onset of global instability. In contrast, pillar thickness of 15 m and 20 m produce convergent numerical solutions, while yielded zones remain localized around excavation boundaries and rock mass displacements decrease by more than an order of magnitude. This agreement between three independent stability criteria considerably increases the reliability of the obtained conclusions and demonstrates that the identified threshold is not an artifact of any individual evaluation method.
4.3. Saturation Behavior and Diminishing Returns
The obtained results reveal the existence of a threshold pillar thickness separating two fundamentally different geomechanical regimes. Below this threshold, mining-induced yielded zones progressively coalesce into a continuous instability region, accompanied by excessive deformation and the loss of numerical equilibrium. Once the threshold is exceeded, the failure mechanism changes qualitatively: yielded zones remain isolated, the numerical solution becomes stable, and the rock mass preserves its global load-bearing capacity despite the presence of localized inelastic deformation.
An equally important observation is that the relationship between pillar and geomechanical stability exhibits a distinct saturation regime. Beyond the critical pillar thickness of approximately 15 m, further increases in pillar dimensions produce only marginal reductions in displacement while the extent and distribution of yielded zones remain essentially unchanged. This behavior represents a classical case of diminishing geomechanical returns, where additional increases in pillar thickness no longer result in proportional improvements in stability. Instead, they primarily increase the volume of sterilized ore left underground. Therefore, the optimum pillar thickness should not be interpreted as the maximum pillar capable of minimizing deformation, but rather as the minimum pillar thickness that prevents global instability while maximizing ore recovery. This criterion leads to the conclusion that, under the geological and mining conditions of the Kenzhem deposit, a 15 m inter-stope pillar provides the most rational balance between geomechanical safety and mining efficiency.
Therefore, the optimum pillar thickness should not be interpreted as the maximum pillar capable of minimizing deformation, but rather as the minimum pillar thickness that prevents global instability while maximizing ore recovery. This criterion leads to the conclusion that, under the geological and mining conditions of the Kenzhem deposit, a 15 m inter-stope pillar provides the most rational balance between geomechanical safety and mining efficiency.
It should be emphasized, however, that the identified threshold is specific to the geomechanical conditions adopted in the present model. Although the input mechanical properties were derived from site-specific laboratory testing and statistically characterized, natural variability in UCS, GSI, and the in situ stress field may affect the magnitude of calculated displacements and the spatial extent of yielded zones. This uncertainty is particularly relevant near the transition between the 10 m and 15 m pillar configurations. Therefore, the identified 15 m pillar thickness should not be regarded as a universal stability threshold, but rather as a rational design value for the representative geological, geomechanical, and mining conditions considered in this study. A formal sensitivity and uncertainty analysis of the principal input parameters is recommended as a subject of future work.
4.4. Qualitative Engineering Analogy with Field Observations
Since the Kenzhem area is currently at the design stage and underground excavations have not yet been developed, direct validation of the numerical simulations against field measurements is not presently possible. Nevertheless, the engineering plausibility of the predicted failure pattern can be discussed through comparison with field observations from an operating underground gold mine developed under partially comparable deep-mining conditions. The Zholymbet gold mine provides a useful reference in this respect. Similarly to Kenzhem, mining is conducted at considerable depth and is associated with the extraction of gold-bearing veins. In contrast to the Kenzhem area, however, Zholymbet has been operated for a long period, and field observations are available regarding the character of localized rock-mass damage in underground roadways located near mined-out areas. These observations make it possible to establish a qualitative engineering analogy between the numerically predicted failure pattern at Kenzhem and the actual manifestations of ground pressure observed at Zholymbet.
At the same time, the two deposits differ substantially in orebody geometry and mining technology. At Kenzhem, the ore veins considered in the present study are relatively thick and comparatively continuous both along strike and down dip. Their extraction therefore results in the formation of large mined-out stopes, which significantly affect stress redistribution and the stability of adjacent sublevel drifts. In contrast, the ore veins at Zholymbet are generally thinner and less continuous along strike and dip, and mining is carried out using a small-hole/shrinkage stoping method. As a result, the mined-out openings are considerably smaller, and the specific problem of selecting an inter-stope pillar between a large mined-out space and a sublevel drift does not arise in the same form. The principal similarities and differences between the two mining areas are summarized in
Table 6.
As shown in
Table 6, the two sites are comparable only in terms of deep underground mining conditions and the occurrence of localized damage near mined-out openings. Therefore, the Zholymbet observations are used solely as a qualitative engineering analogy and not as validation of the Kenzhem numerical model.
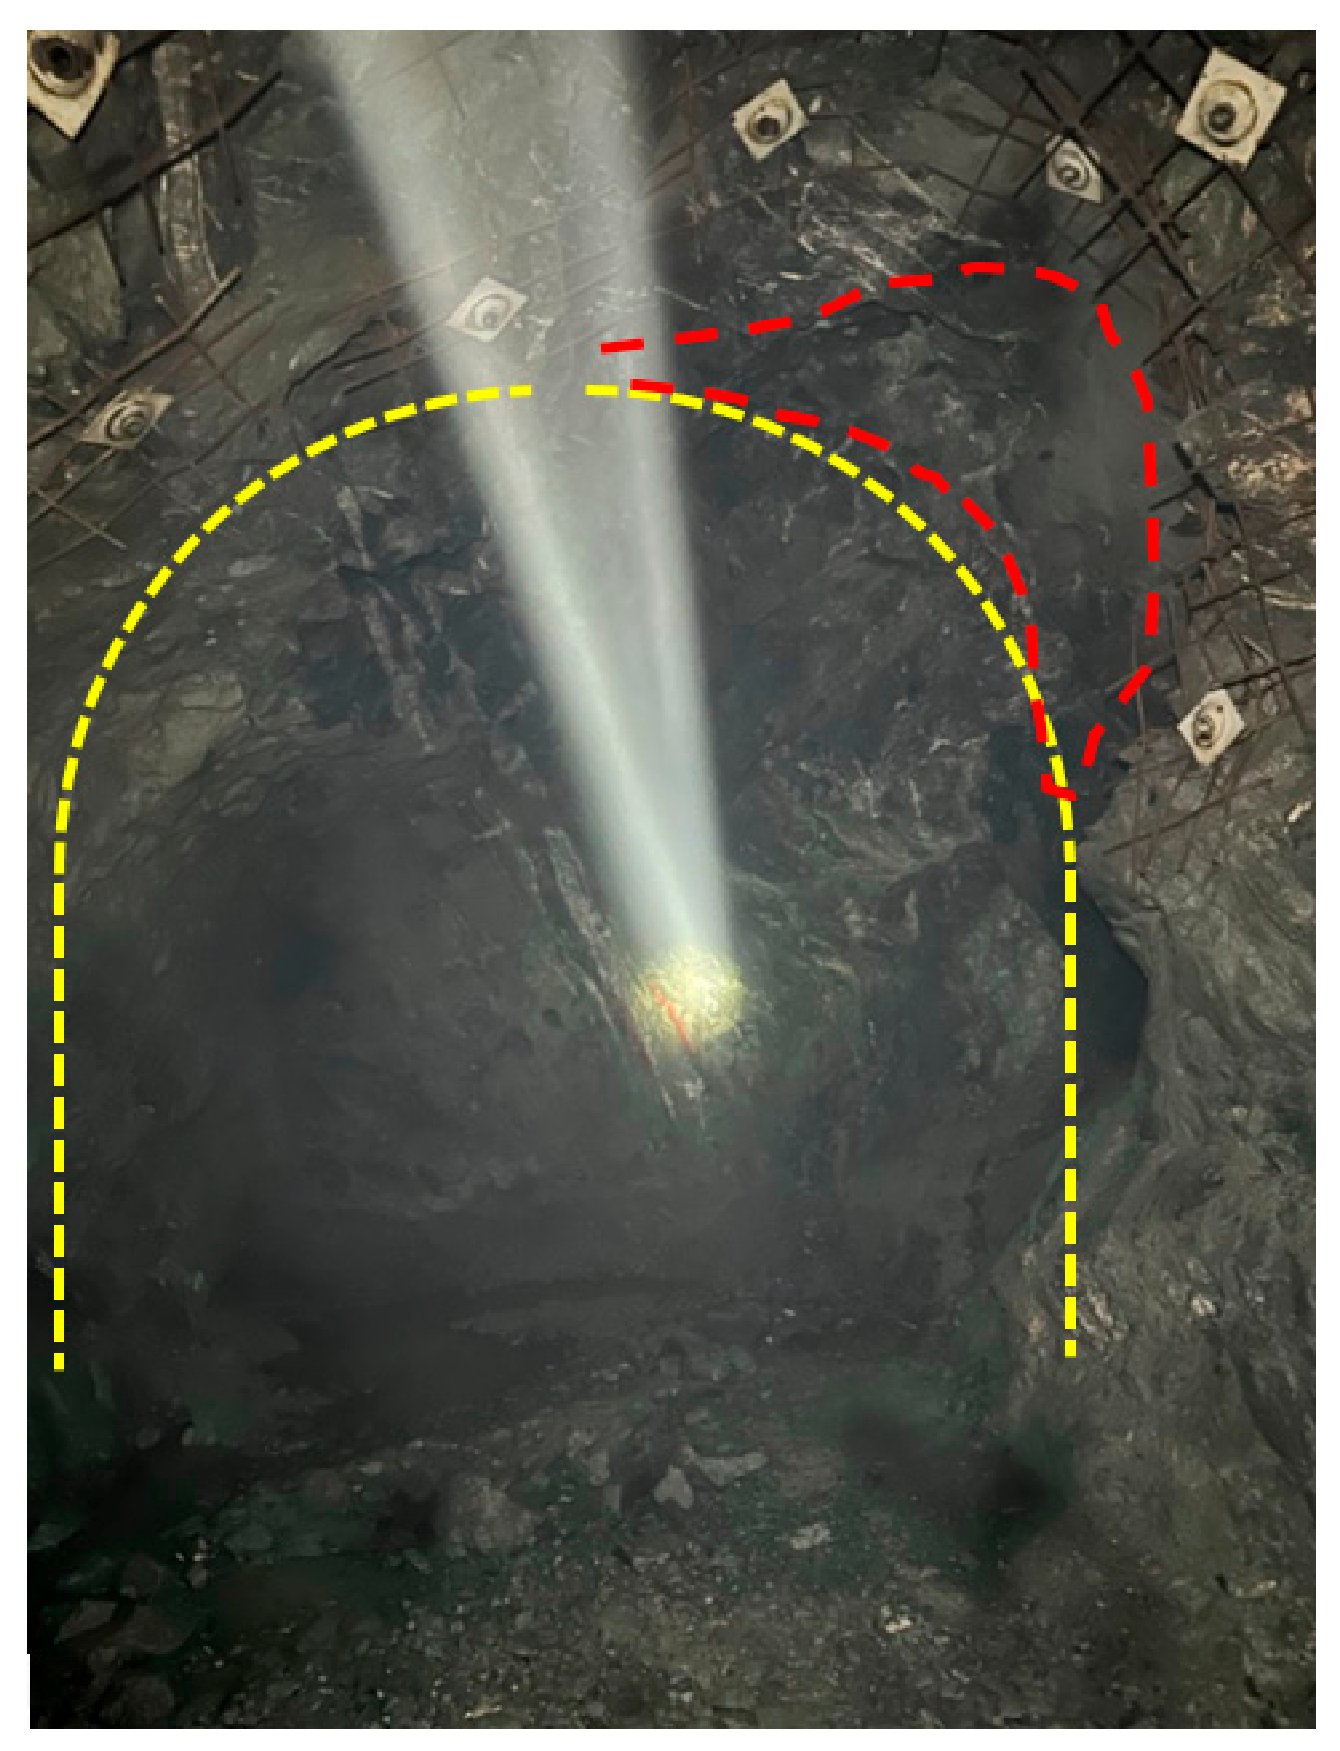
Routine geomechanical inspections conducted at the Zholymbet gold mine indicate that underground haulage drifts generally remain stable during mining operations. However, localized manifestations of ground pressure, including roof slabbing, sidewall spalling, and minor rock falls, are observed in excavations located adjacent to mined-out areas. In particular, inspection of the “Nauryz” vein roadway at the 840 m level revealed rock delamination and localized roof falls are consistently observed in excavations located adjacent to mined-out stopes. Thus, an inspection of the “Nauryz” vein roadway at the mining level of 840 m revealed that there were rock delaminations and rock falls at the roof of the excavation (
Figure 18).
Importantly, these failures remain spatially confined and do not evolve into large-scale instability of the surrounding rock mass. In engineering practice, such localized damage is successfully controlled by systematic rock bolting and welded wire mesh support. This behavior is in good qualitative agreement with the numerical results obtained in the present study for the 15 m and 20 m pillar scenarios. In both cases, the generalized Hoek–Brown model predicts fragmented yielded zones localized around excavation boundaries without the formation of a continuous failure region. Consequently, although direct quantitative validation is not yet possible, the similarity between the predicted failure mechanisms and the observed ground behavior in an operating mine provides additional confidence in the engineering realism of the proposed design recommendations.
No site-specific empirical database or documented displacement case history is currently available that would allow a quantitative benchmark of the calculated displacement magnitudes for Kenzhem. Therefore, the present comparison is restricted to the qualitative consistency of failure mechanisms rather than quantitative validation of deformation values.
4.5. Engineering Implementation of the Recommended Pillar Configuration
The 15 m inter-stope pillar should be regarded as a baseline design value for the geological and mining conditions represented in the present model. Although this configuration prevents the development of a continuous instability zone, localized yielded regions may remain near excavation boundaries; therefore, the pillar design should be combined with local support measures in sublevel drifts adjacent to mined-out stopes. Systematic rock bolting and mesh support are appropriate basic measures for controlling localized roof and sidewall damage, while the final support pattern should be adapted to actual ground conditions observed during development. The extraction sequence should be organized progressively so that the response of the surrounding rock mass can be evaluated as successive stopes are mined and the simultaneous creation of large adjacent unsupported voids is minimized. Geotechnical monitoring should include excavation convergence, visible rock-mass damage, support response, and, where possible, mining-induced stress changes. If monitoring indicates deformation or damage exceeding the expected range, contingency measures should include local support reinforcement, adjustment of the mining sequence, temporary reduction in excavation advance, and, where necessary, reconsideration of pillar dimensions in critical areas.
5. Conclusions
This study investigated the geomechanical response of the rock mass during underground extraction of the Kenzhem area of the Akbakay gold deposit using three-dimensional finite element modeling. The developed model incorporated the actual lithological structure, irregular geometry of the ore bodies, spatial arrangement of the underground workings, and the presence of mined-out stopes.
Four mining scenarios were analyzed, including complete extraction without pillars and extraction with inter-stope pillars of 10, 15, and 20 m thickness.
Complete ore extraction without leaving inter-stope pillars was found to be geomechanically unacceptable. In this scenario, the maximum total rock mass displacements reached approximately 2.6–3.0 m, while individual yielded regions coalesced into an extensive continuous instability zone propagating from the mined-out stopes toward the ground surface. The failure of the numerical solution to converge additionally indicated that the rock mass was unable to establish a stable equilibrium stress–strain state.
The introduction of a 10 m pillar reduced the maximum displacement to approximately 0.50–0.66 m and considerably limited the extent of rock mass failure. Nevertheless, partially connected yielded zones remained around the stopes, and the finite element solution did not achieve convergence. Therefore, although a 10 m pillar substantially improves the deformation response compared to the pillarless scenario, it is insufficient to ensure the long-term global stability of the excavation system under the investigated geological and mining conditions.
Increasing the pillar thickness to 15 m produced a qualitative change in the geomechanical response. The maximum total displacement decreased to approximately 0.08 m, the numerical solution converged, and the yielded zones became fragmented and localized near the excavation boundaries. These results indicate that the rock mass preserves its overall load-bearing capacity and that large-scale progressive collapse is prevented. However, localized inelastic deformation may still result in roof slabbing, sidewall spalling, or minor rock falls; therefore, systematic rock bolting, mesh support, and geotechnical monitoring should be incorporated into the mine design.
A further increase in pillar thickness from 15 to 20 m reduced the maximum displacement only slightly, from approximately 0.08 m to 0.065–0.070 m. At the same time, the geometry and extent of the yielded zones remained essentially unchanged. This saturation behavior demonstrates diminishing geomechanical returns: additional pillar thickness does not produce a proportional increase in stability but results in a larger volume of sterilized ore.
The combined interpretation of three independent criteria—maximum rock mass displacement, the extent and connectivity of yielded zones, and numerical convergence—consistently identifies a critical transition between pillar thicknesses of 10 and 15 m. Accordingly, a 15 m inter-stope pillar is recommended as the most rational design solution for the investigated area, as it represents the minimum thickness capable of preventing global instability while avoiding unnecessary ore losses. This recommendation applies to the geological, geomechanical, and mining conditions incorporated into the present model.
Accordingly, a 15 m inter-stope pillar is recommended as the most rational design solution for the representative geological, geomechanical, and mining conditions incorporated into the present model. The identified threshold should not be interpreted as a universal value, since variations in rock-mass quality, intact-rock strength, and in situ stresses may modify the local deformation and yielding response.
Because the Kenzhem area is currently at the design stage, direct quantitative validation of the numerical results against in situ measurements is not yet possible. Nevertheless, the predicted localized failure pattern for the stable scenarios is qualitatively consistent with observations from the operating Zholymbet gold mine, where local roof and sidewall damage occurs near mined-out stopes without developing into large-scale instability. Future mining operations at Kenzhem should therefore be accompanied by systematic monitoring of excavation convergence, rock mass damage, support performance, and mining-induced stress changes, allowing the numerical model and the recommended pillar dimensions to be verified and progressively recalibrated.
The predicted displacement magnitudes should therefore be regarded as model-based estimates for the adopted input conditions until field monitoring data become available during mine development.
The initial in situ stress state adopted in the numerical model was assumed to be hydrostatic (). This assumption is justified by the field hydraulic fracturing measurements at the Kenzhem site (Boreholes GTS-KZM-001, 009, and 010), where the measured horizontal stresses (, ) aligned closely with the calculated lithostatic pressure range (). Nevertheless, localized geological heterogeneities or structural features could induce regional stress anisotropy (). Under a tectonic regime (), increased horizontal compression would elevate compressive stress concentrations in the roof and floor of development workings, potentially promoting roof sagging or shear failure along bedding planes. Conversely, under a gravity-dominated regime (), stress relief in the roof would increase tension, while sidewall stress concentrations would increase, potentially accelerating rib spalling. While the hydrostatic model serves as a reliable baseline representative of the measured site conditions, evaluating non-hydrostatic stress ratios () remains an important direction for future parametric stability assessments.




 ,
,