


Abstract
The eddy covariance (EC) technique is a key tool in environmental monitoring, enabling continuous and non-invasive measurement of carbon dioxide (CO2) fluxes at the ecosystem–atmosphere interface. In environments characterized by high levels of airborne particulates, such as volcanic regions, the reliability of enclosed-path EC measurements can be compromised by frequent filter clogging, potentially affecting data continuity, and increasing maintenance requirements. This study investigates whether the chemical and mineralogical signatures of particulate matter accumulated on clogged Swagelok pre-Licor filters can be used to identify dominant particle sources and provide insights into filter clogging processes. A multi-analytical workflow combining scanning electron microscopy with energy-dispersive X-ray spectroscopy (SEM–EDS), portable Raman spectroscopy, and hyperspectral imaging (HSI) was applied to recovered filter residues. The combined approach provided complementary chemical, mineralogical, and morphological information, allowing discrimination among volcanogenic material (e.g., glass shards, crystals, and lithic fragments), aeolian lithogenic dust, including Saharan inputs, and biogenic particles such as plant fibers. The results revealed two dominant particulate groups, volcanogenic mineral phases and biogenic material, with a minor contribution from wind-transported lithogenic dust. Volcanogenic phases, enriched in Si, Al, and Fe, dominated the inorganic fraction, whereas O-, C-, and N-rich particles were mainly associated with local biogenic sources. No clear evidence of significant anthropogenic contributions was identified. These findings demonstrate that multi-analytical characterization of particles accumulated on EC pre-filters can provide qualitative source attribution and valuable information on the processes responsible for filter loading and clogging. By linking particle characteristics with meteorological and environmental conditions, this approach has the potential to support site-specific, predictive, and event-driven maintenance strategies, contributing to improved EC data quality and more efficient long-term monitoring in high-aerosol environments.
1. Introduction
Eddy covariance (EC) is a micrometeorological technique widely applied for the continuous, long-term monitoring of carbon, water, and energy turbulent fluxes at the interface between soil, vegetation, and the atmosphere, ensuring minimal disturbance to the monitored environment [1,2,3,4,5,6,7]. For this reason, EC stations have become fundamental in carbon cycle research, climate change studies, and environmental monitoring networks worldwide. However, the method relies on a set of basic restrictive assumptions, such as stationarity and homogeneity of turbulent motions, spatial homogeneity of surface properties, and neutral atmospheric stratification (or absence of stable atmospheric stratification and convection), which may limit its applicability in complex natural environments [7], especially in those that are harsh and remote, such as volcanic environments.
Within the framework of the PON-GRINT project led by INGV, an EC tower, two automated soil chambers, and one portable accumulation chamber were installed in the volcanic environment of Mt. Etna. The primary objective of this integrated infrastructure is to investigate CO2 fluxes at the soil–vegetation–atmosphere interface and to assess the relative contributions of volcanic degassing and biological respiration. This installation represents the first nucleus of a Critical Zone Observatory at Mt. Etna and is part of the IGG-CNR network of observatories in remote environments. The site offers a unique natural laboratory in which volcanic, atmospheric, and biological processes interact, often under rapidly changing environmental conditions.
The application of EC systems in volcanic and hydrothermal environments, although still relatively limited, has demonstrated significant scientific potential [8,9,10,11]. However, the deployment of EC systems in active volcanic regions introduces specific operational challenges that are less critical in temperate or forested ecosystems. Among these, the presence of high atmospheric particulate loads represents a major limiting factor for long-term data continuity.
The impact of particulate matter on EC measurements depends strongly on the system configuration. Open-path systems offer high-frequency response but are highly sensitive to aerosol interference and surface contamination [12,13]. Enclosed-path systems mitigate some of these limitations but require efficient filtration systems to prevent particulate contamination of the infrared gas analyzer (IRGA), making filter clogging a critical issue [7,14].
Mt. Etna is characterized by persistent volcanic degassing, episodic ash emissions, resuspension of pyroclastic deposits, intense aeolian transport of lithogenic dust, and periodic marine aerosol input due to its proximity to the coast. In such particle-rich environments, airborne particulate matter progressively accumulates within the air intake lines and on the pre-LICOR filters that safeguard the infrared gas analyser (IRGA). This accumulation leads to filter clogging, which may alter airflow dynamics, increase pressure gradients, compromise sampling efficiency, contaminate internal components, and ultimately generate data gaps and reduce the signal-to-noise ratio. Data interruptions may also occur when the theoretical assumptions underlying EC theory are violated or when instrument failures arise. At the Mt. Etna site, these effects are particularly evident, with interruptions in CO2 flux time series occurring on a roughly monthly basis due to filter clogging. This involves a lack of synchronization between the gas concentration signal measured by the IRGA and winds components measured by the sonic anemometer, thus severely affecting the proper EC functioning which is based on the coupling of gas concentration and vertical wind components signals.
Similar issues have been documented in other environments characterized by elevated particulate concentrations. In urban green-space ecosystems, for example, rapid filter clogging has been shown to cause underestimated fluxes, increased maintenance frequency, and contamination of EC system components [15,16]. To date, effective preventive strategies for significantly delaying filter clogging without perturbing the measured turbulent fluxes in high-aerosol environments remain limited. Scheduled and periodic filter replacement remains the only practical solution to ensure data continuity and instrument functionality, with consequent increases in operational costs and logistical complexity.
Despite its operational relevance, filter clogging is typically treated as a purely technical limitation, while the physicochemical nature and sources of the accumulated particulate matter remain poorly constrained. A key unresolved question is therefore whether the chemical, mineralogical, and morphological signatures of particles retained on EC filters can be used to identify dominant sources and provide insights into the environmental conditions affecting EC measurements.
Rather than considering filter clogging solely as a technical limitation, this study explores the potential of clogged EC filters as integrated archives of atmospheric particulate inputs accumulated over their operational lifetime. Characterizing the retained material can provide information on particle provenance and transport processes and, when combined with meteorological and volcanic observations, may help identify the conditions responsible for filter loading. This information is relevant not only for interpreting the atmospheric environment surrounding the EC station but also for developing more targeted maintenance strategies, as well as for a more accurate scientific interpretation of the experimental data collected by the EC method in environments characterized by high particulate matter concentrations. This is particularly important in digital signal processing, to better distinguish measurement anomalies from extreme events associated with real-world processes.
To address this objective, we developed a multi-analytical workflow integrating Scanning Electron Microscopy coupled with Energy-Dispersive X-ray Spectroscopy (SEM–EDS), portable Raman spectroscopy, and hyperspectral imaging (HSI). SEM–EDS was used to characterize particle morphology and elemental composition, supporting the discrimination of silicate minerals, volcanic glass, oxides, carbonates, and saline phases, and the identification of natural and anthropogenic inputs [17,18,19,20,21,22,23,24]. Portable Raman spectroscopy was employed to refine mineralogical identification beyond elemental composition, allowing discrimination of phases with similar elemental compositions but different mineralogical structures [25,26,27,28,29,30]. HSI was used to rapidly map filter surfaces and discriminate compositional domains, providing an intermediate scale of observation between bulk analysis and single-particle characterization and supporting the identification of heterogeneous volcanic, lithogenic, marine, and biogenic components [31,32].
The integration of these complementary techniques enables the combined assessment of particle morphology, elemental composition, mineralogical structure, and spectral properties, providing qualitative source attribution in a complex volcanic environment. To the best of our knowledge, this approach has not previously been applied to clogged filters from eddy covariance systems deployed in volcanic environments. By linking particulate characteristics with environmental conditions, the proposed workflow aims to provide a basis for understanding filter-clogging processes and for developing site-specific, predictive, and event-driven maintenance strategies, potentially reducing instrument downtime and improving the continuity and quality of EC measurements in high-aerosol environments. Although this study is site-specific (volcanic), the procedure could have general applicability to any EC station located at particulate-rich sites.
2. Site Characterization
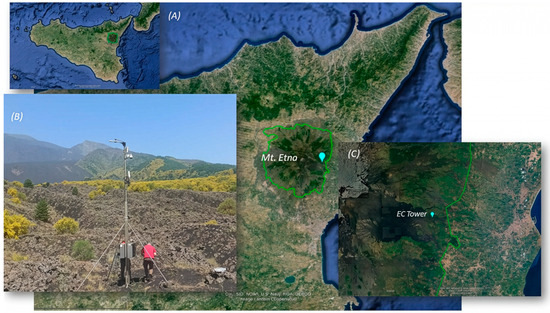
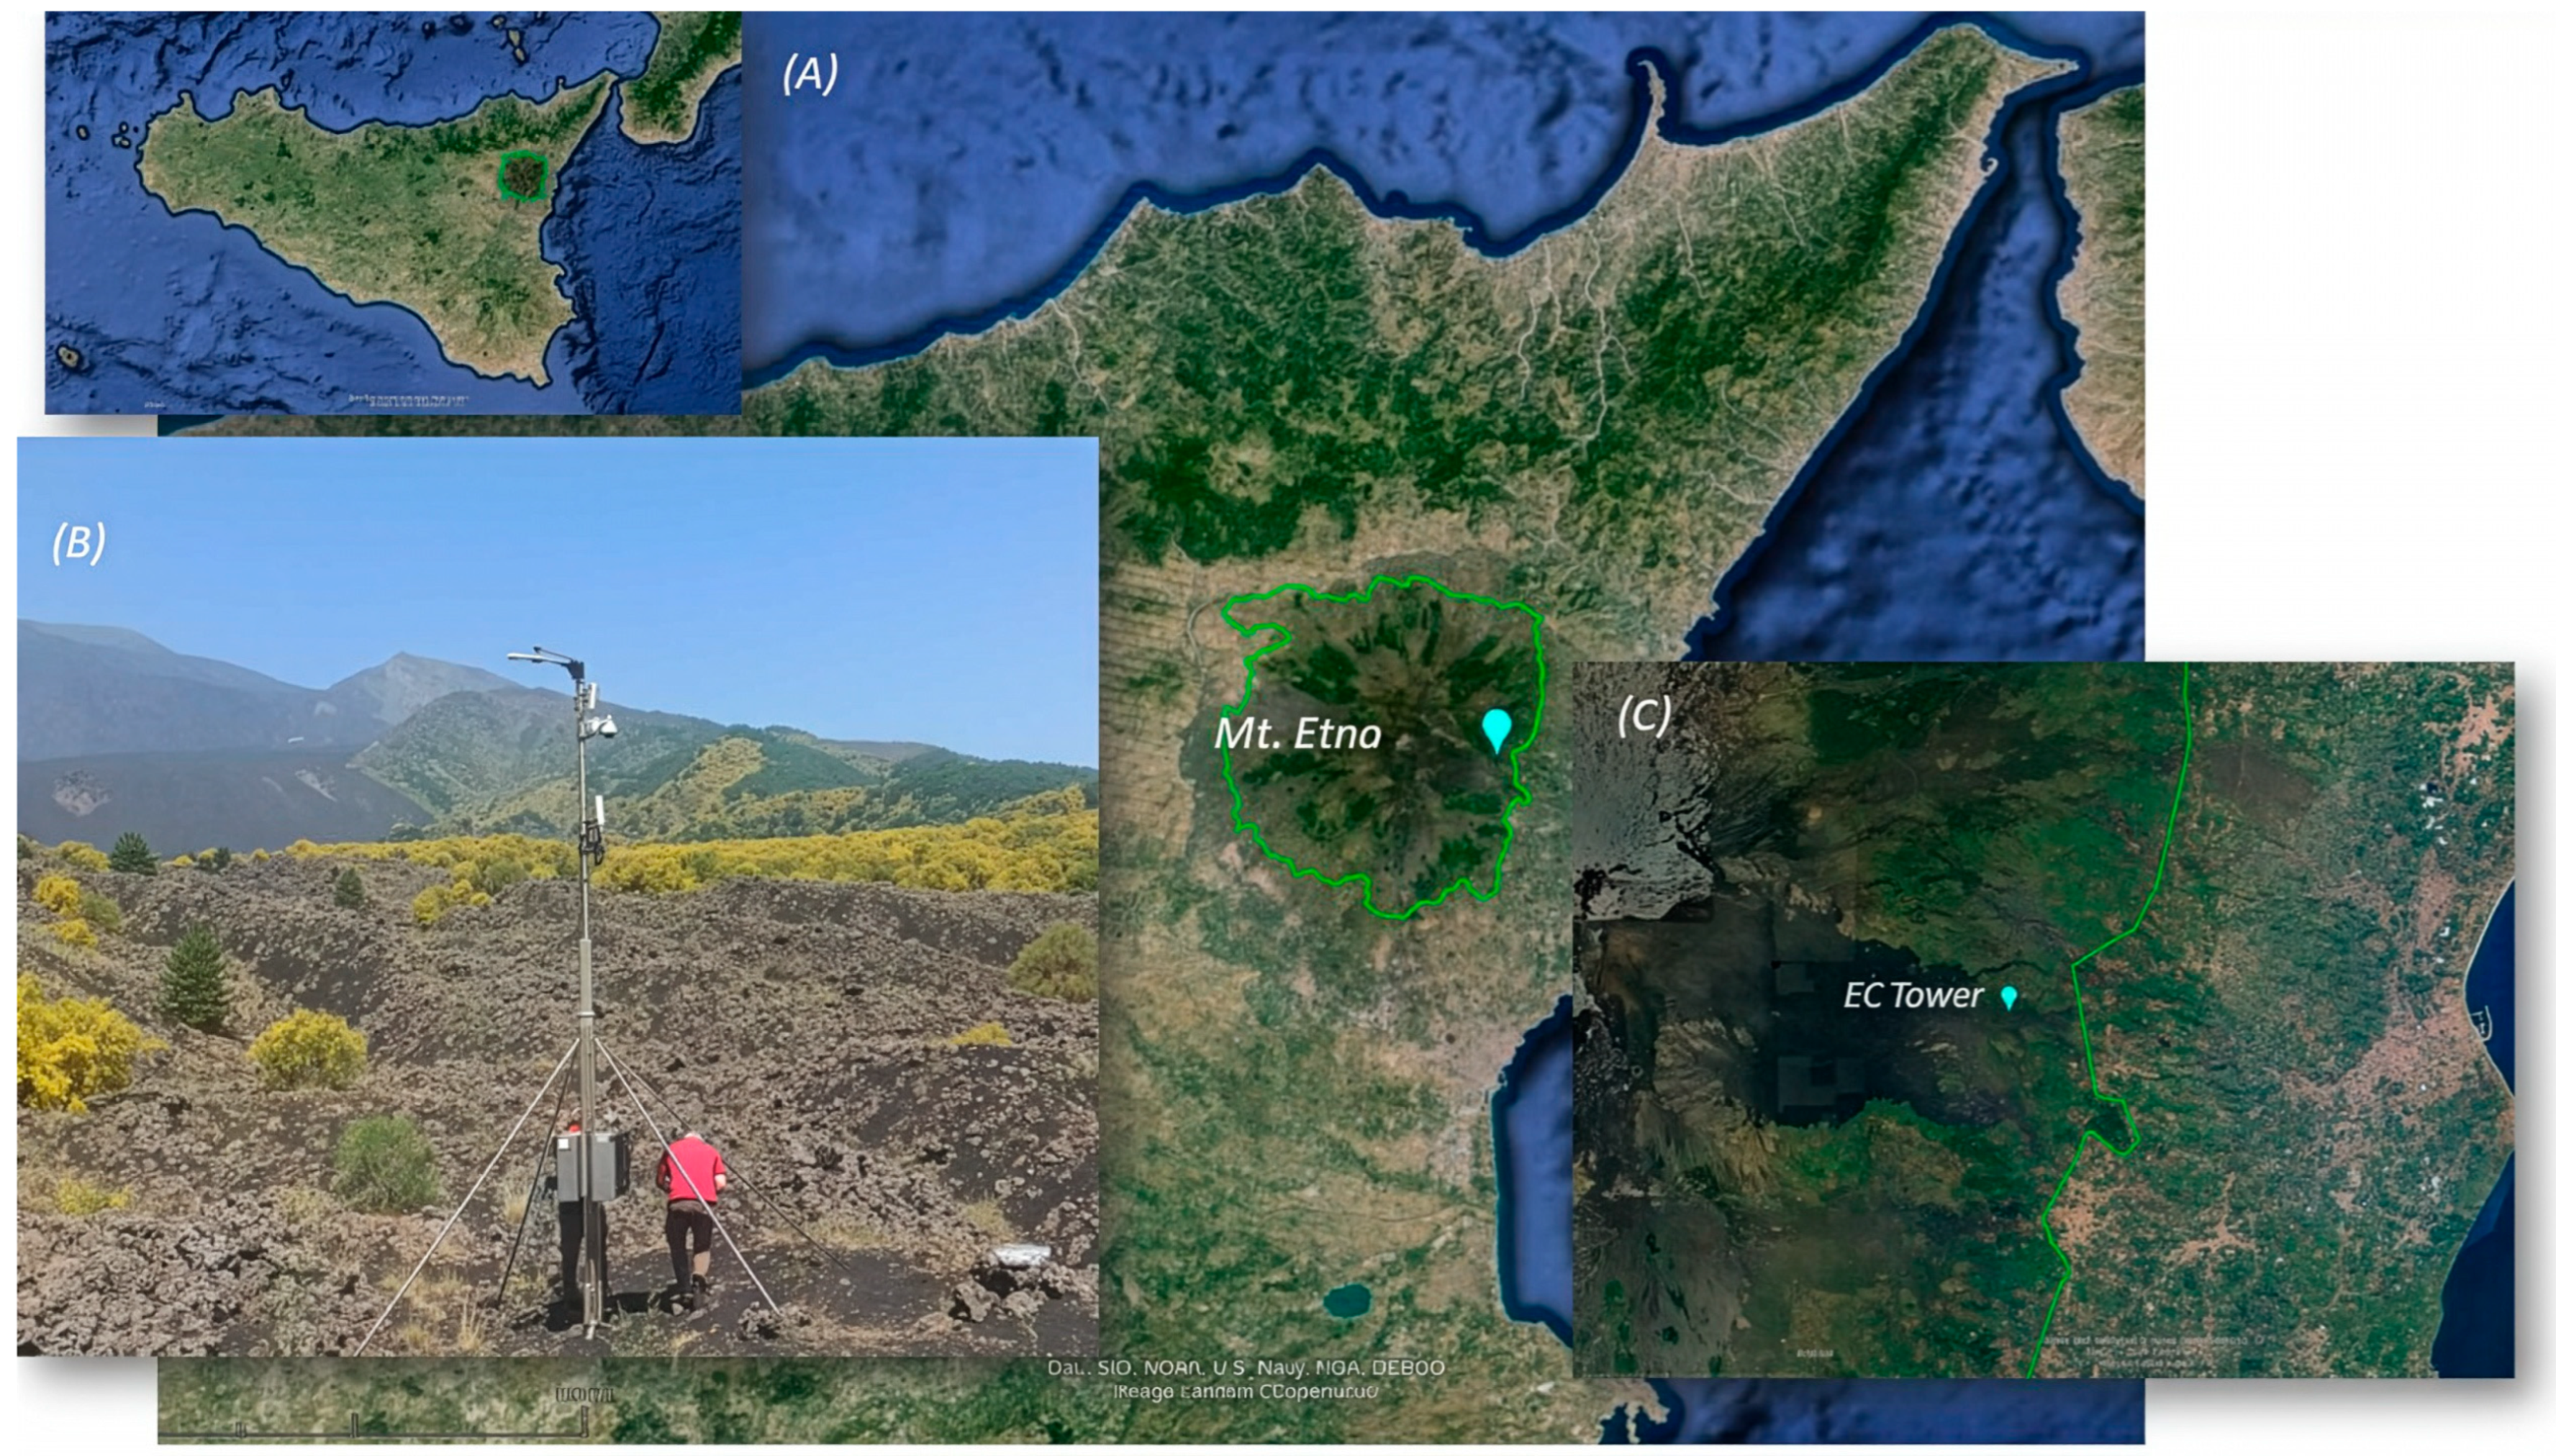
In 2022, an eddy covariance tower for the measurement of net ecosystem fluxes of CO2 and H2O was installed at 1100 m a.s.l. within the territory of Mount Etna Regional Park (Figure 1). Characterized by its remote and pristine location, the measurement site is situated far from urban settlements, industrial areas, commercial activities, and major road networks, effectively ensuring the absence of local anthropogenic contributions. The study area is managed by the Etna Park Authority and the Regional Department of Rural and territorial Development in Catania, which granted access to the study area and authorized measurement activities. Mt. Etna is a basaltic stratovolcano characterized by a complex geological evolution that began around 500 ka ago, and it is divided into four main phases [33,34,35,36,37]. Today it is one of the most active volcanoes in the world. It reaches a height of 3328 m, covers a surface of 1178 km2, and has a maximum diameter of about 45 km [34]. The recent activity consists of Strombolian explosions, lava fountains, and lava flows. The volcanic products erupted in recent times since 1971 are K-trachybasalts in composition. Over the last decades, Mt. Etna has shown a significant increase in high-energy explosive activity, especially from its summit craters. While traditionally dominated by mild Strombolian eruptions and lava effusion, the volcano has recently produced more frequent and powerful paroxysmal events, including major lava-fountaining sequences. These eruptions generated high eruptive columns, up to about 13 km, and widespread ash plumes, causing substantial tephra fallout and ash dispersion over large areas [38]. In addition, Etna’s activity is accompanied by the persistent emission of a huge volcanic plume arising from summit craters during both quiescent and eruptive magma degassing [39]. Mofettes, “mud volcanoes”, diffuse soil degassing and bubbling gases are typical natural manifestations that occur in peripheral sectors of the volcano [40]. In the area surrounding the EC tower, the topsoil consists of basaltic lapilli and ash ejected during paroxysmal events and the vegetation consists of typical Mediterranean species, with endemic Genista aetenensis and Saponaria sicula as the dominant species. Owing to this high-altitude geographical isolation within a strictly protected natural reserve, the station operates under near-background conditions, potentially unaffected by urban or industrial emissions. Data analysis of the anemometric measurements from the eddy covariance station revealed that the wind regime exhibits a typical day–night pattern with daily winds coming from Levante and Scirocco (E-SE, E and SE), the latter is a warm wind from the Sahara, bringing typical Saharan dust. At night, the prevailing winds are more aligned, coming from the direction of Ponente and Maestrale (W and W-NW) [41].
Figure 1.
(A) Location of the monitoring station at Mt. Etna; (B) eddy covariance tower; (C) zoom of the area.
3. Methods and Materials
3.1. Etna Eddy Covariance Station
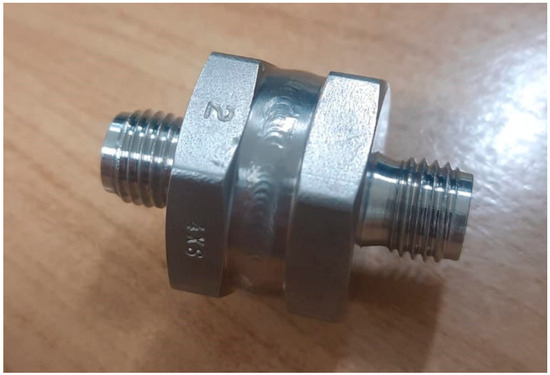
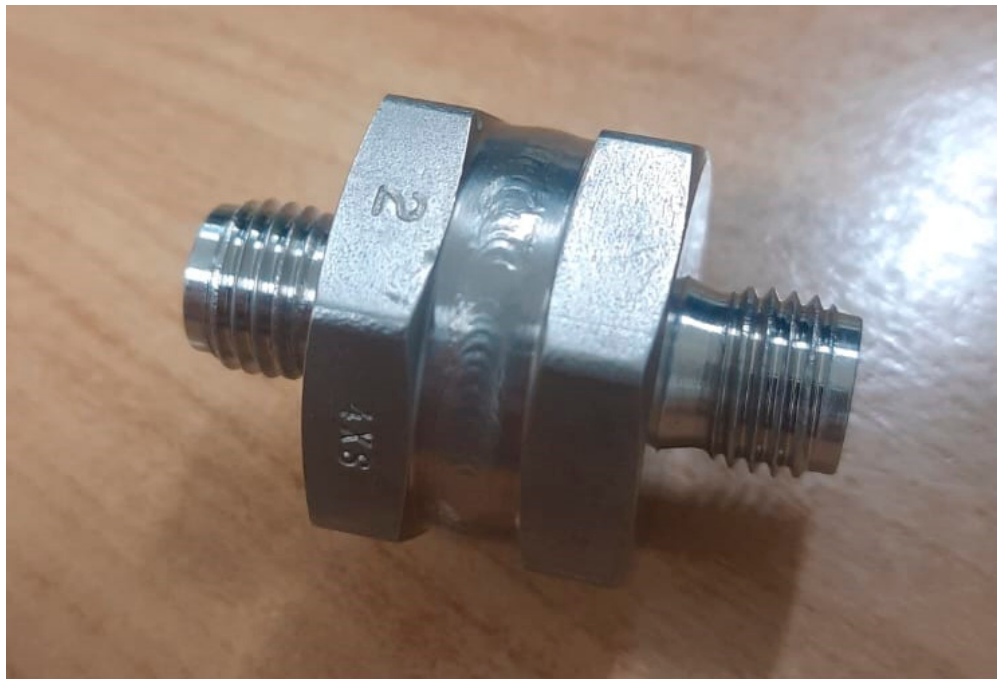
The Etna EC station is equipped with a 3-dimensional a Gill WindMaster HS-50 sonic anemometer (Gill Instruments Limited, Lymington, Hampshire, UK; serial number H193105) for the measurements of wind and turbulence parameters, and an infrared CO2 and H2O (fs = 10 Hz sampling rate) enclosed-path gas analyzer (Licor Li7200RS, software 8.9.0, Serial Number =72H-1010, ID = AIU-2240) associated with a LI-7550 Analyzer Interface Unit (AIU). The instrument software version was 3.01. The latter assures synchronous recording with the 3-dimensional sonic anemometer and provides Ethernet communication. Data are transmitted monthly by West Systems (https://www.westsystems.com/NUOVO/it/, accessed on 27 August 2026) to the servers of the Institute of Geoscience and Earth Resources of CNR. Eddy covariance turbulent fluxes are computed as 30 min averages. The EC system is equipped with a steel filter, installed immediately upstream of the LICOR analyzer to prevent the particulate contamination of the monitoring station. In our case, a Swagelok FW filter with a pore diameter of 2 µm is used (Figure 2). The fine-pore filter keeps the analyzer clean for a longer time, but clogs more quickly. In this site, maintenance is required frequently, monthly or even weekly, depending on local environmental conditions. By monitoring the eventual increase in the blower motor power value, it is possible to identify the need to replace the filter. The chronology and intensity of Mt. Etna’s volcanic activity during the filter exposure intervals were compiled using the official eruptive logs and seismic tremor data from Istituto Nazionale di Geofisica e Vulcanologia (INGV) Year 2022, 2023, and 2024. This independent database allowed us to establish a reliable and objective correlation between the atmospheric deposition captured by the clogged eddy covariance filters and the specific eruptive or degassing phases of the volcano. These data are reported in the following Table 1.
Figure 2.
Swagelok FW filter with a pore diameter of 2 µm.
Table 1.
Geochemical correlation between Mt. Etna volcanic activity and filter wash appearance (2022–2024) in the 11 samples analyzed.
3.2. Recovery of Particulate from Filter
The Swagelok FW-2 µm filter can be cleaned and utilized numerous times. The cleaning operation allows for the collection of filter particulate. We follow the cleaning recommended by Licor [42], which involves the following steps (Figure 3):
- First flush filter with distilled water pumped in the reverse flow direction;
- Repeat the flush several times until the water that flows out is clear;
- Place the filter in an ultrasonic bath filled with distilled water. Leave in the bath for about 25 min at maximum power;
- Flush the filter again with distilled water in the reverse flow direction;
- Use clean compressed air to blow out the particulate possibly left inside the filter, in the reverse flow direction (at pressures below 5 bar);
- Dry in the oven overnight at 50 °C.
Figure 3.
Sample preparation steps for analysis.
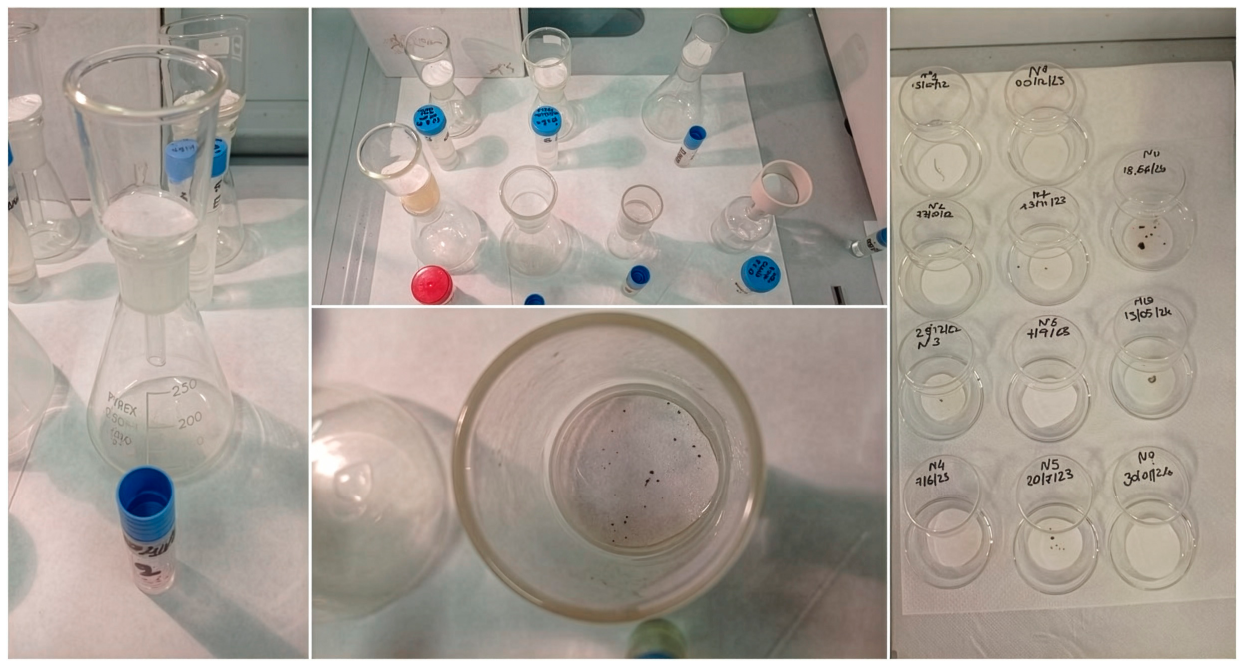
The MIFT department of the University of Messina provides equipment from the Geochemistry and Mineralogy laboratory to clean the filter.
The water flushed from the filter and collected in step 1, in which the highest number of particles is concentrated, is regularly treated and analyzed by the working group of the Institute for Chemical and Physical Processes (IPCF, Messina, Italy) and Institute for Advanced Energy Technologies ‘Nicola Giordano’ (ITAE, Messina, Italy) of CNR, after sample preparation.
The analyzed particulate corresponds to a period of sampling that represents roughly the entire season from October 2022 to June 2024 (Table 2).
Table 2.
Samples details: sampling date and appearance description of the residues recovered from filter washing.
3.3. Sample Preparation for Analysis
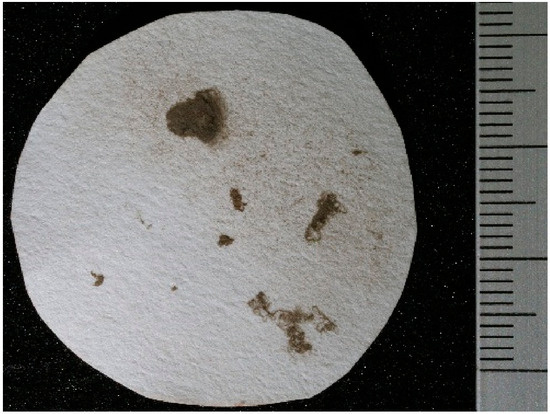
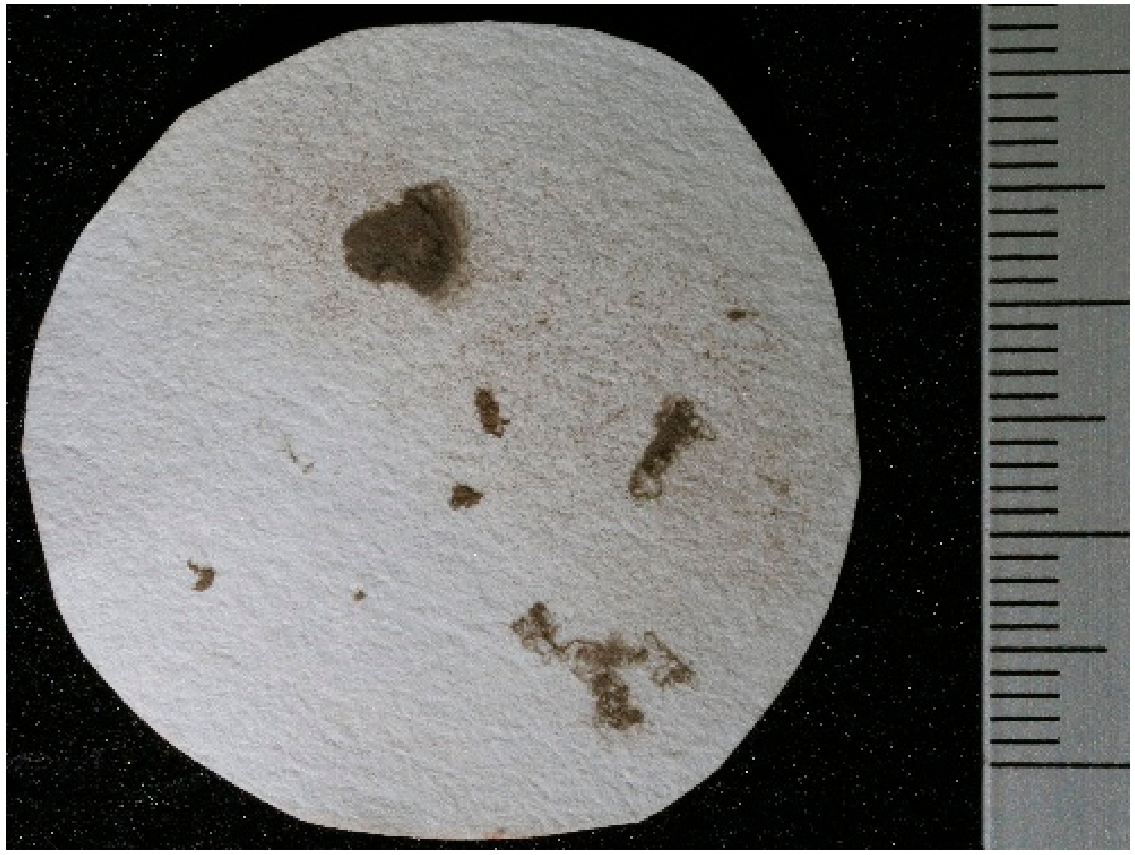
The water obtained from the filter washing was collected in 50 mL polyethylene test tubes. Prior to analysis, the collected water was passed through a porous septum funnel equipped with a paper filter (Whatman, grade 5, 45 mm circle) to capture the suspended/insoluble particles (Figure 4). Instead, the soluble fraction is considered negligible because it is not believed to be responsible for filter clogging.
Figure 4.
Sample 1 after filtration with Whatman paper filter.
Paper, as a flexible substrate support material, is particularly advantageous due to its low-cost, easy preparation, and environmental friendliness. The filtered samples were stored in glass dish containers, dried in air, and then investigated with different analyses.
As indicated in Table 1, which reports sample details and the residues recovered from filter washing, detectable residues were identified in six filters. Each of these exhibits distinct morphological and physicochemical features, which are described in detail in the following sections. Particles with different features were observed and classified as: (1) coarse and large particles (up to 30 µm) of angular shape; (2) clusters of incrustations and unshaped minerals; (3) globular shaped particles; and (4) filamentary structures.
3.4. Workflow for the Morphological and Physicochemical Characterization of Samples
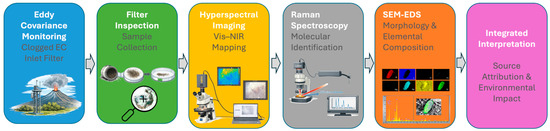
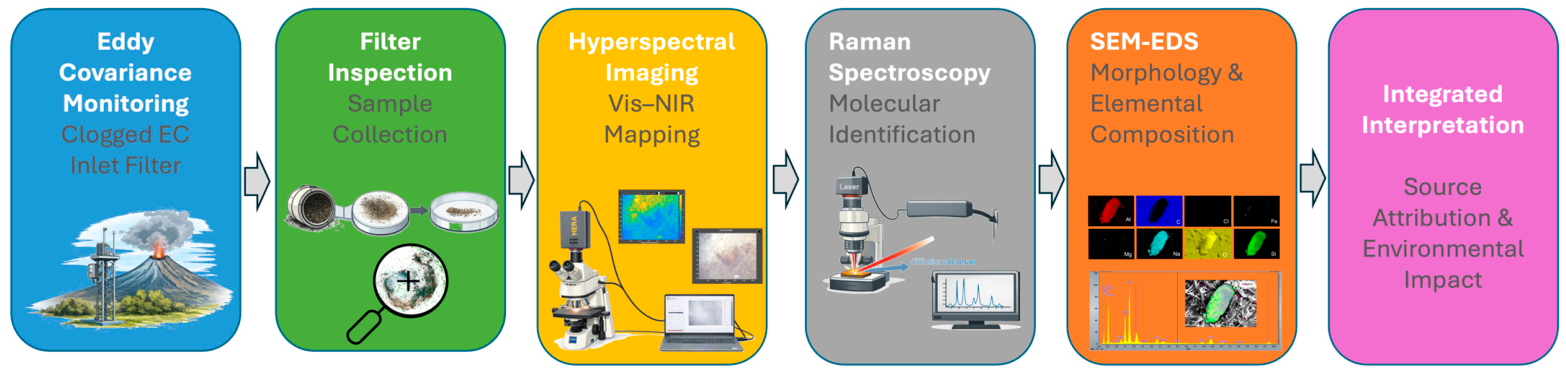
All filter-wash residues collected over the monitoring period (Figure 5) were examined using a stepwise analytical strategy designed to move from non-destructive, spatially resolved screening to targeted molecular and elemental microanalysis (Figure 5). The analysis integrated complementary morphological and physicochemical methods that were applied either systematically to all samples or selectively to representative residues and regions of interest (ROIs), depending on particulate abundance and heterogeneity. This strategy was based on three main considerations: (1) the particulate load is intrinsically heterogeneous and unevenly distributed within the fibrous matrix; (2) the paper substrate contributes a strong background signal that can mask weak particle signatures; (3) more invasive analyses were performed only after representative ROIs had been identified. Therefore, samples were first inspected by optical microscopy to document particle morphologies and distribution patterns, and then inspected by hyperspectral imaging to map compositional variability and guide ROI selection. Subsequently, Raman spectroscopy was used for molecular identification of selected targets, while SEM–EDS provided high-resolution morphology and elemental confirmation of mineral, salt, and mixed assemblages. This macro-to-micro sequence maximizes interpretability and analytical efficiency, while preserving sample integrity and enabling and supporting its application in long-term monitoring activities.
Figure 5.
Schematic overview of the stepwise analytical workflow adopted for the characterization of particulate residues recovered from clogged EC filters: from filter inspection and sample preparation to optical microscopy, hyperspectral imaging, Raman spectroscopy, SEM–EDS analysis, and integrated interpretation for source attribution and environmental assessment.
3.4.1. Optical Microscopy
Optical microscopy was employed as a preliminary screening technique for the identification and selection of coarse particles retained on the filters. Observations were performed at different magnifications using a Axioskop 2 optical microscope (Carl Zeiss, Oberkochen, Germany), equipped with an external digital color camera (SCC-833 P Low Light, Samsung Techwin Co., Ltd., Changwon, Republic of Korea). The acquired images provide detailed information on particle morphology and surface texture, enabling the recognition of macroscopic heterogeneities and guiding the subsequent application of higher-resolution and spectroscopic analyses.
3.4.2. Hyperspectral Imaging
Hyperspectral imaging was applied to a representative subset of samples to investigate the spectral properties of particulate residues at the microscale. Measurements were carried out using a VIS–NIR hyperspectral camera (HERA VNIR, 400–1000 nm; NIREOS S.r.l., Milano, Italy) mounted on the microscope described above through a dedicated adapter, ensuring proper alignment and efficient light collection from the sample surface. The analysis is based on the acquisition and interpretation of reflectance spectra extracted from hyperspectral data cubes, allowing the discrimination between different classes of materials (e.g., mineral particles, volcanic fragments, and organic components) and their differentiation from the supporting substrate.
The HERA hyperspectral camera operates according to a Fourier-transform (FT) imaging approach and employs a staring acquisition mode, enabling the simultaneous capture of spatial and spectral information without mechanical scanning or relative movement between the camera and the sample. This configuration ensures high spatial–spectral resolution and enhanced sensitivity under low-light illumination conditions, while maintaining full compatibility with microscopic imaging workflows, making the system particularly suitable for the analysis of heterogeneous particulate samples [43].
Hyperspectral data were acquired under controlled visible illumination over the spectral range of 400–1000 nm. Raw datacubes were corrected by white and dark reference calibration to obtain reflectance data. Subsequent processing and spectral analysis were performed using the HERA Analysis App 4 software (NIREOS S.r.l., Milan, Italy), including extraction and visualization of single-pixel spectral profiles and application of the Spectral Angle Mapper (SAM) classification algorithm. Reference spectra for SAM classification were extracted from manually selected pixels representative of the cellulose substrate and of the visually distinct particles, and the resulting similarity maps were used to define the regions of interest subsequently submitted to Raman and SEM–EDS analysis. Because the classification expresses spectral similarity to a reference spectrum, its output is treated throughout as a compositional partition and not as a mineralogical identification.
3.4.3. Raman Spectroscopy
Raman spectroscopy was used as a non-destructive analytical technique that enables molecular and mineralogical identification through the detection of characteristic vibrational modes. Within the multi-analytical workflow adopted in this study, Raman analysis provides information complementary to SEM–EDS, facilitating the discrimination of specific crystalline phases and carbonaceous materials and supports source attribution where elemental data alone were not sufficiently diagnostic. In particular, Raman measurements assist in distinguishing volcanogenic assemblages from lithogenic dust and in identifying carbon-based residues (e.g., amorphous carbon) within the filter-trapped particulate matter [44,45,46].
Raman spectra were first acquired using the BRAVO™ handheld Raman spectrometer (Bruker Optik GmbH, Ettlinger, Germany), selected for rapid screening of heterogeneous residues on paper substrates and for its robustness under conditions prone to fluorescence. The BRAVO system employs a dual-laser (DuoLaser™) configuration at 785 nm and 853 nm, providing broad spectral coverage (approximately 300–3200 cm−1) with a typical spectral resolution of 10–12 cm−1. In addition, the patented SSE™ (Sequentially Shifted Excitation) approach mitigates fluorescence by introducing small excitation wavelength shifts (via controlled diode temperature changes) and computationally separating the Raman contribution from the fluorescent background, thereby improving the interpretability of spectra collected from complex matrices.
Acquisitions were performed using optimized automatic parameters, with laser power, integration time, and number of accumulations automatically adjusted by the system according to the spectral response of the analyzed area. Data processing was performed with OPUS software v. 7.7 (Bruker Optik GmbH, Ettlingen, Germany).
Raman analyses were also performed on selected individual particles and aggregates using a LabRAM HR800 micro-Raman spectrometer (Horiba Jobin Yvon, Villeneuve d’Ascq, France). Spectra were excited with the 632.8 nm line of a He–Ne laser, using a 600 lines/mm grating and providing a spectral resolution of approximately 2 cm−1 over the 100–3000 cm−1 acquisition range. The excitation beam was focused onto the sample through a 100× long-working-distance objective. Laser power at the sample was attenuated to approximately 0.5 mW by means of a neutral-density filter (10–15% transmission) in order to prevent thermal degradation; the absence of sample damage was verified by inspecting the analyzed spot before and after each acquisition and by checking spectral reproducibility on repeated acquisitions. Each spectrum was collected with an integration time of 10 s and five accumulations, for a total acquisition time of 50 s per point. The scattered radiation was detected by a Peltier-cooled Synapse CCD detector. Calibration was performed daily against the band of a silicon wafer. Spectra were baseline-corrected and normalized with respect to acquisition time and laser power. The microscope-coupled configuration enables high spatial resolution measurements on individual grains and aggregates trapped among cellulose fibers.
3.4.4. Scanning Electron Microscopy (SEM)
Particle morphology and elemental composition were investigated using a Helios 5 UC dual-beam scanning electron microscope (Thermo Fisher Scientific, Waltham, MA, USA) equipped with an energy-dispersive X-ray spectroscopy (EDS) detector. Prior to analysis, the samples were sputter-coated with a thin gold layer to minimize charging effects caused by the insulating cellulose filter substrate. SEM micrographs were acquired in secondary electron (SE) mode using accelerating voltages ranging from 18 to 25 kV and beam currents ranging from 13 pA to 0.80 nA, depending on the imaging conditions and magnification. Elemental maps were obtained by EDS analysis.
4. Results and Discussion
4.1. Optical Microscopy: Particle Distribution and First-Order Morphological Classes
All samples listed in Table 1, corresponding to the sampling events carried out over the investigated period, were analyzed according to the previously described workflow, with particular attention to residues showing distinct morphologies and, where possible, different physicochemical characteristics. It should be noted that particulate matter in this work was recovered through aqueous washing of the filters, which likely resulted in the partial or complete removal of highly soluble components. Consequently, the analytical results are inherently biased toward the insoluble or weakly soluble fraction of particulate matter, while contributions from soluble aerosol species, including marine-derived salts, may be underrepresented.
Optical microscopy revealed that the residues are embedded in a highly porous cellulose network, where particles are mechanically trapped between fibers and locally concentrated in micro-aggregates.
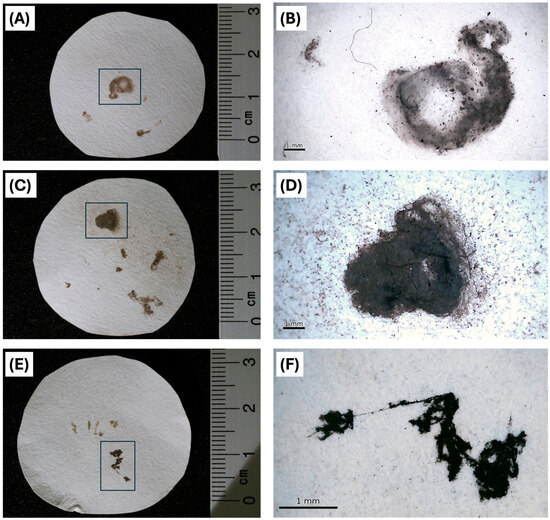
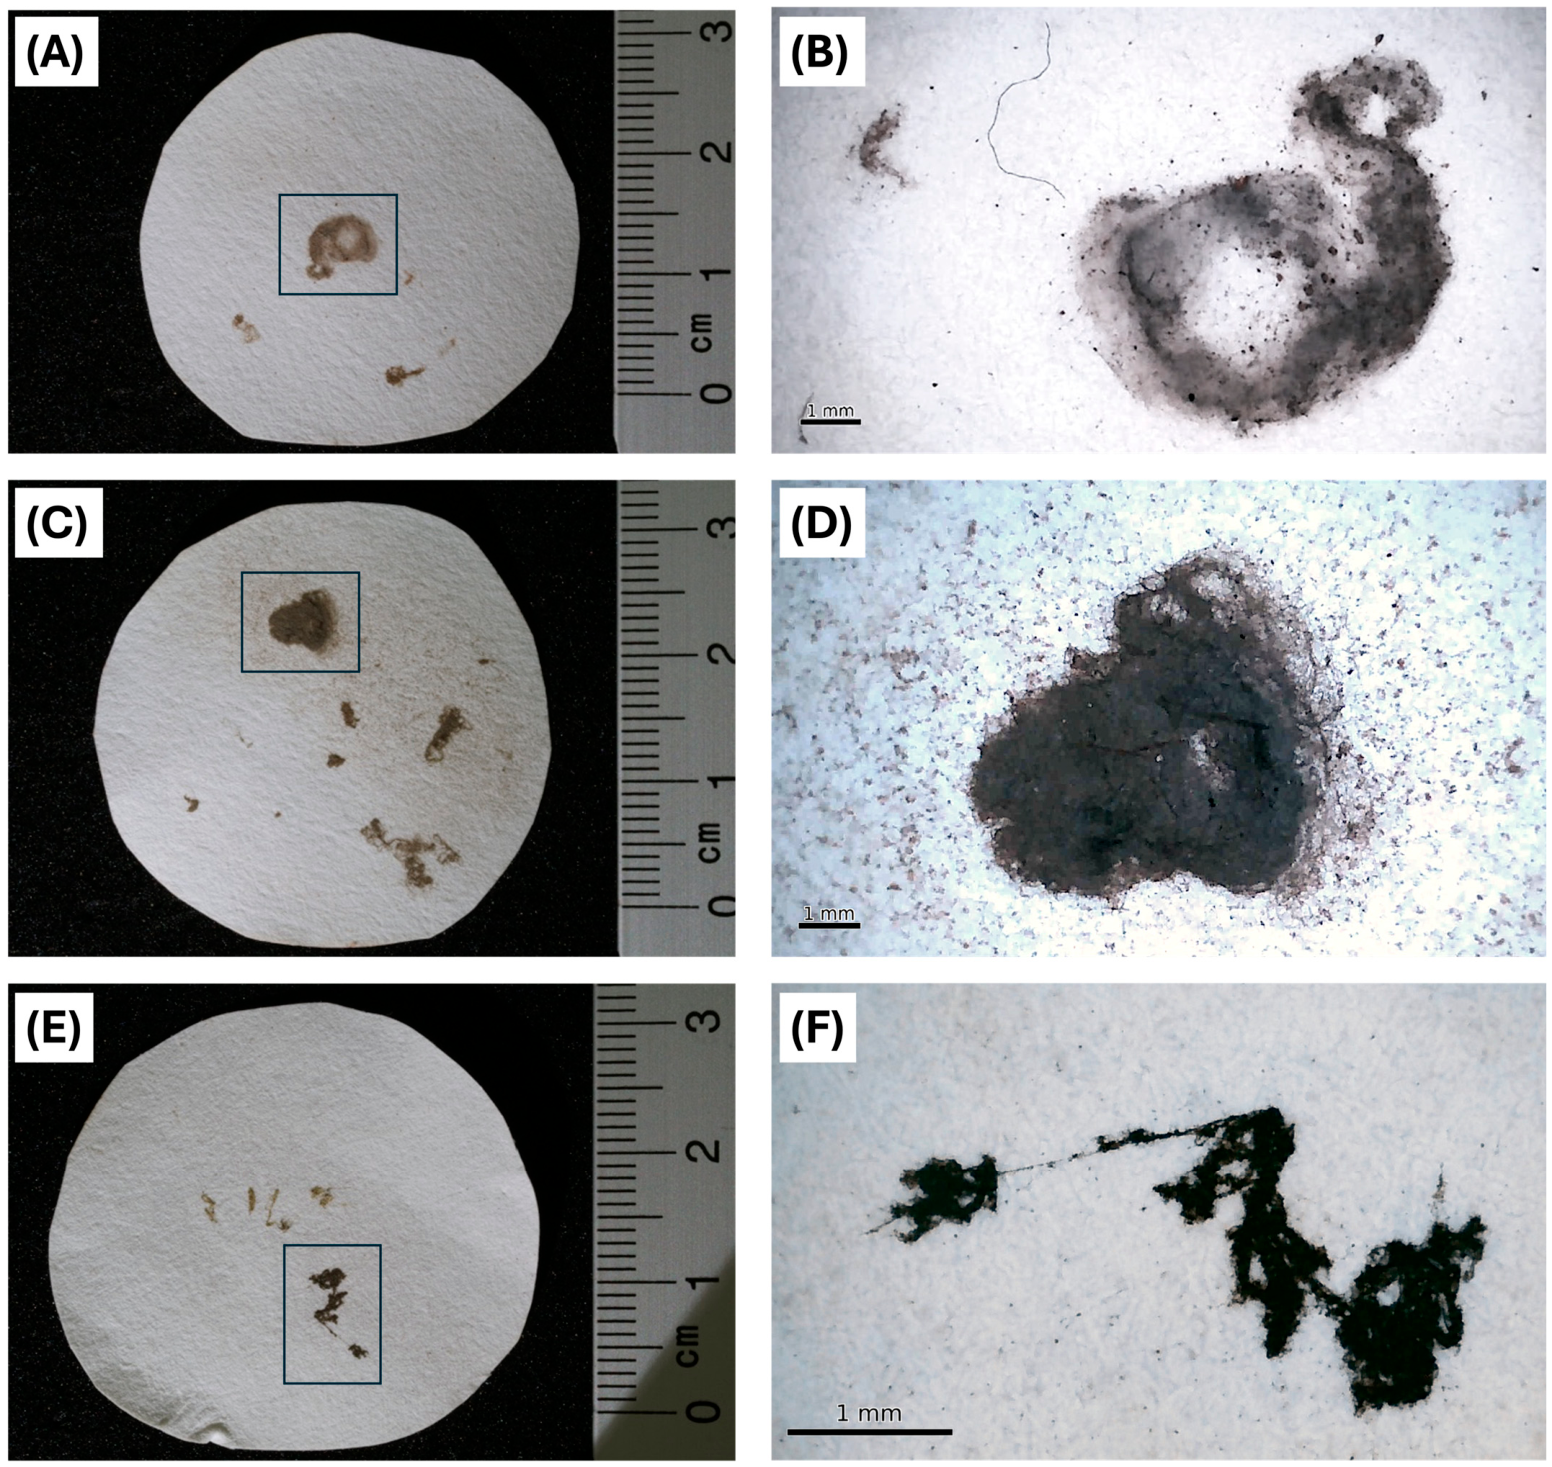
As representative examples of the microscopic investigation, three images are presented (Figure 6), each corresponding to representative samples of the residues found. It is evident that, at this level of analysis, optical microscopy mainly allows a preliminary morphological discrimination between the cellulose substrate and the retained exogenous particulate matter, rather than a definitive compositional identification. Microscopic details of all 11 samples reported reveal the presence of black particles, likely inorganic or carbonaceous, interspersed among the filter paper fibers. Their small size and distribution suggest that they were transported in suspension and subsequently trapped within the fibrous matrix.
Figure 6.
Optical micrographs of filter-wash residues. (A,B) Sample 10; (C,D) sample 1; (E,F) sample 5. (A,C,E) Whole filter areas showing the overall distribution of the recovered residues; (B,D,F) higher-magnification details in which fine dark particles are distributed among the fibers of the filter paper, together with larger irregular grains and aggregates within the cellulose network (scale bars correspond to 1 mm).
Alongside the black particles, larger irregularly shaped particles are also visible, particularly under higher magnification. These particles show varied morphologies, indicating the presence of multiple material types, possibly including mineral fragments, organic debris, or volcanic ash. Some of the particles appear to be aggregated, forming clusters, which could indicate local accumulation and/or adhesion between different materials in the sample.
4.2. Hyperspectral Imaging Characterization
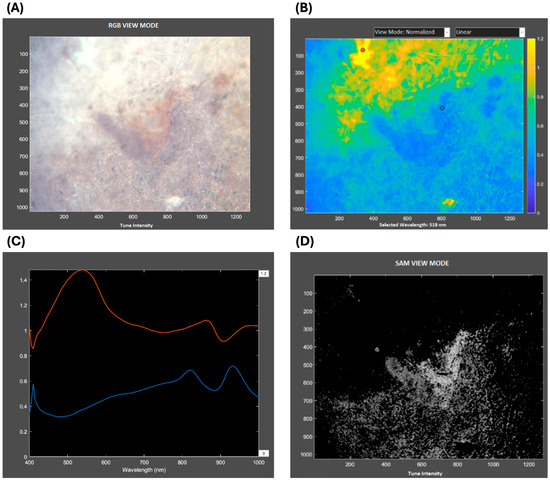
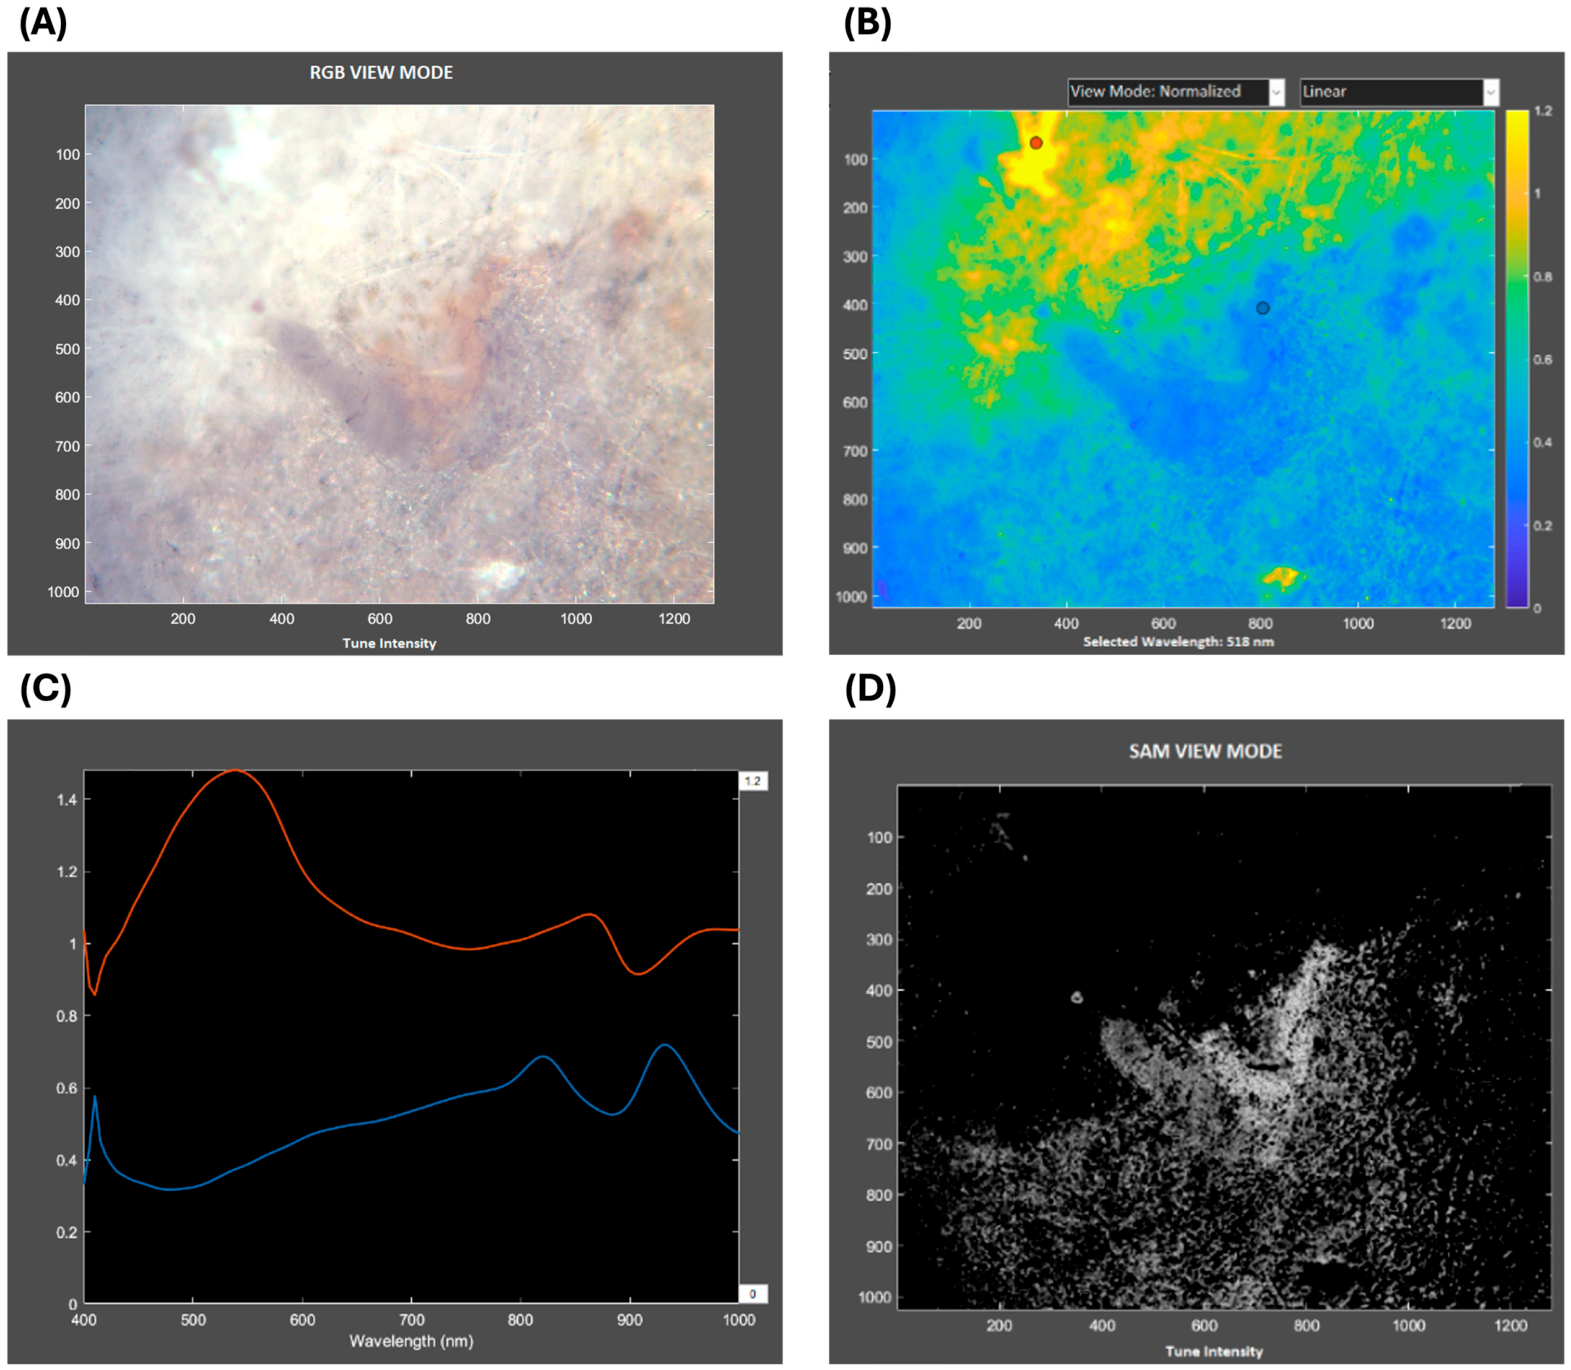
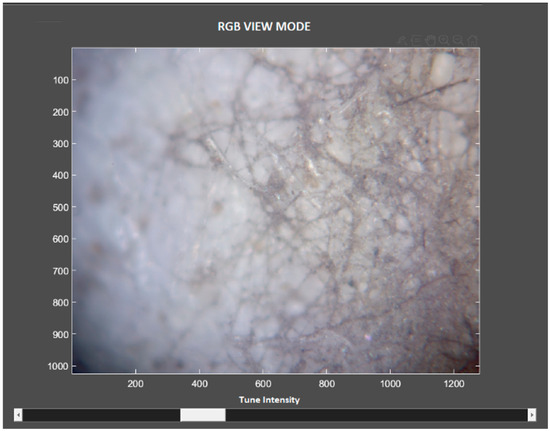
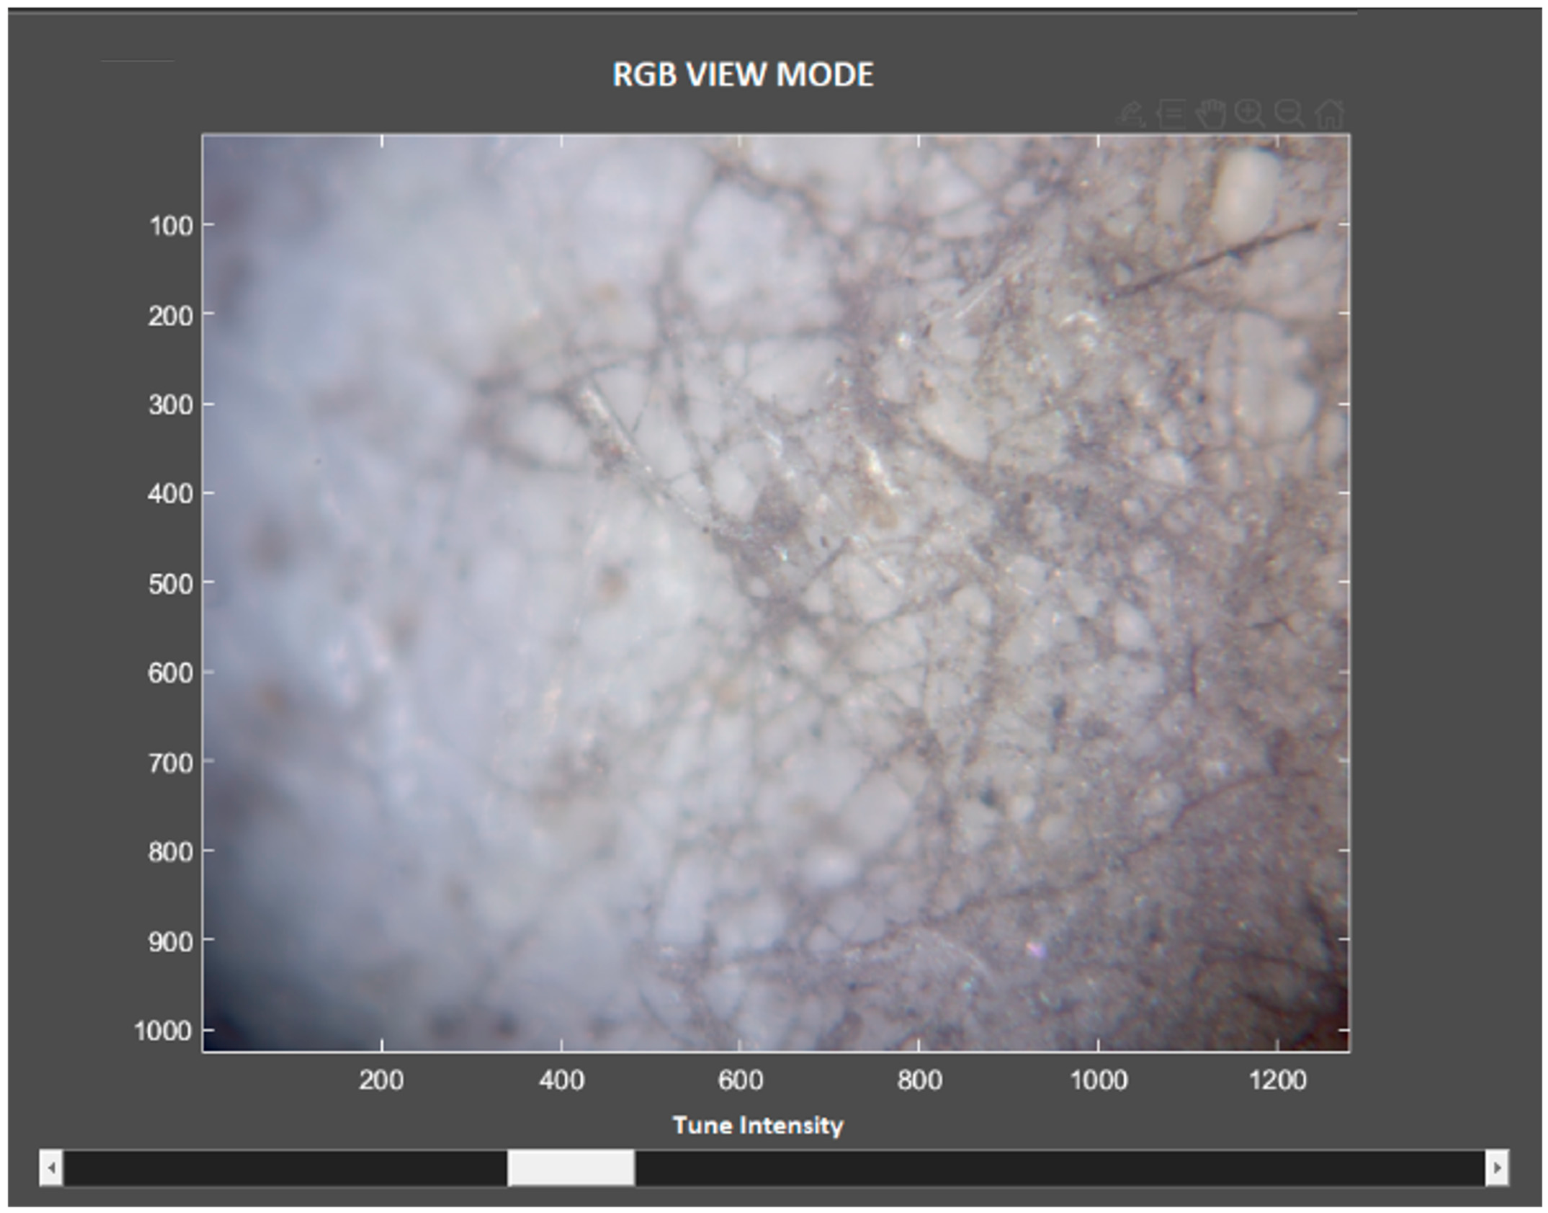
Among the analyzed filters, sample 10, collected in May, displayed the most pronounced differences in the morphology and appearance of particle aggregates under optical microscopy (Figure 7A), making it a suitable case for subsequent analyses aimed at discriminating volcanic ash from other entrapped particles. Hyperspectral imaging was combined with optical microscopy to map the spatial distribution of spectrally distinguishable materials across the filter surface and to define regions of interest (ROIs) for subsequent Raman and SEM–EDS analyses according to reproducible spectral criteria rather than visual judgement alone. Using specific algorithms, a visual mapping of the sample was performed, allowing different particle populations to be distinguished on the basis of their spectral characteristics. The false-color image in Figure 7B represents the same portion of the filter observed in RGB, acquired with a hyperspectral camera at 518 nm. The color scale highlights differences in reflectance between the cellulose substrate and the particles, with yellow/red areas corresponding to higher reflectance and blue/violet areas to lower reflectance. These spectral differences reflect variations in the optical properties of the materials and provide a basis for subsequent characterization by complementary techniques such as Raman spectroscopy. In Figure 7B, the red and blue points indicate two selected areas of interest for spectral comparison. The red curve in Figure 7C represents the reflectance spectrum of the filter substrate, whereas the blue curve corresponds to a red–brown particle. The latter shows relatively low reflectance in the blue–green region, an absorption feature at approximately 480–500 nm and a progressive increase towards the near-infrared, producing a spectral profile compatible with ferric-iron-bearing phases such as Fe-oxides and oxy-hydroxides, although this spectral behavior alone does not constitute a definitive mineralogical identification. To map the distribution of pixels spectrally similar to the selected red–brown particle, the Spectral Angular Mapper (SAM) algorithm was applied (Figure 7D). The brightest pixels indicate the highest spectral similarity to the reference spectrum, whereas black pixels correspond predominantly to the cellulose substrate; intermediate grey levels represent particles with spectra distinct from both the reference particle and the paper. The resulting classification demonstrates that HSI can resolve spectral populations that are not readily distinguishable by optical microscopy, where particles are primarily differentiated according to color, brightness, and morphology, and can therefore provide a more objective basis for selecting analytical targets. At the same time, the SAM output should be interpreted as a map of spectral similarity rather than as a mineralogical classification. The spatial distribution obtained from the hyperspectral data was subsequently used to focus point analyses on compositionally meaningful areas, reducing the need for extensive random or visually selected Raman and SEM–EDS measurements. This is particularly relevant for SEM–EDS, which requires sputter-coating and therefore alters the sample surface, whereas HSI is rapid, full-field, and strictly non-invasive and can consequently be positioned at the beginning of the analytical sequence. The macro-to-micro workflow adopted here is therefore dictated by the increasing analytical specificity and degree of sample alteration associated with the different techniques. Nevertheless, the micro-hyperspectral configuration presents an important limitation for the finest particulate fraction: when particles are smaller than, or comparable to, the dimensions of the filter-paper fibers, individual pixels may contain a mixture of particle and cellulose signals, reducing the spectral contrast and preventing unambiguous characterization (Figure 8). HSI should therefore be regarded primarily as a screening and targeting technique rather than as a stand-alone identification method. Within the present workflow, its main added value lies in providing a rapid, reproducible, and non-invasive full-field assessment of the residue, enabling the spatially targeted use of slower and partly destructive techniques and offering a potentially scalable approach for the characterization of the larger number of clogged filters generated by a continuously operating EC station.
Figure 7.
Representative hyperspectral imaging results for sample 10. (A) Calculated RGB detail of sample 10 reconstructed from the hyperspectral datacube; (B) hyperspectral image of sample 10 at 518 nm, in which the color scale encodes reflectance intensity, with yellow and red corresponding to higher reflectance and blue and violet to lower reflectance; (C) reflectance spectra extracted from two different points of sample 10 in the 400–1000 nm range, where the red curve corresponds to the filter substrate and the blue curve to a representative red–brown particle; (D) Spectral Angle Mapper (SAM) similarity map obtained for sample 10 using the spectrum of the red–brown particle as reference, in which the brightest pixels indicate the highest spectral similarity to the reference spectrum, black pixels correspond predominantly to the cellulose substrate, and intermediate grey levels represent particles whose spectra differ from both the reference particle and the paper.
Figure 8.
RGB image of a portion of sample 10 processed from the hyperspectral datacube: the black particles are smaller than the filter-paper fibers, a condition that likely contributes to spectral mixing effects and limits the unambiguous characterization of the finest particulate fraction by micro-hyperspectral imaging.
4.3. Raman Spectroscopy Analysis
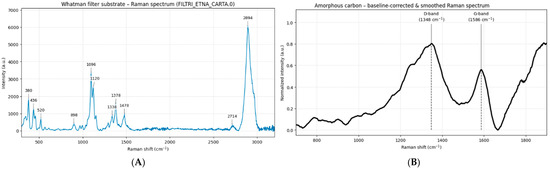
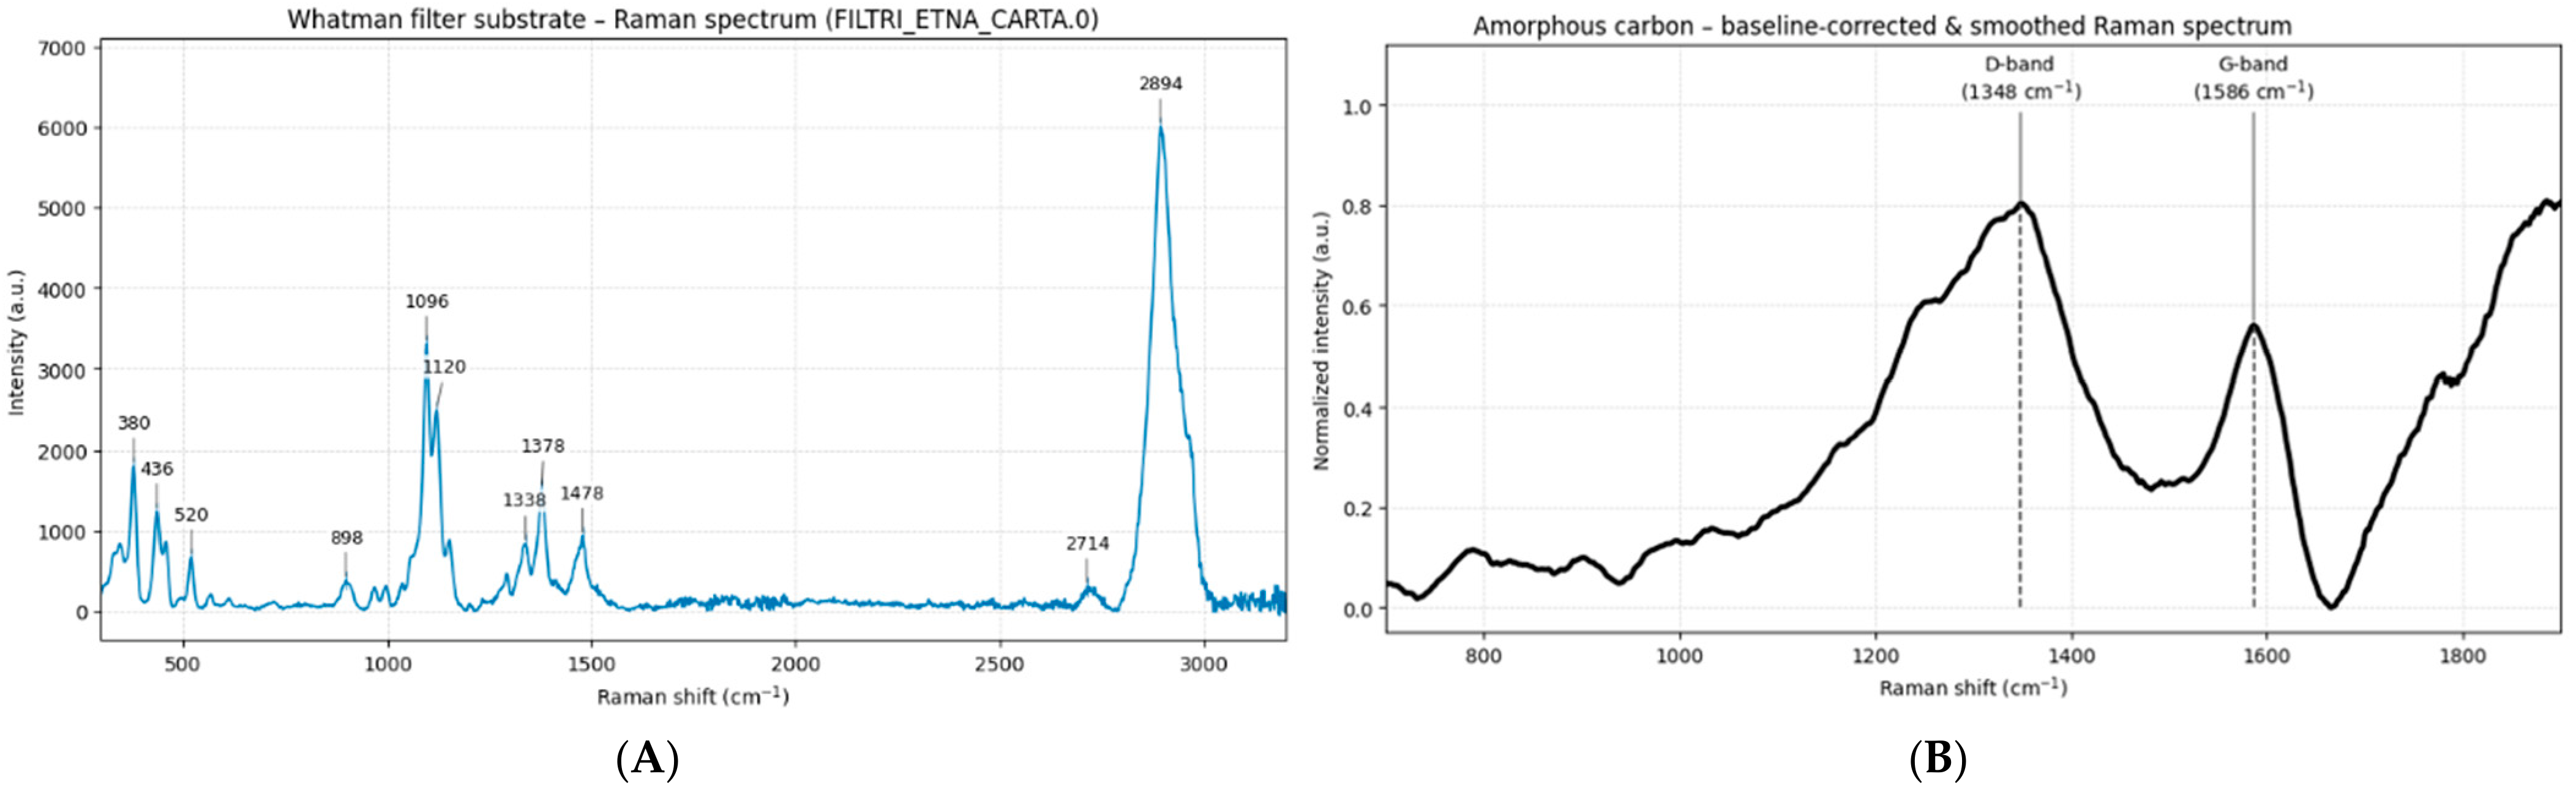
Raman spectroscopy was employed for the molecular identification of selected components within the regions of interest defined in the previous step. As detailed below, its diagnostic contribution in this specific configuration was concentrated on the carbonaceous fraction, whereas the attribution of the mineral phases relied on SEM–EDS composition combined with particle morphology. Because the Whatman filters are cellulose-based and can dominate the Raman response, a reference Raman spectrum of the clean Whatman substrate was acquired and used as a control baseline for interpretation. The Raman spectrum in Figure 9A provides the cellulose fingerprint characterized by low cm−1 lattice deformation modes (340–520 cm−1), the β-glycosidic/linkage marker around 900 cm−1, and a strong doublet in the 1000–1200 cm−1 region (≈1096 and ≈1120 cm−1) attributable to C–O–C/C–O stretching of the glycosidic bond and ring modes. Additional bands in the 1300–1500 cm−1 range (≈1336, 1378, 1412, 1476 cm−1) arise mainly from CH/CH2 bending and scissoring. In the high-wavenumber region, the dominant feature at ~2898 cm−1 corresponds to C–H/CH2 stretching. The Raman profile allows for unequivocal recognition of measurements acquired on bare fibers or in areas where particle signals are weak relative to the substrate contribution.
Figure 9.
Raman spectra of the analyzed materials. (A) Raman spectrum of the Whatman substrate (cellulose). (B) Raman spectrum of a black particle: superimposed on the fluorescence background generated by the substrate, two broad bands centered at approximately 1350 cm−1 (D band) and 1580 cm−1 (G band) can be attributed to amorphous carbonaceous material.
Within the region of interest characterized by darker particulate, Raman spectra, shown in Figure 9B, revealed broad features consistent with amorphous carbon, confirmed by micro-Raman measurements showing the characteristic D and G bands (approximately 1350 and 1580 cm−1). The micro-Raman configuration is essential here because it enables targeting individual dark micro-particles and micro-aggregates lodged within the fiber network, minimizing spectral averaging and avoiding mixed acquisitions dominated by cellulose.
Although Raman spectroscopy enabled the identification of carbonaceous matter through the diagnostic D and G bands, the instrumental spatial resolution (i.e., effective laser spot size and sampling volume on the fibrous substrate) limited the interrogation of smaller particles and sub-micrometer residues trapped within the cellulose network. At several points, the Raman signal was dominated by the filter substrate and/or resulted from spatial averaging over heterogeneous micro-aggregates, preventing reliable phase attribution for the finest particulate fraction. For this reason, the workflow was subsequently complemented with SEM–EDS, which provides higher spatial resolution imaging and localized elemental analysis, allowing for the characterization of particles below the practical Raman detection/targeting limit and the validation of compositional heterogeneity at the micro- to sub-micrometer scale.
4.4. Scanning Electron Microscopy (SEM) Morphological Analysis
Scanning Electron Microscopy (SEM) was employed as the final high-resolution step within the multi-analytical workflow to investigate the morphology and detailed imaging of individual particles, enabling localized elemental characterization through energy-dispersive X-ray spectroscopy (EDS). Considering that the particles were analyzed directly on the cellulose-based filter substrate, all EDS spectra dominated by C, O, and N were interpreted with caution, as a partial contribution from the underlying filter matrix cannot be excluded. Therefore, elemental interpretations were mainly based on particles clearly distinguishable from the fibrous substrate or showing the presence of additional mineral elements such as Si, Al, Fe, Mg, or Ti.
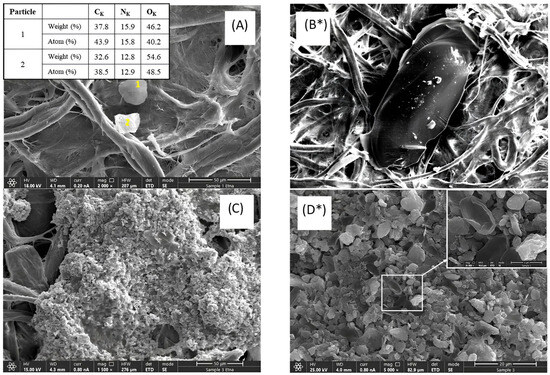
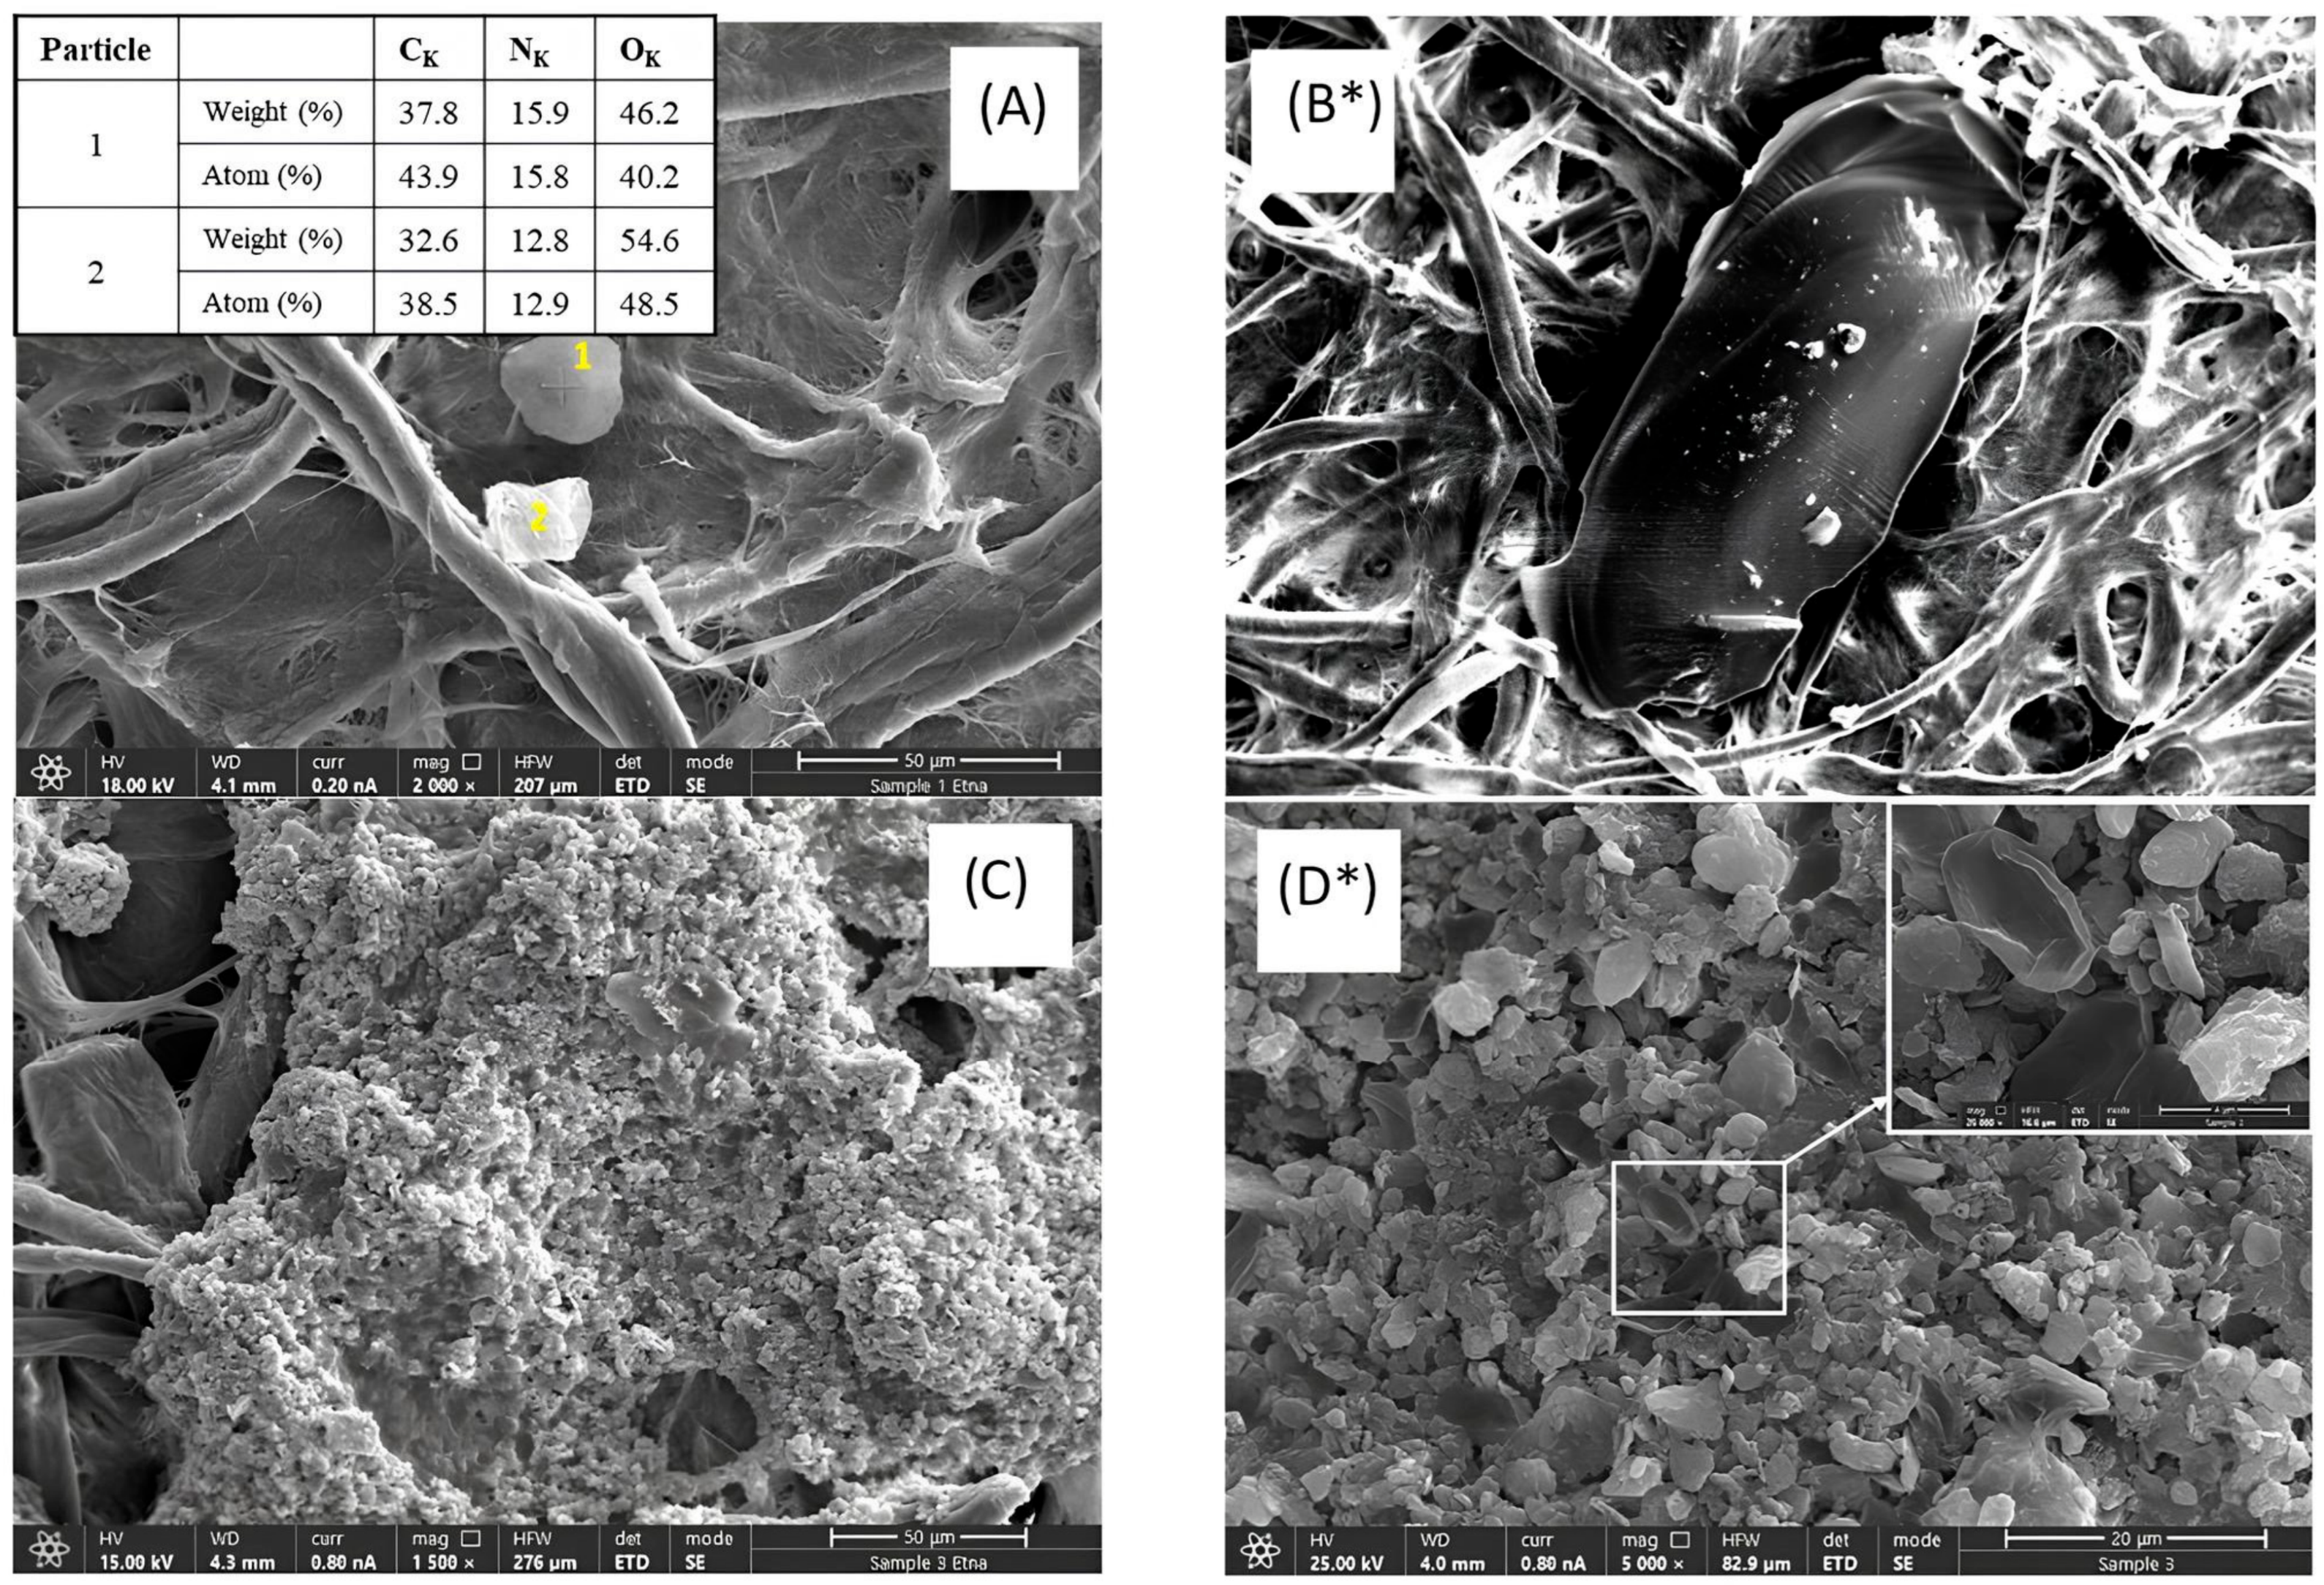
In Figure 10, SEM images of Samples 1 [A], 2 [B*] and 3 [C-D*] are shown. Specifically, Sample 1 is characterized by a very low number of deposited particles. The typical structure of the paper can be clearly observed, composed of intertwined cellulose fibers forming a highly porous network capable of efficiently trapping airborne particulate matter. Particle 1 exhibits a sub-spherical morphology with a relatively smooth and compact surface, whereas particle 2 shows an angular morphology characterized by sharp edges, consistent with a fragmented particle. EDS microanalysis performed on both particles indicates that carbon, oxygen, and nitrogen are the dominant elements. This elemental signature suggests a possible organic composition, although a contribution from the cellulose substrate cannot be excluded.
Figure 10.
SEM images of sample 1 (A); sample 2 (B); sample 3 (C,D). * indicates that mapping analysis has been performed.
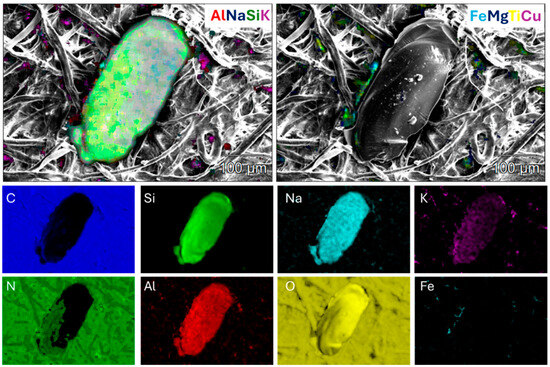
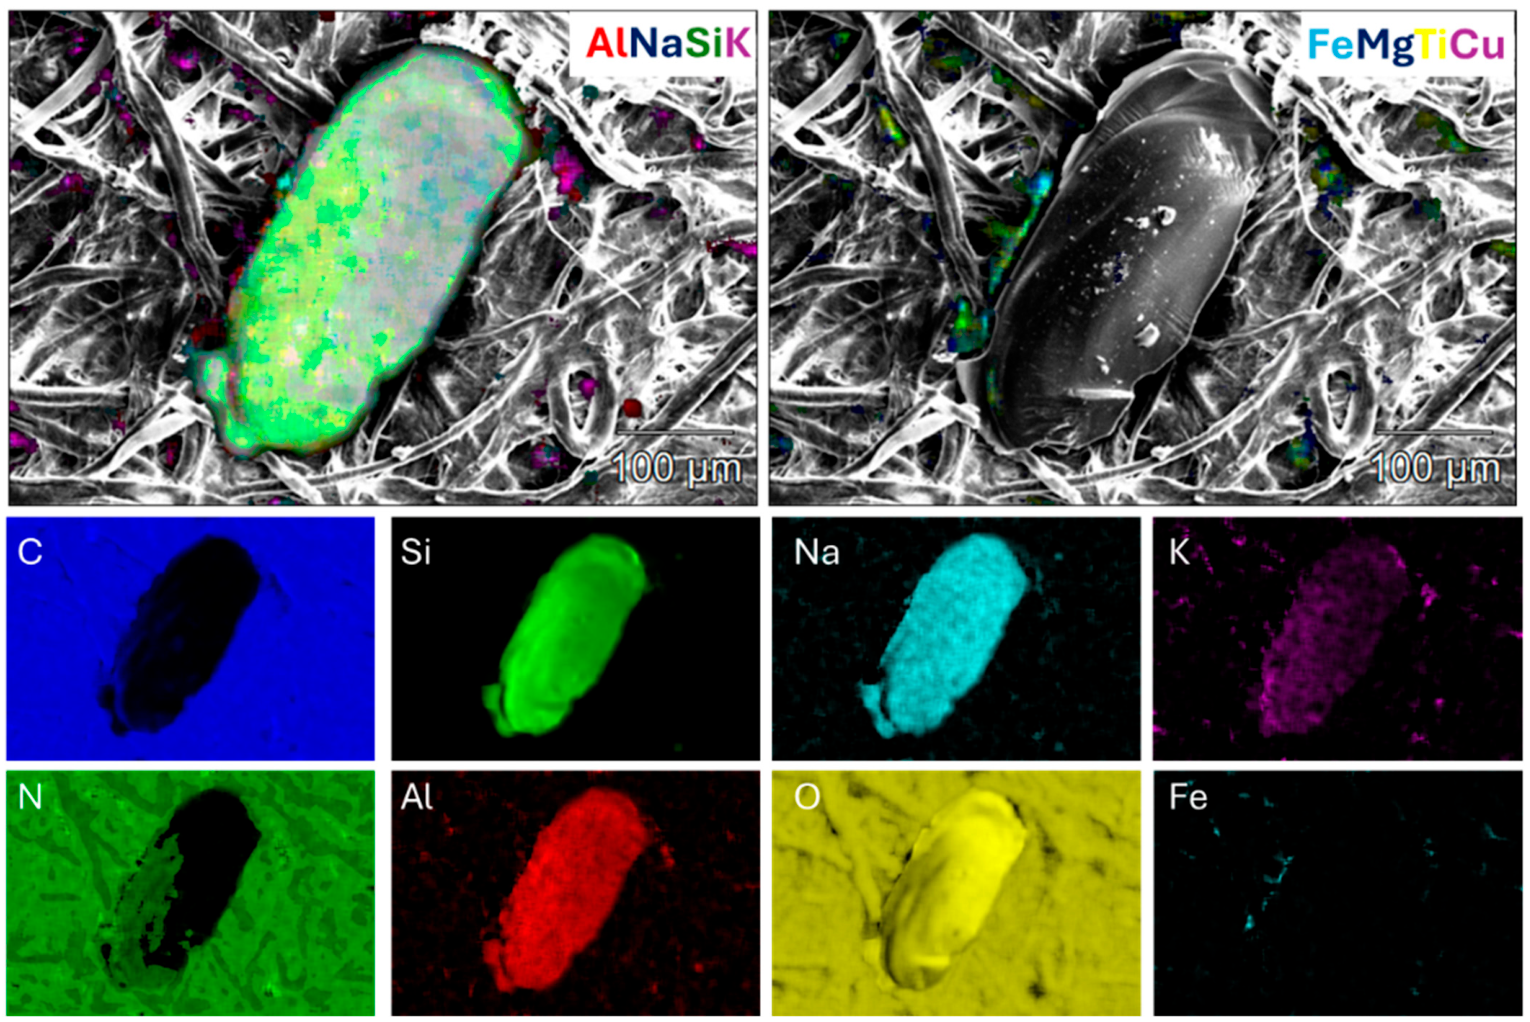
At the centre of Sample 2, within the fibrous matrix of the filter, a relatively large (≈100 µm) oval-shaped particle is observed (Figure 10B). The elemental maps shown in Figure 11 reveal a marked enrichment in oxygen (yellow), sodium (cyan), aluminium (red), silicon (green), and potassium (purple), which are characteristic of aluminosilicate minerals and suggests that the particles may correspond to feldspar fragments. The particle is clearly distinct from the surrounding substrate, which is dominated by carbon-rich cellulose fibers, indicating that it represents an exogenous particulate component that is potentially associated with volcanic ash deposition, although a contribution from local lithogenic sources sharing similar mineral phases (e.g., feldspars and pyroxenes) cannot be ruled out.
Figure 11.
Elemental mapping of Sample 2-Etna referred to image B of Figure 10 showing a large oval-shaped particle embedded within the fibrous filter matrix.
Sample 3 shown in Figure 10C,D appears particularly enriched in particle materials. The SEM micrographs reveal aggregates of very fine particles forming clusters on the order of several tens of micrometers, while the individual microgranules composing these aggregates are significantly smaller, with estimated sizes ranging from the micrometer to the sub-micrometer scale.
The detailed view in Figure 10D shows a dense aggregate of particles displaying a wide range of morphologies, including angular, plate-like, and lenticular fragments. Several particles exhibit sharp edges and irregular fracture surfaces consistent with morphologies commonly reported for fragmented basaltic volcanic ash.
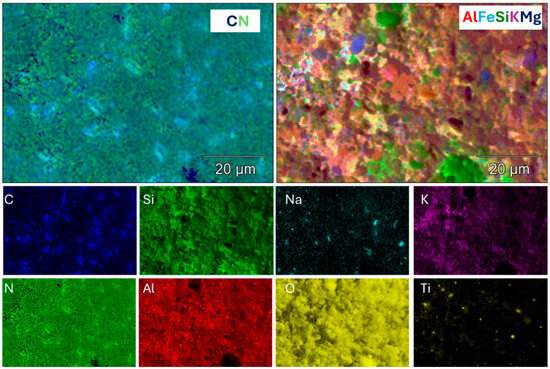
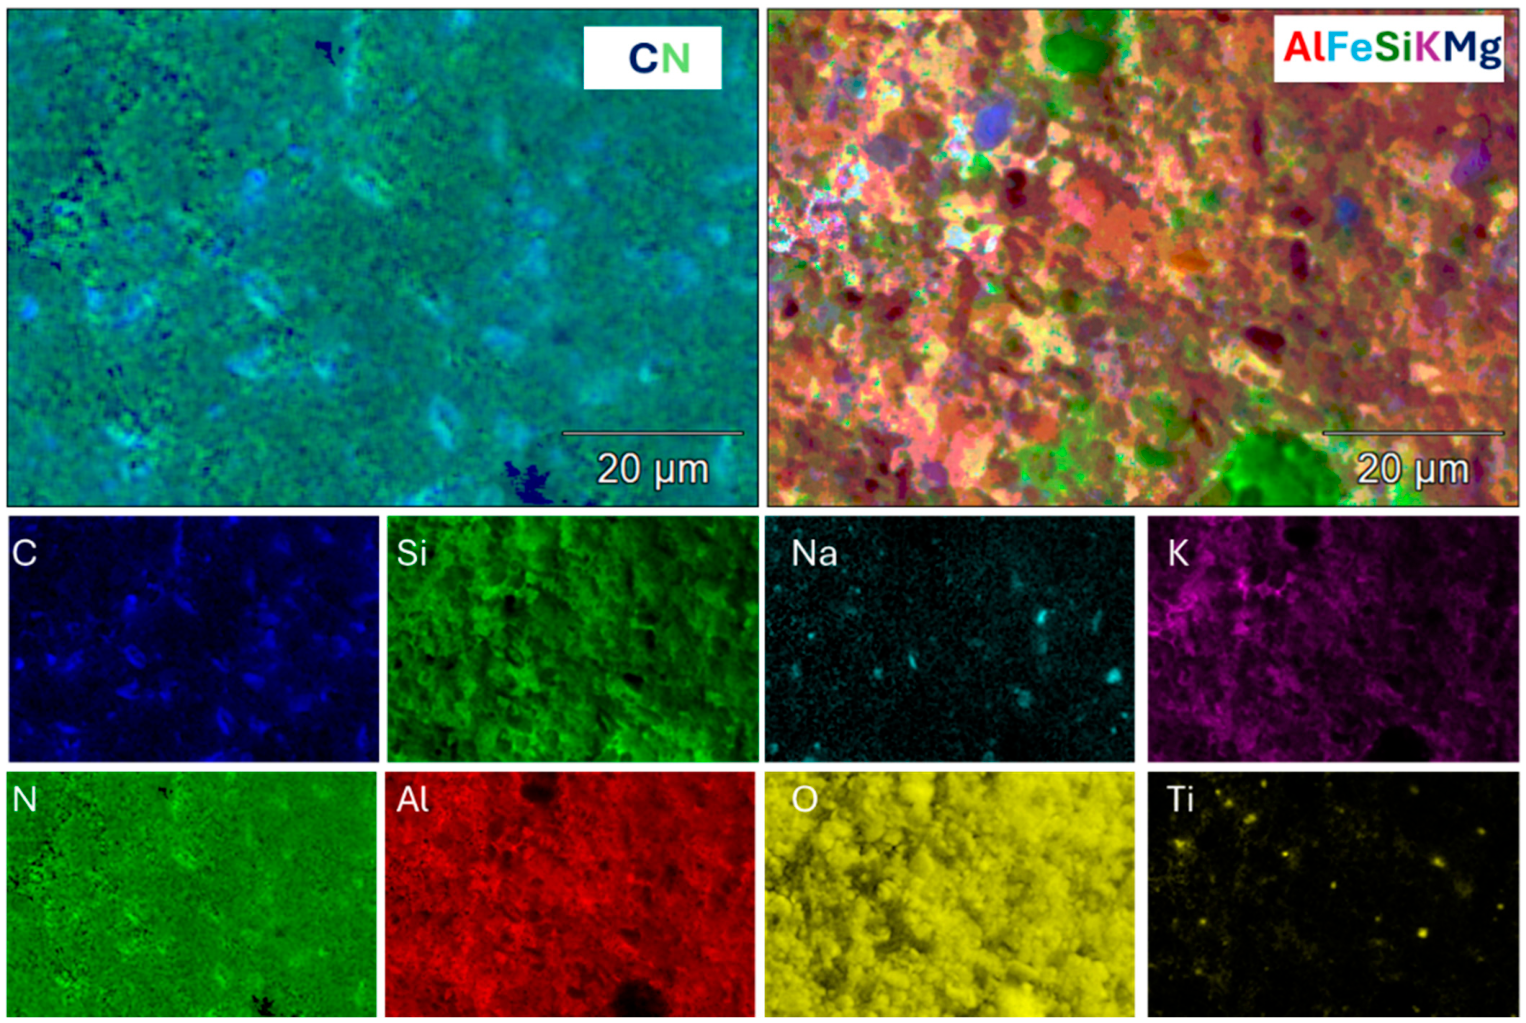
EDS elemental mapping is reported in Figure 12 and it is referred to the area shown in Figure 10D. It is evident the presence of Si, Al, Fe, Mg, and K, which are typical components of silicate minerals and volcanic glass fragments. The spatial distribution of these elements within the aggregates confirms the predominance of silicate mineral phases and supports the interpretation of volcanogenic particulate material. Small, localized areas enriched in Ti were also detected, likely corresponding to Ti-bearing oxide phases. In contrast, some lenticular particles exhibit an elemental signature dominated by C and N, suggesting a possible organic origin and tentatively attributable to pollen grains or other biogenic material. The presence of abundant silicate particles and fragmented mineral grains is consistent with the volcanic setting of the monitoring site and may reflect the deposition of fine ash or the resuspension of volcanic materials commonly occurring in the Mt. Etna area.
Figure 12.
Elemental mapping of Sample 3 referred to image D of Figure 10.
Samples 4, 6, 7, 8, and 9 show negligible particulate deposition (See Figure S1). The SEM images are dominated by the fibrous morphology of the cellulose filter substrate, with only sporadic particles observed on the surface.
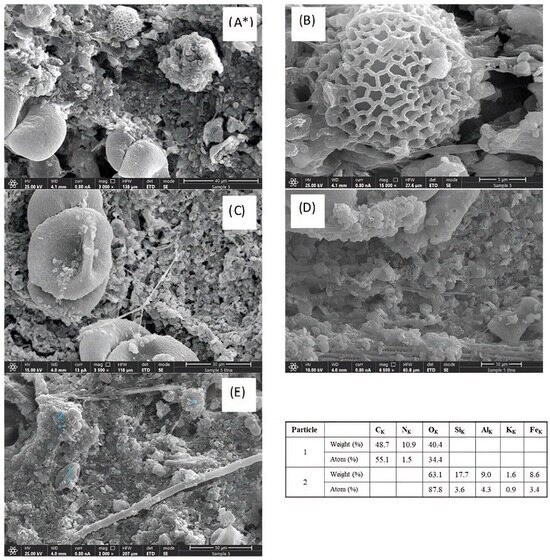
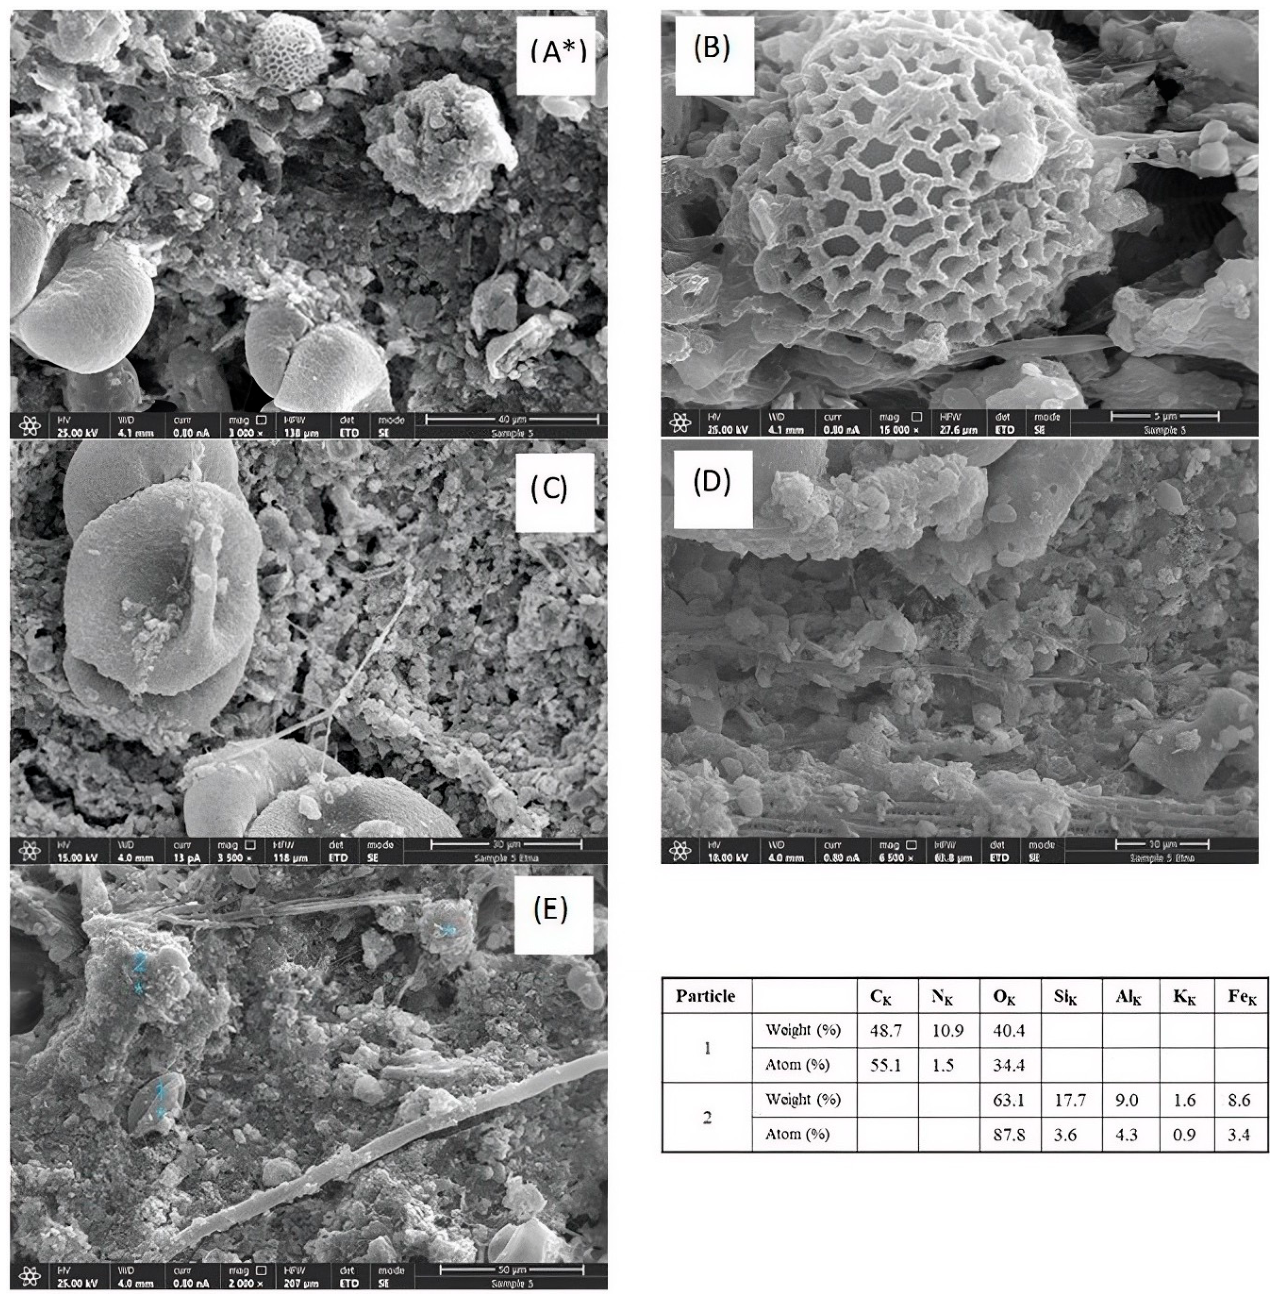
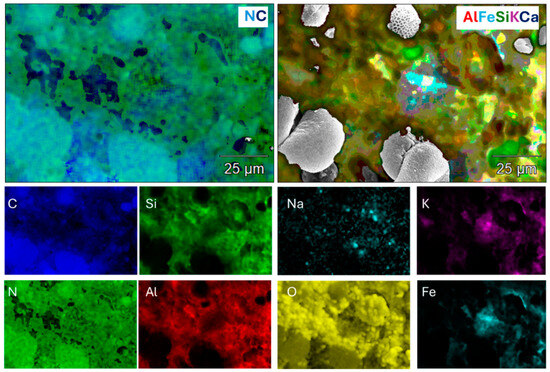
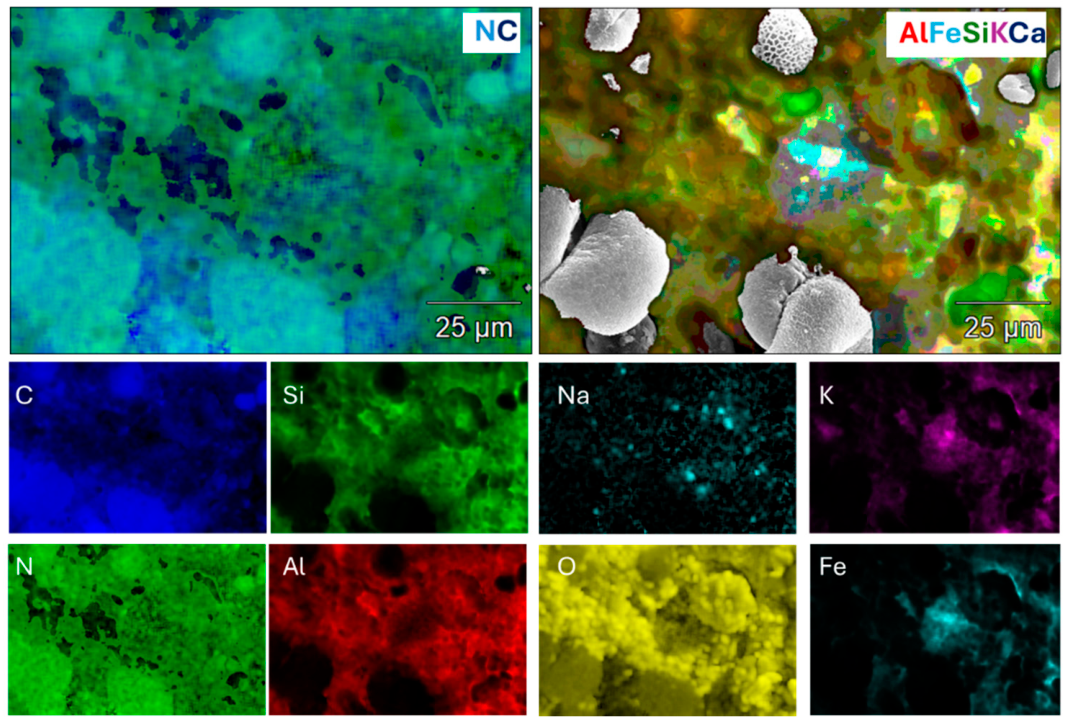
Sample 5 displays many particles with irregular and heterogeneous morphology, including fibrous, tubular, honeycomb-like, and globular structures together with fine particulate matter (see Figure 13). EDS analysis of point 1 in Figure 13E confirms the presence of C, O, and N, consistent with an organic particle, whereas point 2 is dominated by O, Al, Si, K, and Fe, indicative of clay and silicate minerals. EDS mapping (F) of Figure 13A indicates that the globular and honeycomb-like structures are predominantly composed of carbon, nitrogen, and oxygen due to organic material, whereas the surrounding matrix contains Al, Si, Fe, K, and Ca, typical of volcanic minerals. Sample 5 was collected after a strong Scirocco event in July, suggesting that the organic particles were transported by the intense wind-driven processes. Figure 14 shows the elemental mapping of Sample 5, corresponding to image A in Figure 13.
Figure 13.
SEM images of Sample 5. (A) General view of the sample microstructure, showing its heterogeneous nature. (B–E) Higher-magnification images highlighting specific features, including a honeycomb-like siliceous microfossil (B), globular structures (C), volcanic mineral aggregates (D), and a filamentous microfiber (E). EDX analyses were performed at points 1 and 2 in panel (E). The semi-quantitative elemental analyses distinguish an organic particle (1) from a mineral particle (2). Asterisks (*) indicate areas where elemental mapping was performed.
Figure 14.
Elemental mapping of Sample 5 referred to image A of Figure 13.
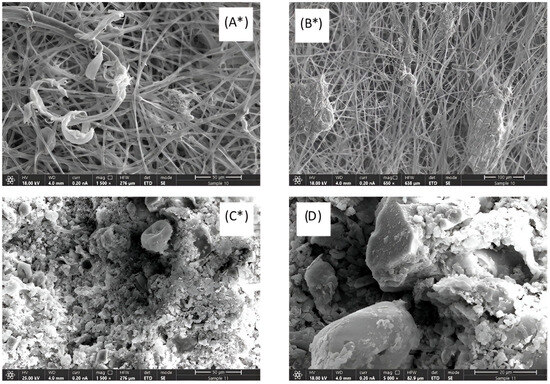
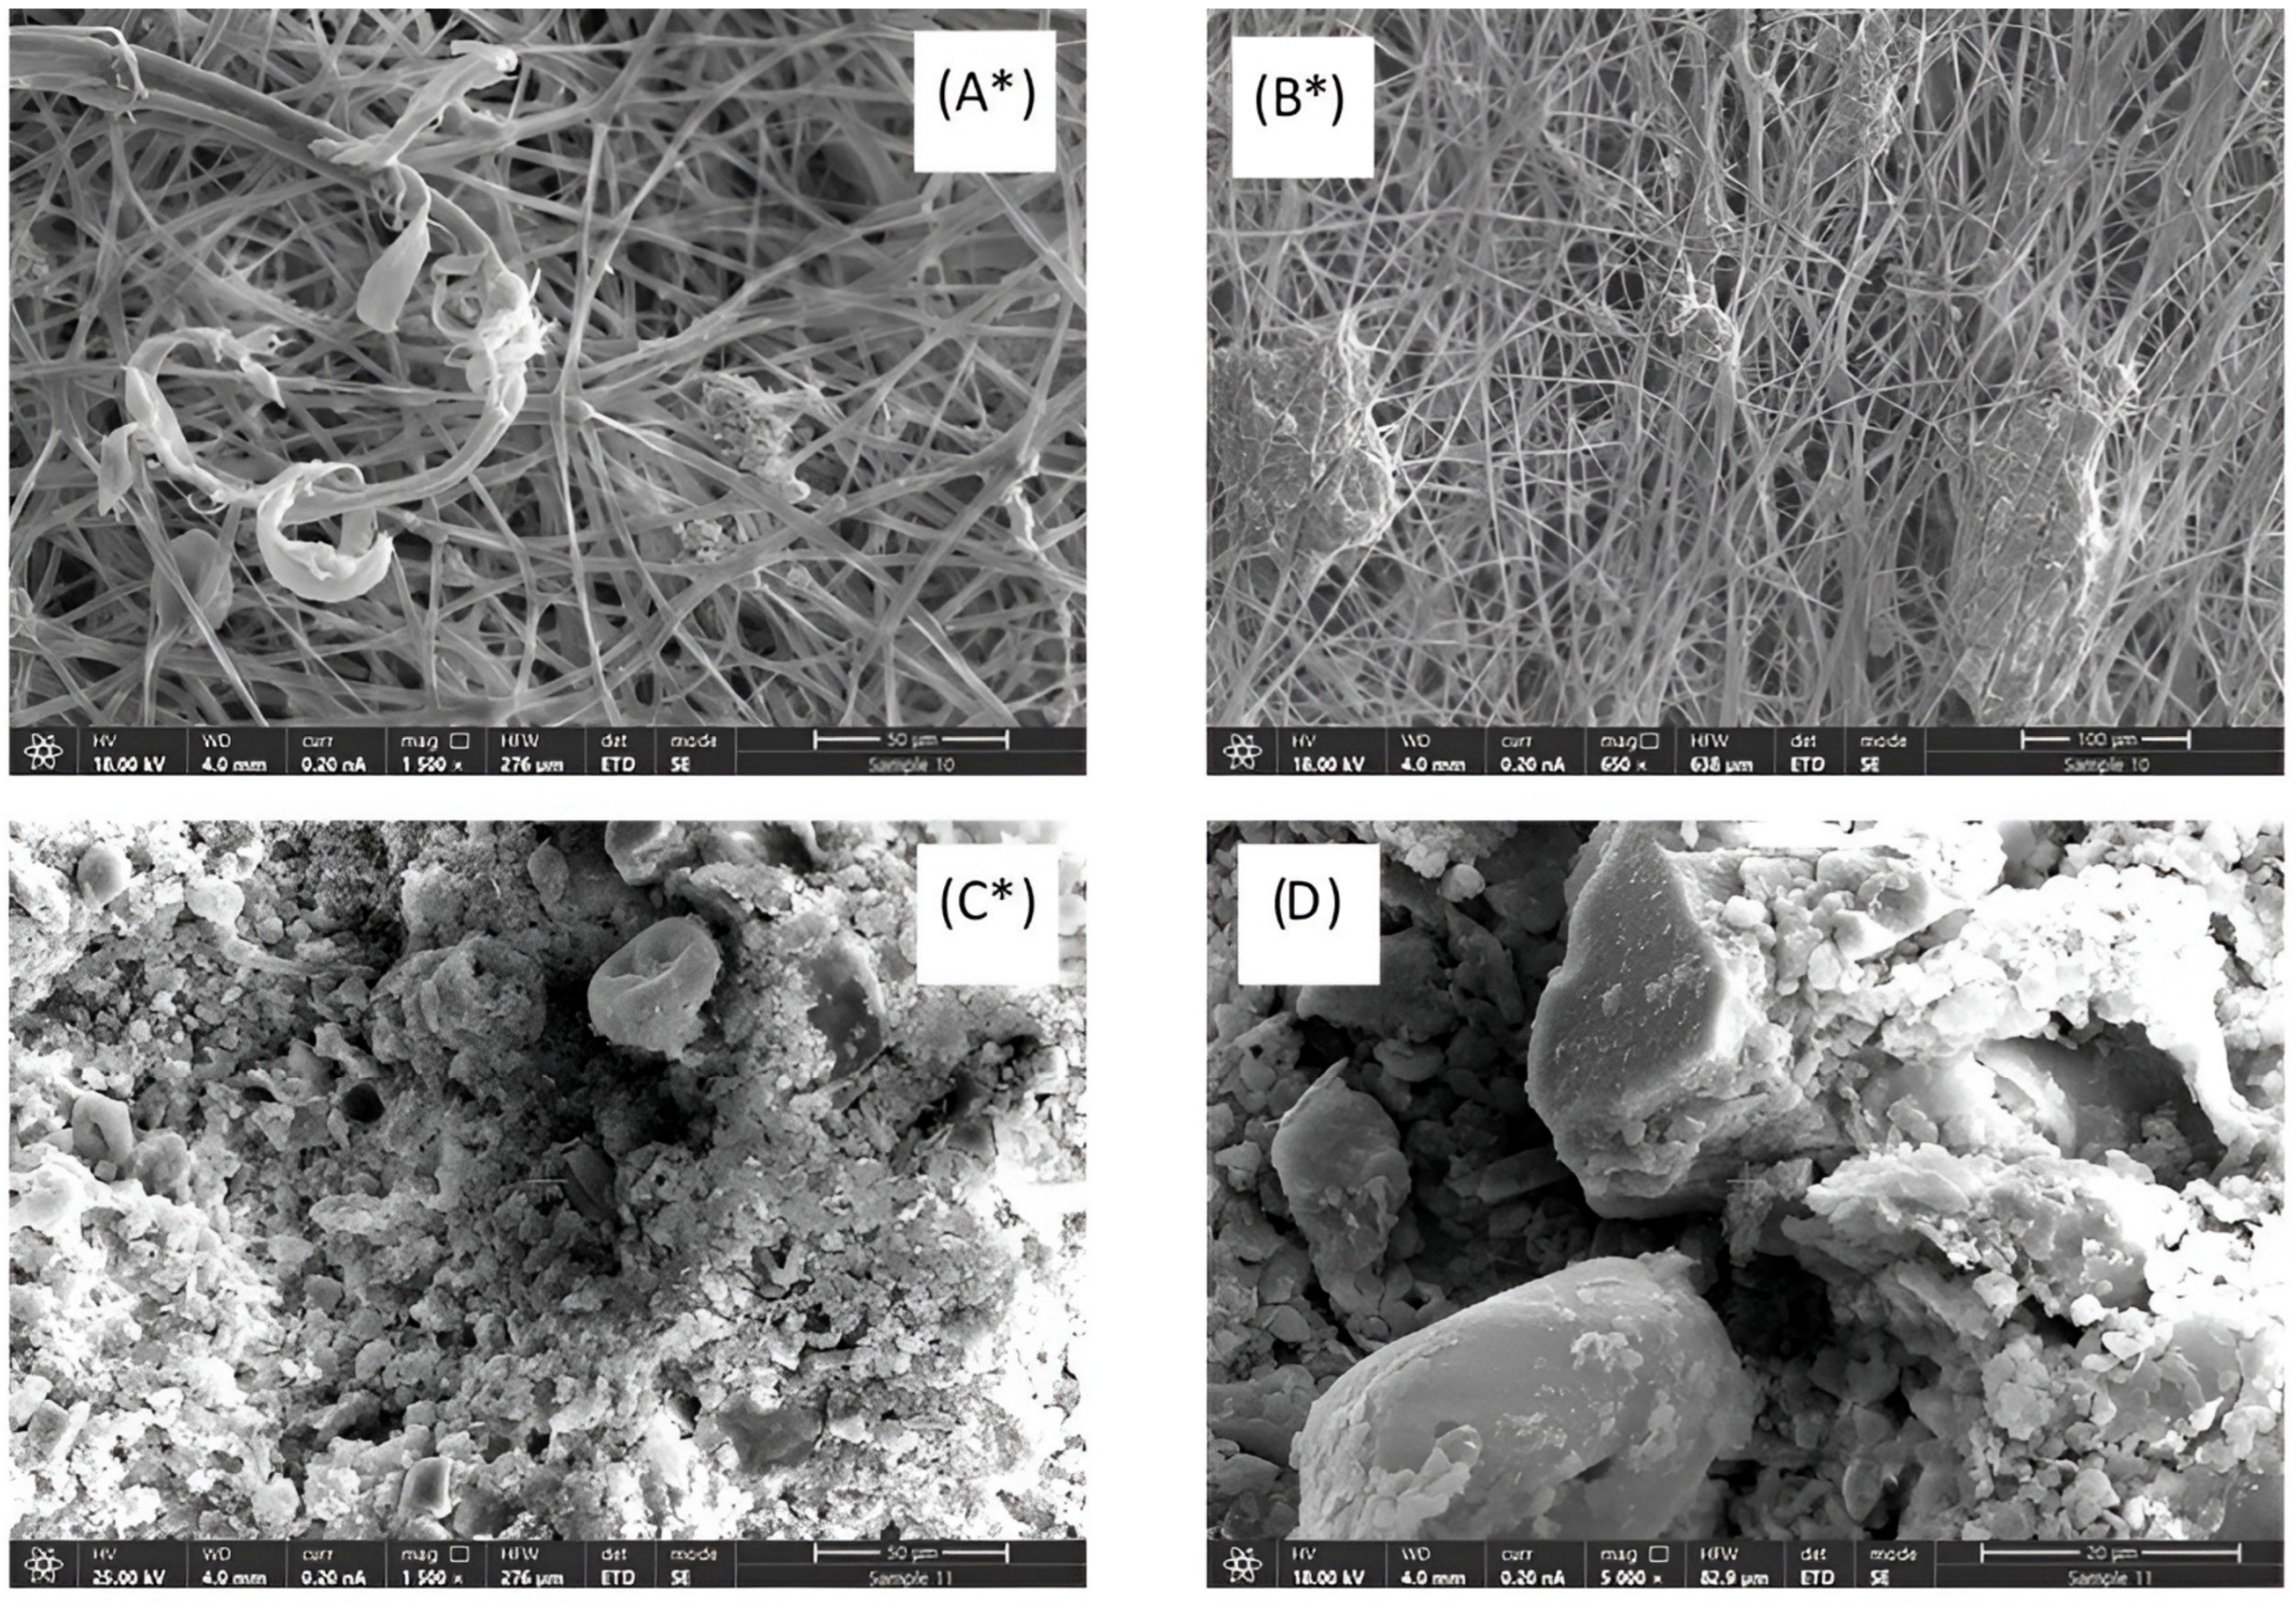
In Figure 15, SEM micrographs of Sample 10 (A,B) and Sample 11 (C,D) are reported. Sample 10 is mainly composed of paper substrate, interspersed with occasional particle aggregates (A) and irregular structures attributable to plant-derived fiber (B).
Figure 15.
SEM images of Sample 10 Etna (A,B) and Sample 11-Etna (C,D). * indicates that mapping analysis has been performed.
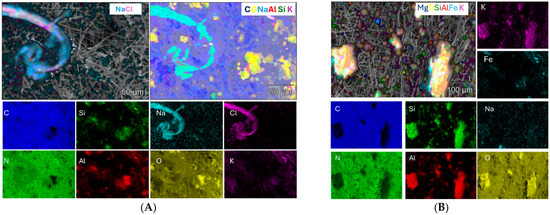
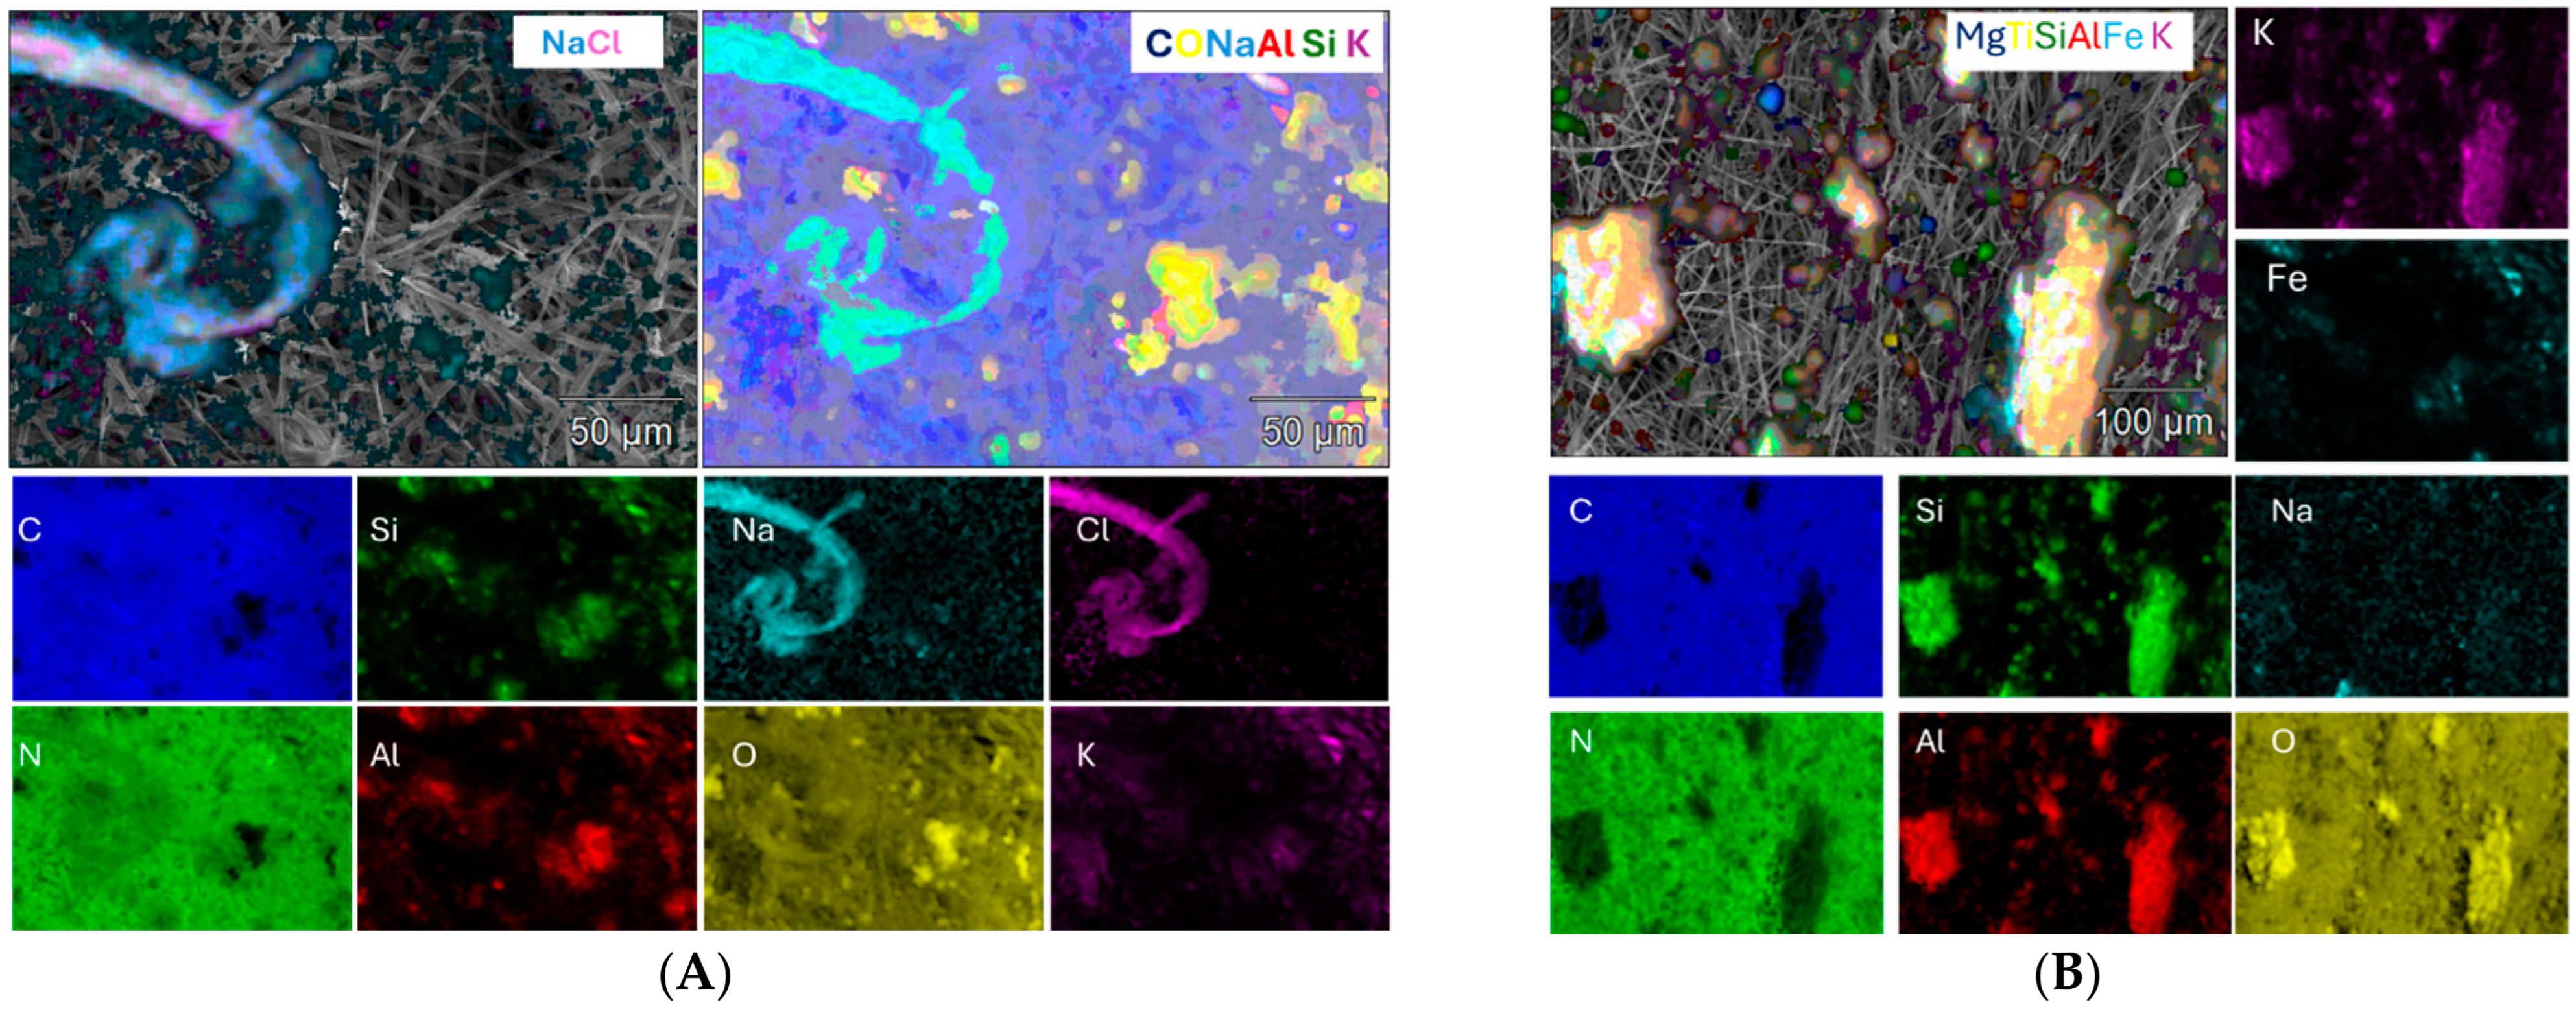
The 2D elemental mapping corresponding to Figure 15A,B is shown in Figure 16. Specifically, zone A shows a clear spatial overlap between Na and Cl along the fiber, indicating the presence of Na- and Cl-rich phases, possibly NaCl. This deposit is likely formed from the evaporation of a saline microdroplet trapped within the fibrous network of the filter. In contrast, the 2D elemental maps of Figure 15B indicate the presence of Mg, Ti, Si, Al, and Fe. The deposits observed within the fibrous network are agglomerates of inorganic particulate matter composed of silicate minerals and oxides. Their irregular distribution and non-filamentous morphology suggest a mechanical entrapment of particles and solid aggregates within the fibrous matrix. Figure 16 shows Elemental mapping of Sample 10 referred to image A and B of Figure 15.
Figure 16.
Elemental maps of Sample 10 corresponding to panels (A) and (B) of Figure 15. (A) The Na-Cl overlay highlights the sharp chemical contrast between the sodium chloride (NaCl) fiber and the surrounding silicate and organic matrix. (B) The Mg–Ti–Si–Al–Fe–K overlay highlights heterogeneous mineral grains embedded in an organic-rich background matrix. The individual elemental maps show the localization of silicate-related elements (Si, Al, K, and O) within the larger particles, together with small grains enriched in Mg and Ti. These mineral particles contrast with the predominantly organic background matrix, characterized by C and N.
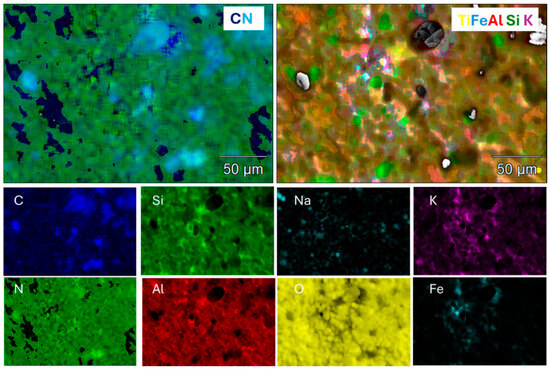
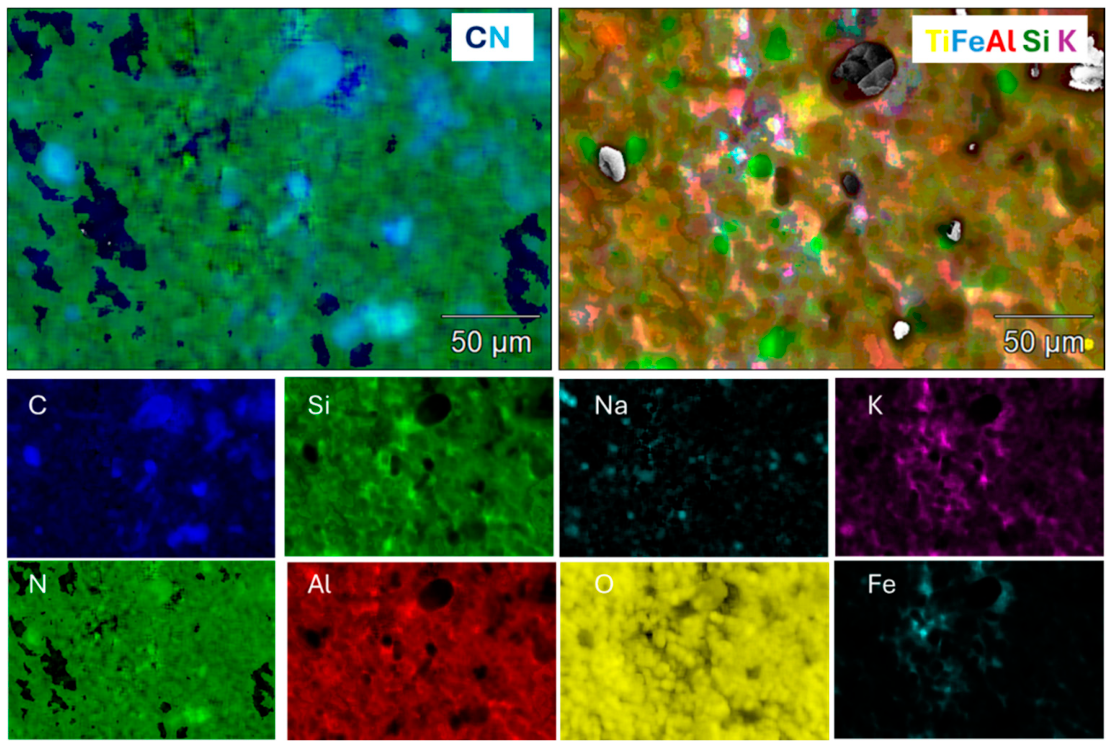
The microstructure of Figure 15C,D, corresponding to Sample 11, is morphologically consistent with fine volcanic ash. The observed particles appear porous, fractured, and irregularly shaped, characteristics typically associated with fragmented volcanic glass and fine ash particles. In the compositional map of Sample 11 (see Figure 17), the areas colored in green and blue indicate zones enriched in C and N, suggesting the presence of organic matter distributed in a discontinuous and localized manner within the sample. This organic component appears as small irregular aggregates dispersed within the mineral matrix. The remaining areas of the map correspond to mineral particles, as indicated by the presence of elements such as Ti, Fe, Al, Si, and K, which are typical of volcanic mineral phases and associated alteration products.
Figure 17.
Elemental mapping of Sample 11 referred to image C of Figure 15.
5. Conclusions
The analysis of particles accumulated on Swagelok pre-Licor filters at the Mt. Etna eddy covariance (EC) site highlights the effectiveness of a multi-analytical workflow for characterizing particulate matter in complex environments. Through the integration of hyperspectral imaging (HSI), Raman spectroscopy, and scanning electron microscopy with energy-dispersive X-ray spectroscopy (SEM–EDS), it was possible to discriminate between volcanogenic, lithogenic, and biogenic components. Within this sequence the three techniques play distinct and non-interchangeable roles: HSI provides a rapid, non-invasive, full-field partition of the residue into spectral classes, and defines, with a reproducible quantitative criterion, the regions submitted to the subsequent point analyses; Raman spectroscopy discriminates the carbonaceous fraction; and SEM–EDS delivers the morphological and compositional evidence on which the attribution of the mineral phases ultimately rests. A key outcome of this study is the potential to consider the clogged EC filter as an integrated archive of atmospheric particulate inputs. Characterizing the retained material and combining the results with meteorological and volcanic data can help identify the processes responsible for filter loading and clogging. This information could support predictive and event-driven maintenance strategies, allowing interventions to be planned according to the occurrence or expected recurrence of high-aerosol events rather than at fixed calendar-based intervals. For example, the identification of volcanic ash as the dominant clogging material could justify more frequent inspections during periods of enhanced volcanic activity, whereas the predominance of seasonal biogenic material or aeolian dust could require different maintenance intervals. Such an approach could optimize maintenance resources while reducing the risk of filter obstruction and associated alterations in EC measurements.
Beyond Mt. Etna, the proposed workflow could be applied to EC monitoring networks exposed to volcanic emissions, mineral dust, biomass, or other high-aerosol inputs. By coupling particulate characterization with meteorological observations and aerosol events, it may provide a practical tool for developing site-specific maintenance schedules and targeted interventions, thereby supporting improved data quality, data gap reduction, and thus more efficient long-term operation of EC monitoring systems. Furthermore, gaining information on the dominant clogging material can help provide a better scientific interpretation of the experimental data collected using the EC method and better distinguish anomalies in the measurements from extreme events related to real-world processes.
Overall, filter-based particulate analysis represents a promising complement to conventional EC quality-control procedures, providing information not only for qualitative source attribution but also for anticipating filter clogging and supporting evidence-based maintenance planning.
Supplementary Materials
The following supporting information can be downloaded at: https://www.mdpi.com/article/10.3390/geosciences16090362/s1, Figure S1: SEM micrographs of Samples 4 (A), 6 (B), 7 (C), 8 (D), and 9 (E). The images are dominated by the fibrous morphology of the cellulose filter substrate, with only sporadic particles observed on the surface, indicating negligible particulate deposition. The EDS spectrum (F) is mainly characterized by C and O signals, consistent with the cellulose matrix of the filter.
Author Contributions
Conceptualization: D.S., A.D., G.V. and I.B.; Data curation: D.S., A.D., R.C.P., D.G. and S.D.; Formal Analysis: D.S., A.D. and D.G.; Investigation: D.S., A.D., R.C.P., D.G., C.C. and S.L.F.; Supervision: M.P.; Writing—original draft: D.S., A.D., D.G., G.V., C.C. and S.L.F.; Writing—review, and editing: D.S., A.D., D.G., M.P., G.V., I.B., C.C., S.L.F. and S.D. All authors have read and agreed to the published version of the manuscript.
Funding
The eddy covariance installed at Mt. Etna was funded by the Italian Ministry of University and Research (MUR) through the PON Research and Innovation 2014–2020 Program, co-funded by the European Regional Development Fund (ERDF), within the framework of the “Geoscience Research Infrastructure of Italy” (PON-GRINT, project code PIR01_00013). The Principal Investigators, Giuseppe Puglisi and Fabrizia Buongiorno, are gratefully acknowledged. GEO-CNR also acknowledges support from the Rafforzamento del Capitale Umano program, project CIR01_00013. D.G., D.S. and R.C.P. thank the European Union (NextGeneration EU), through the MUR-PNRR project SAMOTHRACE—Sicilian Micro and Nano Technology Research and Innovation Center (ECS00000022) and project FOE 2024 project FutuRaw–“The raw materials of the future from non-critical, residual and renewable sources”.
Data Availability Statement
We confirm that all data obtained in this study, including the results of the physicochemical and chemical characterizations, are fully reported in the manuscript and are available to users. No additional datasets were generated or deposited in a public repository.
Acknowledgments
The authors gratefully acknowledge the anonymous reviewers for their insightful comments, constructive suggestions, and careful evaluation of the manuscript. Their feedback significantly contributed to improving the clarity and overall quality of the paper. The authors acknowledge the Ente Parco dell’Etna, and the Dipartimento Regionale per lo Sviluppo Rurale of Catania for hosting the EC facility. Special thanks are due to Pietro Nolasco for his valuable and constant support during fieldwork. During the preparation of this manuscript, the authors used AI tool for the purposes of English translation. The authors have reviewed and edited the output and take full responsibility for the content of this publication.
Conflicts of Interest
The authors declare no conflicts of interest.
References
- Montgomery, R.B. Vertical eddy flux of heat in the atmosphere. J. Atmos. Sci. 1948, 5, 265–274. [Google Scholar] [CrossRef] [Scilit]
- Swinbank, W.C. The measurement of vertical transfer of heat and water vapor by eddies in the lower atmosphere. J. Meteorol. 1951, 8, 135–145. [Google Scholar] [CrossRef] [Scilit]
- Obukhov, A.M. Investigation of the microstructure of the wind in the near-surface layer of the atmosphere. Izv. Akad. Nauk SSSR Geophys. Ser. 1951, 3, 49–136. [Google Scholar]
- Baldocchi, D.D.; Hincks, B.B.; Meyers, T.P. Measuring biosphere–atmosphere exchanges of biologically related gases with micrometeorological methods. Ecology 1988, 69, 1331–1340. [Google Scholar] [CrossRef] [Scilit]
- Baldocchi, D.; Falge, E.; Gu, L.; Olson, R.; Hollinger, D.; Running, S.; Anthoni, P.; Bernhofer, C.; Davis, K.; Evans, R.; et al. FLUXNET: A New Tool to Study the Temporal and Spatial Variability of Ecosystem-Scale Carbon Dioxide, Water Vapor, and Energy Flux Densities. Bull. Am. Meteorol. Soc. 2001, 82, 2415–2434. [Google Scholar] [CrossRef] [Scilit]
- Aubinet, M.; Vesala, T.; Papale, D. (Eds.) Eddy Covariance: A Practical Guide to Measurement and Data Analysis; Springer: Dordrecht, The Netherlands, 2012. [Google Scholar]
- Smidt, J.; Wanner, L.; Ibrom, A.; Schmid, H.; Mauder, M. High-frequency attenuation in eddy covariance measurements from the LI-7200 IRGA with various heating and filter configurations—A spectral correction approach. Agric. For. Meteorol. 2025, 361, 110312. [Google Scholar] [CrossRef] [Scilit]
- Werner, C.; Brantley, S. CO2 emissions from the Yellowstone volcanic system. Geochem. Geophys. Geosyst. 2003, 4, 1061. [Google Scholar] [CrossRef] [Scilit]
- Werner, C.; Chiodini, G.; Granieri, D.; Caliro, S.; Avino, R.; Russo, M. Eddy covariance measurements of hydrothermal heat flux at Solfatara volcano, Italy. Earth Planet. Sci. Lett. 2006, 244, 72–82. [Google Scholar] [CrossRef] [Scilit]
- Lewicki, J.L.; Hilley, G.E.; Dobeck, L.M.; Fischer, M.L. Eddy covariance imaging of diffuse volcanic CO2 emissions at Mammoth Mountain, CA, USA. Bull. Volcanol. 2012, 74, 135–141. [Google Scholar] [CrossRef] [Scilit]
- Lewicki, J.L.; Hilley, G.E.; Fischer, M.L.; Pan, L.; Oldenburg, C.M.; Dobeck, L.; Spangler, L. Eddy covariance observations of surface leakage during shallow subsurface CO2 releases. J. Geophys. Res. 2009, 114, D12302. [Google Scholar] [CrossRef] [Scilit]
- Jia, L.; Zhang, M.; Xiao, W.; Pu, Y.; Zhang, Z.; Bao, H.; Ge, P.; Shi, J.; He, Y.; Yang, F.; et al. Aerosol interference with open-path eddy covariance measurement in a lake environment. Agric. For. Meteorol. 2024, 355, 110104. [Google Scholar] [CrossRef] [Scilit]
- Serrano-Ortiz, P.; Kowalski, A.S.; Domingo, F.; Ruiz, B.; Alados-Arboledas, L. Consequences of uncertainties in CO2 density for estimating net ecosystem CO2 exchange by open-path eddy covariance. Bound.-Layer. Meteorol. 2008, 126, 209–218. [Google Scholar] [CrossRef] [Scilit]
- Ma, J.; Zha, T.; Jia, X.; Sargent, S.; Burgon, R.; Bourque, C.P.-A.; Zhou, X.; Liu, P.; Bai, Y.; Wu, Y. An eddy-covariance system with an innovative vortex intake for measuring carbon dioxide and water fluxes of ecosystems. Atmos. Meas. Tech. 2017, 10, 1259–1267. [Google Scholar] [CrossRef] [Scilit]
- Burba, G. Eddy Covariance Method for Scientific, Industrial, Agricultural, and Regulatory Applications: A Field Book on Measuring Ecosystem Gas Exchange and Areal Emission Rates; LI-COR Biosciences: Lincoln, NE, USA, 2013. [Google Scholar] [CrossRef] [Scilit]
- Järvi, L.; Rannik, Ü.; Kokkonen, T.V.; Kurppa, M.; Karppinen, A.; Kouznetsov, R.D.; Rantala, P.; Vesala, T.; Wood, C.R. Uncertainty of eddy covariance flux measurements over an urban area based on two towers. Atmos. Meas. Tech. 2018, 11, 5421–5438. [Google Scholar] [CrossRef] [Scilit]
- Mico, S.; Tsaousi, E.; Deda, A.; Pomonis, P. Characterization of airborne particles and source identification using SEM/EDS. Eur. Chem. Bull. 2015, 4, 224–229. [Google Scholar]
- Pietrodangelo, A.; Pareti, S.; Perrino, C. Improved identification of transition metals in airborne aerosols by SEM–EDX combined backscattered and secondary electron microanalysis. Environ. Sci. Pollut. Res. 2014, 21, 4023–4031. [Google Scholar] [CrossRef] [Scilit] [PubMed]
- Ramirez-Leal, R.; Valle-Martinez, M.; Cruz-Campas, M. Chemical and Morphological Study of PM10 Analysed by SEM-EDS. Open J. Air Pollut. 2014, 3, 121–129. [Google Scholar] [CrossRef]
- Park, J.I.; Kim, M.S.; Yeo, M.; Choi, M.; Lee, J.Y.; Natsagdorj, A.; Kim, C.; Song, M.; Jang, K.S. Chemical and morphological characterization by SEM–EDS of PM2.5 collected during winter in Ulaanbaatar, Mongolia. Atmos. Environ. 2023, 303, 119752. [Google Scholar] [CrossRef] [Scilit]
- Rendón, M.I.; Viviescas, J.C.; Osorio, J.P.; Hernández, M.S. Chemical, mineralogical and geotechnical index properties characterization of volcanic ash soils. Geotech. Geol. Eng. 2020, 38, 3231–3244. [Google Scholar] [CrossRef] [Scilit]
- Ersoy, O.; Gourgaud, A.; Aydar, E.; Chinga, G.; Thouret, J.-C. Quantitative scanning-electron microscope analysis of volcanic ash surfaces: Application to the 1982–1983 Galunggung eruption (Indonesia). Geol. Soc. Am. Bull. 2012, 119, 743–752. [Google Scholar] [CrossRef] [Scilit]
- Lautze, N.C.; Taddeucci, J.; Andronico, D.; Cannata, C.; Tornetta, L.; Scarlato, P.; Houghton, B.; Lo Castro, M.D. SEM-based methods for the analysis of basaltic ash from weak explosive activity at Etna in 2006 and the 2007 eruptive crisis at Stromboli. Phys. Chem. Earth Parts A/B/C 2012, 45–46, 113–127. [Google Scholar] [CrossRef] [Scilit]
- Schiavo, B.; Morton-Bermea, O.; Meza-Figueroa, D.; Acosta-Elías, M.; González-Grijalva, B.; Armienta-Hernández, M.A.; Inguaggiato, C.; Valera-Fernández, D. Characterization and Polydispersity of Volcanic Ash Nanoparticles in Synthetic Lung Fluid. Toxics 2023, 11, 624. [Google Scholar] [CrossRef] [Scilit] [PubMed]
- Donato, A.; Spadaro, D.; Giuffrida, D.; Sabatino, G.; Di Bella, M.; Trusso, S.; Ponterio, R.C. Monitoring plastic pellet pollution in coastal environments through handheld Raman spectroscopy: Data from the Mediterranean coasts (Southern Italy). Mar. Pollut. Bull. 2024, 202, 116312. [Google Scholar] [CrossRef] [Scilit] [PubMed]
- D’Iglio, C.; Giuffrida, D.; Ponterio, R.C.; Spadaro, D.; Palato, S.; Albano, M.; Capillo, G.; Spanò, N.; Savoca, S. Lost cephalopods recreational fishing lures (EGIs) as marine litter: Composition, persistence, and microplastic release. Sci. Total Environ. 2026, 1011, 181164. [Google Scholar] [CrossRef] [Scilit] [PubMed]
- Estefany, C.; Sun, Z.; Hong, Z.; Du, J. Raman spectroscopy for profiling physical and chemical properties of atmospheric aerosol particles: A review. Ecotoxicol. Environ. Saf. 2023, 249, 114405. [Google Scholar] [CrossRef] [Scilit] [PubMed]
- Harple, V.M.; Ralegankar, S.D.; Jadhav, D.B.; Dhole, S.D. Chemical identification of urban air particulates in the environment of Pune City (India) by Raman spectroscopy. Aerosol Air Qual. Res. 2006, 6, 295–304. [Google Scholar] [CrossRef] [Scilit]
- Rosen, H.; Novakov, T. Raman scattering and the characterization of atmospheric aerosol particles. Nature 1977, 266, 708–710. [Google Scholar] [CrossRef] [Scilit]
- Wang, M.; Zheng, N.; Zhao, D.; Shang, J.; Zhu, T. Using micro-Raman spectroscopy to investigate chemical composition, mixing states, and heterogeneous reactions of individual atmospheric particles. Environ. Sci. Technol. 2021, 55, 10243–10254. [Google Scholar] [CrossRef] [Scilit] [PubMed]
- Chen, C.-W.; Tseng, Y.-S.; Mukundan, A.; Wang, H.-C. Air pollution: Sensitive detection of PM2.5 and PM10 concentration using hyperspectral imaging. Appl. Sci. 2021, 11, 4543. [Google Scholar] [CrossRef] [Scilit]
- Stuart, M.B.; McGonigle, A.J.S.; Willmott, J.R. Hyperspectral imaging in environmental monitoring: A review of recent developments and technological advances in compact field deployable systems. Sensors 2019, 19, 3071. [Google Scholar] [CrossRef] [Scilit] [PubMed]
- Branca, S.; Coltelli, M.; Groppelli, G.; Lentini, F. Geological evolution of Mount Etna volcano (Italy) from earliest products to the most recent activity. Ital. J. Geosci. 2011, 130, 265–291. [Google Scholar] [CrossRef] [Scilit]
- Branca, S.; Del Carlo, P.; Behncke, B.; Bonfanti, P. Database of Etna’s Historical Eruptions (DANTE); Istituto Nazionale di Geofisica e Vulcanologia (INGV): Rome, Italy, 2025. [Google Scholar] [CrossRef]
- De Beni, E.; Branca, S.; Coltelli, M.; Groppelli, G.; Wijbrans, J.R. 40Ar/39Ar isotopic dating of Etna volcanic succession. Ital. J. Geosci. 2011, 130, 292–304. [Google Scholar] [CrossRef] [Scilit]
- Malaguti, A.B.; Branca, S.; Speranza, F.; Coltelli, M.; Del Carlo, P.; Renzulli, A. Age of the Valle del Bove formation and chronology of the post-collapse flank eruptions, Etna volcano (Italy). J. Volcanol. Geotherm. Res. 2023, 434, 107752. [Google Scholar] [CrossRef] [Scilit]
- D’Incecco, P.; Filiberto, J.; Garvin, J.B.; Arney, G.N.; Getty, S.A.; Kohler, E.; Zelenyi, L.M.; Zasova, L.V.; Korablev, O.; Ivanov, M.A.; et al. The “Analogs for VENus’ GEologically Recent Surfaces” (AVENGERS) initiative: Using Terrestrial Analogs to Study Recent Volcano-Tectonic Activity on Venus and Inform the Characterization of Terrestrial Exoplanets. J. Geophys. Res. Planets 2024, 130, e2024JE008675. [Google Scholar] [CrossRef] [Scilit]
- Giuffrida, M.; Cardone, M.; Zuccarello, F.; Viccaro, M. Etna 2011–2022: Discoveries from a decade of activity at the volcano. Earth-Sci. Rev. 2023, 245, 104563. [Google Scholar] [CrossRef] [Scilit]
- D’Oriano, C.; Del Carlo, P.; Andronico, D.; Cioni, R.; Gabellini, P.; Cristaldi, A.; Pompilio, M. Syn-eruptive processes during the January–February 2019 ash-rich emissions cycle at Mt. Etna (Italy): Implications for petrological monitoring of volcanic ash. Front. Earth Sci. 2022, 10, 824872. [Google Scholar] [CrossRef] [Scilit]
- Aiuppa, A.; Moussallam, Y. Hydrogen and Hydrogen Sulphide in Volcanic Gases: Abundance, Processes, and Atmospheric Fluxes. Comptes Rendus Géoscience 2024, 356, 85–108. [Google Scholar] [CrossRef] [Scilit]
- Vivaldo, G.; Caparrini, F.; Donato, A.; D’Incecco, S.; Goiran, S.; Lelli, M.; Raco, B.; Provenzale, A.; Pennisi, M. CO2 fluxes in a volcanic ecosystem from eddy covariance measurements at Mt. Etna, Italy. Sci. Rep. 2026; accept.
- LI-COR Biosciences. Cleaning the Swagelok Filter; Technical Note; LI-COR Biosciences: Lincoln, NE, USA, 2005. [Google Scholar]
- Ciocca, M.; Maver, M.; Allará, C.; Zanotelli, D.; Krik, S.; Orlando, A.; Rühle, T.; Walz, S.; Figueroa Gonzalez, T.; Gentile, G.; et al. Conjugated polymer nanoparticles boosting growth and photosynthesis in biohybrid plants. Mater. Horiz. 2025, 12, 7937–7950. [Google Scholar] [CrossRef] [Scilit] [PubMed]
- Ivleva, N.P.; Huckele, S.; Weinzierl, B.; Niessner, R.; Haisch, C.; Baumann, T. Identification and characterization of individual airborne volcanic ash particles by Raman microspectroscopy. Anal. Bioanal. Chem. 2013, 405, 9071–9084. [Google Scholar] [CrossRef] [Scilit] [PubMed]
- Wagner, J.; Wang, Z.-M.; Ghosal, S.; Wall, S. Source identification on high PM2.5 days using SEM/EDS, XRF, Raman, and windblown dust modeling. Aerosol Air Qual. Res. 2019, 19, 2518–2530. [Google Scholar] [CrossRef] [Scilit]
- Doughty, D.C.; Hill, S.C. Raman spectra of atmospheric aerosol particles: Clusters and time-series for a 22.5 hr sampling period. J. Quant. Spectrosc. Radiat. Transf. 2020, 248, 106907. [Google Scholar] [CrossRef] [Scilit]

Disclaimer/Publisher’s Note: The statements, opinions and data contained in all publications are solely those of the individual author(s) and contributor(s) and not of MDPI and/or the editor(s). MDPI and/or the editor(s) disclaim responsibility for any injury to people or property resulting from any ideas, methods, instructions or products referred to in the content. |
© 2026 by the authors. Licensee MDPI, Basel, Switzerland. This article is an open access article distributed under the terms and conditions of the Creative Commons Attribution (CC BY) license.