


Abstract
Rare metal exploration increasingly relies on the integration of heterogeneous geological datasets and advanced analytical methods to improve the efficiency and reliability of mineral prospecting. This study presents the development of a web-based Geographic Information System, Geospatial Information System for Optimized Rare Metal Exploration in Eastern Kazakhstan (GISORMEK), using the central part of the Kalba–Narym rare-metal belt (Eastern Kazakhstan) as a case study. A comprehensive geospatial database was developed through the digitization of archival geological maps and the integration of geological, geochemical, tectonic, geophysical, geomorphological, and mineral occurrence datasets. To complement historical mapping data, Landsat-8 multispectral imagery was incorporated to improve lithological discrimination and identify hydrothermal alteration zones. Two remote sensing techniques were applied: Principal Component Analysis (PCA) for lithological mapping and enhancement of geological features, and band ratio (BR) analysis for the calculation of geological spectral indices, including the iron oxide index and the hydroxyl-bearing (Al–OH) mineral index. The resulting spectral indices were subsequently integrated to generate a predictive hydrothermal alteration map. GISORMEK integrates historical and contemporary datasets within a unified web-GIS framework, ensuring spatial consistency, reproducibility, and accessibility. The proposed framework enhances the interpretation of the mineralization potential of the Kalba–Narym region and provides geospatial platform for supporting rare metal exploration and future mineral prospectivity assessments.
1. Introduction
Rare metals play an essential role in the global production of electronics, heat-resistant alloys, superconducting materials, cryotrons and capacitors. Among the most economically important rare metals are lithium, cesium, tantalum, niobium, molybdenum and several others. According to international market analyses, the global rare and rare earth metals market was valued at approximately USD 6.0 billion in 2024 and is projected to reach USD 10.9 billion in 2029, corresponding to a compound annual growth rate (CAGR) of 12.6% during 2024–2029 [1]. The growing global demand for critical raw materials has increased the importance of efficient exploration methods for rare-metal deposits. Although the terms rare metals, rare elements, rare earth elements (REEs), and critical minerals are often used interchangeably in the literature, they refer to different groups of elements. In this study, the term rare metals refers specifically to the elements associated with the rare-metal mineralization of the Kalba–Narym belt (Eastern Kazakhstan), namely Li, Be, Cs, Nb, Ta, Sn, W, and Mo. Rare earth elements are not considered within the scope of this study.
The exploration and assessment of rare metal deposits represent a complex scientific and technical challenge. Because geospatial information is fundamental to mineral exploration, Geographic Information Systems (GIS) have become an essential tool for integrating, managing, analyzing and visualizing geological data, thereby improving the efficiency of exploration workflows [2,3,4]. Early applications of GIS primarily focused on its use as a cartographic and spatial data management tool [5,6,7,8]. More advanced applications include the generation of rare-metal distribution maps based on field survey data [9]. The study most closely related to the present research is that of [10], in which GIS was employed to develop two- and three- dimensional visualization of rare metal geological systems by integrating field observations, geophysical data (gravity and magnetic fields), geochemical data, topographic and geological maps, and technical reports. Recent advances in remote sensing technologies have further expanded the opportunities for geological investigations and mineral exploration [11,12,13,14]. The integration of GIS with remote sensing data provides additional capabilities for lithological mapping, hydrothermal alteration detection, and mineral prospectivity assessment, making it particularly valuable for rare-metal exploration [15,16].
Comprehensive reviews of remote sensing methods for geological applications have been presented in [17,18]. In the context of the present study, particular emphasis is placed on the integration of remote sensing data with complementary geospatial datasets within a comprehensive Web-GIS platform. Such integration enables the efficient collection, management, analysis, visualization, and dissemination of heterogeneous geological information. GIS provides a robust framework for integrating diverse spatial datasets, supporting spatial modeling, and facilitating the visualization and interpretation of large volumes of geospatial data [19].
The effectiveness of GIS-based approaches depends on the availability of comprehensive geological GIS databases and on geoportals that support storage, processing, and interactive analysis. Worldwide, numerous geoportals provide access to information on mineral resources, geological structures, and related datasets by integrating cartographic, geophysical, and geochemical information, including satellite imagery and historical geological archives. Despite their broad functionality, many existing platforms remain constrained by limitations such as insufficient positional accuracy, incomplete geographic coverage, and outdated or inconsistently updated datasets [20].
In the Republic of Kazakhstan, despite the intensive development of the mining industry, there is currently no unified geoportal for the storage, management, and analysis of geological data to support mineral exploration and resource development, including rare-metal deposits. The country’s geological information resources comprise more than 65,000 geological reports, 613 gravimetric survey sheets at a scale of 1:200,000 and other geophysical data [21]. The first significant step toward the development of a national geological geoportal was undertaken in 2014 by the Republican Centre for Geological Information Kazgeoinform and Kazzinc LLP, (Limited Liability Partnership) which jointly developed the “Interactive map of the location of existing subsoil use objects of the Republic of Kazakhstan” [22].
The primary objective of this database was to provide reliable and up-to-date information on licensed and available contract areas for subsoil users. However, the platform has several limitations. It does not incorporate geological mapping data and provides only the standard functionality of a conventional web-GIS application, including map navigation, layer management, query functions, and measurement tools. The database is available online as an ArcGIS Web Application 12.
Despite the strategic importance of rare metals and the growing global demand for these resources, existing geoinformation systems supporting geological exploration in Kazakhstan exhibit several important limitations. National geological databases are, in most cases, limited to collections of static maps and reports and do not integrate heterogeneous datasets (geological, geophysical, geochemical, remote sensing) within a unified geospatial framework. Consequently, opportunities for comprehensive spatial analysis data integration, and timely information updates remain limited, which may reduce the efficiency of identifying prospective mineralization zones. Furthermore, many international geoportals (OneGeology or Mineral Resources Online Spatial Data) provide overview-scale geological information and do not include detailed datasets for Kazakhstan, with available data generally limited to map scales ranging from 1:200,000–1:1,000,000.
These limitations are particularly significant in Eastern Kazakhstan, where rare metal deposits are characterized by complex geological structures, numerous small pegmatite veins and a high degree of tectonic deformation. Under such conditions, traditional exploration methods, including field mapping and drilling, are often labor-intensive and time-consuming, highlighting the need for integrated geospatial approaches that support more efficient exploration planning and target prioritization.
In view of the need for an integrated geospatial platform to support rare-metal exploration in the Republic of Kazakhstan, this study aims to develop the structure of a geological geoportal, the Geospatial Information System for Optimized Rare Metal Exploration in Eastern Kazakhstan (GISORMEK). The proposed system integrates geological, topographic, geophysical, and remote sensing data within a unified Web-GIS environment to support the management, visualization, and analysis of geospatial information for mineral exploration. The GISORMEK framework is demonstrated using the central part of the Kalba–Narym rare-metal belt in Eastern Kazakhstan as a case study, a region recognized for its significant rare-metal mineralization.
The proposed GISORMEK framework extends the capabilities of existing geoinformation platforms by integrating the following components within a unified Web-GIS environment:
- -
- archival geological maps of various scales;
- -
- geophysical and geochemical datasets;
- -
- multispectral satellite imagery from Landsat-8;
- -
- digital elevation models (DEM) and their processed derivatives.
By applying geospatial analysis methods, including Principal Component Analysis (PCA) and Band Ratio (BR) techniques, GISORMEK supports the identification of lithological contrasts, hydrothermal alteration zones, and potential pegmatite outcrops. These capabilities improve the integration and interpretation of heterogeneous geological datasets and provide additional support for the identification and prioritization of prospective exploration targets.
Table 1 summarizes the technical specifications of GISORMEK relative to other geological portals.
Table 1.
Comparison of the geographic coverage, data content, interoperability and functional capabilities of selected geological geoportals and GISORMEK.
Rather than replicating large-scale national or international geoscience infrastructures, GISORMEK is designed to address the specific requirements of rare-metal exploration at the regional scale. Its distinguishing feature is the integration of detailed, exploration-oriented datasets—including archival geological maps, multi-element geochemical data, geophysical datasets, mineral occurrence records, and Landsat-derived lithological and hydrothermal alteration products—within a unified Web-GIS framework.
Thus, this study introduces an integrated geospatial framework, GISORMEK, for rare metal exploration in Eastern Kazakhstan, addressing a critical gap in national geological data infrastructure. Its scientific novelty lies in:
- -
- a reproducible framework with enhanced architecture for integrating archival geological intelligence (archival geological, geophysical, and geochemical maps), multiscale remote sensing data (Landsat-8);
- -
- PCA applied to seven spectral bands of a Landsat-8 image can distinguish lithological boundaries between the intrusive complexes of the Kalby region and the sedimentary deposits of the Takyr Formation. The use of band ratios also helps to predict zones of hydrothermal alteration;
- -
- a Kazakhstan-specific geospatial infrastructure model. The model provides multiscale harmonization and reproducible geospatial infrastructure pertinent to the eastern Kazakhstan area, providing a foundation for a new standard for geological data management and mineral targeting in the region and serving as a scalable model for other metallogenic zones.
The following sections of the work describe the object of research—Kalba– Narym ore zone. The materials and research methods section provides a description of the developed geoportal structure, content, merging technologies and data types. The results and discussion sections present practical results of the effective application of the geoportal for solving geological database management problems and experimental application of the geoportal for the research of deposit distribution using the developed GIS and remote sensing data in order to identify pegmatites. The last section summarizes the conclusions of the work carried out.
2. Study Area
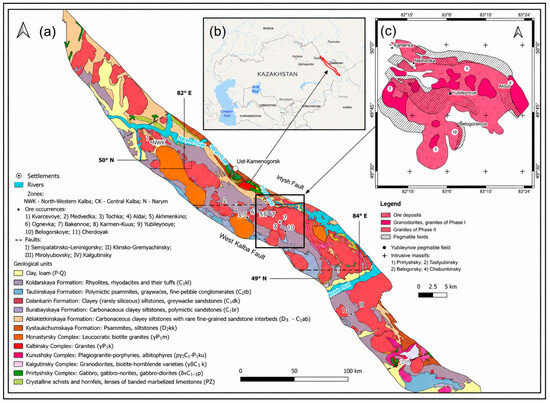
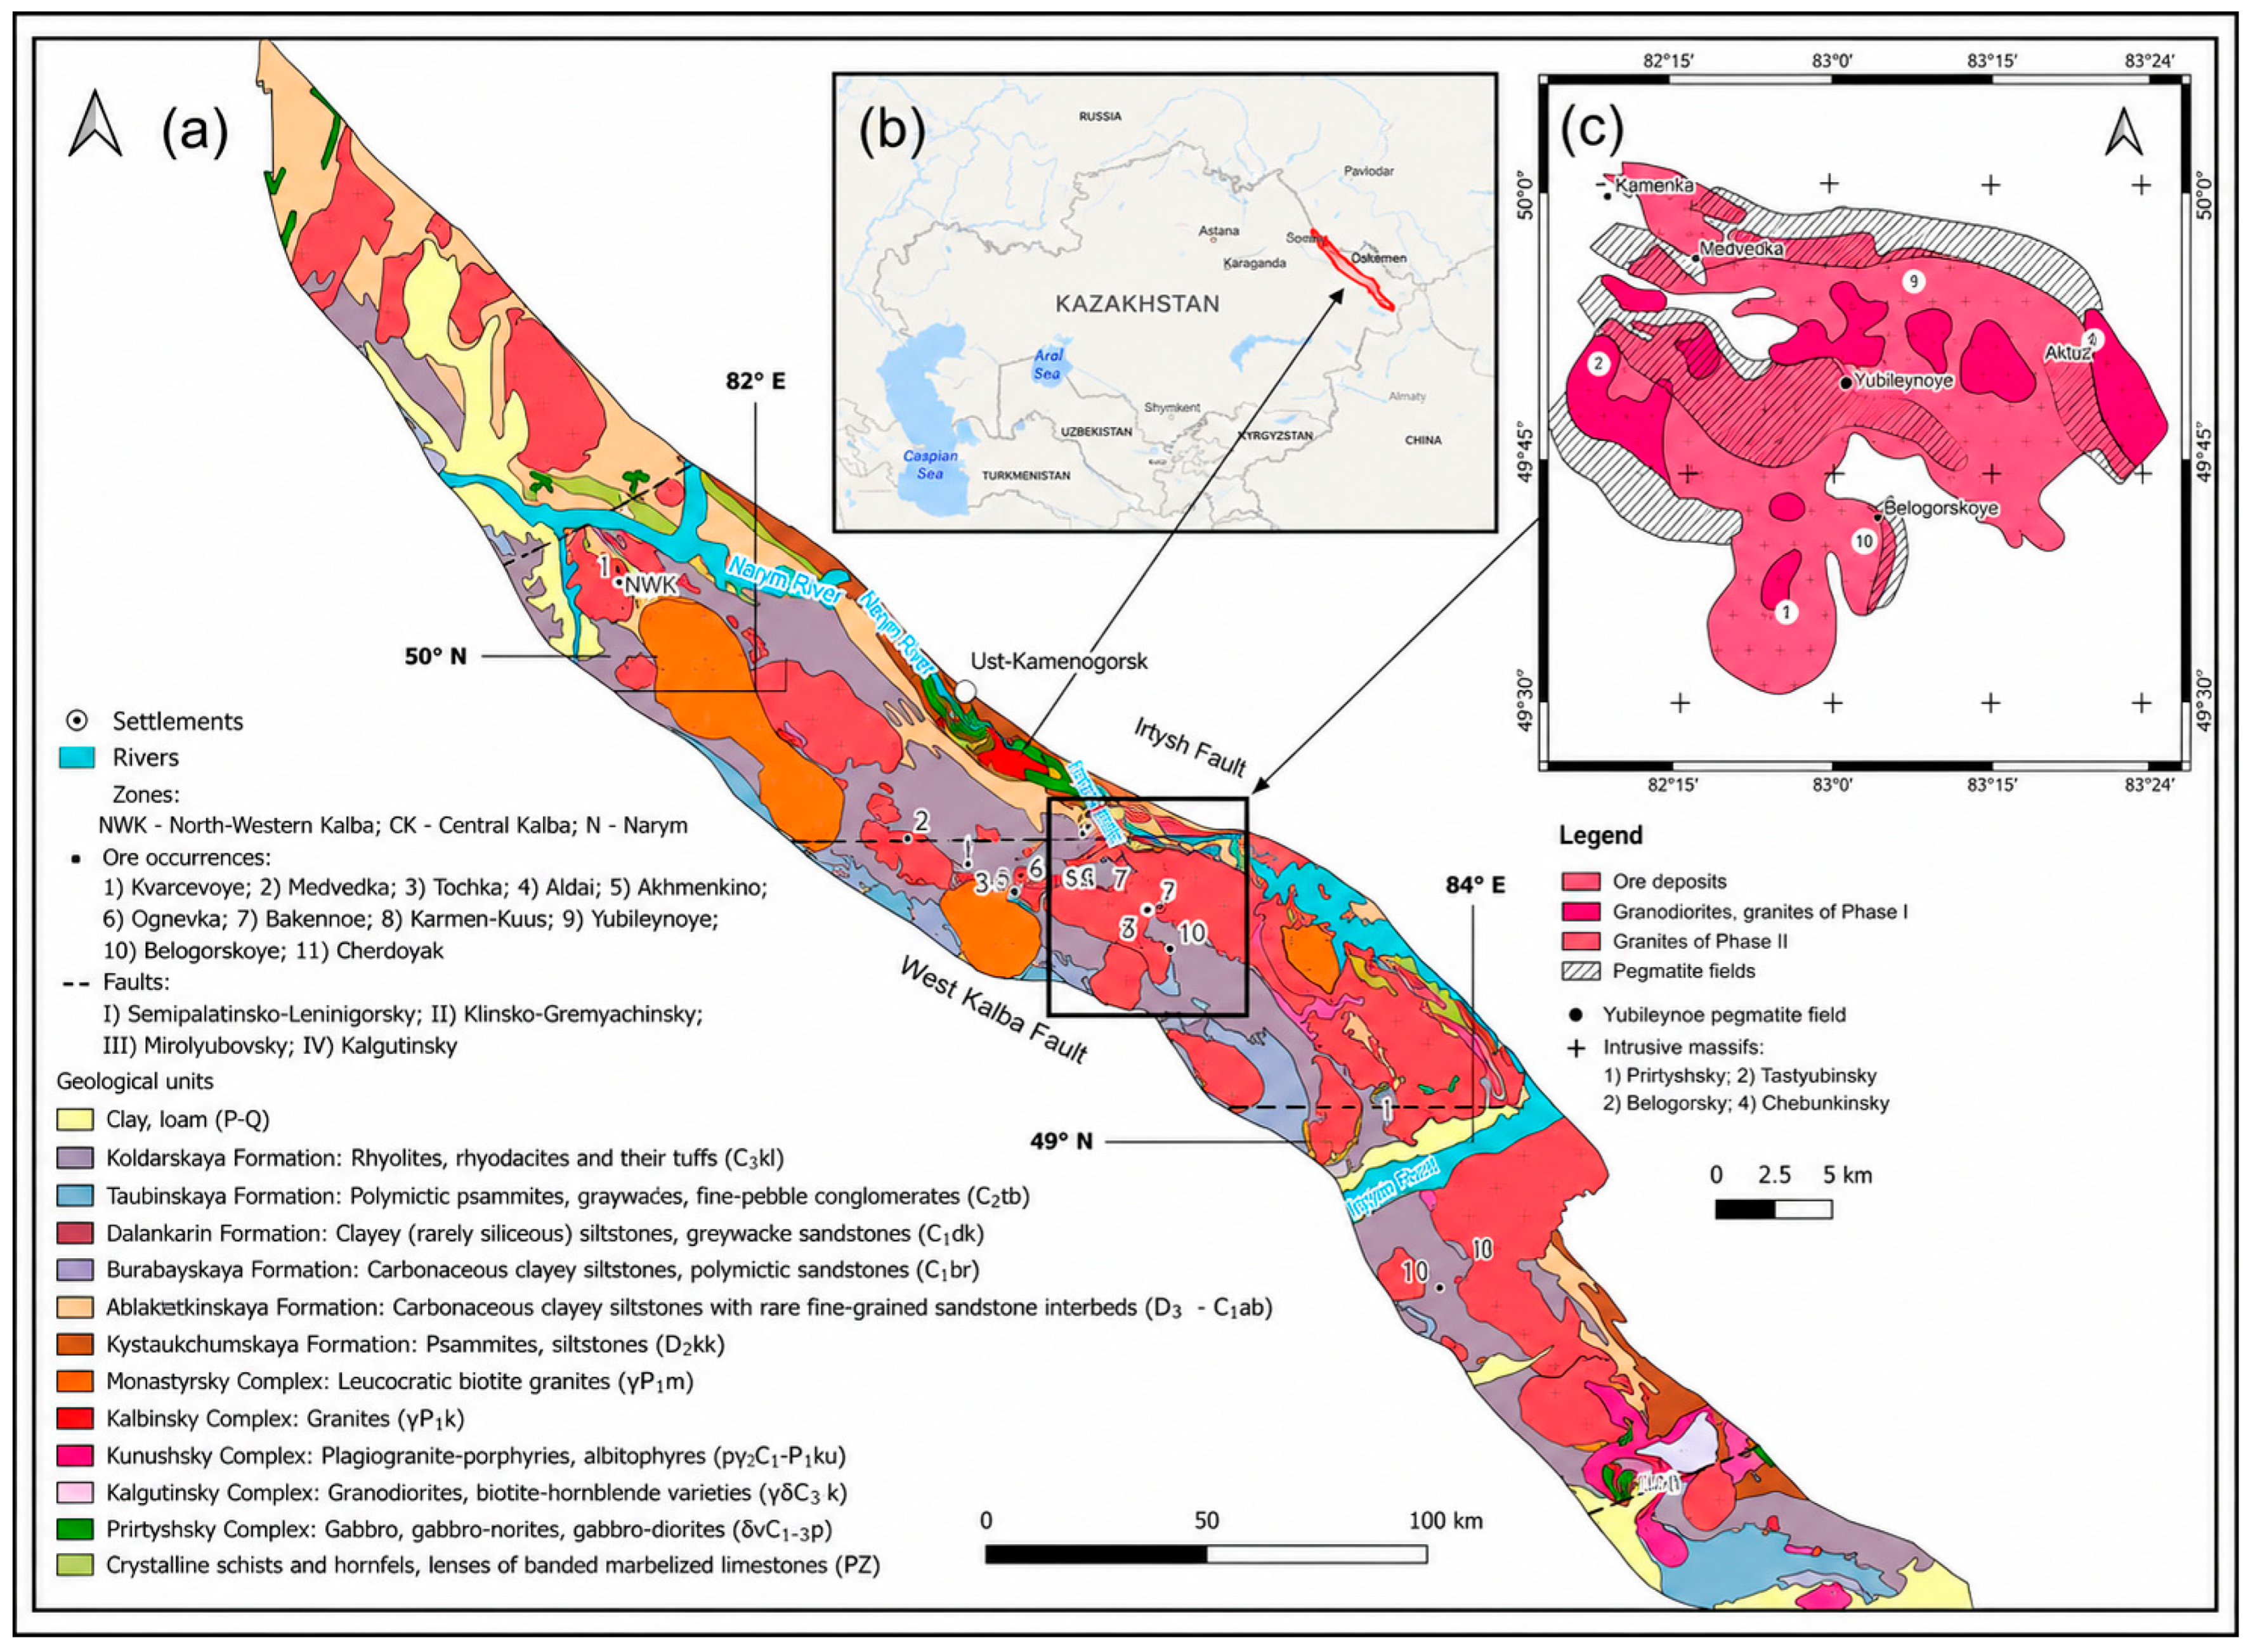
The Kalba–Narym metallogenic (ore) zone in the territory of East Kazakhstan region of the Republic of Kazakhstan, belonging to the southwestern part of the Altai Mountains, was selected as a research object for which the structure of the geological geoportal was developed. The Kalba–Narym belt extends for more than 500 km in a northwestern direction and ranges from 20 to 50 km in width. It extends from the Russian border in the northwest to the Chinese border in the southeast (Figure 1b). Tectonically, the belt is bounded by the Irtysh Fault to the northeast and the West Kalba Fault to the southwest (Figure 1a). The Kalba–Narym belt forms part of the Ob–Zaisan (Irtysh–Zaisan) Fold Belt, which developed during the Late Paleozoic as a result of the collision between the Siberian and Kazakhstan continental blocks [23,24].
Figure 1.
Kalba–Narym ore zone and Central Kalba: (a) Geological map of the Kalba–Narym ore belt; (b) Location of the ore belt within the territory of East Kazakhstan; (c) Geological map of Central Kalba.
The Kalba–Narym zone is a flysch basin of Middle Devonian to Middle Carboniferous age, composed of carbonaceous clayey siltstones, sandstones, and black shale sequences with a thickness of 7–10 km. Sedimentation began in the Devonian within a fore-arc basin due to the erosion of Rudny Altai volcanics, and during the Carboniferous shifted to passive margin conditions. The subsequent emplacement of the Kalba–Narym granitoid batholith is attributed to post-collisional extension and, according to several studies, the influence of the Tarim plume, which makes the region highly prospective for pegmatite formation [25].
Three major magmatic complexes are distinguished within the Kalba–Narym Batholith based on their age, composition, and degree of magmatic evolution: the Kunush, Kalba, and Monastyr complexes.
The Kunush Complex (Late Carboniferous–Early Permian) comprises small intrusive bodies and stocks and is represented predominantly by numerous dikes trending in a northwestern direction [26].
The Kalba Complex (Early Permian) forms the principal part of the batholith and is characterized by large, multiphase granodiorite and granite intrusions with a dominant northwestern strike.
The Monastyr Complex (Early Permian; late leucogranites) also follows the regional northwestern structural trend and consists of a chain of leucogranite plutons distributed along this direction [27].
Overall, geochronological and petrochemical evidence indicates that granitoid magmatism in the Kalba–Narym belt evolved through multiple magmatic stages. This evolution progressed from early arc-related granitoids of the Kunush Complex to large granodiorite–granite intrusions of the Kalba Complex, followed by highly differentiated leucogranites and associated dike swarms of the Monastyr Complex.
The rare-metal LCT (Li–Cs–Ta) pegmatites are genetically associated with the final stages of evolution of this batholithic magmatic system. Their formation is interpreted to result from the enrichment of incompatible elements in residual melts and exsolved magmatic fluids during the late stages of crystallization of the Kalba and Monastyr granites [28,29].
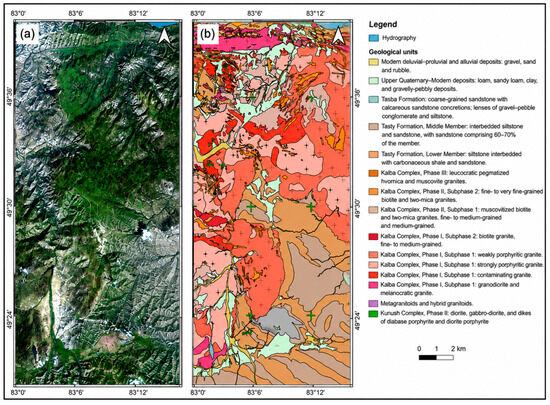
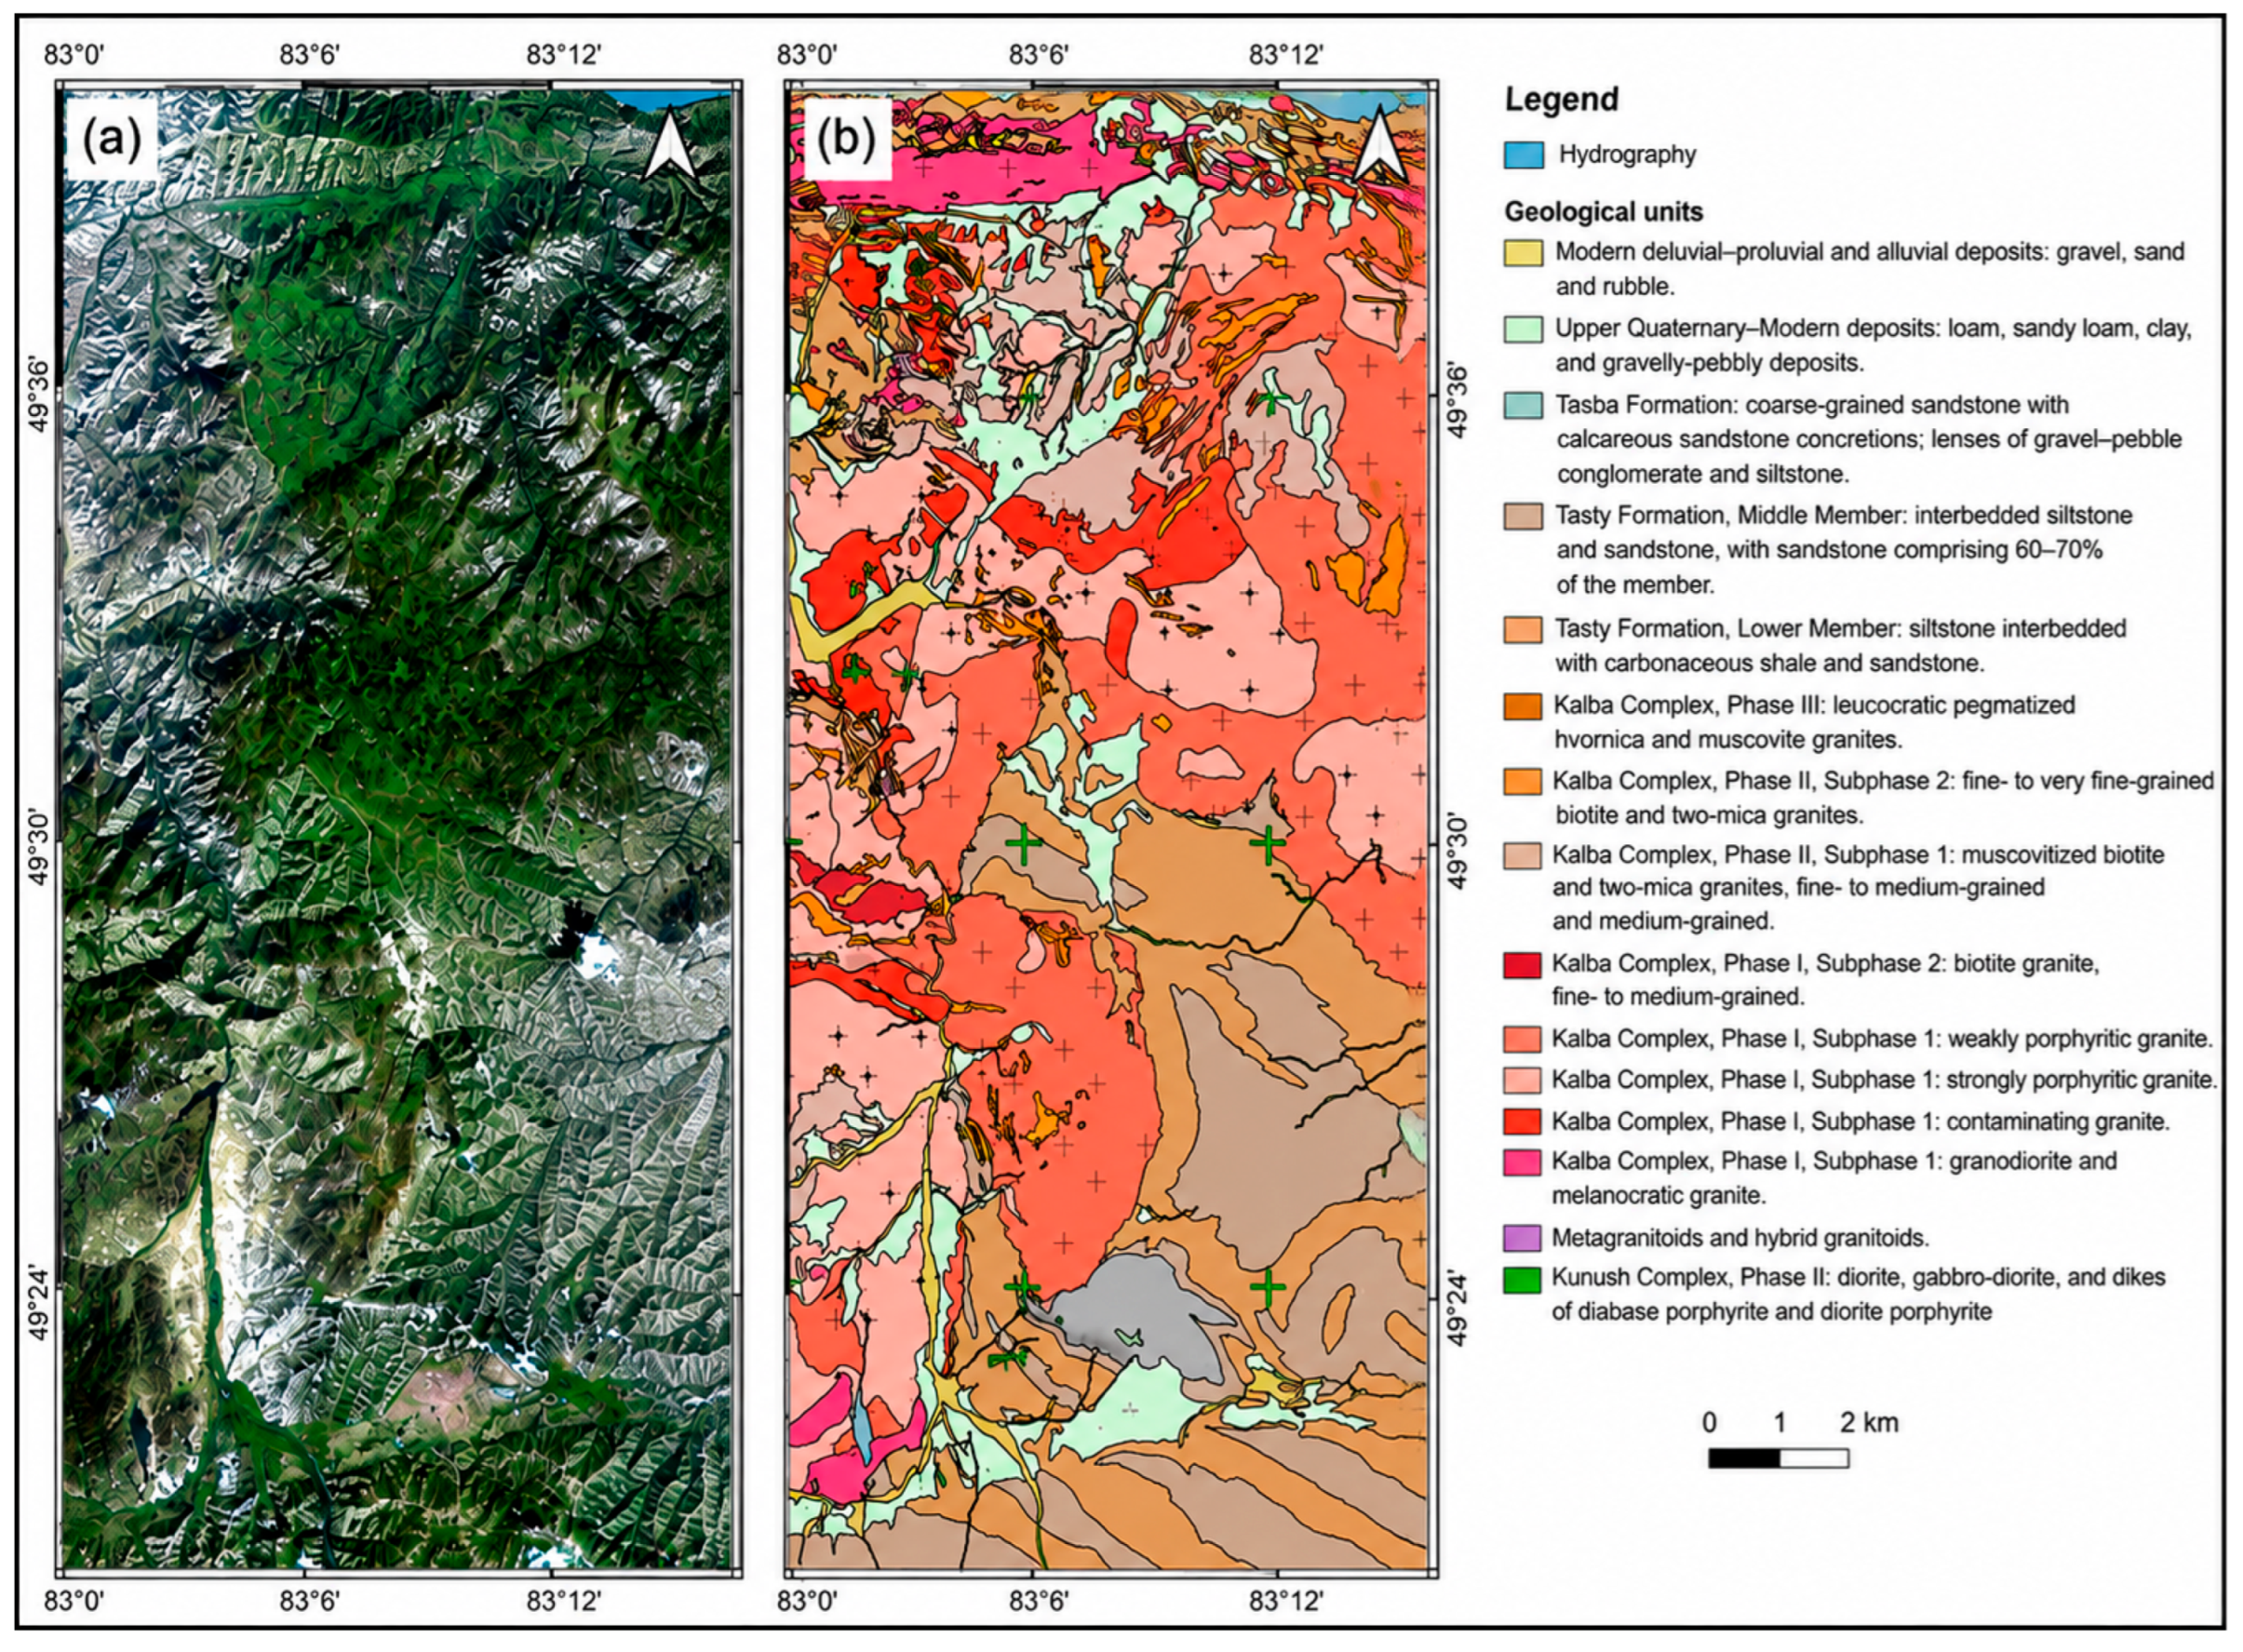
Rare-metal pegmatites and quartz-vein occurrences of Central Kalba (Figure 1c) are spatially associated with endo- and exocontacts, as well as with the apical parts of granitoid bodies of the Kalba complex (Figure 2a,b). The complex is represented by biotite granodiorites, porphyritic granites of various grain sizes, two-mica granites, as well as aplites, granite-aplites, and pegmatites [30].
Figure 2.
Asubulak Ore District (Central Kalba): (a) Landsat-8 image in natural colors; (b) Geological map.
3. Materials and Methods
3.1. Geospatial Information Systems for Optimized Rare Metal Exploration in Eastern Kazakhstan (GISORMEK) Database Structure
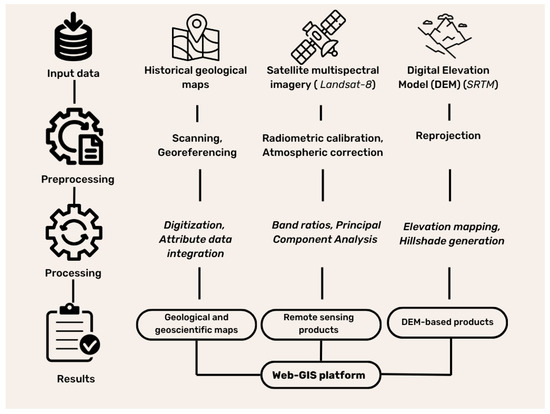
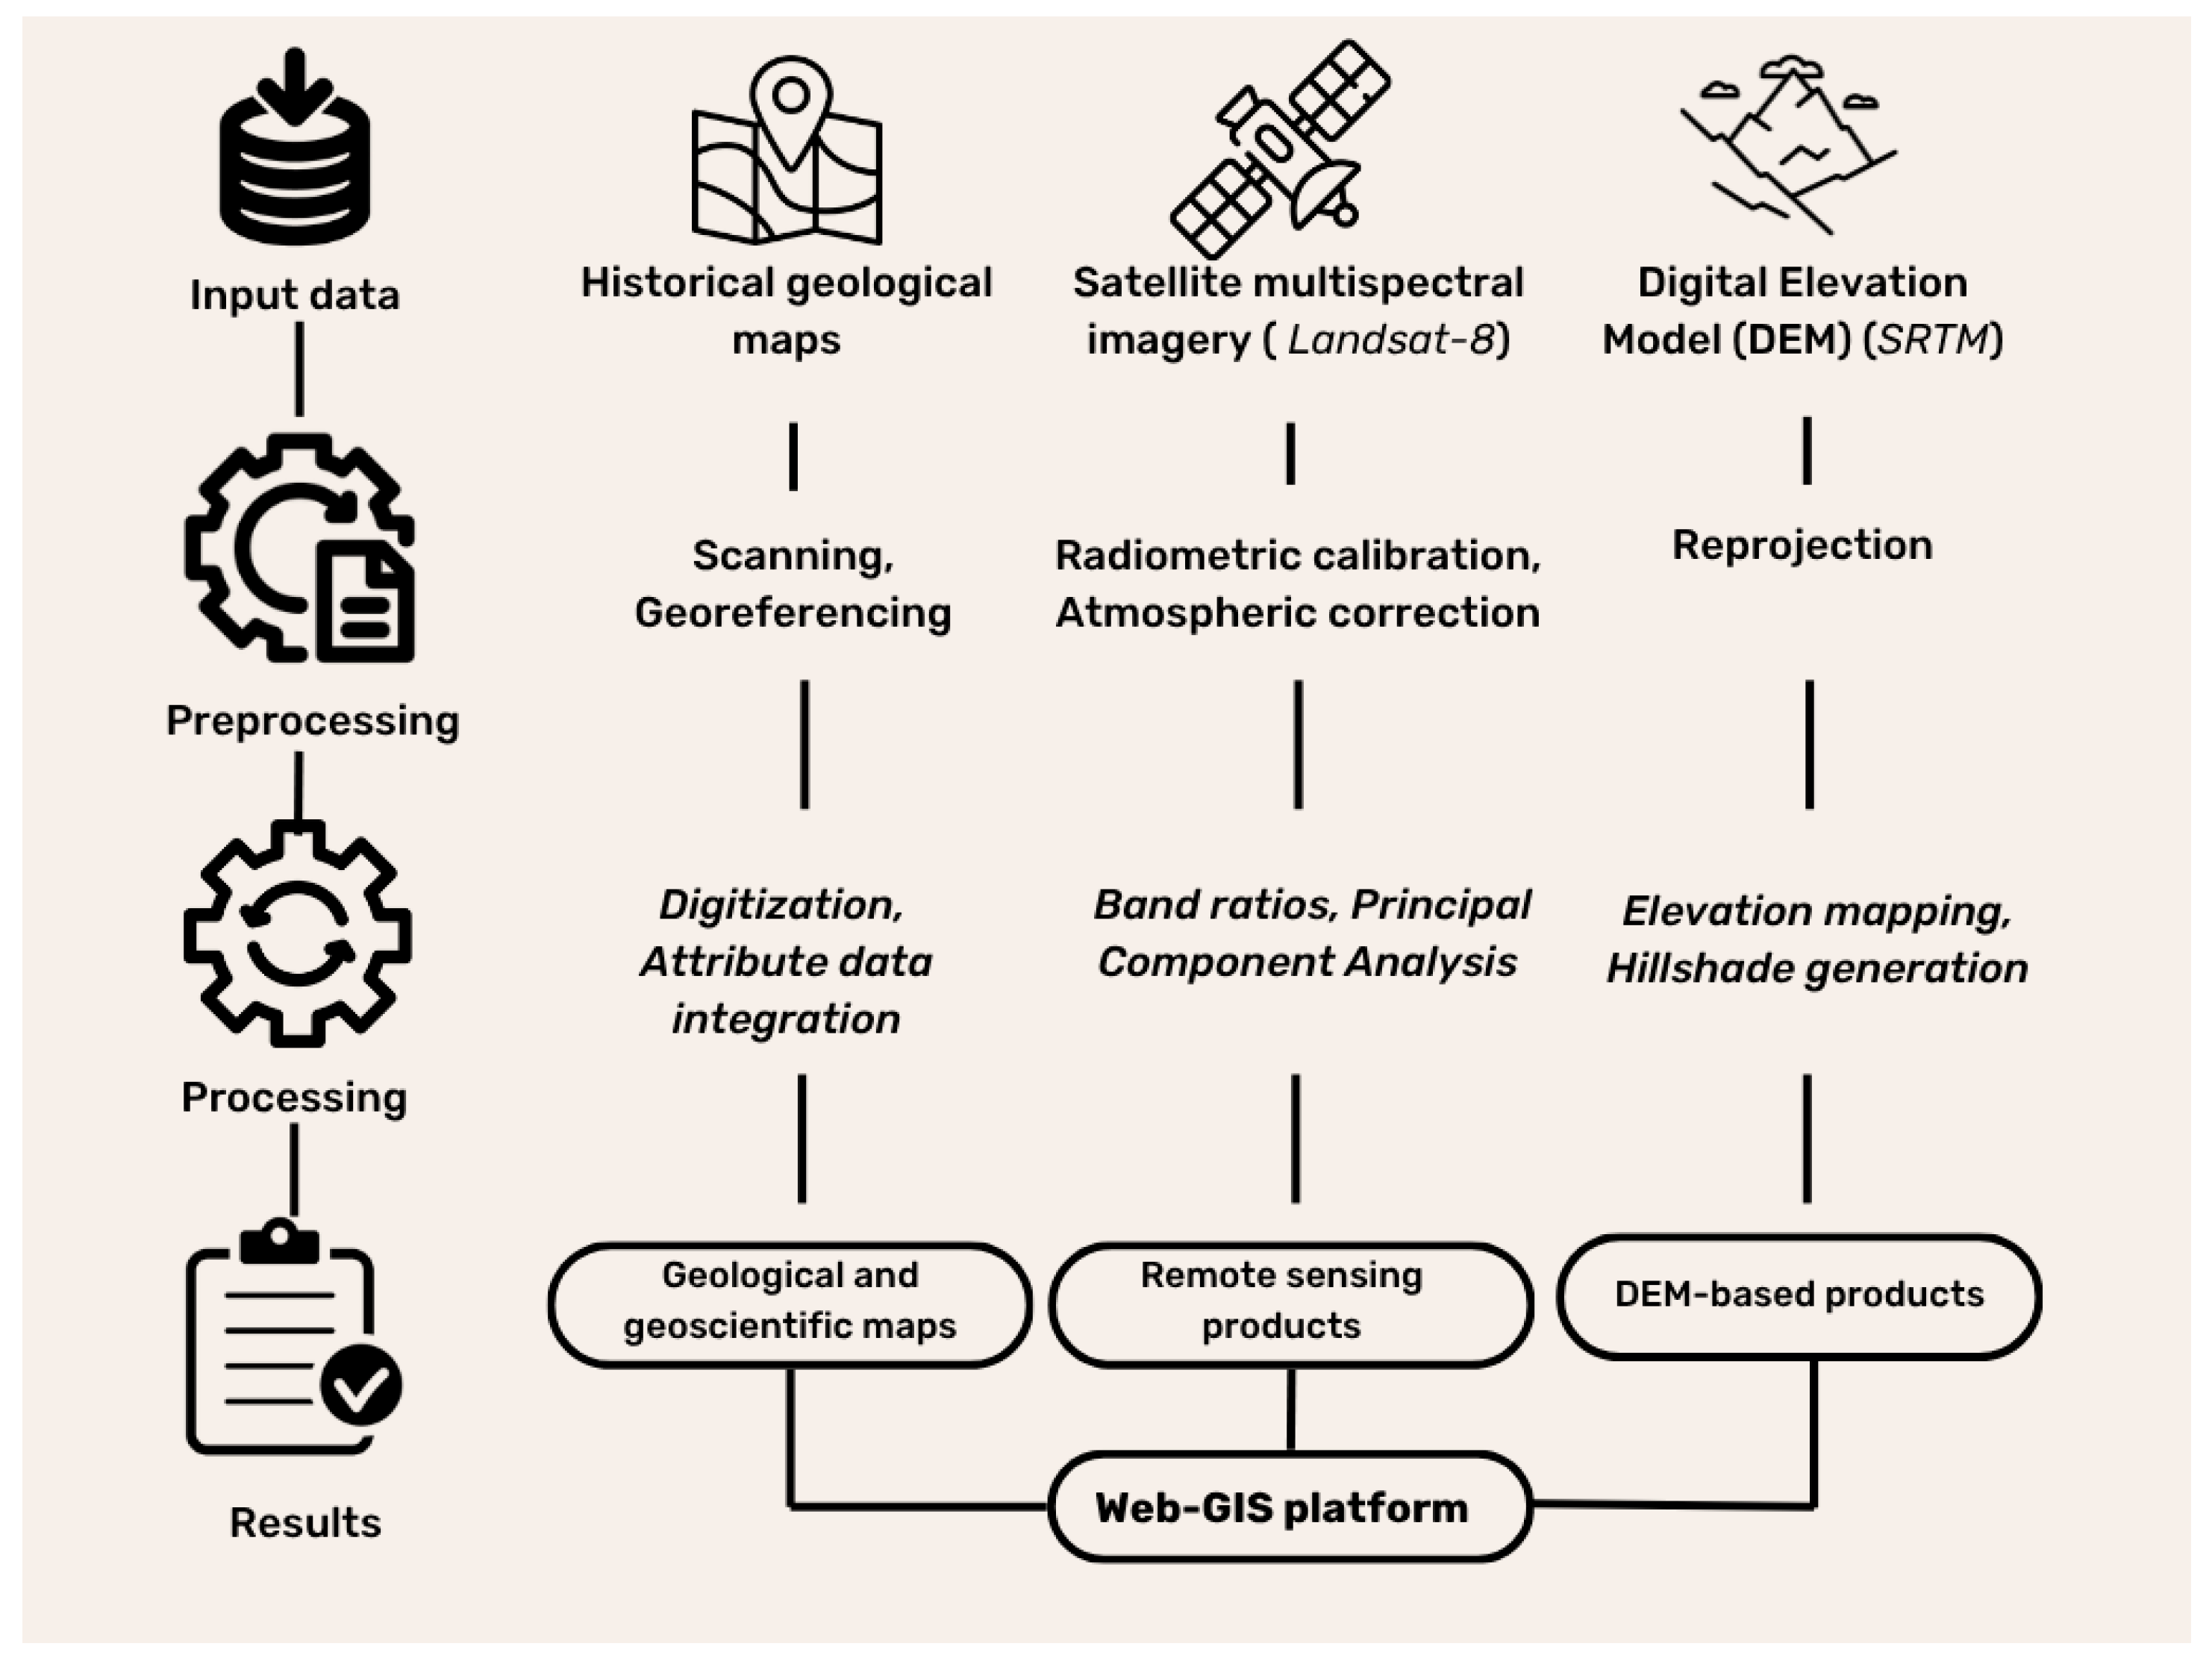
The GISORMEK geoportal consists of vector-topological spatial models and attribute data organized according to the layer-by-layer principle, which are interconnected by georelational data model. Large- and medium-scale maps of various purposes formed the basis of the GIS database of the Kalba–Narym ore zone and, in particular, the Asubulak ore field, while remote sensing materials and digital terrain models supplemented the database. The scheme of geospatial data processing and integration for Web GIS is shown in (Figure 3).
Figure 3.
Geospatial data processing and aggregation scheme for Web GIS.
The geospatial data in this scheme includes geological, topographical, geophysical and remote sensing data. Heterogeneous mapping materials from various sources were used to create overview (Kalba–Narym ore zone) and detailed (Central Kalba) Web GIS [31].
The main sources included archival paper maps, web maps (Web Map Service (WMS)), raster and vector maps from open sources (Table 2).
Table 2.
Geospatial datasets integrated into the GISORMEK database.
The collected maps are represented by scales: 1:1,000,000, 1:200,000, 1:100,000. 1:50,000, 1:10,000. The 1:1,000,000 scale maps used to create an overview geological map of the entire Kalba–Narym zone. In order to improve data reliability, paper maps were merged with WMS taken from OneGeology geoportal. The 1:200,000 scale maps used as a basis for creating digital maps of the ore field. The main data on geological exploration was obtained from the geological survey reports of the Republic of Kazakhstan. The created maps show geological, geophysical, geochemical and mineral information. The 1:100,000 and 1:50,000 scale maps describe the area at 49° 20′ N, 83° 00′ E and 49° 40′ N, 83° 15′ E coordinates. In addition to the above map sets, a large scale map (1:10,000) of the Asubulak ore field was used to detail the geological structures and deposits.
To perform geological mapping based on remote sensing of the Earth, satellite images were used. Satellite image selection is an important criterion for geological objects extraction and mapping. To select the necessary satellites, technical characteristics of known satellites were analyzed. In general, remote sensing satellites can be classified into several categories, depending on their technical and technological parameters: (i) spectral range; (ii) number of channels; (iii) spatial resolution. Widespread data from remote sensing satellites SPOT-5, Worldview-2, IKONOS, KazEOSat-1 and KazEOSat-2, do not meet the requirements of geological tasks because their spectral ranges are too narrow. Many rocks and minerals show their characteristics in the SWIR region, while the equipment of these satellites is limited to the near-infrared. As a result, the Landsat and Sentinel-2 satellite series meet the technical criteria. Landsat-8 was chosen among the Landsat satellites because one of the Landsat 7 sensors has technical problems and bands with missing data.
A digital elevation model (DEM) is required for geomorphological and lineament analysis. The elevation map and shadow terrain created based on the Shuttle Radar Topography Mission (SRTM) DEM.
3.2. Map Digitisation Techniques
In the first stage of GIS database development, archival paper geological maps were scanned and prepared for digital processing. The scanned maps were subsequently georeferenced in Quantum GIS (QGIS) version 3.34 using the Georeferencer plugin [39,40,41].
The original geological maps were compiled in the Pulkovo 1942/Gauss–Krüger coordinate system. To ensure the spatial consistency of all datasets, the maps were transformed to the WGS84/UTM Zone 44N coordinate reference system, which was selected because the entire study area is located within UTM Zone 44N and because it provides a common projection for integrating geological, geophysical, geochemical, topographic, and remote sensing datasets [31].
Georeferencing was performed using a first-order polynomial transformation based on a minimum of five well-distributed ground control points (GCPs). Control points were selected at stable cartographic features, including map grid intersections and other clearly identifiable reference locations. Nearest-neighbour resampling was applied to preserve the original raster information during image transformation.
The quality of the geometric transformation was evaluated using the root mean square error (RMSE) calculated from the residuals of the GCPs. For all archival maps, the RMSE remained below one pixel (e.g., approximately 0.22 pixels for the 1:50,000 geological map), indicating a high-quality geometric fit between the source maps and the target coordinate system. It should be noted that these RMSE values describe only the accuracy of the georeferencing transformation and should not be interpreted as the positional accuracy of the original geological maps. The spatial uncertainty of geological boundaries is primarily controlled by the compilation methods, cartographic generalization, and scale of the source maps (1:50,000–1:200,000), and therefore exceeds the transformation error.
Following georeferencing, all geological boundaries, faults, mineral occurrences, and thematic layers were manually vectorized in QGIS. Quality control was performed by visually comparing the vectorized features with the original maps, checking the consistency of adjacent map sheets, and cross-validating major geological boundaries against Landsat-8 imagery where appropriate.
Each geological object and process used separate geometric primitives (point, line, and polygon). Each entity was placed on a separate layer. For example, the geological map included layers such as “Geological complexes and formations” “Dykes”, “Geological boundaries” and “Discontinuities”. Objects are vectorized in Shape files format, UTF-8 (Unicode Transformation Format-8 bit) encoding. Polygon layers were created using a topology-preserving editing workflow. Instead of digitizing adjacent polygons independently, a single polygon was first created and subsequently subdivided into individual geological units using the Split Features tool. This approach ensured that neighboring polygons shared common boundaries and minimized topological inconsistencies such as gaps and overlaps. During digitization, snapping was enabled to automatically align vertices and line segments with existing features, thereby reducing positional errors and maintaining topological consistency. Raster Tracer was selected from among many modules. It is a module of semi-automatic vectorisation of raster substrate in QGIS [41].
Layer mapping properties were changed using rule-based symbolisation. Working with this type of symbolisation requires the use of expressions for filtering. QGIS uses the QGIS Expression Language for this purpose. This is a query language, similar to SQL (Structured Query Language), for working with attributes and geometry of objects. Expressions are built using the fields and values of the attribute layer tables.
After the spatial layers had been created and edited, attribute information was assigned to each vector feature. Spatial and attribute data were linked using the georelational data model [42], in which each feature is associated with its corresponding attribute record through a unique identifier (ID).
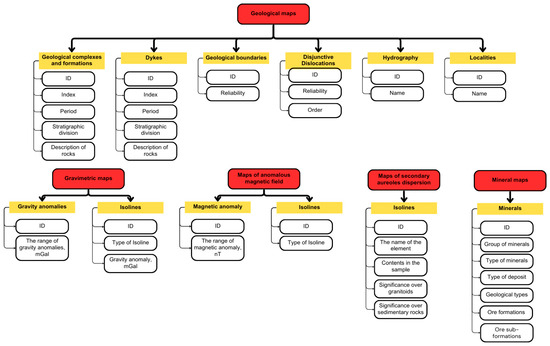
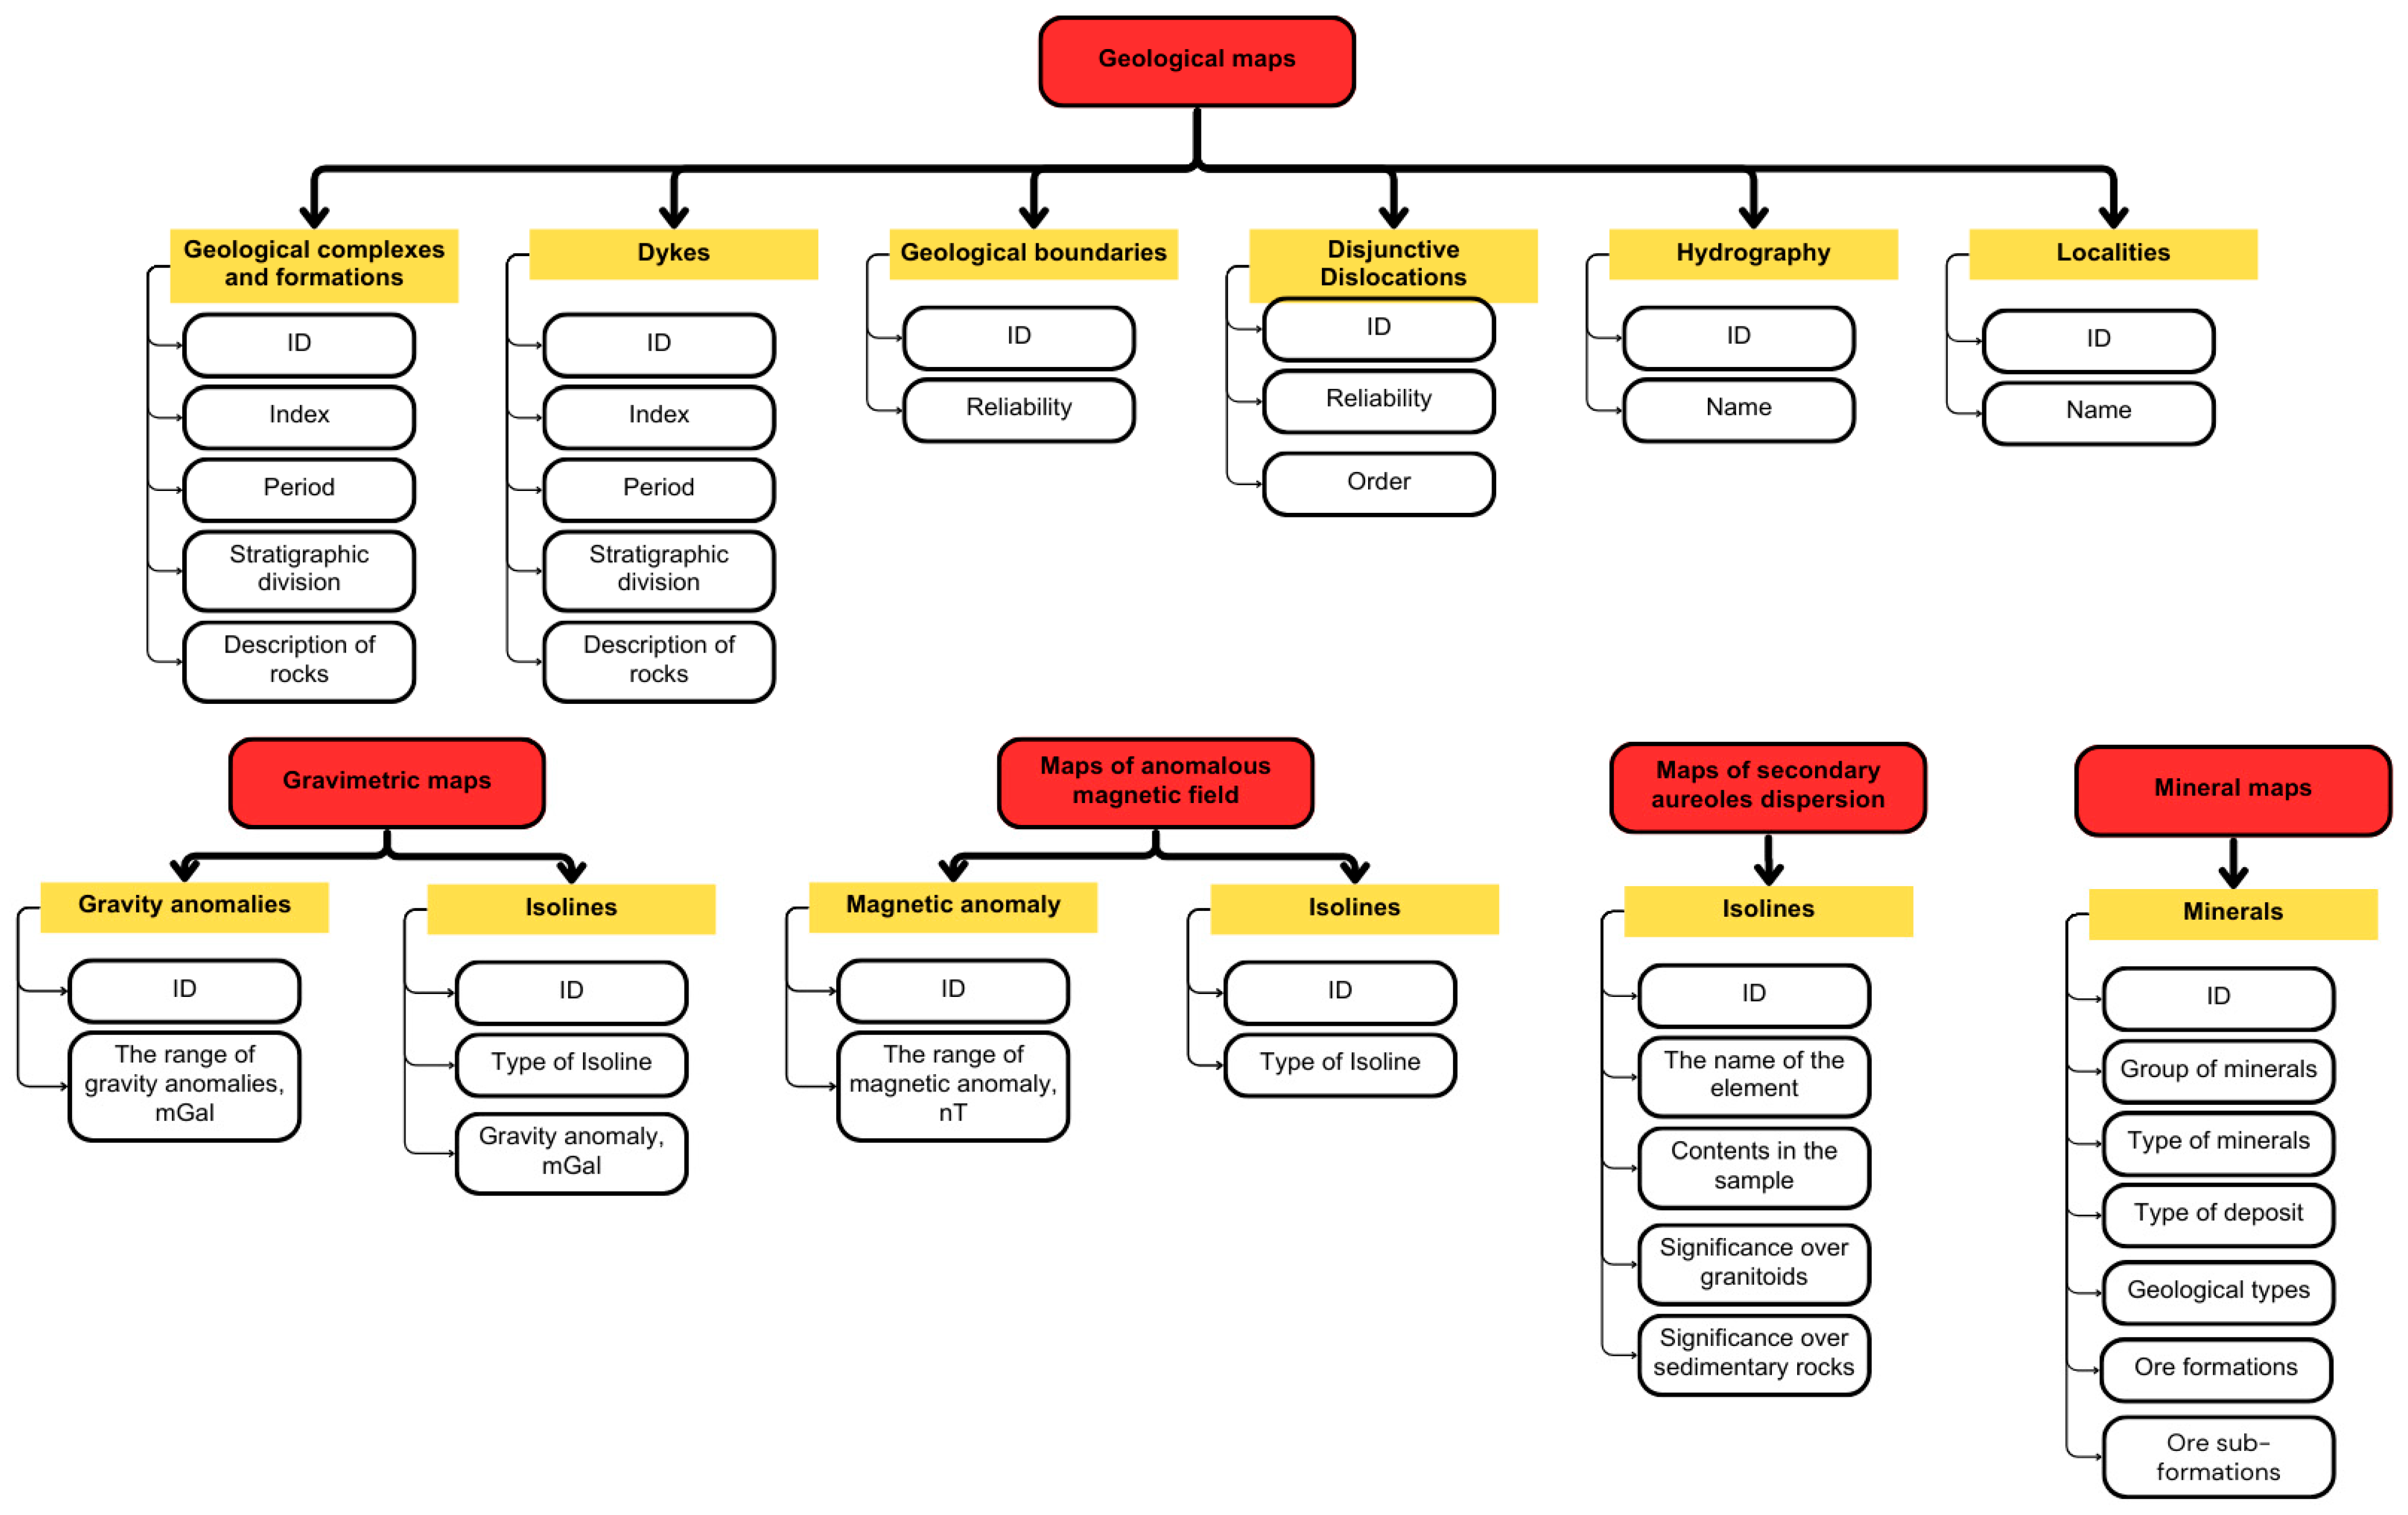
Each layer has an attribute table. Each layer attribute table consists of an automatically generated identifier (ID) and fields characterizing the object. For example, one of the layers of the geological map is “Geological complexes and formations”, which in turn consists of the following fields: ID; geological index; geological period; stratigraphic divisions that specify the names of intrusive complexes and formations; description of rocks (Figure 4).
Figure 4.
Structure and content of attribute data of the GISORMEK geoportal.
Thus, each map contains unique information. The integration of all maps into a single web GIS allows users to switch layers on and off selectively, so the project team did not digitize some recurring map elements. For example, the original 1:200,000 mineral map used the geological map as a base layer. Since the geological map already existed, the team selected only the elements related to mineral data.
3.3. Use of Remote Sensing Data
In addition, remote sensing data has been added to traditional geological maps. The ability to identify rocks and minerals in satellite images is based on the principle that these objects interact with electromagnetic radiation, in this case visible, near-infrared (NIR) and shortwave infrared (SWIR). Electronic transitions and vibrations of ions within minerals affect the degree of spectral absorption or reflection. In particular, the presence of iron, hydroxyl ions or carbonates in the mineral composition influences this [43]. The authors added pre-processed Landsat-8 remote sensing image to the GISORMEK geoportal [44]. Technologically, the process of remote sensing data processing and integration can be described in the following steps:
- A multispectral Landsat-8 image was downloaded from the USGS EarthExplorer portal. A Level-1 Terrain Corrected (L1TP) scene with the identifier LC81470262025157LGN00, acquired on 6 June 2025, was selected for this study. The multispectral image is referenced to the WGS 84 datum and projected in the UTM Zone 44N coordinate system.
- Image preprocessing was performed in ENVI 5.3 to improve image quality and minimize atmospheric effects. The preprocessing workflow included conversion of digital numbers (DN) to top-of-atmosphere (TOA) radiance, followed by radiometric calibration to surface reflectance. Atmospheric correction was then carried out using the QUAC (Quick Atmospheric Correction) module with the image metadata file.
- Geological image interpretation was performed using two approaches: Principal Component Analysis (PCA) and band ratio (BR)-based geological spectral indices. PCA is a mathematical transformation that converts correlated spectral bands into a new set of mutually orthogonal and uncorrelated principal components, thereby enhancing spectral contrast and reducing data redundancy [45]. In this study, all 7 multispectral Landsat-8 bands were used for PCA. Band ratio (BR) is a technique in which the digital values of one spectral band are divided by those of another spectral band. This method enhances the spectral response of specific surface materials while reducing the influence of illumination differences, terrain shading, and topographic effects [44]. Based on this approach, geological spectral indices for iron oxides and hydroxyl-bearing (Al–OH) minerals were calculated. The formulas used to derive these indices are presented in Table 3.Table 3. Recommended Band ratios.
PCA was applied for lithological mapping by generating high-contrast principal component (PC) images, which enhance spectral differences between lithological units. In addition, PCA was used to identify subtle and previously unrecognized geological anomalies. Band ratio-derived spectral indices were employed to delineate zones of hydrothermal alteration, with particular emphasis on iron oxide and hydroxyl-bearing (Al–OH) mineral assemblages.
3.4. Adding a Digital Elevation Model (DEM)
The Shuttle Radar Topography Mission (SRTM) digital elevation model (DEM) was used to generate the elevation and hillshade maps. The DEM, with a spatial resolution of 30 m in GeoTIFF format, was obtained from the CGIAR (Consultative Group for International Agricultural Research) Consortium for Spatial Information. The elevation map was generated in QGIS by applying appropriate raster visualization settings, whereas the hillshade map was produced using the Google Earth Engine (GEE) platform based on the same SRTM DEM and its built-in terrain analysis functions.
This preparation of input data completed the development of the GISORMEK geoportal structure. The next step involves building the geoportal and testing it for geological problem-solving.
4. Results
4.1. Creation of Geological Database of the GISORMEK Geoportal
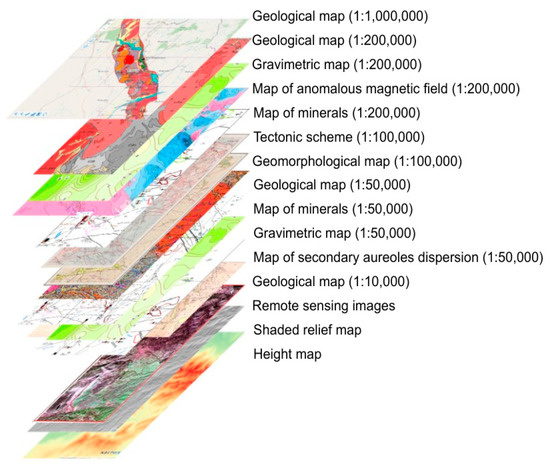
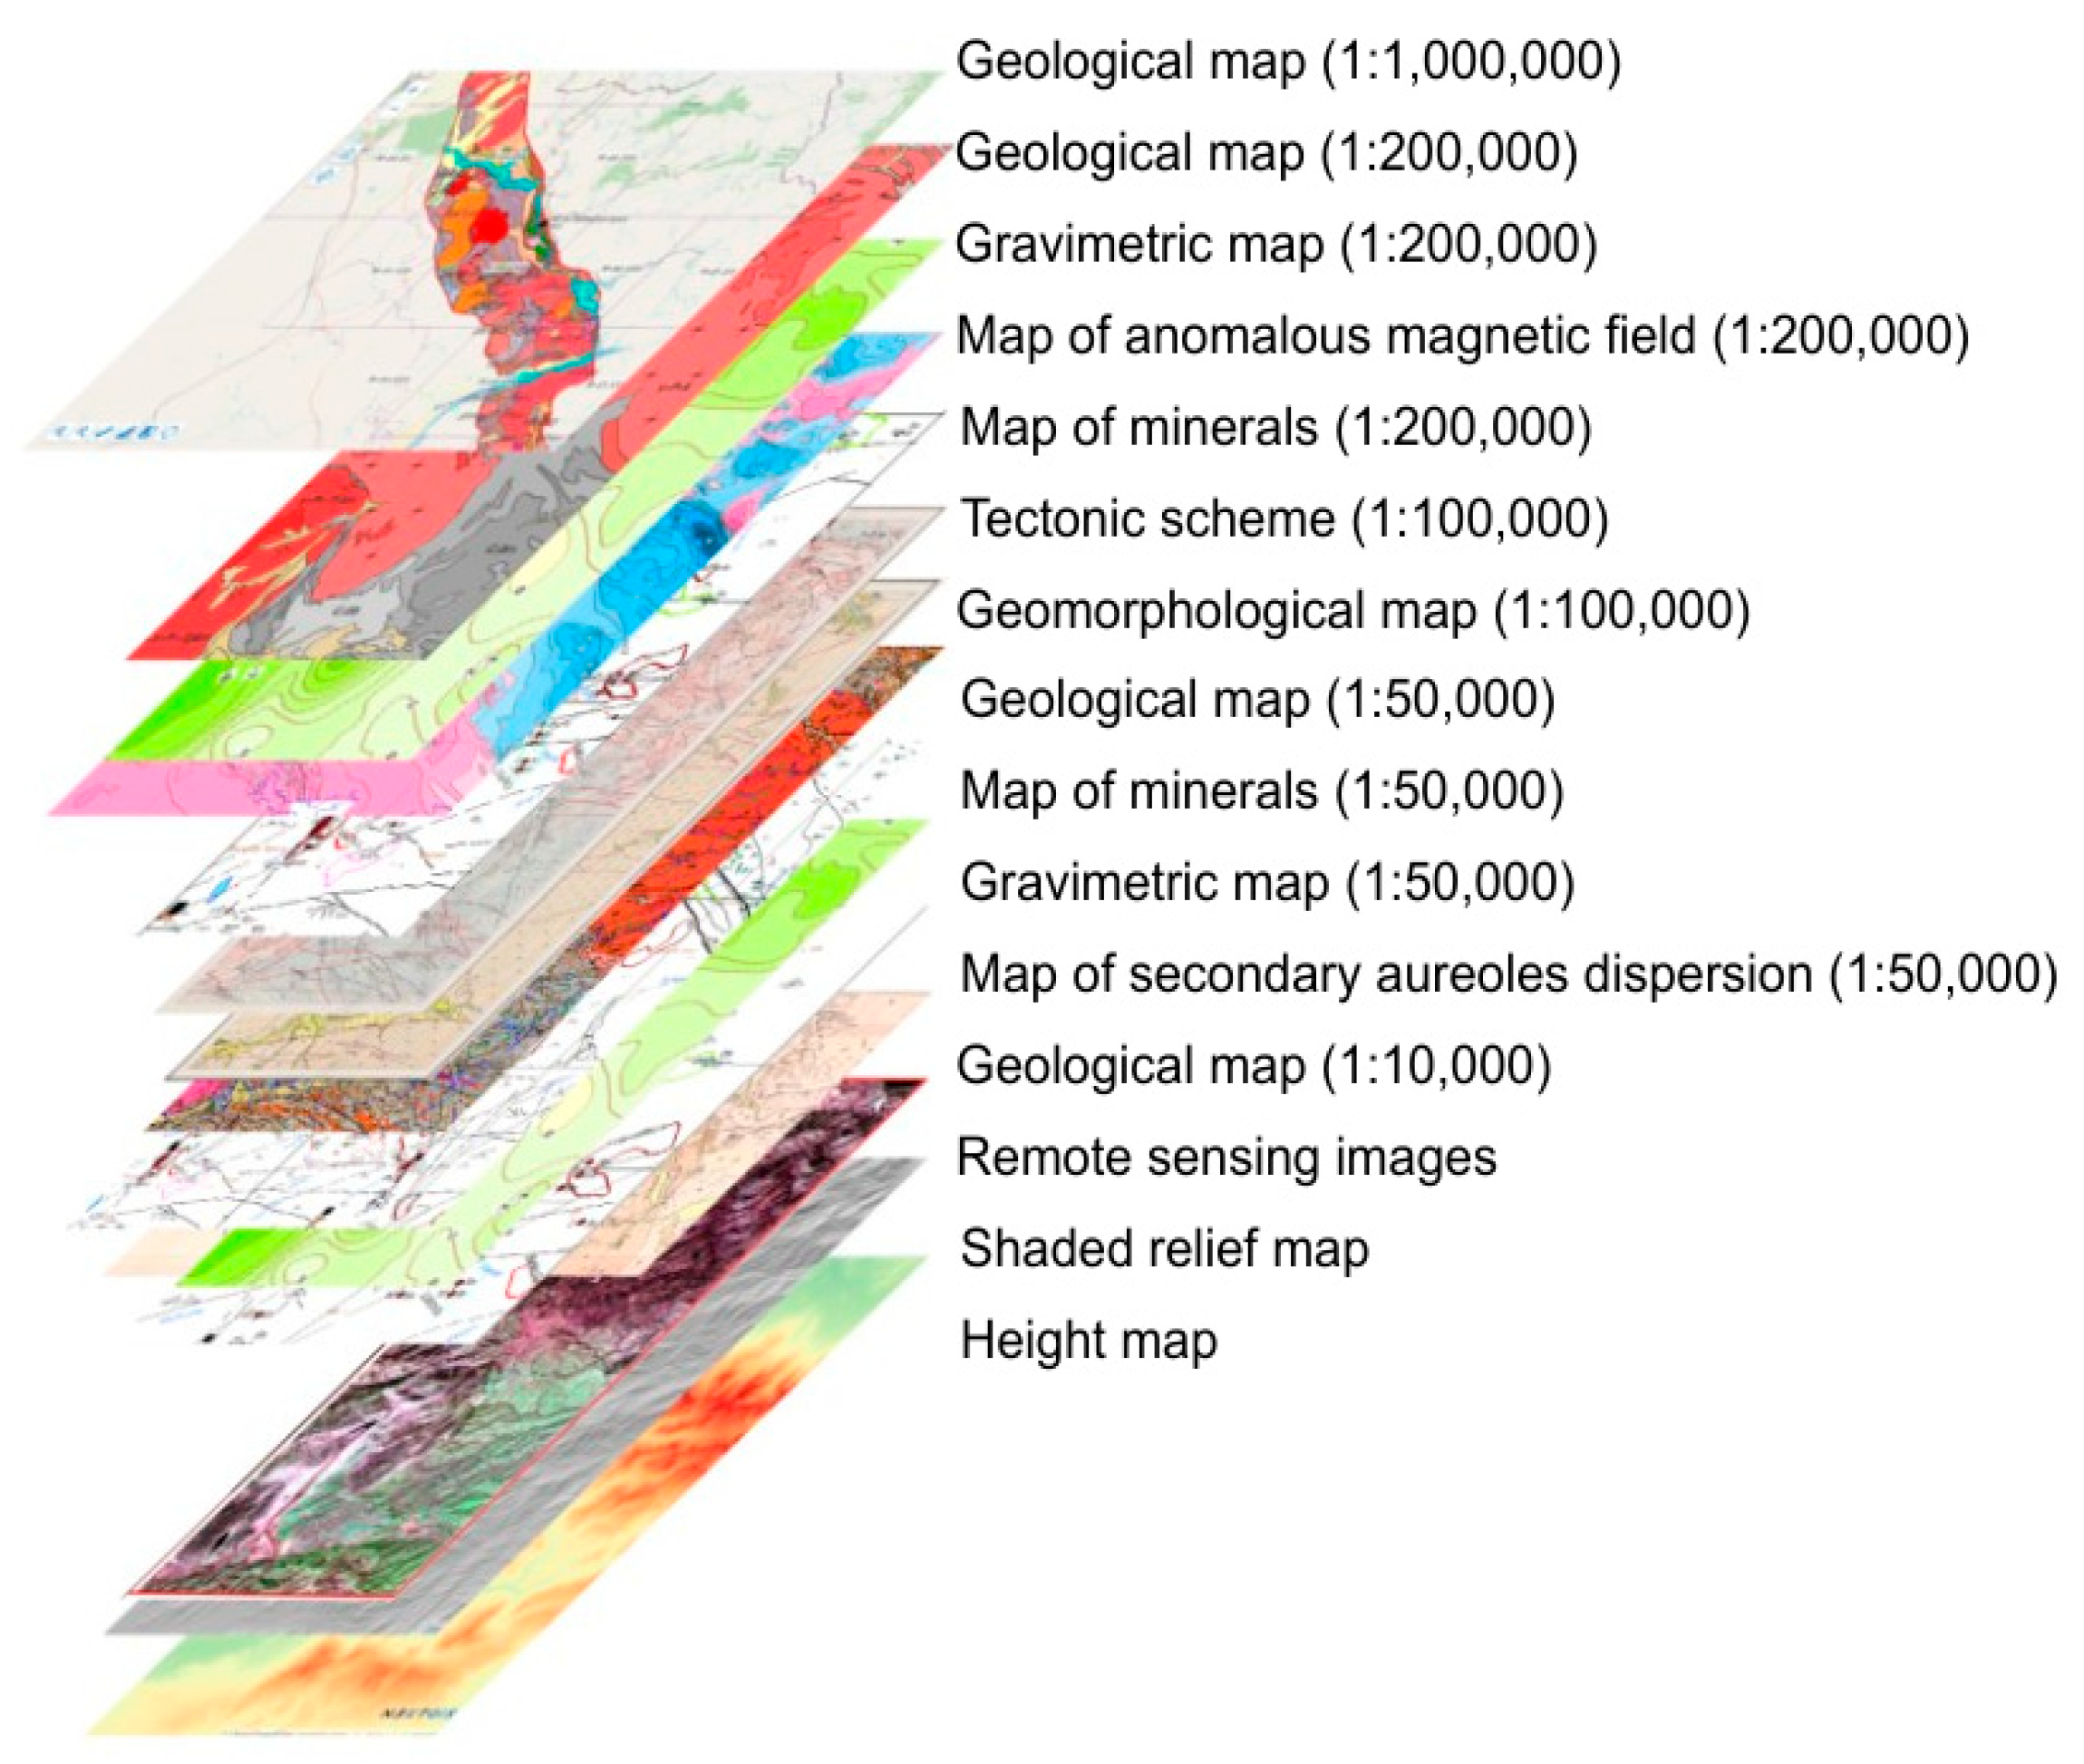
The database is organized and grouped according to the scale and occupied territories of the created maps (Figure 5).
Figure 5.
Structure of data organization in GISORMEK Web GIS.
The GISORMEK geoportal is organized according to the hierarchical geological framework of ore zone—ore field—deposit. At the regional level, the Kalba–Narym rare-metal belt is represented by a geological map at a scale of 1:1,000,000. The central part of the belt, corresponding to the Asubulak ore field, is presented at multiple scales (1:1,000,000, 1:200,000, 1:100,000, 1:50,000 and 1:10,000) to support analyses at different levels of spatial detail. The ore field includes an integrated collection of geological, geophysical, geochemical, tectonic, and mineral occurrence maps.
Following the development of the desktop GIS, the geospatial database was deployed as a Web-GIS application. This implementation improves data accessibility and facilitates wider dissemination of geological information through a browser-based platform. As a Rich Internet Application (RIA), GISORMEK enables users to visualize and interact with geospatial datasets via a web browser, while data storage, processing, and analytical operations are performed on the server side.
NextGIS—Web was chosen as the working platform due to its wide functionality. The server part of the platform as a database uses PostgreSQL with PostGIS extension for storing and processing geospatial data. The client part is based on Leaflet and OpenLayers. The service interacts with different types of data: Open Geospatial Consortium (OGC) standards, GeoJSON (Geographical JavaScript Object Notation), KML (Keyhole Markup Language), GML (Geography Markup Language) and Shapefile. It was the ability to use Shapefile and save QGIS. layer styles that was the deciding factor in choosing this platform.
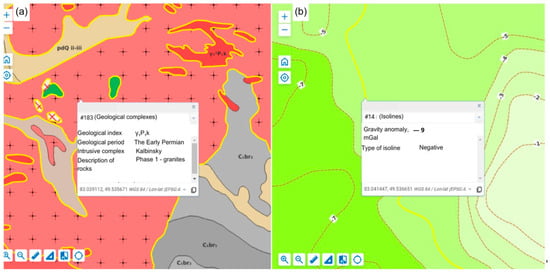
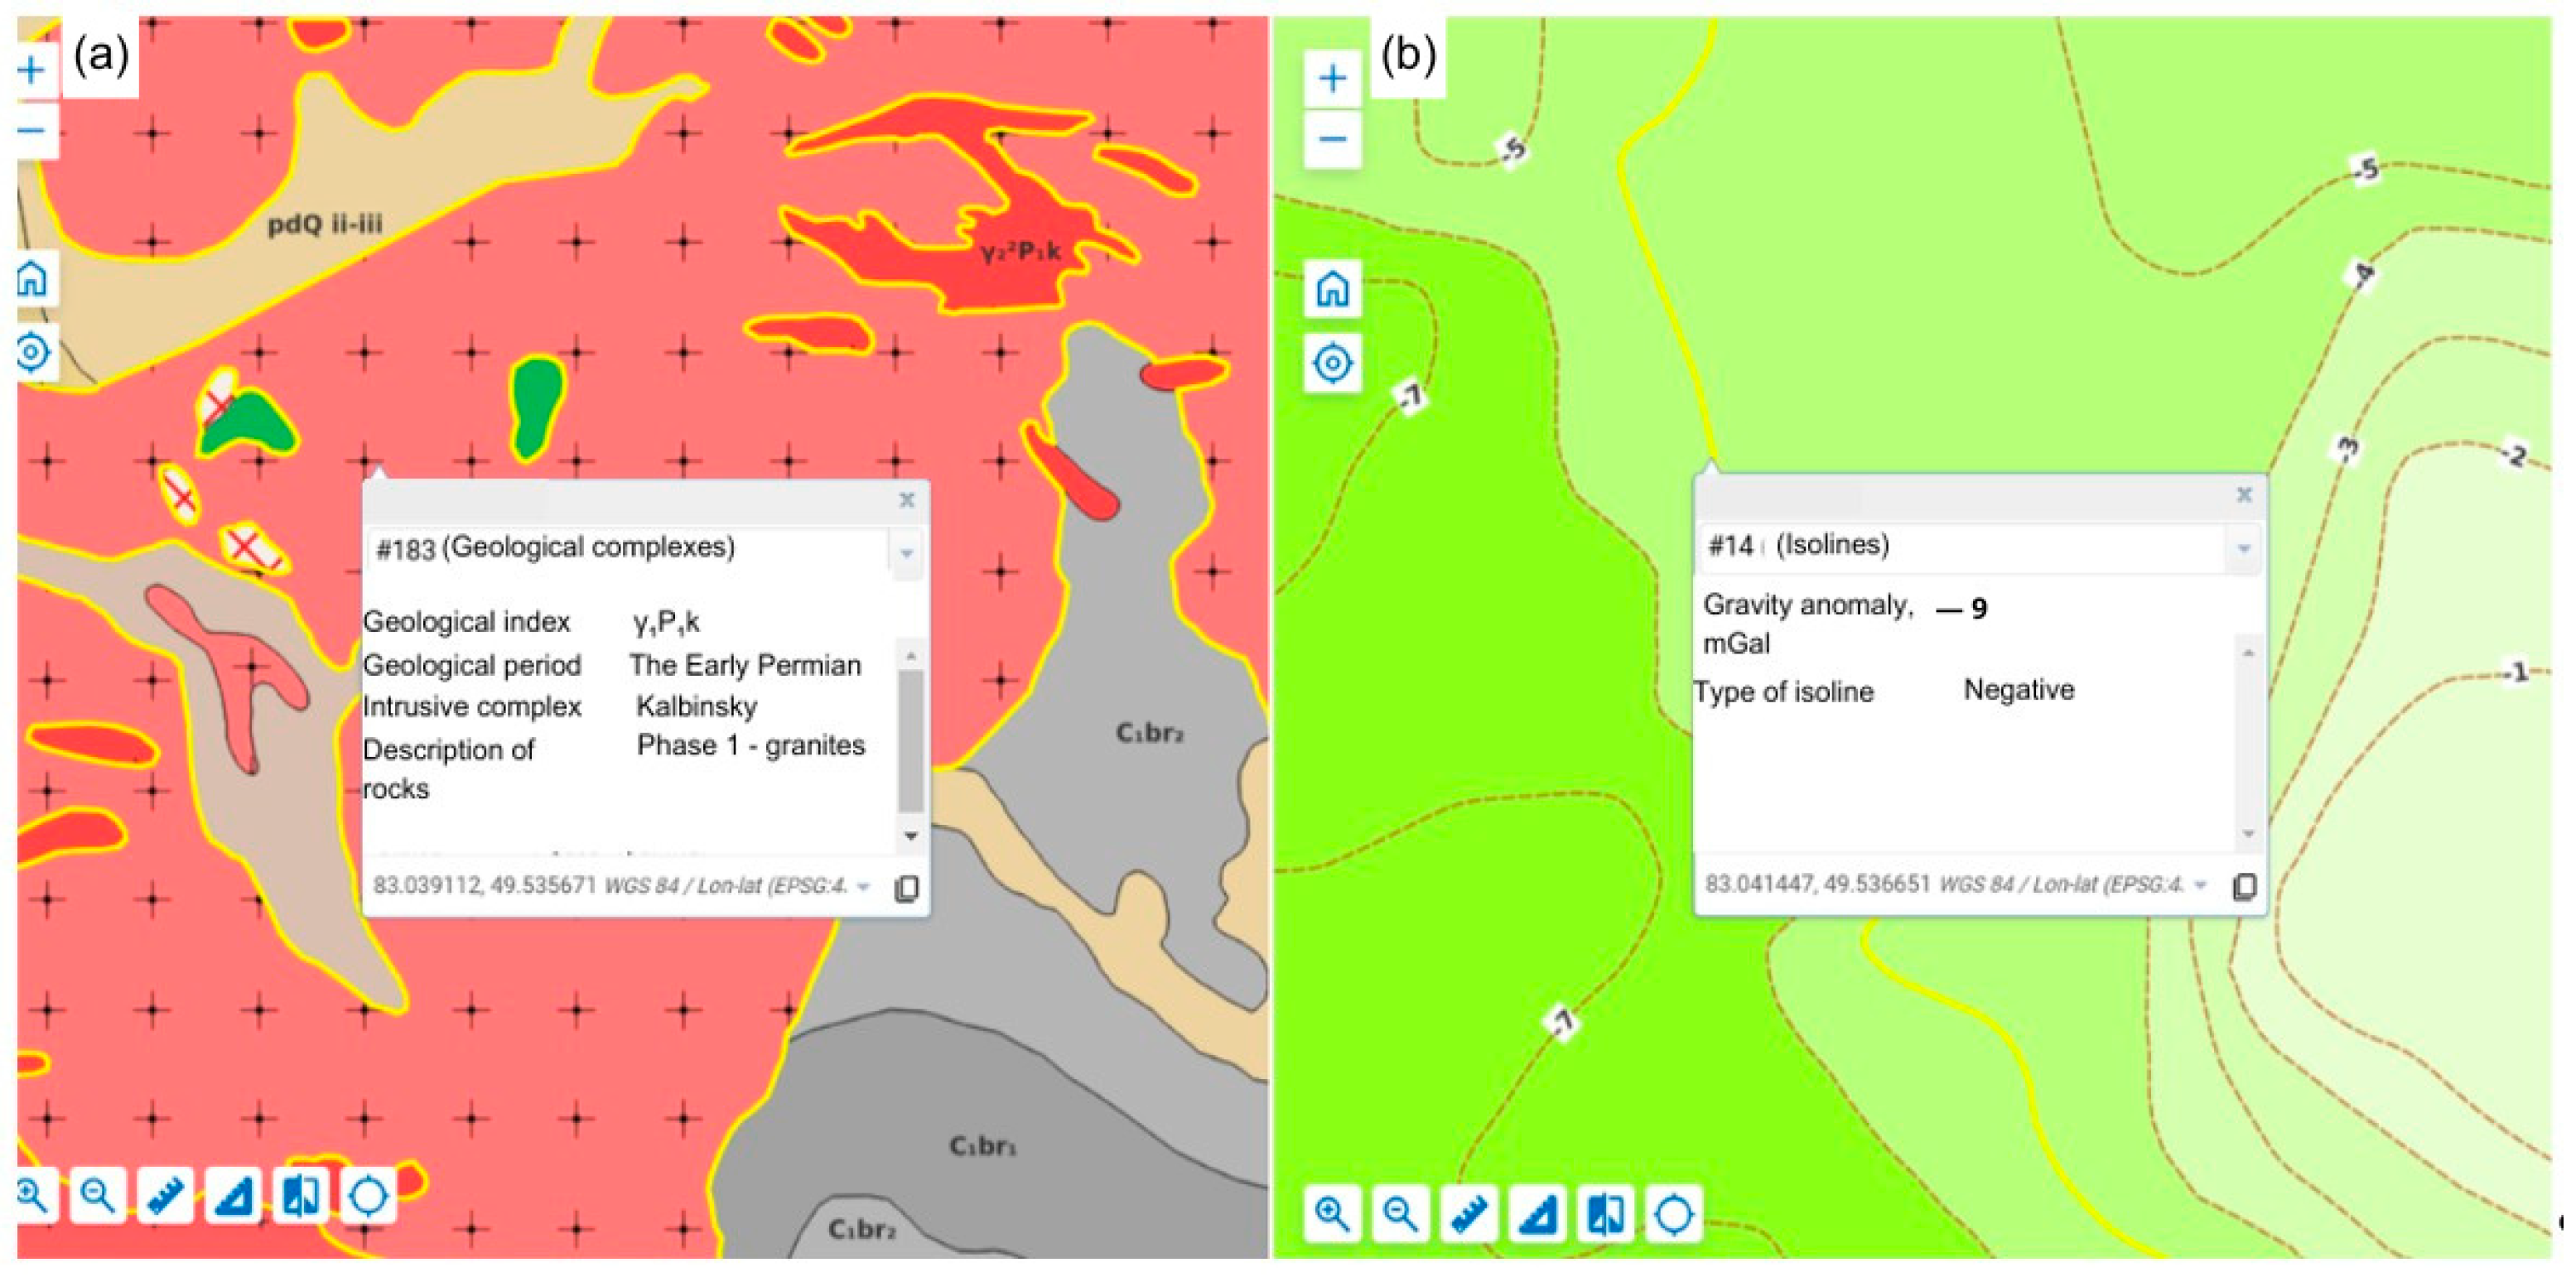
Uploaded to NextGIS—Web, the geological GIS database is transformed into an interactive map. Each object and map element, thanks to pre-filled tabular information, shows attribute data when selected (Figure 6).
Figure 6.
Map fragments from the GISORMEK geoportal: (a) Geological map (1:50,000); (b) Gravity map (1:200,000).
During the development of the geological database, several technical challenges associated with adapting QGIS and NextGIS Web to geological applications were addressed. One of the main limitations was the absence of a standardized library of geological symbols commonly used in Kazakhstan. To overcome this limitation, the authors developed a custom geological symbol library for use within the GIS environment.
A second challenge involved the representation of geological indices. Although QGIS supports the ArcIndex font, this font is not supported by the NextGIS Web platform. To ensure the correct visualization of geological symbols and indices in the Web-GIS environment, a compatible set of custom glyphs was created and incorporated into the system.
4.2. A Case Study of Deposit Distribution Using Developed GIS and Remote Sensing Data
PCA. PCA was performed using the seven spectral bands of the Landsat-8 satellite imagery. This method enables the reduction in redundant information caused by inter-band correlation and facilitates the identification of the main factors contributing to spectral variability within the study area.
Prior to performing PCA, the relationships among the spectral bands were evaluated by calculating the correlation matrix. The correlation coefficients between the spectral bands used in the analysis are presented in Table 4.
Table 4.
Correlation Matrix of the Spectral Bands.
Table 4 presents the Pearson correlation matrix of the original Landsat-8 spectral bands, illustrating the linear relationships among the seven spectral channels. The first four bands (Coastal, Blue, Green, and Red) exhibit very strong positive correlations (correlation coefficients > 0.92), as they all belong to the visible spectrum and are similarly influenced by surface brightness and albedo.
In addition, Band 6 (SWIR 1) and Band 7 (SWIR 2) show a strong positive correlation with each other (r = 0.91) and moderate correlations with the visible bands. In contrast, Band 5 (NIR) demonstrates negative correlations with most of the other spectral bands, indicating a distinct spectral response compared with the visible and shortwave infrared regions.
Subsequently, Principal Component Analysis (PCA) was performed using ENVI 5.3 software. The eigenvectors of the resulting principal components are presented in Table 5.
Table 5.
Eigenvectors of the Principal Components.
Analysis of the eigenvector matrix indicates that the first principal component (PC1) is dominated by Band 5 (NIR), with the largest loading (−0.98), while the contributions of the remaining bands are comparatively small. This suggests that PC1 is primarily determined by the reflectance characteristics of the near-infrared (NIR) spectral region.
For the second principal component (PC2), all spectral bands contribute with negative loadings. The highest contributions are observed for Band 6 (−0.71) and Band 7 (−0.55), both of which belong to the shortwave infrared (SWIR) region. Therefore, PC2 mainly represents spectral variations associated with the SWIR wavelengths.
The third principal component (PC3) is characterized by negative loadings for the first five bands (VNIR region) and positive loadings for Bands 6 and 7 (Band 6: +0.40; Band 7: +0.13). This pattern indicates an enhanced spectral contrast between the VNIR and SWIR regions.
In the fourth principal component (PC4), the largest contributions are provided by Band 6 (−0.54) and Band 7 (+0.74). Consequently, this component primarily describes the spectral differences between the two SWIR bands.
The fifth principal component (PC5) has the following eigenvector values: Band 1 (+0.87), Band 2 (+0.38), Band 3 (−0.43), Band 4 (−0.47), Band 5 (+0.01), Band 6 (−0.08), and Band 7 (+0.28). This component mainly reflects internal spectral variations within the VNIR region. No single band exhibits a dominant contribution; however, the relatively high loading of Band 1 suggests that residual atmospheric effects remaining after atmospheric correction may be concentrated in this component.
In the sixth principal component (PC6), the largest loading is associated with Band 3 (−0.73). The seventh principal component (PC7) is primarily influenced by Band 1 (−0.64) and Band 2 (+0.75).
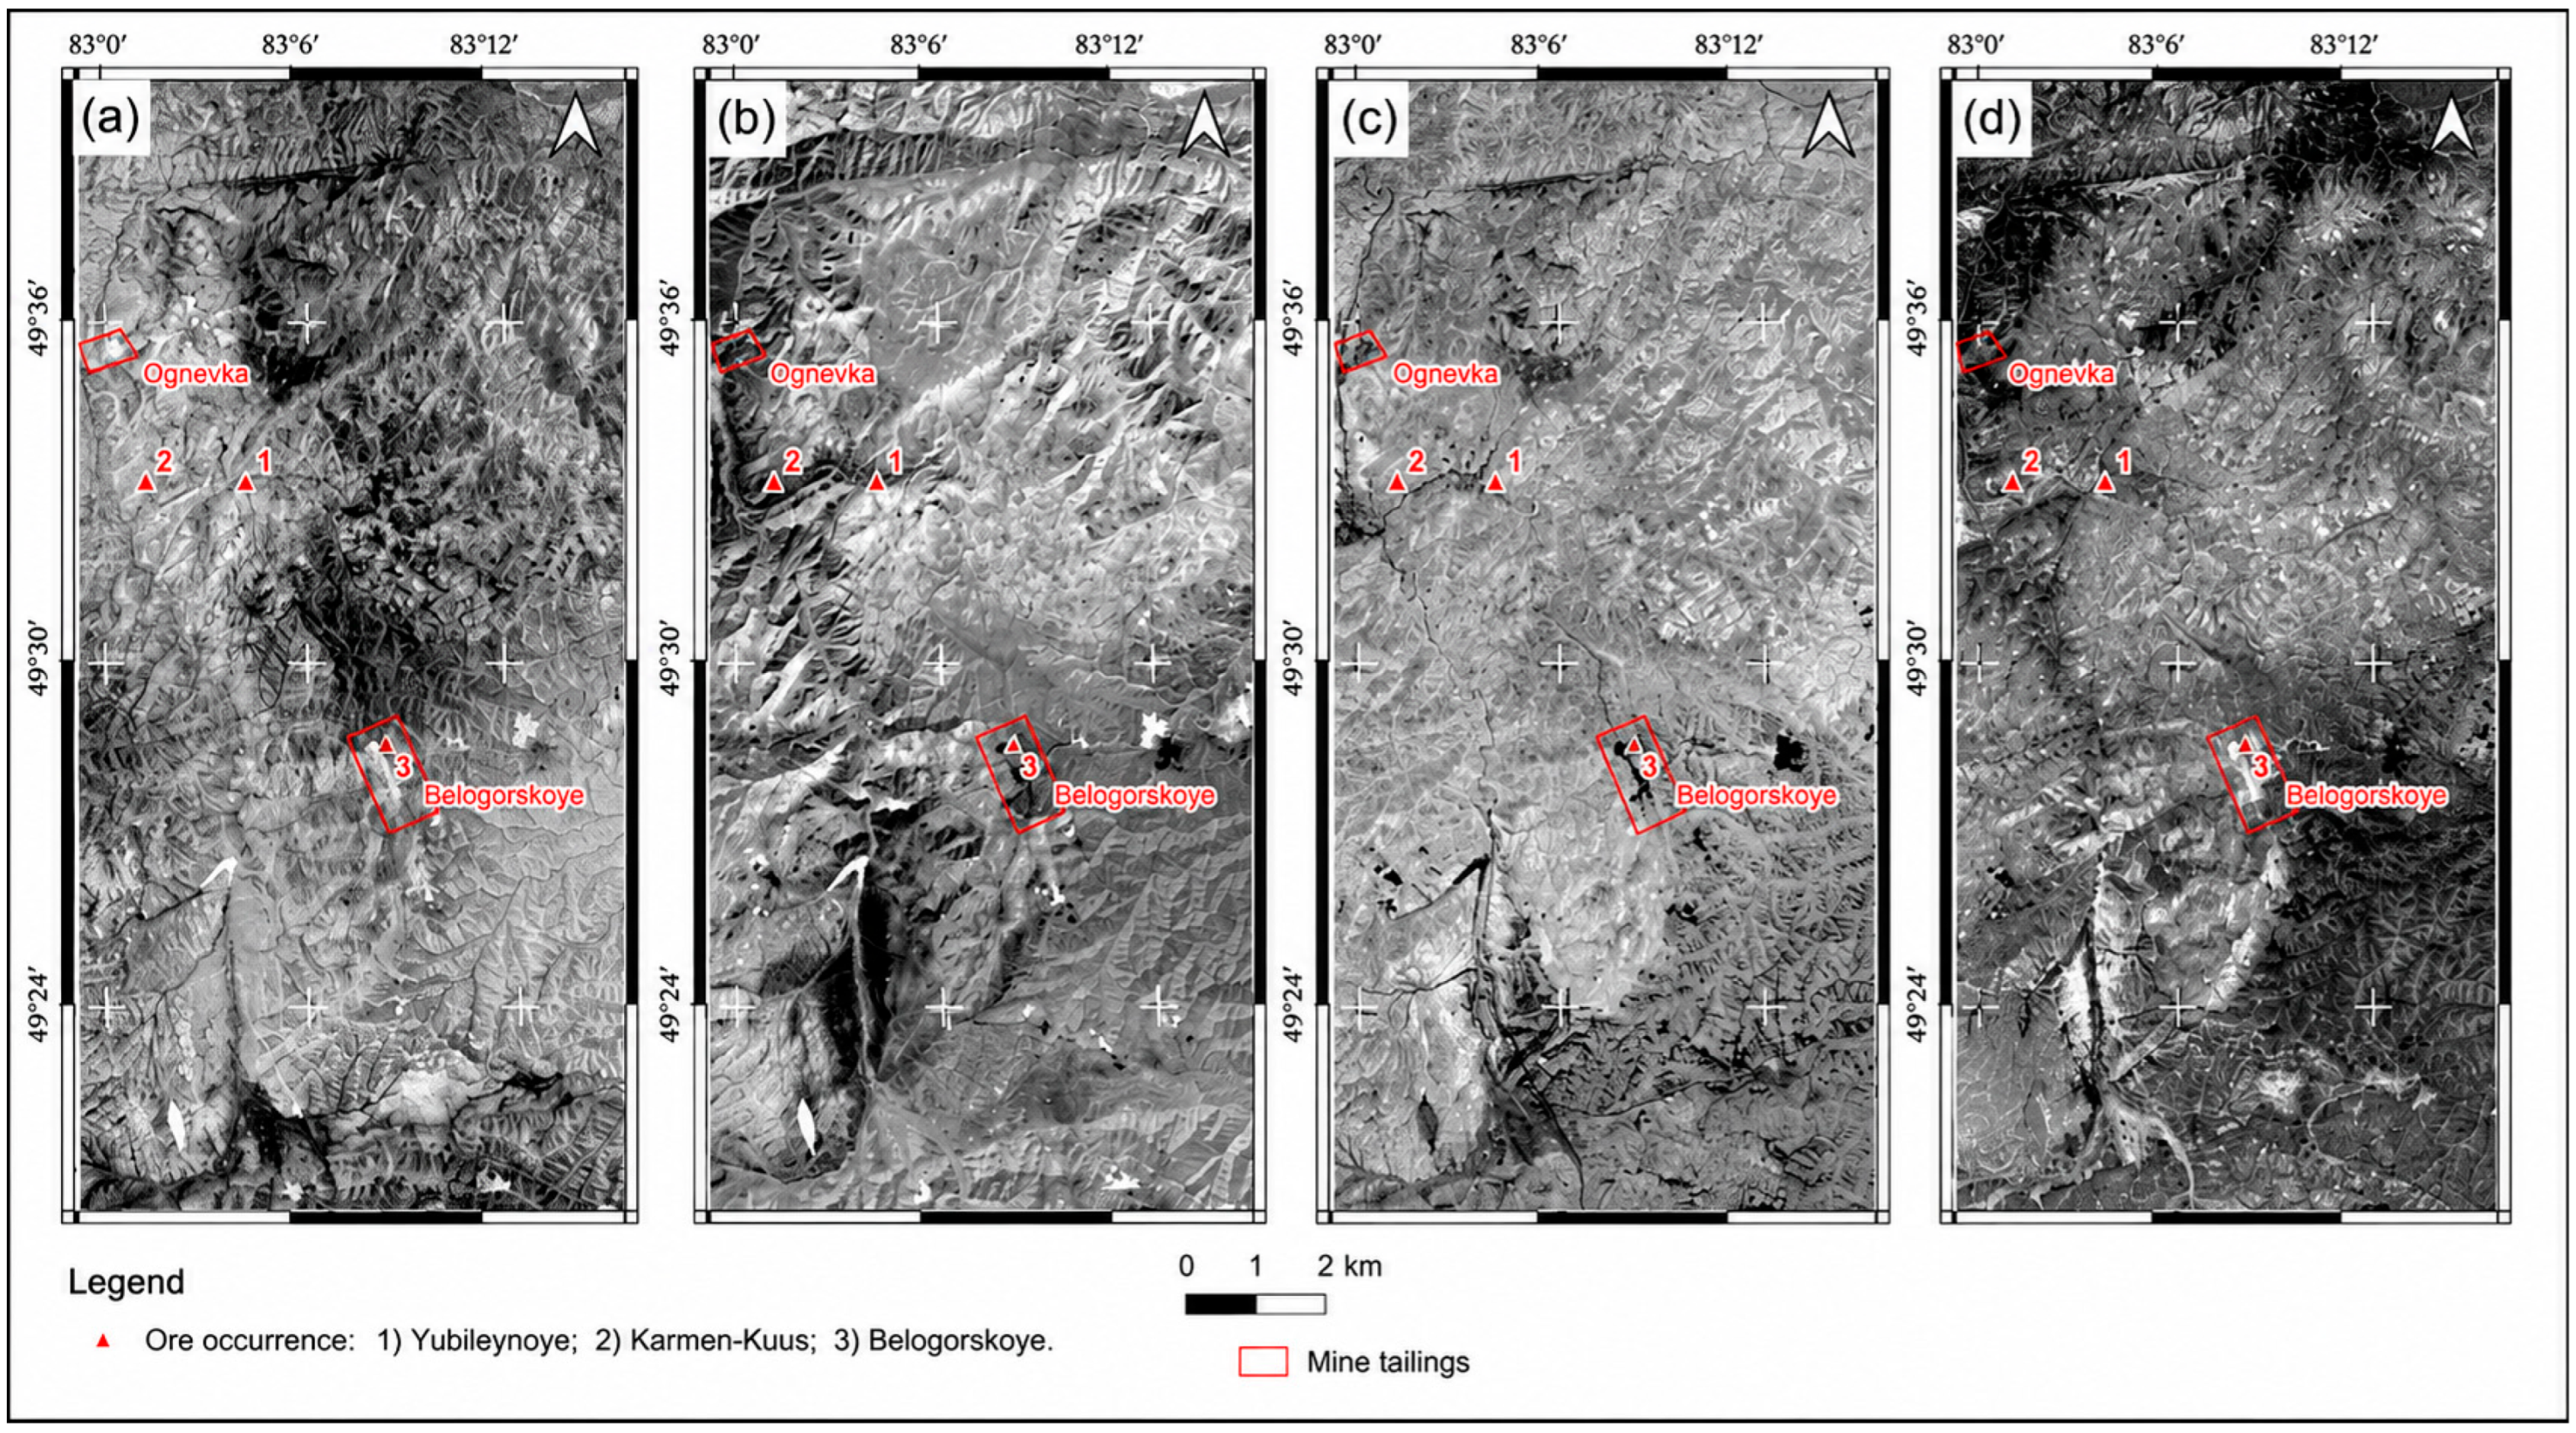
The PCA results are presented as grayscale images of the first four principal components (PCs) (Figure 7). The fifth, sixth and seventh principal components were dominated by noise and contained little useful geological information; therefore, they were excluded from further interpretation.
Figure 7.
Grayscale images of the first three principal components (PCs) derived from Principal Component Analysis (PCA): (a) PC1; (b) PC2; (c) PC3; (d) PC4.
The first principal component (PC1) primarily represents the overall scene albedo (Figure 7a). In this image, most exposed geological units, including igneous intrusions and sedimentary rocks, appear bright white, whereas vegetation, particularly herbaceous cover, is displayed in dark tones. This contrast is mainly controlled by the strong negative loading of Band 5 (near-infrared, NIR; eigenvector = −0.98) (Table 5). Since vegetation exhibits high reflectance in the NIR region, it appears dark in PC1 due to the negative contribution of Band 5.
In the second principal component (PC2), vegetation is represented by bright tones, while most geological units exhibit intermediate gray levels. The siltstones and sandstones of the Takyr Formation appear gray, whereas the granitoids of the Kalba Complex are displayed in dark tones. This spectral pattern is primarily controlled by the strong negative loadings of Band 6 (−0.71) and Band 7 (−0.55). As discussed previously, intrusive rocks exhibit relatively high reflectance in these shortwave infrared (SWIR) bands, resulting in their dark appearance in PC2 (Figure 7b).
The third principal component (PC3) provides the clearest lithological discrimination (Figure 7c). In this image, igneous rocks are represented by bright tones, whereas sedimentary rocks appear dark, producing a distinct lithological contrast. This pattern is mainly associated with the positive contributions of Bands 6 and 7, which enhance spectral differences between these rock types.
Although the fourth principal component (PC4) is generally similar to PC3, the boundaries of several granitoid intrusions are less distinct (Figure 7d). This difference is likely related to the opposite signs of the Band 6 and Band 7 loadings, with Band 6 contributing negatively and Band 7 positively.
Band Ratio Analysis. Geological spectral indices for iron oxides and hydroxyl-bearing (Al–OH) minerals were calculated using band ratio (BR) techniques commonly reported in the remote sensing literature. For iron oxide mapping, the Landsat-8 Band 4 (Red) to Band 2 (Blue) ratio (B4/B2) was used, as iron oxides exhibit relatively high reflectance in the red region of the spectrum and lower reflectance in the blue region.
Hydroxyl-bearing (Al–OH) minerals were identified using the ratio between Landsat-8 Band 6 (SWIR 1; 1.57–1.65 μm) and Band 7 (SWIR 2; 2.11–2.29 μm). According to previous studies, minerals containing hydroxyl groups are characterized by strong absorption features near 2.2 μm and relatively high reflectance around 1.6 μm, making the SWIR 1/SWIR 2 ratio effective for their detection.
However, vegetation exhibits spectral characteristics similar to those of hydroxyl-bearing minerals because leaf water content also produces strong absorption in the SWIR 2 region. Consequently, vegetation can introduce false anomalies in hydroxyl mineral mapping. To minimize this effect, vegetation was masked prior to calculating the spectral indices using the Normalized Difference Vegetation Index (NDVI). Pixels with NDVI ≥ 0.2 were classified as vegetation and excluded from further analysis, whereas pixels with NDVI < 0.2 were retained for geological interpretation.
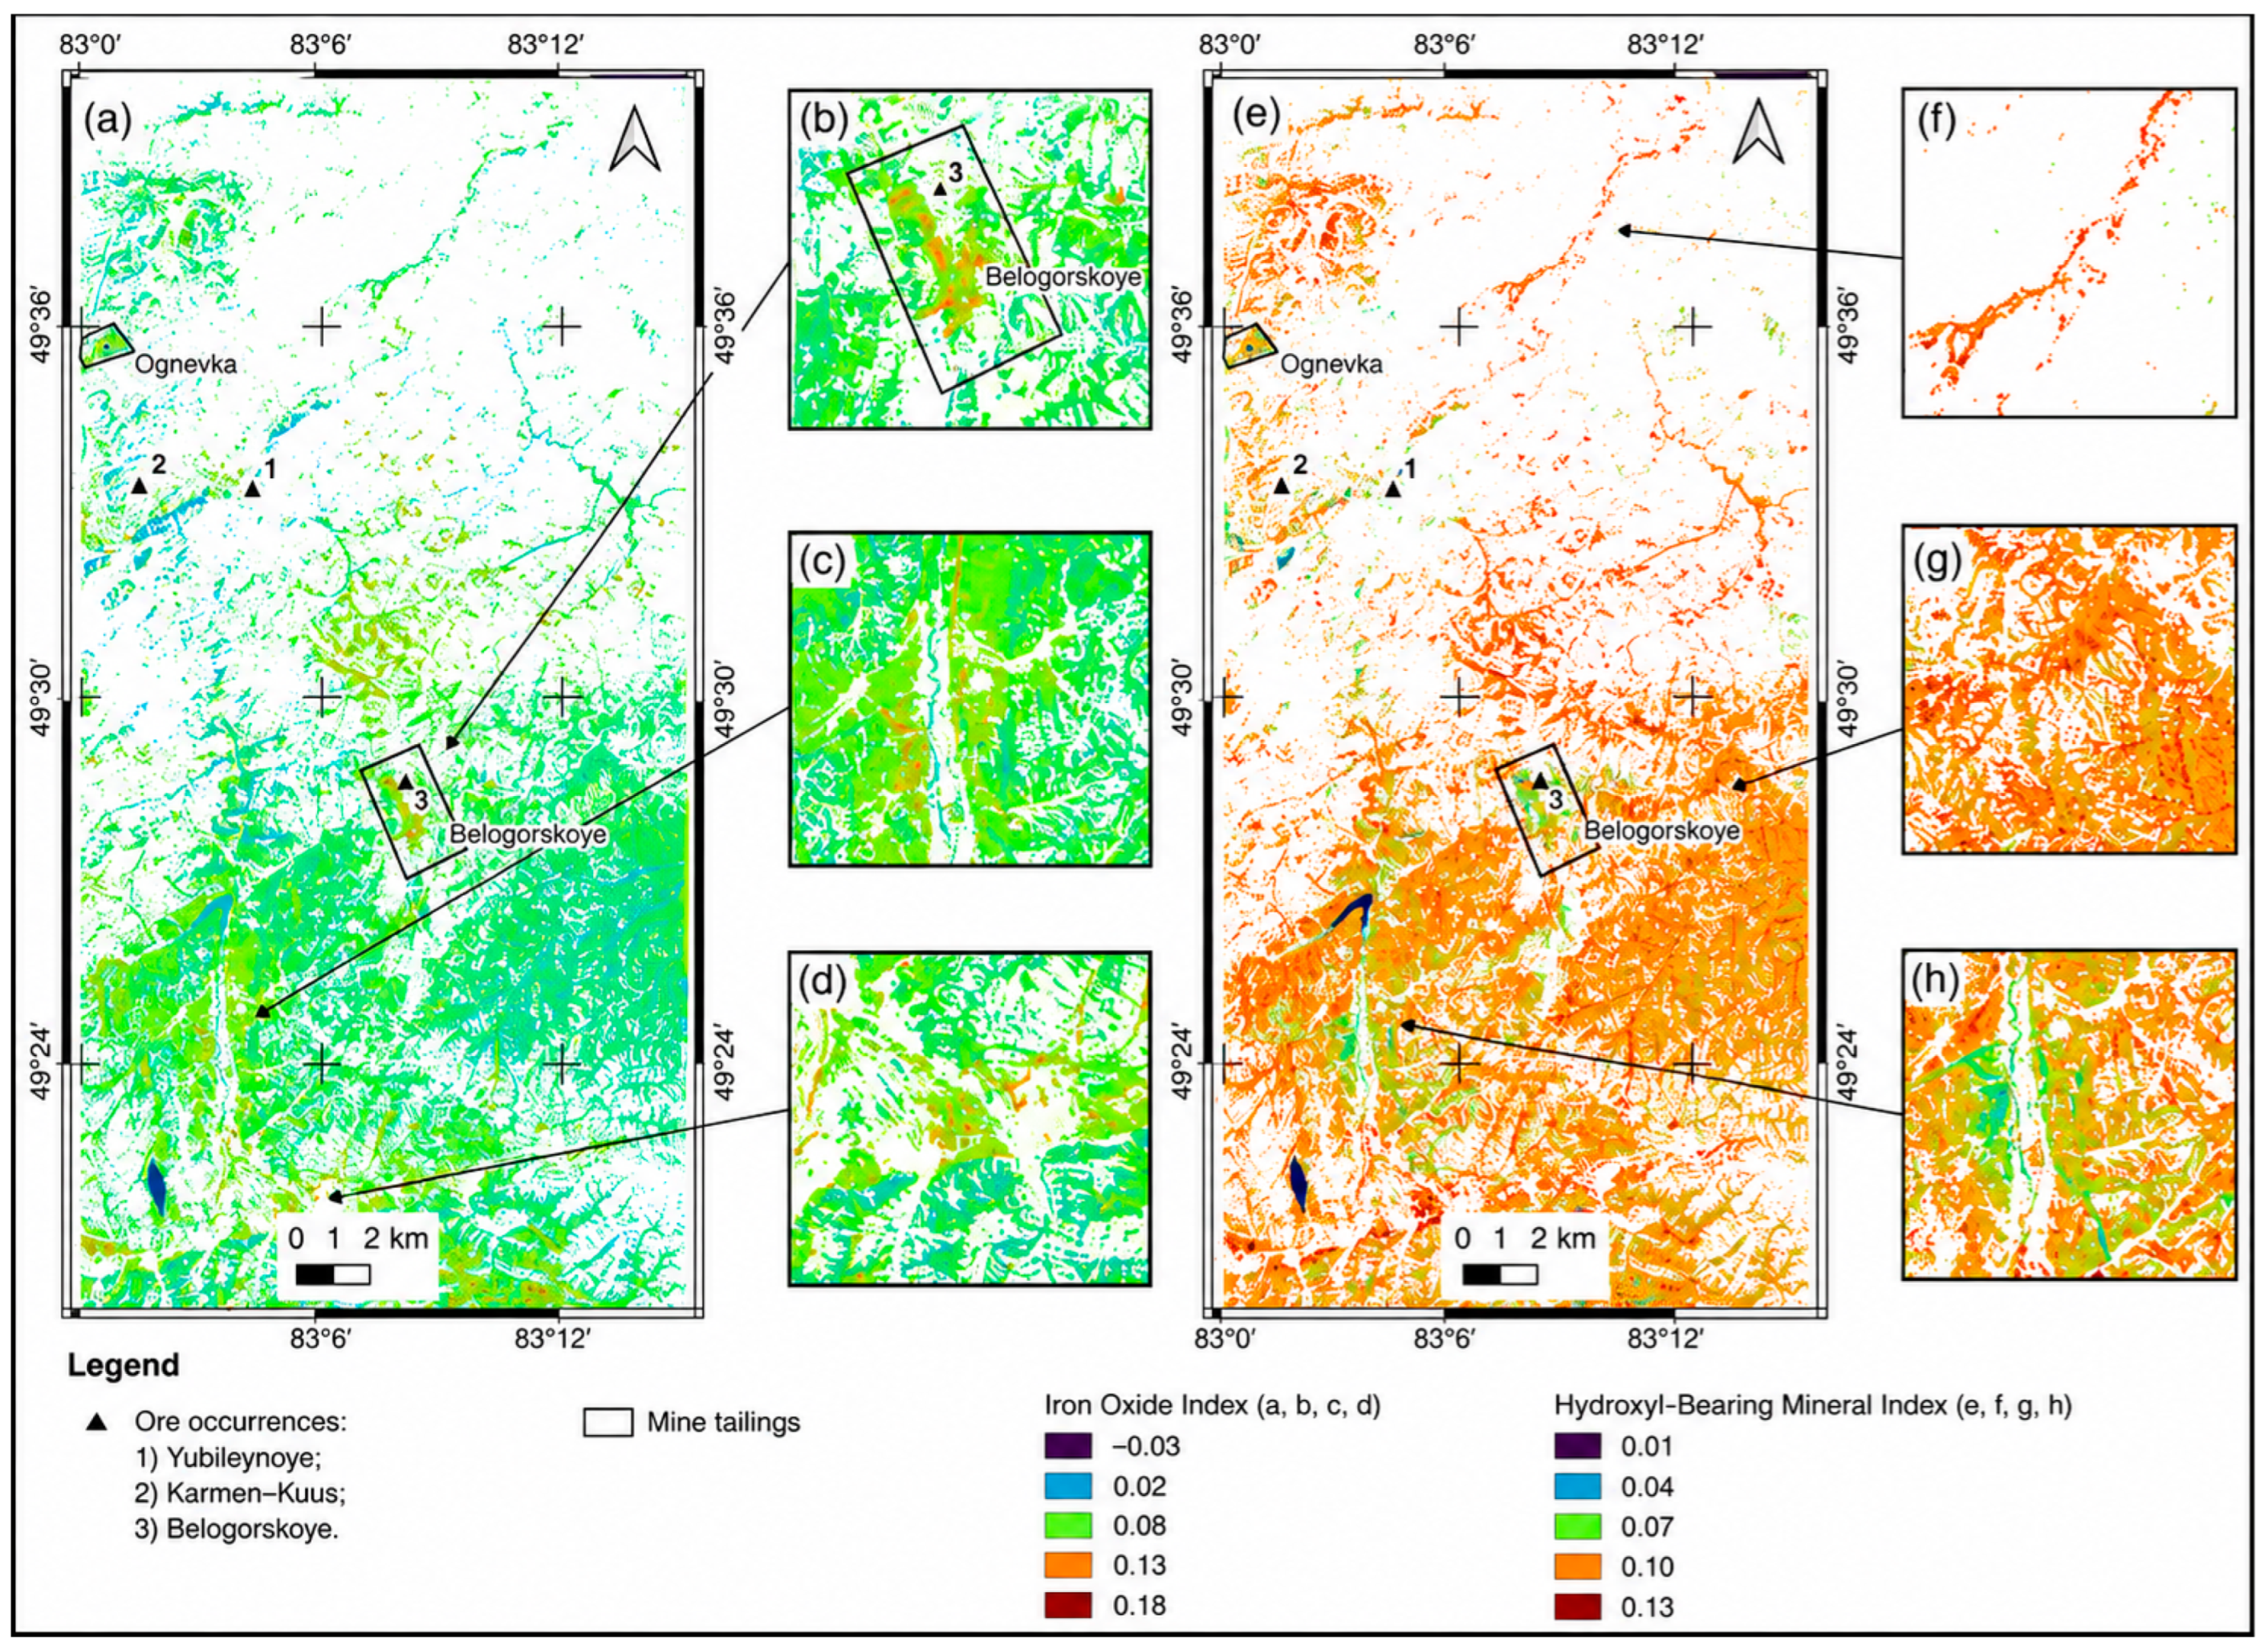
The resulting iron oxide and hydroxyl-bearing mineral index maps are presented as false-color composite images in Figure 8.
Figure 8.
Geological spectral indices: (a–d) iron oxide index; (e–h) hydroxyl-bearing (Al–OH) mineral index.
The iron oxide index, calculated using the Landsat-8 Band 4/Band 2 ratio, shows the highest values (up to 0.18) over mine waste deposits, including waste rock dumps and tailings from ore-processing facilities (Figure 8b). These anomalies are interpreted as resulting from the accumulation of biotite and magnetite in mining waste generated during the extraction and processing of feldspar and muscovite ores.
Moderate iron oxide index values (approximately 0.08) are observed over exposed granitoids of the Kalba Complex (Figure 8c). The granitoids of the first intrusive phase contain relatively high abundances of biotite and magnetite, producing distinct iron oxide anomalies. In contrast, the granitoids of the second intrusive phase contain significantly lower amounts of biotite, resulting in a reduced spectral contrast of the iron oxide index on the satellite imagery.
These results suggest that the iron oxide index may serve as a preliminary criterion for distinguishing the first- and second-phase granitoids of the Kalba Complex. It may also be useful for rare-metal mineral prospectivity analysis. According to previous studies, the first intrusive phase is associated primarily with beryllium–spodumene mineralization, whereas the second phase is related to tin and tantalum deposits [29].
In addition, relatively high iron oxide index values (up to 0.13) are observed within river floodplains and fluvial terraces (Figure 8d). These areas commonly accumulate heavy minerals such as magnetite, ilmenite, and other dense detrital minerals through fluvial transport and sedimentary reworking. Consequently, iron-rich anomalies in these zones may indicate the erosion, transport, and secondary concentration of weathering products derived from the granitoid bodies.
The hydroxyl-bearing (Al–OH) mineral index, calculated using the Landsat-8 Band 6/Band 7 ratio, exhibits high values (up to 0.10) over the sedimentary rocks of the Takyr Formation (Figure 8g), where these areas are represented by shades of red. These elevated index values are attributed to the presence of clay minerals within the siltstone units of the formation.
Alluvial deposits, composed mainly of sand–clay sediments, are also clearly distinguished. In these areas, the hydroxyl index reaches values of up to 0.13, appearing as bright red zones in the false-color image (Figure 8f). Such high values are likely associated with the accumulation of hydroxyl-bearing clay minerals within the alluvial sediments.
The granitoids of the Kalba Complex exhibit moderate hydroxyl index values (approximately 0.07) and are displayed in green tones (Figure 8h). These values may reflect the presence of hydrothermal alteration, including greisenization, muscovitization, and albitization. Such alteration processes commonly produce hydroxyl-bearing minerals, particularly micas such as muscovite. As discussed previously, these minerals are characterized by relatively high reflectance in Landsat-8 Band 6 (SWIR 1) and lower reflectance in Band 7 (SWIR 2), resulting in elevated Band 6/Band 7 ratio values.
5. Discussion
5.1. Multiscale Integration and Geoportal Significance
The present study demonstrates that one of the major challenges in rare-metal exploration is the integration of heterogeneous geological datasets. Geological information is inherently fragmented, as exploration data are derived from multiple sources and are characterized by non-standardized metadata, varying map scales, diverse data formats, and different coordinate reference systems. These inconsistencies increase the complexity of data integration and may lead to the loss of valuable geological information during data harmonization.
At the same time, historical geological materials contain expert interpretations and observations that remain highly valuable for mineral exploration. Although integrating these legacy datasets with modern digital geospatial information is technically challenging, their combined use provides a more comprehensive representation of the geological environment than either data source alone. Therefore, the integration of historical and contemporary datasets is motivated by two principal considerations:
- Remote sensing data are not sufficient for correct interpretation.
- Existing geological maps are static, which significantly restricts interpretation capabilities.
The integration of heterogeneous geological datasets within a unified geospatial framework substantially enhances the potential for comprehensive geological interpretation. GISORMEK was developed to support this objective by combining multi-scale and multi-source datasets within a single analytical Web-GIS environment that promotes data consistency and reproducibility. The platform integrates visualization, data management, and geospatial analysis to support the interpretation of geological information and exploration decision-making.
As discussed in the Introduction, most existing geoportals primarily provide data access and visualization. In contrast, GISORMEK combines these functions with integrated geospatial analysis, enabling users to interpret heterogeneous datasets within a unified analytical framework. This integration represents the principal distinction between GISORMEK and the existing platforms reviewed in this study.
5.2. Band Ratios and PCA for Lithological Discrimination
BR. Conventional geological spectral indices were calculated using band ratio techniques widely employed in imaging spectroscopy, and the corresponding index maps were generated. The iron oxide index was derived from the Landsat-8 Band 4/Band 2 ratio, whereas the hydroxyl-bearing (Al–OH) mineral index was calculated using the Band 6/Band 7 ratio.
Moderate iron oxide index values observed over the first-phase granitoids of the Kalba Complex are attributed to the presence of biotite and magnetite. Elevated iron oxide index values were identified over mine waste deposits, where they are interpreted as resulting from the accumulation of residual biotite associated with feldspar mining and processing. High index values were also detected along river valleys and floodplains, where they are likely related to the concentration of heavy minerals through fluvial erosion, transport, and sedimentary reworking.
Hydroxyl-bearing minerals were detected in both sedimentary and intrusive rocks. High hydroxyl index values within the sedimentary sequence are attributed to the abundance of clay minerals in the siltstones of the Tair Formation, whereas the moderate values observed in the granitoids are interpreted as the result of hydrothermal alteration processes, including greisenization and muscovitization.
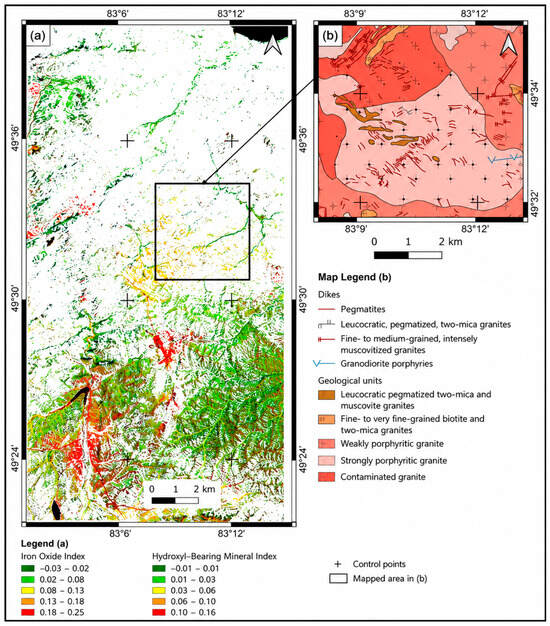
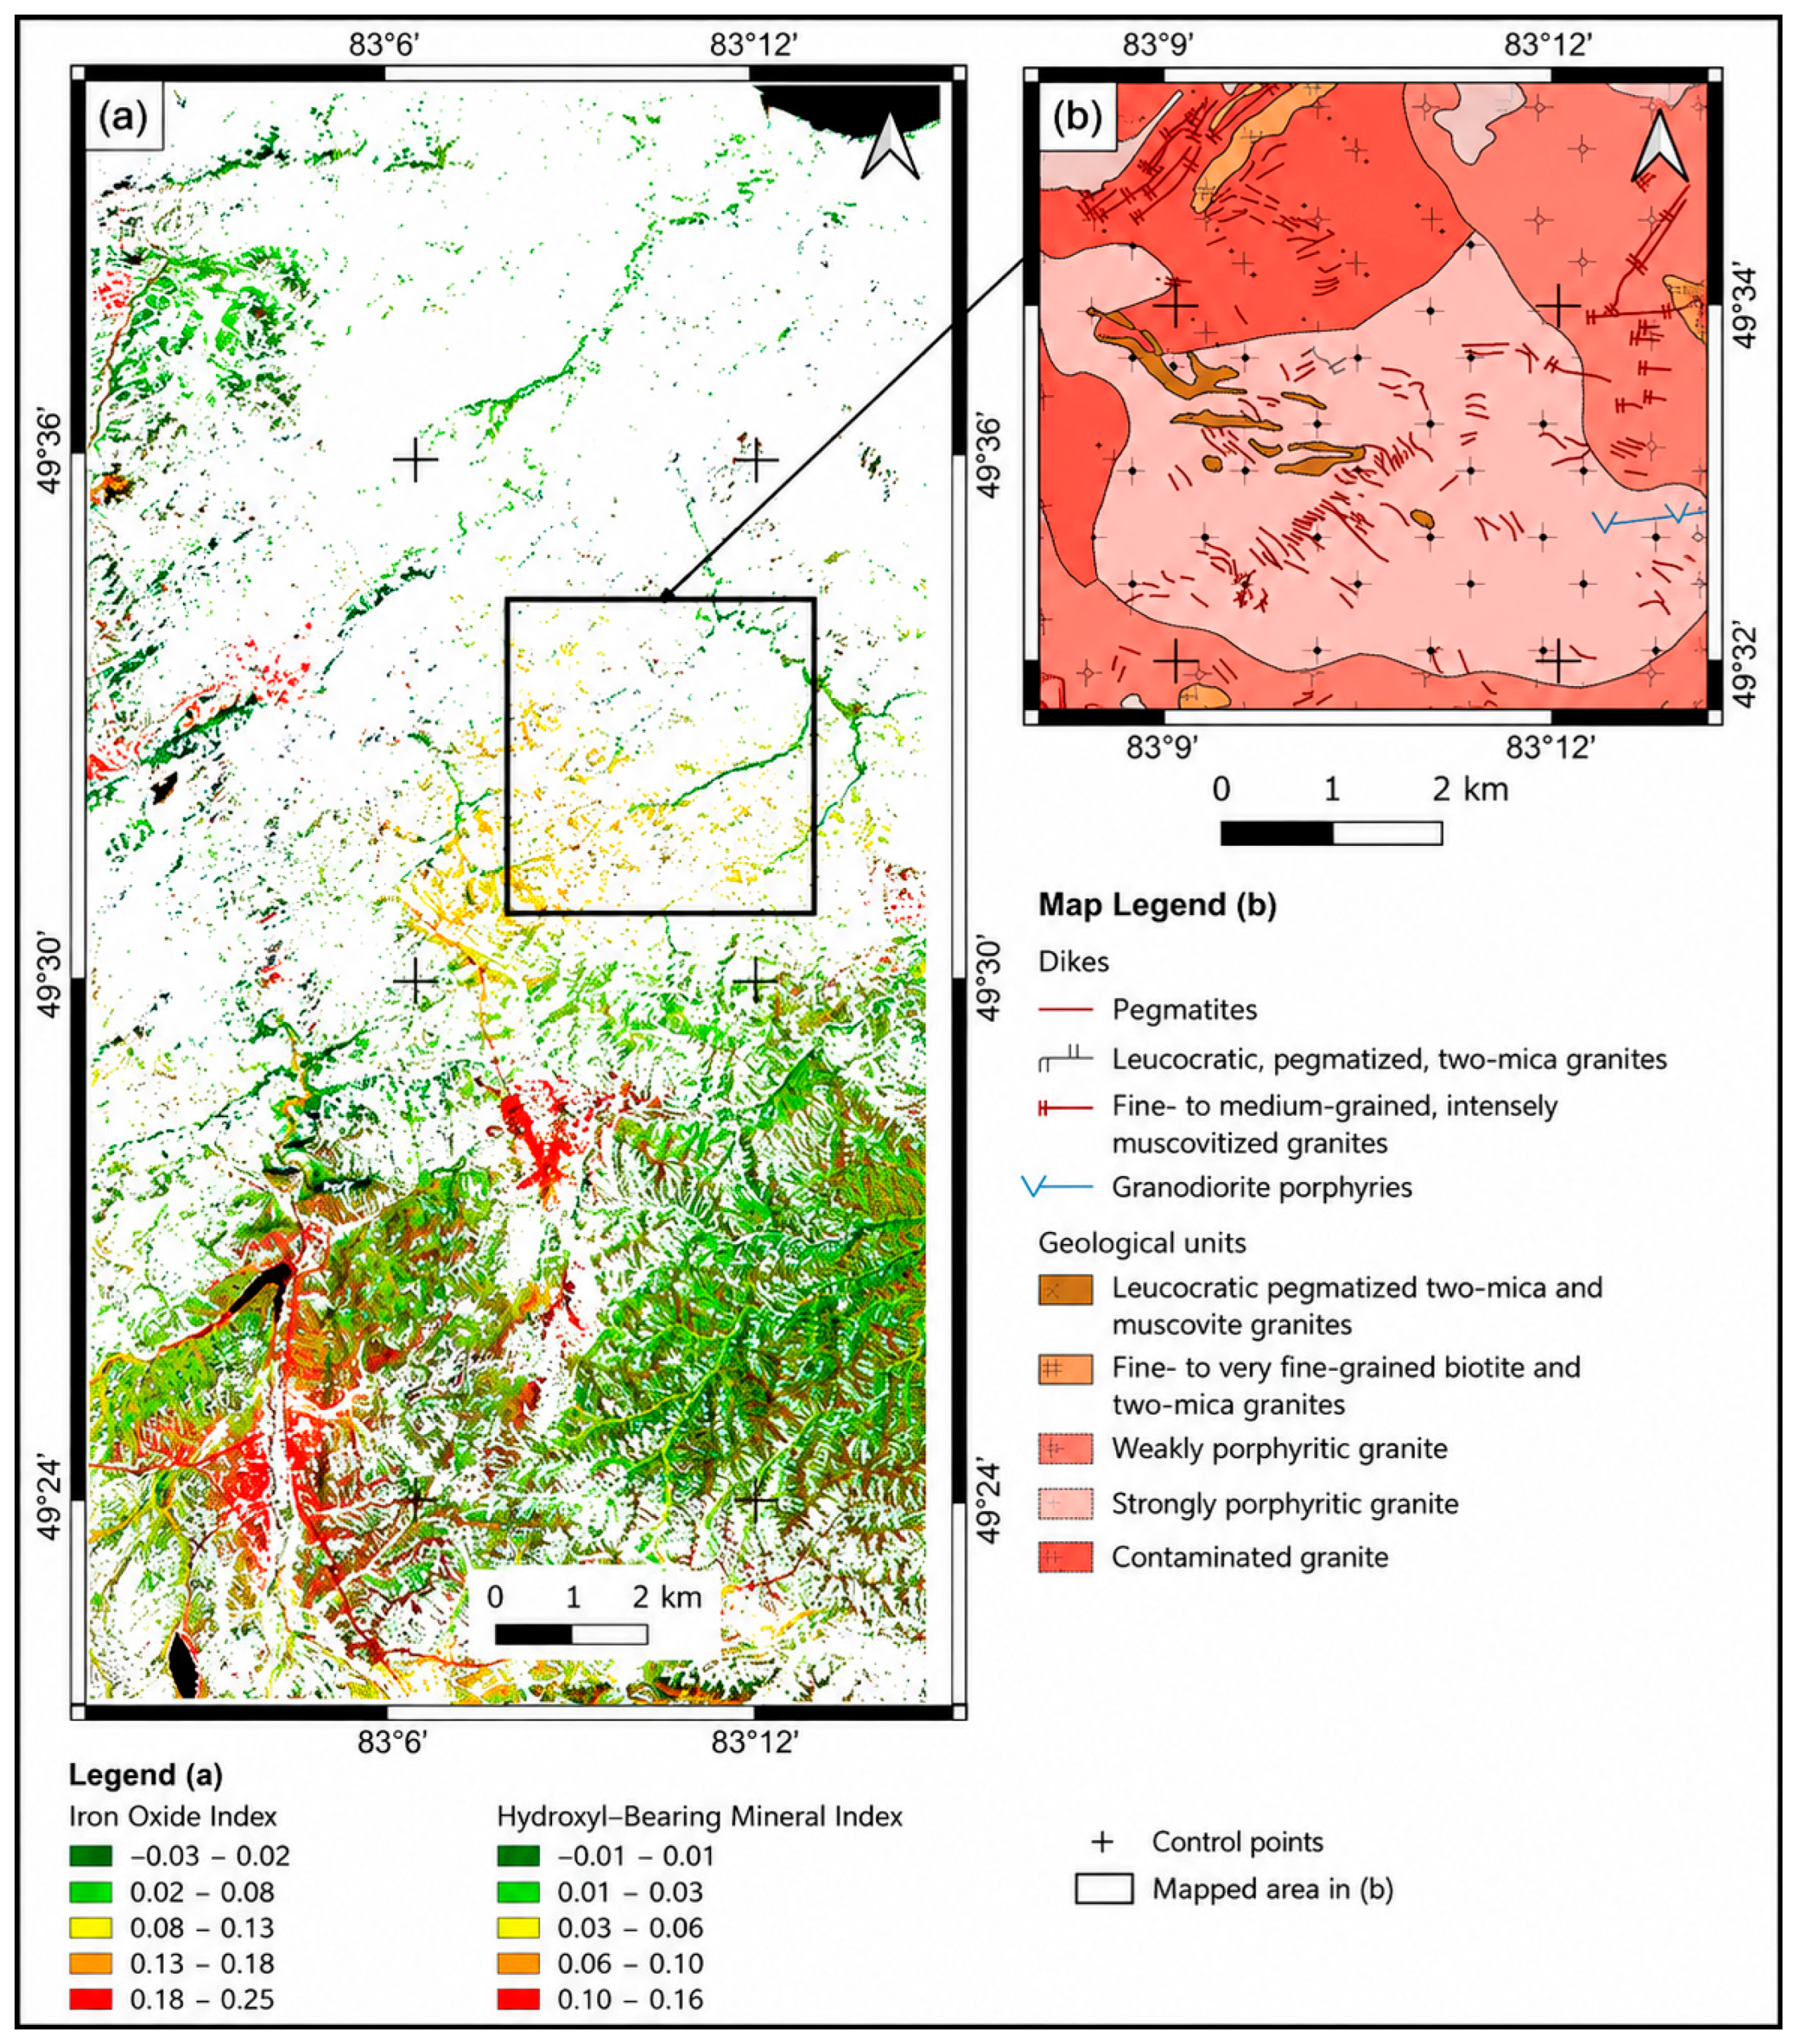
To enhance the visualization of hydrothermal alteration zones, false-color RGB composite images were generated. The first composite consisted of the iron oxide index (Band 4/Band 2) assigned to the red channel, the hydroxyl-bearing mineral index (Band 6/Band 7) assigned to the green channel, and an NDVI-based vegetation mask assigned to the blue channel, where non-vegetated pixels (NDVI < 0.2) were retained (Figure 9a). In this composite, the Band 6/Band 7 ratio served as the primary indicator of hydroxyl-bearing mineralization, whereas the Band 4/Band 2 ratio was used to distinguish hydroxyl-bearing zones associated with granitoids from those developed within sedimentary rocks, since intrusive rocks generally contain higher concentrations of iron-bearing minerals.
Figure 9.
Hydrothermal alteration map: (a) RGB composite of the Band 4/Band 2 ratio, Band 6/Band 7 ratio, and NDVI mask (NDVI < 0.20); (b) fragment of the geological map.
Interpretation of the RGB composite (Figure 9a) revealed yellow anomalous zones where elevated iron oxide and hydroxyl-bearing mineral indices spatially overlap. The yellow color results from the combination of the red and green channels and indicates areas enriched in both iron oxides and hydroxyl-bearing minerals. Comparison of these anomalies with the geological map (Figure 9b) showed that they are spatially associated with the distribution of pegmatite dikes, suggesting that the combined spectral response can be used as an indicator of hydrothermal alteration related to pegmatite emplacement.
PCA. The PCA results demonstrate that the principal components can be effectively used for the preliminary discrimination of surface features and lithological units. Analysis of the seven multispectral Landsat-8 bands showed that PC1 primarily represents the overall scene albedo, PC2 emphasizes vegetation cover, PC3 provides the best discrimination between intrusive and sedimentary rocks, and PC4 enhances anthropogenic features, particularly mine waste deposits and other mining-related infrastructure.
In addition, PC4 reveals several anomalous zones in the central part of the study area that are not evident in the other principal components. These anomalies spatially correspond to the yellow anomalous zones identified in the RGB composite shown in Figure 9, where elevated iron oxide and hydroxyl-bearing (Al–OH) mineral indices overlap. This correspondence suggests that the PC4 anomalies may be associated with the distribution of hydroxyl-bearing minerals. Their spectral response is primarily controlled by diagnostic absorption features in the shortwave infrared (SWIR) region, particularly the spectral contrast between Landsat-8 Bands 6 and 7 (Table 5).
However, Landsat-8 imagery has several limitations for geological mapping. The 30 m spatial resolution is insufficient for detecting small geological features, such as narrow pegmatite dikes and local alteration zones. Therefore, Landsat-8 data are more suitable for regional-scale investigations than for detailed geological mapping. In addition, the sensor includes only two relatively broad SWIR bands (Bands 6 and 7). This limits the discrimination of lithological units with similar spectral characteristics. Vegetation cover also affects the spectral response of the underlying rocks. In the study area, both grassland and forest vegetation obscure geological features. To reduce this effect, an NDVI mask (NDVI < 0.2) was applied before calculating the spectral indices. As a result, densely vegetated areas were excluded from the analysis, and some hydrothermal alteration zones may therefore remain undetected.
Therefore, the Landsat-8-derived products presented in this study should be regarded as regional exploration datasets that provide guidance for subsequent detailed investigations using higher-resolution remote sensing data, field mapping, and geochemical surveys.
6. Conclusions
This study presents GISORMEK, a web-based geographic information system developed to integrate heterogeneous geological datasets for rare-metal exploration in the Kalba–Narym belt (Eastern Kazakhstan). Historical geological maps, geochemical, geophysical, tectonic, geomorphological, and mineral occurrence data were digitized, georeferenced, standardized, and incorporated into a unified spatial database together with remote sensing products derived from Landsat-8 imagery.
The integration of remote sensing significantly enhanced the geological information available within the GIS. Principal Component Analysis (PCA) improved lithological discrimination and highlighted subtle geological features, whereas band ratio analysis enabled the mapping of iron oxide and hydroxyl-bearing (Al–OH) mineral indices. The combined interpretation of these indices enabled the delineation of hydrothermal alteration zones that spatially coincide with known pegmatite occurrences, demonstrating their potential value for rare-metal exploration.
Compared with conventional geological mapping approaches based on individual datasets, GISORMEK provides a unified web-GIS framework that ensures consistent spatial referencing, centralized data management, and efficient visualization of multidisciplinary geological information. The system facilitates the integration of historical and modern datasets, supports geological interpretation and mineral prospectivity assessment, and provides a reproducible platform for future exploration studies.
The proposed methodology can be readily adapted to other mineralized regions where heterogeneous archival and modern geoscientific datasets require integration into a single geospatial environment, although the integrated web-GIS framework requires additional remote sensing data, field observations, and machine-learning approaches for quantitative mineral prospectivity mapping.
Author Contributions
Conceptualization, Y.B., M.R., E.L. and R.S.; methodology, Y.B., M.R., R.S. and E.L.; software, Y.B.; validation, Y.B., M.R. and R.S.; formal analysis and investigation: Y.B., M.R., E.L., R.S. and Z.A.; resources, Y.B.; data curation, Y.B., M.R. and Z.A.; Writing—original draft preparation: Y.B., M.R., E.L., R.S. and Z.A.; writing—review and editing: Y.B., M.R., R.S. and Z.A.; visualization, Y.B.; supervision, M.R.; project administration, M.R.; funding acquisition, M.R. All authors have read and agreed to the published version of the manuscript.
Funding
This research was supported by the project IRN BR24992854 “Development and implementation of competitive science-based technologies to ensure sustainable development of mining and metallurgy industry East Kazakhstan region”, funded by the Science Committee of the Ministry of Science and Higher Education of the Republic of Kazakhstan.
Data Availability Statement
The data that contributed to the findings and conclusions of this study are available upon reasonable request from the authors.
Conflicts of Interest
The authors declare no competing interests.
References
- Rare Earth Metals Market (Cerium Oxide, Lanthanum Oxide, Neodymium Oxide, Yttrium Oxide, Europium Oxide), Application (Permanent Magnets, Metal Alloys, Glass Polishing, Glass Additives, Phosphors, Catalysts), and Region—Global Forecast to 2029. Available online: https://www.marketsandmarkets.com/Market-Reports/rare-earth-metals-market-121495310.html (accessed on 17 October 2024).
- Omali, T.U. Utilization of Remote Sensing and GIS in Geology and Mining. Int. J. Sci. Res. Multidiscip. Stud. 2021, 7, 17–24. [Google Scholar]
- Togizov, K.; Issayeva, L.; Muratkhanov, D.; Kurmangazhina, M.; Swęd, M.; Duczmal-Czernikiewicz, A. Rare Earth Elements in the Shok-Karagay Ore Fields (Syrymbet Ore District, Northern Kazakhstan) and Visualisation of the Deposits Using the Geography Information System. Minerals 2023, 13, 1458. [Google Scholar] [CrossRef] [Scilit]
- Issayeva, L.; Assubayeva, S.; Kembayev, M.; Togizov, K. The Formation of a Geoinformation System and Creation of a Digital Model of Syrymbet Rare-Metal Deposit (North Kazakhstan). In Proceedings of the International Multidisciplinary Scientific GeoConference: SGEM, Sofia, Bulgaria, 28 June–7 July 2019. [Google Scholar] [CrossRef] [Scilit]
- de Kemp, E.A.; Monecke, T.; Sheshpari, M.; Girard, E.; Lauzière, K.; Grunsky, E.C.; Schetselaar, E.M.; Goutier, J.E.; Perron, G.; Bellefleur, G. 3D GIS as a Support for Mineral Discovery. Geochem. Explor. Environ. Anal. 2011, 11, 117–128. [Google Scholar] [CrossRef] [Scilit]
- Ghanbari, Y.; Hezarkhani, A.; Ataei, M.; Paz, K. Mineral Potential Mapping for Rare Earth Elements Mineralization with AHP Method in the Kerman-Kashmar Tectonic Zone, Central Iran. J. Geol. Soc. India 2014, 83, 457–465. [Google Scholar] [CrossRef] [Scilit]
- Joly, A.; Porwal, A.; McCuaig, T.C.; Chudasama, B.; Dentith, M.C.; Aitken, A.R.A. Mineral Systems Approach Applied to GIS-Based 2D-Prospectivity Modelling of Geological Regions: Insights from Western Australia. Ore Geol. Rev. 2015, 71, 673–702. [Google Scholar] [CrossRef] [Scilit]
- Borges, R.C.; Fávaro, D.I.T.; Caldas, V.G.; da Costa Lauria, D.; Bernedo, A.V.B. Instrumental Neutron Activation Analysis, Gamma Spectrometry, and Geographic Information System Techniques in the Determination and Mapping of Rare Earth Elements in Phosphogypsum Stacks. Environ. Earth Sci. 2016, 75, 705. [Google Scholar] [CrossRef] [Scilit]
- Allajbeu, S.; Yushin, N.S.; Qarri, F.; Duliu, O.G.; Lazo, P.; Frontasyeva, M.V. Atmospheric Deposition of Rare Earth Elements in Albania Studied by the Moss Biomonitoring Technique, Neutron Activation Analysis, and GIS Technology. Environ. Sci. Pollut. Res. 2016, 23, 14087–14101. [Google Scholar] [CrossRef] [Scilit] [PubMed]
- Poliakovska, K.; Annesley, I.R.; Ivanik, O.; Sykes, J.; Pandur, K. The Use of 2D/3D GIS Software for Exploration Purposes: Case Studies from Canada and Ukraine. In Proceedings of the Geoinformatics 2020 Conference, Kyiv, Ukraine, 11–14 May 2020. [Google Scholar] [CrossRef] [Scilit]
- Bolouki, S.M.; Ramazi, H.R.; Maghsoudi, A.; Pour, A.B.; Sohrabi, G. Remote Sensing-Based Application of Bayesian Networks for Epithermal Gold Potential Mapping in Ahar-Arasbaran Area, NW Iran. Remote Sens. 2020, 12, 105. [Google Scholar] [CrossRef] [Scilit]
- Ali-Bik, M.W.; Hassan, S.M.; Sadek, M.F. Volcanogenic Talc-Copper Deposits of Darhib-Abu Jurdi Area, Egypt: Petrogenesis and Remote Sensing Characterization. Geol. J. 2020, 55, 5330–5354. [Google Scholar] [CrossRef] [Scilit]
- Beygi, S.; Talovina, I.V.; Tadayon, M.; Pour, A.B. Alteration and structural features mapping in Kacho-Mesqal zone, Central Iran using ASTER remote sensing data for porphyry copper exploration. Int. J. Image Data Fusion 2020, 12, 155–175. [Google Scholar] [CrossRef] [Scilit]
- Frutuoso, R.; Lima, A.; Teodoro, A.C. Application of remote sensing data in gold exploration: Targeting hydrothermal alteration using Landsat 8 imagery in northern Portugal. Arab. J. Geosci. 2021, 14, 459. [Google Scholar] [CrossRef] [Scilit]
- Muavhi, N.; Mavhungu, M.E.; Ndivhudzannyi, R. Mapping of Potential Rare Earth Deposits in the Schiel Alkaline Complex Using Sentinel-2B Multispectral Sensor. Egypt. J. Remote Sens. Space Sci. 2021, 24, 609–617. [Google Scholar] [CrossRef] [Scilit]
- Neave, D.A.; Black, M.; Riley, T.R.; Gibson, S.A.; Ferrier, G.; Wall, F.; Broom-Fendley, S. On the Feasibility of Imaging Carbonatite-Hosted Rare Earth Element Deposits Using Remote Sensing. Econ. Geol. 2016, 111, 641–665. [Google Scholar] [CrossRef] [Scilit]
- Rajan Girija, R.; Mayappan, S. Mapping of mineral resources and lithological units: A review of remote sensing techniques. Int. J. Image Data Fusion 2019, 10, 79–106. [Google Scholar] [CrossRef] [Scilit]
- Rajesh, H.M. Application of Remote Sensing and GIS in Mineral Resource Mapping—An Overview. J. Mineral. Petrol. Sci. 2004, 99, 83–103. [Google Scholar] [CrossRef] [Scilit]
- Zhou, W. GIS for Earth Sciences. In Encyclopedia of Geology, 2nd ed.; Academic Press: San Diego, CA, USA, 2021; pp. 281–293. [Google Scholar] [CrossRef] [Scilit]
- Tkachev, A.V.; Bulov, S.; Rundqvist, D.; Pokhno, S.; Chesalova, E.I.; Arbuzova, E. Web-GIS “The Largest Mineral Deposits of the World”. Geoinformatika 2015, 1, 47-5. (In Russian) [Google Scholar] [CrossRef]
- Uzhkenov, B.S. Methodological Foundations of the Creation of a Bank of Geological, Geophysical and Geochemical Information on the Subsoil and Subsoil Use on the Example of the Republic of Kazakhstan. Ph.D. Thesis, All-Russian Scientific Research Institute of Mineral Raw Materials, Moscow, Russian, 1997. [Google Scholar]
- Minerals. Available online: https://minerals.e-qazyna.kz/en/contracts-map (accessed on 21 May 2026).
- Sengör, A.M.C.; Natal’in, B.A. Paleotectonics of Asia: Fragments of a synthesis. Geol. Soc. Am. Spec. Pap. 1996, 294, 486–640. [Google Scholar]
- Windley, B.F.; Alexeiev, D.; Xiao, W.; Kröner, A.; Badarch, G. Tectonic models for ac-cretion of the Central Asian Orogenic Belt. J. Geol. Soc. 2007, 164, 31–47. [Google Scholar] [CrossRef] [Scilit]
- Gavryushkina, O.; Travin, A.; Kruk, N. Duration of granitoid magmatism in peripheral parts of large igneous provinces (based on 40Ar/39Ar isotopic studies of Altai Permian–Triassic granitoids). Geodyn. Tectonophys. 2017, 8, 1035–1047. [Google Scholar] [CrossRef] [Scilit]
- Kuibida, M.L.; Dyachkov, B.A.; Vladimirov, A.G.; Kruk, N.N.; Khromykh, S.V.; Kotler, P.D. Contrasting granitic magmatism of the Kalba fold belt (East Kazakhstan): Evidence for Late Paleozoic post-orogenic events. J. Asian Earth Sci. 2019, 175, 178–198. [Google Scholar] [CrossRef] [Scilit]
- Kotler, P.; Khromykh, S.; Kruk, N.; Sun, M.; Li, P.; Khubanov, V. Granitoids of the Kalba batholith, Eastern Kazakhstan: U-Pb zircon age, petrogenesis and tectonic implications. Lithos 2021, 388, 106056. [Google Scholar] [CrossRef] [Scilit]
- Khromykh, S.V.; Tsygankov, A.A.; Kotler, P.D.; Navozov, O.V.L.; Kruk, N.N.; Vladimirov, A.G. Late Paleozoic granitoid magmatism of Eastern Kazakhstan and Western Transbaikalia: Plume model test. Russ. Geol. Geophys. 2016, 57, 773–789. [Google Scholar] [CrossRef] [Scilit]
- Mizernaya, M.A.; Aitbayeva, S.S.; Kotler, P.D.; Dolgopolova, A.V.; Seltmann, R.; Bekishev, Y.; Kuzmina, O.N.; Oitseva, T.A.; Shayakhmetova, Z.A.; Akbarov, Y.Y.; et al. Pegmatites of the Kalba–Narym Batholith (East Kazakhstan): Origin and Classification. Minerals 2026, 16, 187. [Google Scholar] [CrossRef] [Scilit]
- Rakhymberdina, M.; Shults, R.; Apshikur, B.; Bekishev, Y.; Grokhotov, Y.; Kapasov, A.; Mukyshev, D. Integrated Sentinel-2 and UAV Remote Sensing for Rare-Metal Pegmatite–Greisen Exploration: Evidence from the Central Kalba–Narym Belt, East Kazakhstan. Geosciences 2026, 16, 130. [Google Scholar] [CrossRef] [Scilit]
- Bekishev, Y.T.; Rakhymberdina, M.Y.; Levin, E.; Assylkhanova, Z.A.; Kapasov, A.K. Creating of a geological GIS database of Eastern Kazakhstan using the Kalba-Narym Zone as an example. In Proceedings of the 45th Asian Conference on Remote Sensing (ACRS 2024), Colombo, Sri Lanka, 17–21 November 2024; Available online: https://acrs-aars.org/proceeding/ACRS2024/AB0282.pdf (accessed on 17 July 2025).
- OneGeology. Available online: https://portal.onegeology.org/OnegeologyGlobal/ (accessed on 17 October 2024).
- Report on the Compilation of the Legend of the Zaisan Series of Sheets for the State Geological Map-200 Based on the Results of Geological Survey at a Scale of 1:200 000 (GDP-200) from the Work Conducted in 2010–2012. In Ministry of Industry and New Technologies of the Republic of Kazakhstan, Committee for Geology and Subsoil Use, State Institution “East Kazakhstan Interregional Department of Geology and Subsoil Use” (MD “Vostkaznedra”); Topaz Geological Exploration Company LLP: Ust-Kamenogorsk, Kazakhstan, 2012. (In Russian)
- Committee for Geology and Subsoil Protection. Report on the Results of Geological Re-Study at a Scale of 1:200 000 of the Zyryanovsk Ore Mining Area (Sheets M-44-XXIV, M-45-XIX) Based on the Work Conducted in 2001–2003. In Ministry of Energy and Mineral Resources of the Republic of Kazakhstan; Topaz JSC: Ust-Kamenogorsk, Kazakhstan, 2003. (In Russian) [Google Scholar]
- East Kazakhstan Territorial Geological Administration. Report of the Belogorsk Production Specialized Enterprise for 1974–1977. In Ministry of Geology of the Kazakh SSR; Ust-Kamenogorsk Geological Exploration Expedition: Ust-Kamenogorsk, Kazakhstan, 1997. (In Russian) [Google Scholar]
- Report on the Results of Contractual Work with the Belogorsk Mining and Processing Plant for 1984–1987; Academy of Sciences of the Kazakh SSR, Altai Branch of the K.I. Satpayev Institute of Geological Sciences, Laboratory of Gold and Rare Metal Formations: Ust-Kamenogorsk, Kazakhstan, 1987. (In Russian)
- USGS EarthExplorer. Access to Satellite and Aerial Imagery, Elevation, and Land Cover Data. Available online: https://earthexplorer.usgs.gov (accessed on 2 July 2025).
- CGIAR Consortium for Spatial Information. Available online: https://csidotinfo.wordpress.com/ (accessed on 18 October 2024).
- QGIS User Guide. Available online: https://docs.qgis.org/3.34/en/docs/user_manual/index.html (accessed on 15 July 2024).
- The Georeferencer Plugin. Available online: https://docs.qgis.org/2.18/en/docs/user_manual/plugins/plugins_georeferencer.html (accessed on 17 October 2024).
- QGIS Python Plugins Repository: Raster Tracer. Available online: https://plugins.qgis.org/plugins/raster_tracer/ (accessed on 17 October 2024).
- Yin, H.-M.; Su, S.-W. Modeling for Geospatial Database of National Fundamental Geographic Information. In Proceedings of the IEEE International Symposium on Geoscience and Remote Sensing, Denver, CO, USA, 31 July–4 August 2006. [Google Scholar] [CrossRef] [Scilit]
- Hunt, G.R. Spectral Signatures of Particulate Minerals in the Visible and Near Infrared. Geophysics 1977, 42, 501–513. [Google Scholar] [CrossRef] [Scilit]
- Rakhymberdina, M.Y.; Bekishev, Y.T.; Shults, R.; Apshikur, B.; Grokhotov, Y.; Assylkhanova, Z.A.; Toguzova, M.M.; Abdygaliyeva, A.K. Remote Sensing Technologies in the Search for Rare Metal Deposits in Eastern Kazakhstan. Int. Arch. Photogramm. Remote Sens. Spat. Inf. Sci. 2025, XLVIII-5/W3-2025, 89–94. [Google Scholar] [CrossRef] [Scilit]
- Kwarteng, P.; Chavez, A. Extracting spectral contrast in Landsat Thematic Mapper image data using selective principal component analysis. Photogramm. Eng. Remote Sens. 1989, 55, 339–348. [Google Scholar]
- Ali, A.S.O.; Pour, A.B. Lithological mapping and hydrothermal alteration using Land-sat 8 data: A case study in Ariab mining district, Red Sea Hills, Sudan. Int. J. Basic Appl. Sci. 2014, 3, 199. [Google Scholar] [CrossRef] [Scilit]
- Sabins, F.F. Remote sensing for mineral exploration. Ore Geol. Rev. 1999, 14, 157–183. [Google Scholar] [CrossRef] [Scilit]
- Pour, A.B.; Hashim, M. Hydrothermal alteration mapping from Landsat-8 data, Sar Cheshmeh copper mining district, south-eastern Islamic Republic of Iran. J. Taibah Univ. Sci. 2015, 9, 155–166. [Google Scholar] [CrossRef] [Scilit]

Disclaimer/Publisher’s Note: The statements, opinions and data contained in all publications are solely those of the individual author(s) and contributor(s) and not of MDPI and/or the editor(s). MDPI and/or the editor(s) disclaim responsibility for any injury to people or property resulting from any ideas, methods, instructions or products referred to in the content. |
© 2026 by the authors. Licensee MDPI, Basel, Switzerland. This article is an open access article distributed under the terms and conditions of the Creative Commons Attribution (CC BY) license.