


Abstract
A study was performed on the electromagnetic response of the geological medium during the propagation of Rayleigh waves from the 2025 Kamchatka earthquakes (M8.8–7.4) at an epicentral distance of approximately 6000 km. The identities of the coseismic telluric current variations and the propagating Rayleigh wave have been revealed, with their power spectra exhibiting a pronounced quasi-line structure with dominant peaks at 0.04 Hz, 0.054 Hz, and 0.064 Hz. The high correlation of the telluric current response with the Rayleigh wave (r = 0.906, M8.8 and r = 0.83, M7.8) allowed the seismoelectric effect of the second kind to be considered the dominant mechanism for disturbance generation. Electromagnetic signals recorded by the IMS-008 induction sensor showed a lower correlation (r = 0.682), which may be attributed to the shaking of the induction sensor during the passage of the Rayleigh wave, though this does not preclude the presence of a true coseismic signal. Coseismic effects were recorded during the M7.8 and M8.8 earthquakes, but were absent during the M7.4 events. For the first time for the Northern Tien Shan region (at teleseismic distances of approximately 6000 km), key regularities in the generation of the seismoelectric effect during Rayleigh wave propagation have been identified. It is shown that the telluric current response is characterized by a threshold sensitivity to the event magnitude, with the magnitude of induced current variations strictly consistent with the intensity of the seismic wave’s dynamic impact. Utilizing telluric currents as a physical reference for the precise determination of Rayleigh wave arrival times allowed for the refinement of the Rayleigh wave group velocity (3.078–3.093 km/s), reducing calculation uncertainty to 0.5%.
1. Introduction
Investigations of geoelectric and magnetic fields before, during, and after earthquakes associated with seismic wave propagation are widely conducted in regions of elevated seismic activity. The Zailiyskiy Alatau, a northern ridge of the Tien Shan, is no exception, as it hosts the sources of several destructive earthquakes, including the Verny earthquake (M7.3, 1887), the Chilik earthquake (M8.3, 1889), the Kemin earthquake (M8.2, 1911), and other major seismic events [1,2]. The seismic activity of the region is characterized by alternating periods of activation and prolonged quiescence. Here, at the Dzhusaly-Kezen Pass (Zailiysky Alatau mountain range, altitude of 3340 m above sea level), the High-Mountain Geophysical Observatory (HGO) of the Institute of Ionosphere and the Tien Shan High-Mountain Scientific Station of the Lebedev Physical Institute are located. Multiparameter observations of geophysical fields, including the monitoring of geoelectric and electromagnetic processes, are carried out at these stations. These studies are aimed at investigating lithosphere–atmosphere–ionosphere coupling during both the preparation and occurrence of earthquakes and other catastrophic events [3,4,5].
On 29 July 2025, at 13:14:51 UTC, an M8.8 megathrust earthquake occurred offshore of eastern Kamchatka (51.495° N, 160.140° E). It was the strongest seismic event recorded in 11 years since the catastrophic magnitude 9.0 Tohoku earthquake. Subsequently, on 18 September 2025, at 18:58:14 UTC (N 53.171, E 160.681), another major earthquake with a magnitude of M7.8 occurred. Such a sequence of large earthquakes originating from the same focal zone provided a rare opportunity to record seismoelectric phenomena in telluric current variations and ultra-low-frequency (ULF) electromagnetic signals at a considerable epicentral distance of approximately 6000 km.
The study of seismoelectric phenomena in geophysics dates back to the works of R.R. Thompson, A.G. Ivanov, Ya.I. Frenkel, and M. Biot [6,7,8,9,10], in which the electrokinetic phenomenon was associated with the relationship between electric field intensity and the pore pressure gradient in a medium. These studies also led to the development of a theory describing the fluid dynamics of porous media subjected to seismic effect. In the 1980s, the Varotsos–Alexopoulos–Nomicos (VAN) group discovered short-term variations in the Earth’s electric field preceding earthquakes and proposed a method for detecting seismic electric signals (SESs) based on variations in telluric currents [11]. SESs preceding major earthquakes have been recorded in various seismically active regions, including Greece, Japan, China, Mexico, and Kyrgyzstan, as reported in [12]. Based on observations of seismoelectric effects during the 2022–2025 period, the statistical effectiveness of the VAN method was demonstrated [13].
Methods for recording seismoelectric phenomena have been widely applied to the study of effects associated with the propagation of volume and surface seismic waves generated by earthquakes. Most investigations of anomalous variations in geoelectric and electromagnetic fields have focused on earthquakes whose epicenters are located at distances of several tens to several hundreds of kilometers from the monitoring sites [14,15,16,17,18]. In the 1990s, the VAN group established that for M6-class earthquakes at distances of about 100 km or greater, electromagnetic disturbances were recorded simultaneously with the arrival of the P-wave and reached their maximum amplitude during the arrival of the S-wave train. A characteristic feature of such effects was the absence of SESs directly at the moment of earthquake onset, which was confirmed by independent measurements of strong earthquakes in Greece and Turkey [14].
Coseismic changes in geoelectric potential differences ranging from 1 to 8 mV were recorded for five mb > 5 earthquakes, whose epicenters were located in the Indian Ocean at distances of approximately 170 km from the monitoring sites [15]. Observations in Japan of earthquakes with magnitudes M5.1–6.1 showed that geoelectric responses at distances from 8 to 50 km were coseismic in nature. The authors emphasized that these effects resulted from the propagation of seismic waves through the local medium rather than from electromagnetic emissions arriving directly from the earthquake focus. The simultaneity of these responses with the arrival of elastic waves indicated local generation of the electric field in the vicinity of the sensors [16]. Significant anomalous variations in geoelectric and magnetic fields observed during the Mw7.9 earthquake at distances of about 110 km from the monitoring sites were reported in [17]. The authors noted that variations in the geoelectric potential of up to 140 mV/100 m occurred simultaneously with the arrival of the seismic P-wave, approximately 40 s after the main shock. In studies of the generation mechanisms of coseismic electric currents, primary attention has been given to the electrokinetic effect, in which the generation zone is local and confined to regions of increased pore-water pressure induced by seismic waves. Calculations based on the parameters of the Rayleigh wave recorded in Alaska after the catastrophic M9.0 Sumatra earthquake in 2004 showed that the expected amplitudes of the vertical component of coseismic electric fields of electrokinetic origin can vary from tens of µV/m to several V/m [19].
Our research focuses on a study of geoelectric and electromagnetic (EM) phenomena associated with the propagation of Rayleigh waves from four major earthquakes (M8.8, M7.8, and two M7.4) that occurred off the eastern coast of Kamchatka during the summer–autumn of 2025 at epicentral distances of about 6000 km. The paper analyzes the effects that resulted from the mechanical deformation of the medium during the passage of Rayleigh waves at the observation site.
2. Materials and Methods
Studies of telluric current variations and ultra-low-frequency (ULF) electromagnetic signals were carried out at the experimental sites of the High-Mountain Geophysical Observatory of the Institute of Ionosphere (Kazakhstan) and of the Tien Shan Research Station of the P.N. Lebedev Physical Institute of the Russian Academy of Sciences. The experimental complex is located in the mountains of the Northern Tien Shan region (Zailiyskiy Alatau) at altitudes of 3340 m and 3400 m above sea level (N 43.037, E 76.943), far from industrial electromagnetic interference.
Telluric currents (TCs) were measured between two grounded lead electrodes separated by a distance of 120 m. Lead electrodes, measuring 41 × 8 × 1 cm, were buried vertically in the ground to a depth of 1 m and oriented in an east–west (E-W) direction. Telluric current variations were recorded in the ultra-low-frequency range (0–20 Hz) with a sampling rate of 66.6 Hz. Detailed description of the measuring complex and measurement method is given in [20].
Registration of ULF electromagnetic signals was carried out using an IMS-008 induction-type magnetic sensor manufactured by VEGA Geophysics Ltd. (Saint Petersburg, Russia). The sensor consists of an induction coil with a ferromagnetic core integrated in a single housing together with a preamplifier. A low-noise preamplifier and a buffer amplifier with differential output are housed together with the transducer and connected via cable and connector to the data acquisition system and power supply [21].
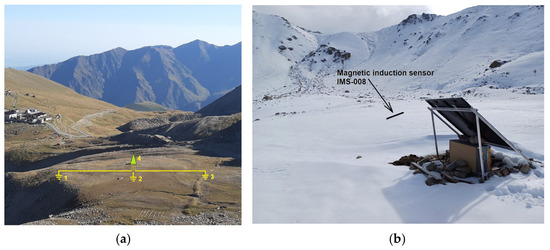
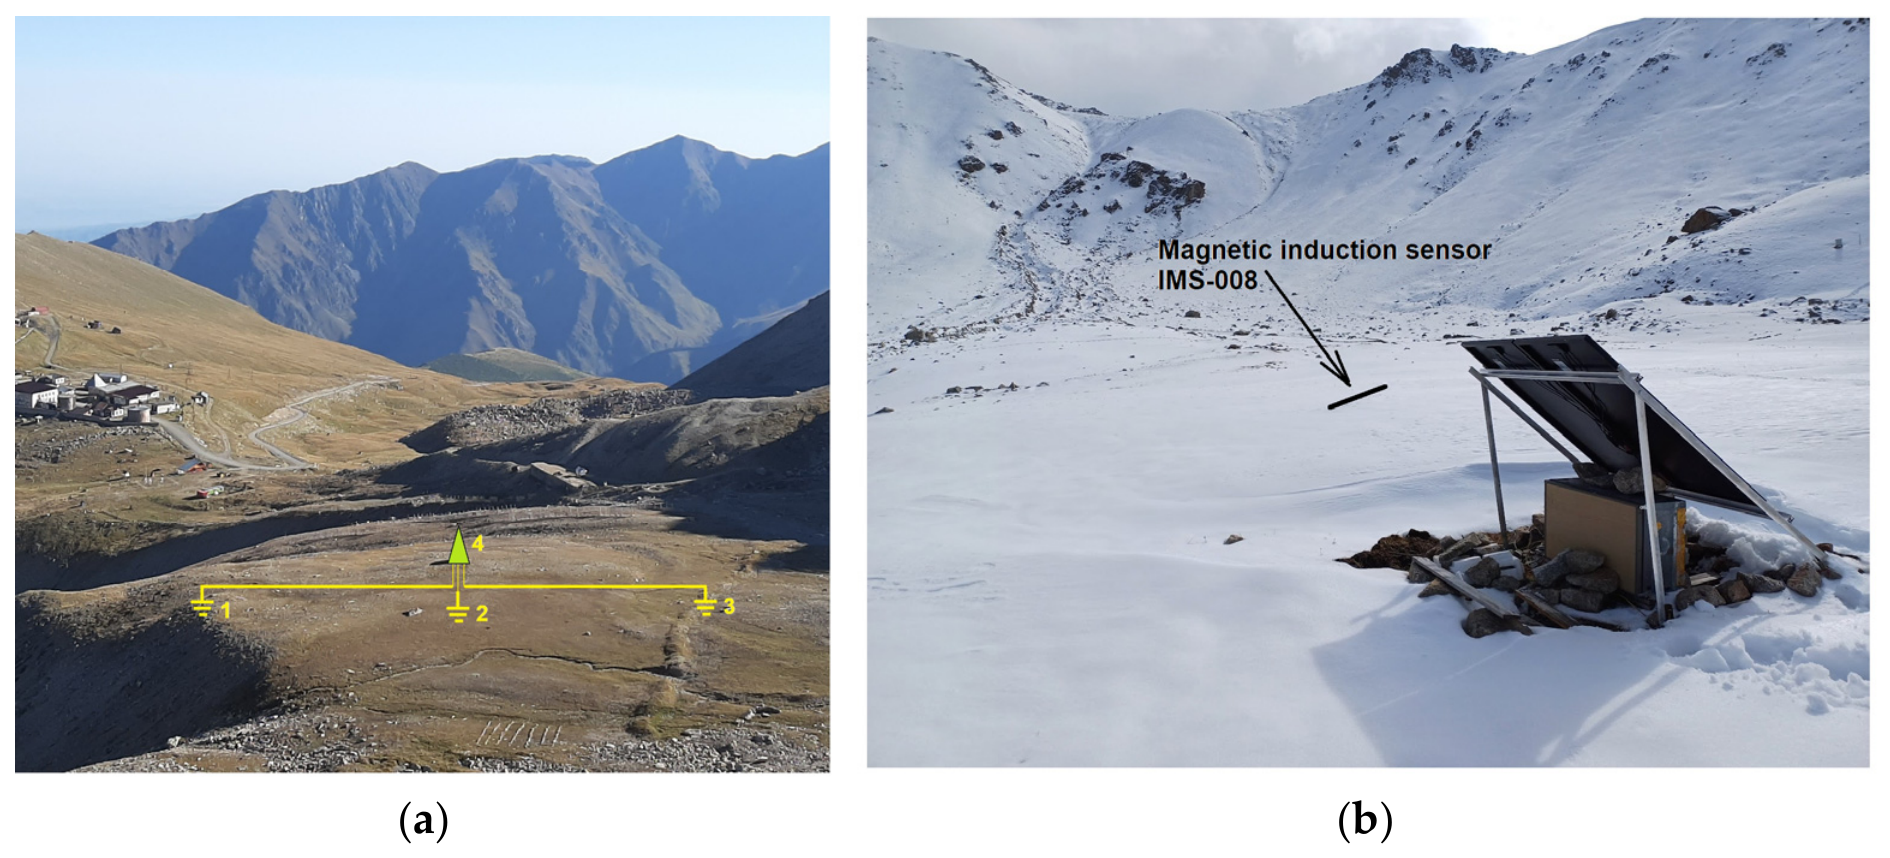
To record signals in the frequency range of 0.0001–20 Hz, a 12th-order Chebyshev low-pass filter with a cutoff frequency of 20 Hz was additionally employed. A notch filter was used to suppress 50 Hz power-line interference. Data acquisition was performed with a sampling frequency of 66.6 Hz. The sensor was placed inside a plastic tube sealed at both ends to protect it from wind and moisture and oriented along the north–south (N-S) direction, corresponding to the X-component of the geomagnetic field. The magnetometer was powered autonomously by solar panels. Synchronization of data acquisition was achieved through the use of a single multichannel analog-to-digital converter (ADC) E-154 (L-CARD, Moscow, Russia). The telluric current and electromagnetic signal sensors were installed at a distance of 5 m from each other (Figure 1). A detailed description of the measuring complex and the applied measurement methodology is given in [22].
Figure 1.
Experimental setup of the telluric current measurement system (a) and the IMS-008 induction-type magnetic sensor (b) for the registration of ultra-low-frequency (ULF) electromagnetic signals. 1 and 3–grounding electrodes for measuring telluric current variations, placed 120 m apart; 2–reference electrode; 4–measuring station [43.03692° N, 76.94230° E].
All observations made at the high-altitude geophysical observatory High-Mountain Geophysical Observatory are analyzed with regard to the current geomagnetic situation. One-second measurements of the geomagnetic field are available on the website of the geomagnetic observatory “Alma-Ata” (N 43.176, E 76.951) of the Institute of Ionosphere, Kazakhstan [23]. More detailed information about the mid-latitude geomagnetic observatory is provided in [24].
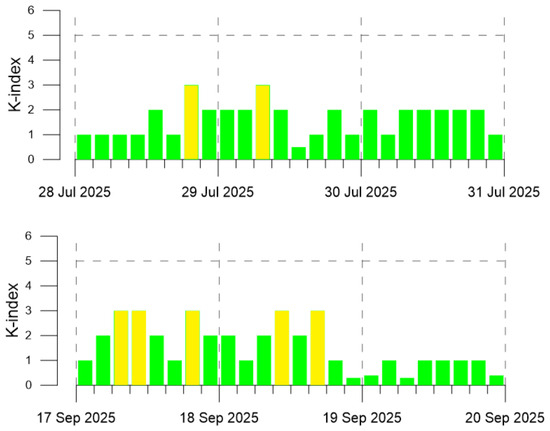
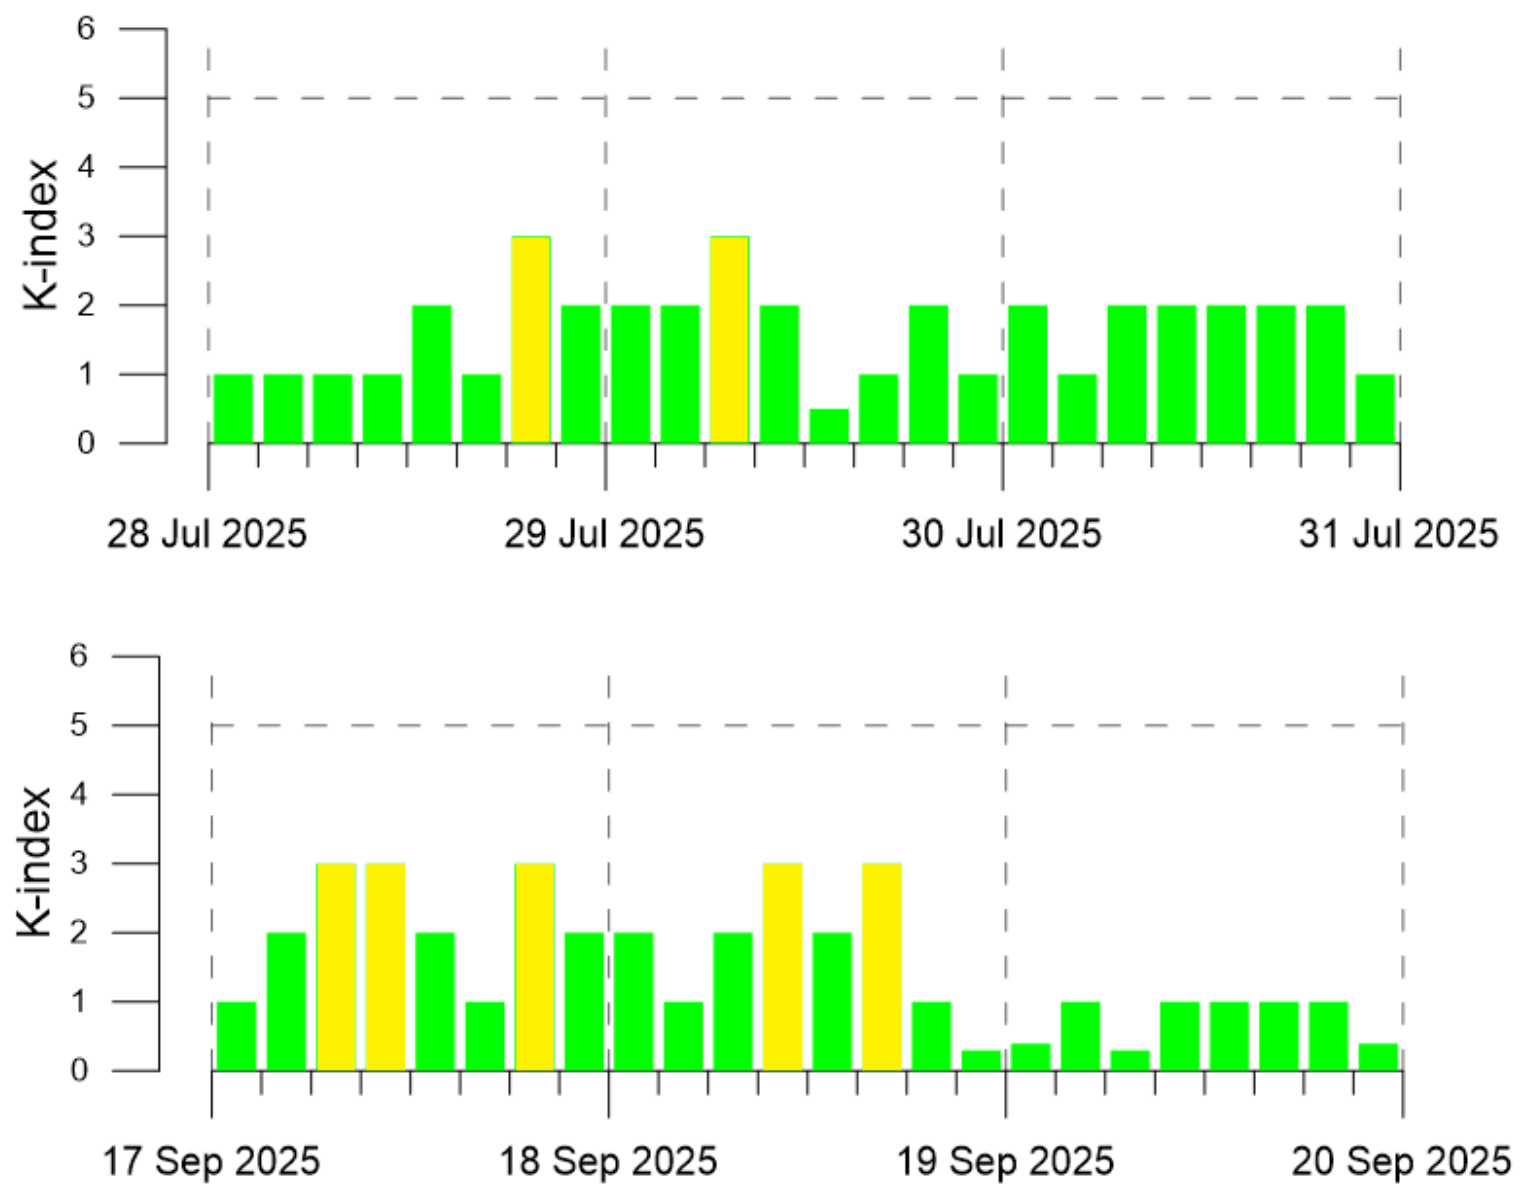
Geomagnetic conditions before and during the Kamchatka earthquakes from 20 July to 29 and from 13 September to 18 2025 remained quiet (Figure 2).
Figure 2.
Variations in the geomagnetic K-index before and during the Kamchatka earthquakes that occurred in July and September 2025, based on data from the geomagnetic observatory “Alma-Ata”.
3. Results
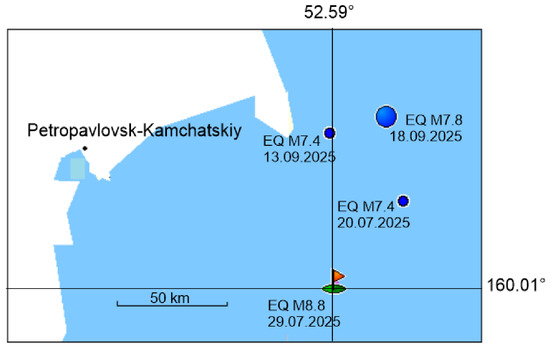
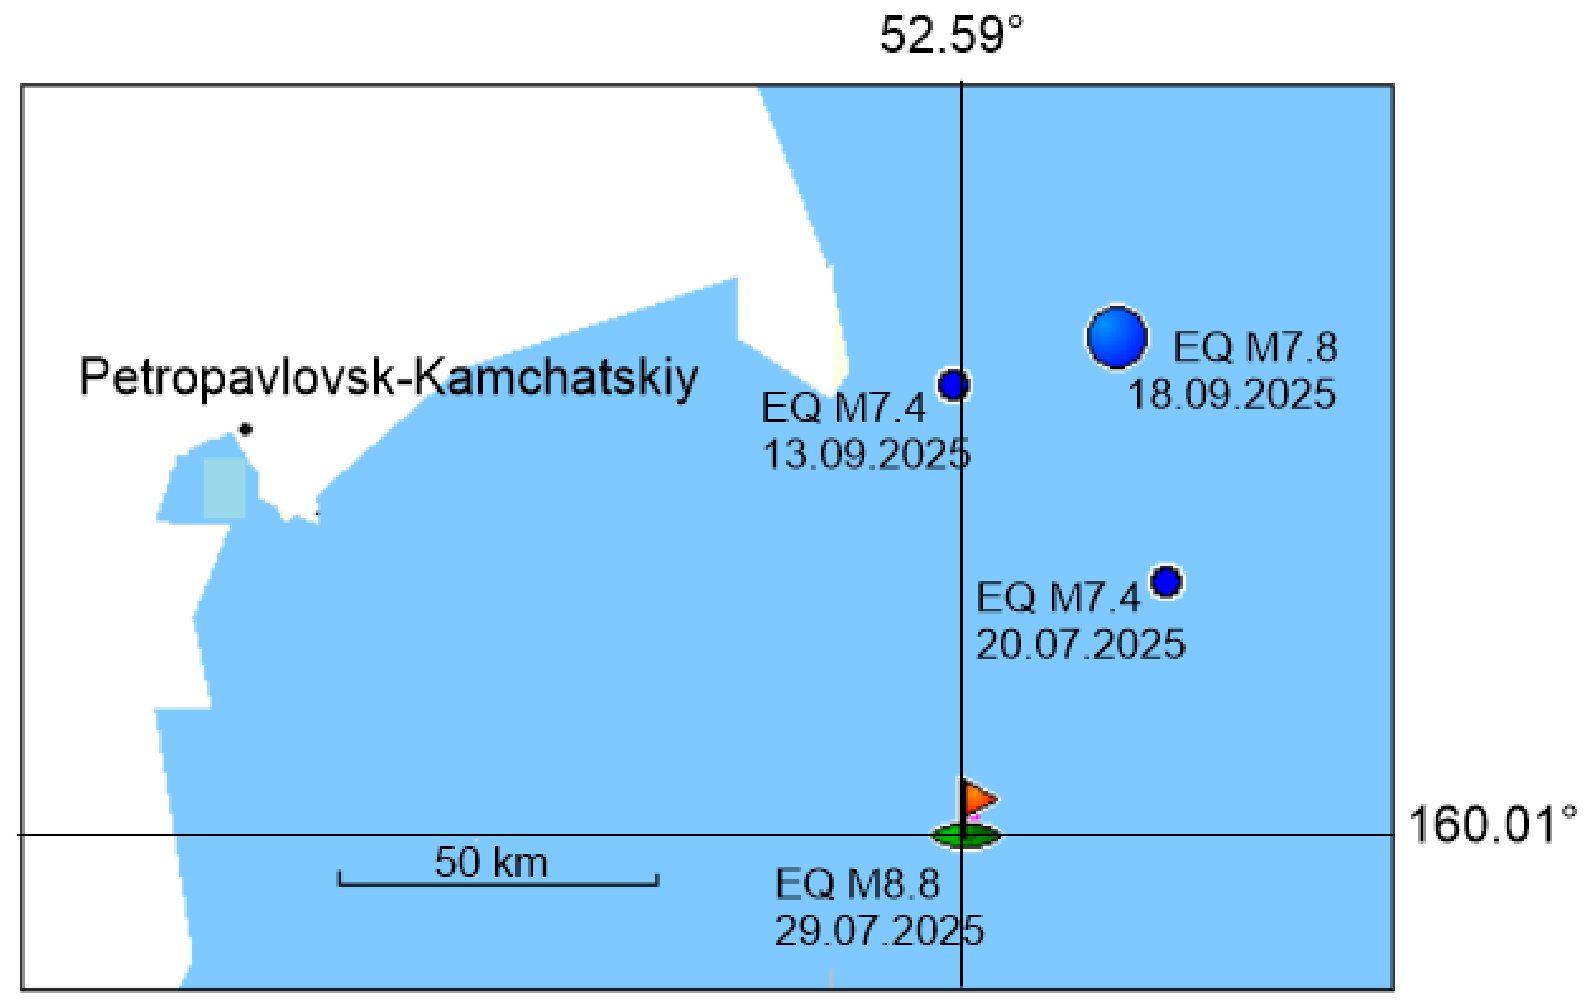
During the summer–autumn period of 2025, a series of four major earthquakes with magnitudes of M ≥ 7.4, including a mega-earthquake of M8.8, occurred within the same geological structure of the Kuril–Kamchatka subduction zone. The epicenters of these events were localized within a narrow geographical cluster at distances of 5949–6062 km from the High-Mountain Geophysical Observatory of the Institute of Ionosphere in the Northern Tien Shan region (Figure 3). Since the distances between the epicenters did not exceed 81 km, the azimuthal deviation at propagation distances of approximately 6000 km was less than 1°.
Figure 3.
Spatial distribution of the epicenters of Kamchatka earthquakes with magnitudes M7.4–7.8 (blue circles) and the epicenter of the M8.8 earthquake (red flag) that occurred during the summer–autumn period of 2025.
Table 1 presents the main seismological parameters of the four strongest Kamchatka earthquakes that occurred during the July–September 2025 period, as well as the role of each event within the earthquake sequence according to [25,26,27,28]. The sequence of processes associated with the preparation of the M8.8 mega-earthquake and the subsequent stress release along a ~500–600 km segment of the Kuril–Kamchatka Trench were analyzed.
Table 1.
Parameters of the Kamchatka earthquakes with M ≥ 7.4 and their chronology relative to the M8.8 earthquake.
A clear arrival of seismic waves generated by these earthquakes was recorded at the Makanchi (MAKZ) seismological station, Kazakhstan, at an epicentral distance of 5408 km.
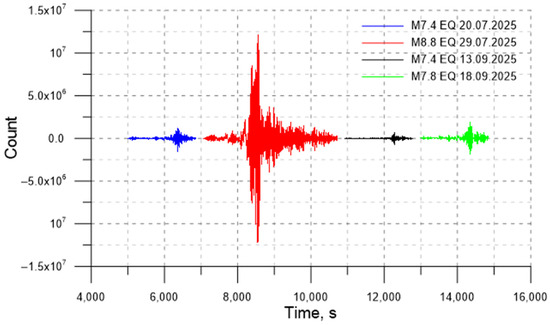
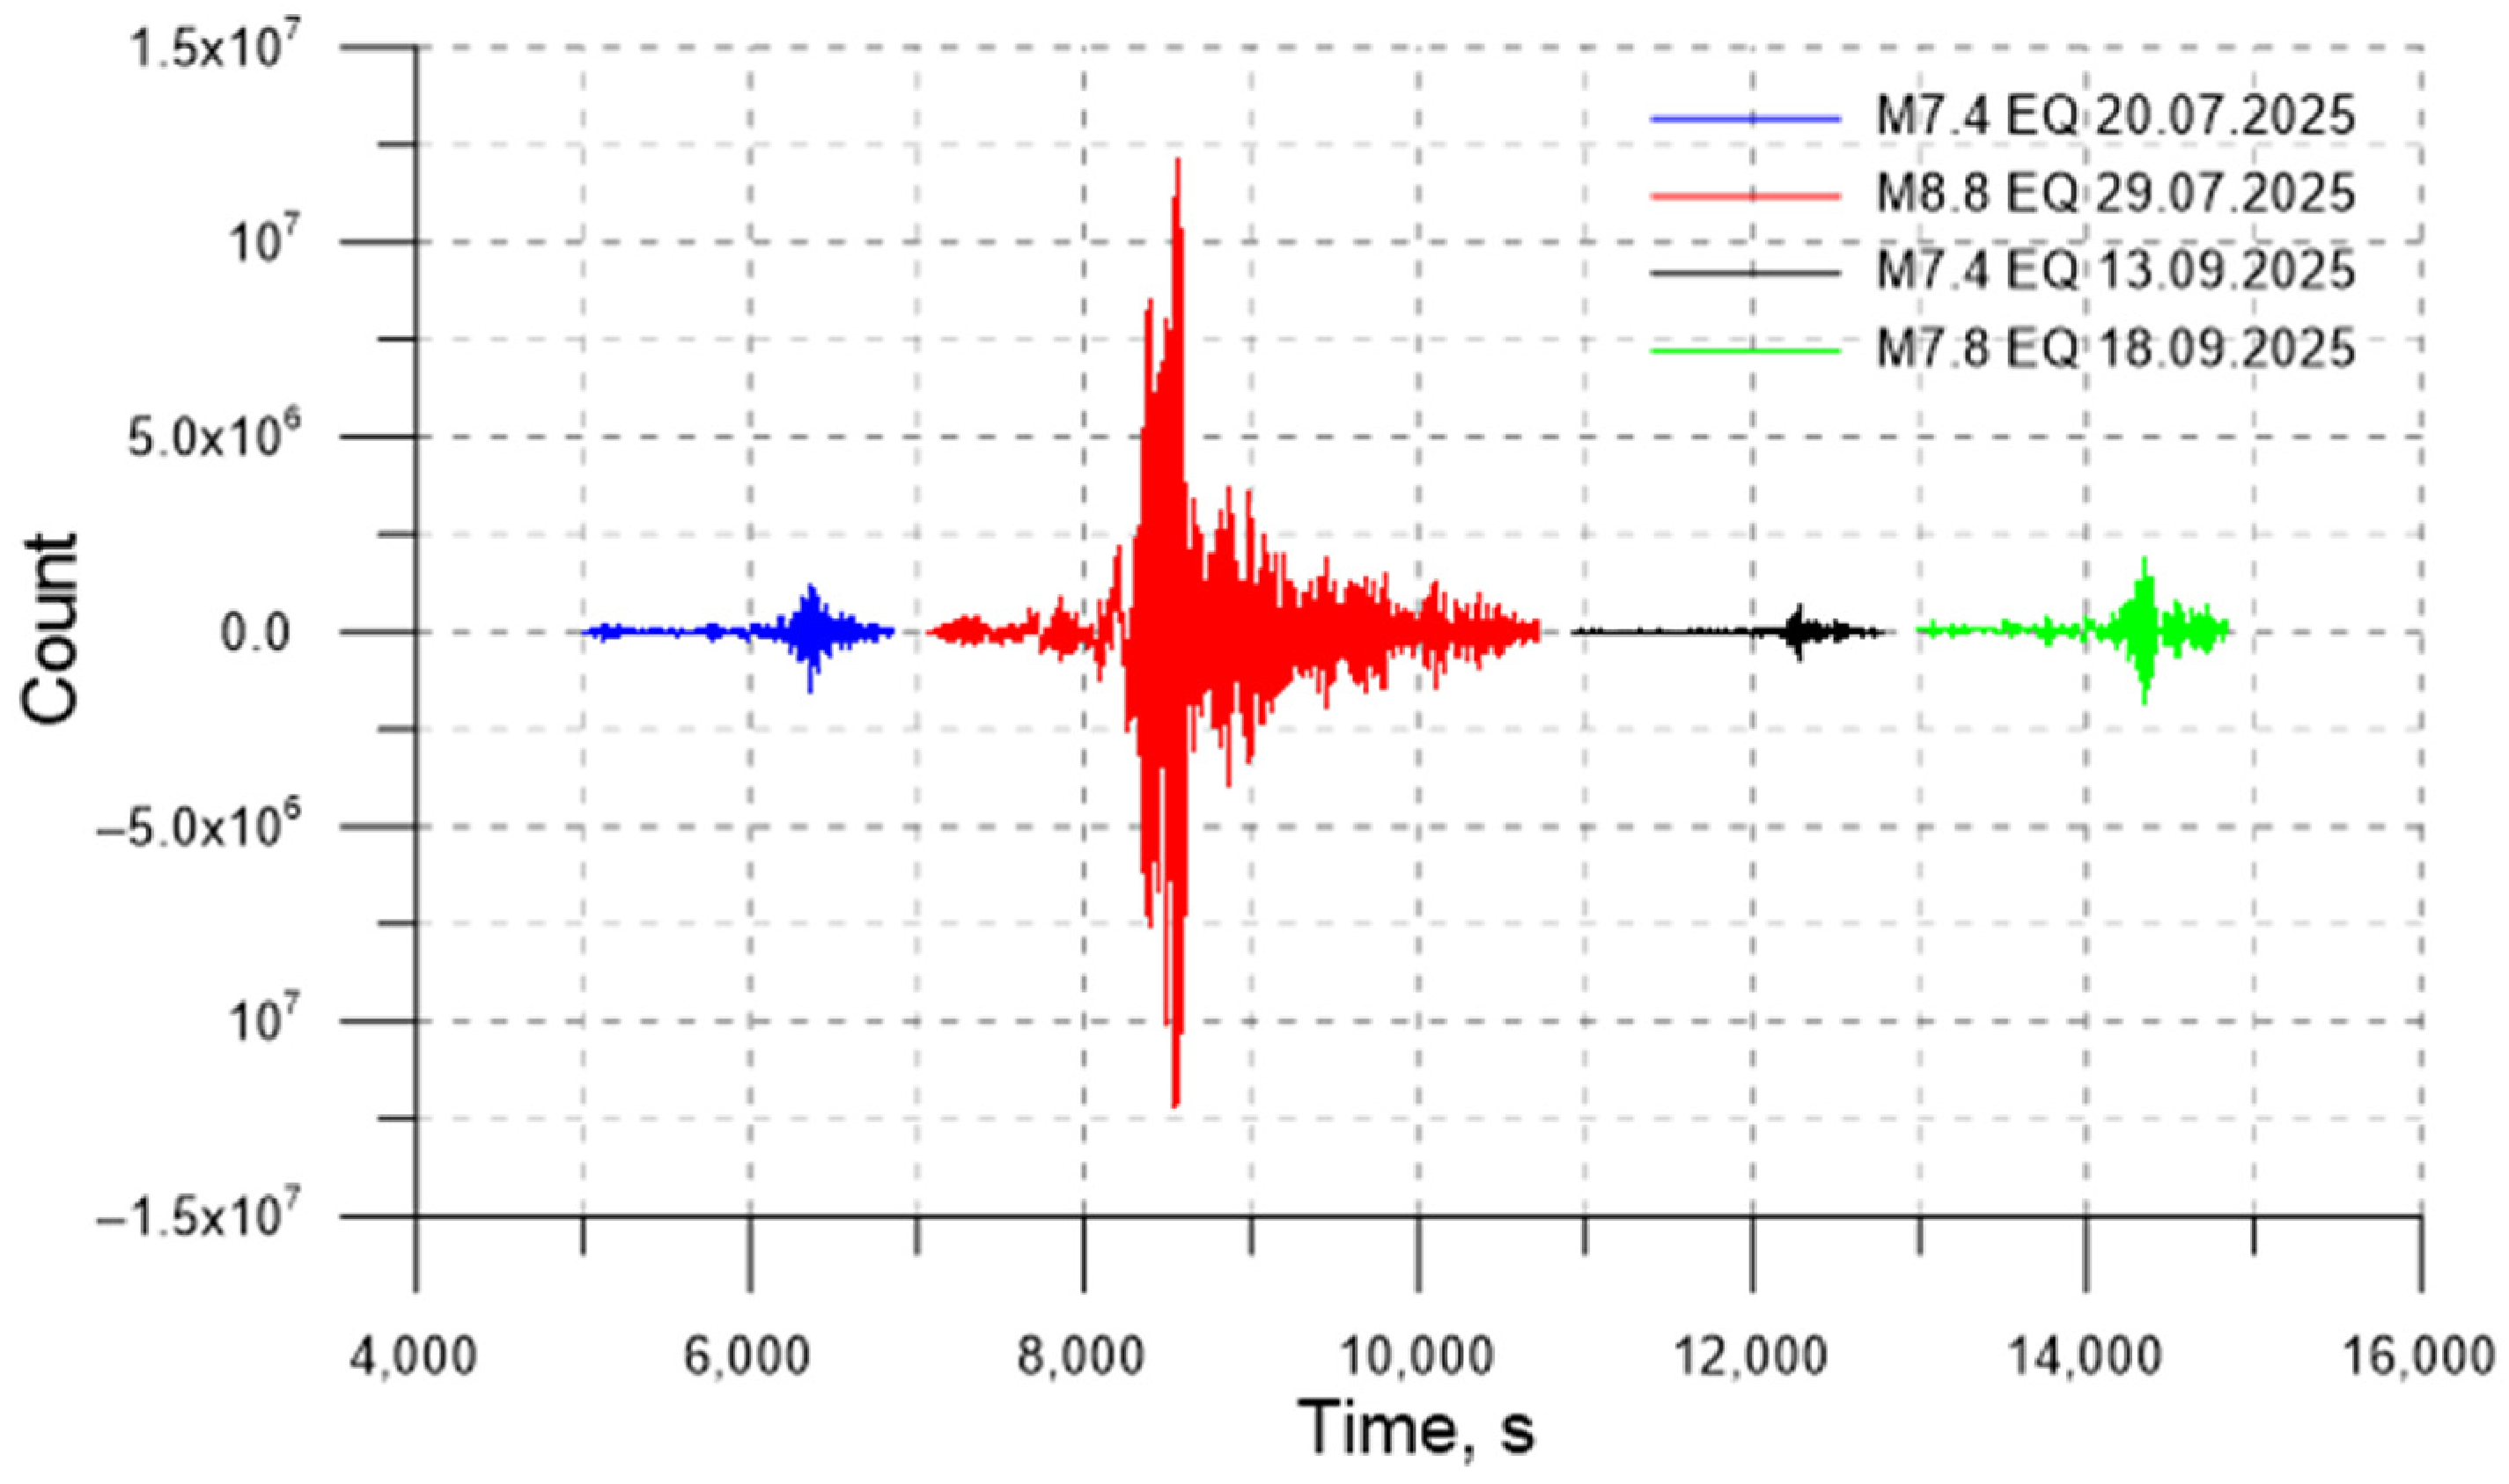
The geographical proximity of the epicenters (~81 km) and the stable azimuth of seismic wave arrival relative to the recording sites, including the Makanchi seismic station and the High-Mountain Geophysical Observatory, allow the propagation paths of the seismic waves to be considered identical. A comparison of the Rayleigh wave records on a common scale (Figure 4) clearly demonstrates the dependence of wave amplitude on earthquake magnitude. The dominant periods of these waves range from 19 to 25 s.
Figure 4.
Vertical component (Z) of Rayleigh waves from four Kamchatka earthquakes (M ≥ 7.4), based on data from the Makanchi (MAKZ) seismic station. For clarity, the records are presented on a common scale with a relative time shift along the horizontal axis.
The Rayleigh wave from the M8.8 earthquake is clearly distinguished in Figure 4, indicating the enormous energy released during this seismic event. The most significant of these were the earthquakes on 29 July (M8.8) and 18 September (M7.8), which caused responses in the telluric current. The similarity of the spatial characteristics of seismic wave propagation made it possible to consistently compare and analyze the intensity of telluric current responses and electromagnetic (EM) signals, depending on the magnitude of each seismic event.
3.1. Coseismic Telluric Current and ULF Electromagnetic Responses to Rayleigh Waves from M7.8–8.8 Kamchatka Earthquakes
3.1.1. The M8.8 Earthquake of 29 July 2025
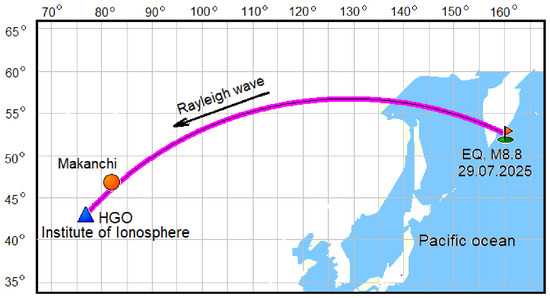
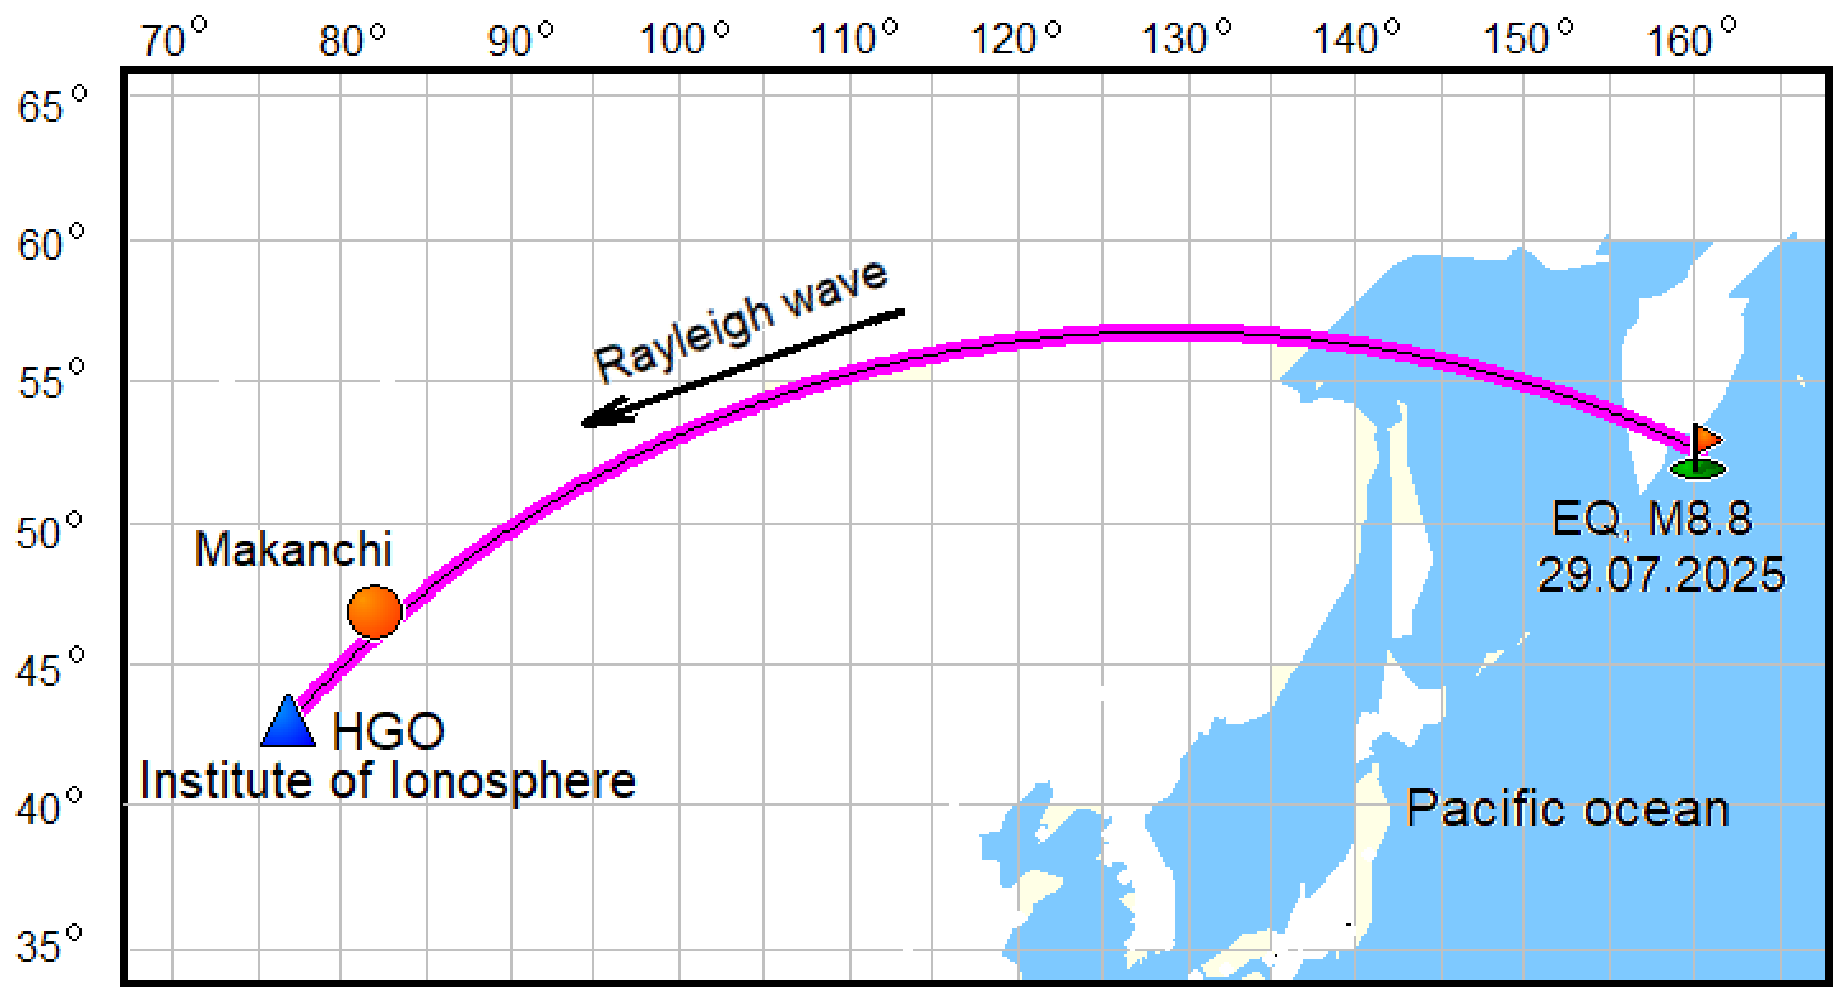
On 29 July 2025, at 23:24:52 UTC, a megathrust earthquake with a magnitude of M8.8 occurred off the east coast of Kamchatka. The Rayleigh waves propagated over considerable distances. First, the passage of the Rayleigh wave was recorded at the Makanchi seismic station (N 46.81, E 81.98). Then, 191.7 s later, the wave front reached the High-Mountain Geophysical Observatory, located at a distance of 574 km from Makanchi and 5981 km from the earthquake epicenter (Figure 5). Continuous monitoring of telluric current variations and ULF electromagnetic signals is carried out at the High-Mountain Geophysical Observatory (3400 m asl).
Figure 5.
Schematic of Rayleigh wave propagation from the M8.8 earthquake to the Makanchi seismic station (5408 km) and the High-Mountain Geophysical Observatory (5981 km), hosting the telluric current and electromagnetic field monitoring sites.
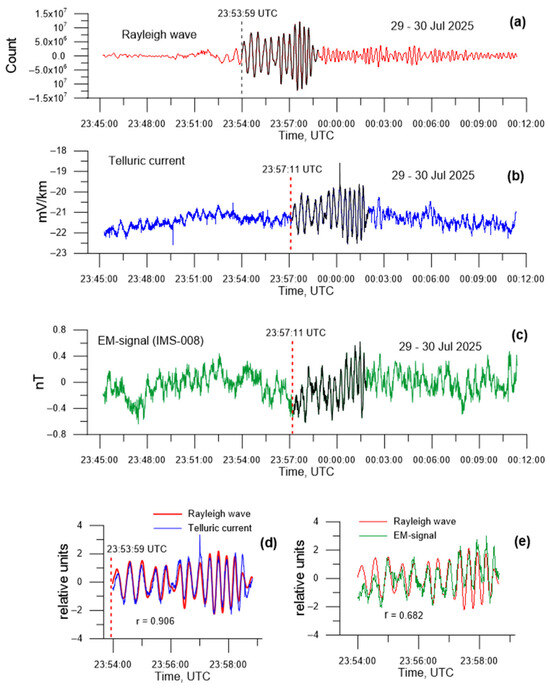
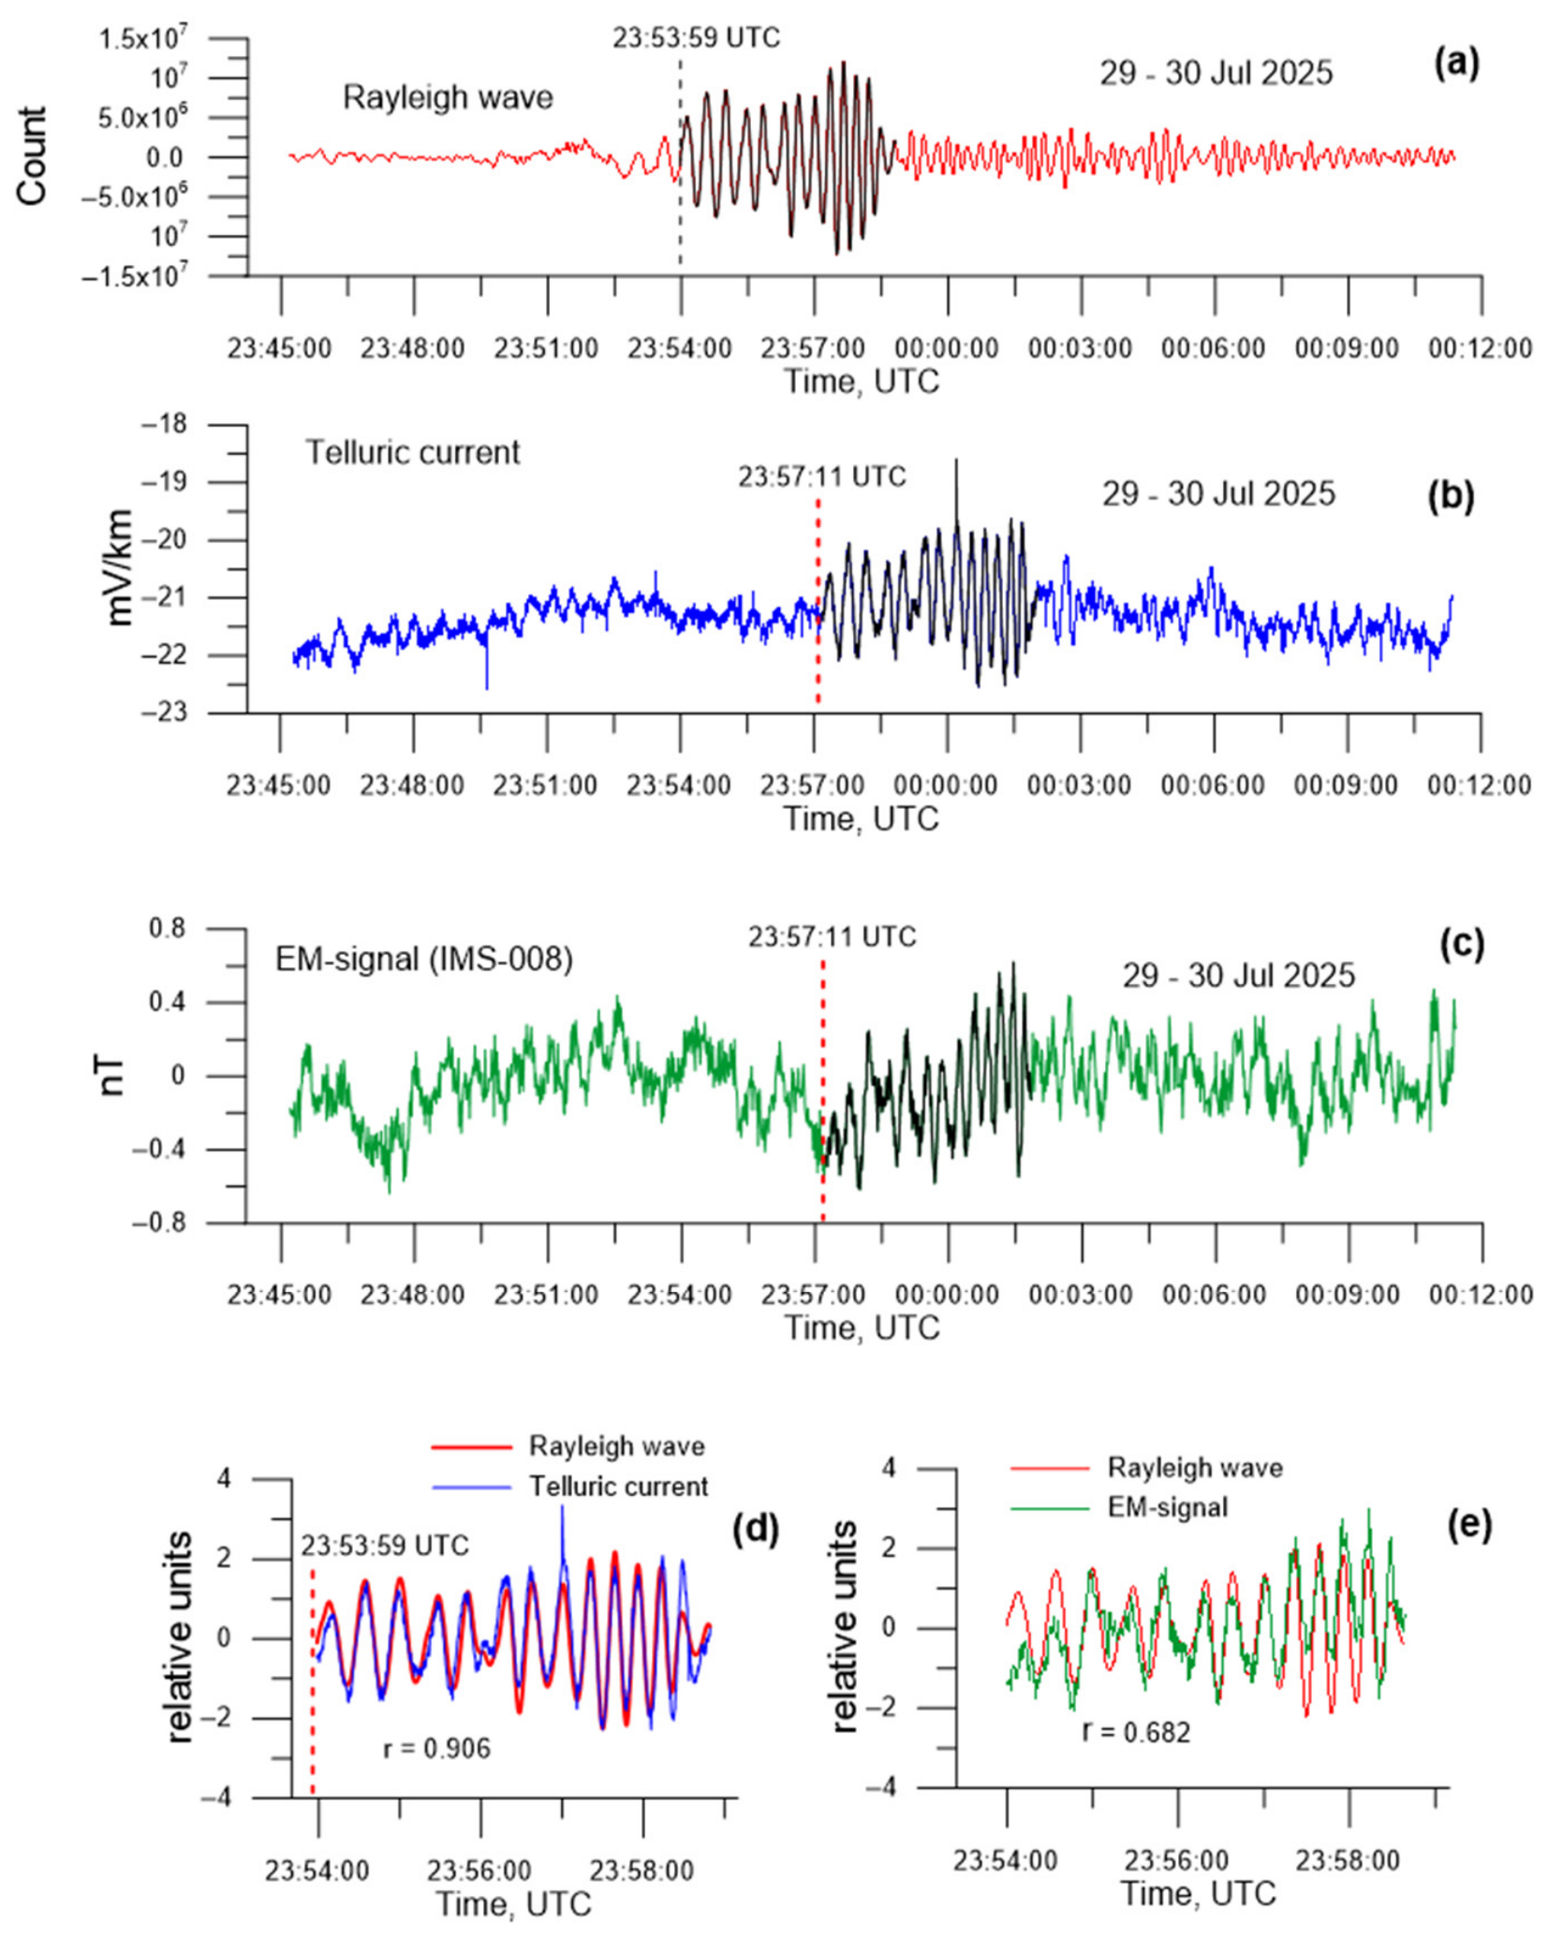
The Rayleigh wave train is clearly visible on the seismogram (Figure 6a). Approximately 3 min later, wave packets appeared in the variations in the telluric current and electromagnetic (EM) signals, exhibiting shapes and durations similar to the passing Rayleigh wave (Figure 6b,c). In this case, the peak-to-peak amplitude reached 2.626 mV/km for the telluric current and 0.873 nT for the EM signals. These results are consistent with the theoretical estimates reported in [10], where the expected amplitudes of coseismic electric fields (of electrokinetic origin) were shown to range from tens of μV/m to several V/m. According to [29,30,31], the amplitudes of oscillations caused by electrokinetic, piezoelectric, and motional induction effects are typically below ~0.2 nT. The graphs shown clearly illustrate the repeatability of the phase structure of the coseismic responses relative to the Rayleigh wave structure. Since the vertical (Z) component of the Rayleigh wave governs the elliptical particle motion and carries the main deformation energy within the near-surface layer, a pronounced response in the local telluric current variations at the observation site was expected. To confirm the results of the visual observation, a cross-correlation analysis was performed between the coseismic telluric current response and the Z-component of the Rayleigh wave. Correlation coefficients were calculated repeatedly for different time intervals. Based on the analysis, we selected the record segment with the highest correlation coefficient (r = 0.906), where the duration of both the telluric current and Rayleigh wave trains was 291 s (Figure 6d). The segments of the EM signal records showing the greatest similarity to the phase structure of the Rayleigh wave (Figure 6e) demonstrated a moderate correlation (r = 0.682). It is possible that the passage of the Rayleigh wave caused a slight mechanical displacement or micro-tilt of the sensor relative to the geomagnetic field vector. This could have generated an additional induction component in the recorded signal, thereby reducing the correlation coefficient. Nevertheless, the pronounced phase similarity between the signals is consistent with the presence of a genuine coseismic electromagnetic component.
Figure 6.
Coseismic response of the telluric current and electromagnetic ULF signals to the propagation of Rayleigh wave generated by the M8.8 earthquake: (a) seismogram of the vertical (Z) component of the Rayleigh wave; (b) telluric current; (c) electromagnetic ULF signal. The wave packets are highlighted in black. Results of the cross-correlation analysis obtained by aligning the telluric current records (d) and EM signal records (e) with the seismic wave in the zone of maximum correlation using a time shift of Δt = 191.7 s. Vertical dashed lines indicate the arrival times of the wave trains for which the maximum cross-correlation coefficient was obtained.
It is well known that the geological environment of the high-mountain region of the Northern Tien Shan, and in particular the territory of the High-Mountain Geophysical Observatory, where the telluric current recording system and the IMS-008 induction magnetic sensor are installed, is characterized by a high degree of water saturation in both near-surface and deep geological structures. In turn, electrokinetic phenomena arising from the deformation of porous rocks and changes in pore pressure induced by seismic waves are strongly dependent on local crustal parameters such as water saturation, electrical conductivity, and related properties [10,32,33]. This factor determined the efficiency of the interaction between the Rayleigh wave and the fluid-saturated medium, resulting in the transformation of elastic wave energy into the generation of seismoelectric currents. The anomalous behavior of telluric currents matching the Rayleigh waveform suggests that the observed response is most likely of electrokinetic origin, resulting from the deformation of porous water-saturated rocks under seismic wave action.
This section demonstrates that the disturbances in the telluric current and EM signal variations occurred locally and had resulted from the passage of a seismic Rayleigh wave generated by the M8.8 Kamchatka earthquake on 29 July 2025 at an epicentral distance of 5977 km.
3.1.2. The M7.8 Earthquake of 18 September 2025
On 18 September 2025, at 18:58:14 UTC, seven weeks after the July mega-earthquake, a strong seismic M7.8 event occurred off the east coast of Kamchatka (N 53.171, E 160.681). The epicenter was located 78.8 km northeast of the July 29 earthquake epicenter. According to the accepted seismological classification, this event is the strongest aftershock linked to the release of residual stresses along the flanks of the Kuril–Kamchatka Trench rupture zone.
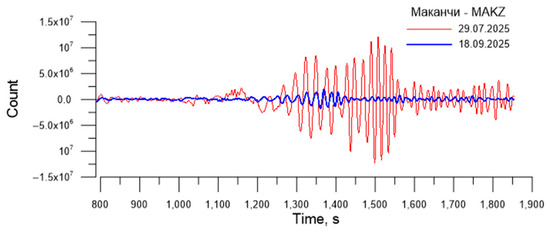
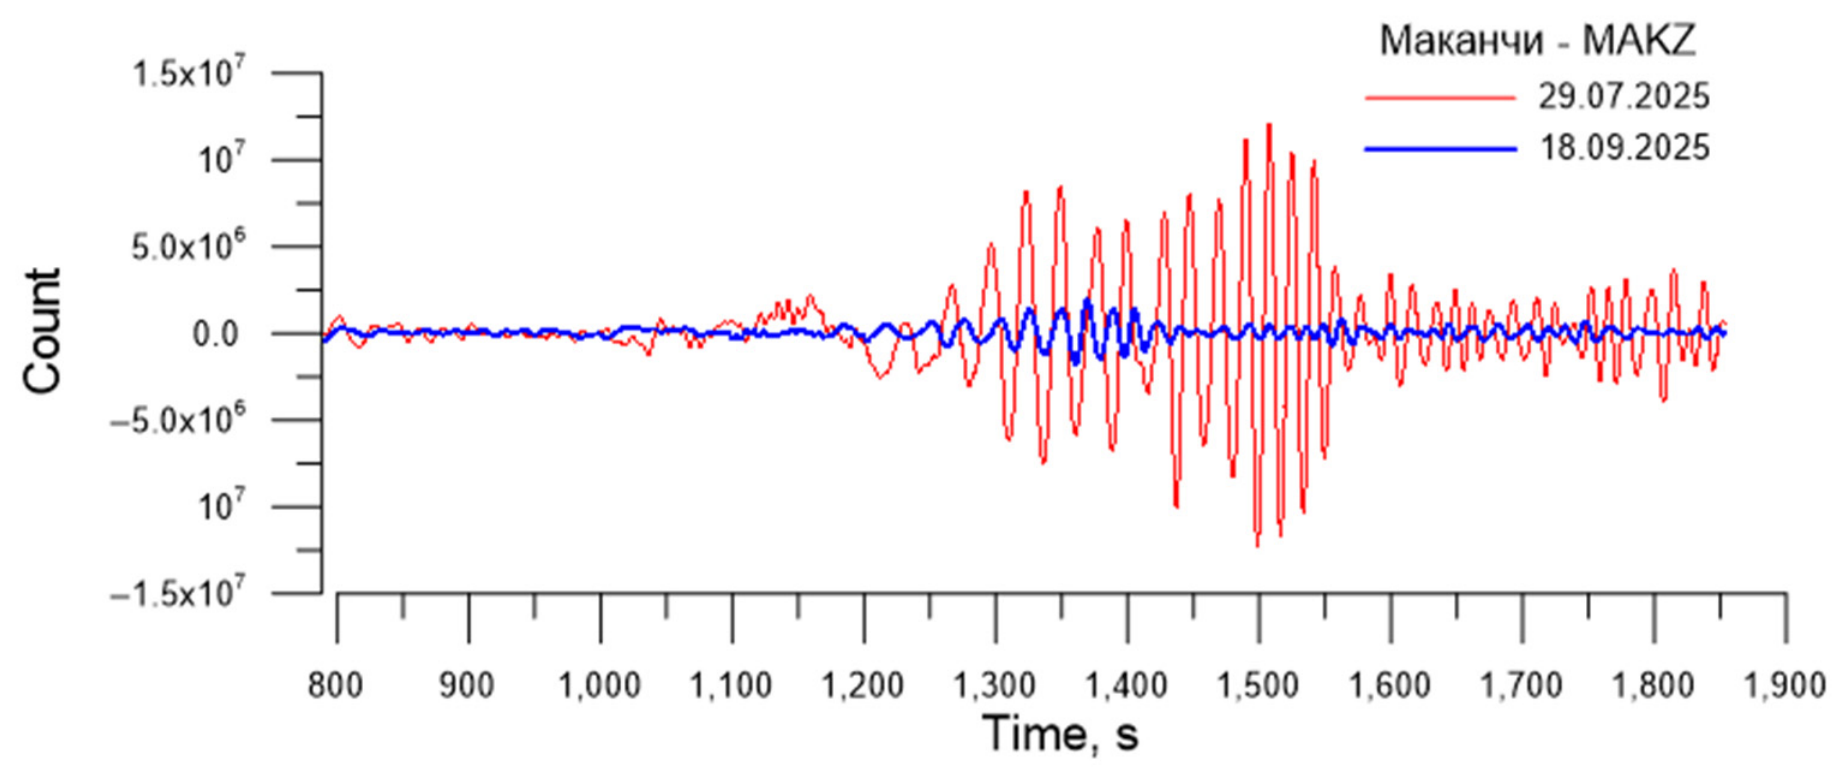
Approximately 30 min later, the passage of the Rayleigh wave was recorded at the Makanchi MAKZ seismological station. Figure 7 presents the vertical component (Z) seismogram of the Rayleigh wave for the 18 September event in comparison with the 29 July seismogram. For convenience of comparison, the dynamic characteristics of the records were aligned to a common time reference. The figure shows that the maximum amplitude of the main shock (M8.8, 29 July) was nearly an order of magnitude greater than that of the strongest aftershock that occurred on September 18.
Figure 7.
Comparison of the waveforms and amplitudes of the Rayleigh waves generated by the 29 July 2025 M8.8 earthquake and the 18 September 2025 M7.8 earthquake. The seismograms were aligned along the time axis for ease of comparison.
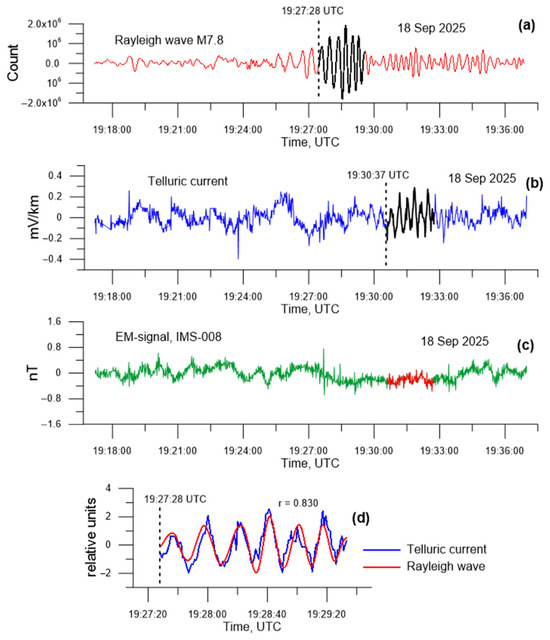
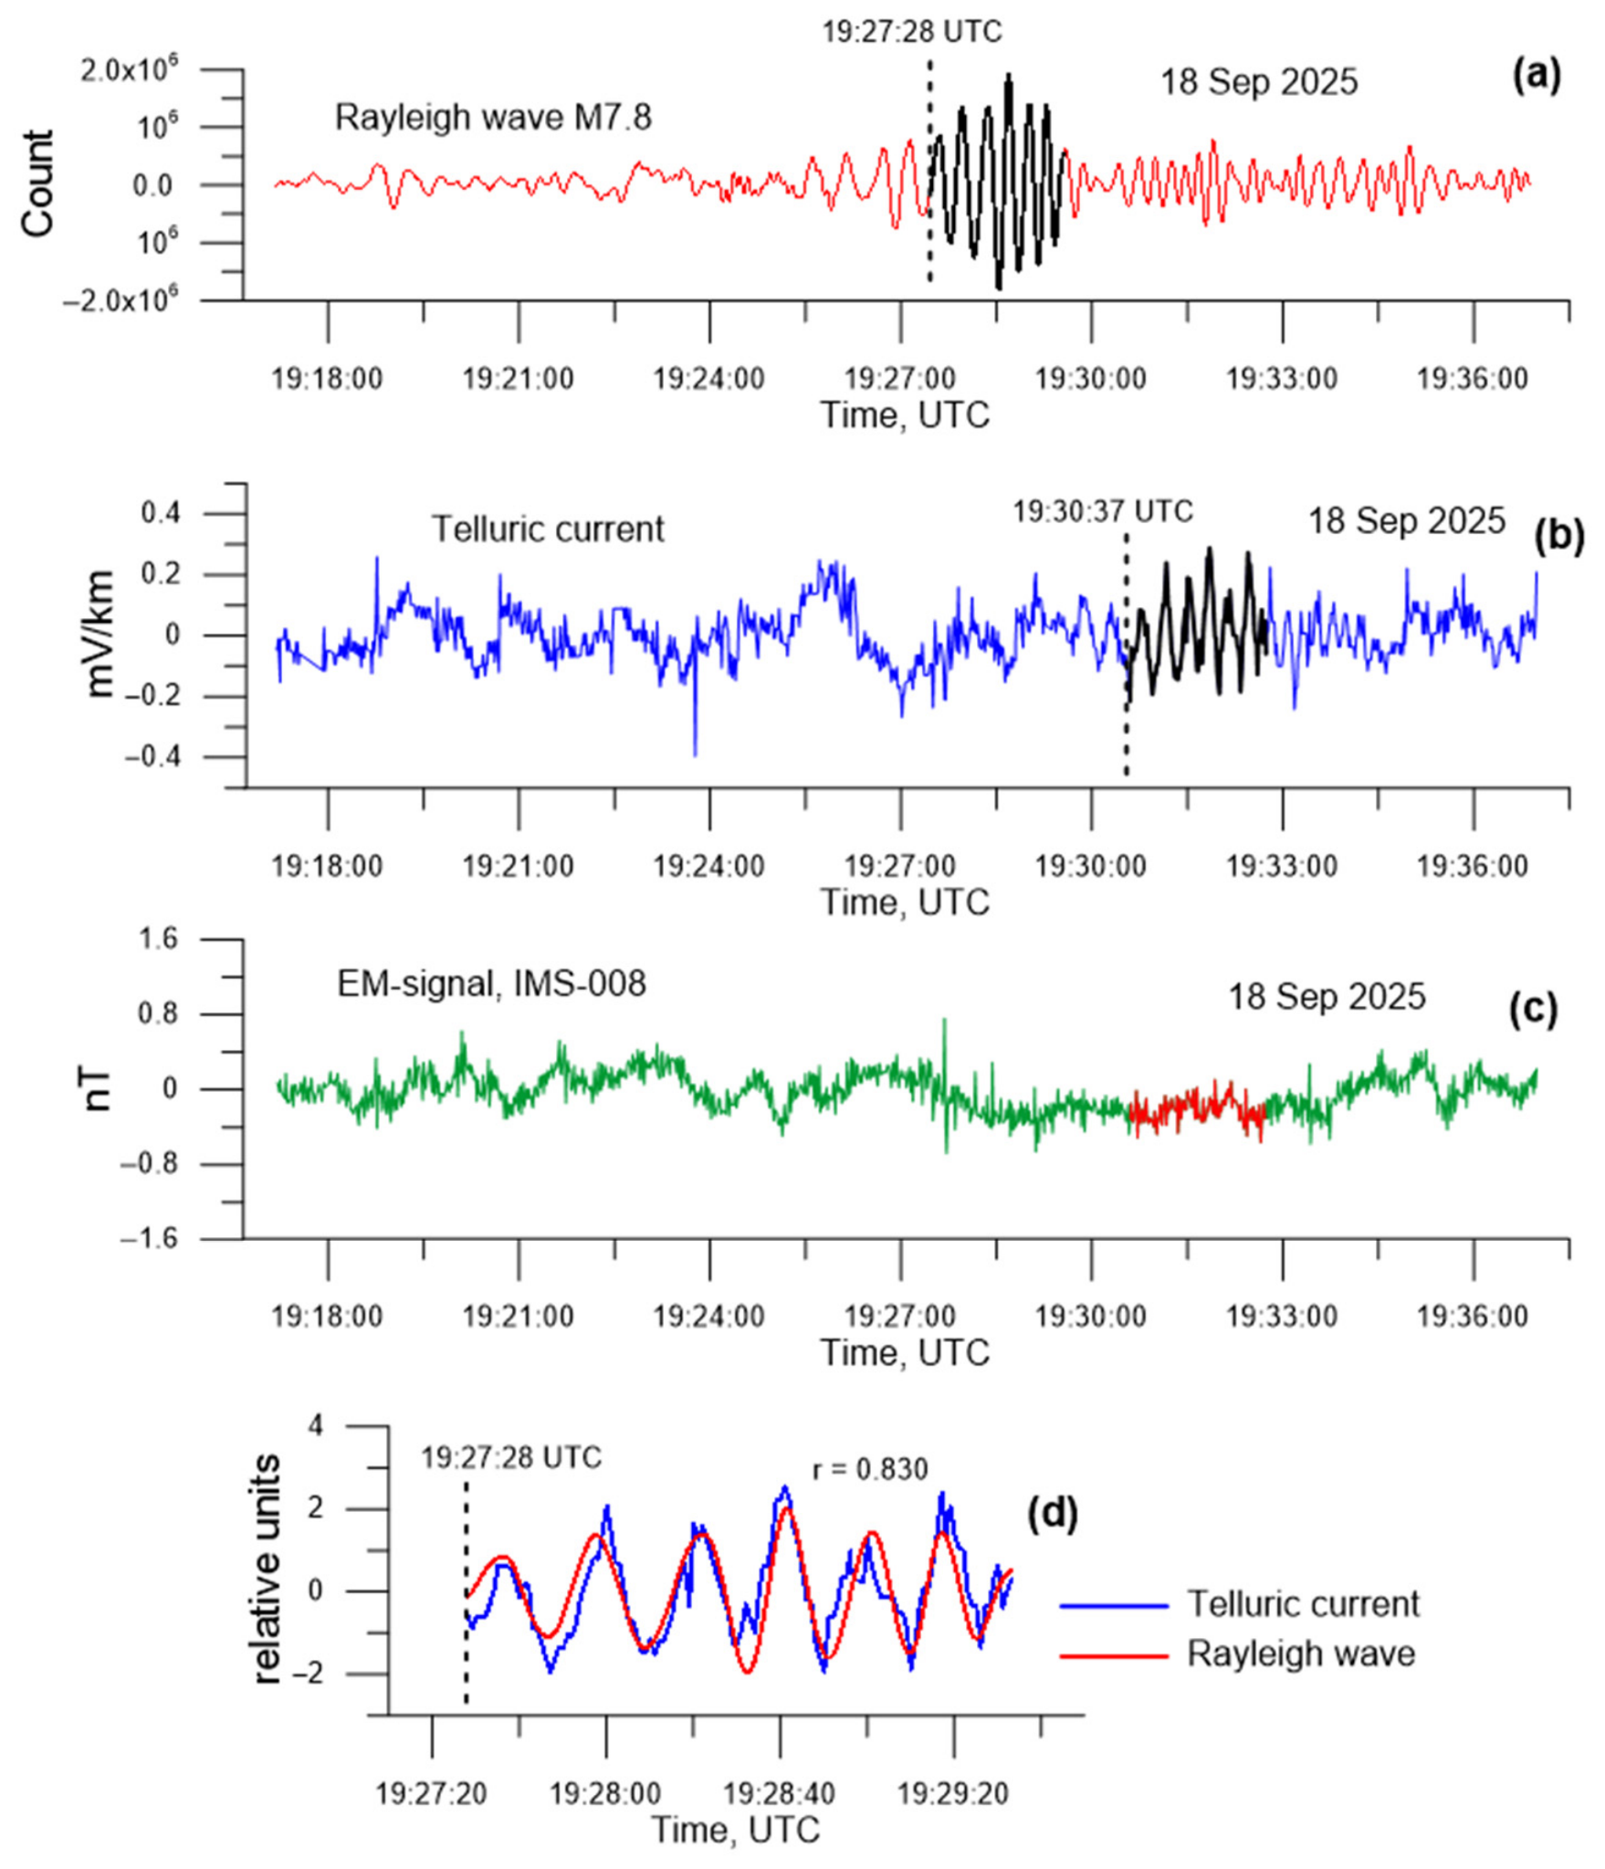
Figure 8a presents the seismogram of the Rayleigh wave, which reached the High-Mountain Geophysical Observatory 191.7 s later. As in the case of M8.8 earthquake, distinct wave packets appeared in the telluric current variations, resembling the waveform of the passing Rayleigh wave, but with significantly smaller amplitude and shorter duration (Figure 8b). The peak-to-peak amplitude of the telluric current variations reached only 0.402 mV/km. No noticeable disturbances were observed in the EM signal variations (Figure 8c). Figure 8d presents the results of the cross-correlation analysis of the telluric current oscillation train and the Rayleigh wave, showing a maximum correlation coefficient of r = 0.830 for the signals’ duration of 130 s.
Figure 8.
Coseismic response of the telluric current to the Rayleigh wave propagation generated by the M7.8 earthquake: (a) seismogram of the vertical (Z) component of the Rayleigh wave; (b) telluric current variations; (c) ULF electromagnetic (EM) signal. The wave packets are highlighted in black. (d) Result of the cross-correlation analysis obtained by aligning the telluric current record with the seismic wave in the zone of maximum correlation using a time shift of Δt = 191.7 s. Vertical dashed lines indicate the arrival times of the wave packets for which the maximum cross-correlation coefficient was obtained.
The M7.8 earthquake, similar to the M8.8 event, reveals a recurring morphology of telluric current wave trains that corresponds to the phase structure of the Rayleigh wave.
3.2. Spectral Analysis of Seismoelectric Effects During the M8.8 and M7.8 Kamchatka Earthquakes
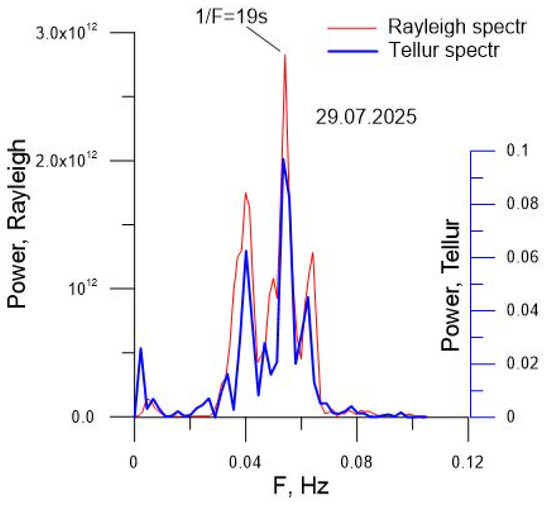
To investigate the physical nature of the telluric current response to the passage of the Rayleigh wave at teleseismic distances (approximately 6000 km), a spectral analysis method was applied. Figure 9 presents the wave train power spectra of the telluric current oscillation and the Rayleigh wave in the zone of their maximum correlation (r = 0.906). For both signals, the main portion of the energy was concentrated within the low-frequency band (0.03–0.07 Hz), corresponding to periods of 33–14 s. The spectral density exhibited a quasi-line spectral structure with dominant peaks at frequencies of 0.04 Hz, 0.054 Hz, and 0.064 Hz.
Figure 9.
A comparison of the wave train power spectra for telluric current variations (blue) and Rayleigh wave oscillations (red) generated by the M8.8 Kamchatka earthquake (29 July 2025).
The observed correlation between the spectral structure of the telluric current response and the dynamic characteristics of the passing Rayleigh wave reflects the mechanism of seismic wave energy transformation into electrokinetic processes within the Earth’s crust.
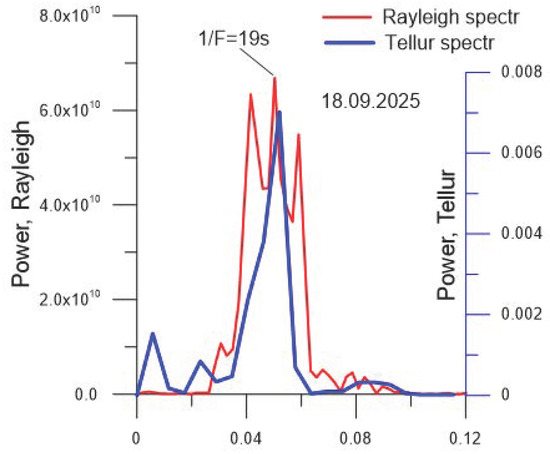
A comparison of the wave train power spectra for telluric current variations and Rayleigh wave oscillations from the M7.8 Kamchatka earthquake (18 September 2025) is performed in Figure 10 within the zone of their maximum correlation (r = 0.83). As in the case of the M8.8 earthquake, the main portion of the spectral energy is concentrated in the low-frequency (0.03–0.06 Hz) band, corresponding to oscillation periods of 33–17 s. The spectral density of the Rayleigh wave also exhibits a pronounced quasi-line spectral structure, with dominant peaks at frequencies of 0.041 Hz, 0.050 Hz, and 0.059 Hz.
Figure 10.
Comparison of wave train power spectra for telluric current variations (blue) and the Rayleigh wave (red), generated by the 18 September 2025 earthquake (M7.8).
In contrast to the Rayleigh wave spectrum, the power spectrum of the telluric current variations exhibits only a single dominant spectral peak at a frequency of 0.052 Hz (corresponding to a period of 19.23 s), which nearly coincides with the central peak of the Rayleigh wave power spectrum (Figure 10). Therefore, even with a decrease in earthquake magnitude to Mw7.8, the energy of the passing surface seismic wave remains sufficient for the effective initiation of electrokinetic processes.
Thus, the observed spectral similarity between the analyzed signals may indicate a physical link between the mechanical impact of the Rayleigh wave and its induced coseismic electrical response at epicentral distances of about 6000 km.
3.3. Determination of Rayleigh Wave Velocity from Telluric Current Response at Teleseismic Distances
When determining the average Rayleigh wave propagation velocity from the Makanchi seismograms for the 29 July and 18 September earthquakes, an ambiguity arose in picking their arrival times on the seismograms. As a result of the initial calculations, the estimated velocity varied over a wide range from 2.9 to 3.4 km/s. This variability, with a scatter of approximately 500 m/s, is due to Rayleigh wave dispersion at large epicentral distances (~5400–6000 km), which complicates accurate phase onset identification on seismograms. To minimize calculation errors in determining the Rayleigh wave velocity, we relied on the results of cross-correlation analysis (Figure 6d,e), where correlation coefficients between seismic and telluric current data were the highest (r = 0.906 for M8.8 earthquake) and (r = 0.83 for M7.8 earthquake). The onset time of the wave train corresponding to the maximum correlation coefficient was taken as the reference arrival time of the Rayleigh wave. For the M8.8 earthquake, this moment corresponded to 23:53:59 UTC on the seismogram (Figure 6a,d), while for the M7.8 earthquake it corresponded to 19:27:28 UTC (Figure 8a,d). In this context, the coseismic disturbances in the telluric current served not only as indicator of the efficiency of transformation of Rayleigh wave elastic energy into the electromagnetic response of the conducting medium, but also as phase marker for determining its arrival time on the seismograms. The initial data used for the calculations are presented in Table 2. Epicentral distances to the observation sites were determined using the Garmin MapSource software package version 6.16.3 (accessed on 15 May 2026) [34].
Table 2.
Arrival time and Rayleigh wave propagation velocity from the 29 July and 18 September 2025 Kamchatka earthquakes to the Makanchi seismological station and the High-Mountain Geophysical Observatory (HGO).
The obtained results demonstrated high reproducibility for two independent earthquakes. However, the present study cannot completely exclude the existence of a small intrinsic delay associated with electrokinetic signal generation. As shown in Table 2, the difference between the propagation velocities of the seismic waves generated by the M8.8 and M7.8 earthquakes was 15 m/s for those reaching Makanchi (3.093 − 3.078 = 0.015 km/s) and 7 m/s for those reaching the HGO (3.082 − 3.075 = 0.007 km/s). Thus, the use of telluric current wave trains as phase markers made it possible to reduce the uncertainty in determining the average Rayleigh wave velocity propagation from approximately 500 m/s to 7–15 m/s.
3.4. Linearity and Sensitivity Threshold of the Telluric Current Response to Passing Rayleigh Waves: A Case Study of Four 2025 Kamchatka Earthquakes
It was established that despite the similarity of the seismic wave propagation paths for the four Kamchatka earthquakes M ≥ 7.4 and the close similarity of the dominant Rayleigh wave periods (19–25 s), coseismic telluric current responses were detected only for the 29 July (M8.8) and 18 September (M7.8) events. At the same time, a significant electromagnetic ULF range response was recorded only in the M8.8 earthquake (see Figure 6). For the M7.4 earthquakes (20 July and 13 September), any disturbances in the telluric currents and electromagnetic signals were not observed during the Rayleigh wave propagation (Table 3). The magnitude difference between the M7.8 and M7.4 events was ΔM = 0.4, which, according to the logarithmic magnitude relationship, corresponds to an approximately fourfold decrease in released seismic energy. Apparently, for the M7.4 events, the seismic energy flux density at teleseismic distances (~6000 km) fell below the threshold pore pressure gradient required to initiate electrokinetic conversions and generate current disturbances in the rocks of the Northern Tien Shan region. Thus, a magnitude range of approximately M7.5–7.6 may be considered a critical energy threshold necessary for the activation of seismoelectric processes in this region.
Table 3.
Sensitivity threshold of the telluric current response to the Rayleigh wave passage depending on earthquake magnitude.
For the Mw 8.8 and Mw 7.8 earthquakes, an analysis was performed for the selected signal segments. These segments were chosen based on the criterion of maximum correlation between the Rayleigh waves and the telluric current variations, corresponding to the interval of the strongest seismic energy impact on the rock mass. First, using the data presented in Table 3, the ratio of the maximum peak-to-peak amplitudes of the Rayleigh waves generated by the Mw 8.8 and Mw 7.8 earthquakes was calculated (KRw = 14,370,807/3,734,980 = 6.515). Then, for the same earthquakes, the ratio of the maximum peak-to-peak amplitudes of the telluric current variations was determined (KTC = 1.616 mV/0.401 mV = 6.531). As a result, an almost complete agreement between the amplitude ratios of the seismic oscillations and the induced telluric currents was observed (KRw = 6.525 and KTC = 6.532). This indicates that, at teleseismic distances of approximately 6000 km, the variation in the telluric current exhibits a strictly proportional dependence on the intensity of the seismic wave impact.
Thus, it was established that the telluric current response to the passage of Rayleigh waves exhibits consistent amplitude scaling together with a threshold sensitivity determined by the earthquake magnitude.
4. Conclusions
During the summer–autumn period of 2025, a series of four major earthquakes with magnitudes M ≥ 7.4, including the M8.8 mega-earthquake, occurred within the same geological structure of the Kuril–Kamchatka subduction zone. The epicenters of these events were localized within a narrow geographical cluster at distances of 5949–6062 km from the High-Mountain Geophysical Observatory of the Institute of Ionosphere (Northern Tien Shan). At such large distances (~6000 km), the maximum separation between the epicenters of only 81 km resulted in an azimuthal divergence of less than 1°. These conditions predetermined the near-identical propagation paths of Rayleigh waves to the observation sites, where continuous monitoring of telluric current variations and electromagnetic signals is conducted in the frequency ranges of 0–20 Hz and 0.001–20 Hz, respectively. This made it possible to perform a reliable comparative analysis of the electromagnetic response of the medium as a function of earthquake magnitude. We emphasize that the observed variations in telluric currents and electromagnetic signals were generated locally during the passage of the Rayleigh waves through the observation site as a result of mechanical deformation of the medium. They do not represent electromagnetic emissions propagating directly from the earthquake source.
This enabled a correct comparative analysis of the electromagnetic response of the medium as a function of the seismic event magnitude.
The main results of the present investigation can be summarized as follows:
- We investigated the coseismic responses of telluric currents (DC–20 Hz) and electromagnetic signals (0.0001–20 Hz) induced by the propagation of Rayleigh waves from the M8.8 mega-earthquake (29 July 2025) and the major M7.8 earthquake (18 September 2025). A high reproducibility of the phase structure of the Rayleigh wave in the telluric current variations was established. The seismoelectric response was most intense during the passage of the maximum energy portion of the Rayleigh wave. The maximum cross-correlation coefficients between the Z-component of the seismogram and the telluric current were r = 0.906 for the M8.8 event and r = 0.83 for the M7.8 event. Such high values suggest that the electrokinetic effect (seismoelectric effect of the second kind) is the dominant mechanism responsible for the telluric current generation during Rayleigh wave propagation in the Northern Tien Shan region. At the same time, variations in the ULF electromagnetic signals recorded by the IMS-008 induction sensor demonstrated only a moderate correlation (r = 0.682) with the phase structure of the Rayleigh wave. The weaker correlation may be attributed to microtilting (mechanical shaking) of the induction sensor during the passage of the Rayleigh wave; however, this does not exclude the presence of a genuine coseismic signal.
- Comparative spectral analysis revealed an almost complete similarity between the spectral composition of the passing Rayleigh wave and the coseismic telluric current variations generated by the M8.8 and M7.8 earthquakes. It was established that, within the zone of maximum correlation, the maxima of the spectral power density of both signals were concentrated in the low-frequency range of 0.04–0.07 Hz, corresponding to the dominant Rayleigh wave periods of 20–15 s. The power spectra exhibited a pronounced quasi-line spectral structure with dominant peaks at frequencies of 0.04 Hz, 0.054 Hz, and 0.064 Hz. The high degree of similarity between the spectral characteristics of the telluric current response and the Rayleigh wave indicates a direct transformation of the energy of elastic seismic oscillations into an electric current. This finding provides strong evidence in favor of the electrokinetic nature of the observed effect.
- Refinement of the Rayleigh wave propagation velocity was performed using cross-correlation analysis of seismic and telluric signals. Determining the arrival times of surface waves at teleseismic distances (5400–6000 km) is associated with substantial uncertainty. This is caused by dispersion effects, as a result of which the energy of the initial impulse is redistributed within the wave packet. Consequently, the onset of the wave train, represented by low-frequency components of small amplitude, is often masked by background noise (Figure 6a and Figure 8a). The application of cross-correlation analysis of seismic and telluric current data made it possible to determine the arrival time of the seismic wave with greater accuracy and then calculate the average Rayleigh wave propagation velocity over distances of approximately 6000 km. Within this approach, the telluric current response acts as a physical marker of seismic wave energy transfer, eliminating subjective uncertainty in determining the regional Rayleigh wave velocity. The obtained average velocities for the M8.8 and M7.8 events, characterized by high correlation coefficients (r = 0.906 and r = 0.83), were very similar: 3.093 km/s and 3.078 km/s, respectively. While conventional analysis of the seismograms resulted in uncertainty in velocity determination within the range of 2.9–3.4 km/s (a spread of about 500 m/s), the use of cross-correlation analysis between seismic and telluric signals reduced this uncertainty to 7–15 m/s, with the calculation error decreasing to approximately 0.5%. Thus, the proposed approach based on cross-correlation analysis of seismic and telluric signals made it possible to refine the true group velocity of Rayleigh waves generated by Kamchatka earthquakes for a specific regional profile at teleseismic distances of approximately 6000 km.
- Using a series of four major Kamchatka earthquakes (M7.4–M8.8), the characteristics of seismoelectric effect generation in water-saturated rocks of the Northern Tien Shan region during the passage of Rayleigh waves under small-deformation conditions were established. For the first time under field conditions at an epicentral distance of about 6000 km, a threshold nature of telluric current generation was discovered: the response was clearly recorded during the M7.8 and M8.8 events, but was completely absent during the two M7.4 earthquakes. The revealed threshold (between M7.4 and M7.8) reflects the minimum level of medium deformation required for activation of the electrokinetic mechanism in the vicinity of the observation site. The identity of the ratios of the double amplitudes of the seismic and telluric signals for events of M7.8 and M8.8 (K ≈ 6.53) indicate the linearity of the conversion process once this energy threshold is exceeded. Thus, based on a series of major Kamchatka earthquakes (M ≥ 7.4), two characteristics of seismoelectric effect generation under small-deformation conditions in the Northern Tien Shan region were identified: the threshold sensitivity, and a linear dependence of the telluric current response on the passage of Rayleigh waves once the threshold value is exceeded.
Author Contributions
Conceptualization, N.S.; methodology, N.S.; software, N.S., D.K. and A.S.; formal analysis, N.S., A.S. and G.P.; data curation, N.S., D.K., A.S. and S.N.; writing—original draft preparation, N.S., G.P. and D.K.; writing—review and editing, N.S., G.P. and S.N.; project administration, S.N., V.R. and V.Z.; funding acquisition, N.S. and S.N. All authors have read and agreed to the published version of the manuscript.
Funding
This research was funded by the Science Committee of the Ministry of Science and Higher Education of the Republic of Kazakhstan, grant number BR24992865, “Development of a multifunctional system of ground-space monitoring and early warning of natural and technogenic emergencies”.
Data Availability Statement
The data presented in this study are available on request from the corresponding author.
Conflicts of Interest
The authors declare no conflicts of interest.
References
- Abdrakhmatov, K.E.; Beloslyudtsev, O.M.; Vilyaev, A.V.; Danabaeva, A.T.; Ibragimova, T.L.; Ibragimov, R.S.; Ismailov, V.A.; Zhunusova, A.Z.; Kalmetyeva, Z.A.; Kuzikov, S.I.; et al. Tectonophysical zoning of the Tien Shan active faults—deterministic strong earthquake prediction. Geodyn. Tectonophys. 2025, 16, 0822. (In Russian) [Google Scholar] [CrossRef] [Scilit]
- Nurmagambetov, A. The Seismic History of Almaty; LEM: Almaty, Kazakhstan, 2015; 69p, UDC 550.348. (In Russian) [Google Scholar]
- Salikhov, N.; Shepetov, A.; Pak, G.; Nurakynov, S.; Ryabov, V.; Zhukov, V. Seismogenic Effects in Variation of the ULF/VLF Emission in a Complex Study of the Lithosphere–Ionosphere Coupling Before an M6.1 Earthquake in the Region of Northern Tien Shan. Geosciences 2025, 15, 203. [Google Scholar] [CrossRef] [Scilit]
- Salikhov, N.; Shepetov, A.; Pak, G.; Saveliev, V.; Nurakynov, S.; Ryabov, V.; Zhukov, V. A PLL-Based Doppler Method Using an SDR-Receiver for Investigation of Seismogenic and Man-Made Disturbances in the Ionosphere. Geosciences 2024, 14, 192. [Google Scholar] [CrossRef] [Scilit]
- Salikhov, N.; Shepetov, A.; Pak, G.; Nurakynov, S.; Ryabov, V.; Zhukov, V. Disturbances in the Doppler frequency shift of ionospheric signal and in telluric current caused by the atmospheric waves from an explosive eruption of Hunga Tonga volcano on January 15, 2022. Atmosphere 2023, 14, 245. [Google Scholar] [CrossRef] [Scilit]
- Thompson, R.R. The seismic-electric effect. Geophysics 1936, 1, 48–51. [Google Scholar] [CrossRef] [Scilit]
- Ivanov, A. Effect of electrization of earth layers by elastic waves passing through them. Dokl. Akad. Nauk. SSSR 1939, 4, 42–45. (In Russian) [Google Scholar]
- Ivanov, A.G. Seismoelectric effect of the second kind. Bull. Acad. Sci. USSR Ser. Geogr. Geophys. 1940, 5, 600–727. (In Russian) [Google Scholar]
- Frenkel, Y.I. On the Theory of Seismic and Seismic-Electrical Phenomena in Wet Soil. Proc. Acad. Sci. USSR. Ser. Geogr. Geophys. 1944, VIII, 134–157. (In Russian) [Google Scholar] [CrossRef] [Scilit]
- Biot, M. General solutions of the equations of elasticity and consolidation for a porous material. J. Appl. Mech. 1956, 23, 91–96. [Google Scholar] [CrossRef] [Scilit]
- Varotsos, P.; Alexopoulos, K. Physical Properties of the variations of the electric field of the earth preceding earthquakes. Tectonophysics 1984, 110, 73–98. [Google Scholar] [CrossRef] [Scilit]
- Sarlis, N.V.; Varotsos, P.A.; Skordas, E.S.; Uyeda, S.; Zlotnicki, J.; Nagao, T.; Rybin, A.; Lazaridou-Varotsos, M.S.; Papadopoulou, K.A. Seismic electric signals in seismic prone areas. Earthq. Sci. 2018, 31, 44–51. [Google Scholar] [CrossRef] [Scilit]
- Sarlis, N.V.; Skordas, E.S.; Varotsos, P.A. Recent Advances on the VAN Method. Appl. Sci. 2025, 15, 10516. [Google Scholar] [CrossRef] [Scilit]
- Skordas, E.; Kapiris, P.; Bogris, N.; Varotsos, P. Field experimentation on the detectability of co-seismic electric signals. Proc. Jpn. Acad. Ser. B 2000, 76, 51–56. [Google Scholar] [CrossRef] [Scilit]
- Mogi, T.; Tanaka, Y.; Widarto, D.S.; Arsadi, E.M.; Puspito, N.T.; Nagao, T.; Kanda, W.; Uyeda, S. Geoelectric Potential Difference Monitoring in Southern Sumatra, Indonesia Co-Seismic Change. Earth Planets Space 2000, 52, 245–252. [Google Scholar] [CrossRef] [Scilit]
- Nagao, T.; Orihara, Y.; Yamaguchi, T.; Takahashi, I.; Hattori, K.; Noda, Y.; Sayanagi, K.; Uyeda, S. Co-seismic geoelectric potential changes observed in Japan. Geophys. Res. Lett. 2000, 27, 1535–1538. [Google Scholar] [CrossRef] [Scilit]
- Widarto, D.S.; Mogi, T.; Tanaka, Y.; Nagao, T.; Hattori, K.; Uyeda, S. Co-seismic geoelectrical potential changes associated with the June 4, 2000’s earthquake (Mw7.9) in Bengkulu, Indonesia. Phys. Chem. Earth Parts A/B/C 2009, 34, 373–379. [Google Scholar] [CrossRef] [Scilit]
- Stovbun, N.S.; Bogomolov, L.M. Measurements of the vertical electrotelluric field strength in fault zones of the southern part of Sakhalin. Vestn. KRAUNC. Fiz.-Mat. Nauk. 2025, 53, 105–117. [Google Scholar] [CrossRef] [Scilit]
- Gokhberg, M.B.; Kolosnitsyn, N.I.; Pliss, A.O.; Alekseev, D.A. Seismoelectric effect associated with the propagation of a Rayleigh wave. Fiz. Zemli 2022, 58, 128–135. (In Russian) [Google Scholar] [CrossRef] [Scilit]
- Salikhov, N.M.; Pak, G.D.; Shepetov, A.L.; Zhukhov, V.V.; Seifullina, B.B. Hardware-software complex for the telluric current investigation in a seismically hazardous region of Zailiysky Alatau. News Natl. Acad. Sci. Repub. Kazakhstan. Ser. Geol. Technol. Sci. 2021, 449, 94–102. [Google Scholar] [CrossRef] [Scilit]
- Polyakov, S.V.; Reznikov, B.I.; Shchennikov, A.V.; Kopytenko, E.A.; Samsonov, B.V. A range of induction magnetic field sensors for geophysical research. Seism. Instrum. 2016, 53, 1–18. [Google Scholar] [CrossRef] [Scilit]
- Kurmanov, D.N. IMS-008 induction magnetometer in complex studies of geomagnetic storms with sudden onset. Bull. Almaty Univ. Power Eng. Telecommun. 2025, 68, 244–255. [Google Scholar]
- “Alma-Ata” Geomagnetic Observatory. Available online: http://geomag.ionos.kz (accessed on 15 May 2026).
- Altaibek, A.; Zhumabayev, B.; Sarsembayeva, A.; Nurtas, M.; Zakir, D. Enhancing geomagnetic disturbance predictions with neural networks: A case study on K-index classification. Atmosphere 2025, 16, 267. [Google Scholar] [CrossRef] [Scilit]
- SAGE—Seismological Facility for the Advancement of Geoscience. 20 July 2025, Mw 7.4. Available online: https://ds.iris.edu/wilber3/find_stations/11995619 (accessed on 15 May 2026).
- SAGE—Seismological Facility for the Advancement of Geoscience. 29 July 2025, Mw 8.8. Available online: https://ds.iris.edu/wilber3/find_stations/11999904 (accessed on 15 May 2026).
- SAGE—Seismological Facility for the Advancement of Geoscience. 13 September 2025, Mw 7.4. Available online: https://ds.iris.edu/wilber3/find_stations/12018829 (accessed on 15 May 2026).
- SAGE—Seismological Facility for the Advancement of Geoscience. 18 September 2025, Mw 7.8. Available online: https://ds.iris.edu/wilber3/find_stations/12020928 (accessed on 15 May 2026).
- Gao, Y.; Harris, J.M.; Wen, J.; Huang, Y.; Twardzik, C.; Chen, X.; Hu, H. Modeling of the coseismic electromagnetic fields observed during the 2004 Mw 6.0 Parkfield earthquake. Geophys. Res. Lett. 2016, 43, 620–627. [Google Scholar] [CrossRef] [Scilit]
- Gao, Y.; Zhao, G.; Chong, J.; Klemperer, S.L.; Han, B.; Jiang, F.; Wen, J.; Chen, X.; Zhan, Y.; Tang, J.; et al. Coseismic electric and magnetic signals observed during 2017 Jiuzhaigou Mw 6.5 earthquake and explained by electrokinetics and magnetometer rotation. Geophys. J. Int. 2020, 223, 1130–1143. [Google Scholar] [CrossRef] [Scilit]
- Chen, H.; Han, P.; Hattori, K. Recent Advances and Challenges in the Seismo-Electromagnetic Study: A Brief Review. Remote Sens. 2022, 14, 5893. [Google Scholar] [CrossRef] [Scilit]
- Surkov, V.V.; Pilipenko, V.A.; Sinha, A.K. Possible mechanisms of co-seismic electromagnetic effect. Acta Geod. Geophys. 2018, 53, 157–170. [Google Scholar] [CrossRef] [Scilit]
- Surkov, V.V. An Overview of Theoretical Studies of Non-Seismic Phenomena Accompanying Earthquakes. Surv. Geophys. 2025, 46, 7–70. [Google Scholar] [CrossRef] [Scilit]
- Garmin MapSource. Available online: https://mapsource.en.softonic.com/download (accessed on 15 May 2026).

Disclaimer/Publisher’s Note: The statements, opinions and data contained in all publications are solely those of the individual author(s) and contributor(s) and not of MDPI and/or the editor(s). MDPI and/or the editor(s) disclaim responsibility for any injury to people or property resulting from any ideas, methods, instructions or products referred to in the content. |
© 2026 by the authors. Licensee MDPI, Basel, Switzerland. This article is an open access article distributed under the terms and conditions of the Creative Commons Attribution (CC BY) license.