


Abstract
The Mao open-pit coal mine waste dump in Hequ, Shanxi, is a loose, anthropogenic mass accumulated over the original topography. Following a recent sliding and significant settlement event, this dump became the subject of intense stability concerns. Due to the high moisture sensitivity of its interlayered soil and coal gangue structure, rainfall infiltration can reduce internal effective stress, triggering slope instability. Although conventional geological surveys have mapped surface fractures, implementing precise, targeted drainage control requires characterizing the internal geometric structure and preferred seepage directions. To address this, this study integrates electrical resistivity tomography (ERT), surface nuclear magnetic resonance (SNMR), and spontaneous potential (SP) methods. Multiple ERT profiles (270–600 m long) were deployed across several benches at varying elevations, supplemented by fixed-point SNMR sounding over typical low-resistivity anomalies and dense SP grid scanning. The integrated results successfully delineate the internal architecture and seepage characteristics of the dump. Specifically, ERT imaging resolves the primary geoelectrical interface (tentatively inferred as the potential sliding surface) separating the overlying loose mass from the stable underlying strata while mapping the spatial extent of the inferred water accumulation zone (IWAZ). SNMR sounding quantitatively reveals a two-layer water-bearing structure at the specific sounding site, with a deep primary water-bearing zone at 45–80 m depth. Furthermore, SP inversions illuminate the seepage process, demonstrating that meteoric water deflects along the geoelectrical interface to converge laterally toward the central axis at approximately 42°, before transitioning into a high-angle vertical deep infiltration zone (61.7°) within the axial region. These findings suggest a potential engineering direction for remediating surficial fractures and designing subsurface drainage along this 1040 m bench axis, which would mitigate future landslide risks by reducing internal pore water pressure.
1. Introduction
Rainfall infiltration-induced erosion and moisture migration within loose media are critical triggers for slope instability in open-pit mine waste dumps [1,2,3,4]. Continuous infiltration propagates surface fractures and softens the anthropogenic mass upon wetting. Concurrently, it elevates internal pore water pressure and drastically reduces effective stress, substantially increasing the risk of sudden geological hazards such as landslides and severe settlement. Hence, refined characterization of the internal structure and associated groundwater occurrence within the dump is a prerequisite for precise drainage control and hazard mitigation. While traditional core drilling is inherently limited by data sparsity and point-scale observations, non-invasive geophysical techniques offer large-scale, continuous spatial mapping. Consequently, they exhibit pronounced advantages in high-resolution structural delineation and hydrogeological assessment [5,6,7,8].
In addressing complex engineering geological and hydrogeological problems, integrated multi-geophysical surveys are the primary paradigm for mitigating the inherent non-uniqueness of single-method interpretations [9,10]. In hydrogeological surveys of settings such as slopes and karst areas, electrical resistivity tomography (ERT), surface nuclear magnetic resonance (SNMR), and spontaneous potential (SP) combine to offer three non-invasive geophysical approaches, each with its unique and highly complementary advantages [5,11,12]. Based on subsurface geoelectrical contrasts, ERT efficiently reconstructs the continuous electrical structure within a slope, making it widely adopted for structural zoning and landslide prediction [13,14,15]. As a direct groundwater-sensing tool, SNMR eliminates the interference of bound water in micropores, enabling the quantitative inversion of key hydrogeological parameters [16,17,18,19], including free water content and hydraulic conductivity. In addition, the passive-source SP method is exceptionally sensitive to fluid potential variations induced by groundwater flow, serving as a powerful means to delineate subsurface flow dynamics [20,21,22]. Traditionally, researchers have combined ERT and SP to qualitatively evaluate groundwater activity in slopes [23,24]. However, interpreting the hydrogeological significance of electrical resistivity introduces inherent physical ambiguity [25,26]. Independent ERT interpretation struggles to distinguish whether low-resistivity anomalies stem from high water saturation, elevated clay content, or lithological variations. Conversely, the direct hydrogen nucleus response of SNMR effectively breaks through this geoelectrical bottleneck, enabling a quantitative interpretation of water-bearing zones. While these individual methods are meritorious and their integrated application has been applied to some extent in slope investigations, conventional studies often rely on the qualitative overlay of datasets, which struggles to effectively overcome interpretational non-uniqueness in the absence of borehole verification.
Prompted by the sliding and significant settlement at the Mao open-pit coal mine waste dump, this study implements a comprehensive hydro-geophysical investigation integrating ERT, SNMR, and SP methods to characterize the groundwater conditions and internal structure of the failure zone. For the survey configuration, multiple ERT profiles were deployed to delineate stratigraphic boundaries beneath the benches. These structurally extracted boundaries were subsequently incorporated as prior constraints to guide the SNMR QT inversion within typical low-resistivity anomalies, achieving a refined, localized quantitative estimation. Simultaneously, dense SP grid scanning was conducted across the core benches; by incorporating a physics-informed neural network (PINN) framework into the SP inversion, multiple anomaly sources were effectively separated to capture preferred seepage directions. The primary objective is to synergistically cross-validate these three techniques in a complex environment lacking borehole verification. This approach allows us to identify the potential shallow sliding surface of the dump, quantitatively estimate hydrogeological characteristics, and elucidate preferred seepage directions following rainfall infiltration.
2. Materials and Methods
2.1. Geology Setting
Globally, large-scale and high-intensity mineral resource extraction severely disrupts subterranean rock structures, triggering a widespread suite of typical geological hazards—including surface subsidence, ground fissures, landslides, collapses, and sinkholes—that pose a universal threat to human safety and regional ecosystems [27,28].
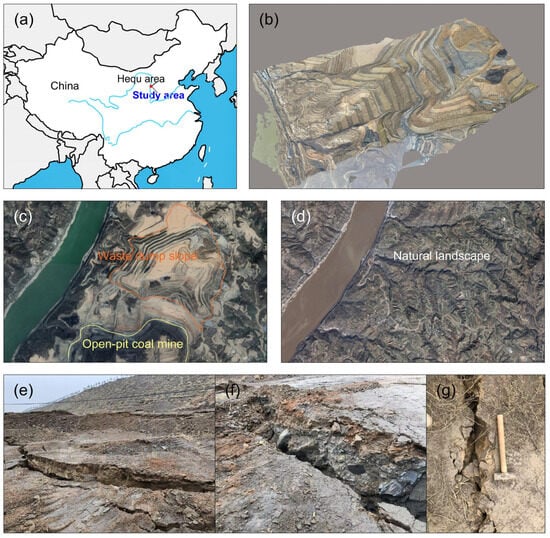
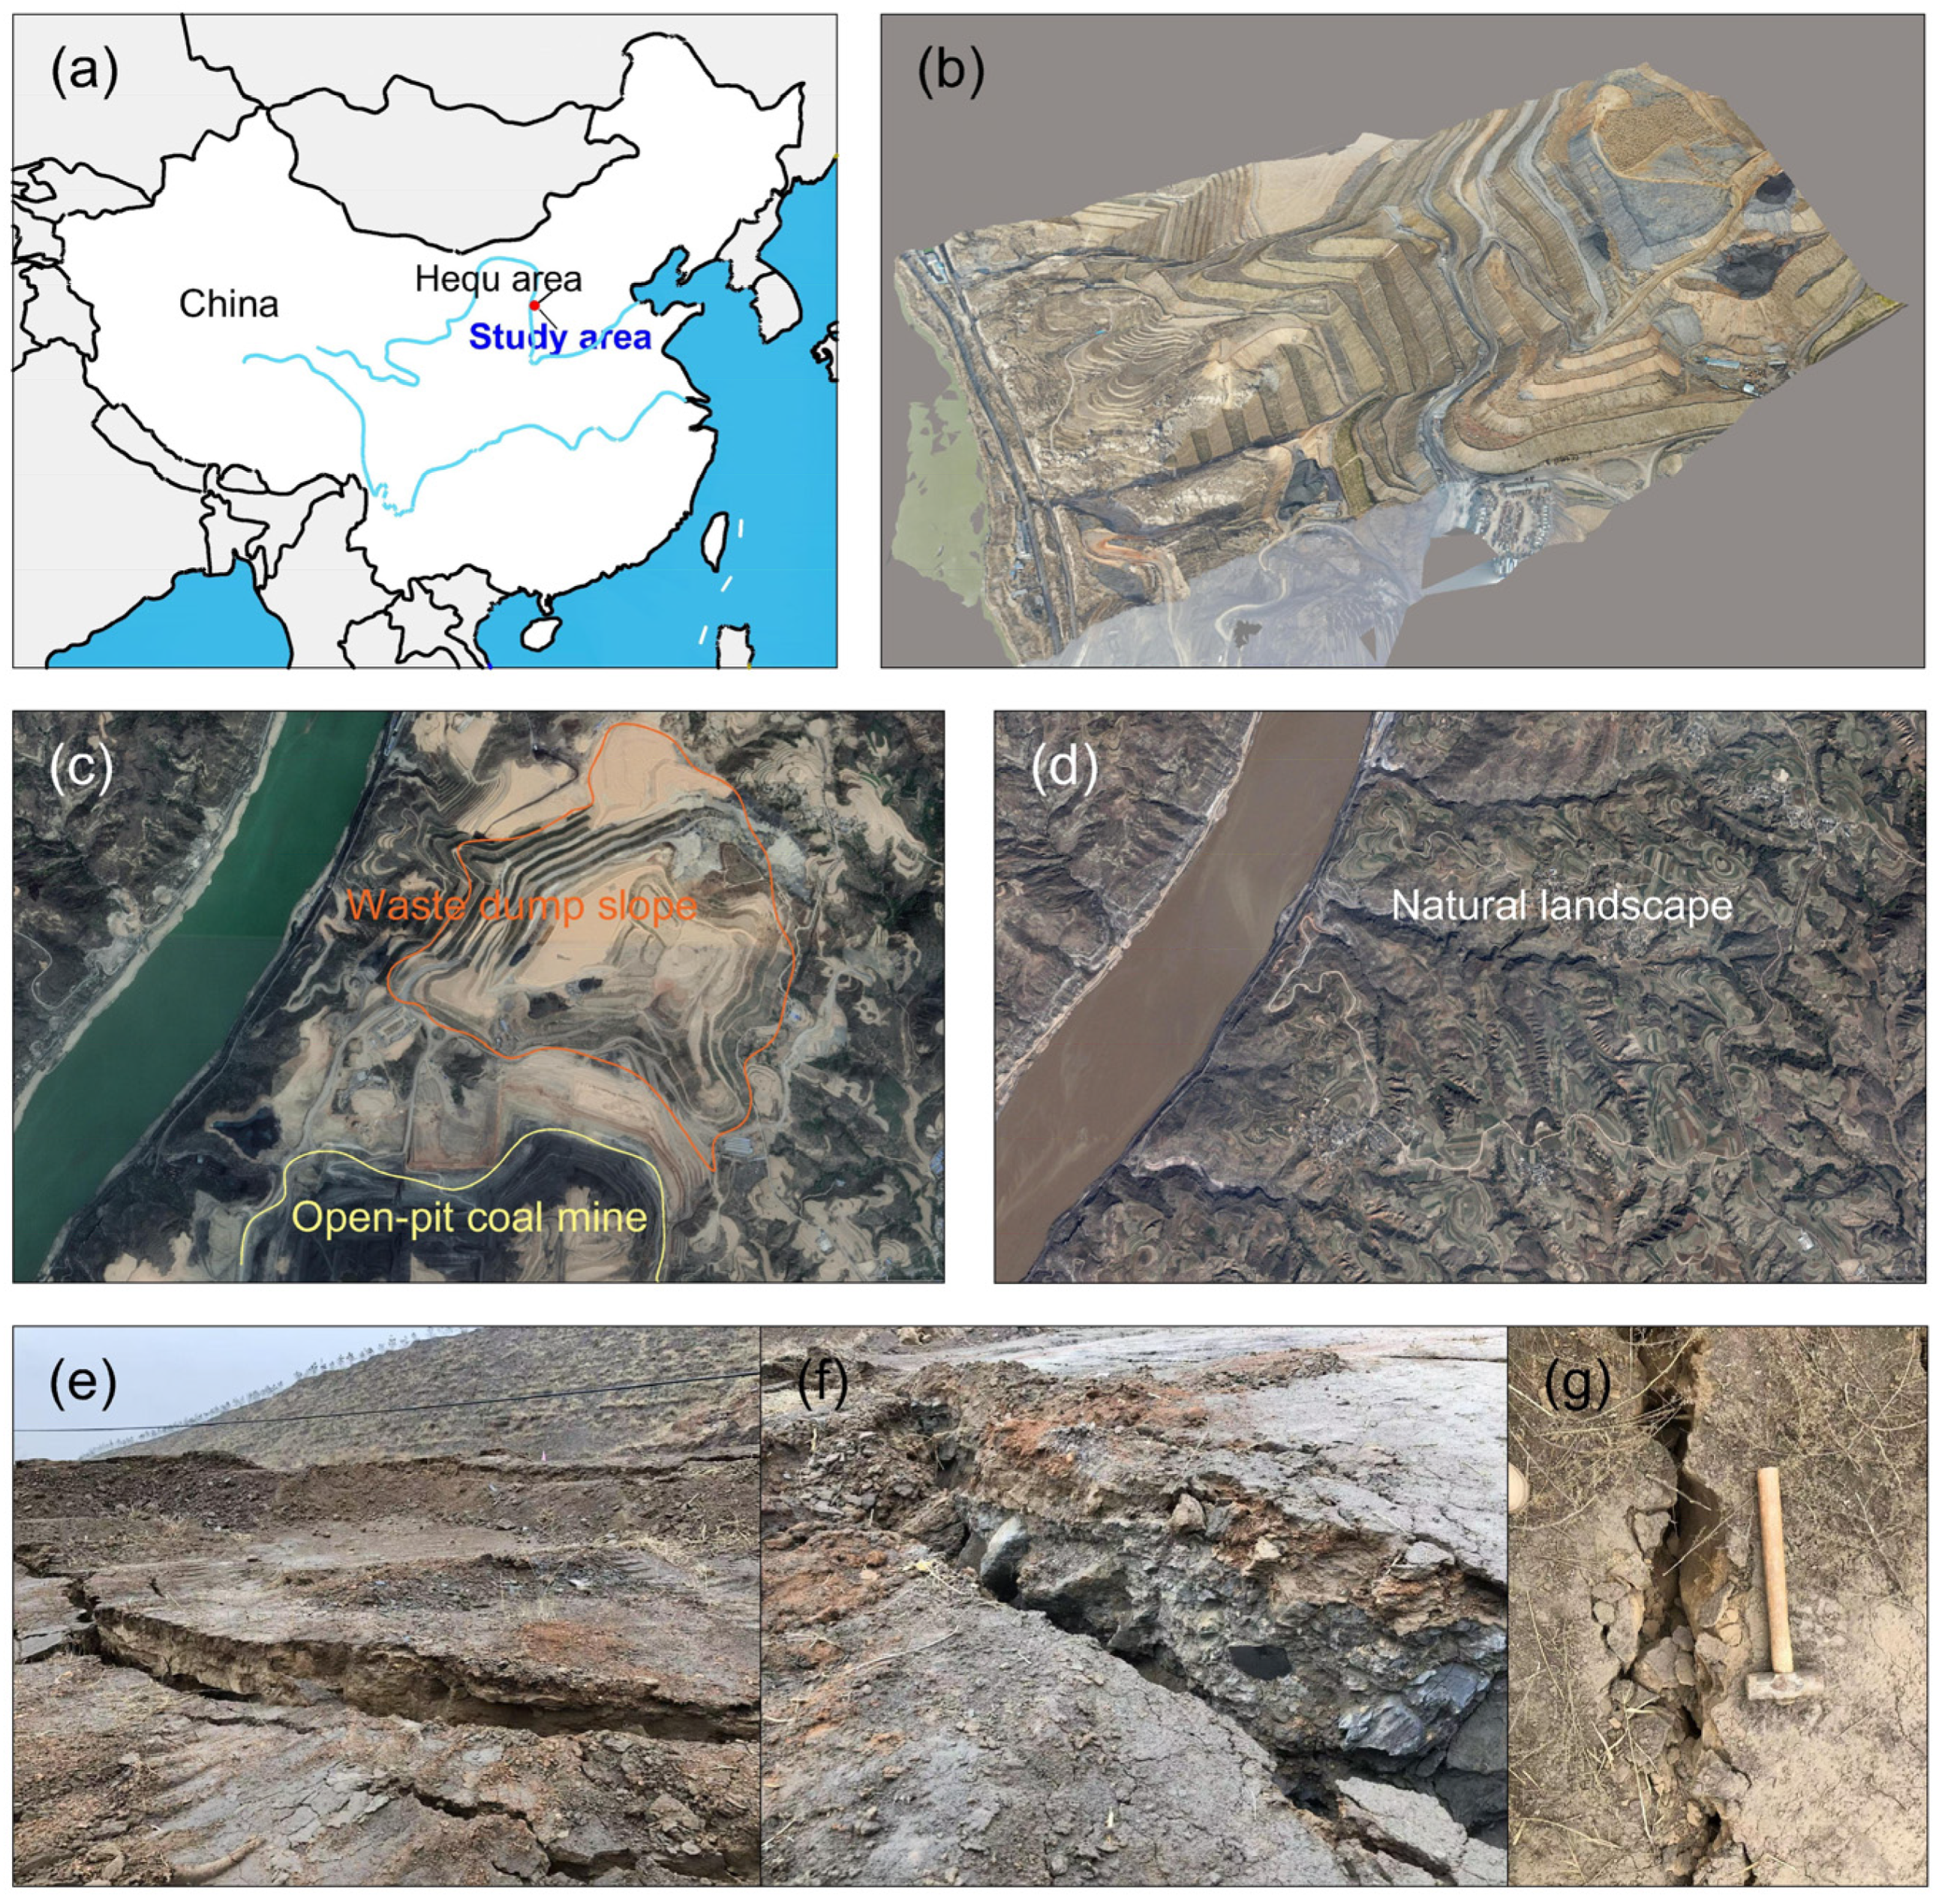
As a typical representative of such engineering contexts, the Mao open-pit coal mine is situated on the east bank of the Yellow River, approximately 32 km southeast of Hequ County, Shanxi Province, China (Figure 1a). Located at the northwestern margin of the Loess Plateau, the study area features complex topography characterized by deeply incised, crisscrossing gullies that generally slope from east to west. The regional climate is temperate continental semi-arid monsoon. The average annual precipitation ranges from 450 to 460 mm, with July representing the peak of the rainy season and accounting for approximately one-fifth of the total annual rainfall. The southern mining area is an active open-pit exploitation zone, while the northern part serves as an overburden waste dump with a terraced micro-topography (Figure 1b,c). Within this dump, the thickness of the upper anthropogenic fill varies drastically, ranging from several meters to 90 m. The upper accumulation layer predominantly consists of silt mixed with minor coal cinder, whereas the lower portion comprises loose rock fragments derived from stripping operations, including sandstone, mudstone, and coal gangue. Beneath this fill lies the original topographic foundation (Figure 1d), the uppermost layer of which consists mainly of Quaternary loess with minor sand and plant roots. This loess overlies the deeper strata with a distinct angular unconformity.
Figure 1.
An overview of the study area: (a) the geographical location of the study area; (b) the UAV-based 3D reconstructed model of the waste dump; (c) a current satellite image of the waste dump; (d) a satellite image of the original topography; (e) the developed surface fractures (photo 1); (f) the developed surface fractures (photo 2); (g) the developed surface fractures (photo 3).
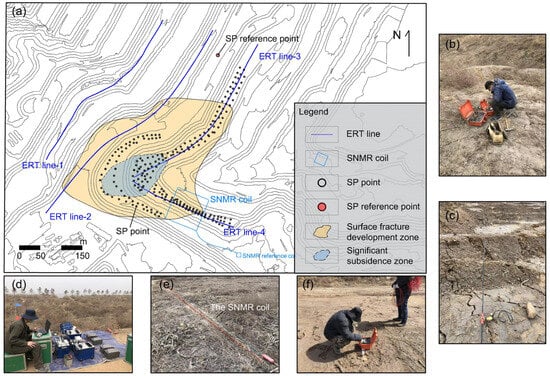
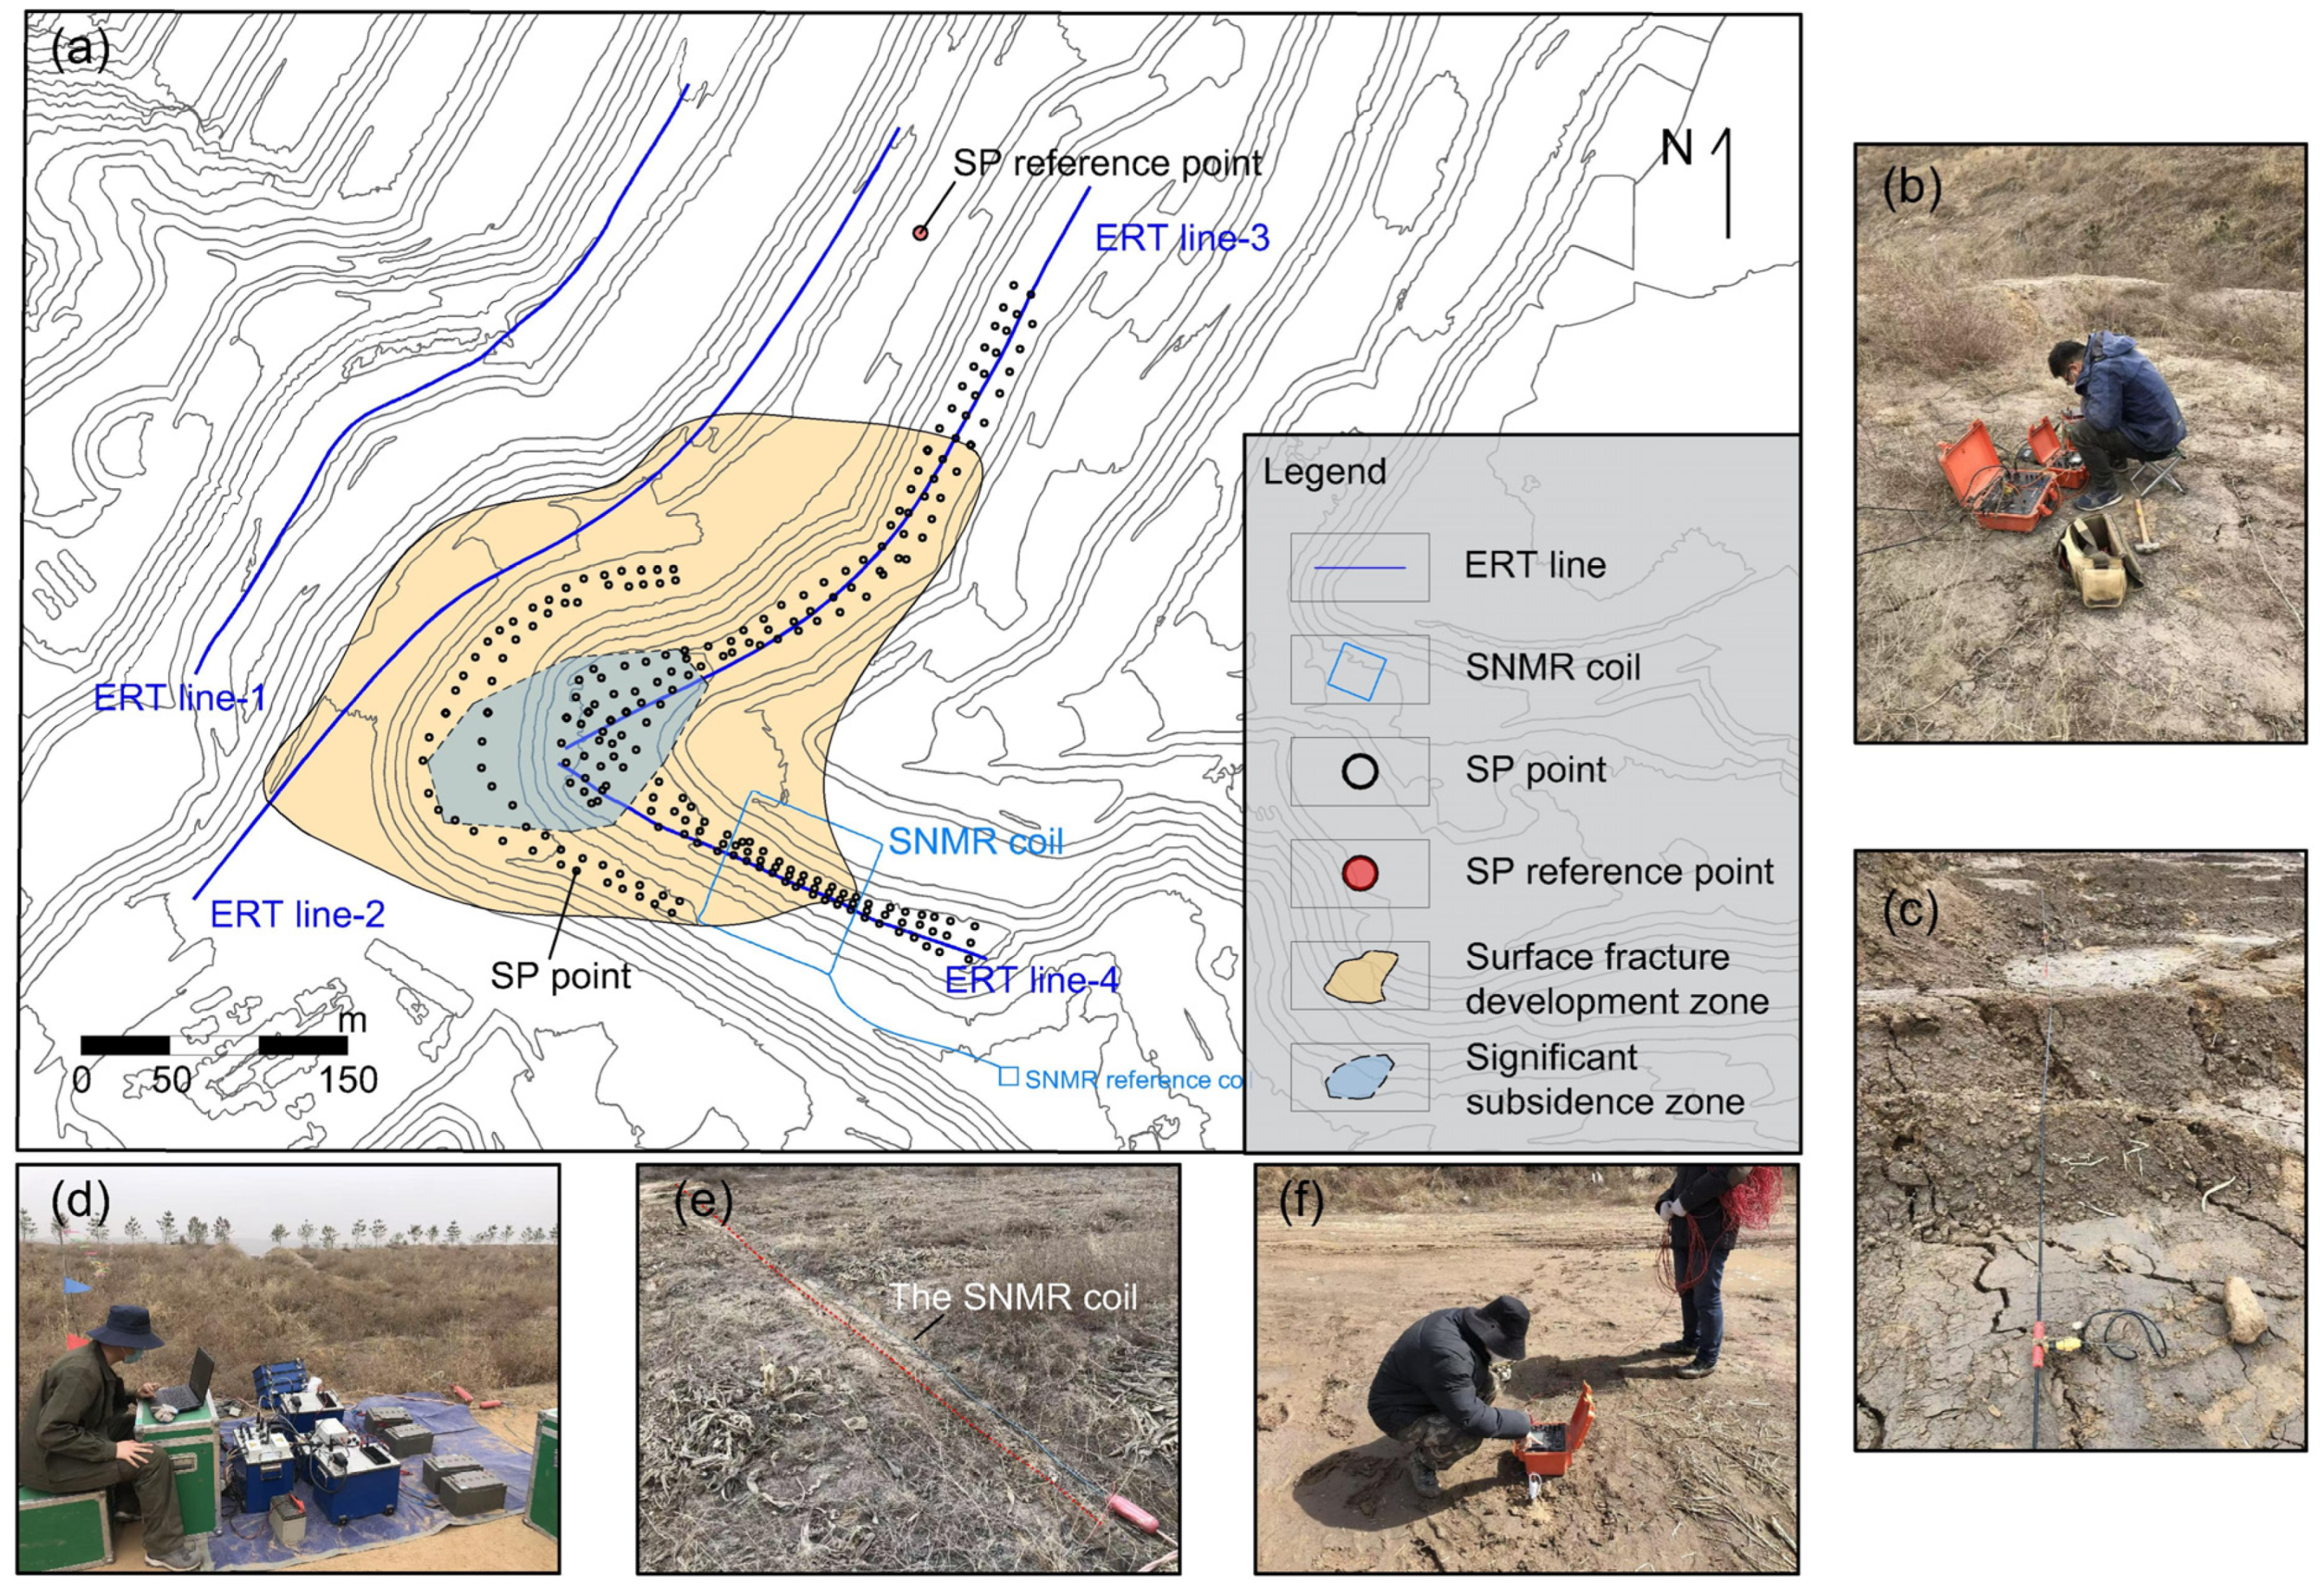
Since the onset of sliding, a massive network of settlement and tension fractures has developed across the dump (Figure 1e–g), with individual fractures reaching a maximum length of 76 m and a maximum aperture of 34 cm. During the subsequent geophysical survey, these surface fractures continued to propagate, indicating a high risk of further overall sliding and failure of the loose anthropogenic mass along its basal contact with the original topography. Accordingly, field investigations integrated with high-precision RTK measurements were conducted to accurately delineate the main sliding-settlement zone and the spatial distribution of ground fractures (Figure 2a). Guided by this framework, ERT profiles, a dense SP grid, and an SNMR sounding point were deployed across the fracture zones to characterize subsurface structures and preferential flow. The spatial geometric parameters of the ERT, SNMR, and SP surveys are listed in Table 1.
Figure 2.
Observation system layout and field operation photographs in study area: (a) planar layout map of geophysical survey lines and measurement stations; (b,c) field photographs of ERT data acquisition; (d,e) field photographs of SNMR data acquisition; (f) field photograph of SP data acquisition.
Table 1.
Spatial geometric parameters of ERT, SNMR and SP surveys.
2.2. Electrical Resistivity Tomography
The ERT method measures subsurface electric potentials by establishing an artificial electric field. The governing equation relating the current and electric potential is expressed as follows [29]:
This partial differential equation describes the relationship between the electric potential field and the input current , where represents the conductivity of the medium; and denote the positions of the positive and negative current sources, respectively; and is the Dirac delta function. Its matrix form can be expressed as follows:
where and denote the discrete divergence and gradient operators, respectively; represents the diagonal matrix of model conductivity; is the forward operator and is the source-term vector. The subsurface electric potential distribution can be obtained by solving the equation system .
For this investigation, four 2D ERT profiles were deployed across the waste dump slope (Figure 2a) with an electrode spacing of 5 m. A Wenner–Schlumberger array was selected to leverage both the robust noise immunity of the Wenner configuration and the high spatial resolution of the Schlumberger configuration. Data were acquired using a WGMD-4 multi-function resistivity meter (CQBTSK Inc., Chongqing, China) (Figure 2b,c), which features a potential measurement accuracy of 1 , fully satisfying the survey requirements.
During the field campaign, loose, unconsolidated material accumulated between the benches and slopes was highly prone to inducing excessive electrode contact resistance. Therefore, to ensure an optimal signal-to-noise ratio (SNR), all ERT profiles were conducted horizontally along the strike of the benches. The profiles covered several critical benches exhibiting the most significant surface settlement to reconstruct the 2D geoelectrical structure within the unstable slope. Stratigraphic depth information extracted from ERT inversions was incorporated as prior structural constraints for the SNMR QT inversion, thereby enhancing the quantitative estimation of water content. Two-dimensional ERT datasets were inverted using the open-source geophysical modeling and inversion framework pyGIMLi [30].
2.3. Surface Nuclear Magnetic Resonance
During the relaxation of hydrogen nuclei in groundwater, a macroscopic alternating magnetic field is generated and captured by surface loops. The resulting induced electromotive force constitutes the SNMR signal, which decays from an initial amplitude over time. Q-time inversion [31] (QTI) simultaneously inverts the spatial distributions of water content and the effective transverse relaxation time (hereinafter referred to as relaxation time) by fitting the entire observational dataset. Compared with traditional initial value inversion (IVI) and time-step inversion (TSI), QTI eliminates the need to partition data into isolated initial values or discrete time steps, thereby improving both spatial resolution and inversion stability. According to Hertrich [32], the forward modeling equation for SNMR can be expressed as follows:
where is the signal amplitude at a given pulse moment and decay time ; represents the kernel function; is the volumetric water content at the subsurface position . In this study, the hypothesis of a single relaxation time is adopted, meaning that each horizontal inversion layer is characterized by a unique relaxation time and a single water content . This hypothesis substantially reduces the dimensionality of the model parameters, thereby enhancing inversion stability and reliability. More importantly, it addresses a practical challenge in hydraulic conductivity estimation. Even in magnetic resonance logging with high resolution, resolving distinct peaks within the spectrum is frequently hindered by SNR limitations [33].
For this investigation, surface loop deployment was tightly restricted by local spatial and operational safety constraints; consequently, only a single fixed-point SNMR sounding (Figure 2a) was conducted over the prominent low-resistivity anomaly zone delineated by the preceding ERT inversion. This targeted sounding served as localized diagnostic tool to determine whether the anomaly was driven by water accumulation. Data were acquired using the NumisPOLY system (IRIS Instruments, France; Figure 2d,e). A square coincident loop with a side length of 100 m was laid out on the ground surface. To mitigate electromagnetic interference, a 10 m remote reference loop was deployed to improve the SNR. To further accurately quantify the subsurface water distribution, stratigraphic layer information derived from the ERT inversion was incorporated as prior constraints into the QTI scheme [34]. The objective function of the QTI is formulated as follows:
where is the data weighting matrix, represents the forward operator, denotes the observed dataset, is the regularization factor for model parameters, is the smoothness matrix, signifies the regularization factor for the prior constraint term, is the prior information weighting matrix, and represents the prior model. The volumetric water content and relaxation time obtained from QTI are utilized to estimate the hydraulic conductivity. The SNMR-estimated hydraulic conductivity is expressed as follows:
Here, , , and are empirical parameters specific to the geological formation. Based on previous research [35,36], and are empirically set to 1 and 2, respectively. Due to local site and operational safety constraints, field pumping tests were precluded, preventing the direct on-site calibration of the coefficient . Nevertheless, given the structural similarities in pore and fracture networks between the loose anthropogenic fill and weathered bedrock, the coefficient was determined by referencing well-established empirical values for typical weathered bedrock formations. Although loose anthropogenic fill and bedrock exhibit distinct compaction states, this highly heterogeneous dump mass can be hydrogeologically analogous to an intensely fractured and weathered rock zone. Recent sliding and settlement generated interconnected and fractures, significantly enhancing the dump’s macro-permeability. Therefore, the coefficient was reasonably approximated as 7.0 × 10⁻¹¹, a well-established value for highly weathered rock formations [36].
2.4. Spontaneous Potential
The SP method is a passive-source geophysical technique exhibiting high sensitivity to groundwater flow. Upon contact with pore fluids, the solid matrix of most geological media develops a negative surface charge, leading to the formation of an electrical double layer. Under a hydraulic gradient, the excess cations within the fluid diffuse layer are transported along with the bulk water flow, thereby establishing an electric potential difference known as the streaming potential.
To characterize the preferred seepage directions following rainfall infiltration, an SP grid scanning survey was executed across benches featuring dense surface fracture clusters and significant settlement (Figure 2a). Data were acquired using a pair of Pb/PbCl2 non-polarizable electrodes to record the potential differences (Figure 2f). A high-precision RTK terminal (Unistrong Inc., Beijing, China) was employed to determine the spatial coordinates of each measurement station. During the field campaign, the reference base station (the fixed negative terminal) was deployed in a geoelectrically stable zone devoid of ground fractures, whereas the other non-polarizable electrode served as the moving probe to traverse the survey area. Before numerical inversion, the temporal drift of the electrodes needed to be eliminated. The initial potential difference between the electrode pair was approximately 0.01 mV and shifted to 0.3 mV by the end of the survey; this polarization drift was corrected via linear interpolation based on the timestamp of each station.
To quantitatively evaluate seepage characteristics, two SP profiles were extracted to perform potential anomaly inversion based on polarization geometry. In this inversion scheme, the zone of concentrated downward infiltration of the preferential subsurface flow was idealized as an equivalent vertical cylinder (VC) model. In quantitative SP inversion, anomalies are commonly simplified into geometric models such as sphere, sheet, and cylinder. Field observations revealed localized surface subsidence along the dump’s central axis, implying subsurface fluid accumulation and increased pore pressure. This interpretation effectively rules out both the sphere (which lacks vertical depth extension) and the sheet (which conventionally simulates planar structures like thin ore bodies). Since the observed phenomenon is most likely induced by a vertical seepage zone, the equivalent VC model was adopted. The forward modeling formula for the VC model is expressed as follows [37,38]:
where is the polarization coefficient; represents the spatial position of the observation point; denotes the horizontal coordinate of the polarized body’s axis; is the burial depth of the top boundary of the polarized body; and signifies the polarization angle between the polarization axis and the horizontal plane, which directly indicates the concentrated migration direction of the subsurface fluid.
This study implements an open-source physics-informed neural network (PINN) framework to perform the simultaneous quantitative inversion and interpretation of overlapping SP anomalies. The network training incorporates a weighted, multi-component loss function that balances a mean squared error (MSE) term for the observed potential data, a physics-informed residual term adhering to the forward governing equation (Equation (6)), and a regularization penalty constraining the spatial divergence of the source parameters. This configuration ensures that the inverted parameters physically characterize the preferential subsurface seepage zones within the waste dump. A detailed formulation of this PINN-based inversion framework is available in the literature [39].
3. Results
3.1. ERT Results
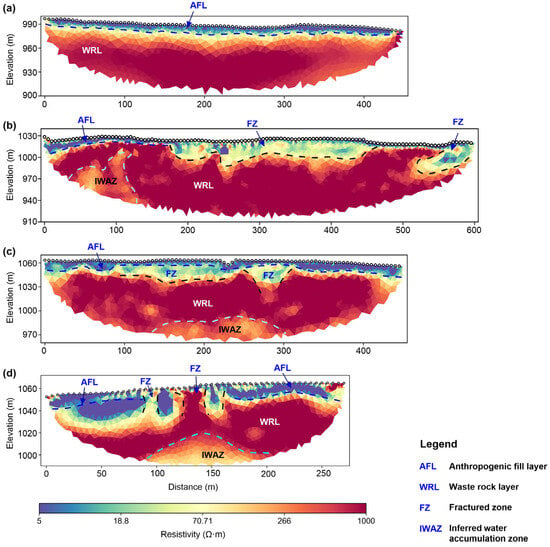
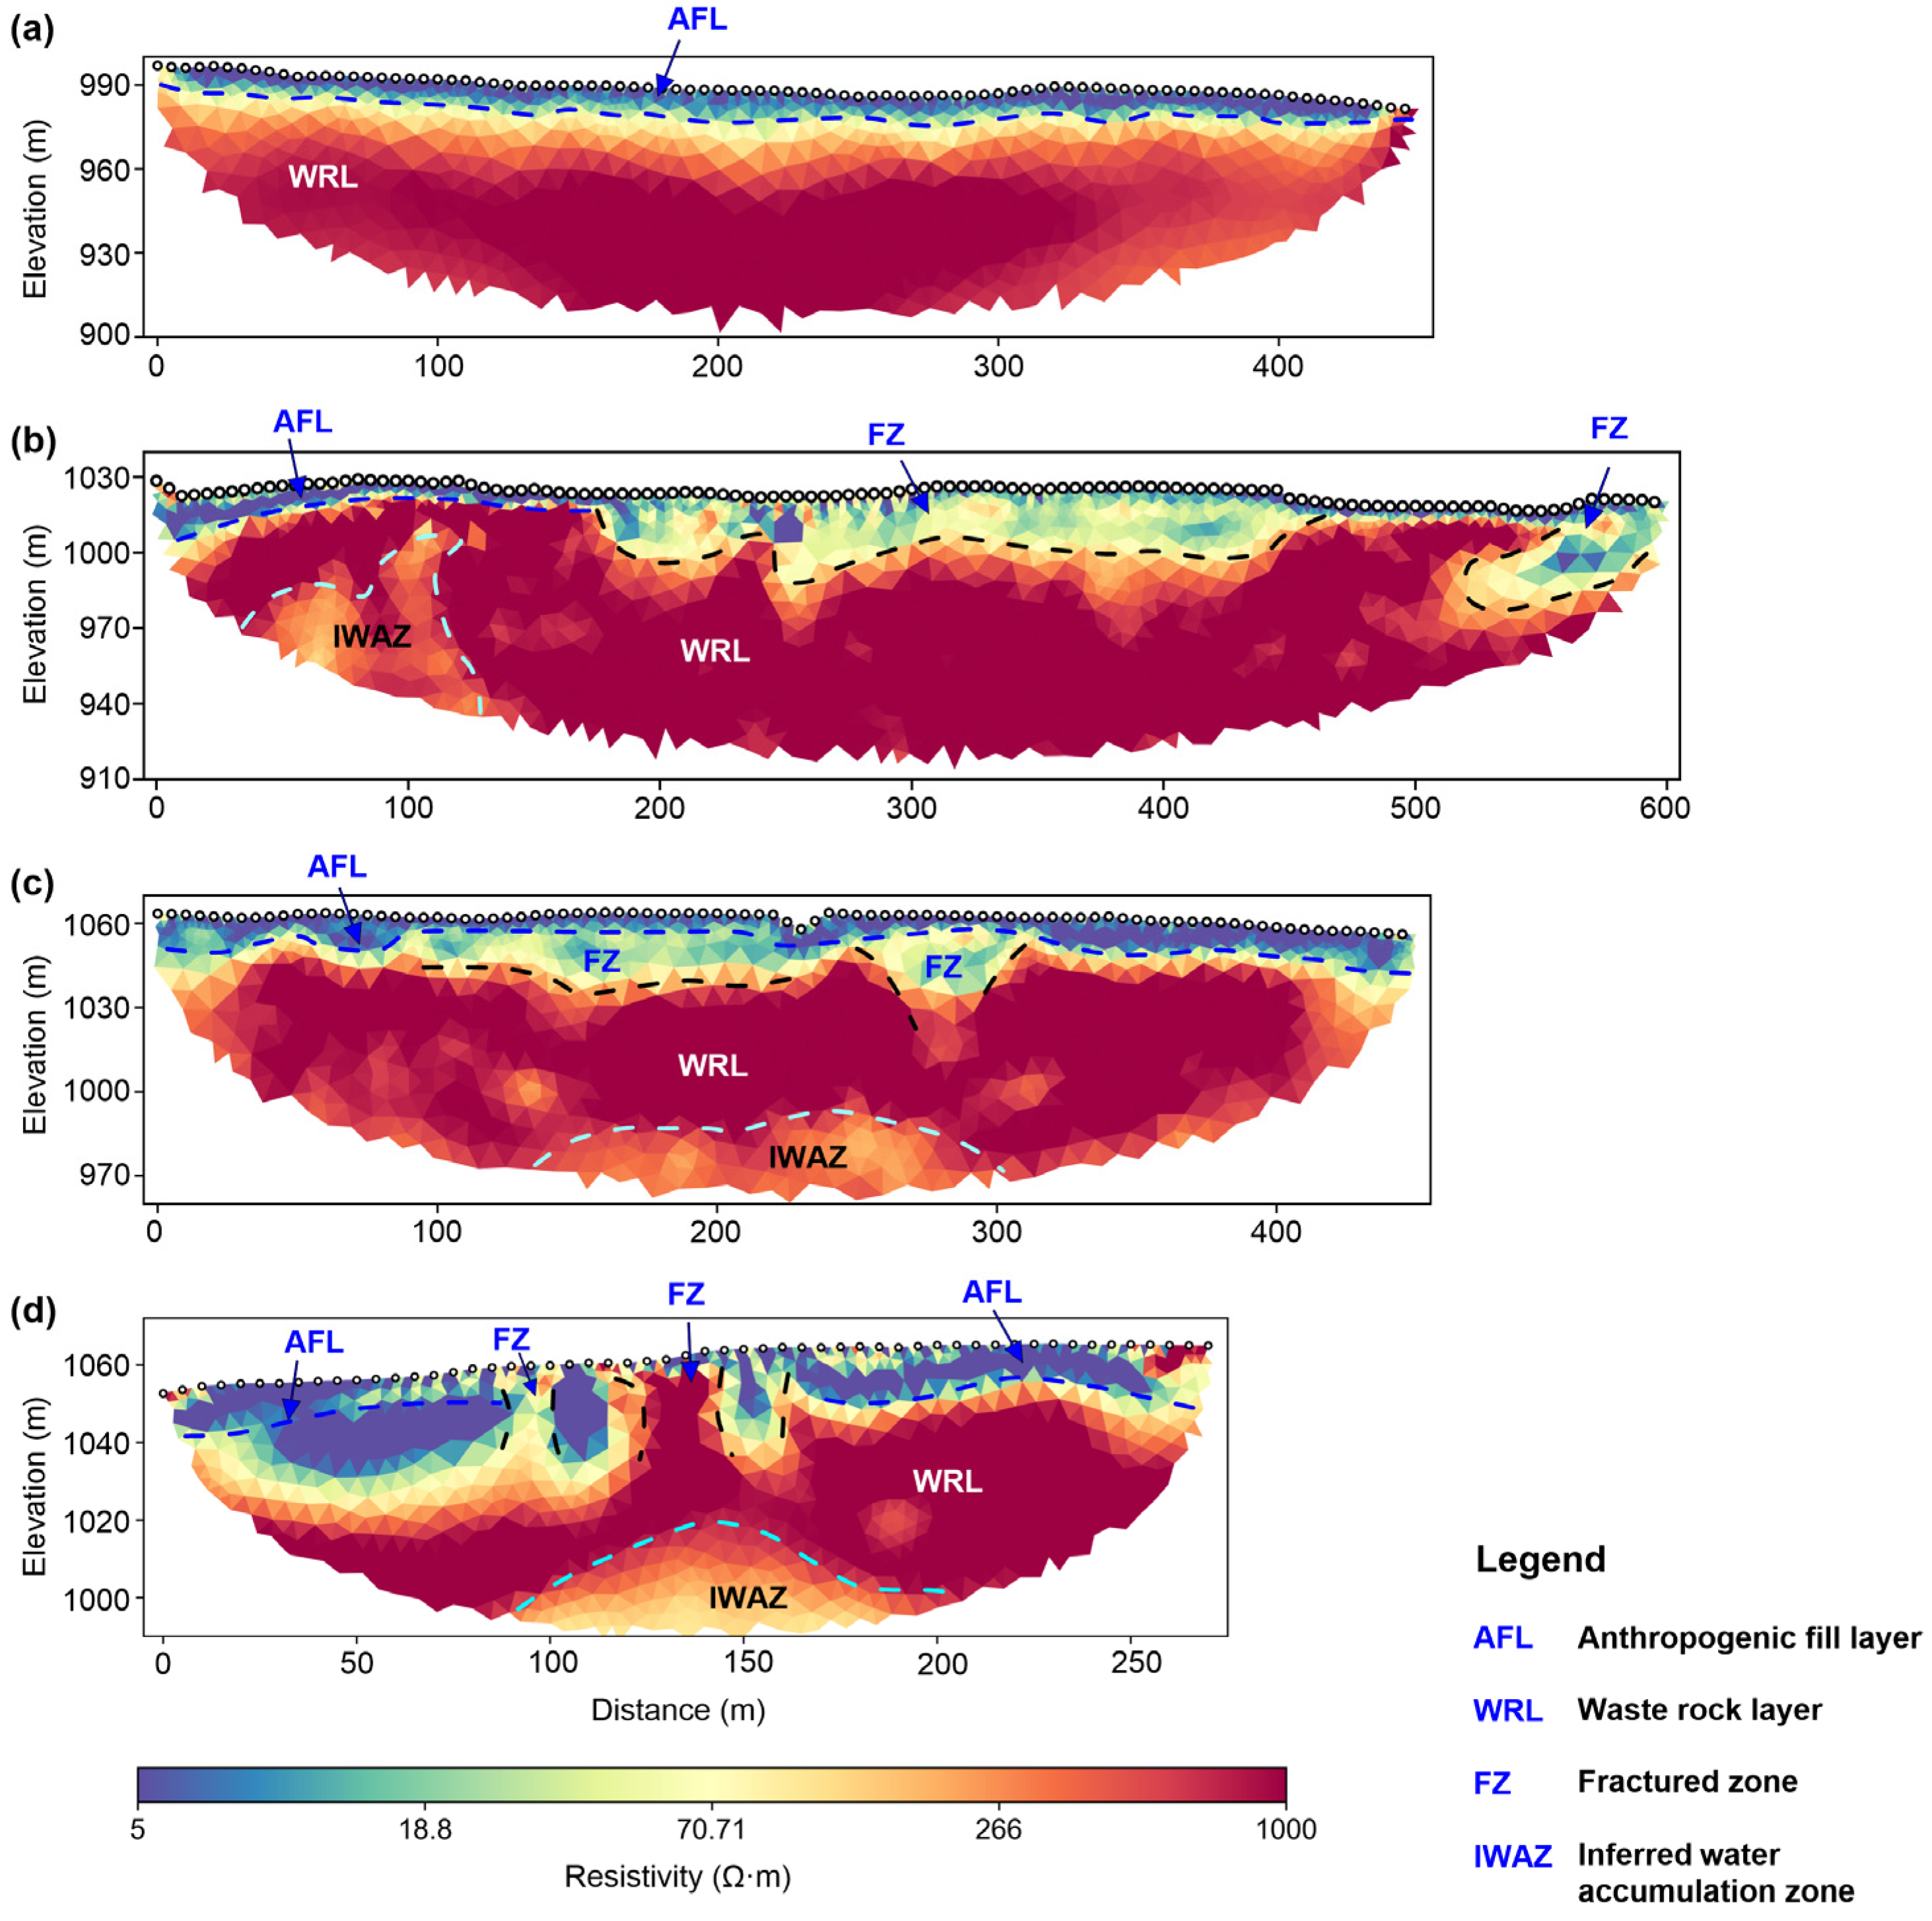
A total of four inverted 2D resistivity profiles were obtained, clearly illustrating the 2D resistivity distributions beneath the benches at various elevations (Figure 3). ERT_Line_1 is deployed on a bench at an elevation of approximately 1000 m, situated outside the active sliding zone, and exhibits favorable lateral stratigraphic continuity (Figure 3a). This profile features a distinct two-layer geoelectrical structure: the uppermost layer is a surficial anthropogenic fill layer (AFL) with a thickness of ~10 m and a resistivity below 20 ; the underlying second layer, extending below a depth of 10 m, exhibits a high resistivity ranging from 300 to 1000 , which is inferred to be a relatively dry waste rock layer (WRL). In contrast, ERT_Lines_2, 3, and 4 extensively traverse the zone characterized by developed surface fractures, where the lateral geoelectrical continuity degrades substantially. The basal interface of the AFL exhibits pronounced undulations (Figure 3b–d), with the resistivity displaying a transitional feature ranging from 50 to 200 . This electrical transition highly correlates with the spatial distribution of the surface fractures, thereby indicating a fractured zone induced by meteoric water infiltration. Moreover, the inverted profile of ERT_Line_4 reveals several sub-vertical, ribbon-like high-resistivity anomalies that penetrate upwards to the ground surface, directly corresponding to the macro-fissures mapped during the field investigation. Within the WRL, localized low-resistivity anomalies (<200 ) are prominently observed, which are delineated as inferred water accumulation zones (IWAZs).
Figure 3.
Two-dimensional resistivity inversion results for ERT profiles: (a–d) profiles for ERT_Line_1 to ERT_Line_4, respectively.
Waste dumps are typically constructed by the alternating accumulation of stripped overburden fill and coal gangue derived from open-pit mining operations. The surficial bench fill macroscopically behaves as a relatively low-permeability layer, partially suppressing rainfall infiltration. Nevertheless, with the progressive increment of overburden loading and sustained cyclic vibrations induced by heavy haul trucks, the surficial crust becomes highly susceptible to fracturing, thereby establishing favorable conditions for meteoric water infiltration. The underlying WRL has pronounced structural heterogeneity and highly developed macropores, which typically exhibits low-resistivity signatures when water-bearing. Consequently, it can be preliminarily deduced that the low-resistivity anomalous zones delineated by the ERT imaging correspond to the IWAZs. Accordingly, a targeted SNMR sounding was subsequently executed over the prominent low-resistivity anomaly identified in the ERT_Line_4 (the IWAZ illustrated in Figure 3d).
3.2. SNMR Results
Specifically, the SNMR sounding site was deployed at approximately the 150 m mark along profile ERT_Line_4. Based on the geoelectrical stratification resolved by the ERT inversion, a two-layer prior hydrogeological constraint model () was established: the first layer spans from the ground surface to the geoelectrical interface between the AFL and the WRL (depth < 20 m); the second layer is defined below the top bound (roof) of the IWAZ (depth > 40 m). Within these structurally extracted constraints, the prior water content was initialized with a uniform random distribution between 1% and 10% to eliminate deterministic bias and avoid local-minimum traps. To ensure a strictly data-driven inversion framework, a minor regularization weight coefficient ( = 2 × 10⁻⁵) was assigned to this structural prior constraint, and the prior information weighting matrix () was set as an identity matrix. Consequently, the optimization process was overwhelmingly driven by the SNMR data residuals, mathematically damping and attenuating any potential depth uncertainties from the ERT horizon before they could propagate into the final water-content estimations.
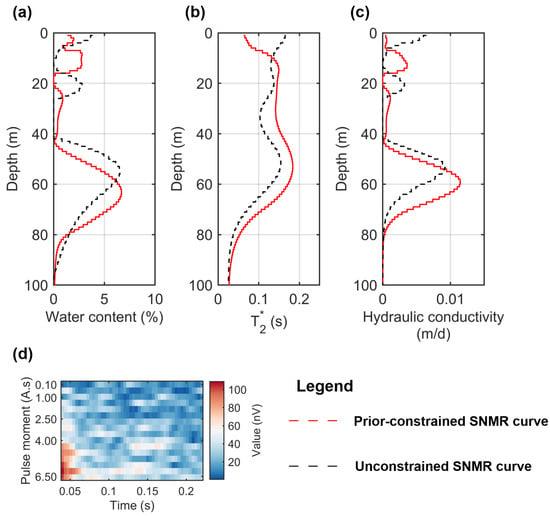
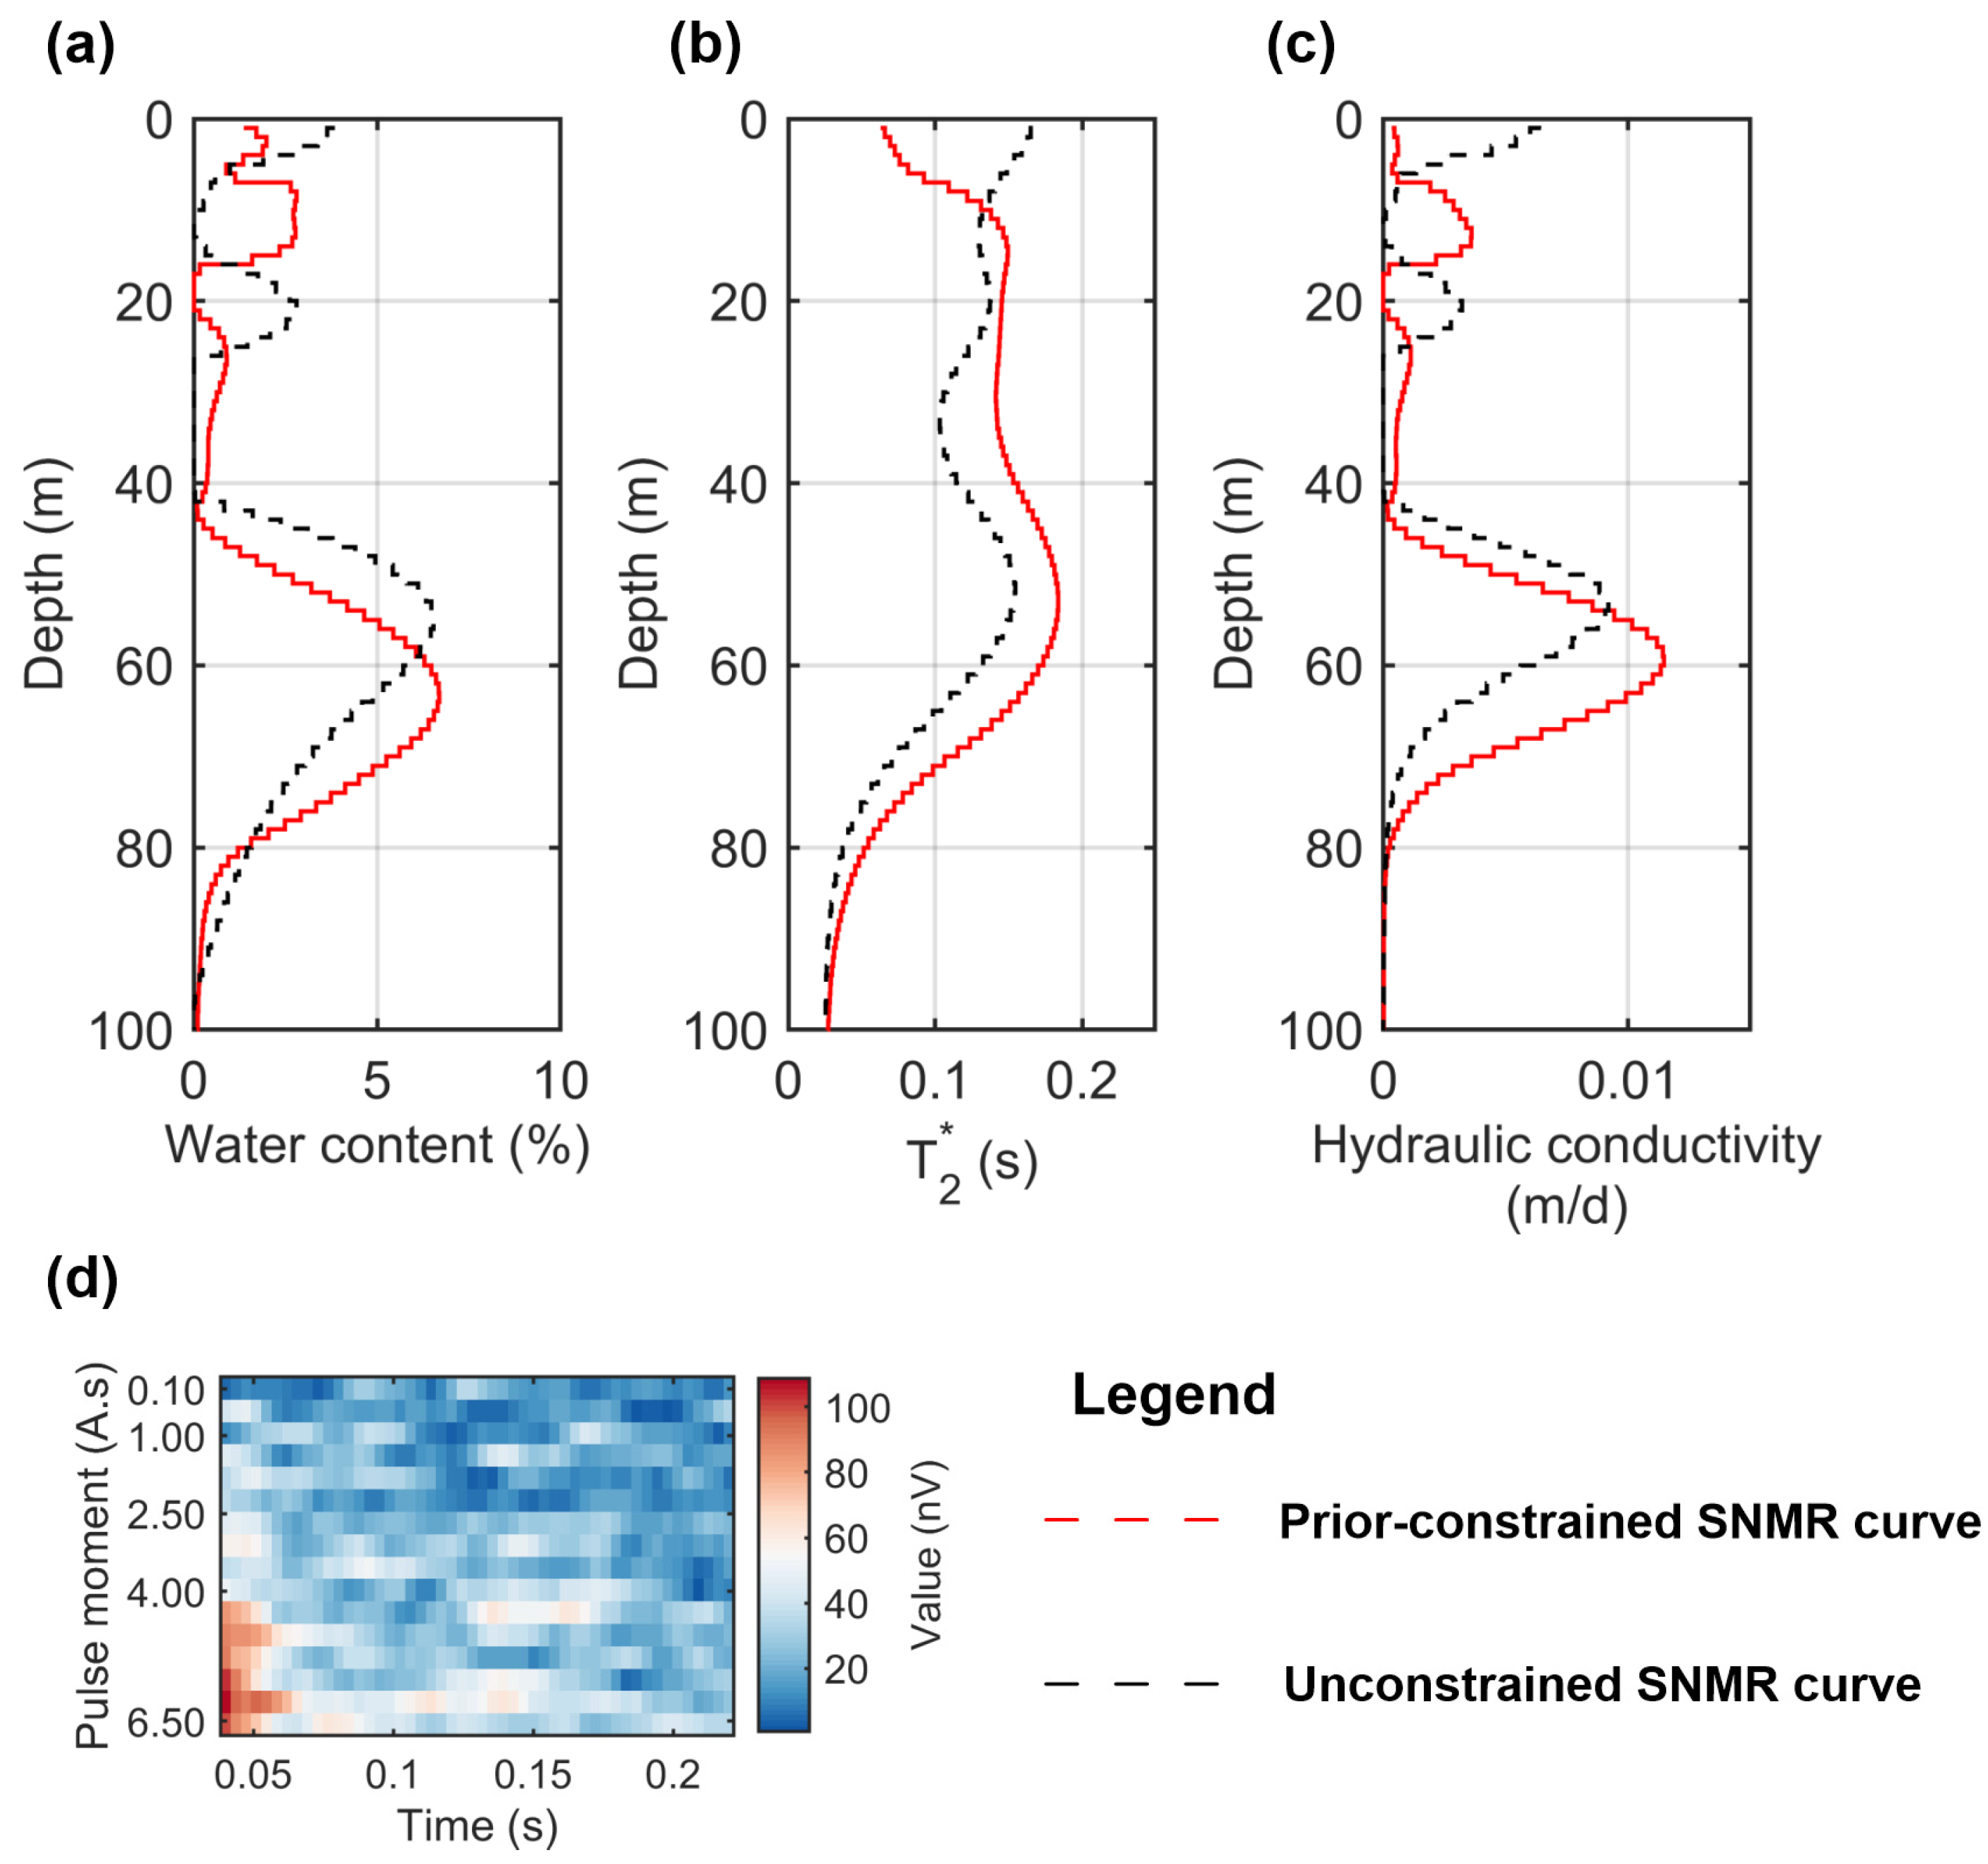
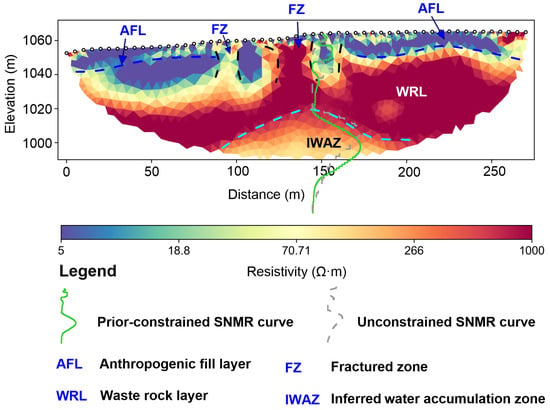
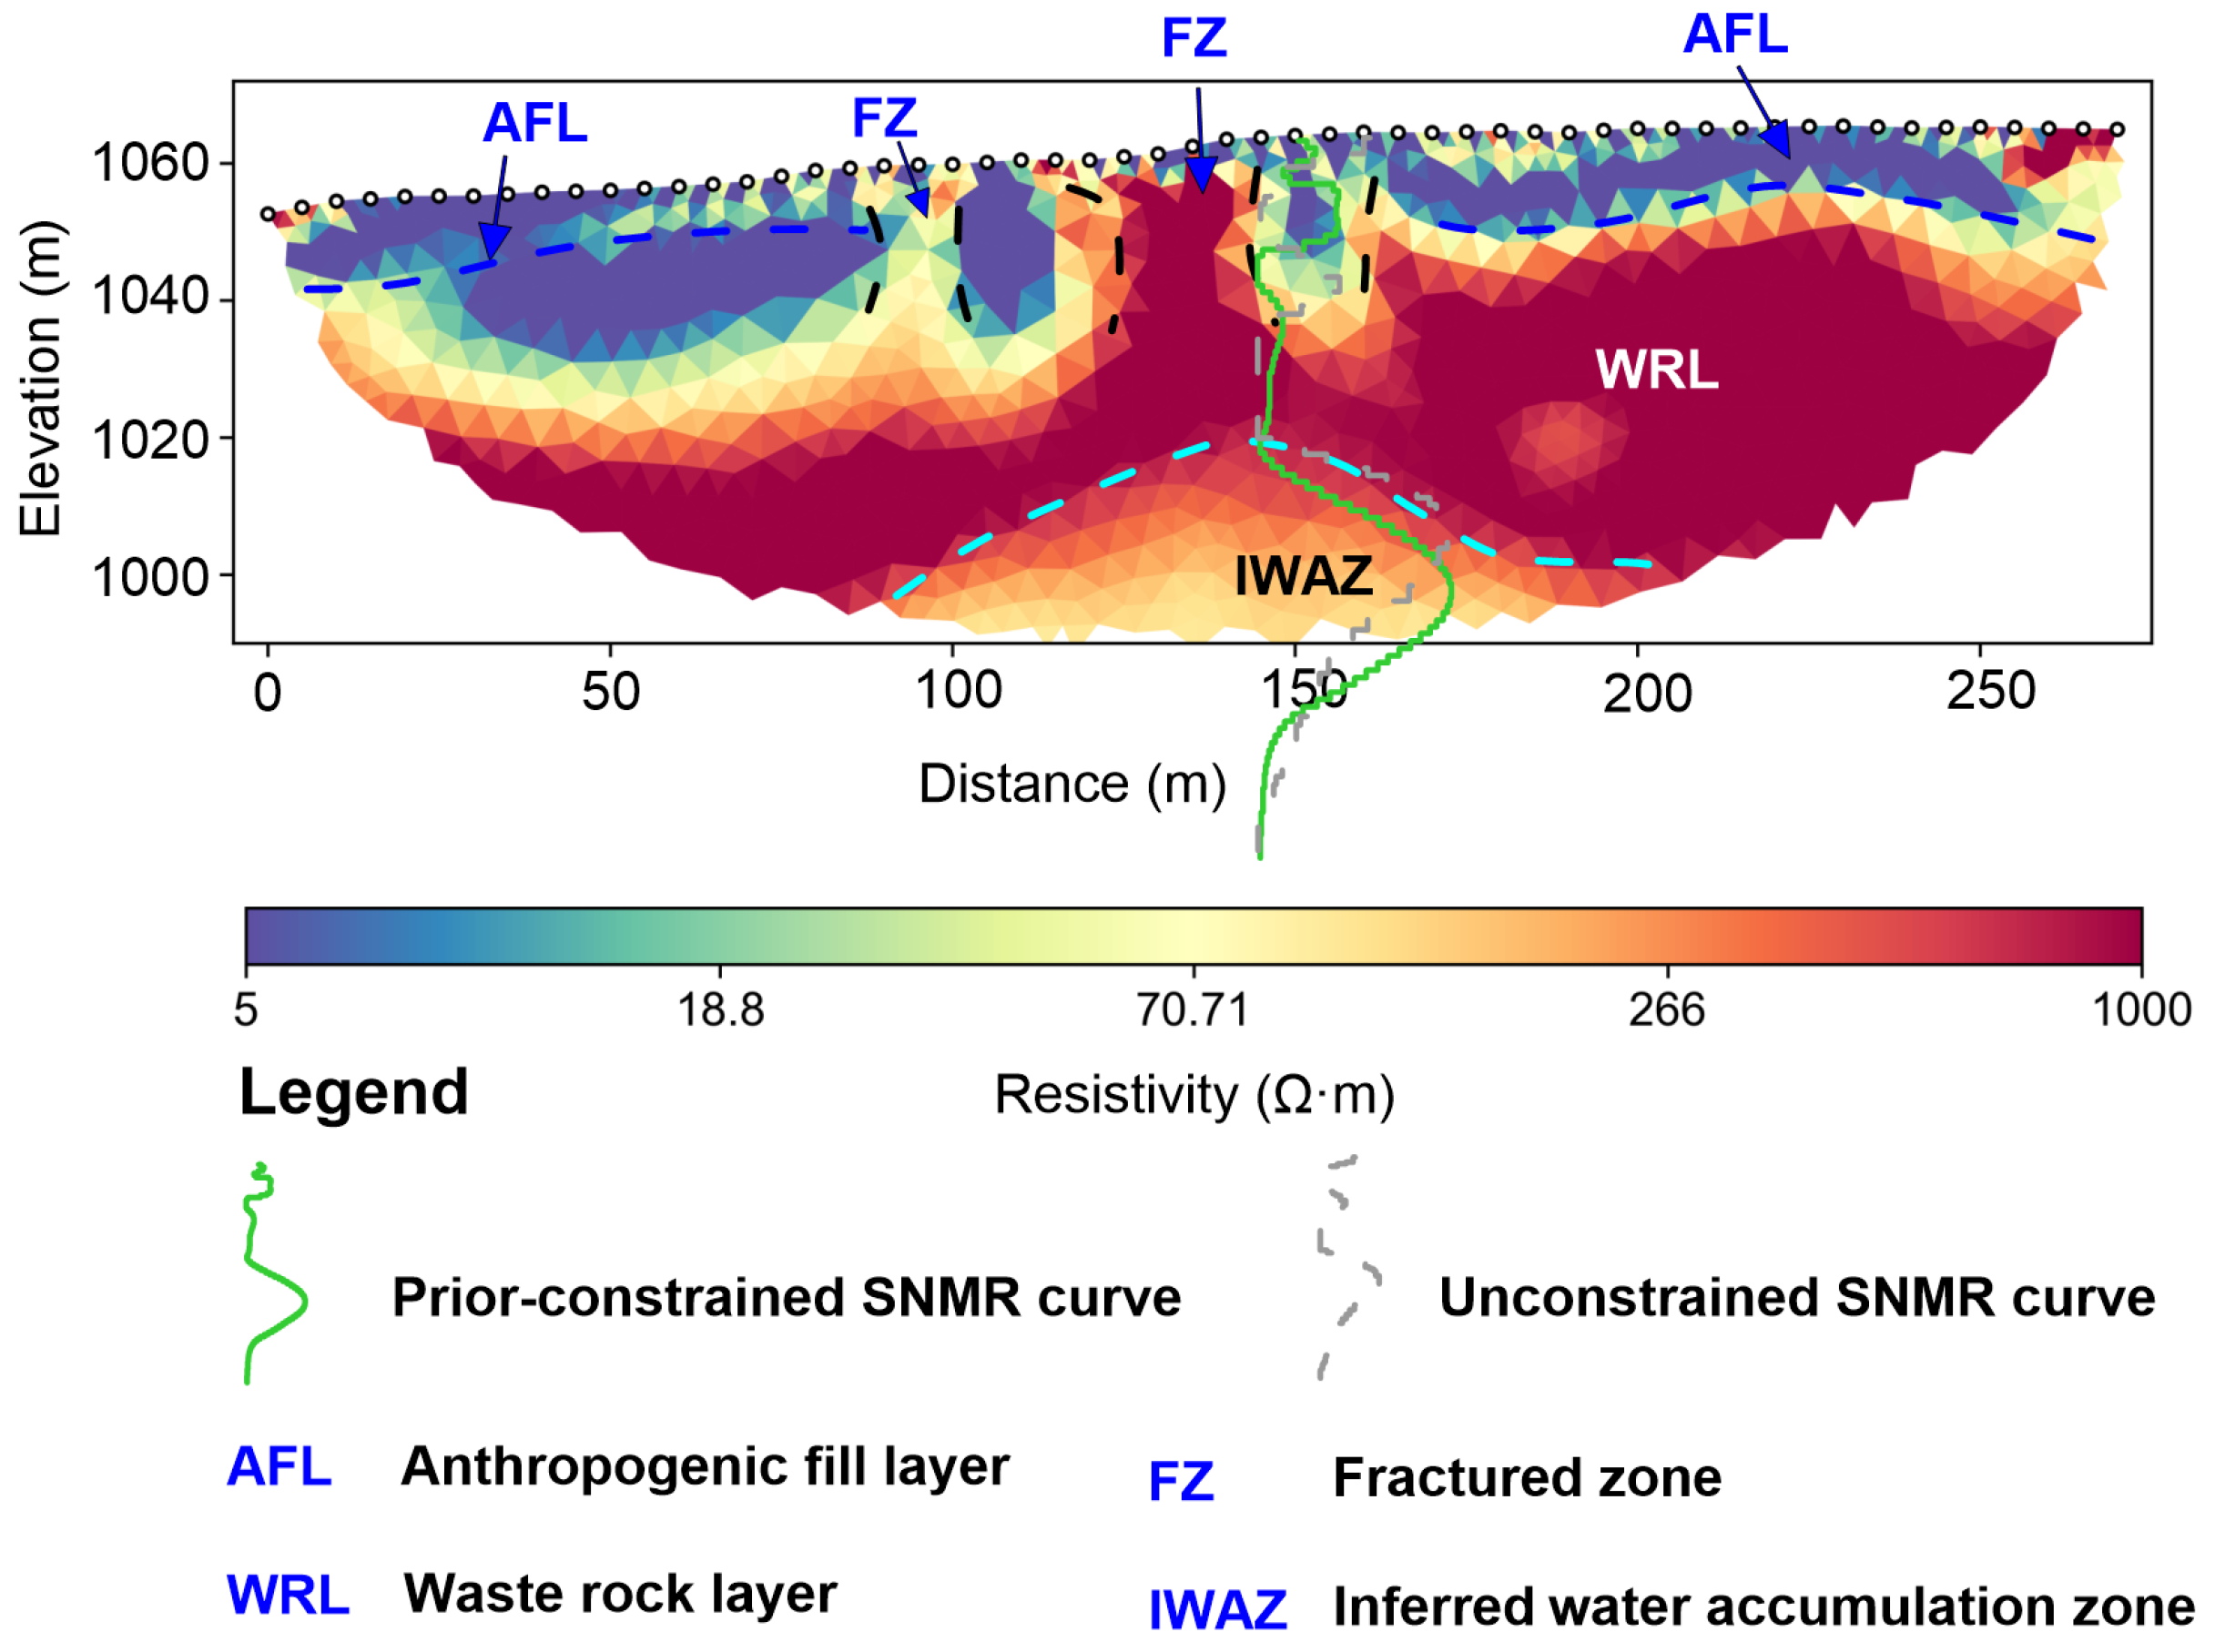
Figure 4 illustrates the SNMR inversion curves. Due to a 40 ms instrumental dead time, fast-decaying signals from bound water in micropores are filtered out; thus, the recorded signals are dominated by free water within fractures and coal gangue macropores. Compared to the unconstrained inversion results (black line), both curves exhibit comparable overall trends with only a minor deviation in the estimated depths of the aquifers, indicating that the data effectively constrained the model parameters during the inversion. The inversion results reveal the presence of two distinct water-bearing zones in the subsurface: the upper layer (burial depth: 8–17 m) features a mean volumetric water content of ~2.7%, which is likely attributed to meteoric water infiltration within the fractured zone; the lower layer (burial depth: 45–80 m) acts as the primary deep aquifer, with its volumetric water content peaking at 6.7% at a depth of 63 m. The inversion results of the relaxation time exhibit a pronounced volume effect, with the global values tightly clustered within the 140–160 ms range. Furthermore, the deep formation demonstrates an elevated hydraulic conductivity, reaching a maximum value of 0.014 m/d.
Figure 4.
SNMR sounding inversion results, where the red and black curves represent the prior-constrained and unconstrained inversion results, respectively: (a) volumetric water content inversion curves; (b) relaxation time inversion curves; (c) inferred hydraulic conductivity distribution; (d) Qt signal plot.
Physically, the 1D SNMR result represents a superposition response under the assumption of layered aquifers at different depths, meaning its inversion curve can be treated as a localized vertical column. By overlaying the volumetric water content profile onto the 2D ERT resistivity cross-section, a strong vertical correlation is observed between the deep water-bearing zone detected by the SNMR and the low-resistivity anomaly delineated by the ERT (Figure 5). In the qt plot (Figure 4d), the signal amplitudes are concentrated within the high pulse moment range. Because larger pulse moments correspond to greater investigation depths, this physical feature confirms a deep water-bearing response directly at the raw data level. This robust correspondence directly validates the IWAZ interpretation. The hydrogeological parameters obtained from the SNMR sounding are summarized in Table 2.
Figure 5.
Two-dimensional resistivity profile of ERT_Line_4 overlaid with SNMR volumetric water content inversion results.
Table 2.
Summary of hydrogeological parameters estimated from SNMR inversion results.
3.3. SP Results
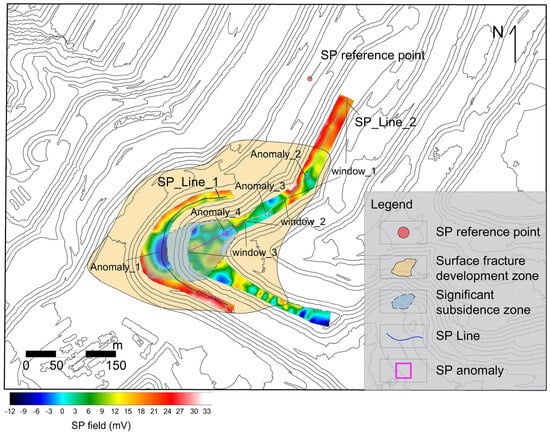
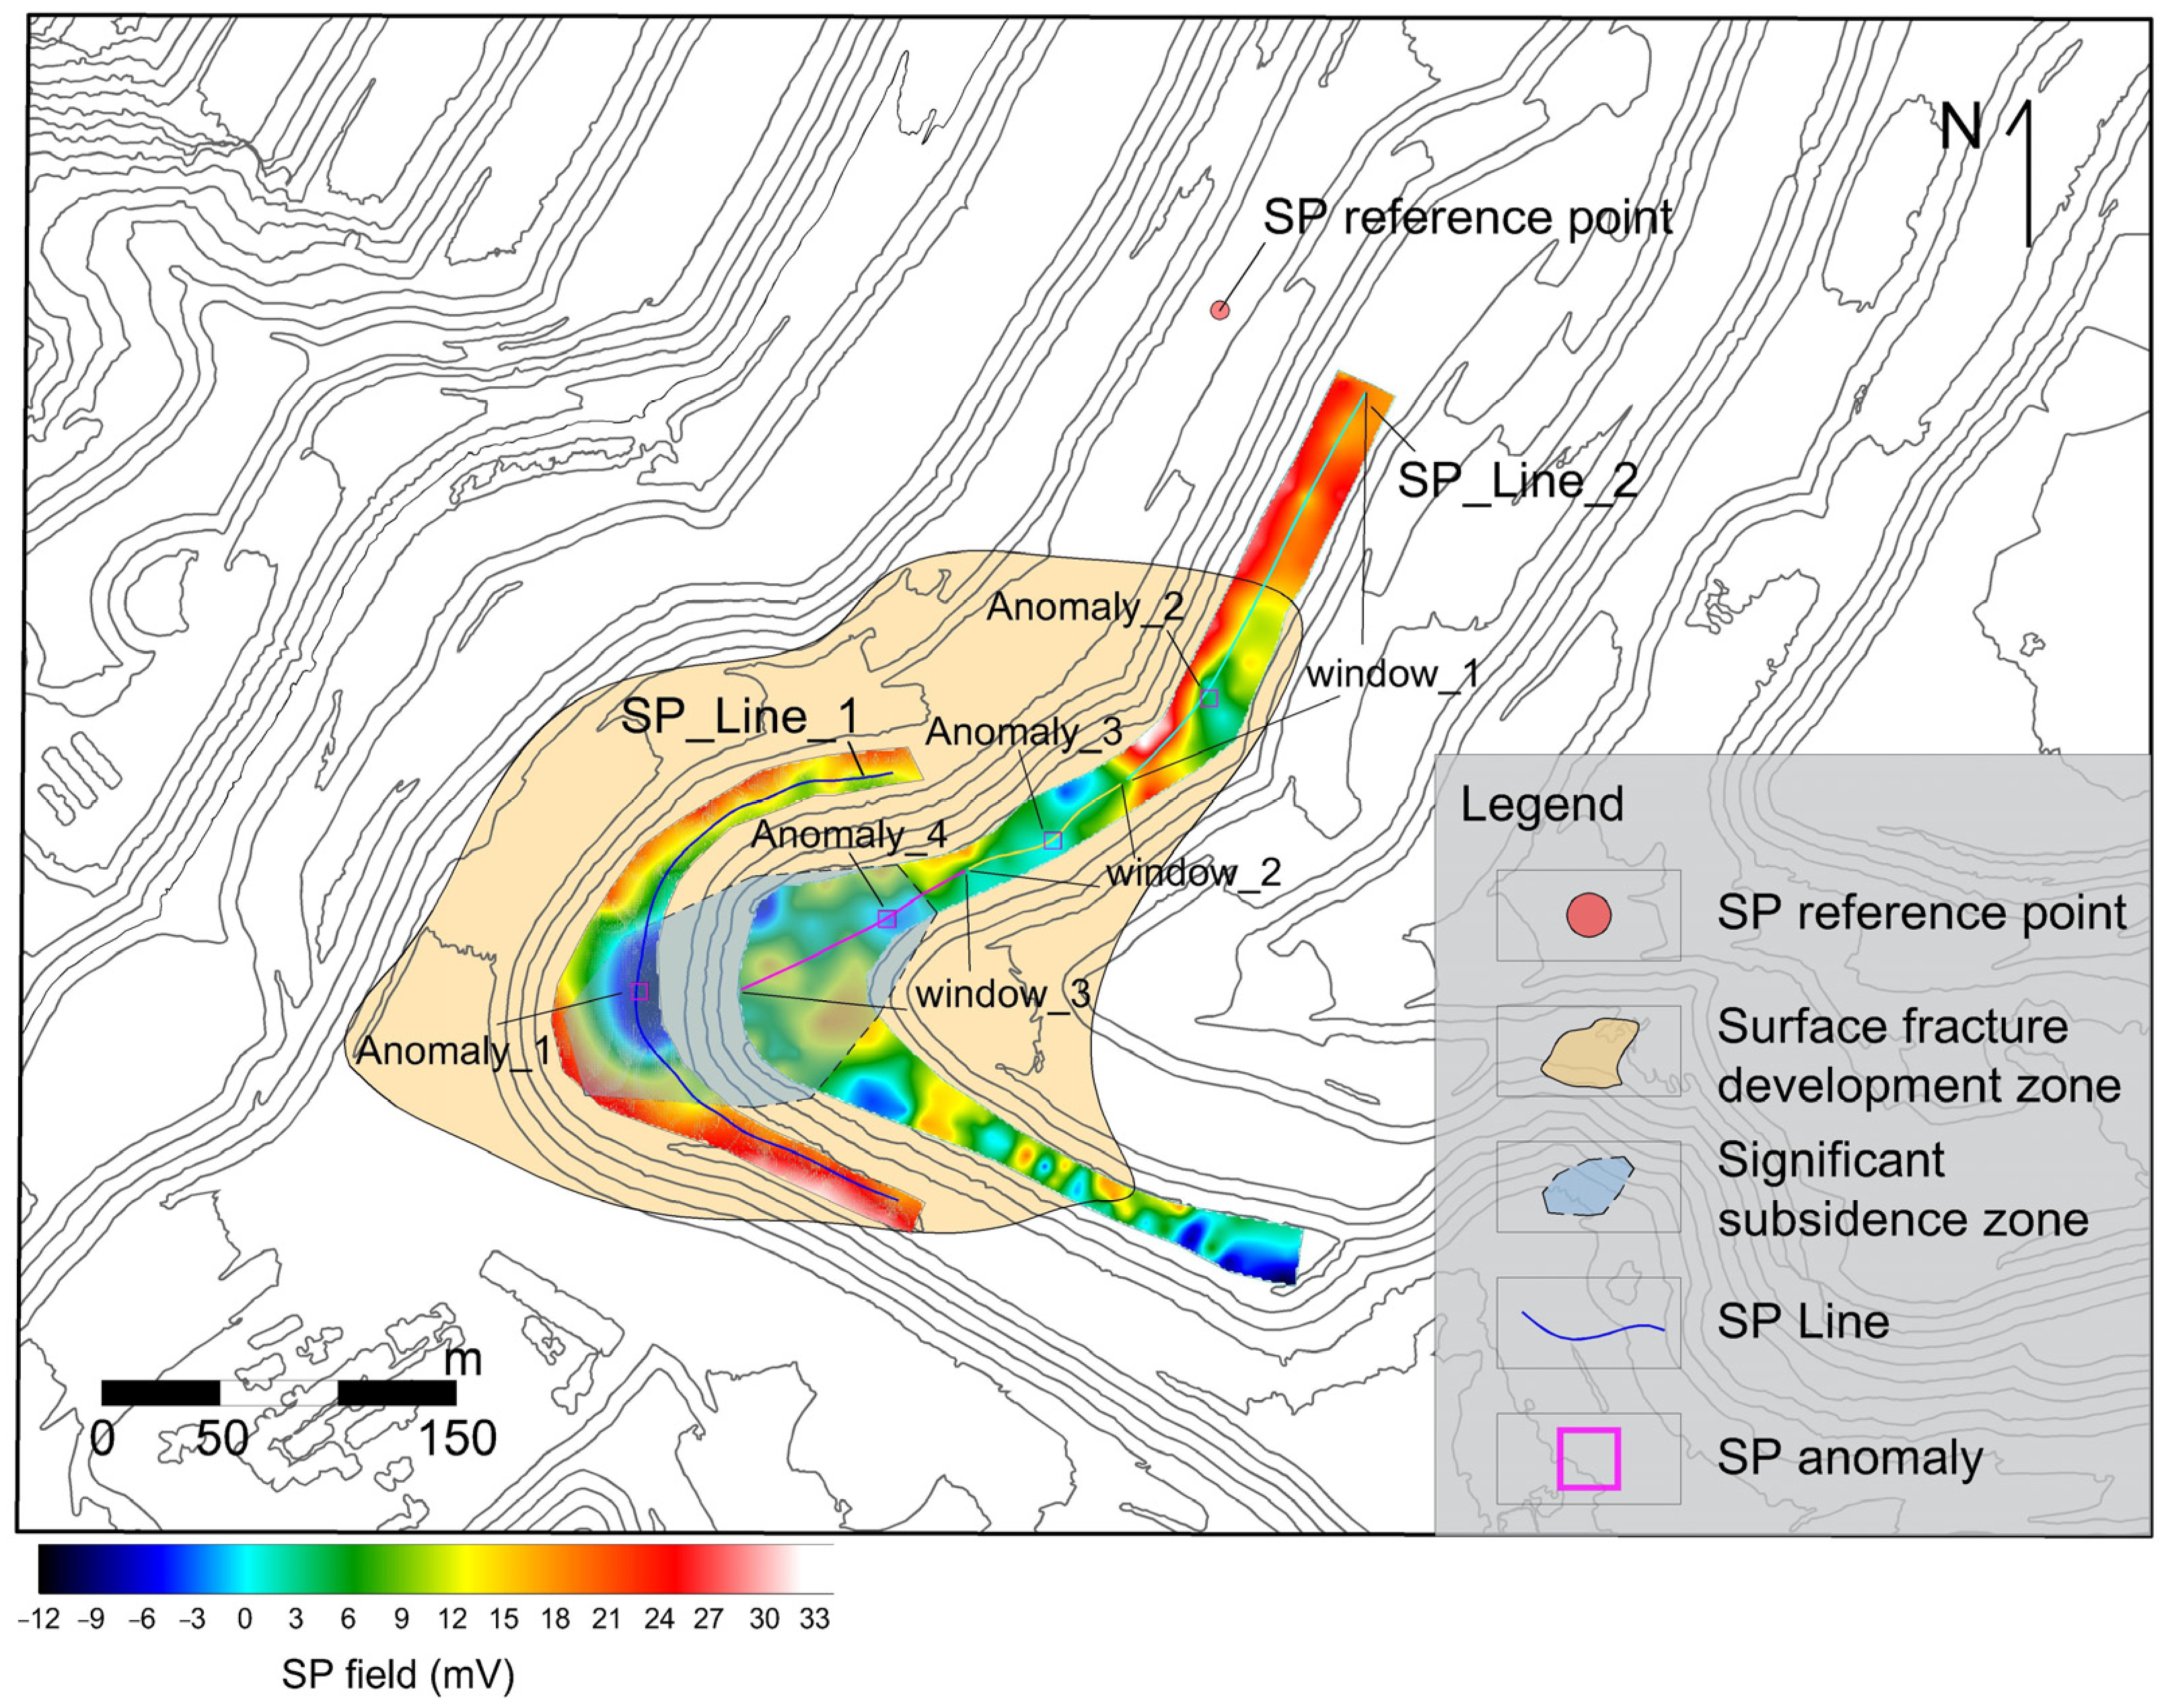
Figure 6 illustrates the planar distribution of spontaneous potential across the 1060 m and 1040 m benches. The negative SP anomalies on the 1040 m bench are concentrated along the bench axis, whereas those on the 1060 m bench exhibit a ribbon-like distribution closely congruent with the strike of surface fractures, confirming that the fractures govern the preferred seepage directions. To quantitatively extract seepage parameters, the SP profiles along the 1040 m (SP_Line_1) and 1060 m (SP_Line_2) benches were extracted for inversion (Figure 6).
Figure 6.
Planar equipotential contour map of spontaneous potential (SP).
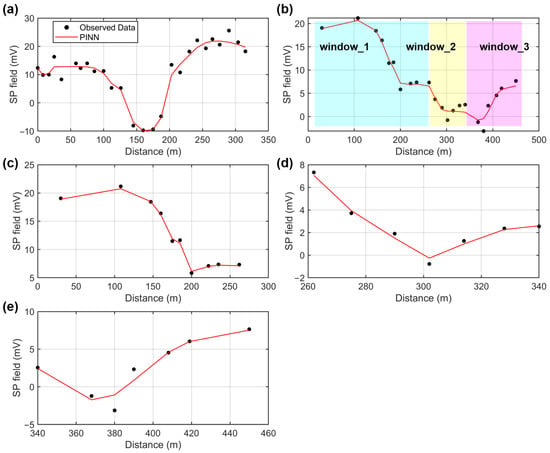
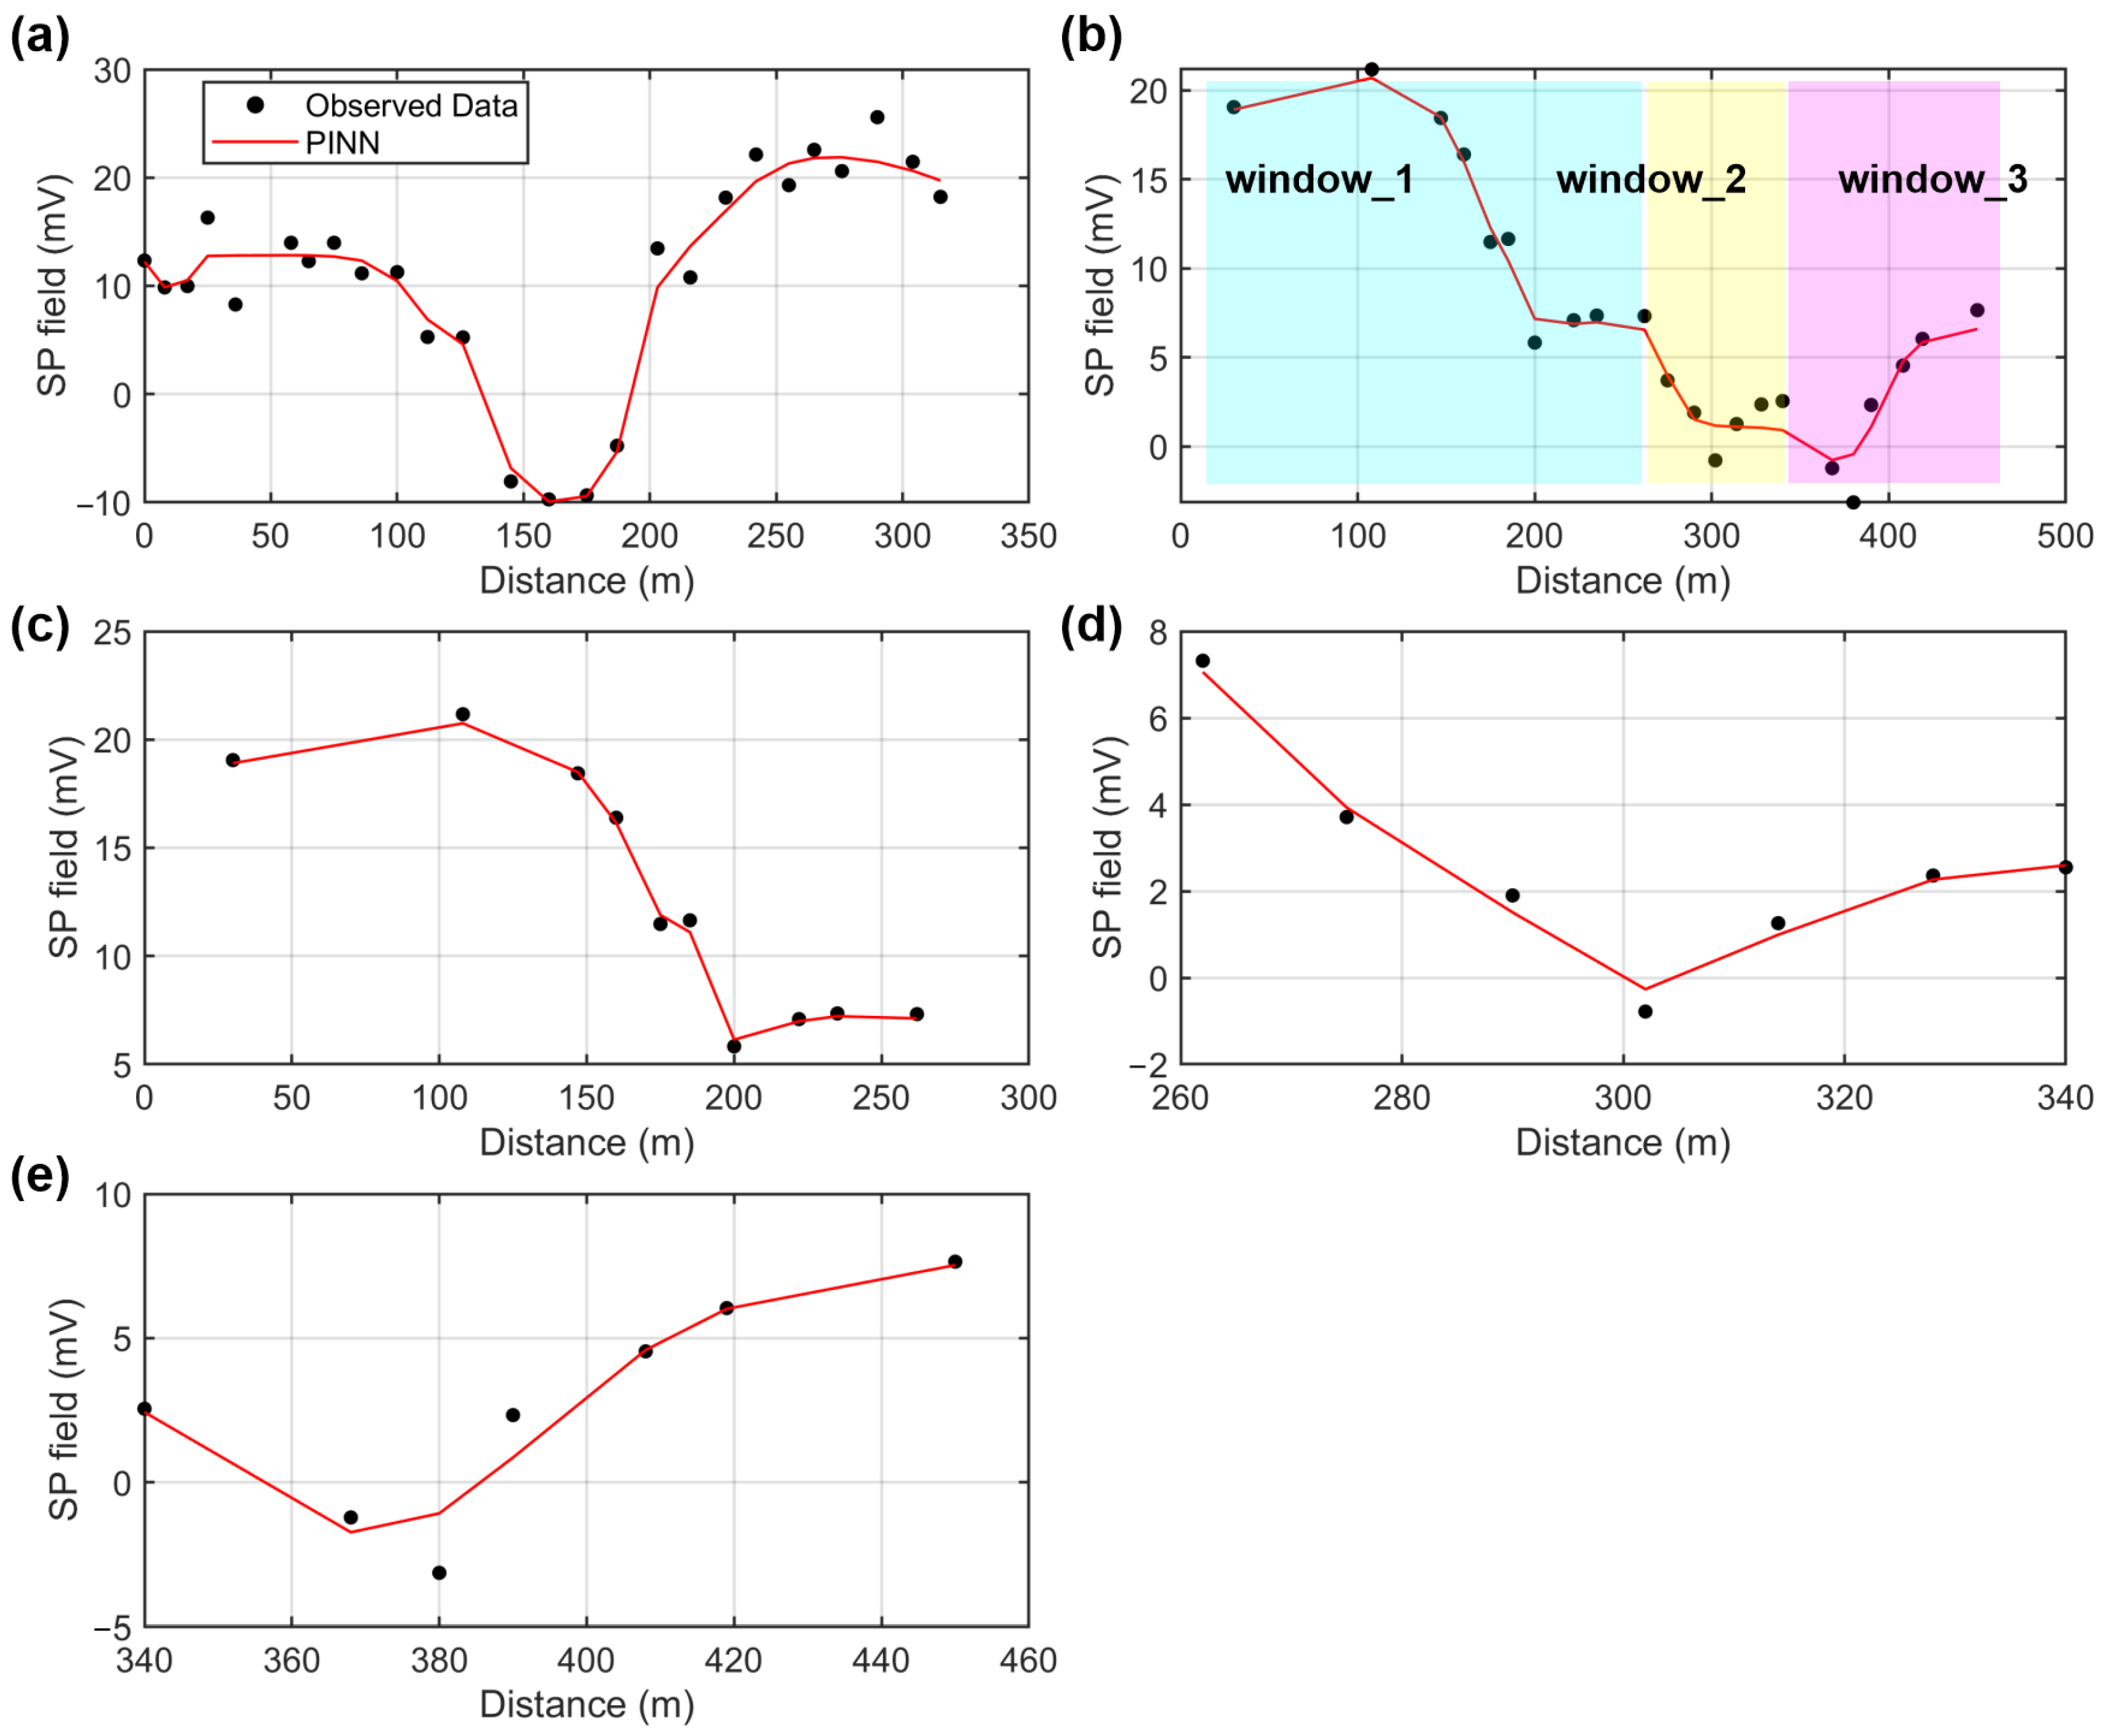
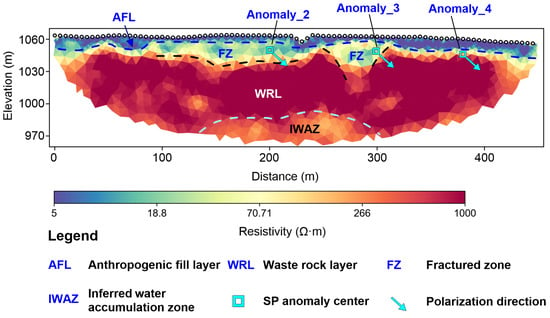
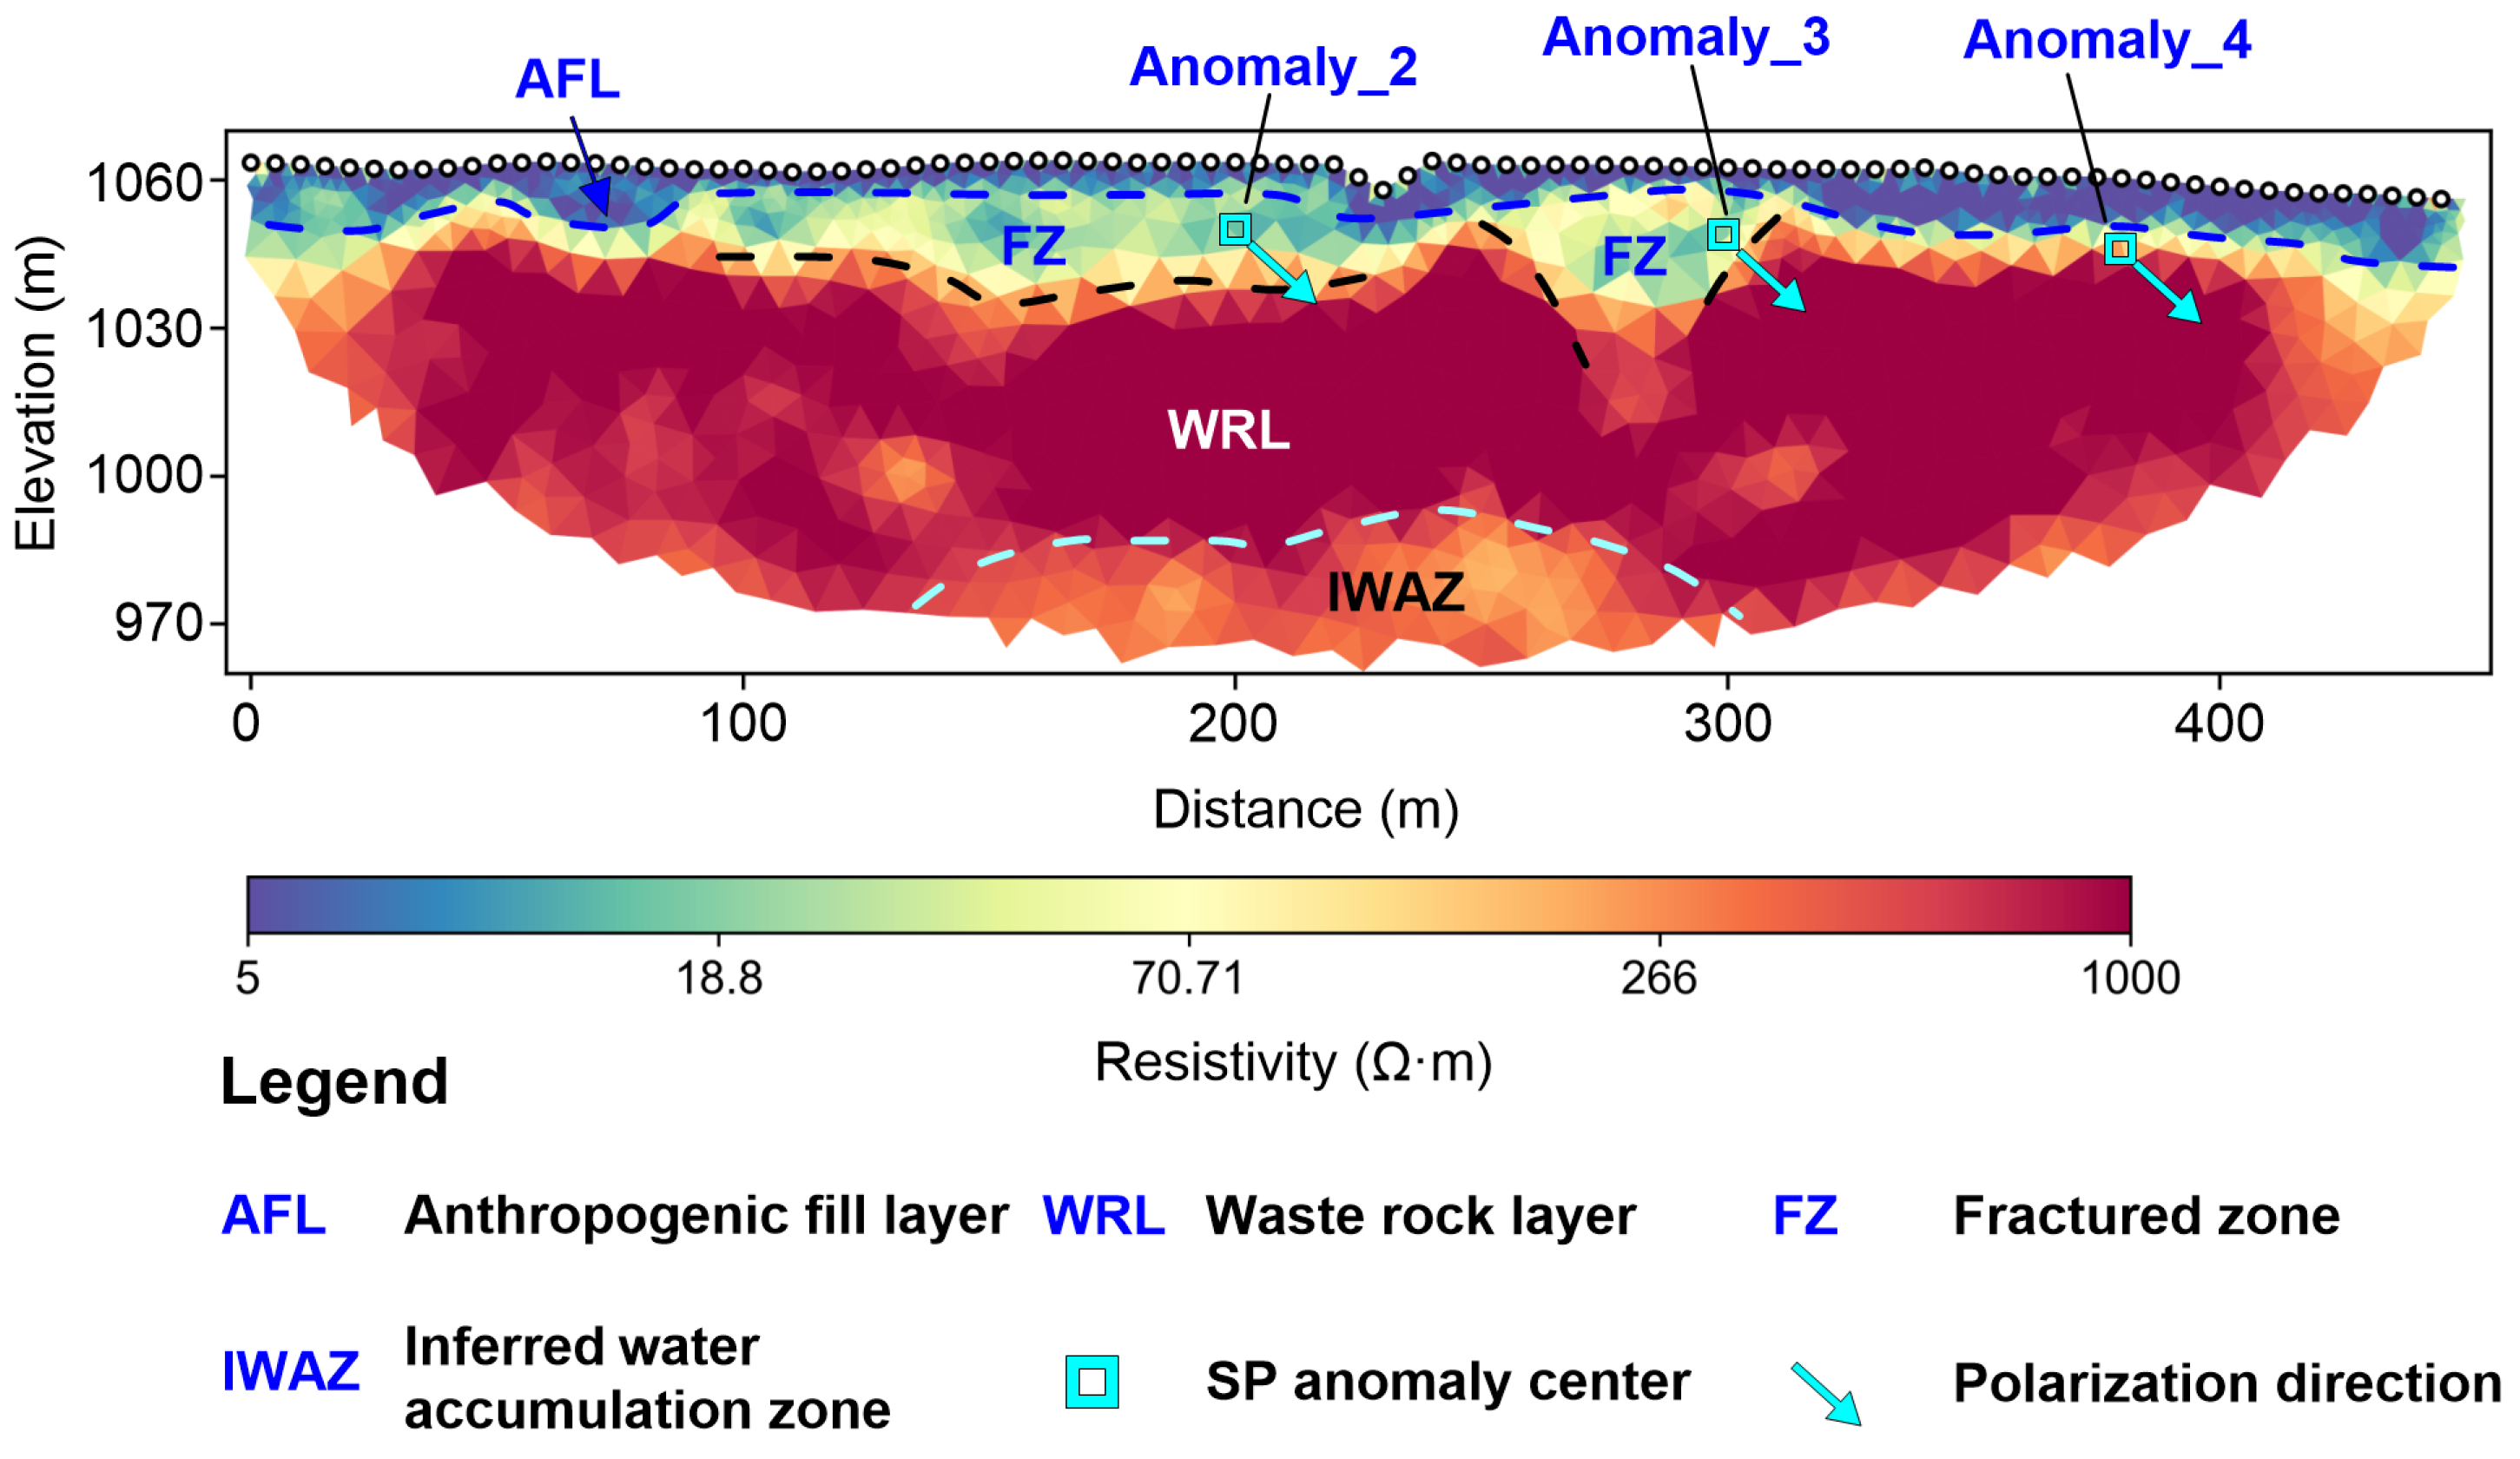
Figure 7a displays the inversion fit for SP_Line_1, which matches the observed data well with a root mean square (RMS) error of 1.59 mV. This potential curve agrees with the SP anomaly pattern induced by downward unsaturated seepage [40]. The inverted polarization angle is 61.7°, indicating dominant vertical infiltration. In contrast, the potential curve of SP_Line_2 on the 1060 m bench shows a complex triple-peak anomaly profile (Figure 7b) caused by multiple adjacent seepage sources. To decouple these sources, the profile was partitioned into three spatial windows (windows 1–3) for simultaneous fitting (Figure 7c–e). The partitioning of windows 1–3 on SP_Line_2 was based on two criteria. First, the first horizontal derivative of the SP curve approaches zero at each of the three prominent extrema, confirming they are well-defined, independent peaks rather than mutual interference artifacts. Second, in conventional 1D SP interpretation, a single distinct extremum uniquely signifies an individual anomaly center. Since these three peaks are separated by clear horizontal distances along the profile, they naturally correspond to three discrete subsurface seepage sources. The inverted polarization angles for the three anomaly centers (located at horizontal coordinates of 200 m, 302 m, and 380 m) are consistently around 42° (Table 3). Projecting the source positions and polarization vectors onto the 2D ERT profile (Figure 8) clarifies the hydrogeological mechanism: the infiltrated water migrates within the FZ layer and is influenced by the basal interface of the AFL, reflecting lateral seepage that propagates southwestward (i.e., toward the central axis of the waste dump) along the interface boundary.
Figure 7.
Profile fitting results for SP_Line_1 and SP_Line_2: (a) fitting result for SP_Line_1 profile; (b) schematic of spatial window partitioning for SP_Line_2 profile; (c–e) individual fitting results for three partitioned windows.
Table 3.
Statistical summary of inverted model parameters for SP profiles.
Figure 8.
Two-dimensional resistivity profile of ERT_Line_3 overlaid with SP_Line_2 inversion results.
4. Discussion
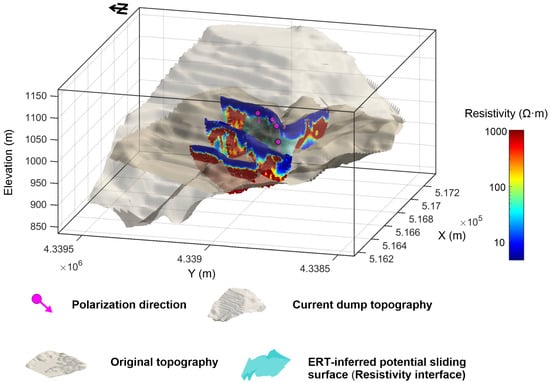
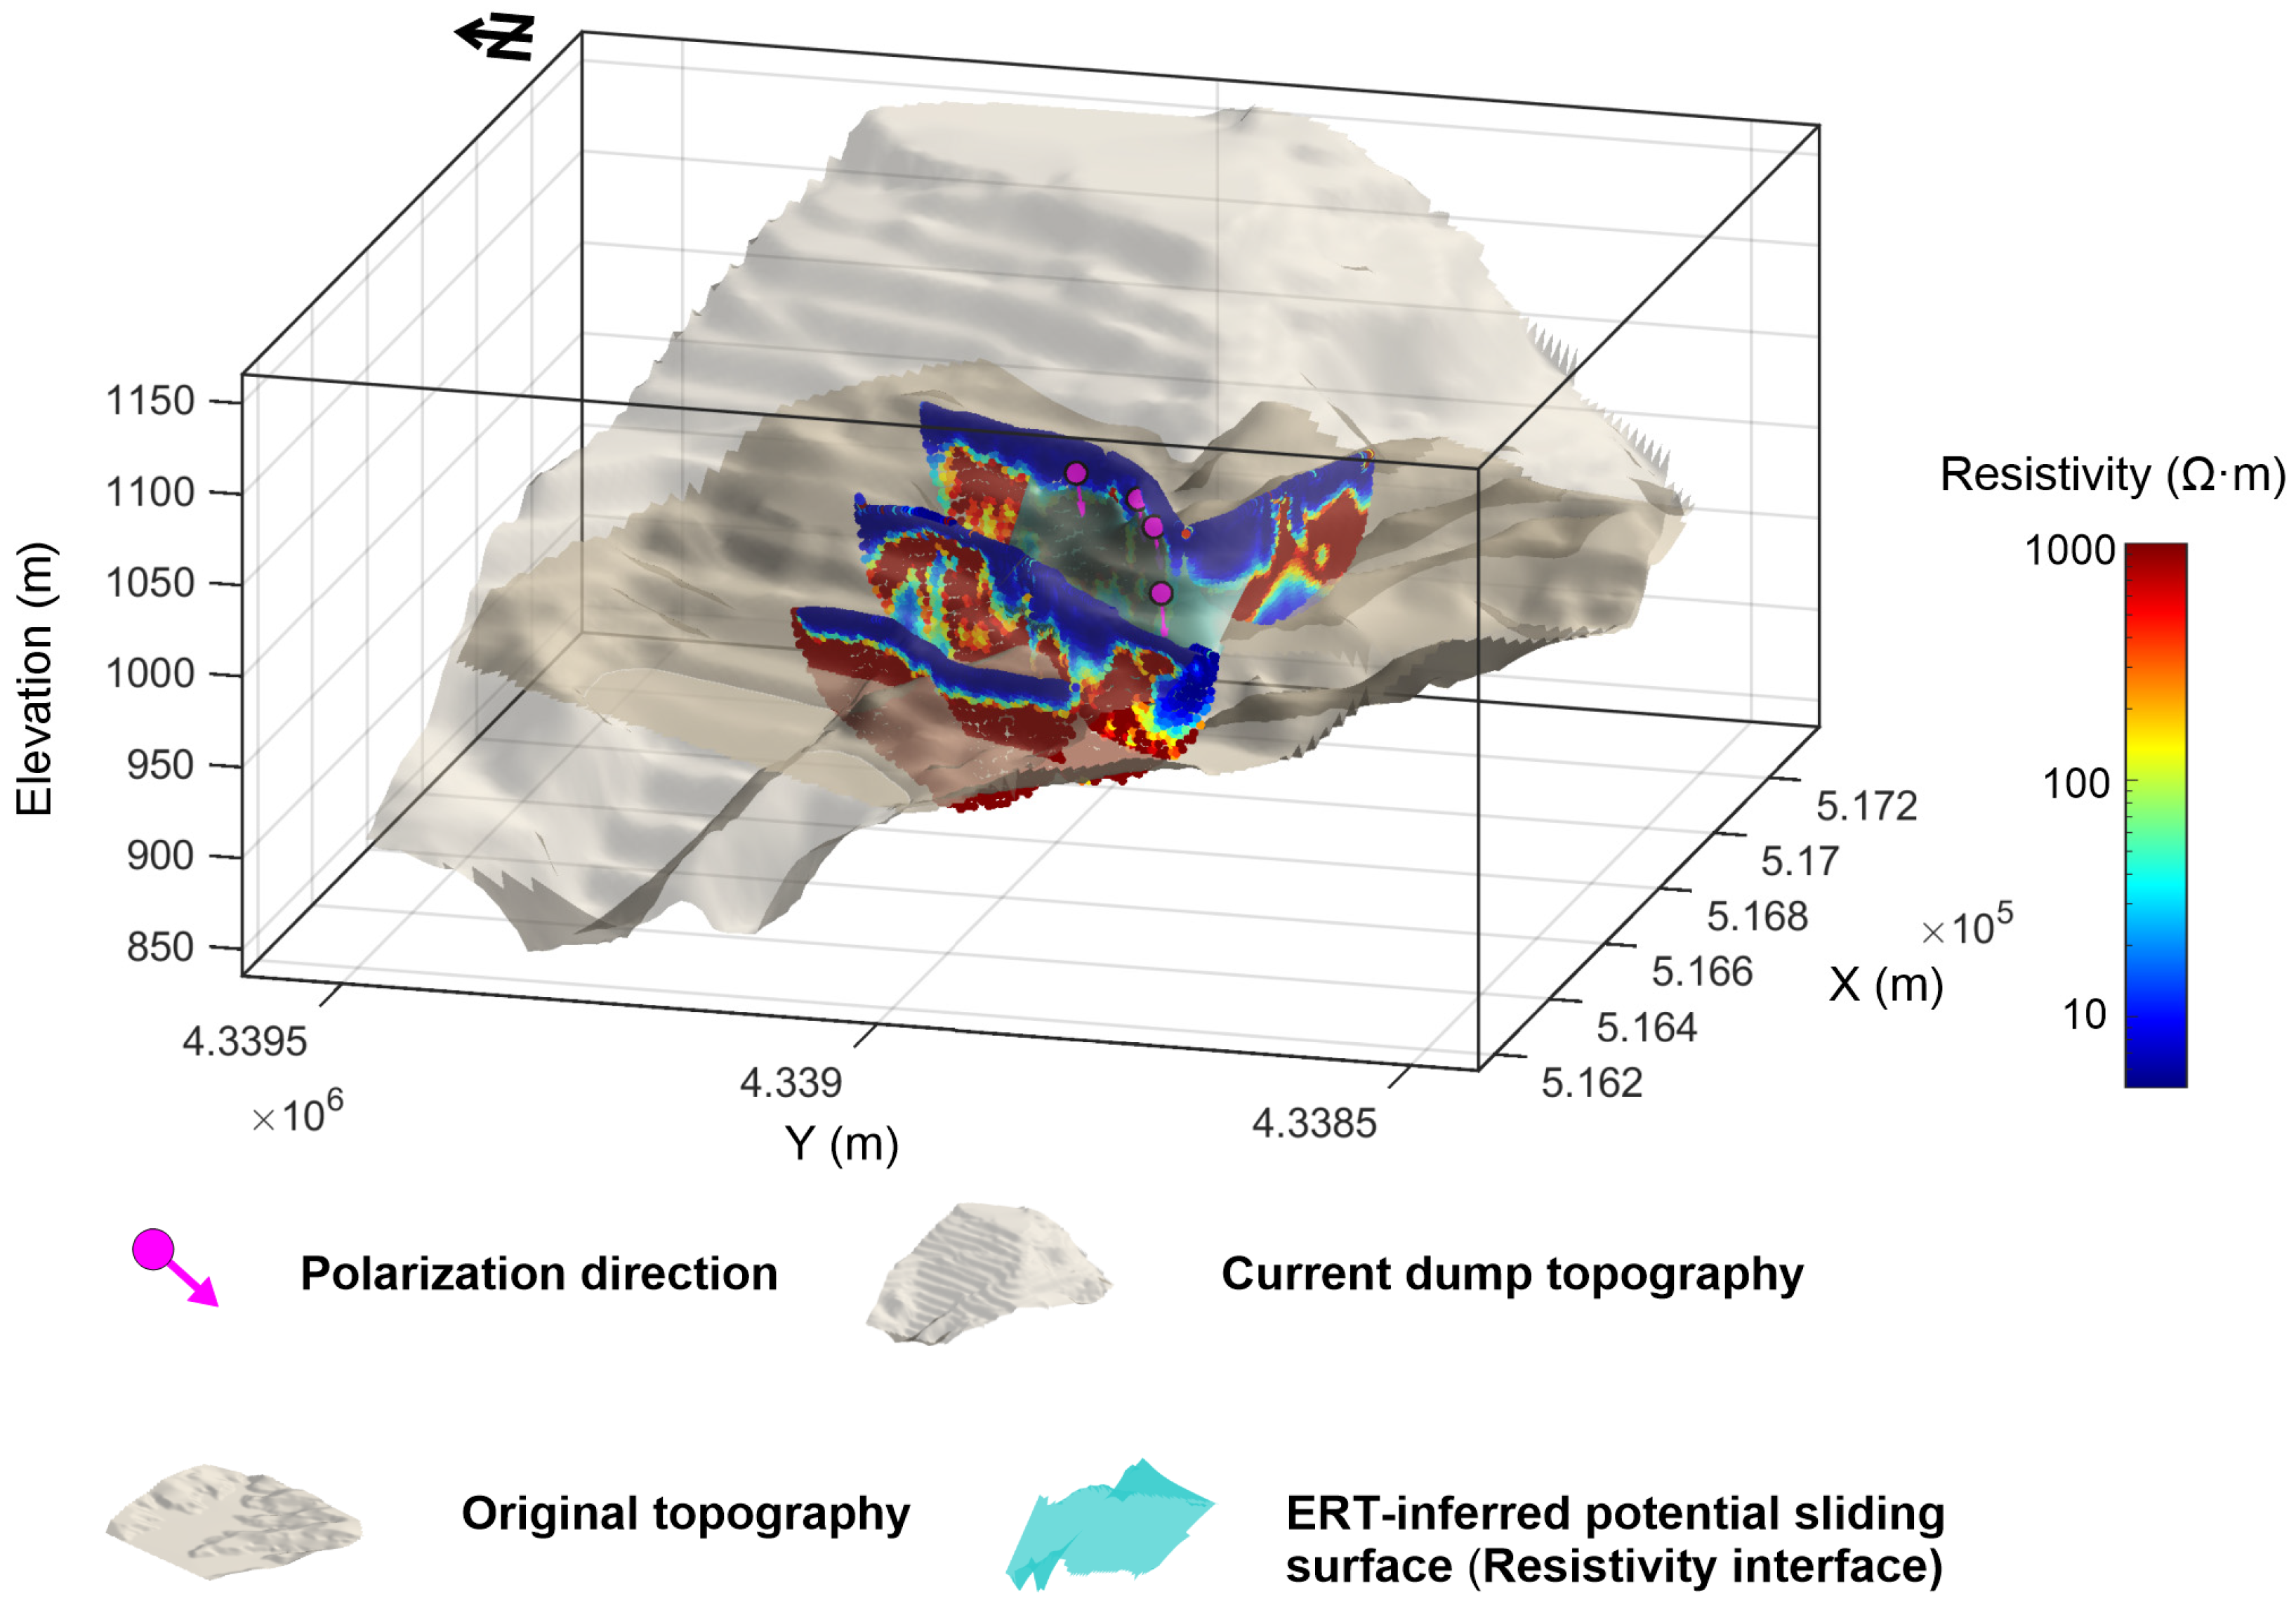
Integrated multi-parameter geophysical analysis effectively mitigates the non-uniqueness inherent in single-method interpretations. In this study, hazardous terrain constrained the survey lines to transverse bench profiles, rather than aligning with the downslope dip. While this configuration limits the continuous mapping of the basal contact interface, we bridged this spatial gap through a 3D digital elevation surface reconstruction that integrates the multi-method results (Figure 9). The reconstructed geoelectrical interfaces beneath the 1040 m and 1060 m benches exhibit distinct spatial undulations with significant geological implications:
Figure 9.
Three-dimensional spatial visualization of the internal structure and preferential seepage directions within the waste dump.
- (1)
- Inferred basal boundary of the sliding mass (cyan surface, Figure 9). This undulating interface marks the lower termination boundary of the surficial fractured zone (FZ). The overlying domain is inferred as the active sliding mass, which has undergone mechanical fragmentation and structural loosening induced by slope displacement. Conversely, the domain beneath the interface exhibits a relatively continuous geoelectrical sequence, representing the stable WRL unaffected by large-scale shear failure. Consequently, in the absence of direct borehole verification, this resistivity interface can be tentatively inferred as the potential shallow sliding surface of the sliding mass.
- (2)
- This spatial overlay relationship demonstrates that the shallow resistivity interface (inferred as the basal boundary of the sliding mass) is not the definitive aquiclude. Instead, it acts as a critical transition zone regulating shallow lateral water migration and subsequent deep infiltration. Driven by erosion and cracking within the AFL, meteoric precipitation rapidly infiltrates vertically along fractures. Upon reaching the vicinity of this resistivity interface, the downward water flux is deflected by the geometry of the AFL’s basal boundary into preferred lateral flow at an angle of approximately 42°, converging toward the central axis of the waste dump. This fluid then drains into deeper strata along preferred zones at the axis, marked by a steeper infiltration angle of 61.7° beneath the 1040 m bench. Lacking deep horizontal drainage, the water pools in the underlying WRL, forming the low-resistivity IWAZs jointly validated by ERT and SNMR. Although located beneath the inferred resistivity interface, the IWAZ poses a long-term threat to overlying slope stability through three distinct mechanisms. First, elevated pore pressure within the IWAZs can dissipate upward through material pores, reducing the effective stress along the sliding surface. Second, long-term immersion induces slaking and softening of the coal gangue, degrading the shear strength of the stable WRL and prompting the shear failure plane to propagate downward. Furthermore, deep water accumulation hinders the downward infiltration from the FZ, exacerbating upper slope instability. Consequently, future drainage works should combine backfilling AFL fractures with deep zone drainage to reduce pore pressure and prevent further landslides.
It must be emphasized that the single-point 1D SNMR sounding conducted in this study was not intended to characterize the macro-scale hydrological features of the entire 3D heterogeneous waste dump. Rather, this localized quantitative tool, combined with 2D ERT profiling, was implemented specifically to diagnose the underlying physical causes of the relative low-resistivity anomaly. In joint interpretation, because the SNMR is susceptible to environmental electromagnetic interference and non-uniqueness, using ERT results as prior stratigraphic constraints improves the reliability of estimated water content. A weak regularization constraint within the QTI inversion ensures that the results remain driven by raw data fitting, avoiding over-assimilation by the prior structural model. The minor discrepancy in estimated water-bearing depths between unconstrained and constrained inversions demonstrates that introducing the geoelectrical interface successfully rectifies depth offsets from direct inversion. Note that due to unsaturated zone complexity and terrain-induced loop distortion, the empirical hydraulic conductivity remains semi-quantitative. Due to the instrument dead time, the inverted relaxation times do not capture the fast-decaying bound water within the coal gangue micro-pores. Instead, induced by settlement, the resolved 140–160 ms relaxation range reflect free water accumulated within the internal fracture networks. Furthermore, the single relaxation time assumption implemented in the QTI inversion serves as an effective parameterization scheme tailored to the field datasets. Although the dump medium exhibits heterogeneity, multi-exponential relaxation decomposition is a highly ill-posed problem, readily magnifying the impact of noise.
The localized unsaturated seepage anomalies were inverted using an equivalent vertical cylinder (VC) model. In reality, preferential flow paths within the loose anthropogenic dump matrix form complex, irregular three-dimensional fracture networks. Collapsing this 3D networked system into a simplified equivalent line or cylindrical source introduces specific smoothing effects that influence the interpretation of the inverted parameters. Specifically, the inverted polarization angles do not reflect the micro-scale tortuosity of individual cracks; instead, they represent the macroscopically dominant direction—effectively the vector sum—of the bulk fluid migration within the axial region. Regarding source depth, the VC inversion resolves the geometric centroid (center of mass) of the streaming potential charge accumulation. Despite these simplifications, the equivalent VC model still holds significant reference value for targeted drainage design.
5. Conclusions
- (1)
- Integrating digital elevation surfaces with 2D resistivity profiles precisely delineates the primary internal geoelectrical interface of the waste dump. This interface separates the overlying active sliding mass from the underlying stable, continuous coal gangue layer. Without borehole verification, it can be tentatively interpreted as the potential sliding surface, and hydrodynamically as a lateral diversion plane regulating shallow water convergence toward the central axis.
- (2)
- SNMR soundings quantitatively reveal a two-layer water-bearing structure at the specific sounding sites: a shallow zone (8–17 m depth) corresponding to vertical infiltration along surficial fractures, and a deep primary water-bearing zone (45–80 m depth) exhibiting a peak volumetric water content of 6.7% at 63 m. These results closely match the ERT low-resistivity anomaly, confirming the IWAZ.
- (3)
- SP inversions quantitatively delineate the complete water migration process: surficial fracture infiltration, lateral deflection along the shallow interface, and centralized deep vertical seepage. Polarization angles around 42° on the 1060 m bench indicate that meteoric water is deflected by the resistivity interface into lateral flow toward the central axis. This fluid subsequently drains into deeper strata through a steep vertical infiltration zone ( = 61.7°) beneath the 1040 m bench axis.
- (4)
- Based on the identified seepage pathways, a potential engineering direction is suggested to mitigate risks. First, surface fractures on upper benches could be sealed to limit infiltration at the source. Second, subsurface drainage tunnels or horizontal boreholes might be considered along the lateral diversion plane and the 1040 m bench axis. These measures would effectively reduce internal pore water pressure, supporting long-term slope stability.
Author Contributions
Conceptualization, K.L. (Kaitian Li), H.Q., H.L. and K.L. (Kai Lu); Methodology, K.L. (Kaitian Li), H.L., and K.L. (Kai Lu); Software, K.L. (Kaitian Li), H.Q. and K.L. (Kai Lu); Validation, K.L. (Kaitian Li), Y.L. and W.L.; Investigation, K.L. (Kaitian Li), H.Q., K.L. (Kai Lu), R.J., W.L. and Y.W.; Writing—Original Draft Preparation, K.L. (Kaitian Li) and H.Q.; Writing—Review & Editing, H.L., H.Q., K.L. (Kai Lu), Y.L., R.J., W.L. and Y.W.; Project administration, K.L. (Kaitian Li), H.L. and H.Q.; Funding acquisition, K.L. (Kaitian Li), H.Q. and H.L. All authors have read and agreed to the published version of the manuscript.
Funding
This research was jointly supported by the National Natural Science Foundation of China (Grant No. 52574247), China Postdoctoral Science Foundation—CCTEG Joint Support Program (Grant No. 2025T024ZGMK), and the Science and Technology Development Foundation of the China Coal Research Institute (Grant Nos. 2025QN-08, 2025ZDI-08, and 2024ZDI-06).
Data Availability Statement
Data available on request from the corresponding author.
Conflicts of Interest
Authors Kaitian Li, Hao Qiu, Hongjie Li, Yuguang Lian, Ruo Jia, Wen Li and Yue Wang were employed by China Coal Research Institute, which had no input in the research processes or results presented. All other authors declare no conflict of interest.
References
- Ding, Y.; Liu, X.; Tian, J.; Yan, S.; Lin, L.; Ma, H. Surface Deformation Monitoring and Analysis of the Bayan Obo Rare Earth Mining Area Using Dual-Ascending SBAS-InSAR Data Fusion. Geosciences 2026, 16, 121. [Google Scholar] [CrossRef] [Scilit]
- Gao, C.; Ye, W.-M.; Lu, P.-H.; Liu, Z.-R.; Wang, Q.; Chen, Y.-G. An Infiltration Model for Inclined Covers with Consideration of Capillary Barrier Effect. Eng. Geol. 2023, 326, 107318. [Google Scholar] [CrossRef] [Scilit]
- Supandi. The Influence of Water Balance for Slope Stability on the High Mine Waste Dump. Geotech. Geol. Eng. 2021, 39, 5253–5266. [Google Scholar] [CrossRef] [Scilit]
- Cho, Y.-C.; Song, Y.-S. Deformation Measurements and a Stability Analysis of the Slope at a Coal Mine Waste Dump. Ecol. Eng. 2014, 68, 189–199. [Google Scholar] [CrossRef] [Scilit]
- Lu, K.; Li, F.; Pan, J.; Li, K.; Li, Z.; Wang, P. Structural Characterization and Attempted Displacement Interpretation of the Baishuihe Landslide Using Integrated Geophysical Methods. Eng. Geol. 2024, 336, 107568. [Google Scholar] [CrossRef] [Scilit]
- Sujitapan, C.; Kendall, J.M.; Chambers, J.E.; Yordkayhun, S. Landslide Ground Model Development through Integrated Geoelectrical and Seismic Imaging in Thungsong District, Nakhon Si Thammarat, Thailand. J. Asian Earth Sci. X 2023, 10, 100168. [Google Scholar] [CrossRef] [Scilit]
- Glazunov, V.V.; Burlutsky, S.B.; Shuvalova, R.A.; Zhdanov, S.V. Improving the reliability of 3D modelling of a landslide slope based on engineering geophysics data. J. Min. Inst. 2022, 257, 771–782. [Google Scholar] [CrossRef] [Scilit]
- Chen, Q.; Zhang, S.; Chang, S.; Liu, B.; Liu, J.; Long, J. Geophysical Interpretation of a Subsurface Landslide in the Southern Qinshui Basin. J. Environ. Eng. Geophys. 2019, 24, 433–449. [Google Scholar] [CrossRef] [Scilit]
- He, K.; Yuan, Y.; Sheng, Y.; Li, H. Integrated Geophysical Hydrogeological Characterization of Fault Systems in Sandstone-Hosted Uranium In Situ Leaching: A Case Study of the K1b2 Ore Horizon, Bayin Gobi Basin. Processes 2025, 13, 3313. [Google Scholar] [CrossRef] [Scilit]
- Yang, Y.; Zhan, J.; Zhuang, J.; Zhu, W.; Peng, J. Space-Air-Ground-Interior Integrated Framework for Mapping Loess Landslide Fissures: A Case Study in the Heifangtai Terrace, Northwest China. Bull. Eng. Geol. Environ. 2025, 84, 459. [Google Scholar] [CrossRef] [Scilit]
- Sun, X.; Zhang, C.; Pan, J.; Chen, K.; Wang, T.; Li, Y.; Zhang, C.; Xiong, Y. Geophysical Evidence of Water Pollution Treatment Effectiveness in Karst Areas: A Case Study in Guizhou, China. J. Geophys. Eng. 2026, 23, 407–418. [Google Scholar] [CrossRef] [Scilit]
- Li, K.; Yan, J.; Li, F.; Lu, K.; Yu, Y.; Li, Y.; Zhang, L.; Wang, P.; Li, Z.; Yang, Y.; et al. Non-Invasive Geophysical Methods for Monitoring the Shallow Aquifer Based on Time-Lapse Electrical Resistivity Tomography, Magnetic Resonance Sounding, and Spontaneous Potential Methods. Sci. Rep. 2024, 14, 7320. [Google Scholar] [CrossRef] [Scilit] [PubMed]
- Li, J.; Wu, C.; Bai, H. Three-Dimensional Stability Analysis of Slopes under Complex Terrain from FLAC3D and Electrical Resistivity Tomography. J. Appl. Geophys. 2025, 241, 105861. [Google Scholar] [CrossRef] [Scilit]
- Watlet, A.; Wilkinson, P.; Whiteley, J.; White, A.; Uhlemann, S.; Swift, R.; Ouellet, S.; Minto, C.; Meldrum, P.; Jones, L.; et al. High-Resolution Geophysical Monitoring of Moisture Accumulation Preceding Slope Movement—A Path to Improved Early Warning. Environ. Res. Lett. 2024, 19, 124059. [Google Scholar] [CrossRef] [Scilit]
- Khan, M.A.; Basharat, M.; Riaz, M.T.; Sarfraz, Y.; Farooq, M.; Khan, A.Y.; Pham, Q.B.; Ahmed, K.S.; Shahzad, A. An Integrated Geotechnical and Geophysical Investigation of a Catastrophic Landslide in the Northeast Himalayas of Pakistan. Geol. J. 2021, 56, 4760–4778. [Google Scholar] [CrossRef] [Scilit]
- Legchenko, A.V.; Shushakov, O.A. Inversion of Surface NMR Data. Geophysics 1998, 63, 75–84. [Google Scholar] [CrossRef] [Scilit]
- Legchenko, A.; Valla, P. A Review of the Basic Principles for Proton Magnetic Resonance Sounding Measurements. J. Appl. Geophys. 2002, 50, 3–19. [Google Scholar] [CrossRef] [Scilit]
- Gabriel, L.; Hertrich, M.; Ogier, C.; Müller-Petke, M.; Moser, R.; Maurer, H.; Farinotti, D. Surface Nuclear Magnetic Resonance for Studying an Englacial Channel on Rhonegletscher (Switzerland): Possibilities and Limitations in a High-Noise Environment. Cryosphere 2025, 19, 6261–6281. [Google Scholar] [CrossRef] [Scilit]
- Griffiths, M.P.; Zamora Luria, J.C.; Tcheheumeni Djanni, A.L.; McLachlan, P.; Grombacher, D. Mapping Freshwater Lenses with TEM and SNMR: Case Studies from Saloum Region, Senegal. Geophysics 2026, 91, B25–B34. [Google Scholar] [CrossRef] [Scilit]
- Ikard, S.J.; Carroll, K.C.; Rucker, D.F.; Adams, R.F.; Brooks, S.C. Geoelectric Characterization of Hyporheic Exchange Flow in the Bedrock-Lined Streambed of East Fork Poplar Creek, Oak Ridge, Tennessee. Geophys. Res. Lett. 2023, 50, e2022GL102616. [Google Scholar] [CrossRef] [Scilit]
- Revil, A.; Finizola, A.; Gresse, M. Self-Potential as a Tool to Assess Groundwater Flow in Hydrothermal Systems: A Review. J. Volcanol. Geotherm. Res. 2023, 437, 107788. [Google Scholar] [CrossRef] [Scilit]
- Butler, S.L. Spontaneous Potential Surveys in Surface Fresh Waters for Engineering and Environmental Applications. Geophys. J. Int. 2025, 242, ggaf278. [Google Scholar] [CrossRef] [Scilit]
- Guo, Y.; Cui, Y.; Xie, J.; Luo, Y.; Zhang, P.; Liu, H.; Liu, J. Seepage Detection in Earth-Filled Dam from Self-Potential and Electrical Resistivity Tomography. Eng. Geol. 2022, 306, 106750. [Google Scholar] [CrossRef] [Scilit]
- Khalil, M.A.; Hallum, D.R.; Joeckel, R.M.; Krondak, M. Integrated 2D Time-Lapse Resistivity Tomography and Spontaneous Potential Surveys Demonstrate Seasonal, Use-Related Patterns of Seepage from a Water-Supply Canal System. J. Appl. Geophys. 2025, 238, 105708. [Google Scholar] [CrossRef] [Scilit]
- Hasan, M.; Shang, Y. Geophysical Evaluation of Geological Model Uncertainty for Infrastructure Design and Groundwater Assessments. Eng. Geol. 2022, 299, 106560. [Google Scholar] [CrossRef] [Scilit]
- Balasco, M.; Lapenna, V.; Rizzo, E.; Telesca, L. Deep Electrical Resistivity Tomography for Geophysical Investigations: The State of the Art and Future Directions. Geosciences 2022, 12, 438. [Google Scholar] [CrossRef] [Scilit]
- Liao, Y.; Chen, M. Investigating Hidden Disaster Factors in Coal Mines Using UAV: Case Study of Tongxin Coal Mine, Shanxi Province, China. Acta Geophys. 2026, 74, 154. [Google Scholar] [CrossRef] [Scilit]
- Zhang, Y.; Sun, Y.; Yan, Y.; Wang, S.; Ge, L. Research Status, Challenges and Future Perspectives of Geological Hazard Monitoring Methods in Mining Areas. Remote Sens. 2026, 18, 1333. [Google Scholar] [CrossRef] [Scilit]
- Pidlisecky, A.; Haber, E.; Knight, R. RESINVM3D: A 3D Resistivity Inversion Package. Geophysics 2007, 72, H1–H10. [Google Scholar] [CrossRef] [Scilit]
- Ruecker, C.; Guenther, T.; Wagner, F.M. pyGIMLi: An Open-Source Library for Modelling and Inversion in Geophysics. Comput. Geosci. 2017, 109, 106–123. [Google Scholar] [CrossRef] [Scilit]
- Mueller-Petke, M.; Yaramanci, U. QT Inversion—Comprehensive Use of the Complete Surface NMR Data Set. Geophysics 2010, 75, WA199–WA209. [Google Scholar] [CrossRef] [Scilit]
- Hertrich, M. Imaging of Groundwater with Nuclear Magnetic Resonance. Prog. Nucl. Magn. Reson. Spectrosc. 2008, 53, 227–248. [Google Scholar] [CrossRef] [Scilit]
- Jibrin, A.; Helmi, M.E.; Lawal, U.; Abdalrahman, E.; Mahmoud, M. NMR Techniques for Quantifying Gas Adsorption in Porous Media: Principles, Applications, Limitations, and Future Directions. Prog. Nucl. Magn. Reson. Spectrosc. 2026, 154–155, 101599. [Google Scholar] [CrossRef] [Scilit]
- Lu, K.; Hou, E.; Xie, H.; Wang, P.; Li, L.; Li, G.; Lei, F. Magnetic Resonance Sounding Focusing Inversion Method for the Volumetric Water Content and T2* of Weathered Bedrock Aquifers. J. China Coal Soc. 2025. [Google Scholar] [CrossRef]
- Chalikakis, K.; Nielsen, M.R.; Legchenko, A. MRS Applicability for a Study of Glacial Sedimentary Aquifers in Central Jutland, Denmark. J. Appl. Geophys. 2008, 66, 176–187. [Google Scholar] [CrossRef] [Scilit]
- Buczynski, S.; Olichwer, T.; Wcislo, M.; Tarka, R. The Assessment of Hydrogeological Parameters of Aquifer with the Use of Magnetic Resonance in Lower Silesia (Sw Poland). Carpathian J. Earth Environ. Sci. 2017, 12, 121–130. [Google Scholar]
- Bhattacharya, B.; Roy, N. A Note on the Use of a Nomogram for Self-Potential Anomalies. Geophys. Prospect. 1981, 29, 102–107. [Google Scholar] [CrossRef] [Scilit]
- Di Maio, R.; Rani, P.; Piegari, E.; Milano, L. Self-Potential Data Inversion through a Genetic-Price Algorithm. Comput. Geosci. 2016, 94, 86–95. [Google Scholar] [CrossRef] [Scilit]
- Adetokunbo, P.; Eluyemi, A.A.; Ayuk, M.A. Physics-Informed Neural Networks for Simultaneous Multi-Anomaly Inversion of Self-Potential Data. Int. J. Multidiscip. Res. Dev. 2026, 13, 294–299. [Google Scholar]
- Richards, K.; Revil, A.; Jardani, A.; Henderson, F.; Batzle, M.; Haas, A. Pattern of Shallow Ground Water Flow at Mount Princeton Hot Springs, Colorado, Using Geoelectrical Methods. J. Volcanol. Geotherm. Res. 2010, 198, 217–232. [Google Scholar] [CrossRef] [Scilit]

Disclaimer/Publisher’s Note: The statements, opinions and data contained in all publications are solely those of the individual author(s) and contributor(s) and not of MDPI and/or the editor(s). MDPI and/or the editor(s) disclaim responsibility for any injury to people or property resulting from any ideas, methods, instructions or products referred to in the content. |
© 2026 by the authors. Licensee MDPI, Basel, Switzerland. This article is an open access article distributed under the terms and conditions of the Creative Commons Attribution (CC BY) license.