Article

Influence of Dry Density and Salt Content on Hydraulic Conductivity and Drying Shrinkage

1
Xinjiang Architectural Research Institute Co., Ltd., Urumqi 830002, China
2
Xinjiang Key Laboratory of Green Construction and Smart Traffic Control of Transportation Infrastructure, Xinjiang University, Urumqi 830017, China
3
School of Traffic and Transportation Engineering, Xinjiang University, Urumqi 830017, China
4
Department of Civil Engineering and Smart Cities, Shantou University, Shantou 515000, China
*
Author to whom correspondence should be addressed.
Geosciences 2026, 16(6), 242; https://doi.org/10.3390/geosciences16060242
Submission received: 29 April 2026 / Revised: 11 June 2026 / Accepted: 16 June 2026 / Published: 22 June 2026
(This article belongs to the Section Geomechanics)

Abstract

Soil is prone to structural degradation under water infiltration, and the combined effects of dry density and salinity further complicate its hydraulic conductivity and drying shrinkage behavior. However, previous studies have primarily focused on single factors, and the interactive mechanisms between compaction state and salinity remain poorly understood. To investigate the hydraulic conductivity and drying shrinkage behavior of soil under different dry densities and salinity levels, this study examined three dry densities (1.30, 1.35, 1.45 g/cm3) and four NaCl contents (0, 0.5%, 2%, 6%). Saturated hydraulic conductivity (ks) and drying shrinkage were systematically measured. The results indicate that dry density is the primary factor controlling pore structure evolution, ks and drying shrinkage behavior. Increasing dry density markedly reduced porosity (up to 15.95%), ks (by 57.14–92.91%), and drying shrinkage. In contrast, salinity exhibited non-monotonic, density-dependent effects. Salts increased porosity through electrochemical interactions and crystallization-induced pore support, but their effects on ks and drying shrinkage displayed threshold and reversal behavior. These coupled effects demonstrate strong nonlinearity and density dependence, providing a mechanistic basis for compaction optimization and the stability assessment of soil under saline conditions.

1. Introduction

Water infiltration often induces soil softening and collapse, while changes in pore structure and reduced matric suction decrease shear strength, which are key factors contributing to slope instability, surface subsidence, foundation settlement, and environmental degradation [1]. In engineering practices, such as constructing embankments, railway subgrades, earth dams, or compacted clay liners in landfills, soil is typically compacted to reduce interparticle voids and achieve high density [2]. Dry density directly determines the soil’s pore characteristics and water transport capacity, which can significantly influence its hydro-mechanical behavior and structural stability [3]. Therefore, it is necessary to systematically quantify the variations in hydraulic conductivity and drying shrinkage behavior of soil under different dry density conditions, so as to provide a scientific basis for compaction control and stability assessment in engineering applications.
Saline soils are characterized by soluble salt contents exceeding 0.3% and often exhibit detrimental behaviors such as corrosion, collapse, and salt-induced swelling in engineering applications [4]. Depending on the dominant salt type, saline soils can be classified as sulfate, carbonate, or chloride saline soils, commonly distributed in arid, semi-arid, and coastal regions worldwide [5]. Influenced by natural processes (freezing–thawing, evaporation, rainfall) and human activities (irrigation, fertilization), the content and forms of salts in saline soils fluctuate dynamically. These variations can alter soil structure and engineering properties, potentially causing a range of engineering problems [6]. Therefore, it is necessary to investigate the effects of salinity on the hydraulic conductivity and drying shrinkage behavior of saline soils to better evaluate the safety of engineering constructions.
Evidence indicates that increasing dry density is generally accompanied by a reduction in porosity and enhanced particle contact, resulting in a denser soil structure, which improves shear strength and bearing capacity, while altering water migration pathways and reducing both pore water mobility and soil compressibility [7]. In addition, salinity has a significant influence on the physical and mechanical properties of soils. Shen et al. (2023) [5] reported that in NaHCO3-treated soils, when salinity is below 1.5%, interparticle cohesion weakens, macroaggregates become more dispersed, the soil structure loosens, and compressibility increases. When salinity exceeds 1.5%, salts approach saturation and crystallize within interparticle voids, decreasing porosity. The cementation effect of salt crystals enhances interparticle cohesion. However, most previous studies have investigated the effects of either dry density or salinity individually, with limited attention given to their coupled influence on soil hydraulic and shrinkage behavior. Moreover, the interactions among dry density, pore structure evolution, hydraulic conductivity, and drying shrinkage under varying salinity conditions remain insufficiently understood.
This study aims to systematically evaluate the hydraulic conductivity and drying shrinkage characteristics of saline soil under different dry density and salinity conditions. By controlling dry density and salinity levels, the variations in soil porosity, saturated hydraulic conductivity, and drying shrinkage were quantitatively analyzed. The novelty of this work lies in the following: (i) quantifying the coupled influence of dry density and salinity on both hydraulic and deformation responses of saline soil; (ii) establishing the relationships among dry density, salinity, pore structure, and hydraulic conductivity. The results are expected to reveal the underlying mechanisms governing soil stability and hydro-mechanical responses under the combined effects of dry density and salinity, providing a scientific basis for compaction optimization and safety assessment of saline soils in engineering applications.

2. Materials and Methodology

2.1. Materials and Sample Preparation

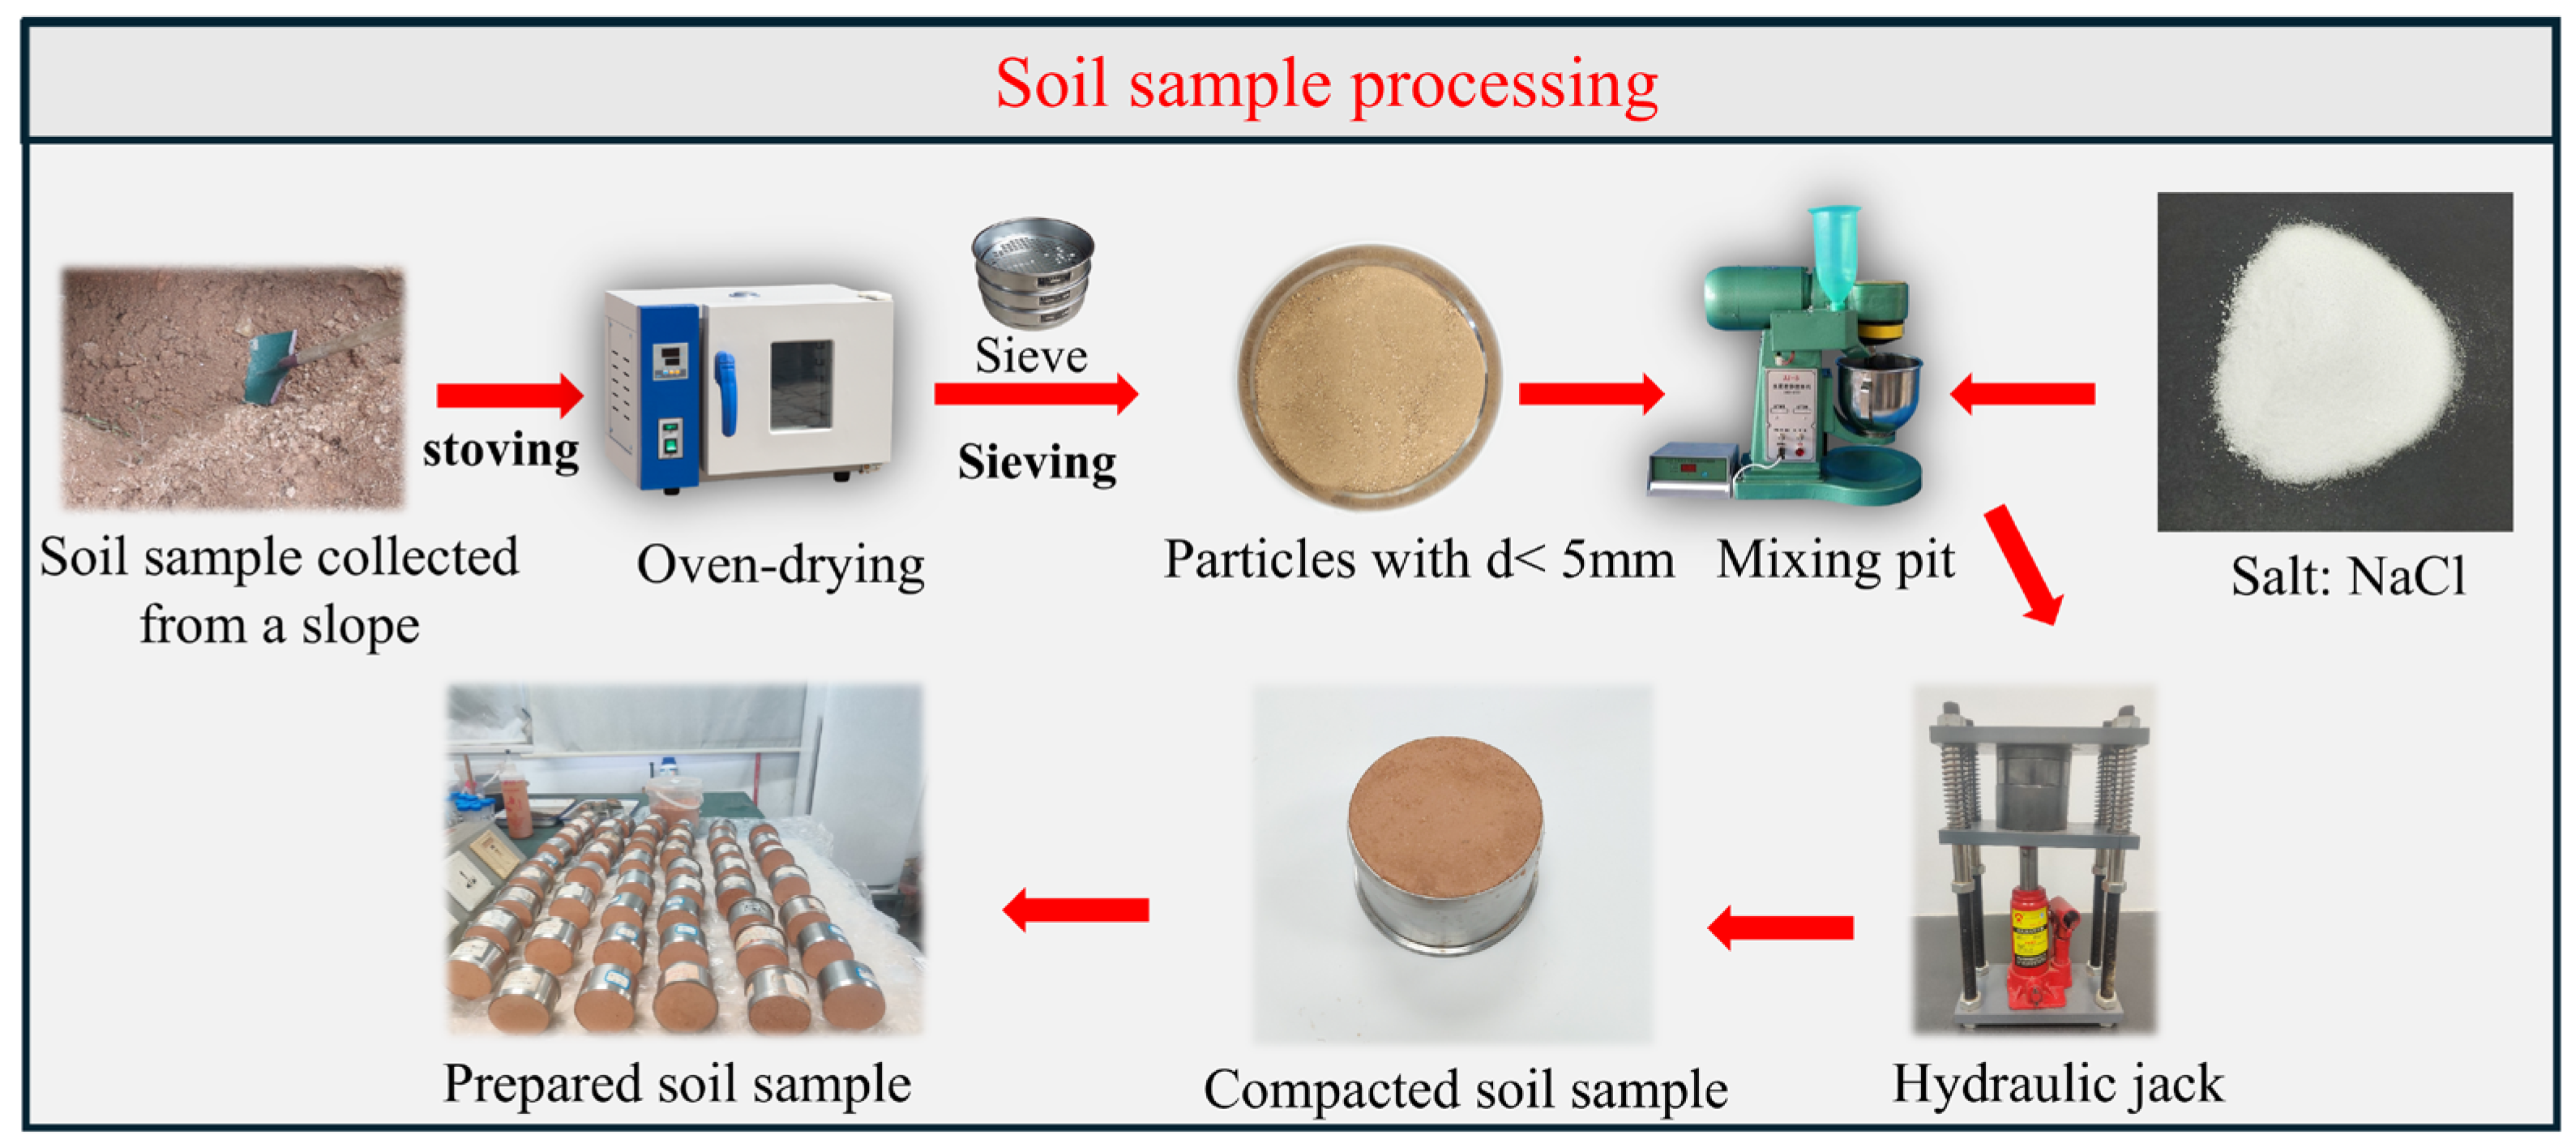
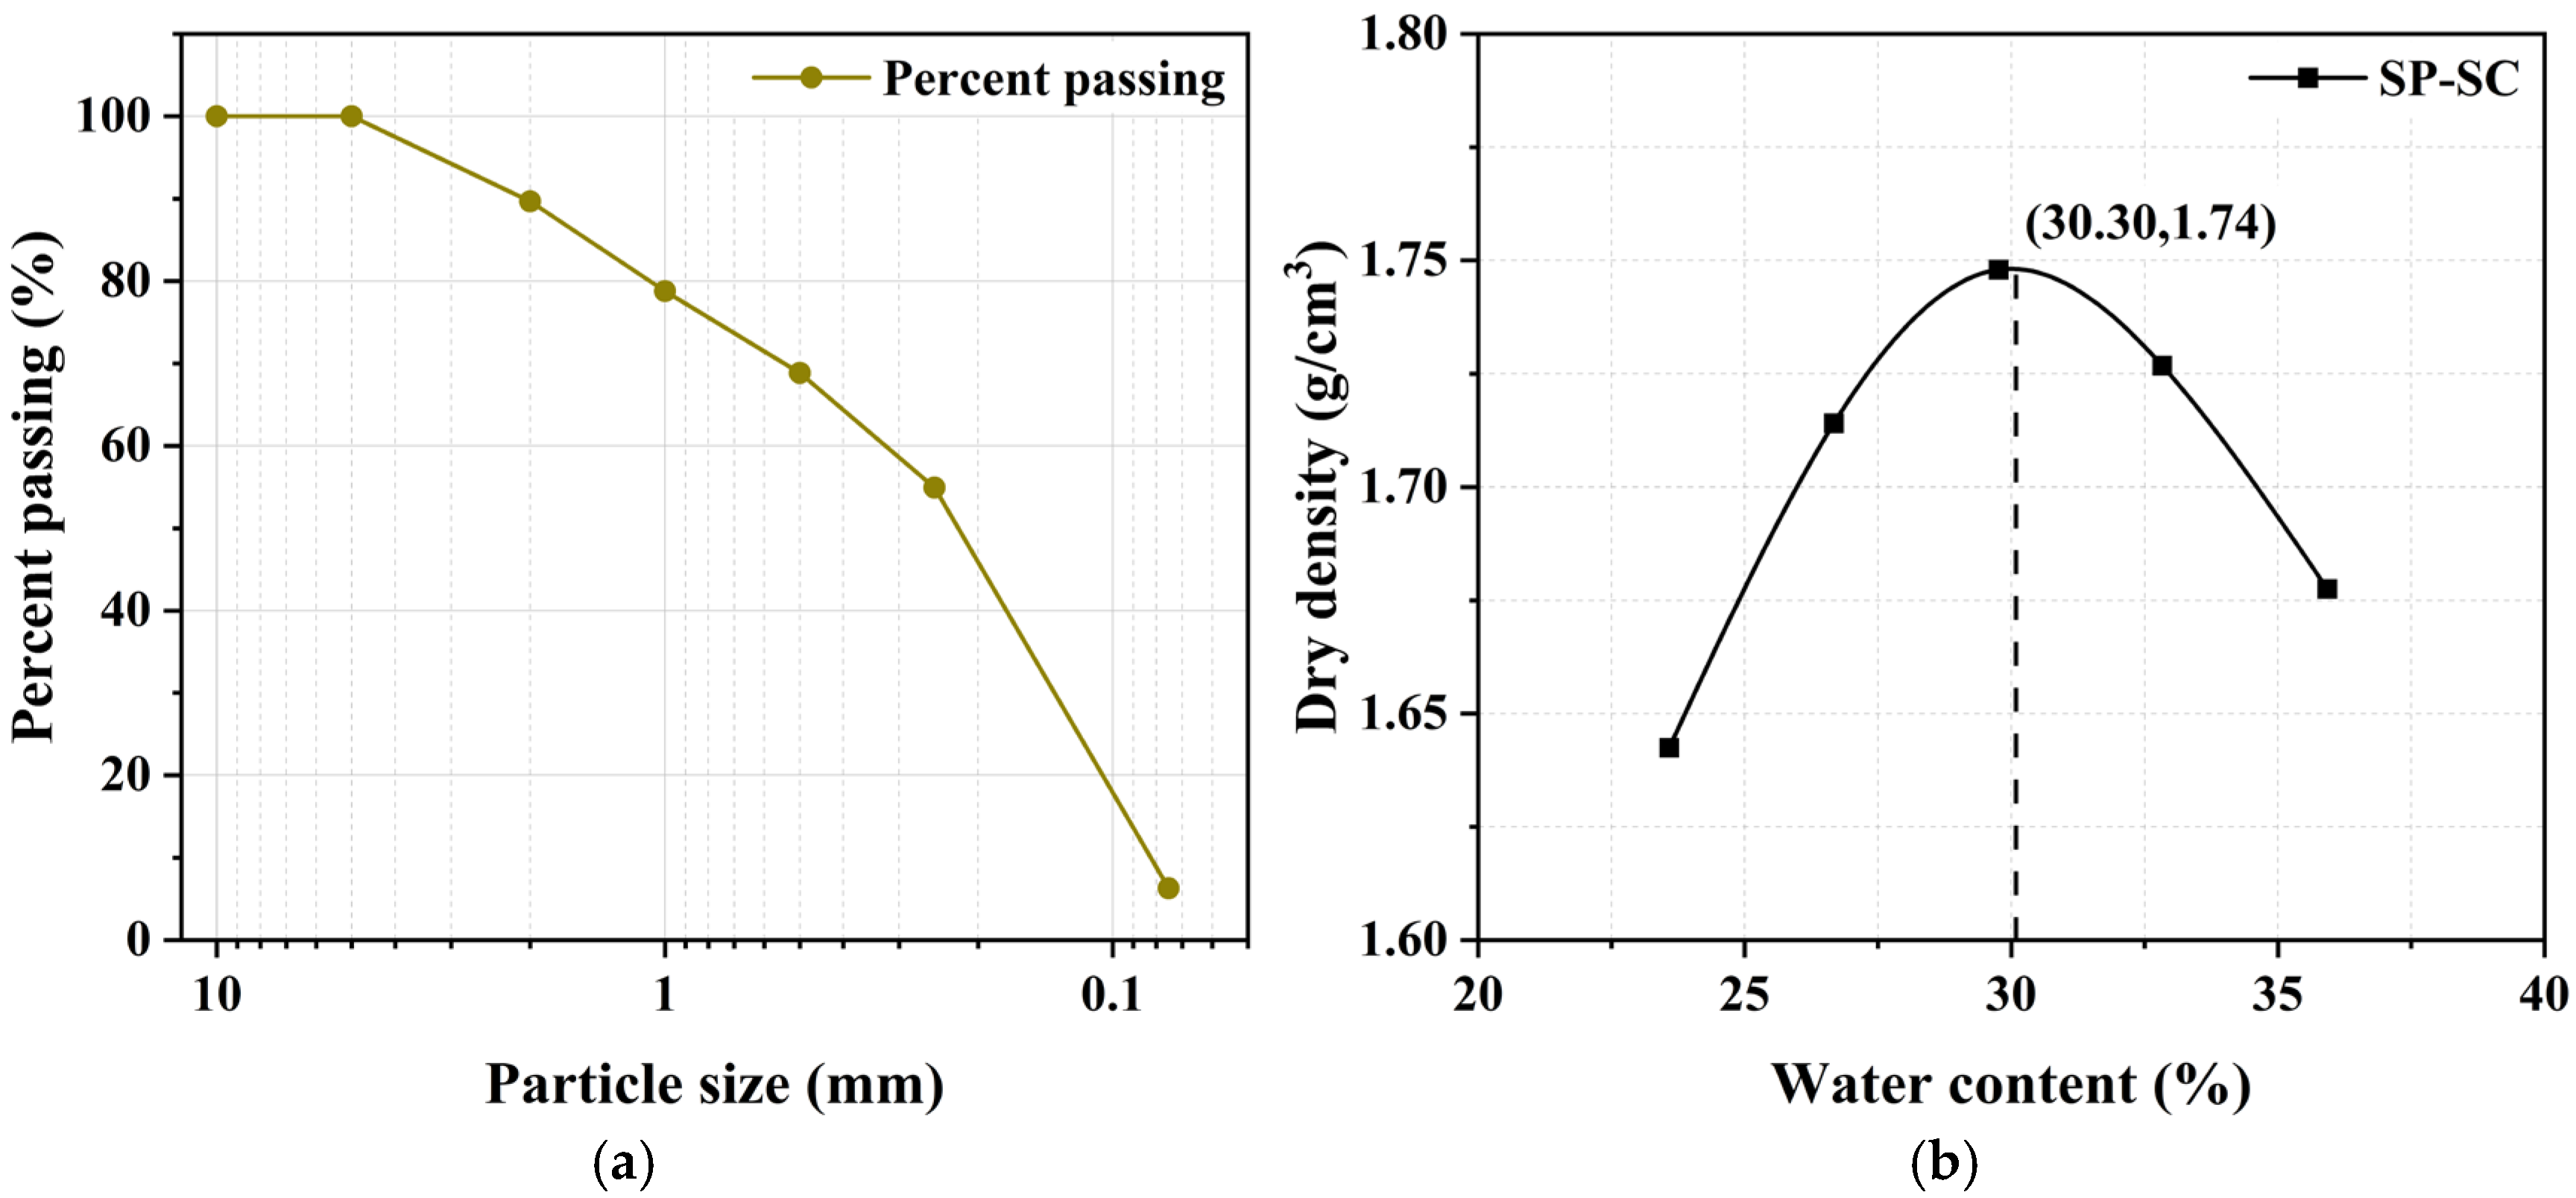
Soil samples were collected from a slope (Figure 1). This soil is common in the Xinjiang Uygur Autonomous Region of China. The collected soils were air-dried for seven days and cleaned of roots, leaves, and other debris. The samples were then oven-dried at 105 °C for 24 h in a forced-air oven (Shenzhen Sanli Technology Co., Ltd., Shenzhen, China) (Figure 1) to ensure consistent sample mass during preparation. The oven-dried soil was passed through a 5 mm standard sieve, and the particle size distribution curve is shown in Figure 2a. According to ASTM D4318–17 (2018) [8], the soil had a liquid limit of 53.50%, a plastic limit of 33.12%, and a plasticity index of 20.38%. The maximum dry density and optimum moisture content were 1.74 g/cm3 and 17.43%, respectively (Figure 2b) [9]. Based on the Unified Soil Classification System (USCS) [10], the soil is classified as Poorly Graded Sand with Clay (SP-SC). The properties of the SP-SC are summarized in Table 1.

2.2. Experimental Setup

Saline–alkali soils are widely distributed in northwestern and coastal regions of China, significantly affecting both agricultural productivity and industrial development. To systematically evaluate the combined effects of salinity and compaction on the hydro-mechanical behavior of SP-SC, NaCl was added to the soil at 0.5%, 2%, and 6% of the dry weight, corresponding to light, moderate, and severe salinity levels, respectively, according to the Technical code for building in saline soil regions (2015) [11]. These salinity levels were selected to represent the typical range of salt contents encountered in natural and engineered saline soils and to capture the potential transition from low- to high-salinity conditions. The dry densities were set to 1.30, 1.35, and 1.45 g/cm3, representing 75%, 78%, and 83% of the maximum dry density, respectively, to simulate soil conditions under different engineering compaction standards [12]. SP-SC and salts were thoroughly mixed using the mixer illustrated in Figure 1. All sample preparation and experimental measurements were conducted under controlled laboratory conditions at a constant temperature of 25 ± 3 °C. To ensure data reliability and reproducibility, each measurement was repeated three times. Repeated tests and the inclusion of error bars in figures allowed for the effective evaluation and control of sample variability, thereby enhancing the statistical robustness of the results. Sample labeling and the detailed experimental design are presented in Table 2.

2.3. Testing Procedure

2.3.1. Saturated Hydraulic Conductivity (Ks) Test

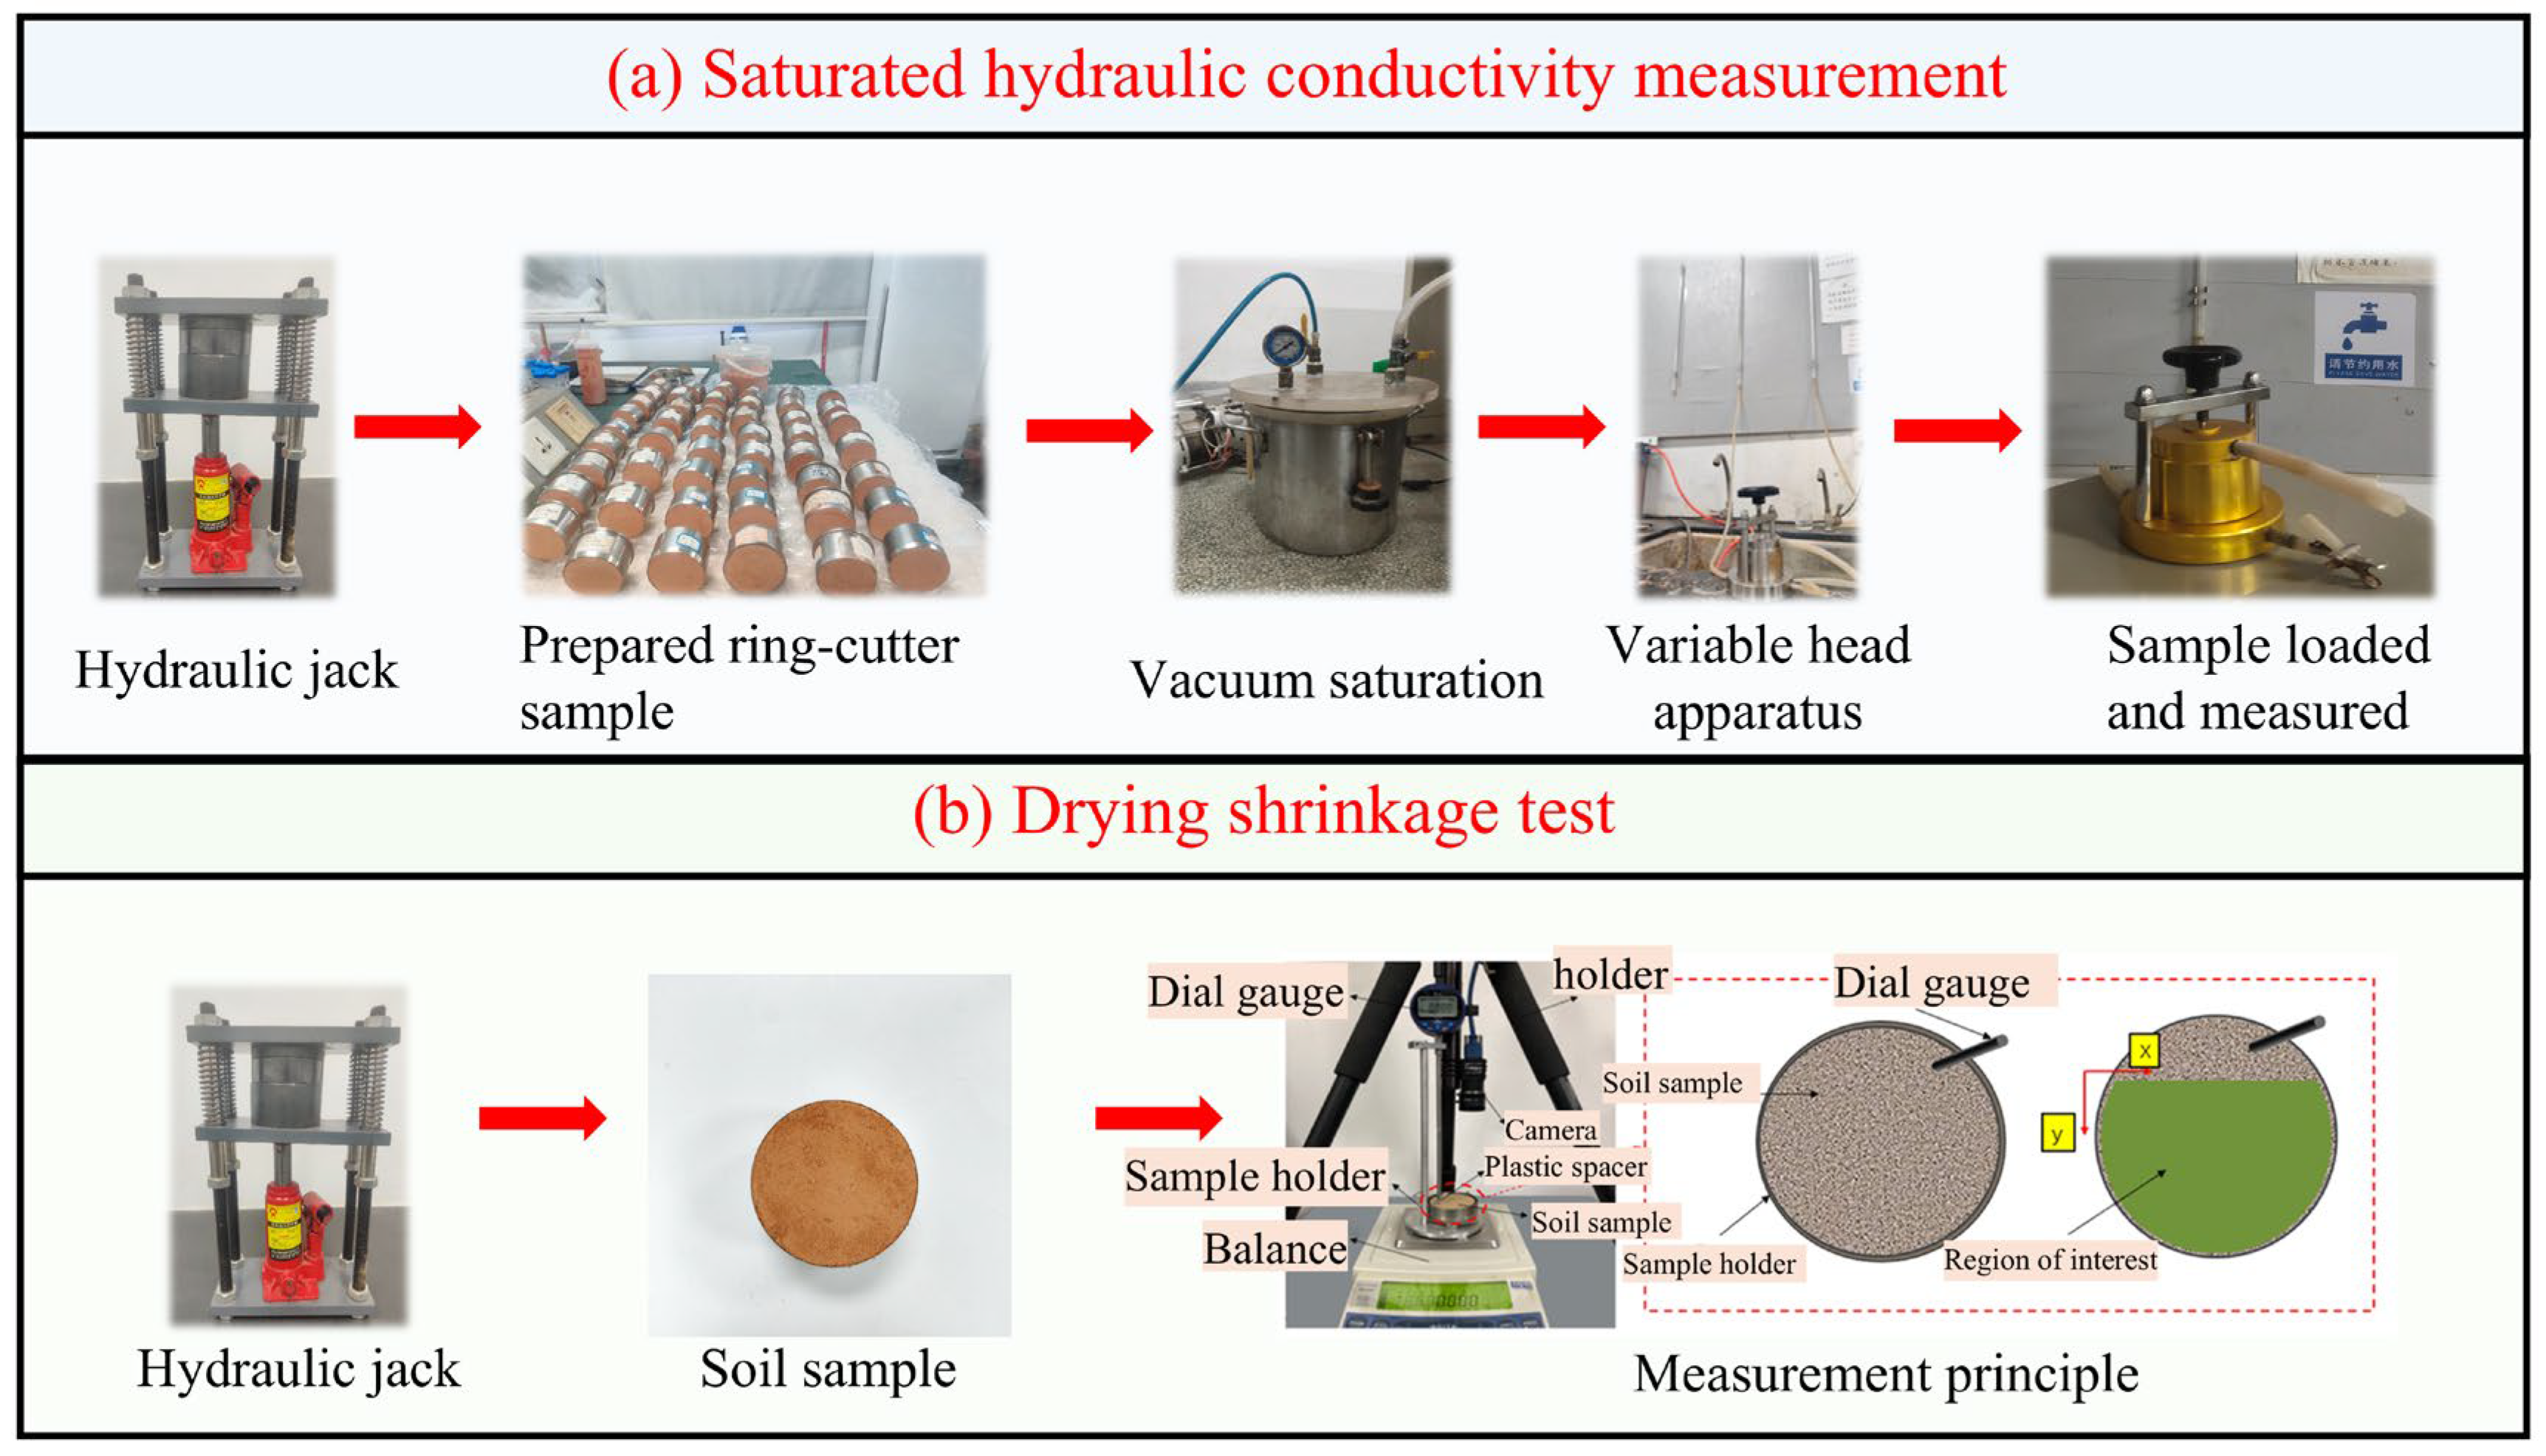
As shown in Figure 3a, the saturated hydraulic conductivity was measured using a variable-head permeameter (Nanjing Soil Instrument Factory Co., Ltd., Nanjing, China). Prior to the test, soil samples were compacted to the target dry density and fully saturated to ensure the expulsion of air from the pore water. The saturated samples were placed in the permeameter, connected to a 1 m water head device, and water was introduced to purge air from the bottom until the effluent was free of bubbles, after which the vent valve was closed. The initial water head was set, and the starting and ending water levels were recorded for each 10 cm drop along with the corresponding time interval. The saturated hydraulic conductivity was then calculated from the measured data according to Darcy’s law (Equations (2)) [13].

2.3.2. Drying Shrinkage Test

The drying shrinkage test was conducted strictly following the method proposed by Wen et al. (2021) [14]. The measurement system is shown in Figure 3b and consisted of a measuring unit and a data acquisition unit, including a supporting frame ((Shenzhen Hongming Technology Development Co., Ltd., Shenzhen, China)), an electronic balance (Shanghai Qiqian Electronic Technology Co., Ltd., Shanghai, China), a camera (Allied Vision Technologies GmbH, Stadtroda, Germany), and a dial indicator equipped with Bluetooth wireless transmission (Mitutoyo Corporation, Kawasaki-shi, Kanagawa, Japan). The electronic balance (accuracy 0.001 g), dial indicator (accuracy 0.001 mm), and camera were connected to a computer via data acquisition software(Daheng MER-Series Devices 17.09.26.01), and the acquisition frequency was set according to experimental requirements. During testing, the mass loss recorded by the electronic balance reflected the water evaporation, while axial deformation was obtained from the dial indicator readings. Radial deformation was determined using digital image correlation (DIC) by processing images captured by the camera [15], with a measurement interval of 5 min. The DIC technique calculates surface displacement by matching images captured before and after deformation. Prior to testing, the sample surface was sprayed with white paint to generate a random speckle pattern, ensuring no relative slip between the speckle layer and the specimen during deformation. Images were captured at a predefined frame rate, and radial deformation was obtained through subset matching analysis. A Pike F-100B/C camera (Allied Vision Technologies GmbH, Stadtroda, Germany) was used to capture high-resolution frontal speckle images with a resolution of 1000 × 1000 pixels (approximately 0.11 mm per pixel). Continuous illumination was provided by two 20 W fluorescent lamps (Shanghai Yaming Lighting Co., Ltd., Shanghai, China). Approximately 800 images were processed in each test. Axial deformation was measured using the dial indicator, and the DIC method provided full-field local deformation in both the horizontal and vertical directions (Figure 3b), from which radial deformation was calculated (Equations (3)) [14].

2.4. Theoretical Consideration

2.4.1. Soil Porosity

Soil porosity was determined using Equation (1) as follows:
ϕ = 1 ρ b G s
where ϕ, ρb and Gs are porosity (%), bulk density (g/cm3), and specific gravity (g/cm3), respectively.

2.4.2. Saturated Hydraulic Conductivity (Ks)

The ks was determined using the variable-head permeability test. According to Darcy’s Law, it was calculated as follows:
k s = a L A t l n h 1 h 2
where a and L are the cross-sectional area of the standpipe and the specimen height, respectively, A is the specimen’s cross-sectional area, and h1 and h2 are the hydraulic heads at the start and end of the time interval t. All measured values were subsequently corrected to a standard temperature of 20 °C according to [16].

2.4.3. Radial Deformation

Digital image correlation can obtain the local deformation of specimens in horizontal direction and vertical direction, and then the radial deformation of specimens can be calculated, as shown in Figure 3b:
Δ R = Δ x 2 + Δ y 2
where Δx is the local deformation of specimens in horizontal direction; Δy is the local deformation of specimens in vertical direction; and ΔR is the radial deformation.

2.5. Statistical Analysis

In this study, SPSS Statistics 27 software was employed to evaluate the effects of salt content, dry density, and porosity on saturated hydraulic conductivity and drying shrinkage deformation. First, one-way analysis of variance (ANOVA) was performed to test the significance of each factor, with the F-value, p-value, and effect size (η2) being determined. Subsequently, correlation analysis was conducted to identify potential relationships among these parameters. All statistical tests were executed at a significance level of α = 0.05.

3. Results

3.1. Influence of Salt Content on Ks Under Different Dry Densities

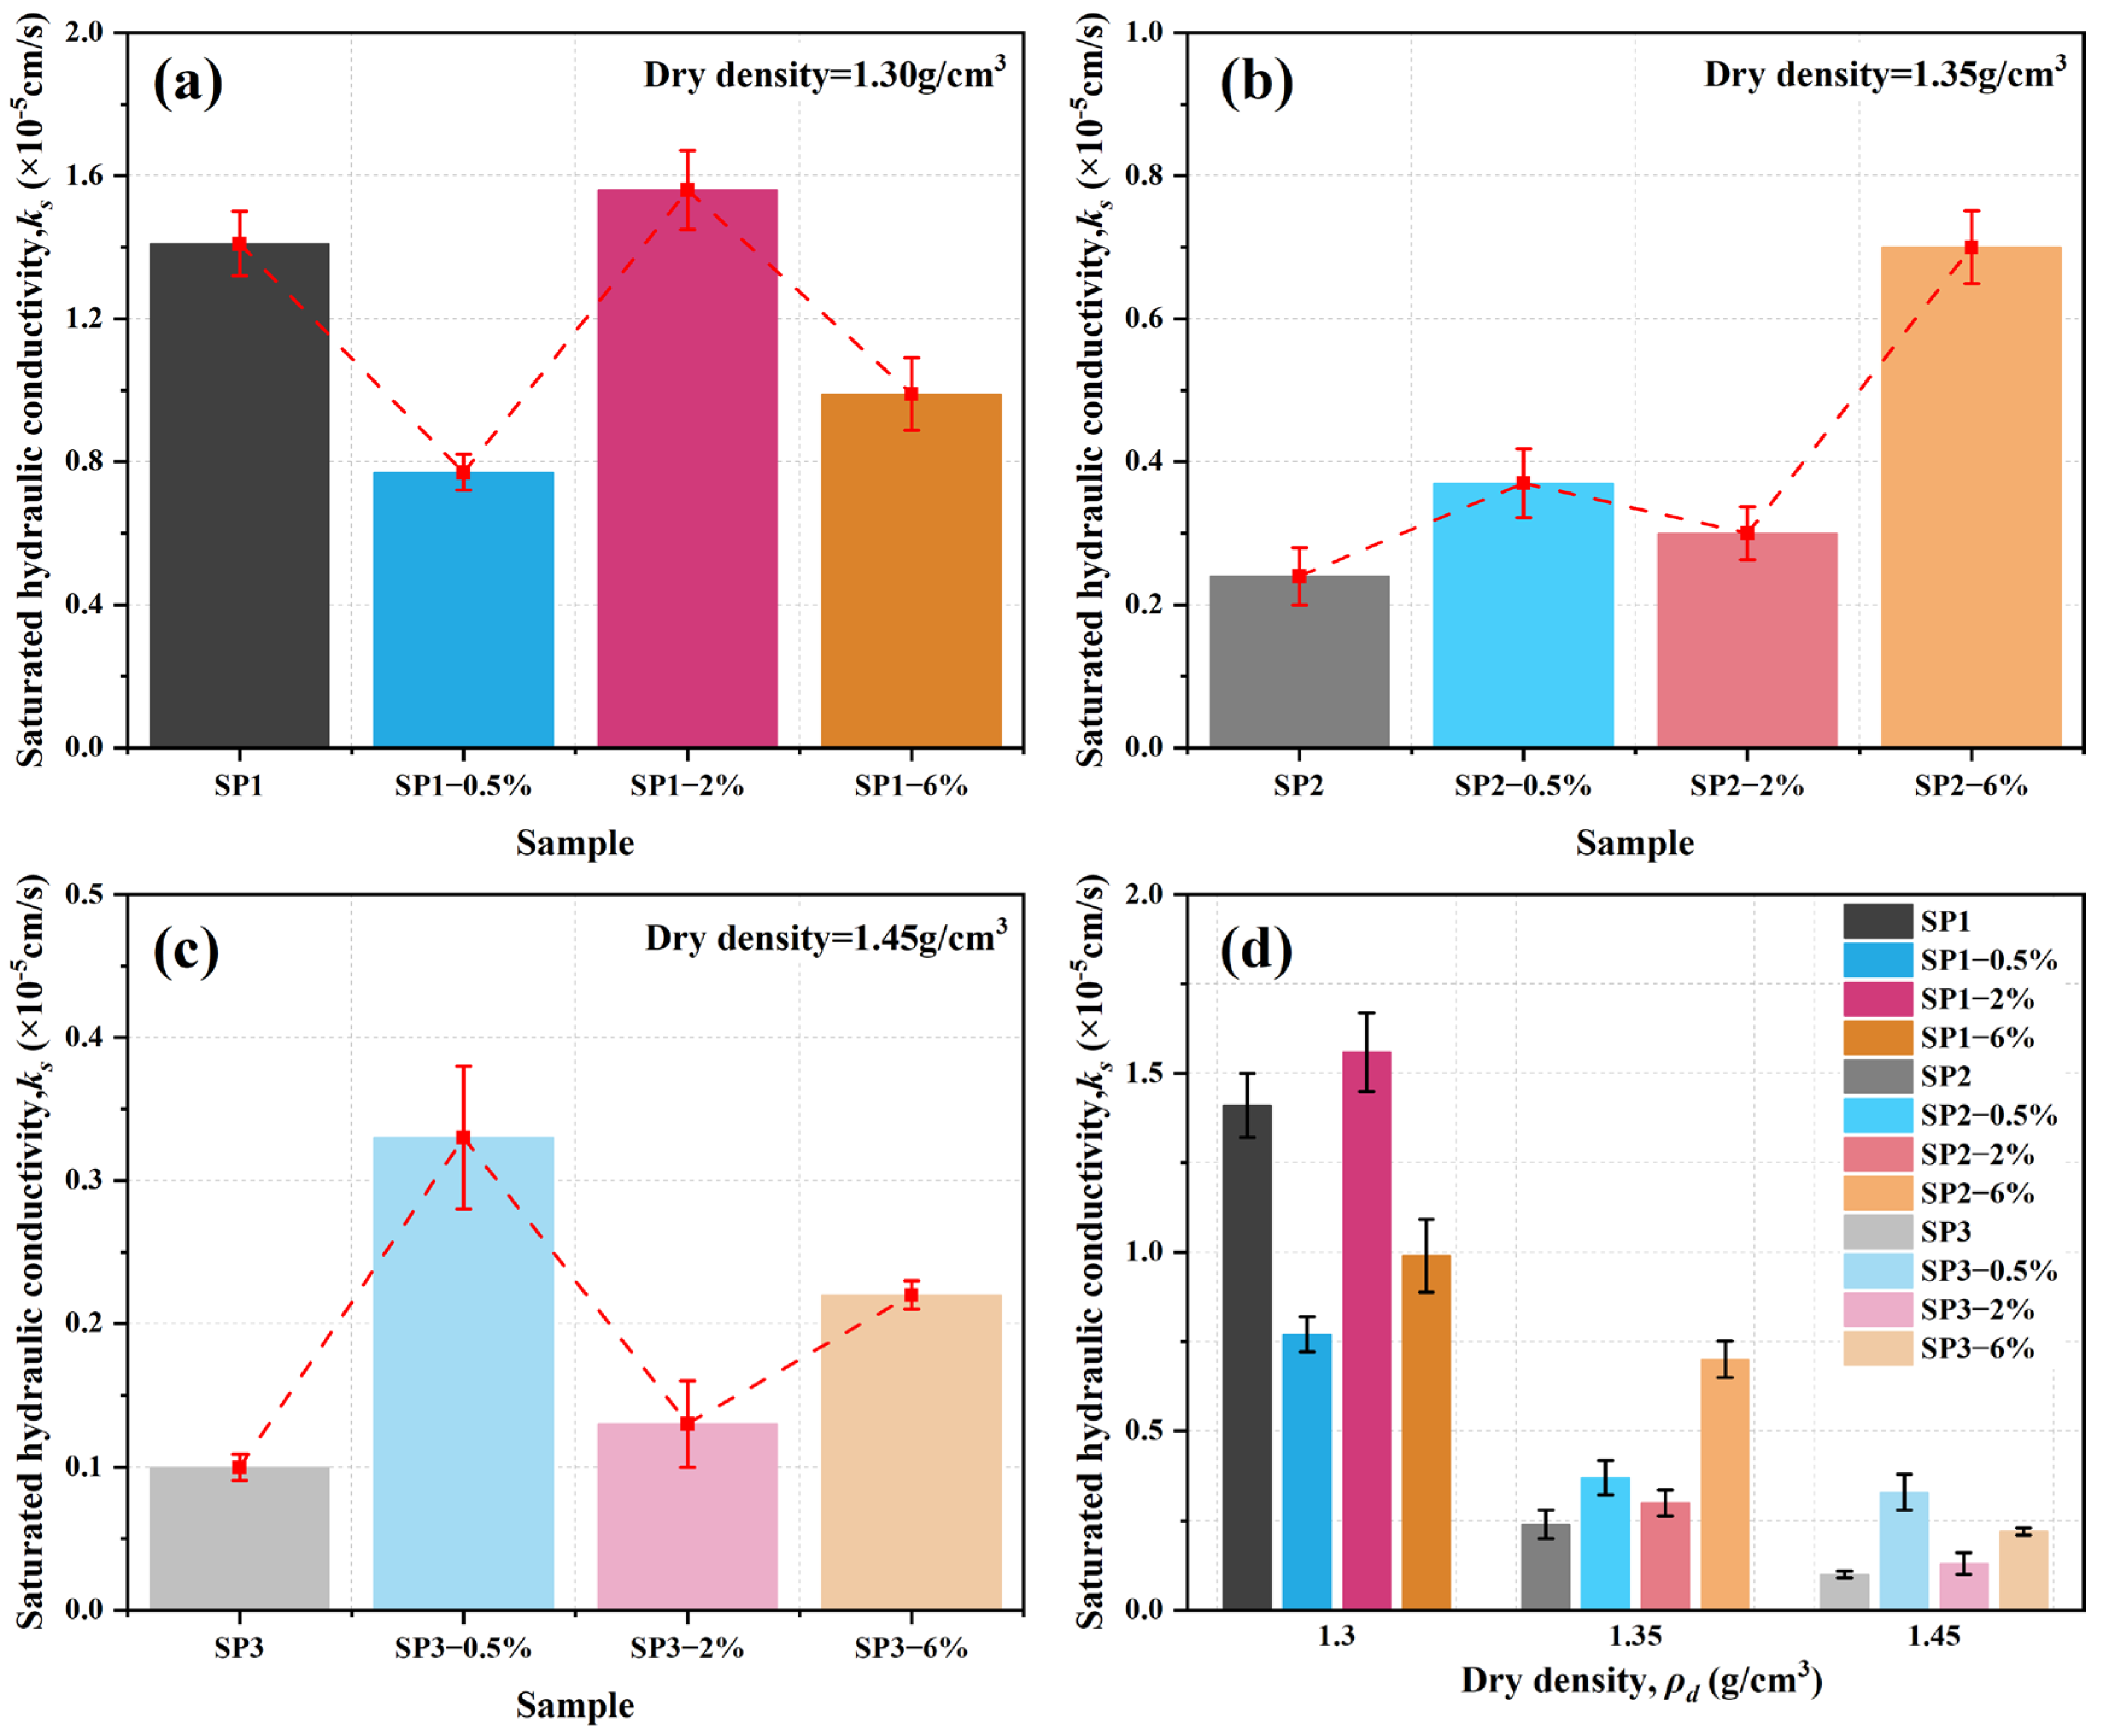
As shown in Figure 4a–c, salinity exhibits a complex, non-monotonic effect on the ks, modulated by dry density. At low dry density (1.30 g/cm3), Ks initially decreases, then increases, and finally decreases again with increasing salinity, reaching a maximum at 2% salinity (Figure 4a). This trend may result from the larger pore space at low density, where moderate salinity (2%) promotes particle flocculation and forms more stable aggregates, significantly enhancing hydraulic conductivity [17]. At medium and high dry densities (Figure 4b,c), the ks of saline soils is generally higher than that of non-saline soils (SP2 and SP3). At 1.35 g/cm3, ks is 0.37 × 10⁻⁵ cm/s at 0.5% salinity, slightly decreases to 0.30 × 10⁻⁵ cm/s at 2%, and markedly increases to 0.70 × 10⁻⁵ cm/s at 6%, while the non-saline SP2 exhibits a lower ks of 0.24 × 10⁻⁵ cm/s, These changes likely reflect that at moderate density, the pore structure allows low-concentration salts to induce flocculation, and higher salinity further enhances particle interactions, increasing permeability [18]. At high dry density (1.45 g/cm3), the smaller pore space limits particle mobility. Low salinity (0.5%) can still promote favorable flocculation, slightly increasing pores and producing the highest ks. Further increases in salinity likely lead to salt crystallization, which may block pores and reduce hydraulic conductivity under high-density conditions [19].
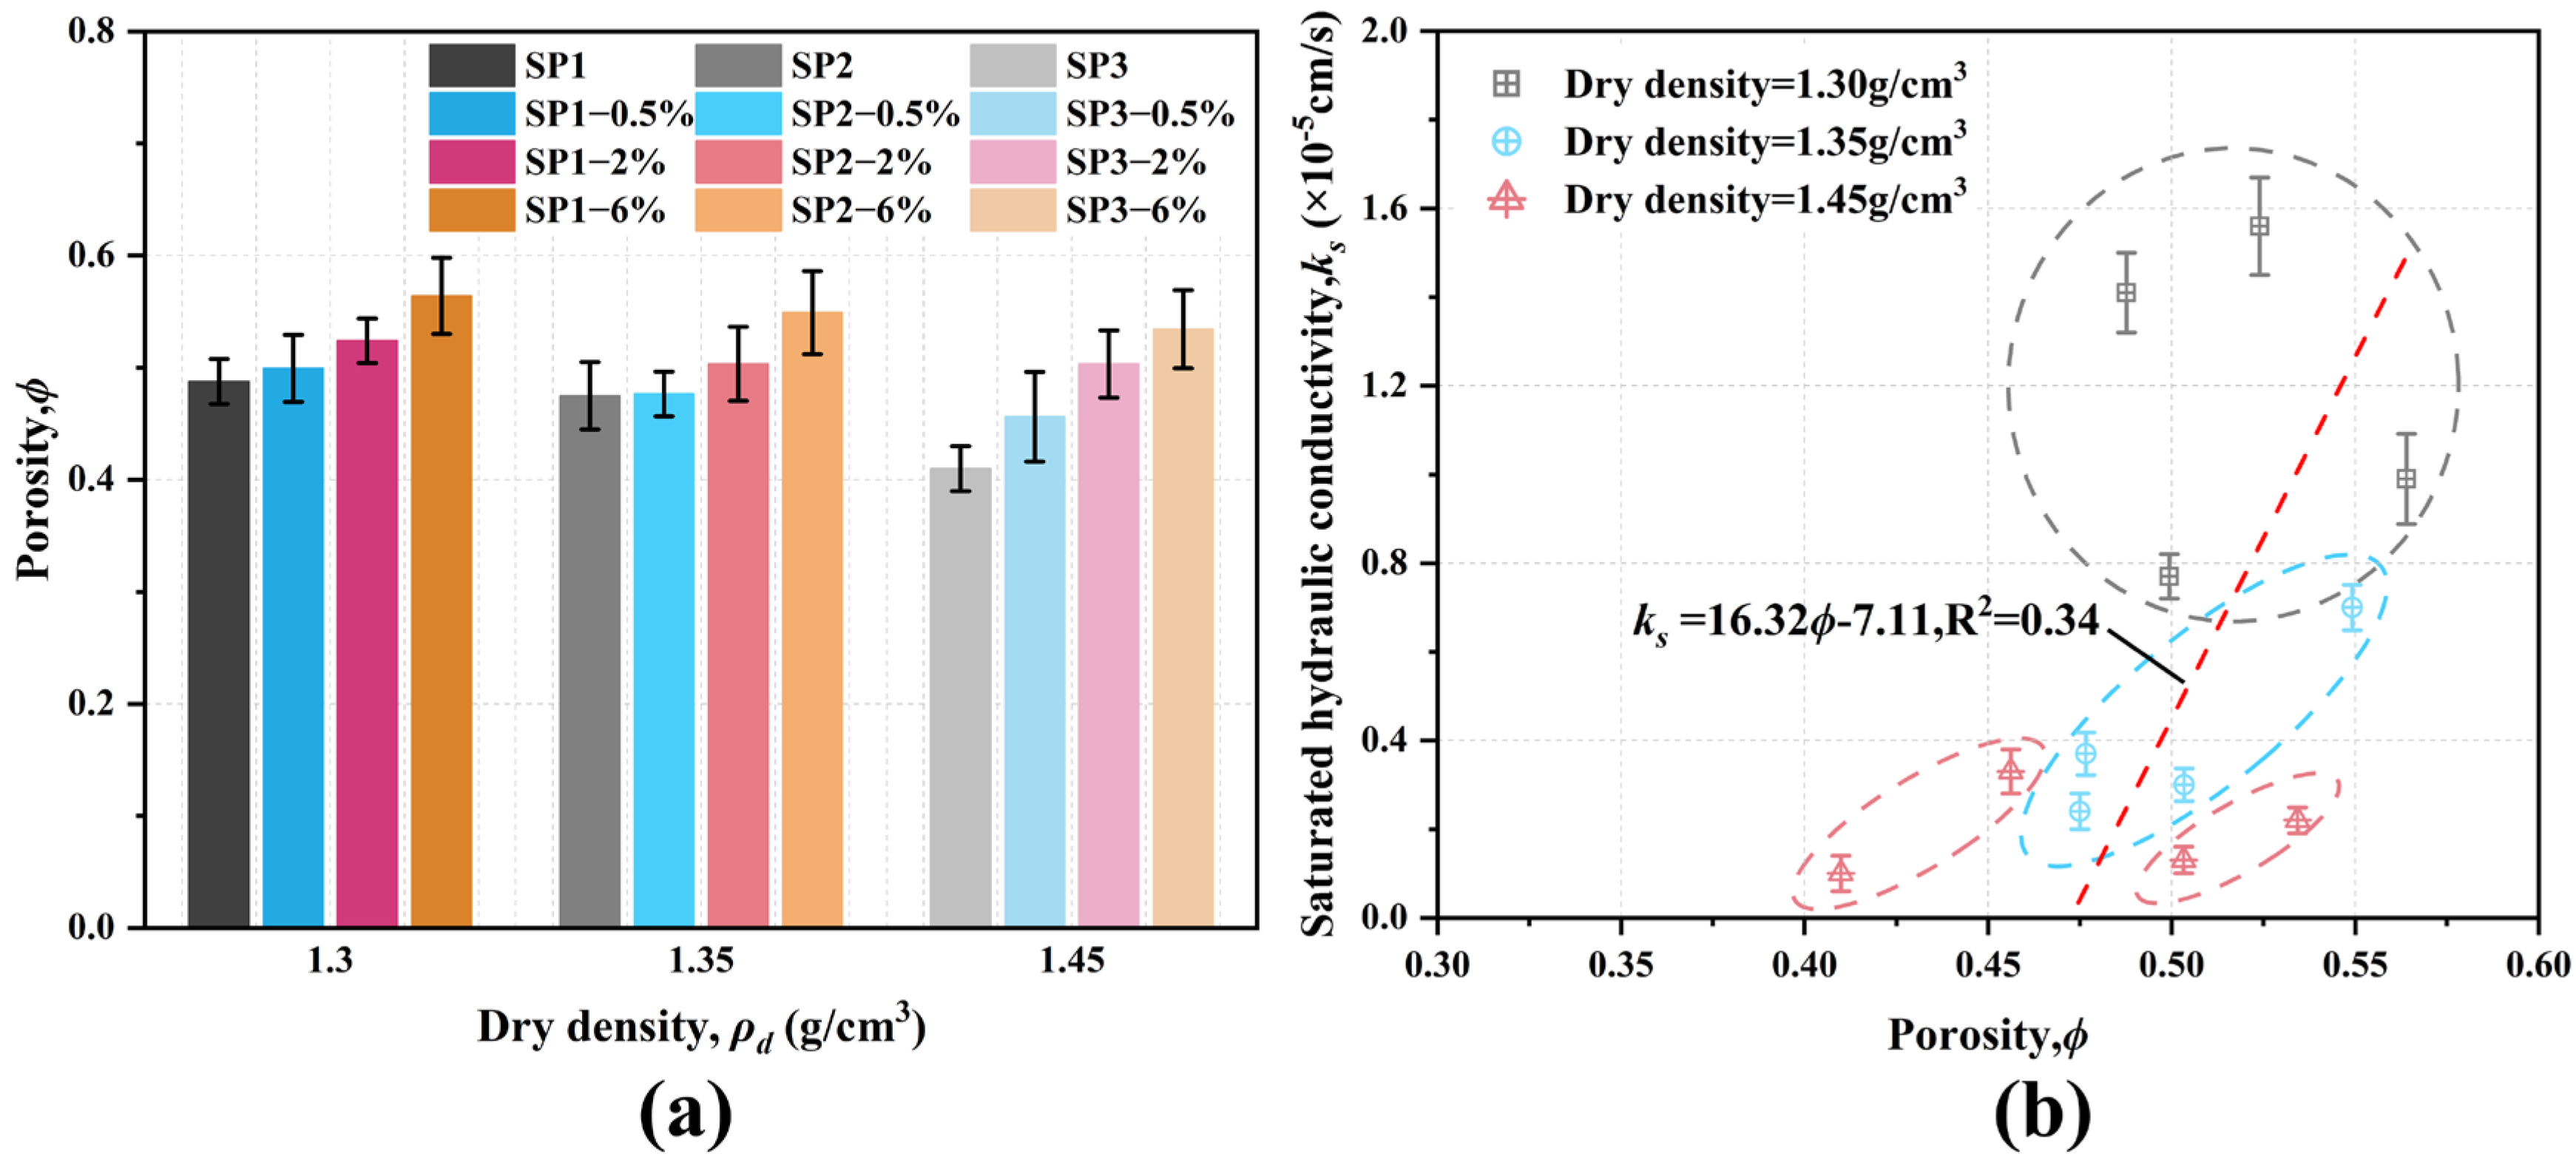
Furthermore, dry density and porosity are significant factors influencing ks (Figure 4d and Figure 5). As dry density increases from 1.30 g/cm3 to 1.45 g/cm3, ks decreases by 57.14–92.91% (Figure 4d). This decline is primarily attributed to compaction, which reduces the total pore volume, especially the large pores that serve as the main flow channels (Figure 5a). The compression of these pores increases the tortuosity of flow paths and decreases the effective cross-sectional area for water movement [20]. As shown in Figure 5b, ks positively correlated with porosity, although the fit is relatively low (R2 = 0.34). This may result from the nonlinear effect of salinity on samples with different dry densities, where low salinity can enhance pore connectivity, whereas high salinity may inhibit water flow [19]. Additionally, ks is generally lower at higher dry densities because particle packing is tighter, pore space is reduced, and water permeability is greatly limited, resulting in the lowest ks values observed within the experimental range [21].

3.2. Response of Drying Shrinkage to Salt Content at Different Dry Densities

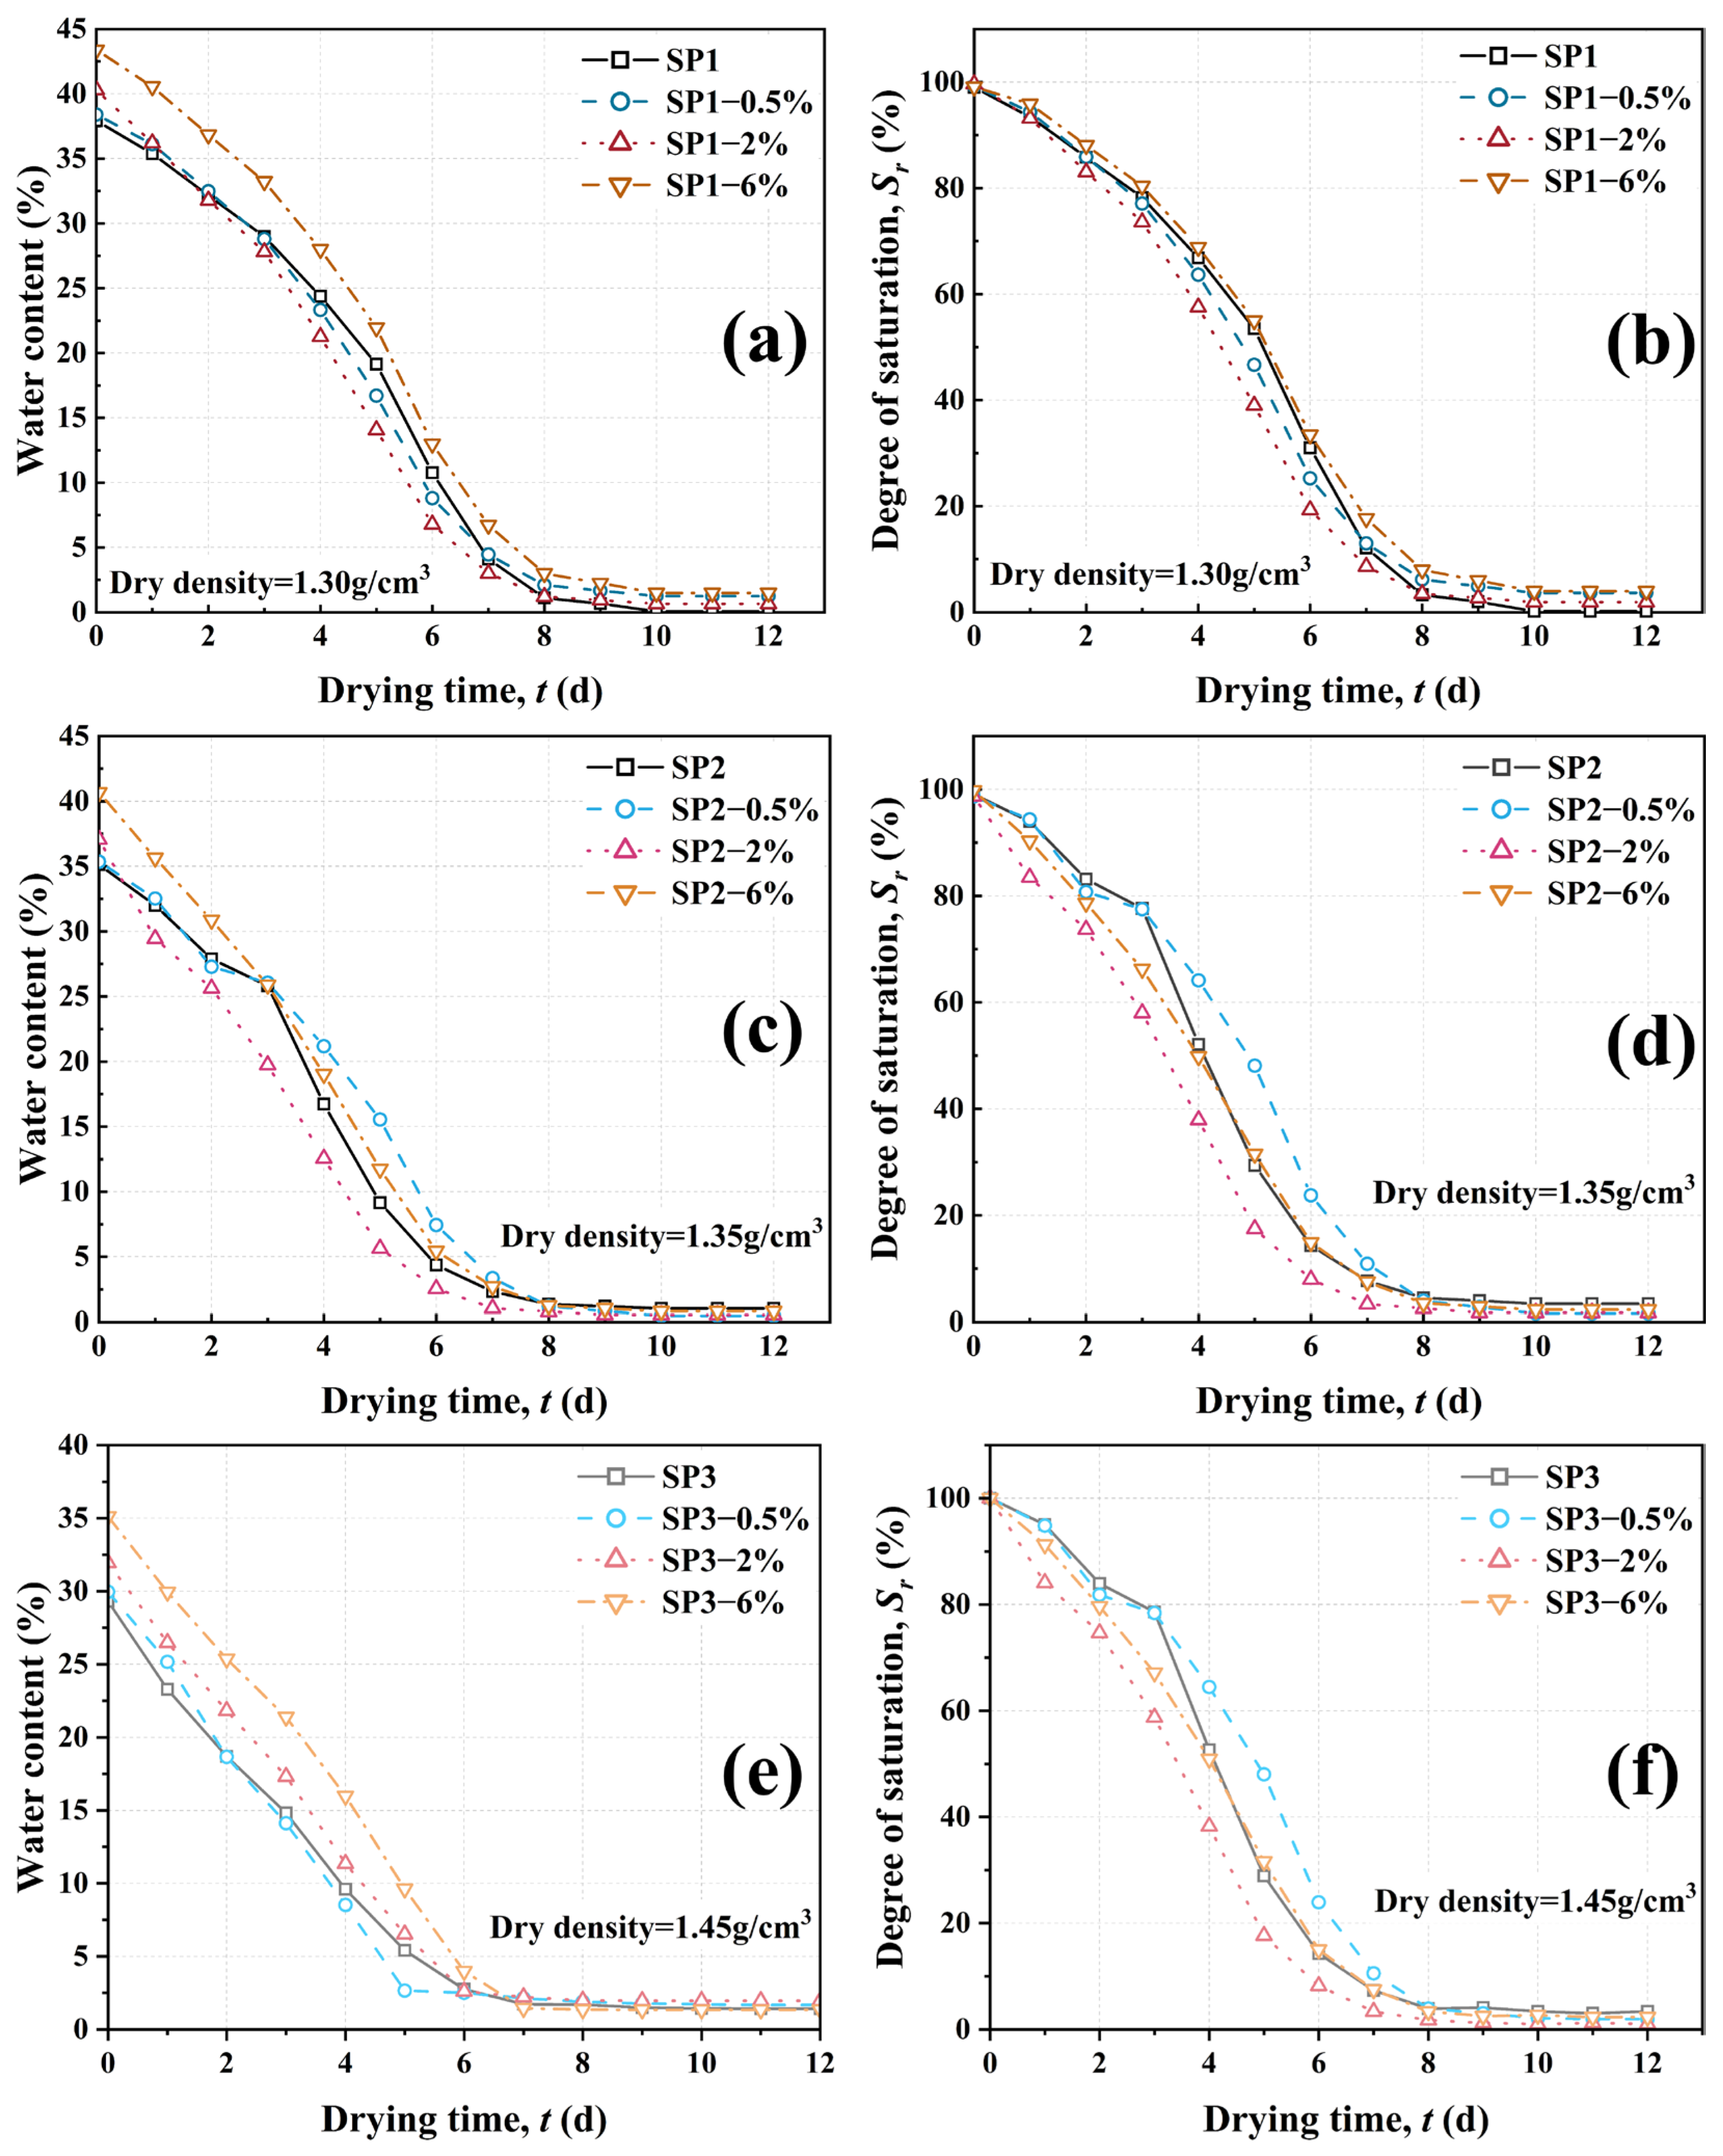
In the saturated soil desiccation–shrinkage tests, the water evaporation rate of the samples decreased progressively as the experiment proceeded. As shown in Figure 6, during the initial drying stage (<4 days), the decline in water content and saturation was similar among all salinity treatments. However, differences among treatments became apparent during the mid-drying stage (4–8 days), where the 2% and 6% salinity treatments exhibited slightly lower water loss rates compared to the non-saline and 0.5% salinity treatments. This suggests that the presence of salts may slightly reduce water diffusion within the soil, which was particularly pronounced at a dry density of 1.30 g/cm3. During the final drying stage (>8 days), the drying curves of all treatments gradually leveled off, and changes in water content and saturation became minimal.
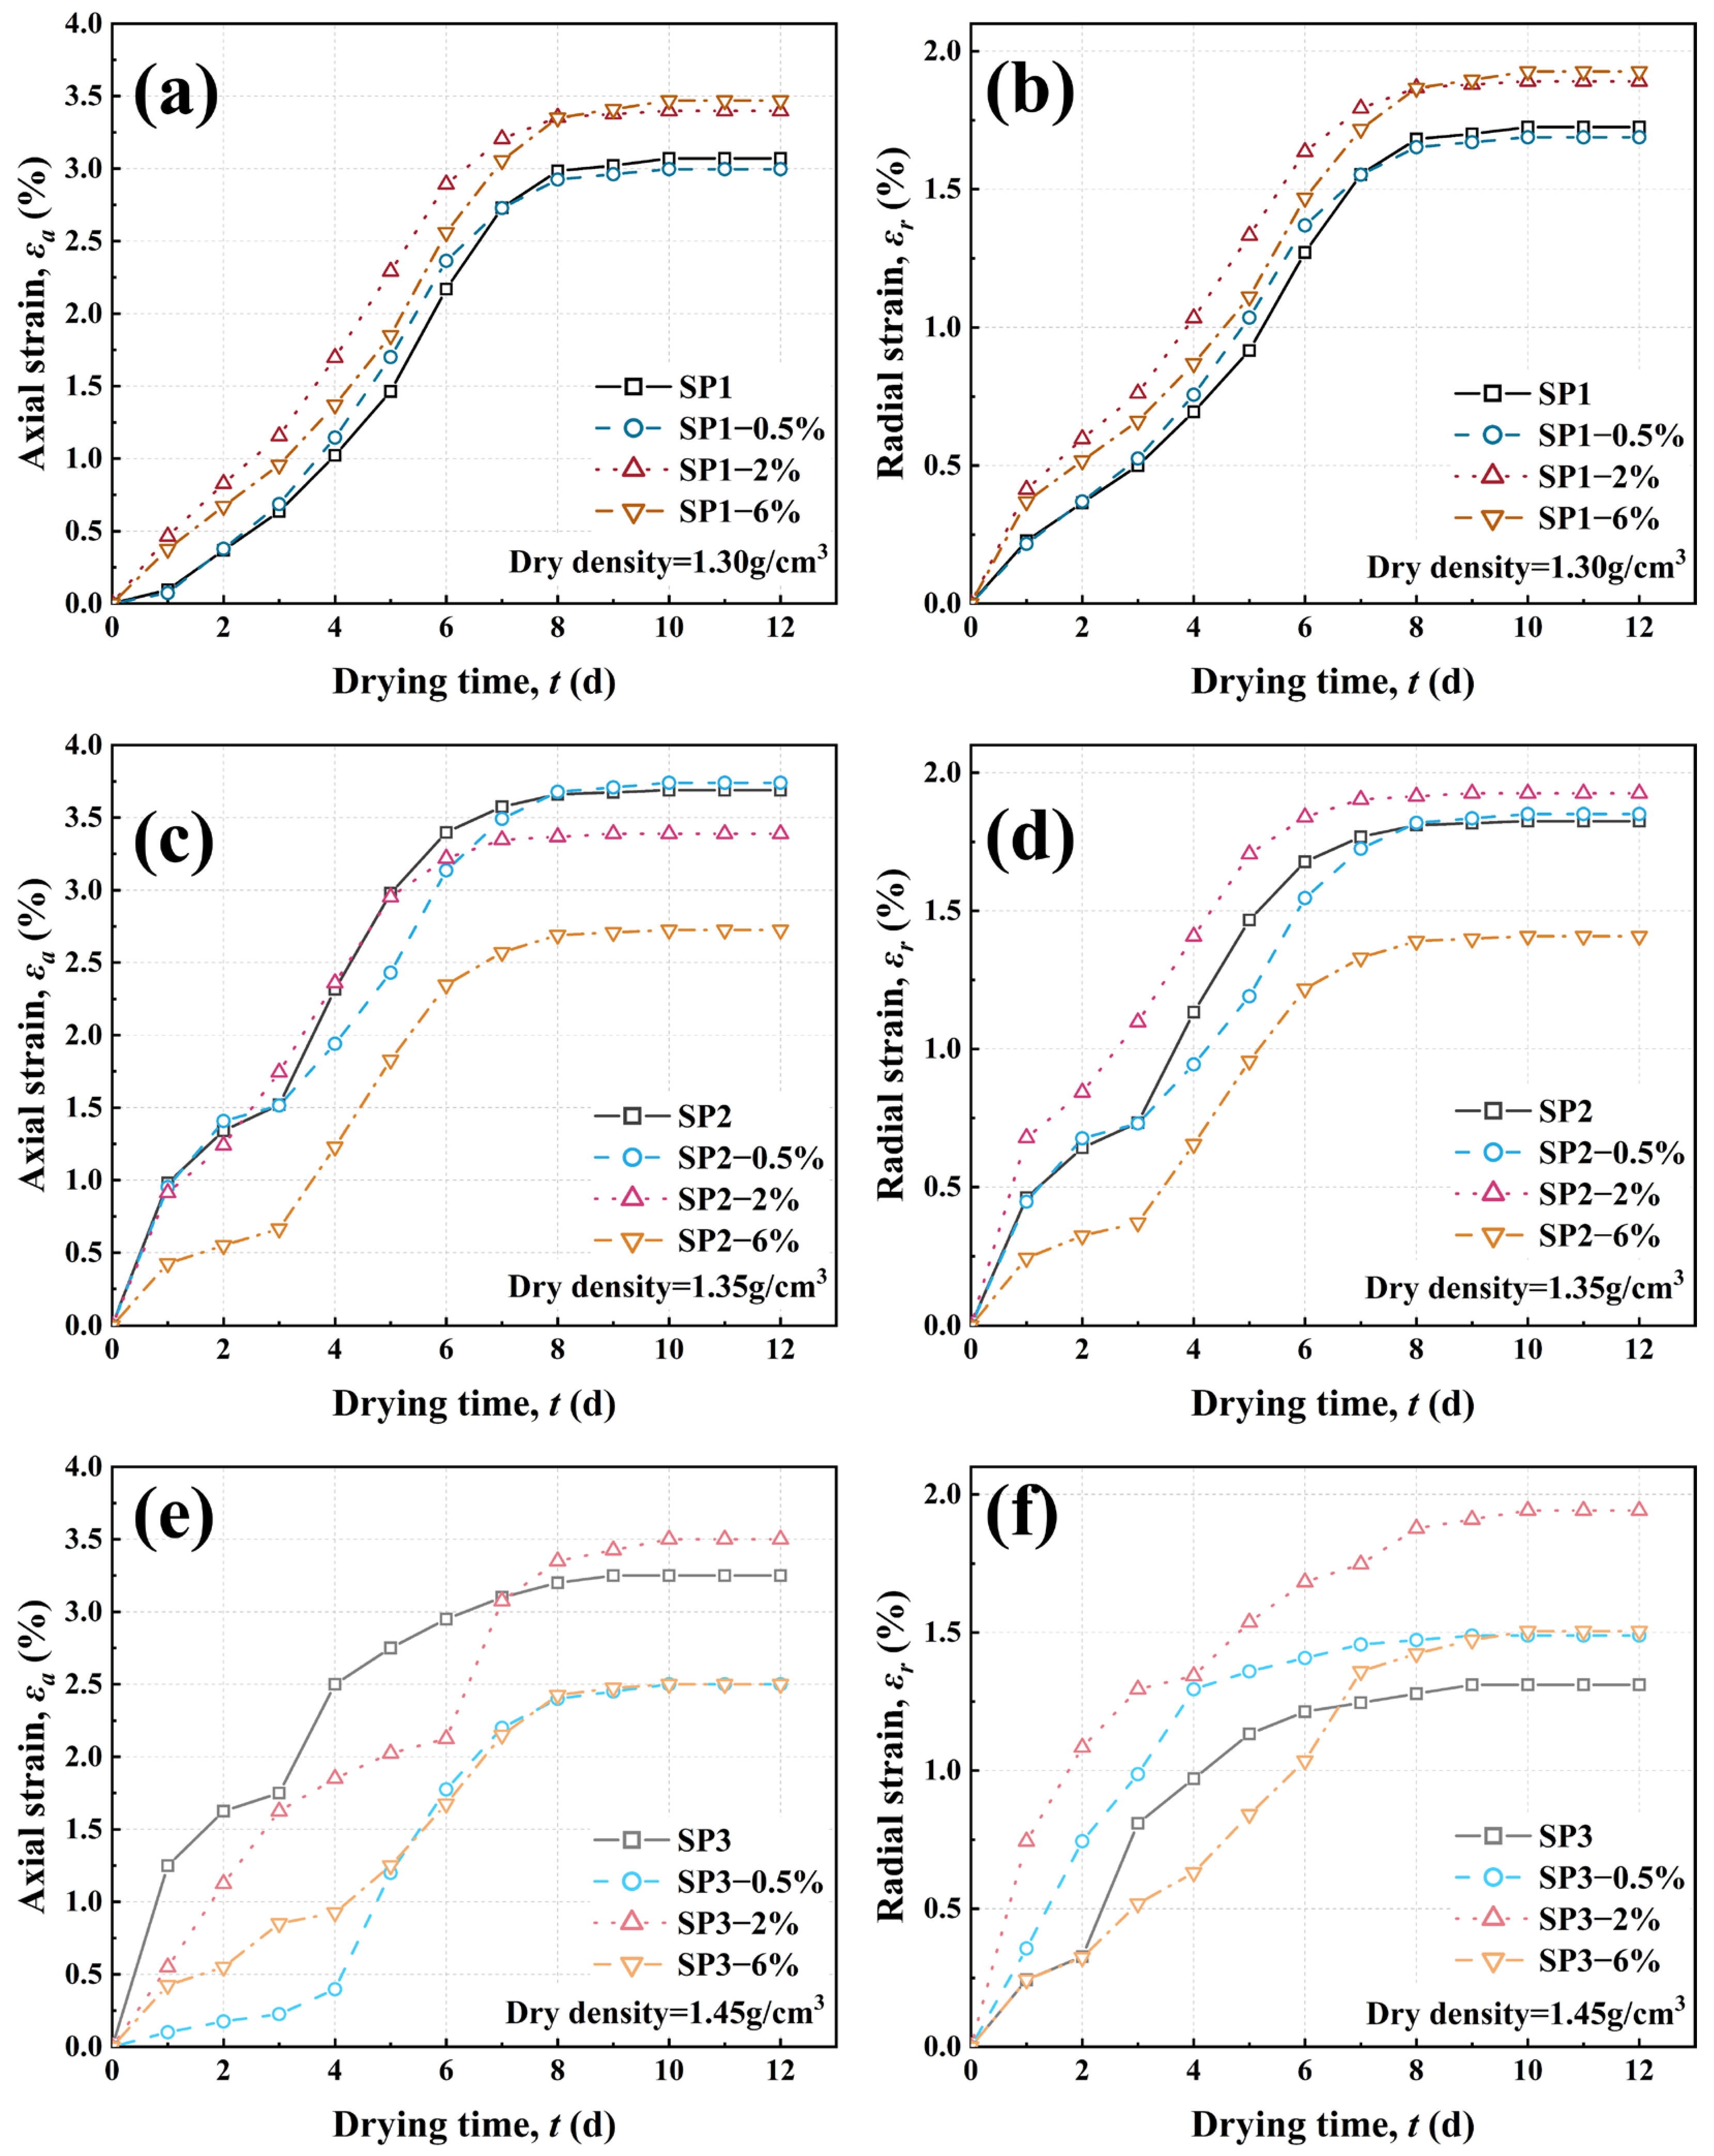
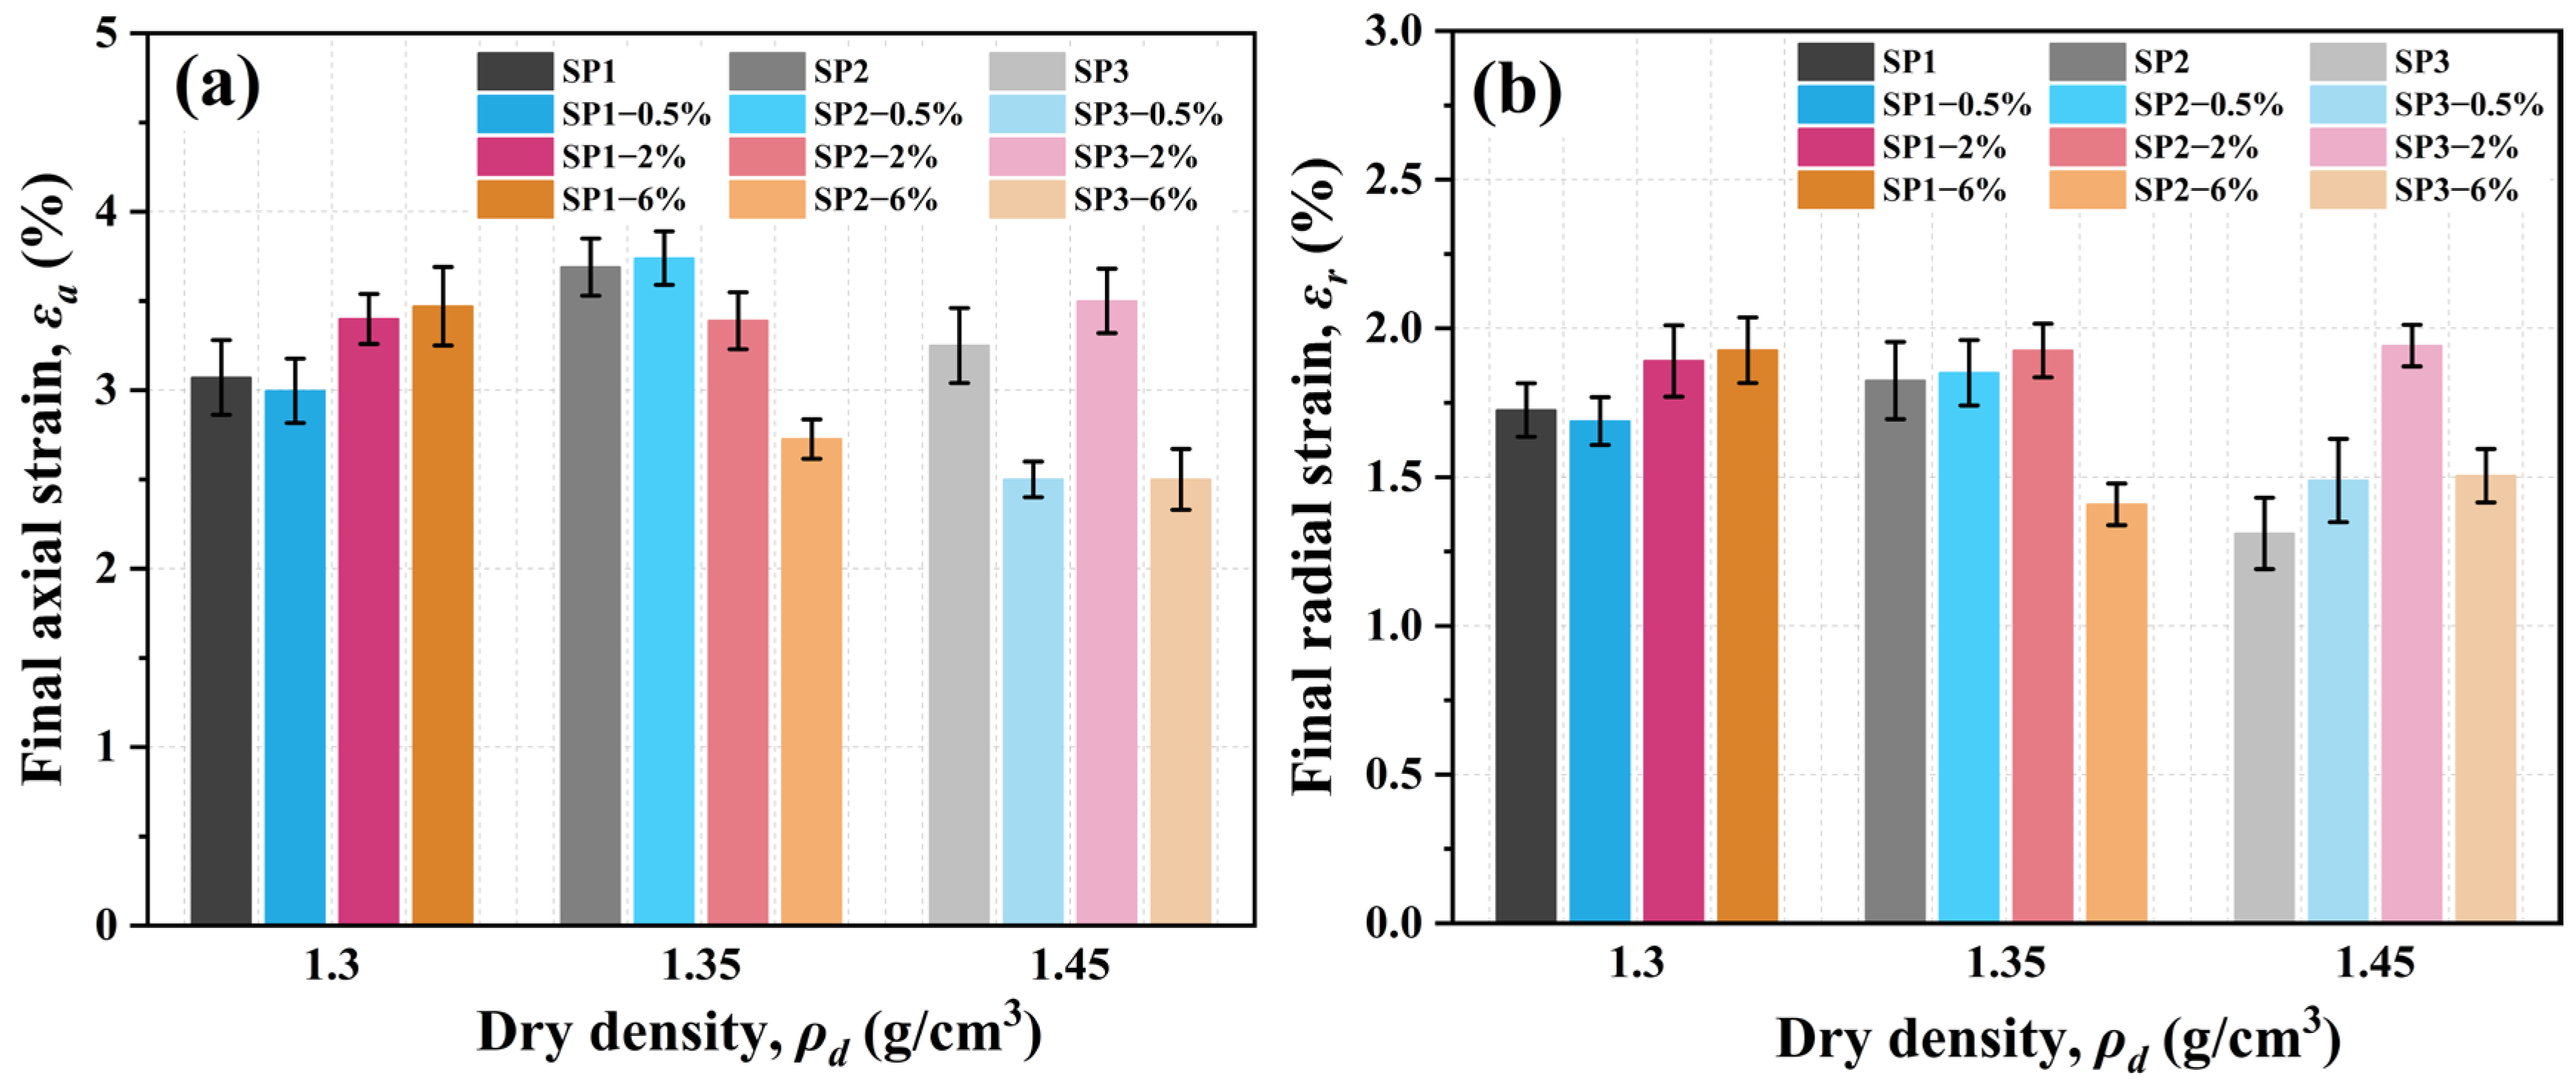
Figure 7 illustrates the evolution of axial and radial strains during the drying process. All samples exhibited a sigmoidal strain development, with rapid initial increases followed by stabilization as drying progressed. In the early and mid-drying stages (0–8 days), rapid water loss increased matric suction, causing particle rearrangement and resulting in shrinkage strains. During the late drying stage, deformation in all treatments stabilized. Dry density significantly influenced both axial and radial strain trends, although fluctuations were observed. As shown in Figure 8, at a dry density of 1.3 g/cm3, the final axial and radial strains for SP1, SP1-0.5%, SP1-2%, and SP1-6% were 3.07% and 1.73%, 2.99% and 1.69%, 3.40% and 1.89%, and 3.47% and 1.93%, respectively. At 1.45 g/cm3, the final axial and radial strains for SP3, SP3-0.5%, SP3-2%, and SP3-6% were 3.25% and 1.31%, 2.51% and 1.49%, 3.52% and 1.94%, and 2.50% and 1.51%, respectively. Overall, increasing dry density constrained soil deformation: at low and medium densities, the looser soil structure allowed greater particle rearrangement, maintaining relatively high axial and radial strains. As dry density increased to 1.45 g/cm3, particle contacts and interlocking strengthened, effectively limiting drying-induced volumetric shrinkage, resulting in lower final strains compared to lower-density treatments [22]. Notably, the SP3-2% treatment exhibited minimal reduction, with a slight tendency for increased strain.
In addition, variations in salt content exerted a complex regulatory effect on the final shrinkage strains, with dimension-dependent responses observed (Figure 8). At a dry density of 1.30 g/cm3, salt contents of 2% and 6% increased axial and radial strains by 10.67% and 9.56%, and 13.00% and 11.64%, respectively, whereas 0.5% salt resulted in a slight reduction. At dry densities of 1.35 g/cm3 and 1.45 g/cm3, the influence of salinity on strain exhibited greater variability. At 1.35 g/cm3, 0.5% salt moderately increased both axial and radial strains; 2% and 6% salt reduced axial strain, while 2% salt increased radial strain. At 1.45 g/cm3, 2% salt increased axial and radial strains by 7.69% and 48.15%, respectively, whereas 0.5% and 6% salt reduced axial strain but increased radial strain. Overall, the effect of salinity on axial and radial deformation was strongly dry density-dependent and non-monotonic. This behavior may be attributed to coupled mechanisms, including electrical double-layer compression, particle rearrangement, and possible salt crystallization bonding. Under low dry density conditions, salt tended to weaken interparticle structural stability and amplify deformation, whereas at high dry density, the soil skeleton governed the response, and salinity primarily modified lateral restraint and structural stability, thereby altering deformation patterns.

3.3. Anova and Correlation Analysis

The above results quantitatively demonstrate the effects of salinity and dry density on soil ks and drying shrinkage; one-way ANOVA (Table 3) confirmed that these factors significantly influence all the measured soil properties. Among them, salinity, dry density, and porosity had a particularly strong effect on drying shrinkage (η2 = 0.84–0.90).
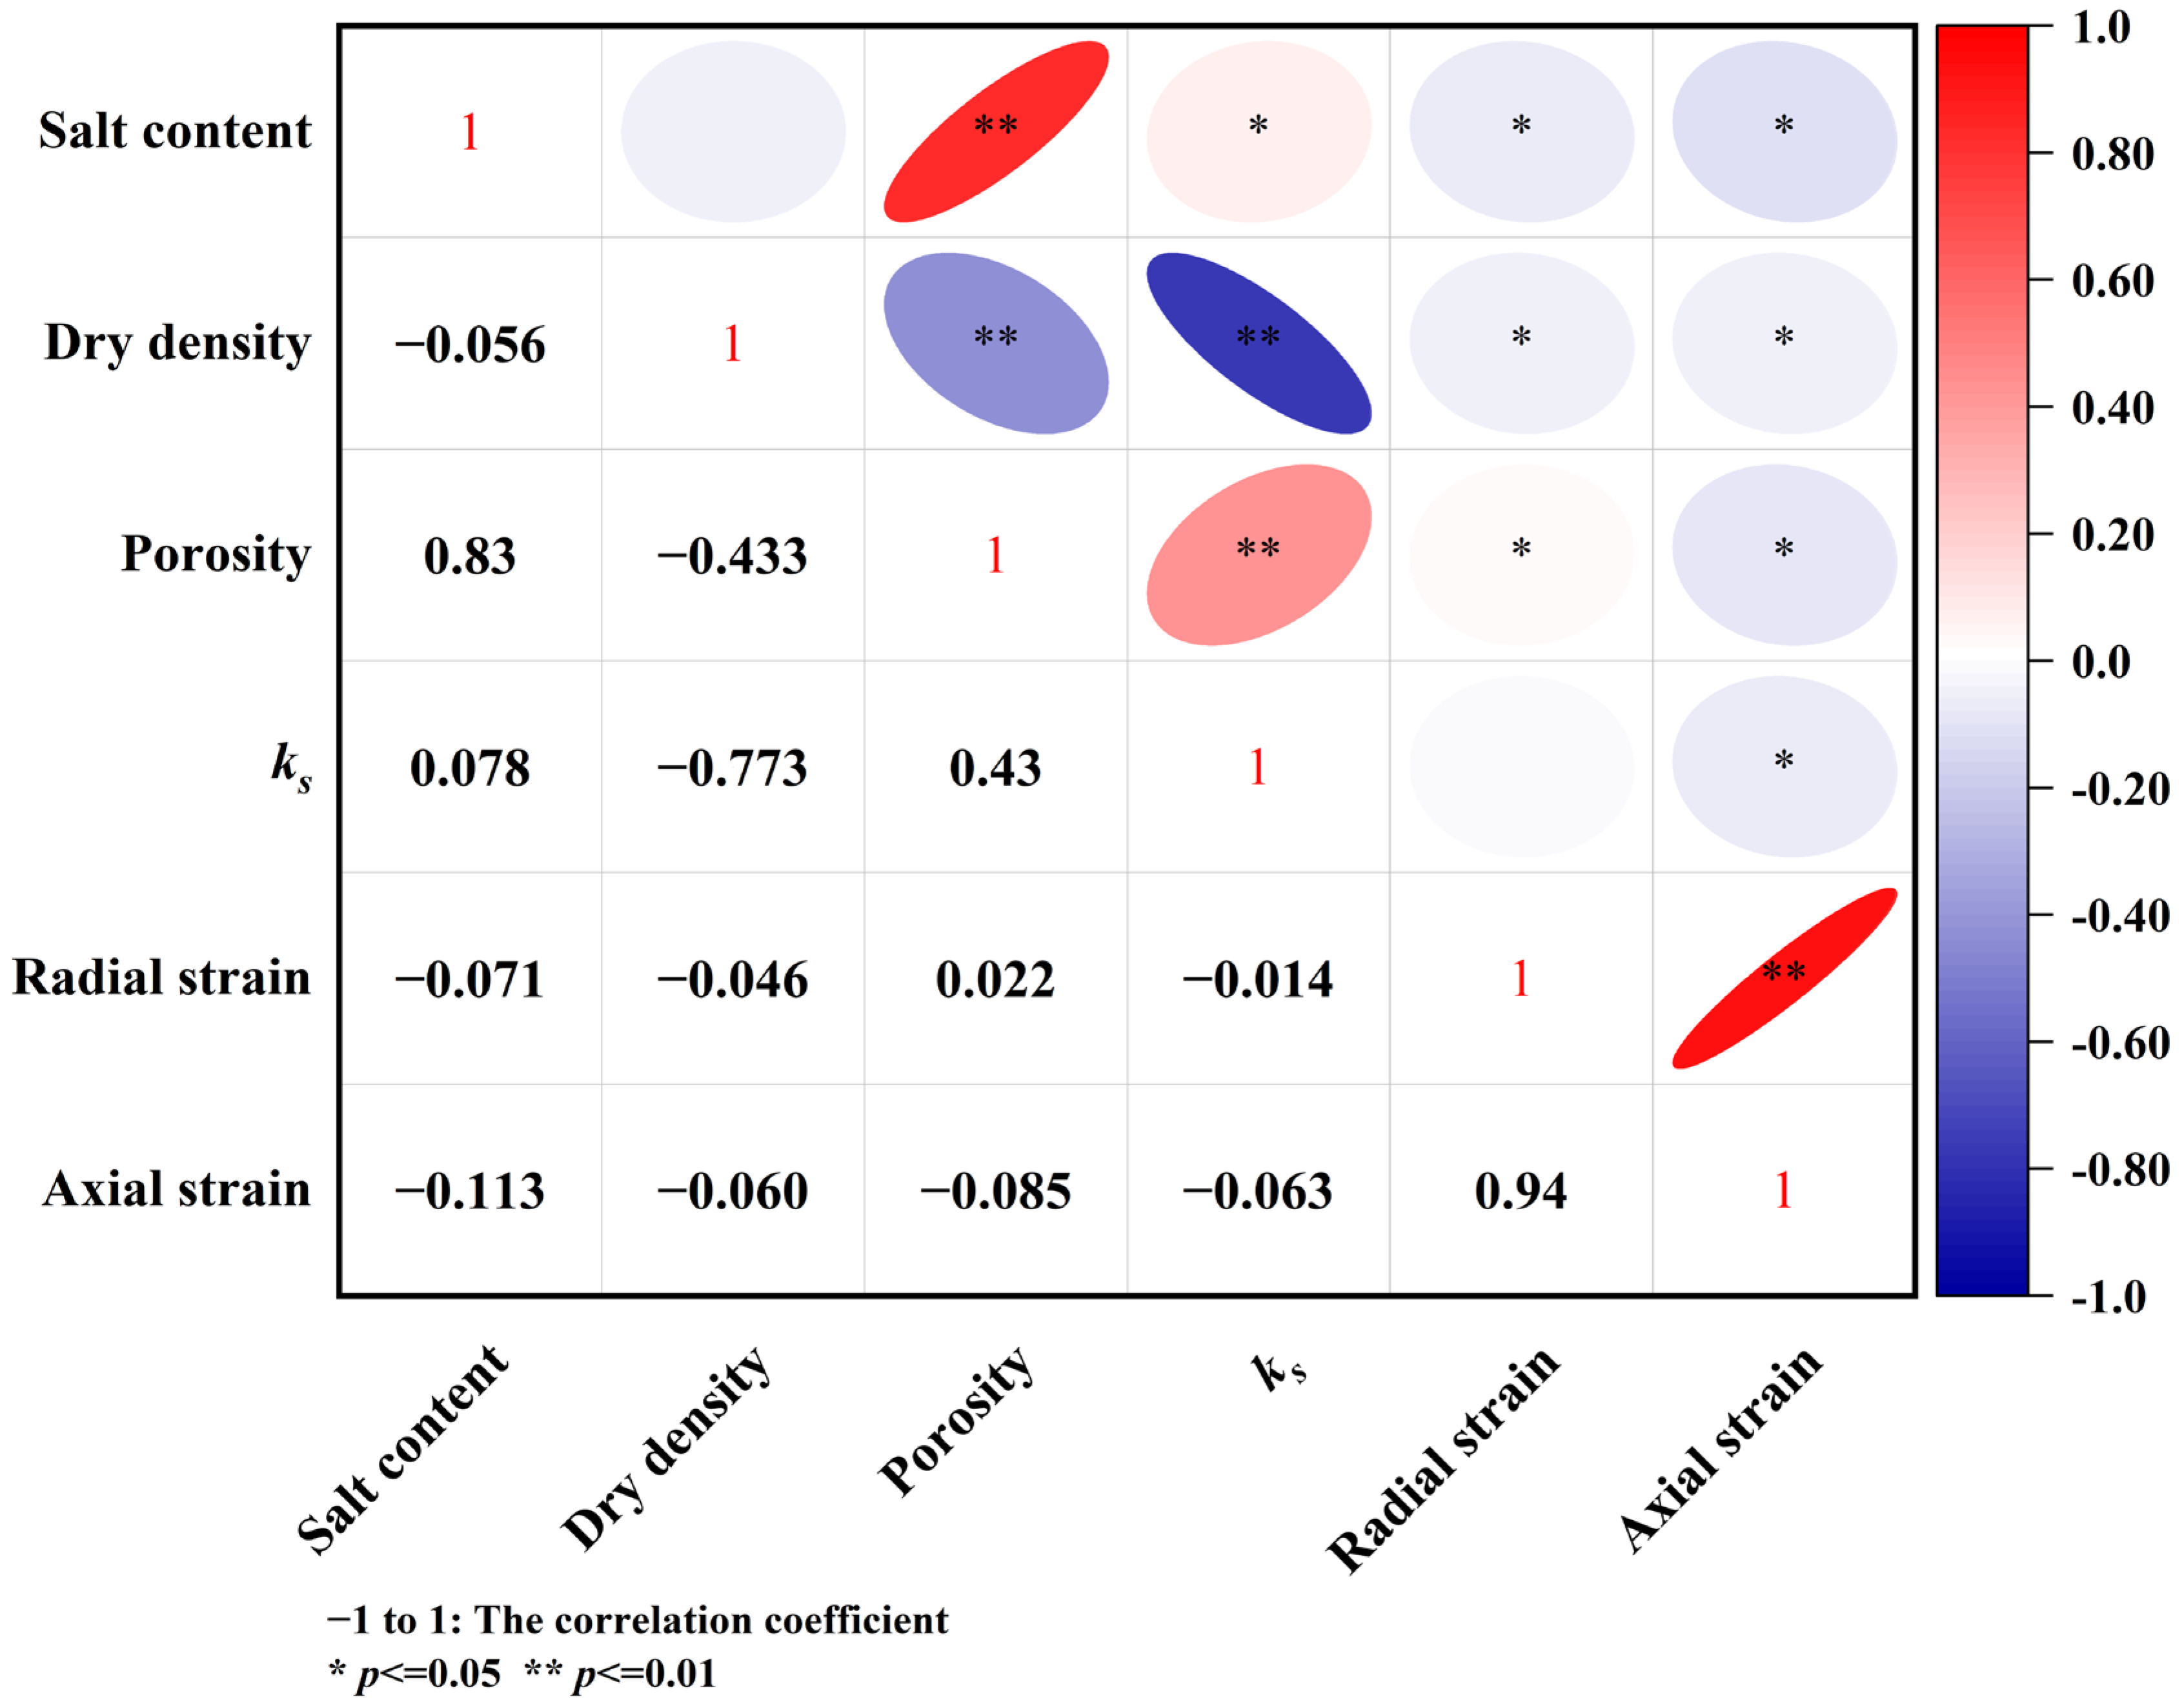
In addition, as shown in Figure 9, Pearson correlation analysis indicates that salinity is significantly positively correlated with porosity (r = 0.83) and ks (r = 0.078), while exhibiting negative correlations with drying shrinkage. Dry density is negatively correlated with porosity, ks, and drying shrinkage, with relatively strong correlations for porosity and ks (r = −0.43 and −0.78, respectively). Overall, these trends are consistent with experimental observations and are statistically significant (p < 0.05).

4. Discussion

4.1. Effects of Dry Density and Salinity on Ks and Physical Properties

The results indicate that dry density is the primary factor controlling soil pore structure and hydraulic behavior. As shown in Figure 9, dry density significantly affects porosity and ks (p < 0.05). With increasing dry density, particle contacts become tighter and the soil skeleton is rearranged, resulting in a notable reduction in total porosity (Figure 5a) and a more compact pore structure [23]. Wang et al. (2021) [24] reported that, in compacted loess, changes in dry density primarily affect pores with radii of 1–10 μm, while pores < 0.5 μm are less influenced. Consequently, an increase in dry density reduces porosity while slightly increasing microporosity. Simultaneously, the reduction in macropores may decrease pore connectivity and increase the tortuosity of flow paths, causing a significant decline in saturated hydraulic conductivity [17]. From a pore-scale perspective, the reduction in ks is governed not only by the decrease in total pore volume but also by changes in pore connectivity. Increased compaction transforms continuous transmission pores into smaller and more tortuous flow channels, thereby increasing hydraulic resistance. According to Darcy-scale flow theory, water transport is primarily controlled by the largest interconnected pores; therefore, even a modest reduction in macropore continuity can result in a disproportionate decline in ks [21,25]. Overall, dry density effectively regulates soil pore structure, thereby enhancing stability in engineering and environmental applications.
In contrast, the influence of salinity on soil hydraulic properties is more complex, affecting not only structural aspects but also the physicochemical environment between particles. In this study, the presence of salts increased soil porosity (Figure 5a). This effect may result from salt-induced particle flocculation and aggregate formation, which strengthen the interparticle framework and expand pore space, thereby increasing total porosity [23]. Increasing ionic strength compresses the diffuse double layer surrounding clay minerals, reducing interparticle repulsion and promoting particle flocculation. The resulting aggregated structure may generate larger inter-aggregate pores and improve flow pathways. However, at higher salinity levels, salt precipitation and crystallization within pore spaces may partially block flow channels, producing the nonlinear response of ks observed in saline soils [26]. You et al. (2017) [27] observed under freeze–thaw conditions that total porosity generally increased with soluble salt content, although different salts affected micro- and macropores differently; for instance, macropores increased significantly when sulfate exceeded 1%. However, higher salt content does not always lead to higher porosity. Safadoust et al. (2024) [28] reported that below a NaHCO3 threshold (<1.5%), salt dissolution and aggregate dispersion loosened the structure and increased porosity, whereas above this threshold, crystallization filled the pores and reduced total porosity. Furthermore, high electrical conductivity can promote the formation of micropores, increasing porosity [29]. At higher salt contents, repeated crystallization and expansion may destabilize the local structure, induce microcracks, or increase pore heterogeneity, leading to variable effects on permeability. High salt content also compresses the diffuse double layer, promoting clay particle flocculation and, under high sodium adsorption ratios, partially restoring or increasing ks [30]. The type of salt solution also affects ks differently. Han et al. (2022) [6] found that low Na+ content promotes clay dispersion and structural breakdown, causing a substantial decline in ks. In contrast, Ca2+ or certain K+ solutions at equivalent electrical conductivity better stabilize aggregates, and ks is generally higher than in Na+ solutions [30].
Overall, increasing dry density generally reduces ks. The effects of salinity on water retention and ks, however, depend on both salt concentration and ion type, exhibiting threshold and nonlinear responses. Therefore, future studies should further explore a wider range of salt concentrations and different salt types to better understand their impacts on soil porosity and saturated hydraulic conductivity. It should be noted that this study focused only on saturated conditions. Under unsaturated conditions, the combined effects of dry density and salinity on hydraulic behavior may be more complex due to the influence of soil suction and water retention processes. Future studies should therefore investigate the coupled influence of dry density and salinity on unsaturated hydraulic properties to improve the understanding of water transport processes in saline soils under field conditions.

4.2. Influence of Dry Density and Salt Content on Drying Shrinkage

As shown in Figure 8, increasing dry density generally reduces both axial and radial strains. This occurs because higher dry density results in a more compact soil skeleton, limiting the space for pore contraction and particle rearrangement during water evaporation, thereby reducing drying-induced shrinkage [22]. Mechanistically, drying shrinkage is driven by capillary stresses generated during water evaporation. In low-density soils, larger pore volumes allow greater water loss and particle rearrangement, producing larger shrinkage strains. In contrast, high-density soils possess stronger interparticle contacts and greater structural stiffness, which resist capillary-induced contraction and limit volumetric deformation [31,32,33]. Microstructural studies by Tian et al. (2022) [34] further confirmed that high-density samples contain fewer macropores, weakening the effects of capillarity and adsorption on structural changes, which suppresses shrinkage and crack development. Similarly, Zhao et al. (2018) [35] observed that under repeated wet–dry cycles, high-density samples exhibit smaller total shrinkage and reduced crack number and width. Overall, dry density enhances structural constraint and particle contact, simultaneously limiting volumetric deformation.
As shown in Figure 8, the presence of salts increases shrinkage in low-density samples, reduces shrinkage in medium-density samples, and induces fluctuating responses in high-density samples. This behavior may be attributed to the fact that, in low-density soils, salt crystallization disturbs the loose skeleton, enhancing shrinkage, whereas in medium-density soils, salts promote particle flocculation and strengthen the structure, thereby reducing shrinkage [14]. In high-density soils, where the structure is already compact, salt effects manifest as subtle microscopic fluctuations, leading to irregular shrinkage [36]. Chang et al. (2024) [37] reported that high salinity enhances soil swelling potential while suppressing shrinkage potential, increasing vertical maximum expansion by 23.42–35.87%. This effect is associated with double-layer compression that promotes particle flocculation and cementation, thereby improving structural stability and reducing shrinkage [38]. It is noteworthy that Song et al. (2023) [39] observed that high salt concentrations may also damage microstructures and induce crystallization pressure, causing localized expansion or irregular volumetric changes, which can result in axial strains exceeding radial strains. Furthermore, different ionic species affect shrinkage differently; for instance, cations such as Na+ and K+ generally reduce shrinkage, whereas anions such as HCO3 and CO32− may enhance it [40].
These findings indicate that soil drying shrinkage is significantly influenced by dry density and salt content. However, as only a single salt type was considered in this study, future research should systematically explore a wider range of salt types and concentrations, along with varying dry densities, to comprehensively assess their combined effects on soil drying shrinkage.

5. Conclusions

This study systematically evaluated the coupled effects of dry density and salinity on the hydraulic conductivity and drying shrinkage behavior of SP-SC. The main conclusions are as follows:
1. Increasing dry density from 1.30 to 1.45 g/cm3 reduced soil porosity by 2.27–15.95% and ks by 57.14–92.91%. Higher dry density also suppressed drying shrinkage.
2. The presence of salt increased porosity by approximately 0.34–30.35%. However, its influence on ks was non-monotonic. Overall, salinity tended to increase drying shrinkage deformation, particularly at a dry density of 1.45 g/cm3.
3. At 1.45 g/cm3 without salt addition, the soil exhibited the lowest porosity, ks, and radial strain, indicating improved structural stability. In contrast, salt addition at this density increased porosity, ks, axial and radial strains, which may adversely affect engineering performance.
Therefore, in saline–alkaline environments, maintaining a relatively high dry density while keeping salinity at a low level can effectively enhance soil structural stability and compressive strength. Future research should further consider long-term influences, such as wetting–drying and freeze–thaw cycles, to better evaluate durability under field conditions.

Author Contributions

X.L. and L.Z.: Investigation, Validation, and Writing—review and editing. Z.S. and B.Y.: Conceptualization, Original draft, and Software. W.R. and Y.L.: Investigation and Validation. T.W.: Funding acquisition, Investigation, Validation, Writing—review and editing. All authors have read and agreed to the published version of the manuscript.

Funding

This research was funded by the National Natural Science Foundation of China (Nos.52468055); Tianshan Talent Training Program (2023TSYCLJ0055); General Program of Xinjiang Uygur Autonomous Region Natural Science Foundation (2023D01C27); Xinjiang Key Laboratory of Green Construction and Smart Traffic Control of Transportation Infrastructure (GCSTCTI-202507); and basic scientific research projects of universities in Xinjiang Uygur Autonomous Region (XJEDU2023P033). And The APC was funded by Xinjiang Key Laboratory of Green Construction and Smart Traffic Control of Transportation Infrastructure (GCSTCTI-202507).

Data Availability Statement

Data will be made available on request.

Conflicts of Interest

Author Xuejun Liu and Yanjun Li was employed by the company Xinjiang Architectural Research Institute, Urumqi, China. The remaining authors declare that the research was conducted in the absence of any commercial or financial relationships that could be construed as a potential conflict of interest.

References

  1. Liu, X.; Zhang, X.; Kong, L.; Wang, G.; Lu, J. Disintegration of granite residual soils with varying degrees of weathering. Eng. Geol. 2022, 305, 106723. [Google Scholar] [CrossRef]
  2. Shimobe, S.; Spagnoli, G. A novel approach to evaluating the compaction control of soils. Q. J. Eng. Geol. Hydrogeol. 2020, 53, 452–459. [Google Scholar] [CrossRef]
  3. Garg, A.; Huang, H.; Cai, W.; Reddy, N.G.; Chen, P.; Han, Y.; Kamchoom, V.; Gaurav, S.; Zhu, H.-H. Influence of soil density on gas permeability and water retention in soils amended with in-house produced biochar. J. Rock Mech. Geotech. Eng. 2021, 13, 593–602. [Google Scholar] [CrossRef]
  4. Shen, J.; Wang, Q.; Chen, Y.; Han, Y.; Zhang, X.; Liu, Y. Evolution process of the microstructure of saline soil with different compaction degrees during freeze-thaw cycles. Eng. Geol. 2022, 304, 106699. [Google Scholar] [CrossRef]
  5. Shen, J.; Wang, Q.; Chen, Y.; Zhang, X.; Han, Y.; Liu, Y. Experimental investigation into the salinity effect on the physicomechanical properties of carbonate saline soil. J. Rock Mech. Geotech. Eng. 2023, 16, 1883–1895. [Google Scholar] [CrossRef]
  6. Han, Y.; Wang, Q.; Liu, J.; Li, X. Seepage characteristics in unsaturated dispersive soil considering soil salinity and density impacts: Experimental and numerical combined study. J. Hydrol. 2022, 614, 128538. [Google Scholar] [CrossRef]
  7. Ying, Z.; Cui, Y.-J.; Benahmed, N.; Duc, M. Salinity effect on the compaction behaviour, matric suction, stiffness and microstructure of a silty soil. J. Rock Mech. Geotech. Eng. 2021, 13, 855–863. [Google Scholar] [CrossRef]
  8. ASTM D4318–17; Standard Test Methods for Liquid Limit, Plastic Limit, and Plasticity Index of Soils. ASTM International: West Conshohocken, PA, USA, 2018. [CrossRef]
  9. ASTM D1557; Standard Test Methods for Laboratory Compaction Characteristics of Soil Using Modified Effort (56,000 ft-lbf/ft3(2,700 kn-m/m3)). ASTM International: West Conshohocken, PA, USA, 2009. [CrossRef] [PubMed]
  10. ASTM D2487-17; Standard Practice for Classification of Soils for Engineering Purposes (Unified Soil Classification System). ASTM International: West Conshohocken, PA, USA, 2020. [CrossRef]
  11. GB/T 50942-2014; Technical Code for Building in Saline Soil Regions (2015): Ministry of Housing and Urban-Rural Development. Standards Press of China: Beijing, China, 2015. (In Chinese)
  12. Spagnoli, G.; Shimobe, S. An overview on the compaction characteristics of soils by laboratory tests. Eng. Geol. 2020, 278, 105830. [Google Scholar] [CrossRef]
  13. Juca, J.; Maciel, F. Gas permeability of a compacted soil used in a landfill cover layer. Unsatur. Soils 2006, 2006, 1535–1546. [Google Scholar] [CrossRef]
  14. Wen, T.; Wang, P.; Shao, L.; Guo, X. Experimental investigations of soil shrinkage characteristics and their effects on the soil water characteristic curve. Eng. Geol. 2021, 284, 106035. [Google Scholar] [CrossRef]
  15. Wong, J.M.; Elwood, D.; Fredlund, D.G. Use of a three-dimensional scanner for shrinkage curve tests. Can. Geotech. J. 2019, 56, 526–535. [Google Scholar] [CrossRef]
  16. ASTM D2434-22; Standard Test Methods for Measurement of Hydraulic Conductivity of Coarse-Grained Soils. ASTM International: West Conshohocken, PA, USA, 2022.
  17. Ying, Z.; Cui, Y.-J.; Duc, M.; Benahmed, N.; Bessaies-Bey, H.; Chen, B. Salinity effect on the liquid limit of soils. Acta Geotech. 2020, 16, 1101–1111. [Google Scholar] [CrossRef]
  18. Zhou, J.; You, X.; Niu, B.; Gong, L. The flocculation process of released clay particles and its effect on the permeability of porous media. Hydrogeol. J. 2019, 27, 1827–1835. [Google Scholar] [CrossRef]
  19. Cheng, H.; Zhang, L.; Shi, C.; Fan, P. Experimental study and model prediction of the influence of different factors on the mechanical properties of saline clay. Sci. Rep. 2025, 15, 3490. [Google Scholar] [CrossRef] [PubMed]
  20. Ng, C.; Peprah-Manu, D. Pore structure effects on the water retention behaviour of a compacted silty sand soil subjected to drying-wetting cycles. Eng. Geol. 2022, 313, 106963. [Google Scholar] [CrossRef]
  21. Luo, Y.; Wen, T.; Lin, X.; Chen, X.; Shao, L. Quantitative analysis of pore-size influence on granite residual soil permeability using ct scanning. J. Hydrol. 2024, 645, 132133. [Google Scholar] [CrossRef]
  22. Su, Y.; Cui, Y.-J.; Dupla, J.; Canou, J. Effect of water content on permanent deformation of fine/coarse soil mixtures with varying coarse grain contents and subjected to multi-stage cyclic loading. Acta Geotech. 2022, 17, 3259–3268. [Google Scholar] [CrossRef]
  23. Tan, Q.; Kang, Y.; You, L.; Peng, H.; Zhao, F.; Bai, J. The role of salt dissolution on the evolution of petrophysical properties in saline-lacustrine carbonate reservoirs: Pore structure, porosity-permeability, and mechanics. J. Hydrol. 2023, 618, 129257. [Google Scholar] [CrossRef]
  24. Wang, Y.; Li, T.-L.; Zhao, C.; Hou, X.; Li, P.; Zhang, Y. A study on the effect of pore and particle distributions on the soil water characteristic curve of compacted loess soil. Environ. Earth Sci. 2021, 80, 764. [Google Scholar] [CrossRef]
  25. Wen, T.; Chen, X.; Luo, Y.; Shao, L.; Niu, G. Three-dimensional pore structure characteristics of granite residual soil and their relationship with hydraulic properties under different particle gradation by x-ray computed tomography. J. Hydrol. 2023, 618, 129230. [Google Scholar] [CrossRef]
  26. Won, J.; Kim, T.; Kang, M.; Choe, Y.-R.; Choi, H. Suffusion of sand-clay mixture by three-staged change of ionic strength. Can. Geotech. J. 2022, 59, 2008–2013. [Google Scholar] [CrossRef]
  27. You, Z.; Lai, Y.; Zhang, M.-Y.; Liu, E. Quantitative analysis for the effect of microstructure on the mechanical strength of frozen silty clay with different contents of sodium sulfate. Environ. Earth Sci. 2017, 76, 143. [Google Scholar] [CrossRef]
  28. Safadoust, A.; Dashtpeyma, B.; Mosaddeghi, M.; Asgarzadeh, H.; Gharabaghi, B. Effect of water salinity and sodicity on soil least limiting water range. Soil Sci. Soc. Am. J. 2024, 88, 371–386. [Google Scholar] [CrossRef]
  29. Yang, X.; Zhang, K.; Chang, T.; Shaghaleh, H.; Qi, Z.; Zhang, J.; Ye, H.; Hamoud, Y. Interactive effects of microbial fertilizer and soil salinity on the hydraulic properties of salt-affected soil. Plants 2024, 13, 473. [Google Scholar] [CrossRef] [PubMed]
  30. Adeyemo, T.; Kramer, I.; Levy, G.; Mau, Y. Salinity and sodicity can cause hysteresis in soil hydraulic conductivity. Geoderma 2021, 413, 115765. [Google Scholar] [CrossRef]
  31. Birle, E.; Heyer, D.; Vogt, N. Influence of the initial water content and dry density on the soil–water retention curve and the shrinkage behavior of a compacted clay. Acta Geotech. 2008, 3, 191–200. [Google Scholar] [CrossRef]
  32. Song, Z.; Yao, Q.; Garg, A.; Wen, T. Synergistic effects of biochar and plant fibers on the hydro-mechanical behavior of landfill cover soil. Acta Geotech. 2026. [Google Scholar] [CrossRef]
  33. Wen, T.; Luo, Y.; Tang, M.; Chen, X.; Shao, L. Effects of representative elementary volume size on three-dimensional pore characteristics for modified granite residual soil. J. Hydrol. 2024, 643, 132006. [Google Scholar] [CrossRef]
  34. Tian, B.-G.; Cheng, Q.; Tang, C.; Zeng, H.; Xu, J.J.; Shi, B. Effects of compaction state on desiccation cracking behaviour of a clayey soil subjected to wetting-drying cycles. Eng. Geol. 2022, 302, 106650. [Google Scholar] [CrossRef]
  35. Zhao, N.; Ye, W.; Chen, B.; Chen, Y.; Cui, Y. Modeling of the swelling–shrinkage behavior of expansive clays during wetting–drying cycles. Acta Geotech. 2018, 14, 1325–1335. [Google Scholar] [CrossRef]
  36. Duan, Z.; Song, K.; Zhang, N.; Zheng, L.; Yan, X.-S.; Zhang, M. Characteristics and mechanisms of soil structure damage under salt weathering. Soil Tillage Res. 2024, 238, 106030. [Google Scholar] [CrossRef]
  37. Chang, K.; Feng, H.; Xing, J.; Wang, X.-P.; Yao, R.; Xing, X. High salinity prolongs water processes required for soil structure stability during drying–wetting cycles. Soil Sci. Soc. Am. J. 2024, 88, 1100–1108. [Google Scholar] [CrossRef]
  38. Jia, B.-B.; Cui, Y.-J.; Chen, W.-W. Influence of salt on the microstructure of loess under various drying conditions. Géotechnique 2025, 76, 87–101. [Google Scholar] [CrossRef]
  39. Song, Z.; Zhang, Z.; Lu, Y.; Du, X. Shrinkage behavior of compacted bentonite considering physicochemical effects. Sci. Total Environ. 2023, 906, 167547. [Google Scholar] [CrossRef] [PubMed]
  40. Xing, X.; Kang, D.; Ma, X. Differences in loam water retention and shrinkage behavior: Effects of various types and concentrations of salt ions. Soil Tillage Res. 2017, 167, 61–72. [Google Scholar] [CrossRef]
Figure 1. Preparation of salinized soil sample.
Geosciences 16 00242 g001
Figure 2. (a) Particle size distribution of SP-SC, and (b) the maximum dry density and optimum moisture content (The dashed line indicates the water content corresponding to the maximum dry density.) of SP-SC.
Geosciences 16 00242 g002
Figure 3. (a) Saturated hydraulic conductivity test; (b) drying shrinkage test.
Geosciences 16 00242 g003
Figure 4. (a) Saturated hydraulic conductivity at a dry density of 1.30 g/cm3; (b) Saturated hydraulic conductivity at a dry density of 1.35 g/cm3; (c) Saturated hydraulic conductivity at a dry density of 1.45 g/cm3; (d) Summary of saturated hydraulic conductivity at different dry densities.
Geosciences 16 00242 g004
Figure 5. (a) Porosity variation; (b) effect of porosity on saturated hydraulic conductivity (The circles represent the saturated hydraulic conductivity at different salt contents under the same dry density.).
Geosciences 16 00242 g005
Figure 6. (a) Water content variation over time at a dry density of 1.30 g/cm3; (b) degree of saturation variation over time at a dry density of 1.30 g/cm3; (c) water content variation over time at a dry density of 1.35 g/cm3; (d) degree of saturation variation over time at a dry density of 1.35 g/cm3; (e) water content variation over time at a dry density of 1.45 g/cm3; (f) degree of saturation variation over time at a dry density of 1.45 g/cm3.
Geosciences 16 00242 g006
Figure 7. (a) Axial strain variation over time at a dry density of 1.30 g/cm3; (b) radial strain variation over time at a dry density of 1.30 g/cm3; (c) axial strain variation over time at a dry density of 1.35 g/cm3; (d) radial strain variation over time at a dry density of 1.35 g/cm3; (e) axial strain variation over time at a dry density of 1.45 g/cm3; (f) radial strain variation over time at a dry density of 1.45 g/cm3.
Geosciences 16 00242 g007
Figure 8. (a) Final axial strain at different dry densities; (b) final radial strain at different dry densities.
Geosciences 16 00242 g008
Figure 9. Pearson correlation heatmap of the tested parameters.
Geosciences 16 00242 g009
Table 1. Basic properties of the SP-SC.
PropertySP-SC
Specific gravity (g/cm3)2.59
Plastic limit (%)33.12
Liquid limit (%)53.50
Plasticity index (%)20.38
Optimum moisture content (%)17.43
Maximum dry density (g/cm3)1.74
D600.33
D100.08
Cu3.84
Cc0.87
Table 2. Experimental plan.
SamplesDry Density (g/cm3)Salt Content (%)Degree of Compaction
SP11.30075%
SP1-0.5%1.300.575%
SP1-2%1.30275%
SP1-6%1.30675%
SP21.35078%
SP2-0.5%1.350.578%
SP2-2%1.35278%
SP2-6%1.35678%
SP31.45083%
SP3-0.5%1.450.583%
SP3-2%1.45283%
SP3-6%1.45683%
Table 3. One-way ANOVA showing the differential effects of various parameters on saturated hydraulic conductivity and Drying shrinkage.
ParameterSaturated Hydraulic ConductivityDrying Shrinkage
Fpη2Fpη2
Salt content49.172.23 × 10−240.392.474.67 × 10−40.86
Dry density170.683.15 × 10−360.593.859.78 × 10−70.90
Porosity63.521.07 × 10−410.762.221.64 × 10−30.84
Disclaimer/Publisher’s Note: The statements, opinions and data contained in all publications are solely those of the individual author(s) and contributor(s) and not of MDPI and/or the editor(s). MDPI and/or the editor(s) disclaim responsibility for any injury to people or property resulting from any ideas, methods, instructions or products referred to in the content.