Article

Conceptual Model for Development of Karst–Erosion Processes in Large Dam Reservoir Coastal Geosystem: Bratsk Reservoir, Baikal-Angara Hydroengineering System, Russia


Laboratory of Engineering Geology and Geoecology, Institute of the Earth’s Crust of Siberian Branch, Russian Academy of Sciences, Lermontov Street, 128, Irkutsk 664033, Russia
*
Author to whom correspondence should be addressed.
Geosciences 2026, 16(6), 241; https://doi.org/10.3390/geosciences16060241
Submission received: 9 April 2026 / Revised: 3 June 2026 / Accepted: 16 June 2026 / Published: 22 June 2026
(This article belongs to the Section Natural Hazards)

Abstract

The sulphate–carbonate karst in the southern part of the Bratsk Reservoir has been active throughout the reservoir’s operation. Long-term monitoring of the coastal zone, interpretation of multi-temporal images, and field studies at the Khadakhan key site resulted in the creation of a conceptual model of coastal geosystem functioning in areas of sulphate–carbonate rock development under conditions of long-term and seasonal fluctuations in the reservoir water level. The structure of interactions within the coastal geosystem is organized at three hierarchical levels: (1) the intra-rock level, (2) the level of interacting factors, and (3) the level of interacting exogenous geological processes, whose activation is driven by an external factor—changes in the reservoir’s water level. We identified five stages of gully formation and the cyclic nature of the karst–erosion process in the coastal geosystem under conditions of seasonal and long-term reservoir water-level fluctuations. Our findings indicate that, when regulating reservoir water levels, dramatic drawdowns should be avoided. This conceptual model aims to improve the understanding of the impact of large reservoir operation on the dynamics of a complex of interacting coastal processes, as well as on the peculiarities of karst development in a boreal climate.

1. Introduction

The study of karst is relevant in different coastal and terrestrial environments worldwide: Mediterranean, Alpine, orogenic and others [1,2,3,4,5,6,7,8,9,10,11,12,13,14,15,16].
Karst forms in coastal areas are of great interest as a result of terrestrial and marine environment interactions. Since karst is a process of rock dissolution by water, additional conditions are created in the coastal zone because of the wave activity of oceans and seas, and unique forms of karst relief are formed: notches, and coastal karren [17].
It was established that coastal karst forms have subsidence rates that are an order of magnitude higher than those of internal karst fields [18].
As investigations show, coastal karst forms with various morphologies, dynamics, etc., emerge in different environments. Notches develop in protected microtidal environments, where wave action is subdued due to enhanced biological activity, and they are relatively reliable sea-level indicators. In the intertidal zones in warm climates, biological weathering often plays a significant role [17]. In contrast, in the boreal climate, the coastal karst features in the study area include intense frost weathering, accompanied by leaching processes [19].
Coastal karst forms develop in the zone of short- and long-term Quaternary sea-level changes. The study of the speleothems in caves of Quaternary carbonate strata on the west coast of Australia revealed that the main periods of their growth correspond to high sea-level marks [20].
Unlike seas and oceans, the water level in dam reservoirs is much more controlled and regulated. These fluctuations exhibit larger amplitudes and more frequent cyclicity, making them a stronger factor in coastal zone impacts. As many studies show, such cyclicity of the level regime is a triggering factor for the activation of many exogenous geological processes (EGPs) in the coastal zone [21,22]. Thus, coastal karst form development occurs at the contact points between two environments of land and sea and depends on their characteristics.
All these works have focused solely on the study of karst features and fail to consider the interaction between karst and gully erosion processes in the coastal zone. The Bratsk Reservoir has served as a natural laboratory for studying the development and activation of exogenous geological processes for more than half a century (since the 1960s). The Bratsk Reservoir is uniquely important because it combines a large scale (170 km3, the second largest in the world), a long operational history (>50 years since the 1960s), and continuous long-term monitoring of the geological environment’s response to technogenic impact. The present study aims to identify and understand cyclic karst–erosion processes under regulated large reservoir fluctuations.
Karst areas are widespread in the south of the Siberian platform (Irkutsk amphitheater) [2,23], especially in our study area—the coastal zone of the Bratsk Reservoir. Various karst types are highly developed, which belong to the carbonate and sulfate–carbonate types according to the rock composition, and to the covered karst type according to the geological and structural features and the position in the section of karstifying rocks.
In the south of the Irkutsk amphitheater, karst has a long history of development. Creation of the Bratsk Reservoir became the trigger for the modern activation of the karst process in the coastal zone [24,25], and the key factors of the activation included formation of the backwater-, reservoir- and groundwater-level fluctuations. The southern part of the Bratsk Reservoir is located in the karstifying rocks of the Lower–Middle Cambrian gypsum–carbonate–salt formation, which includes dolomites, limestones, anhydrite–dolomites, and gypsums. The total length of the coastline in such deposits is 589 km [26].
The sulphate–carbonate karst of the south of the Bratsk Reservoir has remained active throughout the entire period of reservoir operation, and therefore it refers to regional hazardous geological processes [27,28,29]. According to GA Maximovich’s classification of the territory by the degree of stability [30], the studied area refers to unstable regions with an intensity of sinkhole formation of 1–10 sinkholes per 1 km2 per year [24].
Prior to the current study, our group presented a conceptual model of the karst–erosion process development under the conditions of the Bratsk Reservoir, considering the dynamics of the karst–erosion gully in 1967–2013 [31]. As a result, we assumed that in the following decades, similar karst–erosion forms are sure to develop along the regional fracturing network [32].
In 2013–2023, we obtained new data and managed to update our model based on new examples and more accurately compare it with seasonal and annual regulated water-level fluctuations.
In the research, our main goal was to investigate the true nature of the karst–erosion process in the coastal geosystem and to confirm the assumption of the process’s cyclic nature. The principal objectives included identifying environmental features of karst in a boreal climate condition and mechanisms of gully development, determining the structure of EGP interactions in the coastal geosystem, and clarifying the development model of the karst–erosion process under conditions of long-term and seasonal fluctuations in the reservoir water level.
Our study adds a new insight to the model of karst–erosion processes on the coast of large dam reservoirs and improves the understanding of anthropogenic impacts on the coastal geosystem by involving sensitive indicators such as EGPs.

2. Study Area

The climate of the study area is Boreal (Dwc), characterized by severe dry winters and precipitation-abundant summers. It is a continental climate with long, cold (often very cold) winters, and short, warm-to-cool summers. For almost half the year, from mid-October until the beginning of April, the average temperature is below 0 °C. In winter, the coldest month is January, with an average temperature of –23.3 °C. In summer, the warmest month is July with an average temperature of +19.1 °C [33]. In the whole territory influenced by the Bratsk Reservoir, the depth of seasonal ground freezing reaches 2.5–3.0 m [34]. The transition in average daily air temperature through 0 °C towards negative values happens on October 8–15 and towards positive ones on 12–20 April.
The study area belongs to the zone of semi-transitional seasonal freezing (mean annual ground temperature = +1.0 °C to +2.0 °C), with a highly continental type (temperature amplitude A = 34–38°). This type occurs in forest-steppe zones underlain by loams with a moisture content of 15–23% in the freezing layer.
Total annual precipitation is 300–500 mm, with an irregular distribution within the year: over 75% of the annual precipitation (primarily as heavy rainfalls) is recorded in summer, with the maximum (25% of the total annual precipitation) in July–August.
Winds of west and north-west directions predominate. Their frequency of occurrence and speed have a significant influence on the character and intensity of coastal processes.
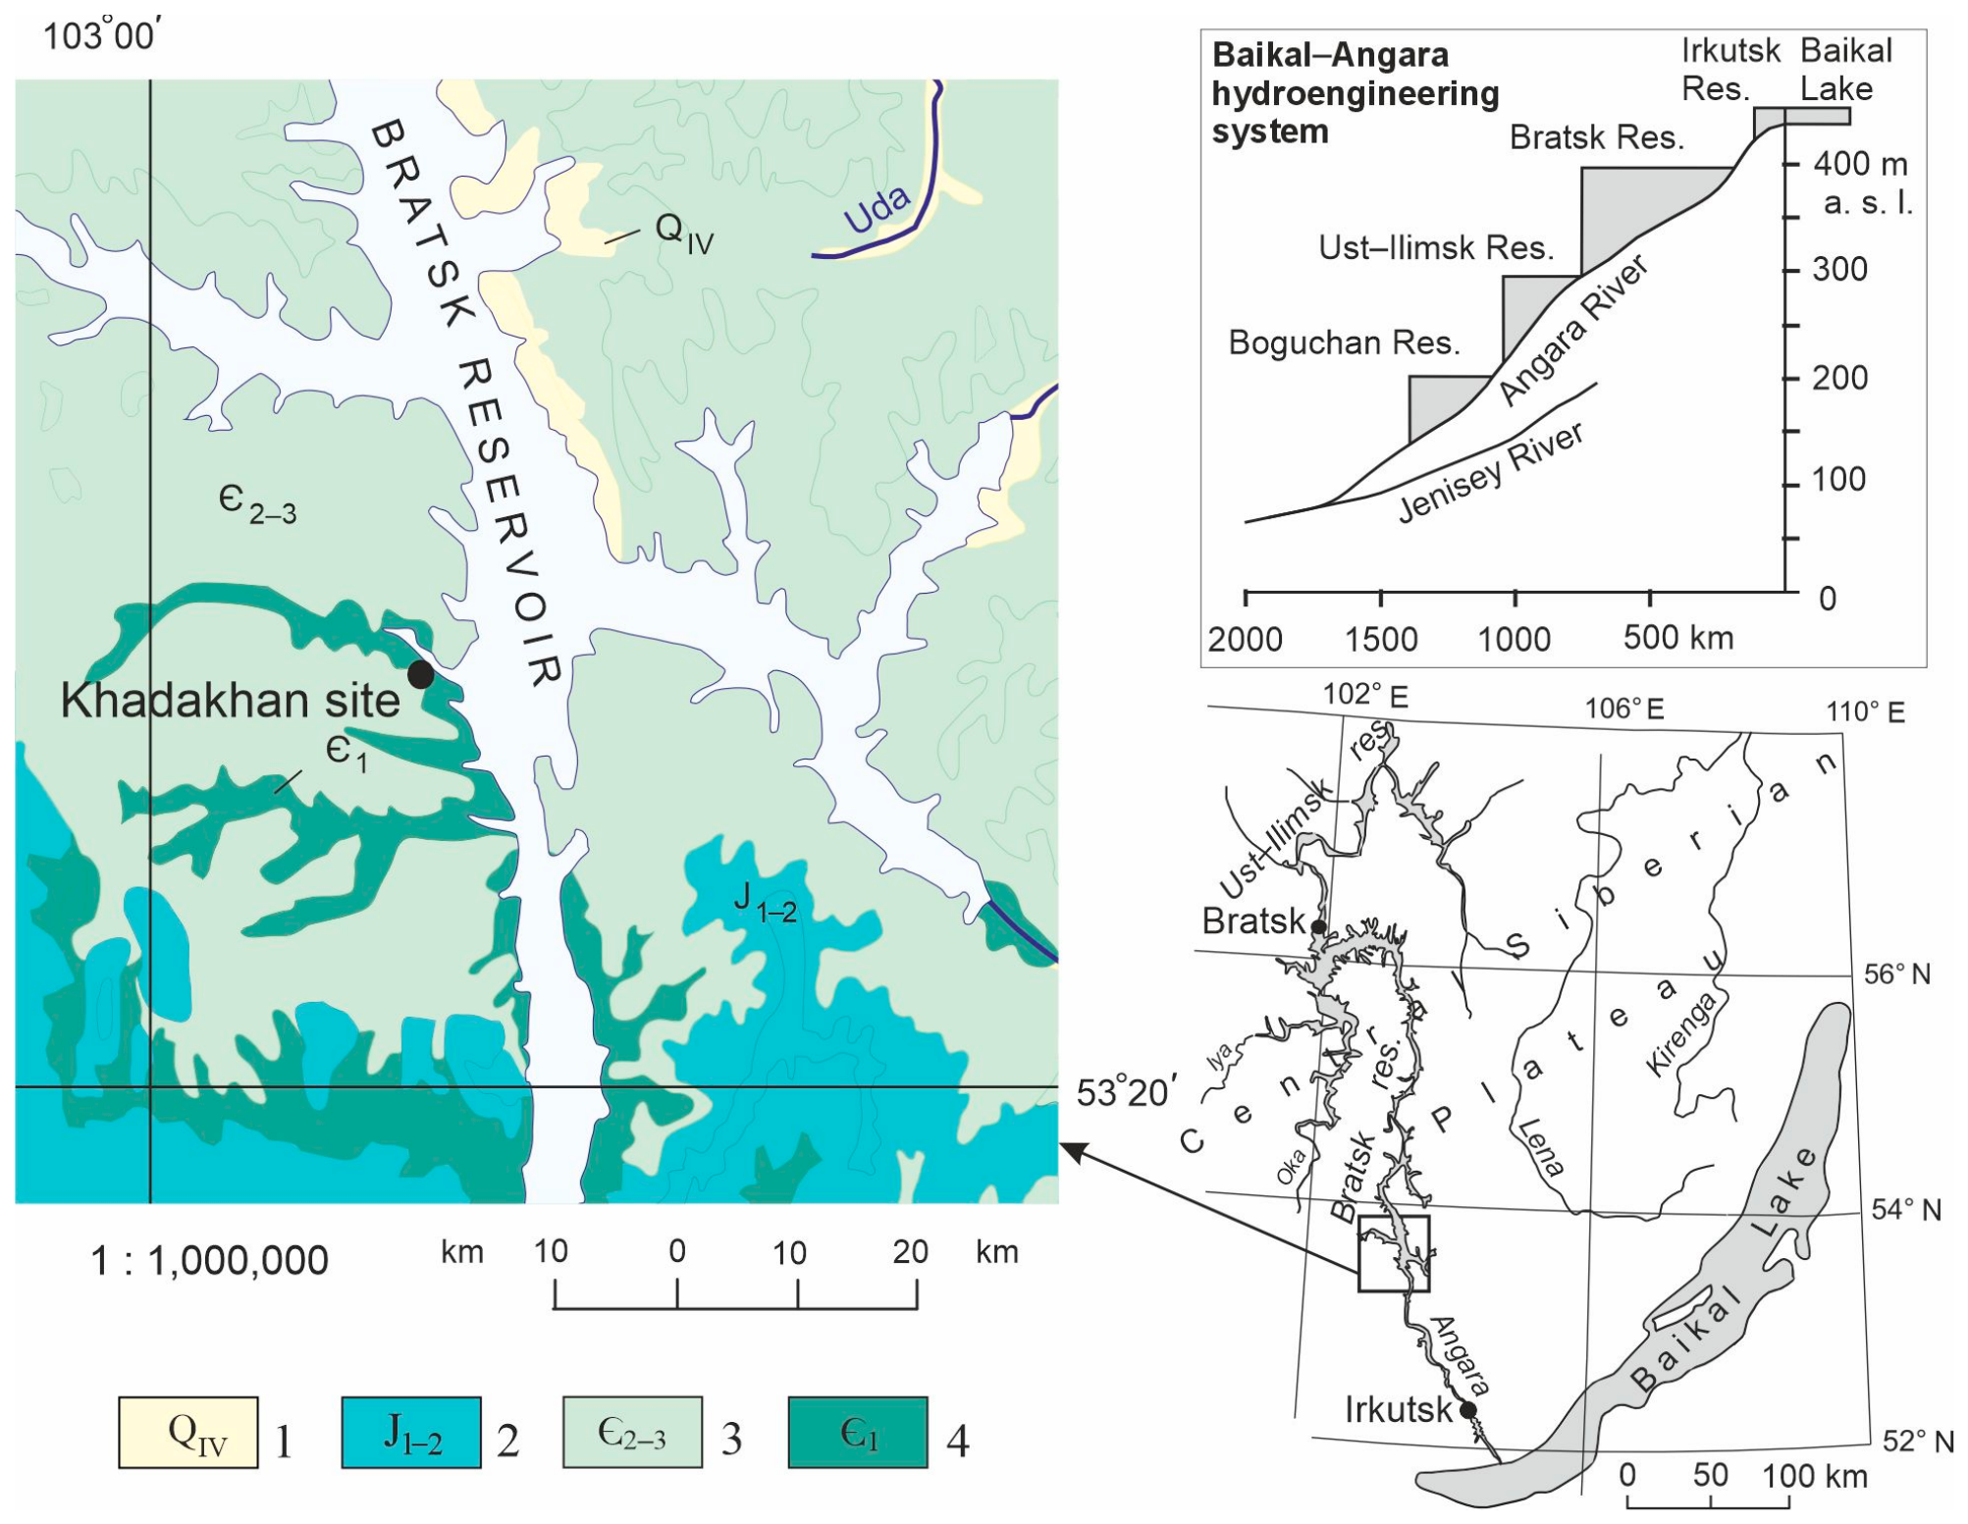
The Bratsk Reservoir is located in the area of the valleys of the Angara, Oka, and Iya rivers (southern part of the Central Siberian Plateau, westwards of Lake Baikal) at an elevation of 400–600 m a.s.l. (Figure 1). This is one of four reservoirs of the Angara hydroelectric complex (including the Irkutsk, Ust-Ilimsk, and Boguchan Reservoirs). By its volume of 170 km3, the Bratsk Reservoir ranks as second in the world, with the water surface area amounting to 5470 km2 (Bratsk Reservoir 1963); the total length of the coastline extends for 6013 km [27].
Among the reservoirs of the Baikal-Angara hydroengineering system, the Bratsk Reservoir is distinguished by a depth of water-level drawdown of up to 10 m. Such a maximum drawdown occurred several times during the reservoir operation period and caused significant activation of many exogenous geological processes in the coastal zone [35].
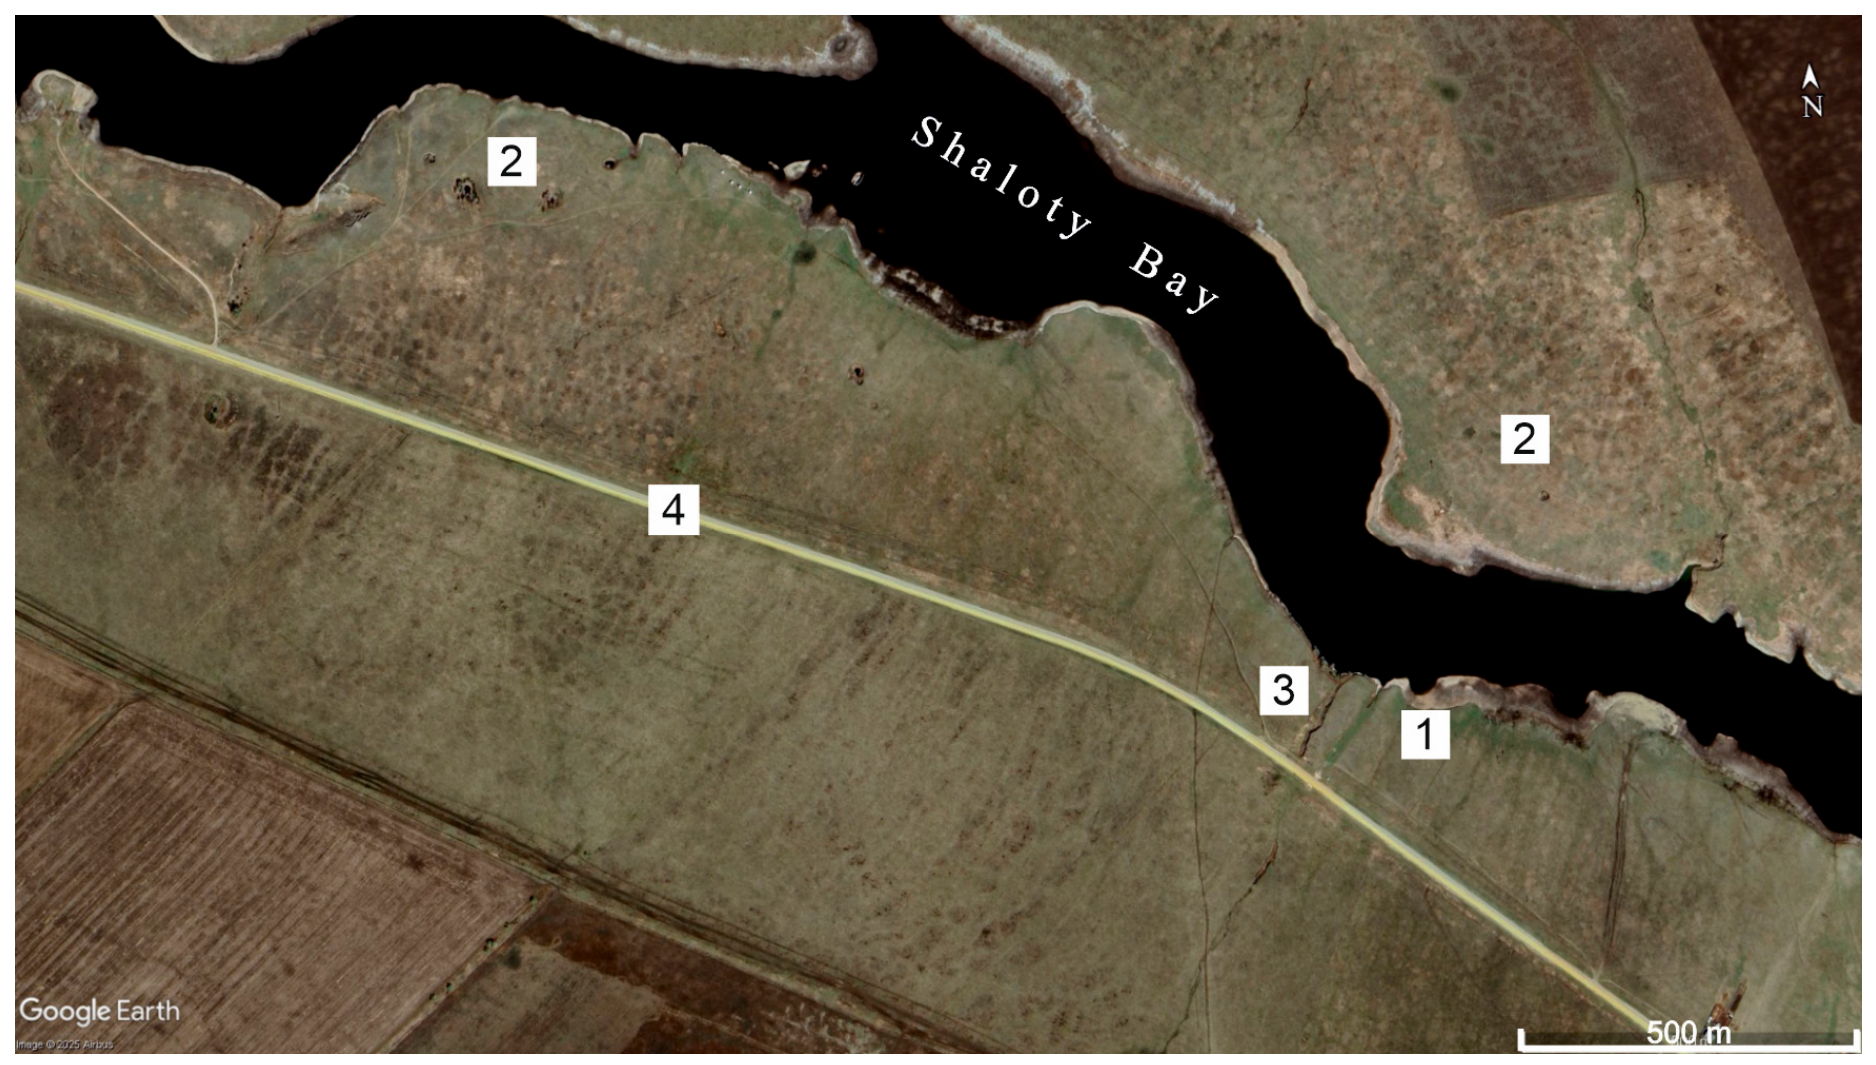
The study area is the Khadahan site, which is located on the right bank of Shaloty Bay, in the area of covered karst. The Khadakhan site is a key site for studying the interaction between karst and erosion processes in the covered karst zone, i.e., where karstifying rocks are overlain by loess-like deposits. It is representative of the 600 km coastline of karstifying rocks of the southern Bratsk Reservoir, as shown in the typical karst–erosion landscape in the Google Earth Pro image (Figure 2).
Karst–erosional forms develop on the erosion–denudational slope of 10–15° inclination, which changes into the steep (40°) cliff at the contact point with the Bratsk Reservoir. They develop in 2–10 m thick deluvial deposits of loess-like loam and sandy loam overlying the sulfate–carbonate–gypsum Cambrian rocks.

3. Materials and Methods

The scientific method of this study is the “geosystem approach” [36]. According to this approach, coastal geosystems are the coast areas within the reservoir backwater influence zone with the paragenetically related EGPs, which are sensitive indicators reflecting the state of the system and its change in time and space.
Analysis of the geodynamic situation and coastal geosystem dynamics required application of the methodology based on geosystem approach to the study of interacting processes [37].
A comprehensive analysis of the composition, structure and soil properties by laboratory methods was carried out in the Centre for Geodynamics and Geochronology at the Institute of the Earth’s Crust SB RAS. A complex of composition indicators, soil microstructure, physical (bulk density, Pb; dry density, Pd; particle density, Ps; porosity, n; degree of water saturation, Sr), physico-chemical (plasticity index, J; relative swelling, Esw; volumetric shrinkage, U; time of air-dry soil sample disintegration in water, t; cation exchange capacity, CEC; pH index, content of water-soluble salts, Sws; content of carbonates, Scc), deformation (coefficient of relative subsidence ability, Esl) and strength (cohesion, Ch; angle of internal friction, φ) properties of soils were analyzed using standard techniques.
The granulometric analysis of soils was carried out by the pipette method with microaggregate, standard (semi-dispersed) and dispersed specimen preparation. Microaggregation coefficients (Kma1, %) were calculated for all fractions according to the method proposed by Larionov [38] and expanded by Ryashchenko et al. [39]. The microaggregation coefficient represents the difference in the content of fraction determined by dispersed (by boiling a suspension with the addition of sodium pyrophosphate, the maximum destruction of aggregates occurs) and aggregate sample preparation (by shaking the suspension, only water non-resistant aggregates are destroyed) [40]. Microaggregation coefficient Kma1 was determined for clay fraction (<0.002).
The number of aggregates (A, %) and the dispersion ratio of fraction <0.001 mm (F6, %) were calculated. Classification tables were used to evaluate the microstructure based on the results of granulometric analysis [41]. A total of 180 determinations were performed (6 samples for 30 indicators).
For medium-term monitoring of the EGPs, a comparative analysis of multi-temporal aerial photographs was used, as well as the results of monitoring works of the Laboratory of Engineering Geology and Geoecology of the IEC SB RAS immediately after inundation and during the first period of operation of the reservoir.
To obtain the short-term dynamics of the EGPs, a total station survey was performed using an electronic total station Trimble TS635 (Trimble Navigation Ltd., Dayton, OH, USA). Since 2021, aerial photography, using DJI Inspire 1 V2.0 and DJI Phantom 4 Pro RTK quadrocopters (DJI, Shenzhen, China), has been used.
UAV surveys. At flight altitudes of 50–60 m, the ground sampling distance (GSD) of orthophoto plans ranged from 1.1 to 2.2 cm/pix, while digital elevation models (DEMs) achieved a resolution of 2.6–5.4 cm/pix. Error correction was ensured through RTK georeferencing, the deployment of 2–3 artificial ground control points per site, camera position optimization in Agisoft Metashape (Agisoft LLC, St. Petersburg, Russia), point cloud classification excluding vegetation and man-made structures, and multi-temporal model validation using checkpoints.
Total station surveys. Surveying was conducted with a point spacing of 1–5 m. Systematic errors were minimized by orienting the instrument to reference geodetic network points and by establishing closed traverse loops with a relative misclosure not exceeding 1:2000.
Archival aerial photographs (spatial resolution 15–30 cm/pix). Error correction was performed by georeferencing the images using 1:25,000–1:50,000 topographic maps and stable natural/anthropogenic ground control points, followed by orthorectification using a digital elevation model derived from the same topographic maps or from field surveys. The root mean square error (RMSE) of the georeferencing was 1–2 pixels. This method is suitable for detecting morphological changes larger than 1–2 m but is not recommended for features smaller than 0.5 m.

4. Results and Discussion

In accordance with the system analysis [36], EGPs develop in those areas where geological environment conditions favor it. As a rule, this is a combination of conditions and factors.
For creation of the conceptual model, we analyzed regional and local structures and properties of the geological environment, which provoke and trigger the development of karst–erosion processes.

4.1. Conditions and Factors for Development of Interacting Processes

The geological cross-section of the study site consists of Lower Cambrian gypsum–salt–carbonate rocks of the upper sub-suite of the Angara suite and Middle–Upper Cambrian rocks of the red-colored terrigenous-carbonate formation of the Verkholensk suite. Quaternary deposits are represented by deluvial loess-like sandy loams and loams with a thickness of 2–10 m. Sulfate–carbonate and sulfate deposits prone to karst occur at absolute elevations of 380–400 m; that is, in the zone of variable water saturation and upper part of the saturated zone.
We analyzed the soil structure and properties to identify the interaction mechanisms between karst and erosion processes. The ground section of Gully 1 reveals a 4.8 m thick sequence of loose deluvial deposits, whose physical and mechanical characteristics directly influence the nature and intensity of karst–erosion interactions.
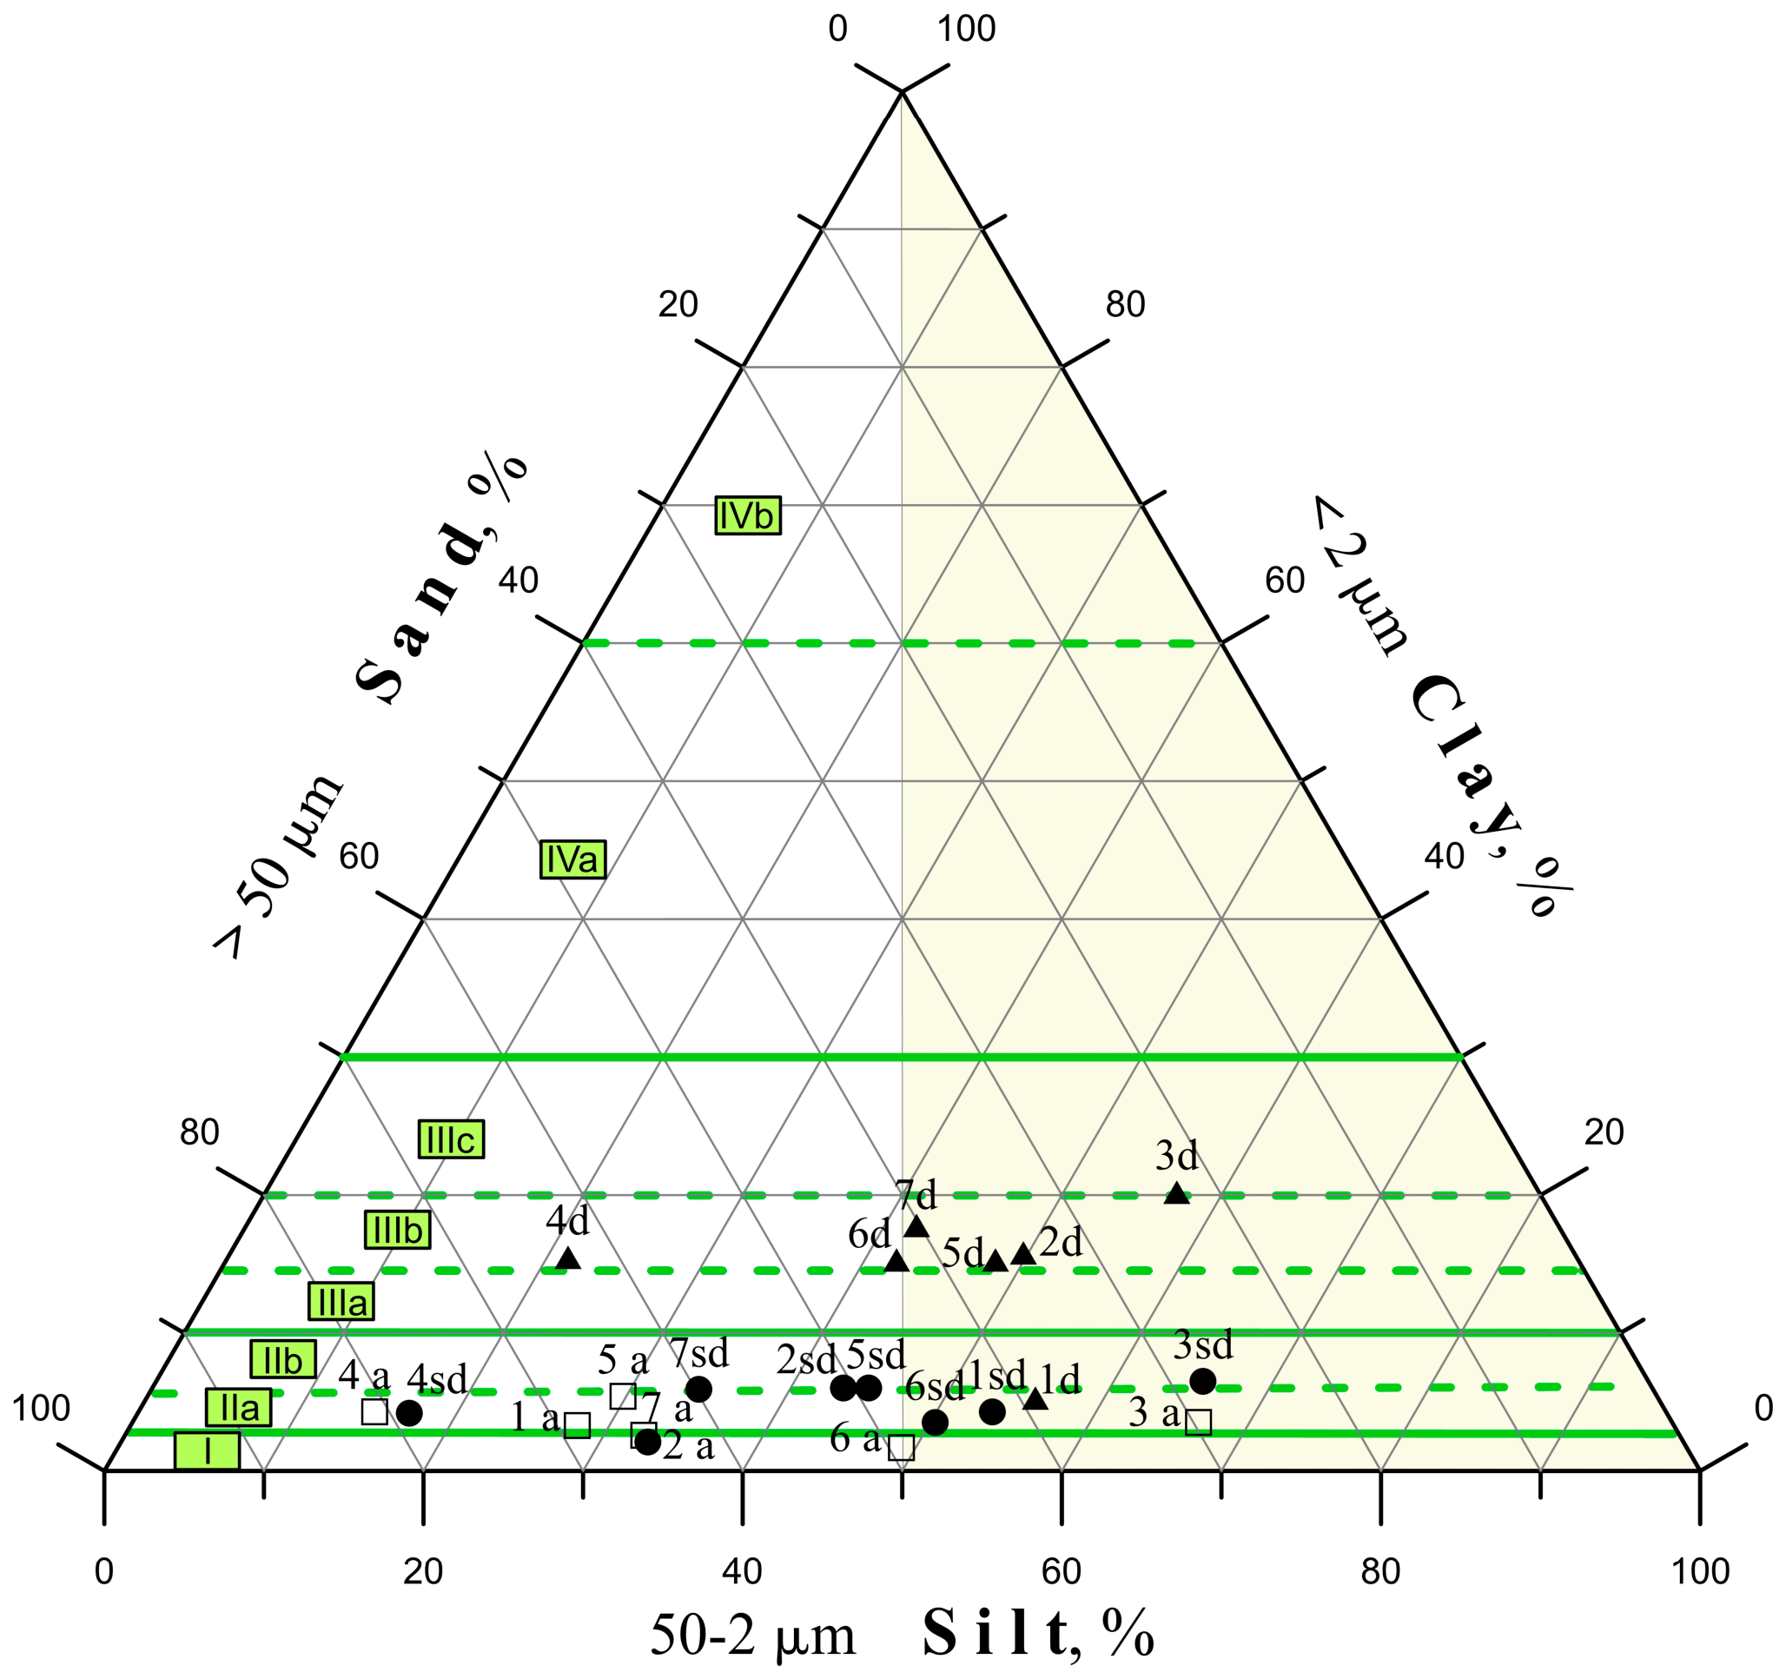
Figure 3 presents a Ferre diagram of the soil granulometric analysis results for three types of specimen preparation (a—aggregate, sd—semi-dispersed, d—dispersed), with lithological boundaries shown by solid and dashed lines, and silty varieties highlighted in yellow.
The diagram clearly shows that the soils of the section group predominantly within the sand and light sandy loam fields and are weakly aggregated, especially in the upper part of the section, which is a key factor in the activation of suffosion and gully erosion processes.
The topsoil layer (0.3 m) consists of light, non-aggregated, non-plastic silty sandy loam (silt 53.5%, clay 4.3%, microaggregation coefficient Kma1 = 2%; Figure 3, specimen 1). Its skeleton was an aggregated microstructure with fine sand-sized aggregates, combined with a very low dry density (ρd = 1.08 g/cm3) and high porosity (n = 55%), indicating a highly unstable structure. The low degree of saturation (Sr = 0.398; Table 1) and under consolidated state suggest that this horizon is prone to rapid infiltration and internal erosion. This combination facilitates downward water percolation, promoting dissolution of the underlying carbonate substrates—a key factor in the formation of subsurface suffosion cavities and their subsequent collapse.
Below the topsoil (specimens 2–6, Figure 3), light-to-heavy sandy loams exhibit variable silt content and aggregation (Kma1 = 2.0–16.7%; clay fraction 3.5–6.5%). The very low-to-low dispersion ratio (F6 = 7–18%) for the <0.001 mm fraction indicates that fine particles are not easily detached by percolating water; however, the aggregated skeletal to skeleton-aggregated microstructure, dominated by fine sand (0.05–0.25 mm), still permits rapid internal flow. These deposits have normal plasticity (J = 2.8–4.0%), a low dry density (ρd = 1.08–1.50 g/cm3), and high porosity (n = 42.7–55.0%). As shown in Table 1, the upper part retains low levels of moisture (Sr = 0.323–0.398), but the lower zone shows normal-to-high moisture levels (Sr = 0.538–0.734). This vertical moisture gradient promotes seasonal saturation, enhancing dissolution of calcareous components and progressive weakening of the soil matrix.
The material is strongly calcareous (Scc = 51–62%) and slightly saline (Sws = 0.34–0.58%, sulfate type), with an alkaline pH (7.8) and low organic matter (0.3–0.696%; Table 1). The combination of high carbonate content and low cohesion (Ch = 0.20–0.55 kg/cm2) makes the soil susceptible to both chemical dissolution and mechanical erosion. The low cation exchange capacity (CEC = 8.60–20.26 meq/100 g) reflects low clay mineral activity and thus limited swelling. This prevents crack self-sealing, maintains high permeability, and promotes water percolation—all of which facilitate karstification, suffosion (internal erosion), and gully erosion. The reduced cohesion of clay particles further enhances particle transport by seepage flow, leading to subsurface cavity formation and subsequent collapse. The soil does not swell (Esw = 0.6–3.3%) but shows volumetric shrinkage (U = 6.8–7.0%; Table 1), which facilitates crack formation during dry periods, creating preferential flow paths. Upon wetting, the material exhibits instant slaking (t = 1–2 s), a key mechanism for rapid structural collapse. This slaking behavior, combined with low cohesion and internal friction angles (φ = 17–29°; Table 1), explains the observed subsidence under natural pressure (Esl = 0.012–0.032) and the high susceptibility to both surface erosion and subsoil cavity formation.
At a depth of 3.2 m, a 0.1 m thick interlayer of gruss soil with light sandy loam filler (specimen 4, Figure 3) differs from the main sequence by its higher sand fraction and lower silt content. This layer acts as a textural discontinuity, potentially concentrating water flow and enhancing local dissolution and piping. In the context of karst–erosion interactions, such interlayers serve as preferential zones for lateral water movement, accelerating subsoil erosion and promoting the development of collapse features.
Overall, the interpreted properties (Figure 3; Table 1) indicate that the studied deposits are highly susceptible to a coupled karst–erosion process: rapid water infiltration through the loose, high porosity surface layer triggers dissolution of carbonates and sulfates, while the low cohesion and instant slaking behavior facilitates mechanical collapse of soil aggregates and cavity walls. This synergy explains the observed karst–erosion mechanism in Gully 1.
Thus, the following environmental features contribute to development of erosion process and its interaction with karstification process. The sandy loams of the section are characterized by high carbonate content, predominance of fine-grained sandy aggregates (0.05–0.25 mm), low cohesion, sulfate salinity, instant soaking, subsidence at natural pressure (Esl 0.012–0.03), high volume shrinkage (U 6.8–10.5%). All these factors contribute to massif fracturing, to formation of significant karst–suffosion cavities, their further failure and linear growth due to erosion.
The development of karst and gully erosion processes is determined by their confinement to the tectonic fracture zones [42]. Our study area is characterized by a regional joint set in the NW and NE directions and associated karst, karst–landslide and karst–gully occurrence.
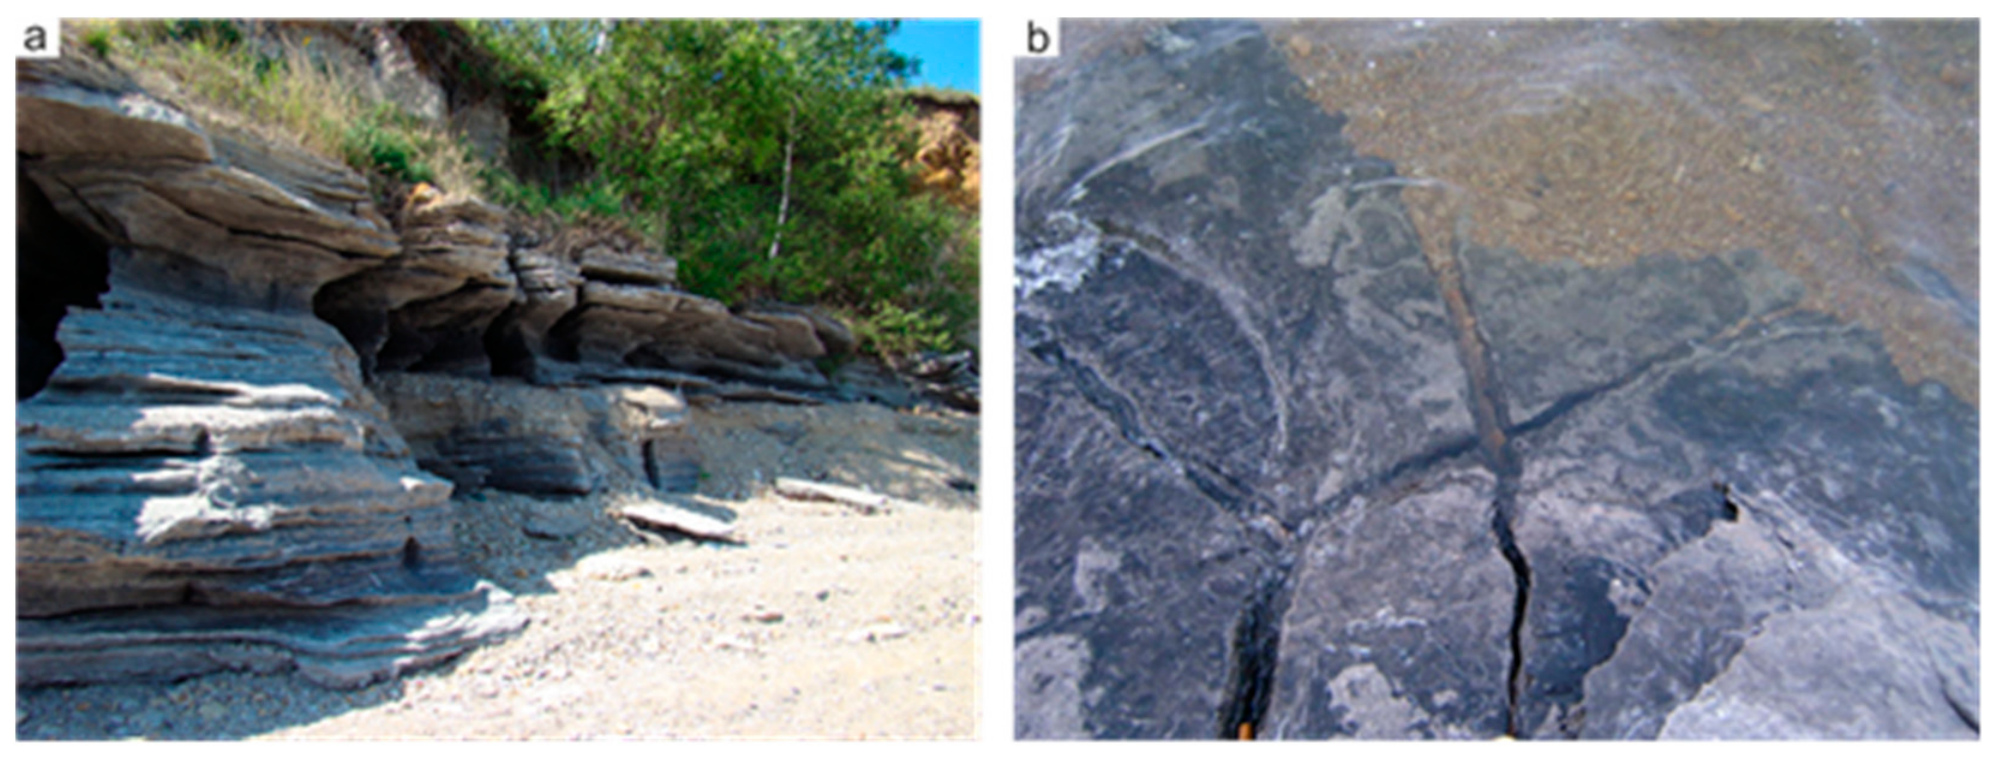
Among other types of fractures, bedding joints in almost subhorizontal-bedding rocks, subsidence cracks and weathering cracks are predominantly important for the development of sulfate–carbonate karst (Figure 4). The structural and textural properties of bedrock, existence of microcracks, presence of terrigenous material and others are more important for the leaching of gypsum than chemical composition [43]. The subhorizontal-bedding of cliff rocks and their solubility determine the karst and shore–erosion mechanisms. The cliff face has lines of weakness such as fractures and bedding planes that are weathered and leached.
In Figure 4a, a karst–wave–cut niche is visible within the subhorizontal-bedding rocks; the niche shape and size illustrate active dissolution at the water level. Figure 4b shows tectonic fractures and bedding plane joints, which are preferentially weathered and leached, providing pathways for water infiltration.
The dissolution of gypsum is significant, so extensive cavities can form during one season of standing water at high levels of tectonic and lithological fracturing. The sizes of the niches depend on the composition of the rocks composing the shore edge and vary significantly: 0.1–1.2 m wide, 0.5–6.0 m deep.
The boreal climate of the study area, with significant fluctuations in annual and daily air temperatures, deep seasonal freezing, soil thawing peculiarities, as well as tectonic fracturing of bedrock, are the factors of physical weathering, and they form weathering fractures in the coastal scarp. During periods of high water levels (which, in the annual operating cycle of the reservoir, always occur in autumn), frost weathering of the shore edge—driven by frequent temperature passes through 0 °C—creates fissured zones, forming weathering niches and giving rise to wave–cut niches. The formation of such niches with a depth of 0.3–0.5 m inside the slope occurs within 3–4 years [27]. In areas of karst rocks, physical weathering is enhanced by chemical weathering through leaching processes. Primary gully cuts subsequently develop from these niches.
The freezing depth reaches 2.5 m. Solid precipitation, amounting to 45–78 mm per year, occurs from November to April. In spring, the development of erosion is influenced by rapid snowmelt runoff under conditions of deep seasonal ground freezing and its subsequent thawing regime. Snow cover thickness varies from 10 to 30 cm. The water equivalent of the snow cover generally reaches its maximum in March, ranging from 39 to 67 mm during the studied period. Snow thawing begins in the first ten-day period of April, and by 26–27 April the land surface becomes free of snow cover but remains unvegetated until mid-May. Furthermore, deep ground freezing impedes the infiltration of meltwater.
By this time, the thaw depth varies between 20 and 40 cm, with the highest thawing rates recorded in May–June. The alternation of daytime thawing and nighttime refreezing desiccates the surface soil layer. This state promotes wind and meltwater erosion because it reduces the soil’s resistance to erosion.
The hydrogeological structure (fractures and conduit systems) in karst basins is very different from that in nonkarst basins, resulting in great spatiotemporal differences in the hydrological characteristics between karst and nonkarst areas [44]. Since the beginning of the Bratsk Reservoir operation, there has been a profound restructuring of hydrogeological conditions in the backwater zone [45]. Flooding of the intensively fractured aeration zone caused an increase in the width of the backwater zone. It was found that the groundwater level repeats the changes in the reservoir level with varying degrees of delay, and the width of the influence zone and the height of the groundwater backwater table vary within a significant range [27,46]. Technological drawdown of the reservoir entails an increase in the groundwater flow gradient and ultimately intensifies leaching and matter transport processes in the backwater zone. The width of the Bratsk Reservoir sulphate–carbonate karst activation zone in the Khadakhan–Melkhitui section reached 6 km [24].
Intensification of karst after filling (in the reservoir backwater zone) has been observed at other reservoirs created in the area of karstifying rocks, such as the Kama reservoirs [1,10,47].
The karst rocks of the study area are located in the zone of variable water saturation and the upper part of the saturated zone. Experimental studies of sulphate rock leaching dynamics have shown that for dolomites the leaching rate in the zone of variable saturation increases 1.9 times, and for carbonates 1.2–1.3 times [25,43].
As a result of filling and exploitation of the reservoir, with alternating watering and drying of rocks, their intensive physical and chemical weathering takes place [48]. In the water-level fluctuation zone of the Bratsk Reservoir, dolomite was discovered to turn into “dolomite flour”, which later turns into ‘cave’ clay. X-ray structural analysis of the dolomite sample showed that the weathered layer contains minerals of the montmorillonite group, which increases the swelling ability of soils and reduces their mechanical strength when watered [49,50].
Thus, the structure of the geological environment, in which karst–erosion forms develop, has been analyzed and its elements, which are the active factors of activation of these EGPs, have been revealed. The following set of conditions and factors can be attributed to the regional peculiarities of karst development mechanisms on the coastal zone of the Bratsk Reservoir:
  • Subhorizontal bedding of karstifying rocks;
  • Confinement of karst forms to different types of fracturing (regional joint set in north-western and north-eastern directions, bedding joint, weathering fissures);
  • Flooding of the intensively fractured zone of karstifying rocks in the former aeration zone as a result of the reservoir backwater;
  • Interaction of karst–suffosion and erosion processes determined by the peculiarities of the covered karst.
These conditions prepare the local coastal geosystem for development of the process. The trigger that disrupts the natural course of development in this coastal geosystem is the change in water level in the reservoir.

4.2. Conceptual Model of Karst–Erosion Processes at the Khadakhan Site

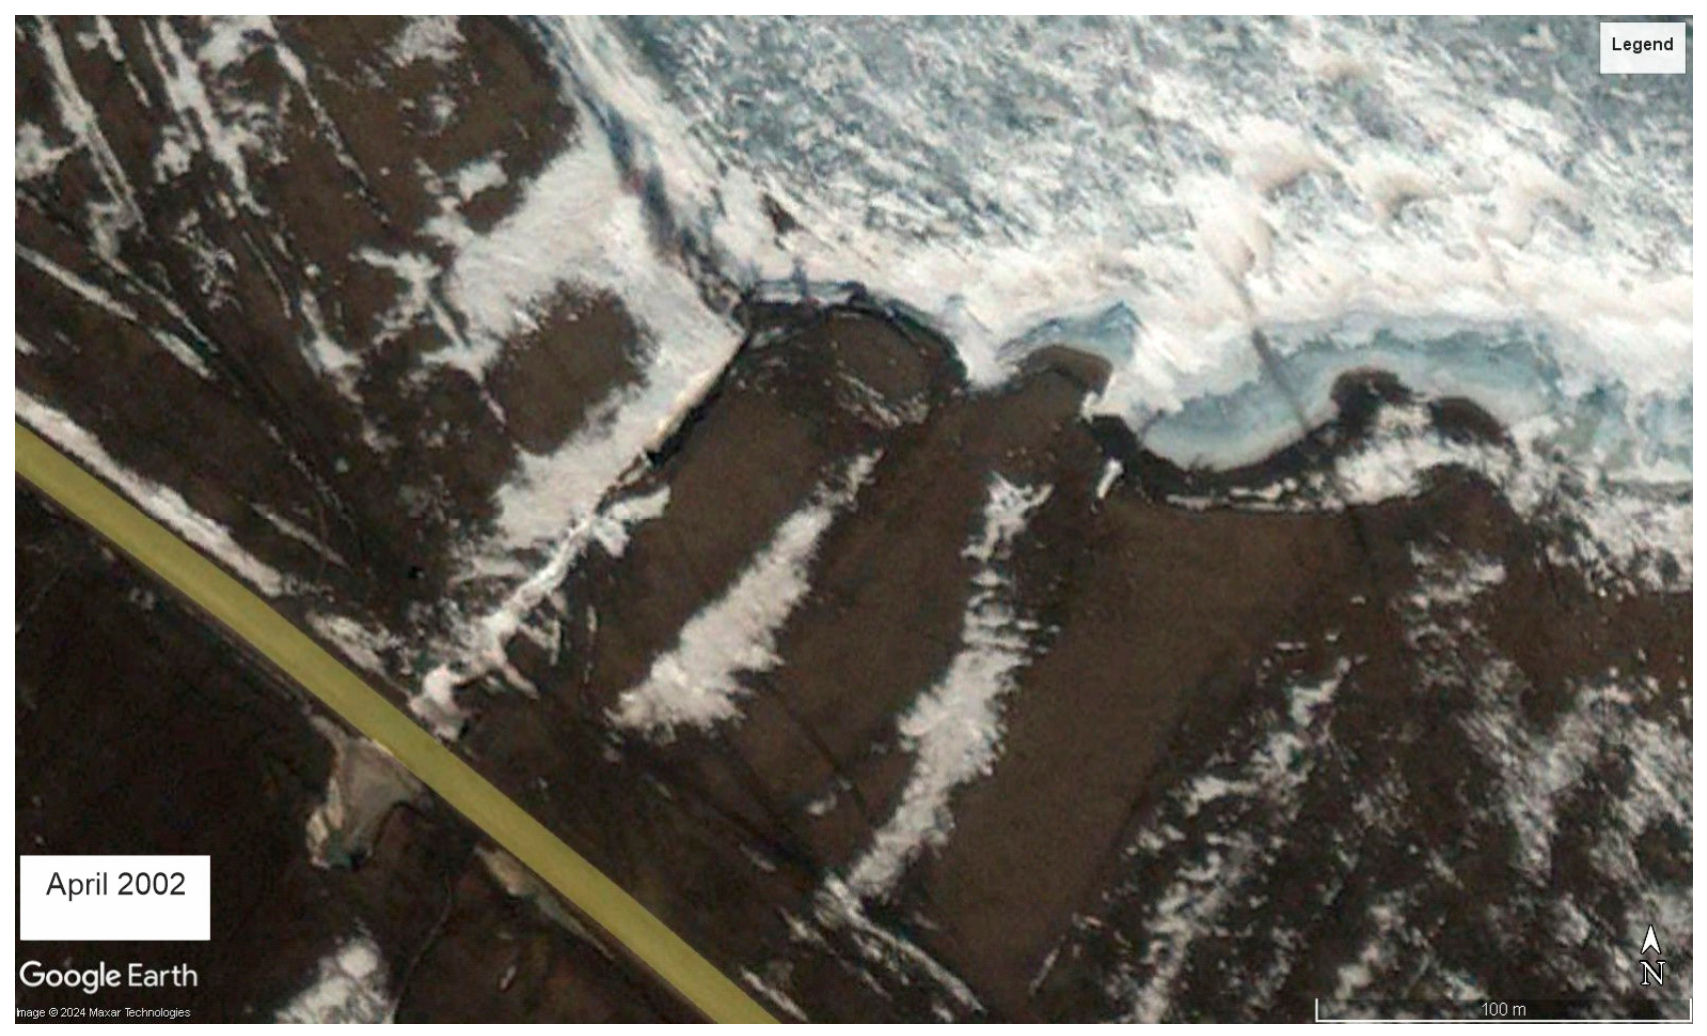
We analyzed historical aerial photographs and detailed field data and identified five stages in the evolution of the gullies at the Khadakhan site, from the formation of the karst sinkhole in the Khadahan-Zakuley motor road to its current stable state. The results of monitoring of this karst form from 2001 to 2013 were discussed in detail in a range of papers [31,32,49,50,51]. It was concluded that similar karst–erosion forms will form along the regional joint set in the coming decades. The expected mechanism is caused by the emergence of primary gully cuts from karst–wave–cut niches, the formation of suffosion–sedimentation sinkholes on the slope, and the merging and growth of karst sinkholes under the influence of karst–erosion processes. The regional joint set is well interpreted on the satellite image by depressions with accumulated snow (Figure 5).
Field investigations of Gully 1 were carried out from 2001 until 2012, when its outline stabilized. Analyses of aerial photographs from 2011 revealed that a new erosion cut from a wave–cut niche has been forming alongside the existing gully.
Such niches are the result of the joint action of karst, shore erosion and frost weathering. In contrast to the temperate climate of mid-latitudes [19], the coastal zone of the Bratsk Reservoir is characterized by severe climatic conditions, namely deep winter ground freezing. As a result, the grounds have a cryogenic structure, and reduced structural strength under the influence of repeated freeze–thaw cycles and frost weathering [52].
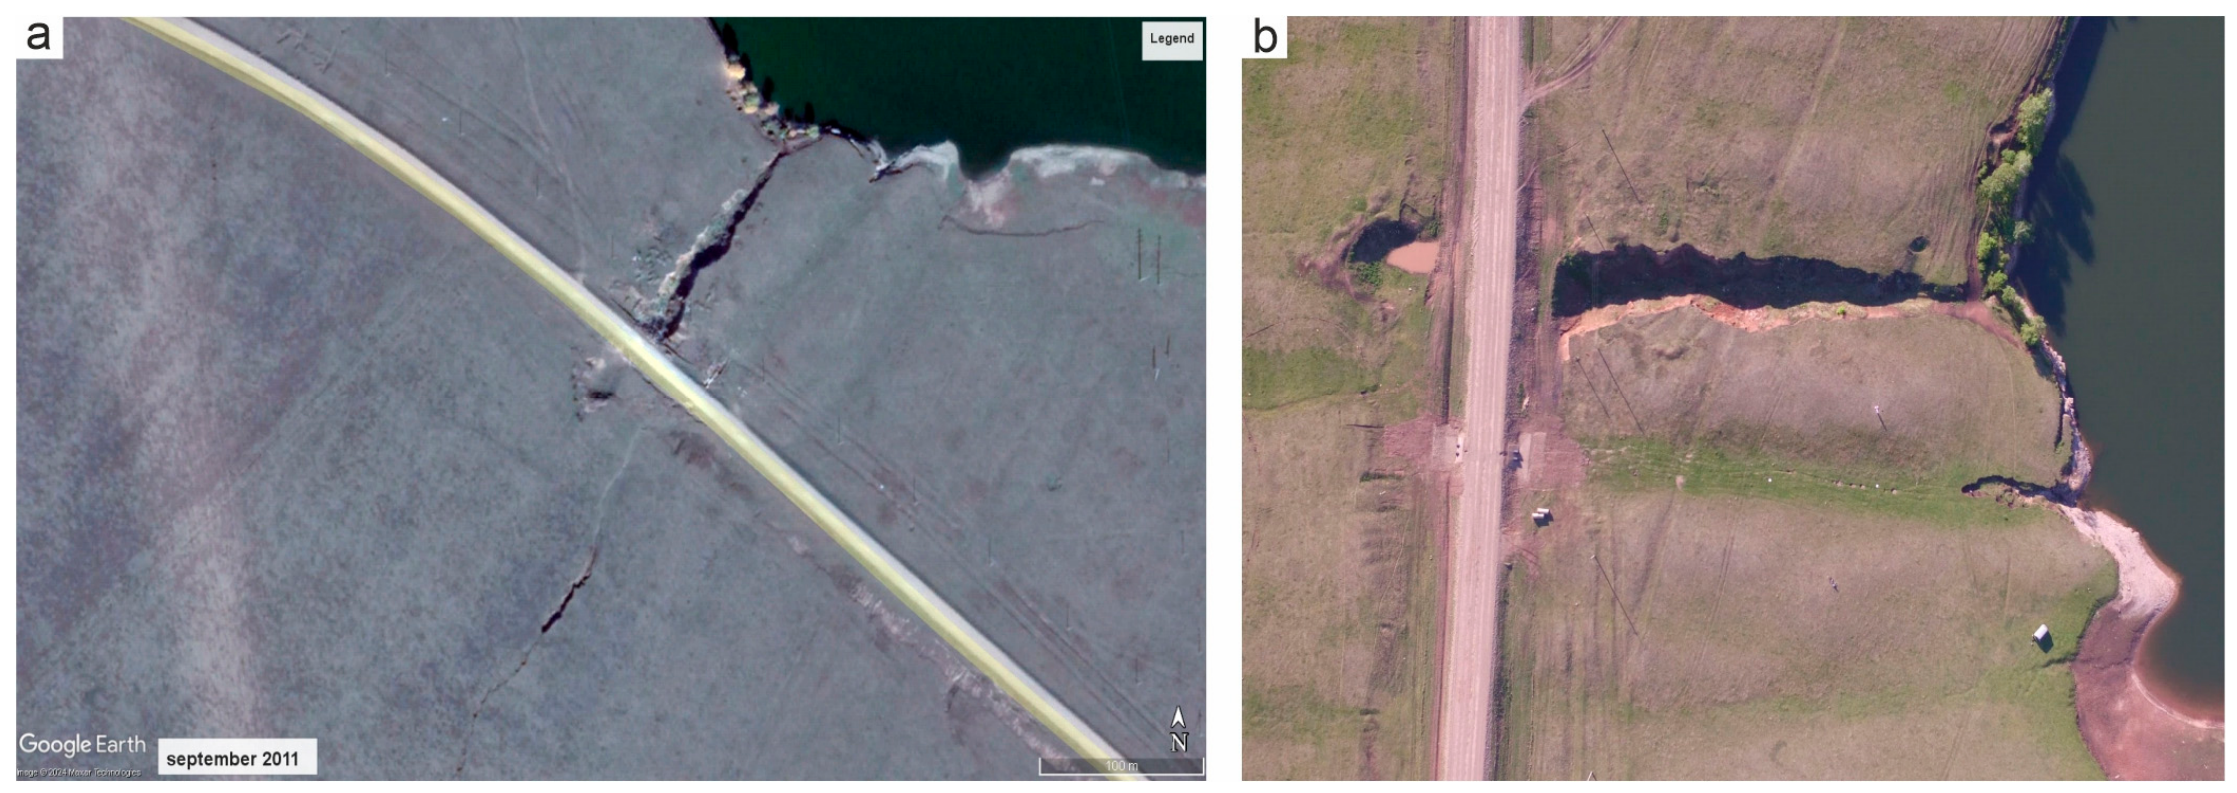
Monitoring of Gully 2 started in 2015 (Figure 6a). The exogeodynamic situation at the site is as shown in Figure 6b.
Gully 2 develops from the edge of the bank scarp. During monitoring studies, we observed its positive dynamics [53]. In the runoff depression, a series of suffosion–sedimentation sinkholes are actively developing, also characterized by constant growth.
Both gullies are in the same environment and under the influence of the identical factors. Monitoring showed that the development model of Gully 2 repeats the long-term evolution of Gully 1. Observations of the sequential development of the two studied gullies revealed their similarity. This allowed us to compare the stages of their development and identify the cycles related to the water-level regime in the reservoir.
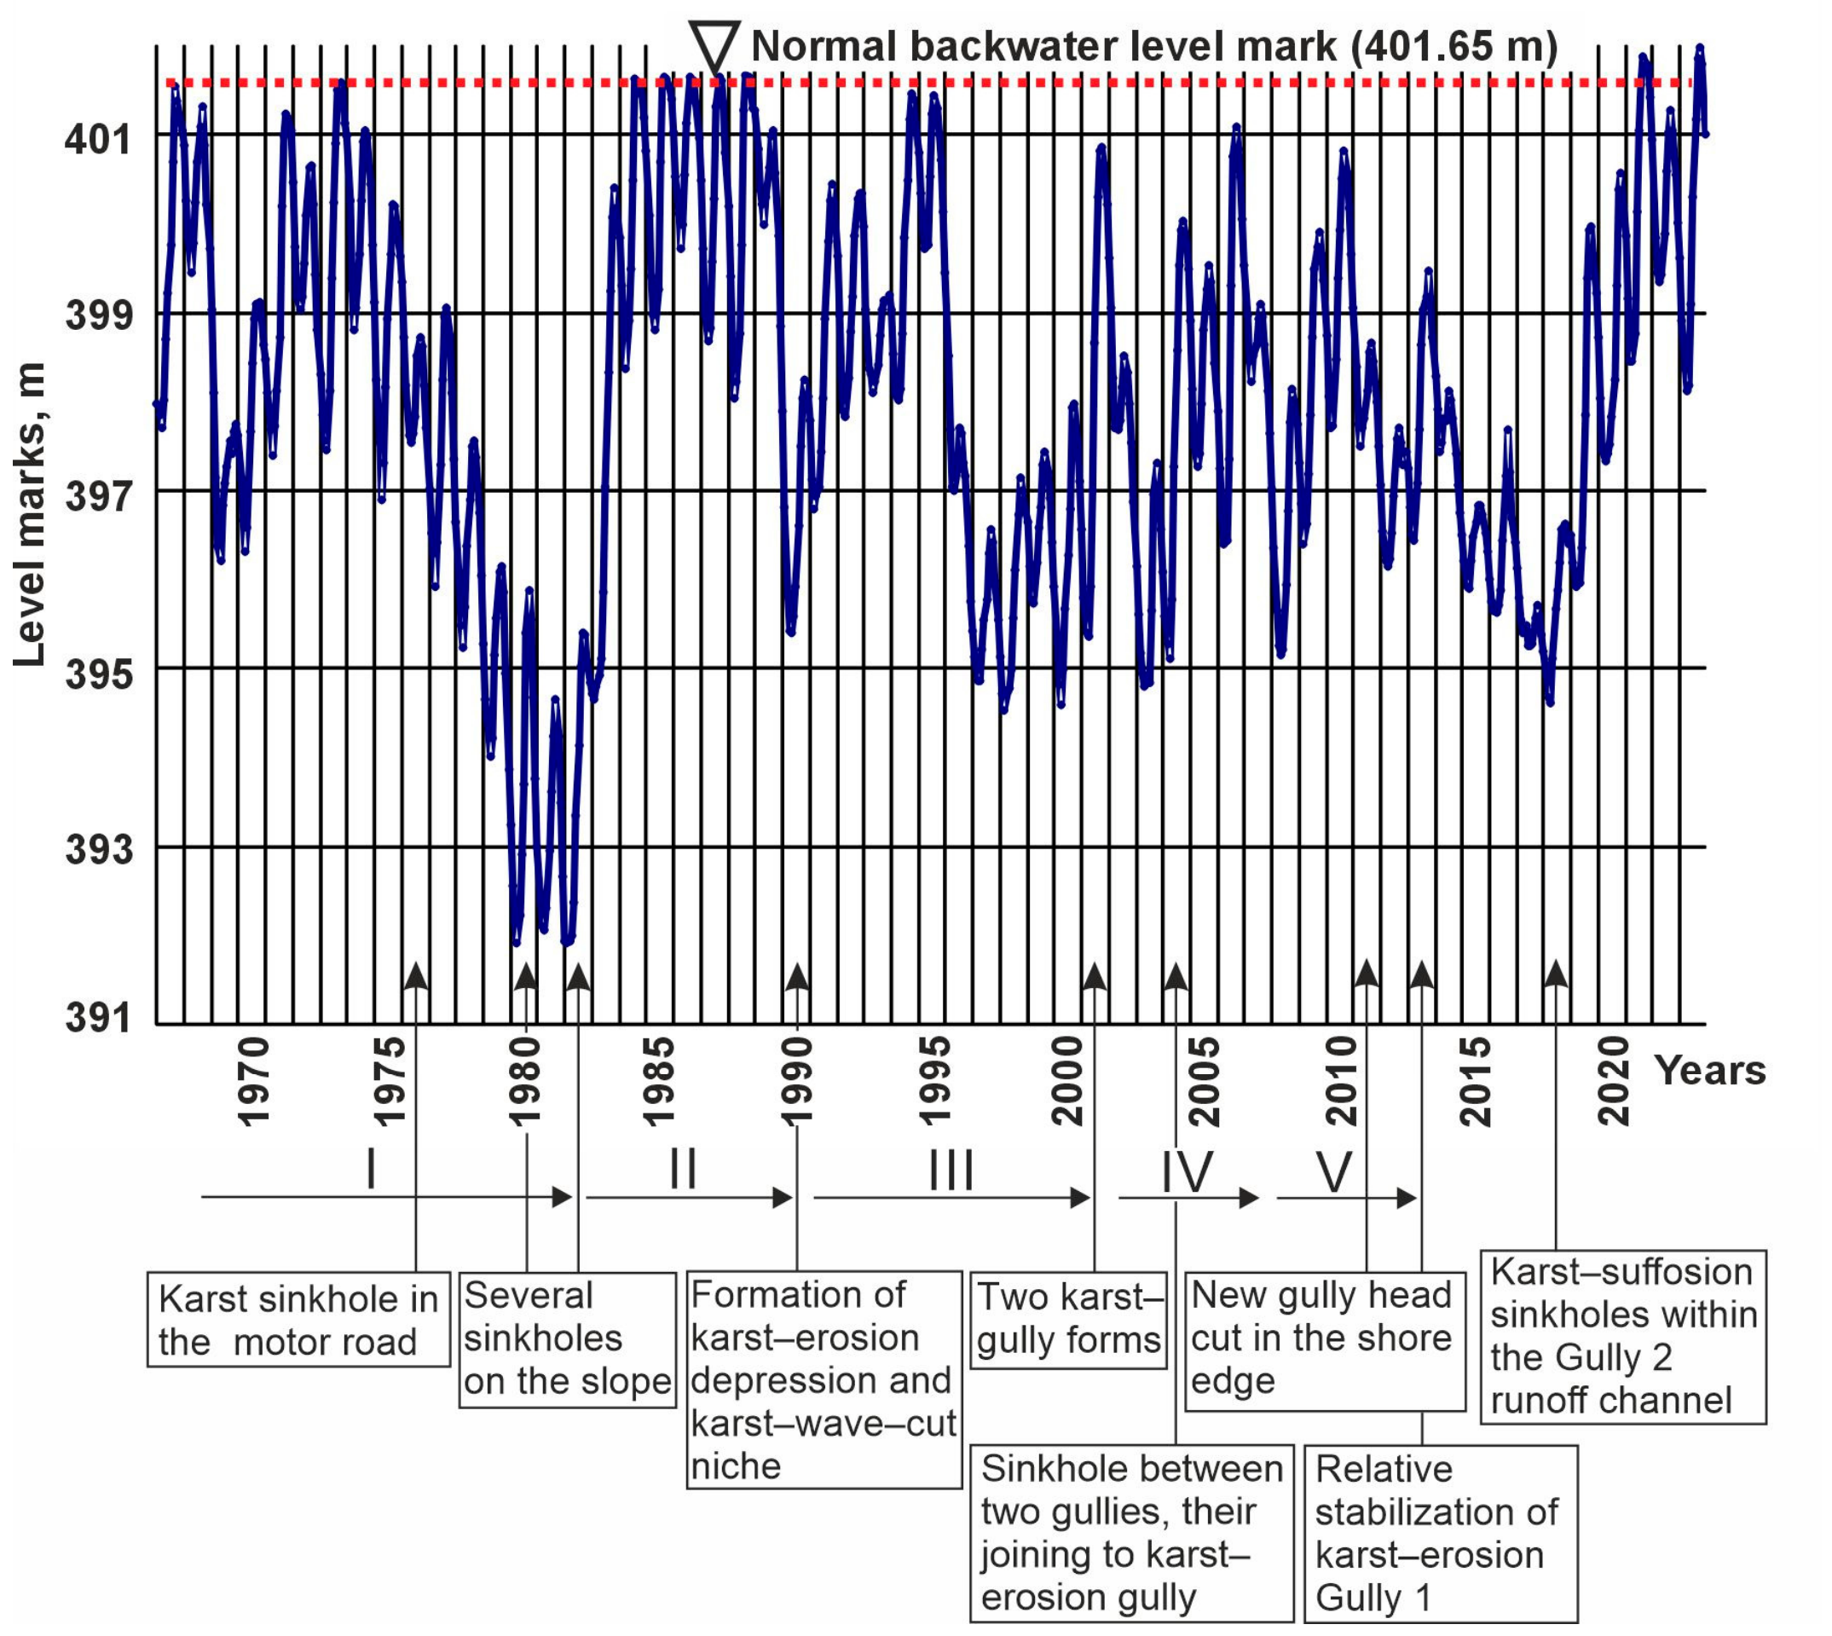
Based on the long-term monitoring, we identified the following stages of karst–erosional form evolution at the site (Figure 7).
Stage I
Gully 1 (1967–1982): activation of karst–suffosion processes (leaching, substance removal and surface subsidence); formation of a karst–wave–cut niche in the coastal edge, which gave a start to the formation of Gully 1 as a result of backwater formation during the reservoir filling; and formation of suffosion sinkholes, which later turned into the gully cuts, in the context of long gradual decrease in reservoir water levels.
Gully 2 (2010–2018): formation of a karst–wave–cut niche in the edge of the coastal cliff (head of Gully 2) after high reservoir water levels in 2006 and 2010; and formation of a series of suffosion sinkholes as a result of a gradual decrease in reservoir water levels.
Stage II
Gully 1 (1983–1990): growth of a karst–wave–cut niche in the coastal edge; formation of a depression below the road level as a result of recurrent cycles of high water levels and their subsequent lowering; and increments of sinkholes due to karst, gully erosion, and suffosion–subsidence processes.
Gully 2 (2018–present time): growth of sinkholes and the gully due to karst, gully erosion, suffosion–subsidence processes, and activation of karst leaching processes at high levels.
Stage III
Gully 1 (1991–2001): activation of the karst process in the backwater zone at high water levels in 1991–1995; joining of several sinkholes as a result of the drawdown in 1996; and formation and development of two gullies in the upper and lower parts of the slope under the influence of heavy rainfall.
Stage IV
Gully 1 (2002–2007): two gullies joining into a single karst form after the reservoir water level drawdown in 2003, with its maximum growth due to interactions of karst–suffosion and erosion processes; and new karst–erosive depressions appear in the relief on the slope according to the regional joint set.
Stage V
Gully 1 (2008–2013): activation of the karst leaching process by high levels in 2010, followed by a volume increase in Gully 1 until 2010, where thereafter its outlines have remained stable; gravitational processes prevail on gully sides, with deluvial sediments accumulating within the gully, resulting in a slight negative trend and relative gully stabilization.
After the high levels of 2010, a karst–wave–cut notch formed within the coastal edge—the head cut of Gully 2 (see stage I).
R 2.10 Figure 7 integrates the long-term reservoir water-level record (Balagansk weather station, RusHydro) with the observed stages of karst–erosion forms. The five stages (I–V) are shown against the timeline 1967–2023. The figure clearly demonstrates that the activation of Gully 1 (stage I, 1967–1982) and Gully 2 (stage I, 2010–2018) coincides with periods of high water levels followed by gradual drawdown. Stage II corresponds to accelerated gully growth during subsequent cycles. The constant base level of 401.65 m (marked on the figure) represents the long-term average or the normal pool level, while deviations above and below trigger the cyclic chain of dissolution, suffosion, collapse and erosion.
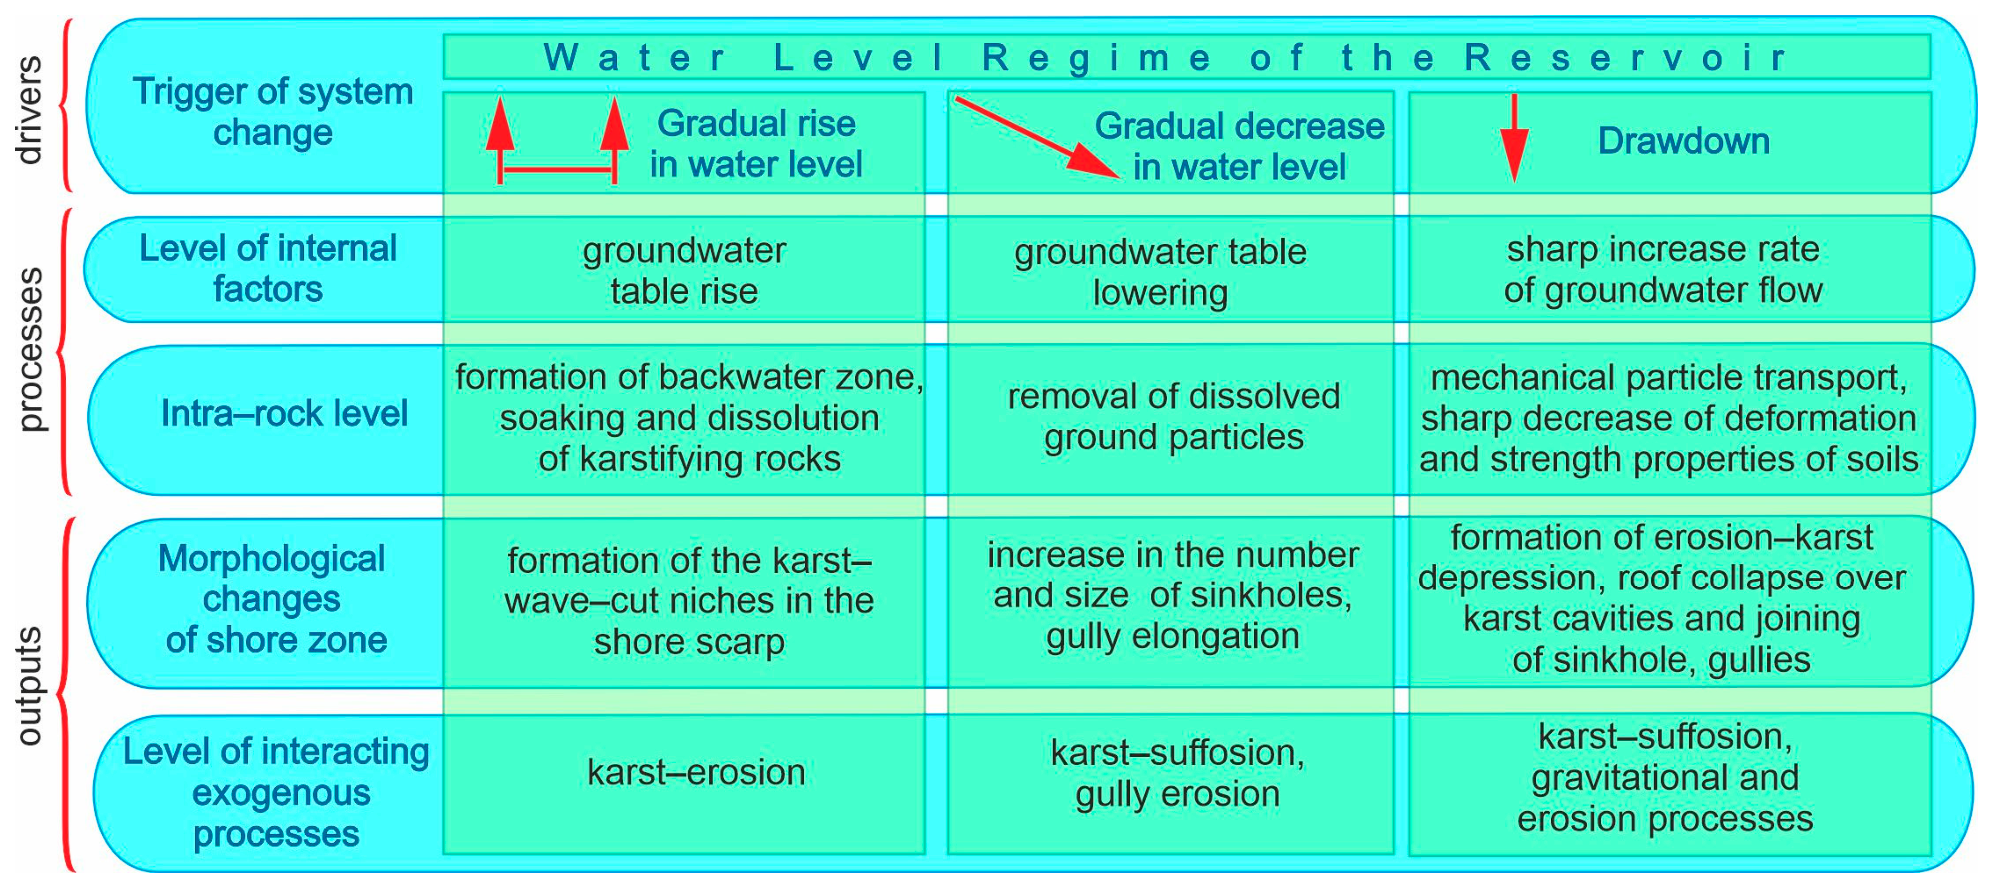
Our research and analysis of karst–gully formation mechanisms and the structure of interaction of EGPs in the local coastal geosystem has resulted in the creation of a conceptual model of karst–erosion process development under conditions of long-term and seasonal water-level fluctuations in the large dam reservoir (Figure 8).
The presented model can be briefly described as follows. At the initial stages, karst processes prevail, i.e., high water levels in the reservoir result in leaching activation in the zone of variable water saturation. In the event of a sharp drawdown in reservoir water level, there is an increase in filtration flow velocity and the removal of dissolved and leached matter. Subsidence runoff hollows and suffusion–subsidence sinkholes are consistently formed on the surface. A similar mechanism was shown in various studies [54,55]. Further, the sinkholes merge into a single gully under the influence of karst–erosion processes. As karst cavities enlarge, roof collapse over these cavities occurs (gravitational process), creating new open fractures and depressions. As the gully develops, erosive processes become prevailing. At the same time, the expanding gully serves an additional channel for concentration and filtration of surface runoff, which stimulates the activation of karst–suffosion processes in the aeration zone. Thus, positive feedback occurs: roof collapse of a karst cavity increases permeability and concentrates groundwater flow, which in turn accelerates dissolution and suffosion particle transport, thereby reinforcing the process and leading to further collapses. Therefore, we should pay attention to more careful control of the surface runoff by irrigation and sprinkling (preventing concentration of rain and melt runoff, as well as wastewater leaks).
The entire cycle of karst gully evolution ends with the stage of relative stabilization, when the potential of environmental conditions favorable to development of karst and erosion processes becomes exhausted, and active growth of karst–erosive form slows down.
In the proposed conceptual model, the system elements include karstifying rocks, reservoir water-level fluctuations, and mechanical particle transport. Thus, the applicability of our conceptual model is limited to covered karst zones in the backwater zone of large water bodies with significant water-level fluctuations.
In boreal climates, deep seasonal freezing and frequent freeze–thaw cycles enhance physical weathering and fracture propagation, whereas in temperate climates (e.g., Kama reservoirs), chemical dissolution dominates, and in tropical/subtropical settings (e.g., Three Gorges Reservoir), rapid chemical weathering and biological activity prevail. Regarding lithology, sulfate–carbonate rocks exhibit higher dissolution rates under variable saturation compared to pure carbonates, but are more prone to physical disintegration under frost action than gypsum-dominated sequences. This comparison highlights that the boreal sulfate–carbonate karst is uniquely characterized by the synergistic interaction of frost weathering, deep freezing, and sulfate dissolution, which is not observed in other climatic–lithological combinations.
The proposed cyclic sequence (dissolution—cavity formation—roof collapse—suffosion—linear erosion) can be extended to other large reservoirs with regulated water-level fluctuations, particularly those constructed in areas underlain by karstifying rocks (sulfates, carbonates, sulfate–carbonates). Examples include the Kama cascade reservoirs (Russia), reservoirs on the Colorado and Tennessee rivers (USA), the Three Gorges Reservoir (China), and various reservoirs in karst regions of Europe.
We emphasize, however, that site-specific factors must be considered when applying our model to other reservoirs: lithology, tectonic fracturing, climatic conditions (freezing depth, temperature amplitude), and reservoir operation regime. In warmer climates, chemical leaching and biological factors may play a more dominant role than physical weathering. Nevertheless, the fundamental cyclic sequence is expected to remain valid.

4.3. Statistical Analysis of Water-Level Fluctuations and Karst–Suffosion Activation

The study employs three independent quantitative methods to relate water-level parameters to karst–erosion (sinkhole) intensity.
Method 1: Water-level drawdown rate analysis (threshold-based)
Daily records of the Bratsk Reservoir from 1967 to 2024 (17,488 observations) were used. Seven karst activation events (known only to the nearest year or month, indicated by arrows in Figure 7) were analyzed quantitatively.
Drawdown rate analysis. Daily water-level change (drawdown rate) was calculated for each day. Negative rates (drawdown) were extracted (7822 values). Empirical percentiles (p1, p5, p10, p25) were computed from the distribution of negative rates (Table 2). A quantitative threshold for “dramatic drawdown” was defined as –0.060 m/day (5th percentile). This rate occurs only ~5% of the time over 58 years. It is exceeded within 90 days preceding four of seven sinkhole events, and corresponds to a sustained level drop of ~1.8 m/month, well beyond normal reservoir operation. For each karst event, exceedance of the p25, p10, p5, and p1 thresholds within the preceding 90 days was examined. Events with drawdown exceeding this threshold show a 75% CWT anomaly match rate (three of four), versus 33% below it.
The analysis revealed that six of the seven sinkhole events were preceded by drawdown rates above the moderate (p25) threshold within a 90-day window, and four of the seven events showed extreme drawdown rates (z-score < −3σ).
Method 2: Continuous wavelet transform (CWT) anomaly detection
Continuous wavelet transform (CWT). To detect statistically significant anomalies in the long-term level series, a Morlet wavelet was used. The analysis was performed in Python 3.12 with PyWavelets 1.8.0. Wavelet scales ranged from 1 to 64 (periods from ~1 to ~64 months). Significance testing was performed against an AR(1) red noise background (α = 0.05). The cone of influence (COI) was applied to suppress edge artefacts, and a time–frequency gap mask accounted for irregular sampling and missing data.
Method 3: Event-level quantitative characterization
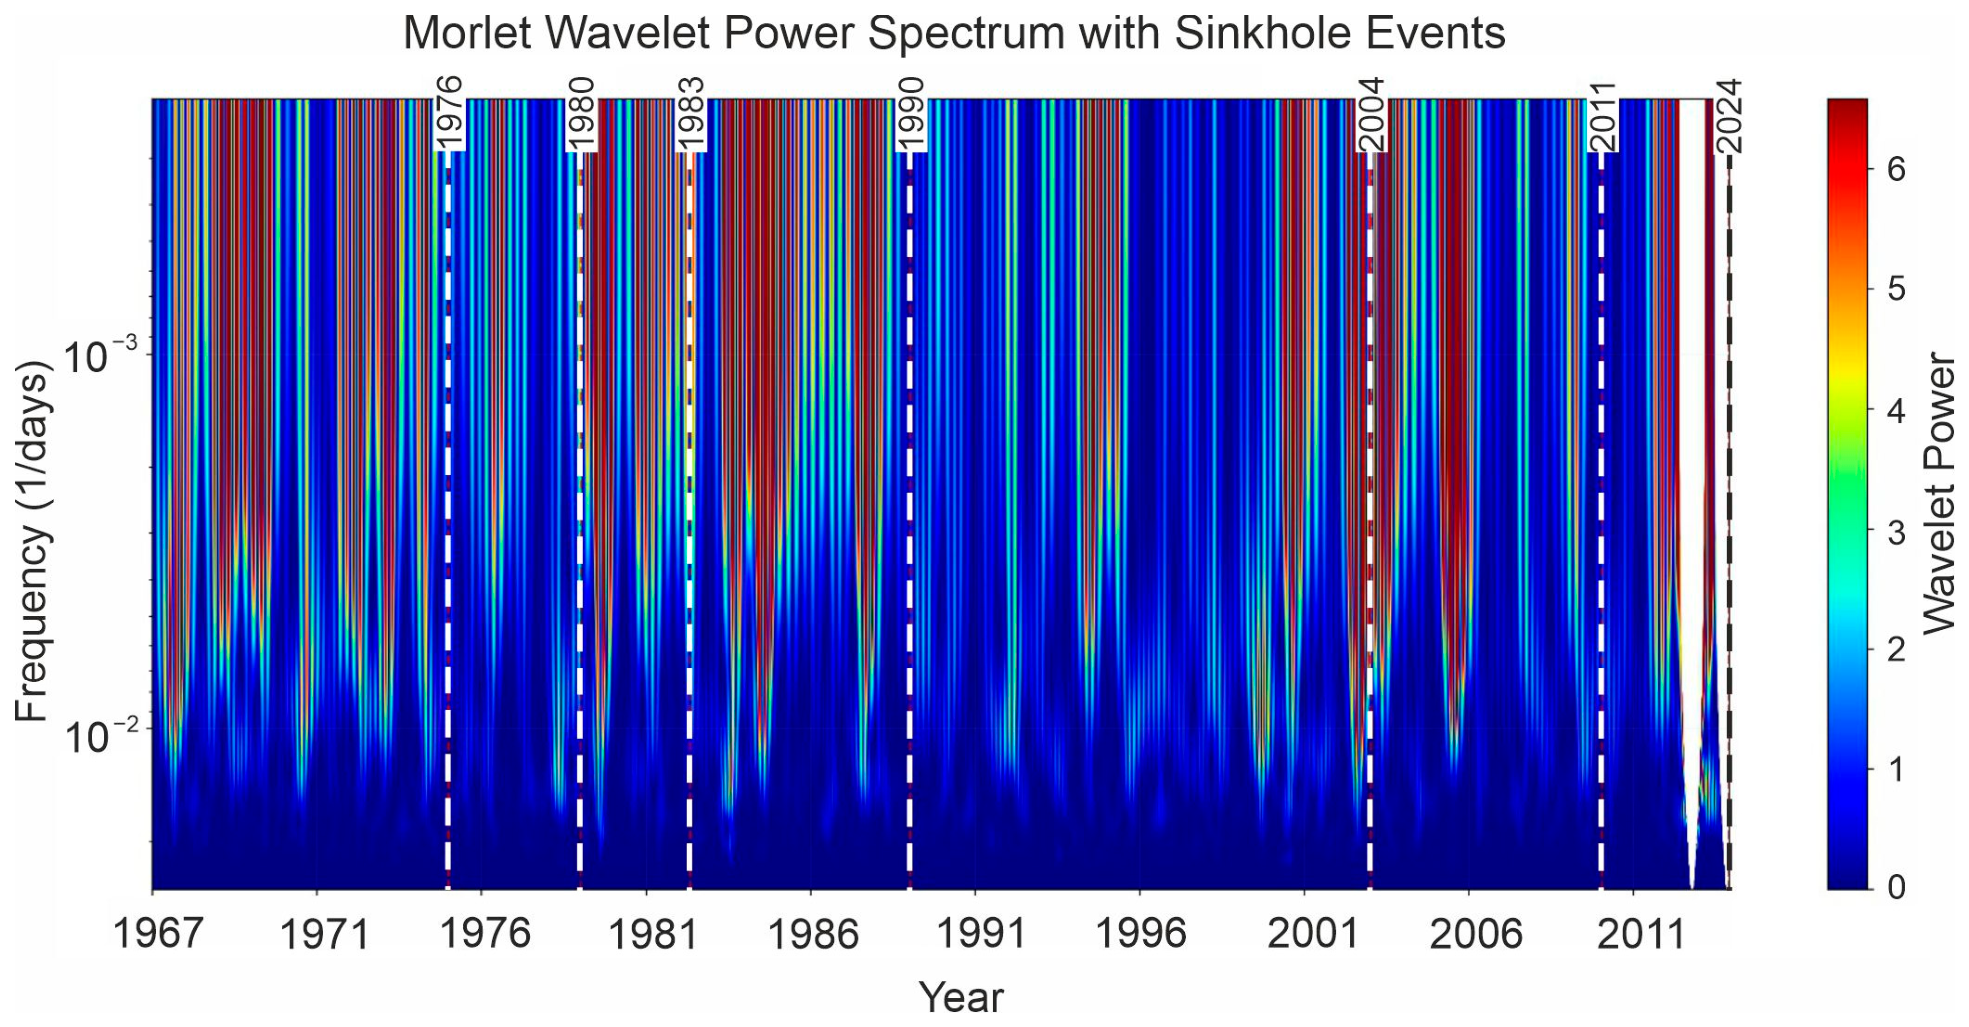
For each of the seven documented sinkhole events, the following hydrological parameters were determined: instantaneous drawdown rate on the event date; maximum drawdown over antecedent windows (30, 90, and 365 days); annual water-level range at the time of the event; and relative level deviation from the long-term mean. These parameters enable quantitative characterization of the water regime preceding karst activation and allow comparison with the presence or absence of CWT anomalies (Figure 9).
Table 3 presents the obtained values for each event, together with the CWT anomaly detection result (Yes/No). The data show that events with an extreme maximum drawdown over 90 days (values below p < 1%) mostly coincide with positive CWT anomaly detection (1980, 1990, 2011, 2024-09). In contrast, events with moderate drawdown (1976, 1983-05, 2004) show a less consistent relationship. Thus, event-level characterization confirms that the most intense and deep-seated sinkholes are associated with anomalously rapid water-level drawdown in the preceding period, captured both by statistically significant percentiles and by wavelet analysis.
Accounting for dating uncertainty.
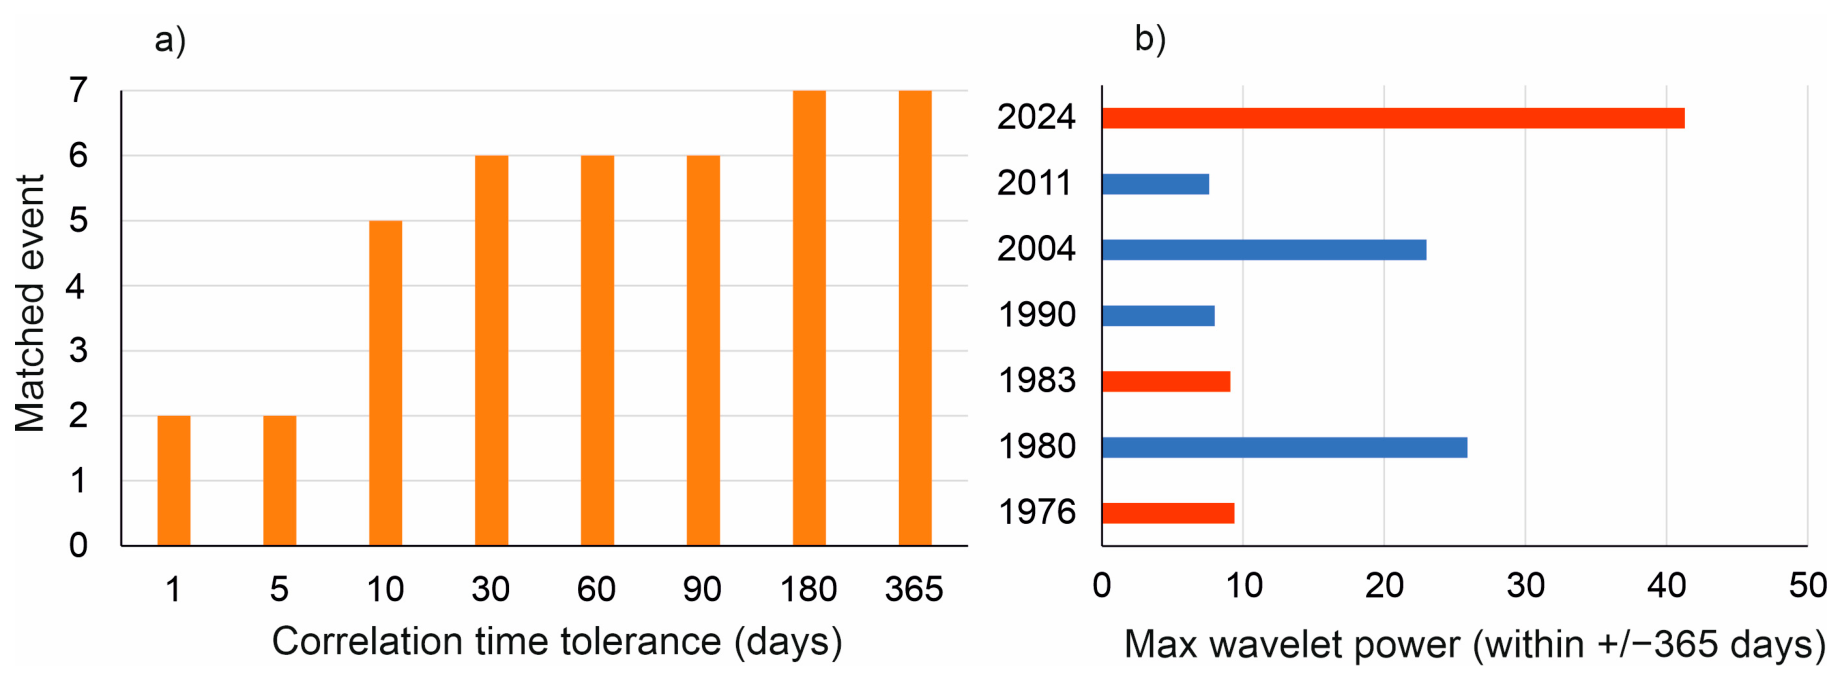
Sinkhole events in the record are known only by year (or year–month for 1983-05 and 2024-09). Events are arbitrarily assigned to January 1. We tested whether relaxing the time correlation tolerance to account for this uncertainty improves CWT anomaly matching (Figure 10).
We used Morlet wavelet (scales 1–128, sampling period 30.44 days) with Z-score detection (threshold 1.2σ, 730-day sliding window) and gap masking.
The 180-day tolerance is not arbitrary: sinkholes are identified from remote-sensing imagery, but in winter (typically November–March) the ground is covered with snow, so sinkholes cannot be detected on the images—they are hidden beneath the snow. A sinkhole that forms in late autumn may not be seen until spring, after snowmelt. This creates a lag of up to 6 months between when a sinkhole forms and when we record it.
With tolerance ≥180 days, all seven events show a strong wavelet anomaly (power range 7.6–41.3, Figure 10b), all at the longest scales corresponding to multi-year cycles. This confirms that the three previously unmatched events (1976, 1983, and 2024—highlighted in red in Figure 10b) do have anomalous wavelet power—they simply occur at a different offset from the arbitrary Jan 1 marker or are shifted by the snow-cover detection lag.

4.4. Uncertainties and Limitations

Monitoring errors. Water levels were measured once per day, which does not capture short-term peaks that may be critical for suffosion initiation. Karst events were dated using remote-sensing imagery with annual (or monthly for two events) accuracy. Winter images are uninformative due to snow cover, so the actual occurrence of a sinkhole may differ from its recorded date by up to 6 months.
Spatial heterogeneity and site representativeness. Soil and rock mass properties (porosity, strength, fracture density) were assumed to be averaged in the model. However, the Khadakhan site is a representative (key) site for studying the interaction between karst and erosion processes in the covered karst zone under large water-level fluctuations, i.e., where karstifying rocks are overlain by loess-like deposits. As shown in the typical karst–erosion landscape (Figure 2), it is representative of covered karst in the coastal zone of the Bratsk Reservoir.
Where the combination of process-controlling conditions differs, other types of interactions develop. For example, on slopes that are too gentle for gully erosion (unlike our site), only karst–suffosion sinkholes form. In the southern part of the karst region, where coastal slopes are steep and the deluvial cover is thin, block slides prevail.
Thus, the applicability of our conceptual model is limited to covered karst zones in the backwater zone of large water bodies with significant water-level fluctuations.
Future climate change impacts. The model is based on historical data and does not incorporate climate change scenarios. Rising groundwater levels and increasing frequency of extreme precipitation expected in the region could significantly alter the regime of suffosion activation. Therefore, the conclusions apply to current conditions and should not be extrapolated to the far future without additional consideration of climatic trends.
These limitations do not undermine the main finding that karst activation is related to drawdown rates, but they should be considered when interpreting the results and planning further research.

5. Conclusions

Creation of the reservoir triggered karst formation in the backwater zone. We revealed regional features contributing to karst and erosion process development and activation, namely: subhorizontal-bedding karst rocks, disrupted by a system of regional jointing in conditions of variable (seasonal and long-term) water-level fluctuations in the reservoir.
The geological structure of the site, i.e., the presence of easily eroded deluvial loess-like loam and sandy loam overlying the sulfate–carbonate–gypsum rocks, determines formation of a favorable environment for karst and gully erosion interactions.
The boreal climate of the study area, with significant fluctuations in annual and daily air temperatures, deep seasonal ground freezing, soil thawing peculiarities, as well as tectonic fracturing of bedrock, are factors of physical weathering and contribute to fractured weathering in the coastal scarp. The cliff face has lines of weakness such as fractures and bedding planes that are weathered and leached. The subhorizontal-bedding of cliff rocks and their solubility determine the karst and shore–erosion mechanisms.
Analysis of the medium-term and short-term data on gully dynamics revealed its interrelation with long-term and seasonal fluctuations in the reservoir water level.
Fluctuations in the reservoir level are a significant factor in the activation of karst–erosion processes along with the concentration of precipitation over time. Close interrelations between the groundwater level and the reservoir level determine karst activation throughout the entire backwater zone and result in high rates of leaching of sulfate–carbonate rocks.
In this study, we verified the cyclic nature of the karst–erosion formation process in the coastal geosystem under conditions of seasonal and long-term reservoir water-level fluctuations.
The stages of development of karst–erosion forms of the site have been determined.
Every distinguished stage presents a cyclic recurrence of high water levels in the reservoir, followed by a dramatic drawdown or a period of low-standing.
High levels activate the karst process in the massif, the shore erosion process, shore edge retreat, and the formation of wave cut niches. Dramatic level drawdown triggers the event occurrence: formation and growth of new and existing karst–suffosion funnels, formation of depressions, roof collapse over karst cavities, and merging of gullies.
At low levels, erosion processes take the dominant role in gully development. This requires careful control over the surface runoff (prevention of rain and melt runoff concentration during irrigation and sprinkling, and of leakage of industrial wastewater as well).
Thus, the mechanism of karst–erosion gully formation is a complex of interactions and activations of collapse, karst, shore, and gully erosion processes.
The main surface morphological changes in this local geosystem, namely, the formation of large failures and the merging of gullies, are tied to the periods of dramatic drawdown in the reservoir water level. These moments involve interaction of all groups of processes (dramatic increase in the filtration groundwater flow velocity, removal of the substance), which leads to the formation of large underground cavities and surface failures.
The study resulted in the creation of a conceptual model for coastal geosystem functioning in the field of sulphate–carbonate rock development under conditions of long-term and seasonal fluctuations in the reservoir water level. The structure of interactions in the local coastal geosystem on three hierarchical levels of its organization is presented: (1) intra-rock level, (2) level of interacting factors and (3) level of interacting exogenous processes occurring under the influence of an external factor, i.e., changes in the water level in the reservoir.
This conceptual model is aimed at improving understanding of the impact of large reservoir operation on the dynamics of complex interacting coastal processes, as well as the peculiarities of karst development in the boreal climate.
To prevent catastrophic activation of karst–erosion processes, the following engineering measures should be implemented. The maximum dramatic drawdown rate should not exceed the threshold of –0.060 m/day (5th percentile) established by the drawdown rate analysis, which corresponds to a sustained level drop of approximately 1.8 m/month. Seasonal regulation should avoid abrupt transitions from high to low water levels; instead, drawdown should be phased over several weeks. Targeted shore protection measures should include the following: (a) interception of surface runoff by means of hillside ditches; (b) grouting of identified karst cavities; (c) local reinforcement of gully heads and mouths; and (d) bio-engineering slope stabilization using deep-rooted vegetation. During land use in coastal areas, measures should be taken to regulate surface runoff, prevent leaks of industrial wastewater, and eliminate the possibility of runoff concentration during irrigation and sprinkling of agricultural land. The detailed design and specifications of these measures should be determined by hydraulic engineering specialists based on additional site-specific investigations.
The model helps us to realize that when regulating reservoir water levels, sharp drawdowns should be avoided. The revealed structure and interactions of processes are the basis for the sustainable development of natural–technical coastal geosystems and for making management decisions.

Author Contributions

Conceptualization, O.M. and V.B.; methodology, O.M., V.B. and A.R.; formal analysis, O.M. and V.B.; investigation, O.M., V.B. and A.R.; resources, A.R.; data curation, O.M. and V.B.; writing—original draft preparation, O.M. and V.B.; writing—review and editing, O.M., V.B. and A.R.; visualization, O.M. and V.B.; supervision, O.M.; project administration, A.R.; funding acquisition, A.R. All authors have read and agreed to the published version of the manuscript.

Funding

This research was funded by the basic budget project of the Ministry of Science and Higher Education of the Russian Federation (EGISU NIOKTR Registration No. 1025022500090-2-1.5.1-1.5.1, Project No. FWEF-2026-0009) “Paleogeography, Dynamics and Evolution of the Natural Environment of Eastern Siberia in the Mesozoic and Cenozoic”.

Data Availability Statement

The original contributions presented in this study are included in the article. Further inquiries can be directed to the corresponding author.

Acknowledgments

The work was conducted using the equipment and infrastructure of the Centre for Geodynamics and Geochronology at the Institute of the Earth’s Crust, Siberian Branch of the Russian Academy of Sciences. We wish to thank our colleagues from the Laboratory of Engineering Geology and Geoecology for their collaborative field investigations.

Conflicts of Interest

The authors declare no conflicts of interest.

References

  1. Pecherkin, I.A. Geodynamics of Kama Water Storage Reservoirs Shore Lines. Part 2. Geological Processes; Perm University: Perm, Russia, 1969. (In Russian) [Google Scholar]
  2. Trzhtsinsky, Y.B. Karst processes in the area of Siberian platform. In IGCP Project 448; Guangxi Normal University Press: Guilin, China, 2004; pp. 66–75. [Google Scholar]
  3. De Waele, J.; Gutiérrez, F.; Parise, M.; Plan, L. Geomorphology and natural hazards in karst areas: A review. Geomorphology 2011, 134, 1–8. [Google Scholar] [CrossRef]
  4. Tîrlă, L.; Vijulie, I. Structural-tectonic controls and geomorphology of the karst corridors in alpine limestone ridges: Southern Carpathians, Romania. Geomorphology 2013, 197, 123–136. [Google Scholar] [CrossRef]
  5. Gutiérrez, F.; Parise, M.; De Waele, J.; Jourde, H. A review on natural and Human-induced geohazards and impacts in karst. Earth Sci. Rev. 2014, 138, 61–88. [Google Scholar] [CrossRef]
  6. Gutiérrez, F.; Gutiérrez, M. Karst Landforms. In Landforms of the Earth; Springer: Cham, Switzerland, 2016; pp. 59–101. [Google Scholar] [CrossRef]
  7. Chen, Z.; Auler, A.S.; Bakalowicz, M.; Drew, D.; Griger, F.; Hartmann, J.; Jiang, G.; Moosdorf, N.; Richts, A.; Stevanovic, Z.; et al. The World Karst Aquifer Mapping project: Concept, mapping procedure and map of Europe. Hydrogeol. J. 2017, 25, 771. [Google Scholar] [CrossRef]
  8. Silva, O.; Bezerra, F.; Maia, R.; Cazarin, C. Karst landforms revealed at various scales using LiDAR and UAV in semi-arid Brazil: Consideration on karstification processes and methodological constraints. Geomorphology 2017, 295, 611–630. [Google Scholar] [CrossRef]
  9. Liang, Y.; Gao, X.; Zhao, C.; Tang, C.; Shen, H.; Wang, Z.; Wang, Y. Review: Characterization, evolution, and environmental issues of karst water systems in Northern China. Hydrogeol. J. 2018, 26, 1371–1385. [Google Scholar] [CrossRef]
  10. Milanović, P.; Maksimovich, N.; Meshcheriakova, O. Dams and Reservoirs in Evaporites; Springer International Publishing: Cham, Switzerland, 2019. [Google Scholar]
  11. Beck, B.F.; Herring, J.G.; Stephenson, J.B. (Eds.) The Engineering Geology and Hydrology of Karst Terrains; CRC Press: Boca Raton, FL, USA, 2020. [Google Scholar] [CrossRef]
  12. Goldscheider, N.; Chen, Z.; Auler, A.S.; Bakalowicz, M.; Broda, S.; Drew, D.; Hartmann, J.; Jiang, G.; Moosdorf, N.; Stevanovic, Z.; et al. Global distribution of carbonate rocks and karst water resources. Hydrogeol. J. 2020, 28, 1661–1677. [Google Scholar] [CrossRef]
  13. Gökkaya, E.; Gutiérrez, F.; Ferk, M.; Görüm, T. Sinkhole development in the Sivas gypsum karst, Turkey. Geomorphology 2021, 386, 107746. [Google Scholar] [CrossRef]
  14. Masilela, M.; Beckedahl, H. Karst geomorphology and related environmental problems in Southern Africa—A review. J. Afr. Earth Sci. 2022, 196, 104686. [Google Scholar] [CrossRef]
  15. Klimchouk, A.; Evans, D.; Milanovic, S.; Bittencourt, C.; Sanchez, M.; Aguirre, F.C. Hypogene speleogenesis related to porphyry magmatic intrusions and its influence on subsequent karst evolution in the Peruvian high Andes. Geomorphology 2023, 420, 108488. [Google Scholar] [CrossRef]
  16. Lin, K.; Yang, Z.; Yu, T.; Ji, W.; Liu, X.; Li, B.; Wu, Z.; Li, X.; Ma, X.; Wang, L.; et al. Enrichment mechanisms of Mo in soil in the karst region Guangxi, China. Ecotoxicol. Environ. Saf. 2023, 255, 114808. [Google Scholar] [CrossRef] [PubMed]
  17. De Waele, J.; Mucedda, M.; Montanaro, L. Morphology and origin of coastal karst landforms in Miocene and Quaternary carbonate rocks along the central-western coast of Sardinia (Italy). Geomorphology 2009, 106, 26–34. [Google Scholar] [CrossRef]
  18. Furlani, S.; Cucchi, F.; Forti, F.; Rossi, A. Comparison between coastal and inland Karst limestone lowering rates in the northeastern Adriatic Region (Italy and Croatia). Geomorphology 2009, 104, 73–81. [Google Scholar] [CrossRef]
  19. Kaczmarek, H.; Bartczak, A.; Tyszkowski, S.; Badocha, M.; Krzemiński, M. The impact of freeze-thaw processes on a cliff recession rate in the face of temperate zone climate change. Catena 2021, 202, 105259. [Google Scholar] [CrossRef]
  20. Woodhead, J.; Sniderman, K.; Hellstrom, J.; Weij, R.; MacGregor, C.; Dickson, B.; Drysdale, R.; Delane, M.; Henke, D.; Bastian, L.; et al. Timescales of speleogenesis in an evolving syngenetic karst: The Tamala Limestone, Western Australia. Geomorphology 2022, 399, 108079. [Google Scholar] [CrossRef]
  21. Yin, Y.; Huang, B.; Wang, W.; Wei, Y.; Ma, X.; Ma, F.; Zhao, C. Reservoir-induced landslides and risk control in Three Gorges Project on Yangtze River, China. J. Rock Mech. Geotech. Eng. 2016, 8, 577–595. [Google Scholar] [CrossRef]
  22. Feng, X.; Zhao, C.; Liu, X.; Yan, M. Detection and monitoring of active landslides after the initial impoundment of the Baihetan Reservoir (China) using time series InSAR method. Bull. Eng. Geol. Environ. 2025, 84, 86. [Google Scholar] [CrossRef]
  23. Fedorovsky, V.S.; Sklyarova, O.A.; Sklyarov, E.V. Karst processes, springs and lakes of the Near-Ol’khon area. In Human Impact and Karst Ecosystem of Eastern Siberia. Guidebook of Excursion on IGCP Project 448; Trzhtsinsky, Y.B., Tyc, A., Eds.; Department of Geomorphology, University of Silesia: Sosnowiec, Poland; The Institute of the Earth’s Crust SB RAS: Irkutsk, Russia, 2003; pp. 27–45. [Google Scholar]
  24. Filippov, V.M.; Trzhtsinsky, Y.B. Recommendations for the National-Economic Use of the Coasts of the Angara Reservoirs in the Zone of Karst Development; SB Academy of Sciences of the USSR: Irkutsk, Russia, 1984. (In Russian) [Google Scholar]
  25. Filippov, V.M. Karst Dynamics in the Angara Reservoir’s Influence Zone. Ph.D. Dissertation, Leningrad Mining Institute, St. Petersburg, Russia, 1988. (In Russian) [Google Scholar]
  26. Bratsk Reservoir. Engineering Geology of the Territory; Academy of Sciences of the USSR: Moscow, Russia, 1963. (In Russian) [Google Scholar]
  27. Ovchinnikov, G.I.; Pavlov, S.K.; Trzhtsinsky, Y.B. Change of the Geological Environment in the Angara-Yenisei Reservoir Backwater Areas; Nauka: Novosibirsk, Russia, 1999. (In Russian) [Google Scholar]
  28. Trzhtsinsky, Y.B. Human-induced activation of gypsum karst in the southern Priangaria (East Siberia, Russia). Carbonates Evaporites 2002, 17, 154–158. [Google Scholar] [CrossRef]
  29. Kozyreva, E.A. Exogeodynamics of Large Natural and Technical Systems of the Mongolian-Siberian Region. Doctoral Dissertation, Institute of the Earth’s Crust SB RAS, Irkutsk, Russia, 2019. [Google Scholar]
  30. Maximovich, G.A. The density of karst sinkholes and sustainability of the karst areas. Proceedings of higher educational establishments. Geol. Explor. 1961, 7, 118–125. [Google Scholar]
  31. Mazaeva, O.; Babicheva, V.; Kozyreva, E. Gully development on large dam reservoir shores: Dynamics, interaction, and mechanisms. Phys. Geogr. 2020, 41, 195–216. [Google Scholar] [CrossRef]
  32. Mazaeva, O.; Babicheva, V.; Kozyreva, E. Geomorphological process development under the impact of man-made reservoir operation, a case study: Bratsk reservoir, Baikal-Angara hydroengineering system, Russia. Bull. Eng. Geol. Environ. 2019, 78, 4659–4672. [Google Scholar] [CrossRef]
  33. Boyarkin, V.M.; Boyarkin, I.V. Geography of the Irkutsk Region (History, Nature, Population, Economy, Ecology): Encyclopedic Reference Book; Sarma: Irkutsk, Russia, 2011. (In Russian) [Google Scholar]
  34. Leshchikov, F.N.; Shats, M.M. Permafrost Occurrence in the South of Central Siberia; Nauka: Novosibirsk, Russia, 1983. (In Russian) [Google Scholar]
  35. Trzhtsinsky, Y.B. Evolution of Engineering-Geological Conditions in the Zones of Influence of the Angara-Yenisei HPP Cascade Reservoirs. Doctoral Dissertation, Institute of the Earth’s Crust SB RAS, Irkutsk, Russia, 1994. [Google Scholar]
  36. Bondarik, G.K. The General Theory of Engineering (Physical) Geology; Nedra: Moscow, Russia, 1981. (In Russian) [Google Scholar]
  37. Mazaeva, O.A.; Kozyreva, E.A.; Trzhtsinsky, Y.B. Evaluation of the interaction of exogenous processes in local coastal geosystems of the Bratsk Reservoir. Geogr. Nat. Resour. 2006, 3, 81–86. [Google Scholar]
  38. Larionov, S.A. Methods of Investigation of Soil Structure; Nedra: Moscow, Russia, 1971. (In Russian) [Google Scholar]
  39. Ryashchenko, T.G.; Akulova, V.V.; Grigorieva, I.Y.; Zhu Wen, D.; Zheng Zhong, C.; Chun Shao, S. Analysis of microstructure of loesses of the Northern Loess Plateau, China. Geoecol. Eng. Geol. Hydrogeol. Geocryol. 2000, 3, 234–240. (In Russian) [Google Scholar]
  40. Lomtadze, V.D. Physical and mechanical properties of rocks. In Laboratory Research Methods: Training Manual; Nedra: Leningrad, Russia, 1990. (In Russian) [Google Scholar]
  41. Makarov, S.A.; Ryashchenko, T.G.; Akulova, V.V. Geo-Ecological Analysis of Territories Marked by Development of Natural-Technogenic Processes in Neogene–Quaternary Deposits of Pribaikalia; Nauka: Novosibirsk, Russia, 2000. (In Russian) [Google Scholar]
  42. Kaufmann, O.; Quinif, Y. Cover-collapse sinkholes in the “Tournaisis” area, southern Belgium. Eng. Geol. 1999, 52, 15–22. [Google Scholar] [CrossRef]
  43. Filippov, V.M. Dynamics, Activation and Forecast of Karst of Angara Reservoirs; SB AS USSR: Irkutsk, Russia, 1983. (In Russian) [Google Scholar]
  44. Li, J.; Yuan, D.; Liu, J.; Ma, M.; Li, Y. Evaluating the effects of water exchange between surface rivers and karst aquifers on surface flood simulations at different watershed scales. J. Hydrol. 2023, 623, 129851. [Google Scholar] [CrossRef]
  45. Pinneker, E.V.; Vologodsky, G.P. Hydrogeological conditions and issues of the groundwater regime changes at the upper section of the Bratsk reservoir. In Issues of Special Hydrogeology of Siberia and the Far East; Zaitsev, I.K., Ed.; Institute of the Earth’s Crust SB RAS: Irkutsk, Russia, 1962; pp. 196–207. [Google Scholar]
  46. Jia, G.W.; Zhan Tony, L.T.; Chen, Y.M.; Fredlund, D.G. Performance of a large-scale slope model subjected to rising and lowering water levels. Eng. Geol. 2009, 106, 92–103. [Google Scholar] [CrossRef]
  47. Maksimovich, N.; Kadebskaya, O.; Meshcheriakova, O. Sulfate Karst of Perm Region (Russia); Springer: Berlin/Heidelberg, Germany, 2022. [Google Scholar]
  48. Huang, B.; Yin, Y.; Yan, G.; Li, B.; Qin, Z.; Wang, J. A study on in situ measurements of carbonate rock mass degradation in the water-level fluctuation zone of the Three Gorges Reservoir, China. Bull. Eng. Geol. Environ. 2021, 80, 1091–1101. [Google Scholar] [CrossRef]
  49. Kozyreva, E.; Mazaeva, O.; Rzetala, M.A.; Jagus, A.; Rizetala, M. Karst and its occurrence on the shores of Bratsk reservoir. In Proceedings of the 12th International Multidisciplinary Scientific GeoConference, SGEM 2012, Albena Resort, Bulgaria, 17–23 June 2012; Volume 2, pp. 175–183. [Google Scholar]
  50. Kozyreva, E.A.; Trzhtsinsky, Y.B.; Mazaeva, O.A. Karst-landslide and karst-erosion processes in local geosystems of coastal zones of the Bratsk Reservoir. Geomorphology 2008, 1, 36–42. (In Russian) [Google Scholar]
  51. Kozyreva, E.A.; Babicheva, V.A.; Mazaeva, O.A. Transformation of the Geological Environment in the Zone of Influence of Reservoirs of the Angarsk Cascade of Hydroelectric Power Plants; Series “Earth Sciences”; The Bulletin of Irkutsk State University: Irkutsk, Russia, 2018; Volume 25, pp. 66–87. [Google Scholar] [CrossRef]
  52. Leshchikov, F.N.; Shulgin, M.V. Destruction of the Angara reservoir shores in the cryolithozone. In Formation of the Angara-Yenisei Reservoir Shores; Zolotarev, G.C., Ed.; Nauka, Siberian Branch: Novosibirsk, Russia, 1988; pp. 59–64. (In Russian) [Google Scholar]
  53. Mazaeva, O.A.; Yuriev, A.A.; Babicheva, V.A. UAV aerial survey in monitoring of coastal geosystems in the southern Irkutsk amphitheater. Geodyn. Tectonophys. 2023, 14, 0734. [Google Scholar] [CrossRef]
  54. Jiang, F. Criteria of sinkhole formation in soils from physical models. Bull. Eng. Geol. Environ. 2020, 79, 3833–3841. [Google Scholar] [CrossRef]
  55. Liu, X.; Chen, H.; Gong, B.; Jiang, G.; Wang, J. Formation process of cover collapse sinkholes related to groundwater level decline in karst areas. J. Mt. Sci. 2024, 21, 3832–3846. [Google Scholar] [CrossRef]
Figure 1. Study area location with geologic map of key site: 1—alluvial mid-Upper Quaternary (sand, pebble, sandy loam and loam); 2—Lower Middle Jurassic terrigenous-coal-bearing (sandstones, siltstones with mudstone aggregates, coals); 3—Middle-Upper Cambrian terrigenous-red-colored (mudstones, siltstones, marls, sandstones); and 4—Lower Cambrian carbonate (dolomites, anhydrites, anhydrite–dolomites, marls, sandstones).
Geosciences 16 00241 g001
Figure 2. Typical landscape of the south of the Bratsk Reservoir (Google Earth Pro image): 1—Khadahan key site; 2—karst–suffosion sinkholes; 3—karst–erosion gullies; and 4—Khadahan-Zakuley motor road.
Geosciences 16 00241 g002
Figure 3. Ferre diagram shows the results of soil granulometric analysis with three types of specimen preparation: a—aggregate, sd—semi-dispersed, d—dispersed; I—sand, IIa—light sandy loam, IIb—heavy sandy loam, IIIa—light loam, IIIb—medium loam, IIIc—heavy loam, IVa—clay, and IVb—heavy clay. The solid line shows the boundaries between the lithological types of soils: sands, sandy loams, loams and clays. The dashed line shows the boundaries between the varieties of soils within the lithological types. The yellow shade corresponds to the silty varieties of grounds (the content of the silty fraction is higher than the content of the sandy fraction by semi-dispersed specimen preparation).
Geosciences 16 00241 g003
Figure 4. Karst–shore erosion forms of the coastal zone, Khadakhan site, 2004: (a) karst–wave–cut niche in the subhorizontal-bedding karst rocks; and (b) tectonic fractures and bedding plane joints, affected by weathering and leaching.
Geosciences 16 00241 g004
Figure 5. Image of the coastal slope in winter. Snow accumulates in depressions and draws a regional joint set in the relief of the coastal slope.
Geosciences 16 00241 g005
Figure 6. General view of the Khadahan site: (a) Google Earth satellite image in 2015; and (b) aerial photo from DJI Inspire 1 V2.0 quadcopter in 2023.
Geosciences 16 00241 g006
Figure 7. Scheme of events and stages (I–V) of karst–erosion process development in the study area under the conditions of water-level fluctuations in the Bratsk Reservoir for the period 1967–2023 (data of the Balagansk weather station and RusHydro).
Geosciences 16 00241 g007
Figure 8. Conceptual model of karst–erosion processes in the context of large dam reservoir operation.
Geosciences 16 00241 g008
Figure 9. Morlet wavelet power spectrum with:—COI mask (grey shading)—Statistical significance contours (white lines, α = 0.05). All 7 sinkhole events marked as vertical white dashed lines.
Geosciences 16 00241 g009
Figure 10. Correlation improvement shown in two panels. (a) Number of matched events as a function of time correlation tolerance; and (b) anomaly power for each event at a tolerance of ±365 days. The three previously unmatched events (1976, 1983, 2024) are highlighted in red in panel (b).
Geosciences 16 00241 g010
Table 1. Some typical physical, chemical and deformation-strength parameters of soils.
Sample Number1234567
sample depth, h, m0.301.442.303.203.254.174.20
microaggregation coefficient, Kma1, %2.013.716.711.29.913.615.2
total aggregate amounts, A, %29.730.427.420.130.013.824.7
fraction < 0.001 mm dispersion ratio, F6, %42.46.718.25.69.412.613.8
moisture content, W, %20.312.817.017.021.717.0
bulk density, Pb, g/cm31.301.481.761.681.811.46
dry density, Pd, g/cm31.081.311.501.441.481.24
particle density, Ps, g/cm32.402.722.622.642.632.66
porosity, n, %55.051.842.745.543.753.4
degree of water saturation, Sr0.3980.3230.5960.5380.7340.394
plasticity index, J– *1.72.82.14.36.15.2
sedimentation volume, V, cm34.02.83.52.12.83.03.5
time of air-dry soil sample disintegration in water, t, s0050111
relative swelling, Esw, %3.30.90.60.5
volumetric shrinkage, U, %7.06.86.910.5
coefficient of internal friction (tg angle of internal friction) tg φ0.4000.5500.3100.450
angle of internal friction, φ, o22291724
cohesion, Ch, kgs/cm20.4500.2000.5500.100
coefficient of relative subsidence ability, Esl0.0120.0320.0130.005
hygroscopic soil moisture, Whyg1.2401.9901.3300.870
cation exchange capacity, CEC, meq/100 g8.60013.25020.26021.170
pH index7.87.87.87.8
carbon content, C0.3000.3200.6960.744
water-soluble salt content, Sws, %0.3380.5760.3480.274
total carbonate content, Scc, %51.3461.8157.9234.22
* No data.
Table 2. Empirical percentiles of daily drawdown rates based on 58-year record (1967–2024, n = 7822 negative rates).
CategoryThreshold (m/d)Frequency
Extreme (p ≤ 1)≤−0.100~1% of days
Severe (p1–p5)−0.100 to −0.060~5% of days
Strong (p5–p10)−0.060 to −0.050~10% of days
Moderate (p10–p25)−0.050 to −0.030~25% of days
Table 3. Quantitative drawdown parameters for each sinkhole event, including the 90-day maximum rate, and corresponding results of CWT-based anomaly detection (Yes/No).
EventDrawdown Rate (m/Day)Max Drawdown 90 Days (m/Day)Annual Range (m)Level vs. Mean (m)CWT Anomaly
1976−0.010−0.130 (p < 1%)3.631.45No
1980−0.020−0.160 (p < 1%)2.72−4.51Yes
1983-050.04−0.040 (p = 15%)3.39−3.21No
19900.03−0.170 (p < 1%)3.050.22Yes
2004−0.020−0.030 (p = 27%)2.66−1.74Yes
2011−0.010−0.120 (p < 1%)3.331.34Yes
2024-09−0.004−1.010 (p < 1%)4.082.48No
Disclaimer/Publisher’s Note: The statements, opinions and data contained in all publications are solely those of the individual author(s) and contributor(s) and not of MDPI and/or the editor(s). MDPI and/or the editor(s) disclaim responsibility for any injury to people or property resulting from any ideas, methods, instructions or products referred to in the content.