


Abstract
Disaster resilience has become a key focus of risk reduction efforts, but measuring it remains complex due to differences in hazards, development paths, and data systems. This study modifies the Baseline Resilience Indicators for Communities (BRIC) approach, based on the Disaster Resilience of Place (DROP) framework, to evaluate community resilience in Serbia and highlight regional differences. An initial list of 186 indicators was created from international BRIC studies and resilience research, then tailored to Serbian conditions through contextual review and data checks. Indicators were normalized using min–max scaling (0–1), and indicators with negative orientation were inverted to ensure that higher values indicate greater resilience. Scores for each dimension were calculated as equally weighted averages across six areas: social, economic, social capital, institutional, infrastructural, and environmental. The overall BRIC index was derived as the average of these dimension scores. Z-scores facilitated the classification of resilience levels and the comparison between regions. The results show clear regional disparities: in the complete model, Belgrade has the highest resilience (BRIC = 0.557), while Southern and Eastern Serbia have the lowest (BRIC = 0.414). Patterns across dimensions show that Belgrade excels in social and economic capacity but lags in environmental indicators; Vojvodina has the strongest institutional and infrastructural capacity; and Šumadija and Western Serbia perform best in environmental indicators. Correlation analysis revealed multicollinearity, leading to the removal of 14 redundant indicators and the refinement to a set of 57. After this reduction, regional rankings change, with Vojvodina (BRIC = 0.530) and Šumadija and Western Serbia (BRIC = 0.522) emerging as higher-resilience regions, while Southern and Eastern Serbia remain the least resilient (BRIC = 0.456). The adapted BRIC-DROP model offers a clear, locally relevant tool for mapping resilience and guiding targeted policies in Serbia, enabling region-specific efforts to address structural resilience gaps.
1. Introduction
The contemporary dynamics of disasters and crises increasingly challenge local communities’ capacities to preserve core functions, reduce losses, and organize recovery amid disrupted social and economic routines [1,2,3,4,5,6,7,8]. Accordingly, community resilience has become central to disaster risk reduction, integrating preparedness, response, and long-term adaptation across hazard typologies and social settings [9,10], and is increasingly understood as a process arising from interactions among populations, institutions, infrastructure systems, and environmental conditions [11,12,13,14,15]. However, hazard heterogeneity and place-specific variability limit universal resilience metrics [16,17,18,19,20,21], making contextualized and methodologically adapted assessments necessary across risk environments (e.g., coastal storm-surge exposure versus seismic zones) [22,23]. Moreover, resilience has a temporal dimension shaped by long-term spatial embeddedness, patterns of space use, and collective functioning that influence adaptive capacities over time [15,24].
The operationalization of resilience for measurement and comparison has driven the development of composite indices and indicator-based frameworks that structure a complex concept into dimensions, indicators, and variables. Within this domain, the BRIC methodology has been positioned as an analytical instrument to support decision-making processes, with explicit requirements for transparency and interpretive clarity to facilitate practical application in risk governance [10]. At the same time, in the construction of composite indicators, particular attention is paid to the influence of indicator selection, normalization, weighting schemes, and aggregation procedures on outcome variability, implying a pronounced sensitivity of results to methodological choices [25].
The problematization of spatial and developmental inequalities further highlights the variability of resilience even within the same formal categories (e.g., urban/rural), as combinations of social, economic, and environmental processes differ and generate distinct resilience patterns [26]. Consequently, resilience enhancement requires a departure from mechanical replication of interventions and a shift toward locally relevant measures grounded in specific risks and development conditions [23,26,27].
The limitations of existing research are often linked to geographic and cultural scope, as many empirical analyses are concentrated on the United States and parts of Europe, which constrains transferability to other socioeconomic contexts without indicator localization and model adaptation [28]. Accordingly, further refinement of resilience indicators is emphasized—particularly across social, economic, and infrastructural domains—because key elements (e.g., age structure, employment, education, transport access, language competencies, and communication capacities) have not been treated consistently across studies [28,29]. The BRIC method (Baseline Resilience Indicators for Communities), developed by Susan Cutter and colleagues, provides a systematic approach to quantifying resilience through social, economic, infrastructural, and institutional drivers [29] and has been applied—when appropriately adapted—in diverse settings (e.g., Australia, Iran, Norway, Hungary, Nepal, and Taiwan) [30]. Therefore, applying BRIC without local adaptation may yield incomplete or misleading conclusions, whereas tailoring indicator selection and operational definitions to local conditions helps preserve analytical validity and policy relevance for disaster risk management and strategic planning [10].
In this regard, Serbia represents a particularly relevant and complex case, as it is exposed to a broad range of natural hazards—most notably floods, followed by fires, earthquakes, droughts, and landslides—while also facing technological, industrial, and socioeconomic risks. This multidimensional hazard environment calls for the development of a predictive resilience model that captures diverse sources of exposure and fully reflects the specificities of Serbian local communities. Importantly, such a model should not rely solely on technical indicators; it should also integrate social, institutional, and cultural factors that shape a community’s capacity to anticipate, absorb, and recover from different types of disasters. In this way, Serbia could develop a resilience approach that is both scientifically grounded and practically applicable within disaster risk governance [31,32].
Furthermore, the DROP framework (Disaster Resilience of Place), which provides the conceptual foundation for the BRIC method, offers a deeper understanding of resilience by analyzing social, environmental, and infrastructural determinants in specific geographic contexts. DROP supports the identification of inherent vulnerabilities and resilience capacities prior to the occurrence of a disaster, and is therefore crucial for developing a comprehensive picture of community resilience [10]. In this context, the indicators used to measure baseline resilience rely on the concept of “pre-event conditions,” as the DROP framework explicitly describes the most important prerequisites that shape a place’s resilience before a catastrophic event [33].
The primary objective of this study is to tailor the BRIC method for assessing the disaster resilience of local communities in Serbia by drawing on the DROP theoretical framework, with the aim of developing a predictive model for evaluating local community resilience to disasters in the Serbian context. The research will identify and select resilience indicators that align with Serbia’s local specificities and generate the necessary data and evidence-based recommendations to strengthen public policies and disaster management strategies. By combining quantitative and qualitative research methods, the study seeks to provide a comprehensive understanding of community resilience in Serbia and, through its findings, strengthen local capacities to cope with disasters [34]. From a policy and governance perspective, BRIC-style composite indices primarily serve as transparent, comparable baselines for assessing territorial capacity. These indices are not designed to track real-time crisis dynamics but rather to support strategic planning by highlighting pre-event structural factors—such as infrastructure, socio-economic resources, and institutional proxies measurable at scale—that can facilitate or hinder effective response and recovery. In this study, the adapted BRIC–DROP index functions as a benchmarking and prioritization tool to guide resilience and resource planning across regions. However, it is important to note that additional process-oriented assessments are necessary to capture adaptive changes during rapidly evolving, complex crises.
Literary Review
Within the resilience measurement literature, indicator-based approaches most commonly begin by grouping measures into broader dimensions that capture key aspects of local community functioning [35]. The eight most frequently identified interrelated dimensions are: sociodemographic structure, community well-being/social capital, economic stability, institutional capacities, infrastructure, geographic–spatial characteristics, collaboration, and risk analysis. Variations in terminology across studies do not necessarily reflect substantive differences; rather, they often represent different labels for conceptually similar indicators within the same analytical categories [28]. The methodological grounding of composite index construction in many approaches draws on OECD guidance, which provides a framework for indicator selection, data treatment, and aggregation into a single index [25].
In many studies, the sociodemographic dimension plays a foundational role in resilience assessments—particularly in urban contexts—by enabling a structural appraisal of population characteristics and their capacity to absorb crisis pressures [36]. Typical indicators include age structure, gender, vulnerable groups, population density, household size, dependency ratios, and educational status [29]. Employment is often used as an indirect marker of self-help and mutual support, while higher shares of minors and older persons are linked to greater recovery challenges [29]. Education is highlighted as a mediating factor in the development of adaptive capacity, given that formal education serves as a channel for acquiring knowledge and competencies relevant to timely responses and post-disaster resource access [36]. Comparative analyses show uneven development relative to earlier frameworks and reduced inclusion of certain BRIC (2010) indicators in later studies, particularly those related to transport access, language competencies, and communication capacities [28].
The community well-being/social capital dimension is frequently treated as both a mediating and a multiplicative factor in resilience, insofar as resources and internal connectedness can amplify the effects of other dimensions across the prevention, response, and recovery phases [37]. Empirical findings suggest that resource-strong communities have greater capacity for preventive activities and impact mitigation, whereas resource-constrained communities are more likely to enter crises without adequate preparedness and equipment [38,39]. Beyond material resources, organizational channels and established communication routines developed through existing structures and activities are highlighted as enabling more effective management before and during disasters [40,41].
In some studies, religious organizations are recognized as part of the social infrastructure that can support connectedness and norms of helping, as well as influence preparedness and the promotion of protective behaviors within urban communities [42]. Nevertheless, certain indicators present in the initial BRIC framework have not been consistently included in subsequent analyses—such as migratory population fluctuations and the share of the population engaged in creative and innovative activities—despite their potential implications for adaptive potential [28]. The economic dimension is positioned in the literature as a fundamental component of resilience, as it structures the capacities of households, organizations, and communities to absorb shocks and finance recovery [41]. Economic indicators are monitored at the household level to estimate cumulative resilience, as well as at the local economy level through employment, income, turnover, and supply chains [29]. A further distinction is made between static assessment of economic activity and dynamic assessment of the capacity to maintain developmental continuity, defining economic resilience as a combination of condition and process [43].
Across studies, commonly emphasized indicators include financial resources available for disaster response, employment, household income, poverty, and insurance system development. At the same time, comparative analyses relative to BRIC (2010) indicate limited inclusion of inequality-related indicators (e.g., the GINI coefficient) or sectoral employment structures, despite their potential to signal economic vulnerability [28]. Institutional resilience is commonly linked to governance quality and the capacity to plan, coordinate, and implement measures across disaster phases. It is viewed not as an isolated attribute but as an outcome of cumulative institutional performance that builds trust and legitimacy for crisis action over time [29]. In addition, spatial and institutional proximity to centers of political and economic power is identified as a factor facilitating access to resources and support, potentially shortening recovery time and enhancing resilience [44]. Compared with earlier frameworks, the development of indicators and variables in the institutional dimension has been noted, whereas, relative to BRIC (2010), later studies have shown limited representation of certain indicators [28].
Infrastructural resilience is most commonly associated with the quality of housing stock and the functioning of key local systems. Weaker infrastructural capacity is linked to greater damage and prolonged functional disruptions [29]. At the same time, the relationship between income differentials and housing quality underscores the inter-dimensional conditioning of infrastructural resilience [36]. Additionally, the correlation between building materials, construction procedures, and the achievement of resilient structures and systems positions infrastructure as a foundational element of overall resilience [45]. Relevant indicators include warning systems, building age and resilience assessments, material characteristics, and infrastructure maintenance. Comparative reviews also indicate limited integration of certain variables from BRIC (2010) in later studies (e.g., mobile homes, vacant properties, per capita hospital capacity, road network density), despite their potential value for a finer diagnosis of infrastructural resilience [28]. The geographic–spatial dimension shapes hazard types, intensity, and frequency, and determines which resilience measures are relevant locally. Because different hazards require distinct preparedness and organizational regimes, identical indicators cannot be scaled across contexts without local adaptation [23]. In parallel, resilience is conceptualized as a process conditioned by long-term spatial embeddedness and adaptation, with space shaping behaviors and collective response mechanisms [15].
Collaboration is treated as a mechanism for actor networking and two-way communication, as well as a channel through which decisions are formed with direct implications for collective resilience [28]. In this sense, the built environment may be conceptualized as a system of subsystems with interdependencies that can cascade across systems and the broader community [46]. Risk analysis is treated as a proactive dimension encompassing risk and vulnerability databases, historical records, mapping, and early-warning systems, with GIS and related tools supporting preventive planning and warning–response actions [47]. Moreover, simulations and scenario analysis are identified as approaches that help identify “surprising” threats and support the development of more effective strategies for prevention, adaptation, and risk management [48]. Comparative analyses suggest that these indicator groups are generally more developed than those in DROP (2008), whereas BRIC (2010) does not always treat them as separate dimensions, with certain elements partially incorporated into institutional or social components [28].
Qualitative syntheses suggest that some indicators used in other measurement approaches are not fully integrated into the original BRIC methodology, which may require localization to country, region, or community-specific conditions [28,49,50]. As a decision-support tool, BRIC prioritizes transparency and interpretive clarity, which can entail trade-offs between methodological precision and practical applicability [10]. Accordingly, the literature calls for broader geographic and cultural coverage and continued refinement of resilience dimensions and indicators to enable more comprehensive assessments [28,44].
2. Methods
This study modifies the Baseline Resilience Indicators for Communities (BRIC) approach, based on the Disaster Resilience of Place (DROP) framework, to evaluate community resilience in Serbia and highlight regional differences. Figure 1 illustrates the complete methodological process for adapting the BRIC framework to the Serbian context and developing the composite resilience index.
Figure 1.
Integrated Three-Phase Framework for Developing the Localized BRIC Resilience Index.
The process is organized into three main phases, each representing a different analytical layer within the overall model.
- Phase I—Indicator Development and Screening (Localization): This phase involves conceptual grounding and contextual refinement of indicators. It starts with the DROP/BRIC theoretical framework and the related literature, moves through initial indicator inventory and adaptation to Serbia’s hazard and socio-demographic profile, and includes relevance screening, data availability checks, and expert-based refinement. The outcome is an initial indicator set tailored to national conditions.
- Phase II—Index Construction: This stage focuses on quantitative transformation. Indicators are standardized via min–max normalization, aligned in directionality to ensure a consistent “higher = greater resilience” interpretation, and redundancies are removed through Pearson correlation screening. Refined indicators are then assigned to BRIC dimensions, aggregated with equal weights into dimension scores, and combined into the overall BRIC index.
- Phase III—Standardization, Classification, and Validation: Here, the composite index is translated into meaningful outputs. BRIC scores are standardized using Z-scores for benchmarking across territorial units, then classified into five resilience levels. The model is validated through regression analyses and qualitative triangulation, yielding final outputs such as resilience rankings, key drivers, and policy-relevant insights.
The following sections provide a detailed examination of each phase and its methodological components, including the decision rules, statistical procedures, and contextual justifications used to construct the index.
2.1. Standardization Procedure and Computation of the Composite Index
2.1.1. Initial Indicator Selection
Given the contextual specificities of each country and, more narrowly, of individual regions, the BRIC methodology required the selection of indicators that accurately reflected local characteristics and hazard profiles [51]. In this study, the indicator selection process was grounded in the original conceptualization and subsequent empirical refinements developed by Susan Cutter (University of South Carolina, USA), who formulated the theoretical DROP framework and operationalized it through the applied BRIC method. In addition, methodological guidance was drawn from adaptation studies conducted in Norway [29], Australia [52], Hungary [53,54], Iran [55], Taiwan [51], and Nepal and England [30,56], where authors tailored BRIC to align with country-specific conditions.
The identification of initial indicators relied on established BRIC indicator inventories. A preliminary list of approximately 150 indicators was compiled, informed by studies that began with 153 indicators [55] and 139 indicators [29], as well as additional publications recognized as influential within the scientific community and within the reviewed literature. This initial pool was then adapted to the Serbian context through a structured assessment of contextual relevance, localization requirements, and data availability, with particular attention to hazards and stressors, including extreme climatic conditions, floods, wildfires, and related events.
Indicator sources included the original BRIC methodology developed by Susan Cutter, alongside official statistical datasets and administrative records available from public institutions in Serbia, including (but not limited to) the Statistical Office of the Republic of Serbia, the Republic Hydrometeorological Service (RHMZ), the ministry responsible for labor-related affairs, the Ministry of Education, the Ministry of Environmental Protection, and other relevant agencies.
2.1.2. Contextual Adaptation
To ensure an analytically valid and locally appropriate indicator set, the study applied contextual adaptation principles consistent with those used in the above-mentioned national BRIC applications. In particular, the Norwegian and Iranian studies used Cutter’s foundational BRIC publications as a starting point without imposing strict constraints that would have required exclusive reliance on the original BRIC indicators—an approach that differed from the Australian application, which followed a more restrictive indicator framework. Consistent with the Norwegian and Iranian approaches, indicators irrelevant to the Serbian context were removed. For example, indicators tied to United States-specific programs (e.g., the share of the population participating in Citizen Corps programs) were excluded, as were indicators for which no historical monitoring existed in Serbia or for which valid time-series data could not be obtained. Conversely, indicators directly relevant to Serbia were retained and/or introduced for consideration where justified by local conditions and hazard exposure. This included, for example, the proportion of the population exposed to flood risk, key demographic characteristics, migration dynamics, employment rates, resource accessibility, and the share of employment in higher-risk sectors. The inclusion of such indicators was warranted insofar as it strengthened contextual validity and improved the explanatory capacity of the resulting resilience index for Serbian local communities.
2.1.3. Elimination of Non-Relevant Indicators
Following initial selection and contextual adaptation, the elimination phase applied two principal criteria:
- (a)
- Lack of applicability to the Serbian context. Indicators assessed as not substantively relevant to Serbia were excluded, consistent with procedures used in BRIC adaptations for Norway, Iran, and Taiwan.
- (b)
- Data unavailability. Indicators for which publicly accessible data did not exist in Serbia—such as certain insurance program metrics or language competency measures—were removed from the analysis. While international efforts aimed to harmonize statistical indicators, countries continued to collect and process data in ways shaped by national institutional arrangements and context-specific priorities. As documented in the BRIC adaptation studies for Iran, Norway, and Taiwan, such structural differences in statistical infrastructure necessitated selective retention and exclusion of indicators during localization.
2.1.4. Selection of Key Indicators
The initial indicator list was compiled after removing non-relevant indicators and those for which no data were available. Indicators were selected to align with the conceptual BRIC/DROP dimensions while ensuring national coverage, data quality, and policy interpretability. This selection logic supports comparability across regions and preserves practical relevance for resilience planning and prioritization. The resulting preliminary set was then reviewed and condensed based on the substantive importance of each indicator.
Before the correlation analysis, indicator values were normalized using min–max transformation on a 0–1 scale. Normalization was performed according to the following formula:
The min–max procedure was implemented across all four regions included in the dataset, such that and were defined at the national level (i.e., across Serbia’s four regions). This approach preserved inter-regional ranking and ensured indicator comparability, while acknowledging that results were sensitive to extreme values. Normalization also enabled comparisons of indicators expressed in different units, including percentages, absolute quantities, and other metric formats.
Subsequently, indicator directionality was addressed. Indicators with an inherently “positive” direction (higher values indicating greater resilience) were retained without modification. For “negative” indicators (higher values indicating greater vulnerability/exposure), values were inverted using:
Xadj = 1 − Xnorm
For each resilience dimension, the arithmetic mean of the adjusted, normalized indicator values was then calculated under an equal-weighting scheme:
The final set of indicators used to measure resilience was determined through Pearson correlation analysis, consistent with procedures applied in BRIC adaptation studies for Norway, Iran, Australia, Hungary, and England. Pearson correlation analysis was used to identify potential multicollinearity among indicators. Indicators exhibiting a high correlation with another indicator were excluded from further processing when deemed less relevant than the indicator with which they correlated. This procedure combined statistical evidence from correlation results with substantive judgments derived during the indicator review process. In this way, locally significant characteristics—whether derived directly from the present analysis or previously validated in the literature (e.g., age structure, resource accessibility)—were recognized as potentially exerting different levels of influence on the construction of the resilience index for Serbian local communities. Indicators were equally weighted to ensure transparency, replicability, and interpretability, and to avoid imposing subjective expert priors in the absence of robust evidence supporting a stable alternative weighting scheme. Equal weighting is commonly used in baseline composite indices when the primary aim is benchmarking and diagnostic prioritization. Nevertheless, alternative weighting strategies (e.g., expert elicitation, factor-based weights, entropy weights) are viable and can be explored as robustness checks in future work.
In summary, the BRIC index was computed as the mean of the dimension scores, yielding a composite BRIC disaster resilience index.
In addition, for the purposes of standardization and classification of the resulting index values—and to position Serbia’s statistical (territorial) units relative to each other—Z-scores were calculated using:
Classification followed these thresholds: Z > +1.5 (high), +0.5 ≤ Z ≤ +1.5 (relatively high), −0.5 < Z < +0.5 (moderate), −1.5 ≤ Z ≤ −0.5 (relatively low), and Z < −1.5 (low resilience).
In other words, the selection of indicators and indicator groups used in resilience assessment was treated as a balanced process conducted through two complementary pathways: (1) the application of statistical criteria and correlation-based screening, and (2) informed researcher judgment regarding the substantive appropriateness of indicators for resilience measurement. This approach distinguished between objective and subjective strategies for indicator construction. Subjective indicators are derived from expert-based reasoning, while objective indicators come from explicit quantitative calculations; some examples include [52,57,58,59,60,61]. Consequently, objective indicators were more readily transferable across broader geographic contexts, while subjective indicators were more appropriate within narrower contexts—such as Serbia—where they reflected a deeper understanding of local operating conditions [62].
The final indicators were subsequently grouped according to the core BRIC resilience dimensions. These dimensions provided a structured analytical framework for examining key determinants of community resilience. As in prior studies—particularly those focusing on Norway, Iran, Hungary, and Australia—the selected dimensions were adapted to Serbia’s specific characteristics and conditions.
The overall procedure for indicator selection and refinement relied substantially on established practices in the relevant scientific literature and on the OECD Handbook on Constructing Composite Indicators, which outlines ten key steps. This framework was referenced in the original BRIC study [10], especially given the considerable scope for variation in BRIC implementation across contexts (e.g., indicator development, application to different geographic settings, varying community definitions, and differing disaster types and consequences). The OECD framework for constructing composite indicators was presented in Table 1.
Table 1.
Framework for Constructing Composite Indices [25] (pp. 19–21).
2.1.5. Validation of the Resilience Model
After the data analysis, the predictive resilience model was validated using the following methods:
- (a)
- Regression analyses were used to assess the model’s predictive power and to identify key resilience factors. They were applied as the primary statistical tool for determining relationships between independent and dependent variables within resilience research. These analyses enabled a detailed evaluation of the model’s predictive performance—its ability to accurately explain or predict the dependent variable’s behavior based on the specific effects of the independent variables. Key parameters, such as the coefficient of determination (R2), were calculated to indicate the proportion of the dependent variable’s variability explained by the model. This process included:
- An initial assessment of appropriate model types (linear, logistic, multivariate models);
- Model validation through comparison of observed and predicted values;
- Identification of potential issues, such as multicollinearity or heteroscedasticity, to ensure model reliability.
Regression models also served to identify the independent variables with the greatest influence on the dependent variable (e.g., the level of resilience of a community or institution). This step included:
- Testing the significance of independent variables using p-values and regression coefficients;
- Identifying key factors such as socio-economic indicators, infrastructure preparedness, or institutional support;
- Refining the model to retain only those variables with statistical and practical significance.
- (b)
- Validation using qualitative data: Qualitative data collected through interviews and surveys were used to further verify and validate the results of the quantitative analysis.
2.1.6. Methodological Challenges in Adapting the BRIC Method
The primary methodological shortcoming identified in the analysis of earlier scientific studies that applied the BRIC method is that OECD guidelines were largely omitted, precisely in areas where difficulties arose; namely, data collection, assessment of indicator quality, and comparability. These are the very segments in which weaknesses in study design and in the selection of optimal indicators for measuring resilience become most visible.
The next identified methodological limitation is the insufficient use of appropriate instruments to produce results that could inform the development of optimal resilience indicators for the geographically defined area under study. In particular, expert analysis was inadequate in the fields corresponding to the indicator groups defined in the reviewed studies. In addition, fieldwork—namely, surveys and interviews—was insufficient, especially when publicly available data from government and other institutions were lacking. The results from multivariate analyses should guide methodological decisions, such as indicator grouping and index weighting [25]. Furthermore, to reduce the number of indicators to be measured, Cutter and colleagues published a 2022 study that, in addition to previously used correlation methods, applied the statistical technique Principal Component Analysis (PCA). However, “PCA did not yield factors that were conceptually justified and aligned with contemporary understandings of community resilience and its drivers” [63] (p. 5).
In other words, the selection of indicators and indicator groups used in resilience assessment should be balanced and conducted in two complementary ways. The first involves statistical measures and correlation testing, while the second relies on expert assessment and field research (surveys and interviews) to determine which indicators should be included in the set measured for resilience assessment. Overall, although the BRIC method ranks highly in identifying relevant resilience indicators, it does not provide a closed, universally applicable set of indicators that could be used across all countries or territories to measure disaster resilience. While correlation-based reduction effectively minimizes redundancy and improves the stability of a national composite index, it may also eliminate indicators that are locally significant in particular contexts. As a result, the reduced indicator set is best suited for standardized national benchmarking. However, local adaptations may retain certain indicators that are vital in specific settings, even if they appear statistically redundant at the national level. For instance, population density can indicate either a resource—such as access to services and social connectivity—or a vulnerability—such as exposure risk or evacuation difficulty—depending on hazard pathways and local institutions.
The use and adaptation of the BRIC method and the theoretical DROP model, developed by Susan Cutter and collaborators, require contextual adjustment (improvement) in order to be successfully applied in specific local settings. For effective implementation, such adaptation must be carried out precisely in the domain of those indicators that the BRIC method does not cover. By incorporating certain indicators from the theoretical framework of this research into the indicator groups used by BRIC, these indicators can be localized to become measurable and meaningful for a specific territory or country, such as Serbia. Which indicators would ultimately be used in the modified method would depend on data availability, statistical techniques, expert analysis, and fieldwork, through which data-collection feasibility would be established and the use of indicators optimized using the above instruments to produce a resilience index.
2.2. Study Area
Disaster risks are among the most serious challenges to the long-term stability, safety, and sustainable development of contemporary societies. As a country exposed to a diverse range of natural hazards and technological–industrial threats, the Republic of Serbia (Figure 2) has intensified its efforts over recent decades to strengthen institutional and operational mechanisms for risk prevention and mitigation. At the same time, growing emphasis has been placed on enhancing the resilience of local communities and the wider social system to ensure effective protection of people, property, and natural resources, as well as continuity of social and economic functions after catastrophic events [28].
Figure 2.
Study area with Serbia’s administrative regions. Source: d-maps.com (https://d-maps.com (accessed on 5 February 2026)). Adapted by the author.
Serbia’s vulnerability is particularly evident in its exposure to a broad spectrum of hazards, including floods, earthquakes, landslides, droughts, and fires. Historical records indicate that over roughly the last century (up to 2013), nearly 850 flood events were registered, resulting in 133 fatalities. The most severe and widely recognized episode remains the catastrophic floods of May 2014. Under such conditions, building and strengthening community resilience becomes a decisive prerequisite for effective disaster risk reduction and for limiting disaster impacts [64].
Although Serbia formally aspires to develop a functional and integrated disaster risk management system, practice still lacks a unified index for measuring local community resilience to disasters. According to findings highlighted by the United Nations Development Programme (UNDP), key shortcomings stem from institutional and governance gaps, as well as constraints in risk reduction capacities, which significantly weaken communities’ overall ability to respond effectively to disasters [31]. These challenges are especially visible in the organization of the system itself, where fragmented institutional arrangements and procedures prevail, and where local and national capacities for prevention, preparedness, and response remain insufficiently developed—directly undermining resilience and the effectiveness of local communities [65,66,67].
A critical condition for effective preparedness, appropriate response, and successful recovery is the systematic measurement of resilience—an area that has gained prominence globally in recent decades and to which Serbia is increasingly orienting its efforts. In this context, the Ministry of Interior prepared a national disaster risk assessment in 2017. When its results are compared with internationally recognized indicators and models, the BRIC method emerges as the most comprehensive and quantitatively robust framework for assessing resilience. This approach enables a systematic incorporation of Serbia’s specific characteristics and context, providing a particularly suitable foundation for further strengthening the national disaster risk management system [28].
3. Results
Regional disparities in baseline community disaster resilience are evident in the composite BRIC–DROP index. Dimension-level results reveal heterogeneous patterns, with strengths and deficits clustering differently across regions. This profile-based view supports targeted interventions aligned with the dimensions where gaps concentrate. During the implementation of the procedure for deriving a resilience index for Serbia, an initial indicator selection process was conducted. Indicators used to construct resilience indices were identified and systematized from the previously listed scientific studies. In total, 186 indicators were included in the initial analysis. After the initial list was compiled, each indicator was assessed in its context. First, indicators that substantially overlapped and relied on the same underlying measures were eliminated. Subsequently, their relevance was examined with respect to whether they existed in the Serbian context—both in meaning and in constituent elements—and, finally, whether they had historically existed and been measured. The next step was to eliminate irrelevant indicators. The analysis examined whether specific indicators were applicable at the local level; i.e., within Serbia. Those that were not applicable due to geographic, economic, social, infrastructural, or other contextual conditions were removed from further selection. Following this, the availability of data for the measures used to construct indicator values was assessed. In many cases, calculating indicator values required collecting data for multiple measures, after which the final indicator values were computed. Indicators for which data were not available or could not be derived through calculations from multiple measures were excluded from the subsequent selection process. After these procedures were completed, a final assessment was conducted, and the indicator list was reduced for Pearson correlation analysis. Prior to the correlation analysis, indicator values were normalized using min–max transformation to a 0–1 range. In addition, to obtain a clearer insight into the resulting values, z-scores were computed, enabling standardization and classification of the obtained results.
The full set of observed indicator values by region is provided in Appendix A (Table A1). Table A1 presents a comprehensive overview of the primary indicators used to calculate the BRIC-based resilience index. The indicators were grouped into six dimensions: social, economic, social capital, institutional, infrastructural, and environmental. For each indicator, the calculation method, the national average for Serbia, and values for four Serbian regions (the Belgrade Region, the Vojvodina Region, the Šumadija and Western Serbia Region, and the Southern and Eastern Serbia Region) are presented.
The results indicate substantial regional differences. In the social and economic dimensions, Belgrade achieves the strongest performance (e.g., the highest share of highly educated population, the highest employment rate, and the largest number of physicians and medical technicians), whereas Southern and Eastern Serbia record the weakest outcomes (the highest poverty rate, lower urbanization, and more limited access to services). Vojvodina performs better on infrastructural and institutional indicators (a more developed road network, higher investment in local health care, and greater institutional stability), while Šumadija and Western Serbia lead in the environmental dimension (a higher share of forested areas and a larger number of agricultural holdings).
Overall, the table illustrates that no region performs uniformly best across all dimensions: Belgrade dominates in socio-economic indicators, Vojvodina in institutional and infrastructural indicators, and Šumadija and Western Serbia in environmental aspects, while Southern and Eastern Serbia are the most vulnerable regions across multiple areas. These results provide the basis for further standardization and z-score computation, as well as for deriving the composite resilience index for Serbia’s regions.
The results of the min–max normalization are reported in Table A2 (Appendix A), with all indicator values rescaled to the 0–1 interval. This ensured comparability among indicators that have different units of measurement and scales. For each indicator, the direction is specified—whether a higher value indicates higher resilience (HR) or higher vulnerability (HV). In cases where an indicator was negatively oriented (e.g., poverty, unemployment, lack of services), an inversion was applied (X_adj = 1 − X_norm) so that all values were aligned with the interpretation “higher value = higher resilience.”
The results show that the Belgrade Region attains the highest values for most indicators (e.g., educational structure, access to transport, urban living), indicating stronger development in the social and economic dimensions. Vojvodina records high scores in infrastructure, institutional capacity, and agricultural indicators, while Šumadija and Western Serbia demonstrate relatively better positions in the environmental dimension (forests, local food suppliers). Southern and Eastern Serbia exhibit the lowest normalized values in most cases, indicating structural disadvantages and lower resilience. These normalized data constitute the starting point for subsequent z-score calculations and the construction of the composite index, enabling clear identification of regional strengths and weaknesses.
Table 2 and Figure 3 present the results of aggregating indicators across six resilience dimensions (social, economic, social capital, institutional, infrastructural, and environmental), calculated as the arithmetic means of min–max normalized scores (0–1). The number of indicators in each dimension is shown in parentheses. The results indicate that the Belgrade Region performs best in most dimensions, with particularly high scores in the social (0.698) and economic (0.692) dimensions, while recording the weakest result in the environmental dimension (0.228). Vojvodina achieves the best results in the institutional (0.631) and infrastructural (0.600) dimensions, reflecting its stronger institutional and infrastructure capacities. Šumadija and Western Serbia show a relative advantage in the environmental dimension (0.661), while scoring below average or average in most other dimensions. Southern and Eastern Serbia is the weakest in almost all dimensions (e.g., economic: 0.377; social capital: 0.321), confirming its lower resilience. At the national level, Serbia’s composite resilience index is 0.497, indicating moderate resilience. Clear regional disparities are evident, ranging from Belgrade’s markedly high results to significant lagging in the southeastern part of the country, underscoring the need for regionally differentiated policies.
Table 2.
Aggregation by dimensions: arithmetic means (M) of min–max normalized scores (0–1).
Figure 3.
Aggregation by dimensions: arithmetic means (M) of min–max normalized scores (0–1).
Serbia as a whole achieved a score of 0.497 (BRIC = 0.101), placing it in the medium resilience category. This result suggests that the country’s average resilience is generally balanced but marked by significant regional disparities. While Belgrade leads with relatively high resilience, Vojvodina and Šumadija/Western Serbia remain around the national average, Southern and Eastern Serbia lag behind, pulling the national result downward. This gap underscores the need for regionally differentiated policies to reduce inequalities.
Regarding the regions, the Belgrade Region recorded the highest composite score (BRIC = 0.557, Z = 1.260), indicating above-average resilience compared to the other regions. This result is classified as relatively high resilience, confirming that this region is the most resilient in Serbia. By contrast, the Vojvodina Region is slightly above average (BRIC = 0.511, Z = 0.372). Although it remains within the medium resilience category, it ranks immediately behind Belgrade, reflecting stable development capacities and room for improvement. Next, the Šumadija and Western Serbia Region is close to the national average (BRIC = 0.485, Z = −0.130), and it also falls within the medium resilience category. Its position reflects moderate resilience, with relatively balanced results across dimensions. Finally, the Southern and Eastern Serbia Region has the lowest score (BRIC = 0.414, Z = −1.502), placing it in the relatively low resilience category. This outcome indicates limited resilience capacities and highlights the need for targeted development interventions and greater investment in social and economic infrastructure. These results are presented in Table 3 and Figure 4.
Table 3.
Regional comparative analysis of the BRIC composite index: z-score, rank, and categories.
Figure 4.
The BRIC index values for all four regions. The dashed horizontal line indicates Serbia’s reference level (BRIC = 0.497). Serbia 0.497 (dark blue color), Belgrade 0.557 (orange color), Vojvodina 0.511 (silver color), Sumadija and Western Serbia Region 0.485 (yellow color), Southern and Eastern Serbia Region 0.414 (light blue color).
Table 4 presents z-scores for the six resilience dimensions (social, economic, social capital, institutional, infrastructural, and environmental) across Serbia’s regions and the national average. The Belgrade Region consistently achieves positive results across most dimensions (especially in the social—Z = 1.624 and economic—Z = 1.607 dimensions), positioning it as the most resilient region. However, it records a negative result in the environmental dimension (Z = −1.646), indicating weaknesses in this area. The Vojvodina Region stands out with high scores in the infrastructural (Z = 1.264) and institutional dimensions (Z = 1.073), while in the social and economic dimensions, it shows average or slightly negative values. Its resilience profile is relatively balanced but moderate. The Šumadija and Western Serbia Region achieves a positive score in the environmental dimension (Z = 1.108), but shows a pronounced decline in the infrastructural dimension (Z = −1.537). In the remaining dimensions, results are close to the national average.
Table 4.
Dimension z-scores by region and interpretation.
Finally, Southern and Eastern Serbia show the weakest performance, with negative z-scores in almost all dimensions, particularly in the institutional dimension (Z = −1.590). The only dimension that shows a slightly positive result is infrastructure (Z = 0.181). At the national level, the average values indicate a medium level of resilience across most dimensions. Exceptions are social capital (Z = 1.401) and the institutional dimension (Z = −1.457), where regional disparities are especially pronounced.
Table 5 presents regional differences across the six resilience dimensions using z-scores and categories. The Belgrade Region stands out as the leader in most dimensions (social, economic, and social capital), while at the same time recording the weakest result in the environmental dimension. Vojvodina leads in the institutional and infrastructural dimensions, indicating more stable institutions and more developed infrastructure than the other regions. Šumadija and Western Serbia lead in the environmental dimension, but simultaneously lag behind in the infrastructural dimension. Southern and Eastern Serbia is the weakest-performing region, showing underperformance across three dimensions (economic, social capital, and institutional), indicating systemic challenges in its development capacities. At the national level, apart from the relatively high environmental dimension, most dimensions fall into the medium resilience category. Social capital and the institutional dimension stand out in particular, with pronounced regional contrasts—from relatively high values in Belgrade and Vojvodina to low values in Southern and Eastern Serbia.
Table 5.
Dimensions—z-scores by region and interpretation.
Figure 5 is particularly useful and visually effective for rapid interpretation, as it presents a “heat map” of normalized BRIC resilience index values. The indices are shown for the regions and for Serbia overall, covering all six resilience dimensions as well as the composite index aggregated across all regions and Serbia.
Figure 5.
BRIC z-scores by region. Z = (x − μ)/σ, where μ = 0.4918 and σ = 0.0518 (calculated across the specified regions). A positive Z indicates above-average resilience, while a negative Z indicates below-average resilience; the dashed zero line represents the mean.
3.1. Correlation Analysis of Indicators
To assess robustness and identify potential indicator redundancy, Pearson correlation analysis was conducted on the normalized and adjusted (X_adj) values of all indicators. In this way, the interrelationships among indicators within and across dimensions were examined. The calculations were performed for all four regions in Serbia, while a version using the national average was included in a separate analysis for comparison. The full correlation matrix contained 72 × 72 cells and was additionally segmented by dimension for practical use.
The results of the correlation analysis indicate significant interconnections among certain indicators. In particular, strong positive correlations (r > 0.80) were observed between specific social and economic measures (e.g., educational structure and employment rate, population density and urbanization), suggesting partial overlap in the information they capture. In contrast, within the environmental dimension, weaker and more diverse relationships were obtained, indicating greater independence from socio-economic indicators.
Figure 5 shows a heat map of Pearson correlation coefficients for all indicators. Stronger relationships are visualized with darker colors, where red shades indicate positive and blue shades negative associations. This analysis confirms the existence of clusters of highly correlated indicators, which opens the possibility of reducing the indicator set using factor analysis or PCA techniques.
3.2. Correlation Analysis Results
The analysis of Pearson correlation coefficients revealed several pairs of indicators with exceptionally high interdependence (|r| ≥ 0.85), indicating substantial overlap in both their substantive content and, to some extent, their analytical scope.
Within the social dimension, an almost perfect correlation was observed between educational attainment and the number of preschool institutions (r = 1.00), indicating that regions with a higher proportion of highly educated residents also tend to have a more developed childcare infrastructure. In addition, the population dependency ratio is strongly associated with the number of employees per employer (r = 1.00), suggesting that demographic structure directly influences economic activity.
In the economic dimension, the employment rate and sectoral employment exhibit an identical trend (r = 1.00), meaning that both indicators effectively measure the same aspect of economic structure. Furthermore, the at-risk-of-poverty rate is in a perfect positive relationship with household internet connectivity (r = 1.00), suggesting that regions with higher poverty levels simultaneously experience weaker access to digital services. A strong association is also observed between gender equality (the share of women in employment) and local health care expenditures (r = 1.00), indicating that women’s economic and social inclusion often depends on the strength of institutional support.
Within social capital, a strong relationship is identified between innovative activity and local expenditures (r = 1.00), indicating that local government financial allocations are directly reflected in regions’ innovative capacity. Similarly, urbanization and the availability of temporary accommodation are strongly correlated (r = 1.00), as urban centers typically offer a greater supply of service capacities.
In the institutional dimension, a notable correlation exists between local expenditures and innovative activity (r = 1.00), indicating that the strength of institutional investment is directly linked to economic potential. In addition, budgetary expenditures and the structure of household income show complete agreement (r = 1.00), suggesting that public spending follows the economic capacity of the population.
Within the infrastructural dimension, housing construction and the availability of temporary accommodation exhibit a perfect positive correlation (r = 1.00), as expected, since increased residential construction expands accommodation capacity. Likewise, health care capacity (number of hospital beds) strongly correlates with the dependency ratio (r = 0.98), indicating that demographic pressures directly shape the health care system.
In the environmental dimension, very strong negative correlations were also identified. Specifically, the population dependency ratio exhibits a strong negative relationship with the number of agricultural holdings (r = −1.00), indicating that demographic challenges reduce agricultural production capacity. Similarly, broadband internet connectivity is negatively associated with population domicile stability (r = −1.00), indicating that technologically more developed regions experience higher migration levels and a lower share of autochthonous population.
Within the social dimension, the number of minors and the number of schools per 10,000 inhabitants show a moderately high association (r = 0.70), as expected, since a larger child population requires a more developed educational infrastructure. At the same time, educational attainment is negatively correlated with the share of the minor population (r = −0.70), indicating that regions with a higher proportion of highly educated residents tend to have fewer young inhabitants.
In the economic dimension, property ownership and the number of schools (r = 0.70) are positively related: regions with a higher share of homeownership also exhibit better-developed educational infrastructure. In addition, business size (the ratio of SMEs to large enterprises) moderately correlates with the share of commercial enterprises (r = 0.70), indicating that economic structure influences sectoral specialization.
Within the infrastructural dimension, the number of newly constructed housing units and urbanization show a clear association (r = 0.70), as housing construction is predominantly concentrated in urban areas. Similarly, better school coverage is negatively associated with the share of households without piped water (r = −0.70), indicating that more developed infrastructure is accompanied by higher-quality educational capacity.
In the institutional dimension, the number of medical technicians and the local governments’ level of indebtedness exhibit a moderate positive relationship (r = 0.70), suggesting that higher public investment in health care may entail greater financial burdens on local budgets.
Within the environmental dimension, the number of agricultural holdings engaged in direct product marketing and forest area is moderately associated (r = 0.70), indicating that regions with traditional agricultural practices also tend to preserve more natural resources. Additionally, urbanization is negatively correlated with forest area (r = −0.70), as expected, as larger urban centers reduce forest coverage.
These pairs reflect moderate but interpretatively significant relationships. Unlike perfect correlations (r = ±1.00), these indicators provide additional information and can remain in the analysis; however, they must be interpreted cautiously to avoid partial redundancy.
In addition to extreme correlation values (|r| ≥ 0.85), the analysis also highlights pairs of indicators with moderate levels of association (0.40 ≤ |r| < 0.70). Although these values do not indicate complete overlap, they represent statistically meaningful and interpretatively relevant relationships. Such associations reveal structural linkages across different dimensions (social, economic, infrastructural, institutional, and environmental) that would remain unnoticed if only extreme coefficients were considered. For this reason, moderate correlations were retained as an added value for understanding the phenomenon’s complexity, with the caveat that they must be interpreted carefully to avoid overstating the extent of partial overlap.
Considering the correlation analysis within the 72 × 72 matrix and within individual resilience dimensions/groups, indicators with the highest degree of interdependence can be identified and eliminated for further use. A specific feature of the initial indicator selection was the large number of indicators and the intention to include all indicators previously used to measure resilience using the adapted BRIC method. This approach aimed to achieve the highest possible precision of the index and a comprehensive data collection strategy.
Taking into account the preceding analysis, some indicators—despite their mutual correlation—remain capable of clearly reflecting interrelationships and highlighting key characteristics of local communities. Therefore, their removal must be conducted cautiously during the construction of the BRIC method. Particular attention must be given not only to index simplicity but also to the predictive capacity of certain indicators, which can significantly enrich the understanding of local community resilience.
Overall, to reduce substantial overlap in content and analytical scope, the following indicators may be removed in accordance with the internationally established BRIC methodology and the research procedure applied in this study. The social dimension initially comprised 18 indicators. Following the correlation analysis, five indicators were removed. Consequently, in the BRIC method adapted for Serbia, this dimension includes 13 indicators.
The indicators removed as redundant were: population density; social protection; communication capacity 1; urban life; and access to health care. Table 6 presents data for the first 20 indicator pairs, along with their correlation coefficients.
Table 6.
The first 20 pairs of indicators were ranked by correlation strength in the social dimension.
The economic dimension (group) initially comprised 13 indicators. Following the analysis and determination of correlation levels, three indicators were removed. Thus, in the BRIC method adapted for Serbia, this dimension includes 10 indicators. The following redundant indicators were removed: sectoral employment, household income structure, and budgetary allocations. Table 7 presents data for the first 20 pairs of indicators with their correlation coefficients.
Table 7.
The first 20 pairs of indicators were ranked by correlation strength in the economic dimension.
The institutional dimension (group) initially comprised nine indicators. Following the analysis and determination of correlation levels, one indicator was removed. Thus, in the BRIC method adapted for Serbia, this dimension includes eight indicators. The indicator that was removed as redundant was the coordination of responsibilities. Table 8 presents data for the first 20 pairs of indicators with their correlation coefficients.
Table 8.
The first 20 pairs of indicators were ranked by correlation strength in the institutional dimension.
The infrastructural dimension (group) initially comprised 12 indicators. Following the analysis and determination of correlation levels, one indicator was removed. Thus, in the BRIC method adapted for Serbia, this dimension includes 11 indicators. The indicator removed as redundant was: water supply. Table 9 presents data for the first 20 pairs of indicators with their correlation coefficients.
Table 9.
The first 20 pairs of indicators were ranked by correlation strength in the infrastructural dimension.
The social capital dimension (group) initially comprised 11 indicators. Following the analysis and determination of correlation levels, two indicators were removed. Thus, in the BRIC method adapted for Serbia, this dimension includes nine indicators. The indicators removed as redundant were: childcare and household internet connectivity. Table 10 presents the first 20 pairs of indicators and their correlation coefficients.
Table 10.
The first 20 pairs of indicators ranked by correlation strength in the social capital dimension.
The environmental dimension (group) initially comprised nine indicators. Following the analysis and determination of correlation levels, two indicators were removed. Thus, in the BRIC method adapted for Serbia, this dimension includes seven indicators. The indicators removed as redundant were: agricultural holdings and settlements. Table 11 presents data for the first 20 pairs of indicators with their correlation coefficients.
Table 11.
The first 20 pairs of indicators were ranked by correlation strength in the environmental dimension.
3.3. Factor Analysis for Dimensionality Reduction
Factor analysis was applied to enable a deeper examination aimed at potential further dimensionality reduction and the identification of latent constructs underlying a large number of individual indicators. This method enables the extraction of a smaller set of factors that best explain the observed variation, rather than relying on a large set of separate measures. In this way, a more stable and analytically cleaner foundation is obtained for constructing a composite resilience index. For the presentation of results, indicator computations rather than the indicators themselves were used, in order to make it easier to understand “at first glance” what each indicator (through its calculation) represents and implies.
The results presented in Table 12 indicated the presence of two main factors that together explain the largest share of total variance:
Table 12.
Factor loadings of the indicators.
- (a)
- Factor 1—Socio-economic development—the highest negative loadings on this factor are observed for: percentage employed relative to the total population (−0.797); at-risk-of-poverty rate (−0.789); percentage of the population living in urban areas (−0.785); percentage of the population with at least the first level of education (−0.787); number of broadband internet subscriptions per household (−0.795); number of passenger cars per 1000 inhabitants (−0.759). Conversely, positive loadings are found for:population density (0.767); percentage of single-person households (0.758); percentage of ownership of the dwelling in which the household resides (0.755). This combination of indicators suggests that the first factor essentially reflects the level of socio-economic development and regional modernization. Higher values of this factor occur in more urbanized and economically developed areas, whereas lower values are characteristic of rural and less developed regions.
- (b)
- Factor 2—Institutional–infrastructural context—the second factor is most strongly associated with indicators describing institutional and infrastructural capacities: ratio of expenditures for health care and social protection to revenues (0.439); share of modern road infrastructure in the total road length (0.453); number of fixed telephone lines per household (0.398); number of medical technicians per 10,000 inhabitants (−0.365); percentage of the population for whom the local/domicile language is the mother tongue (−0.422); number of marriages per 1000 inhabitants (−0.362). These indicators suggest that the second factor represents the strength of institutional and infrastructural systems, as well as socio-cultural patterns within the community.
Overall, the factor analysis showed that many individual indicators can be reduced to two clear, interpretable factors: socio-economic development and institutional–infrastructural context. These results support the further development of the composite index on a more stable, methodologically grounded basis, without the risk of double-counting or indicator overlap. However, caution is warranted, as a number of studies have found that this method may reduce the “depth” of analysis and weaken the conceptual justification for using specific resilience dimensions.
3.4. Adapted BRIC Indicators for the Local Context of Serbia
The observed high correlation values indicate strong redundancy among the model’s indicators. In practical terms, this means that multiple indicators convey almost identical information, thereby reducing the analytical precision and transparency of the composite index. Accordingly, based on the obtained results, a selective process of excluding indicators with the highest correlation was conducted. The selection was guided by the need to further strengthen contextual adaptation to Serbia’s local characteristics, the assessed individual relevance of each indicator, and data availability—not only at the regional level, as applied in this study, but also at lower administrative levels (municipalities). This was carried out to ensure that the selected indicators can be used smoothly in future research.
A specific element of the indicator selection process is also related to the dimension to which an indicator belongs: the indicator group within one of the six BRIC categories. Factor analysis for dimensionality reduction was not included in the final selection of indicators for the adapted BRIC method for Serbia, because—despite methodological simplification—it would “lose” essential relationships needed for a deeper understanding of indicator relevance and the computed values for each indicator. This would limit more advanced analysis and prediction, which is itself an important objective in developing a predictive model to better assess disaster resilience across Serbia. Table 13 provides an overview of the dimensions and the indicators resulting from the methodological procedure described in this study. The resulting 57 indicators across the resilience dimensions (groups) represent an adaptation of the BRIC community disaster resilience indicators for Serbia.
Table 13.
BRIC dimensions, indicators, and measures of community disaster resilience in Serbia.
Table 14 presents the adaptation of the BRIC community disaster resilience indicators for Serbia. It follows the same contextual format as the tables previously used to display the BRIC indicators, to facilitate clearer comparison and highlight how the method has been adjusted to the local Serbian context.
Table 14.
Adaptation of the BRIC community disaster resilience indicators for Serbia.
3.5. Recalculated BRIC Results After Indicator Reduction for Serbia
The tables below display the recalculated dimension scores, composite BRIC values, and comparative differences after narrowing down the indicator set using Pearson correlation screening. All indicators were initially normalized to a 0–1 scale through min–max normalization; negatively oriented indicators were inverted using X_adj = 1 − X_norm to ensure that higher values always reflect greater resilience. Dimension scores are calculated as the arithmetic mean of the retained indicators, and the composite BRIC index is derived as the equal-weighted average of the six dimensions.
Table 15 presents the revised dimension scores based on the reduced indicator set. Belgrade maintains the highest Social performance (M = 0.615) but remains the lowest in the Environmental dimension (M = 0.293). Vojvodina shows the highest Institutional (M = 0.654) and Infrastructural (M = 0.586) capacities. Meanwhile, Šumadija and Western Serbia lead in Economic (M = 0.545) and Social capital (M = 0.621) components. Southern and Eastern Serbia continue to underperform across several areas, especially in Institutional (M = 0.328) and Social capital (M = 0.392). Overall, the updated composite BRIC scores better distinguish strengths in institutional and infrastructural aspects (Vojvodina) and socio-economic and social-capital benefits (Šumadija and Western Serbia), while also emphasizing Belgrade’s environmental shortfall.
Table 15.
Recalculated aggregation by dimensions after indicator reduction: arithmetic means (M) of min–max normalized scores (0–1).
Table 16 displays the recalculated composite BRIC index and the corresponding standardized z-scores. Following indicator reduction, Vojvodina takes the top spot (BRIC = 0.530, Z = 1.022), with Šumadija and Western Serbia close behind (BRIC = 0.522, Z = 0.750). Belgrade moves to a medium resilience level (BRIC = 0.493, Z = −0.244), mainly due to its comparatively low Environmental score in the reduced model. Southern and Eastern Serbia remains the lowest-ranked region (BRIC = 0.456, Z = −1.528), highlighting its consistently limited resilience capacity compared to other regions.
Table 16.
Recalculated BRIC composite index by region: z-score, rank, and resilience categories.
Table 17 presents a standardized overview of regional performance across six resilience dimensions. Belgrade demonstrates above-average Social resilience (Z = 1.031), but significantly underperforms in Environmental resilience (Z = −1.628). Vojvodina shows notable strengths in Institutional (Z = 1.325) and Infrastructural (Z = 1.129) resilience. Šumadija and Western Serbia excel in Economic (Z = 1.419) and Social capital (Z = 0.932), but remain the weakest in Infrastructural resilience (Z = −1.449). Southern and Eastern Serbia have the lowest scores in Economic (Z = −1.269), Social capital (Z = −1.655), and Institutional resilience (Z = −1.493), indicating structural challenges in these areas.
Table 17.
Dimension—specific z-scores (Z) in the recalculated model (computed separately for each dimension).
Table 18 and Figure 6 outline the leading and lagging regions across each resilience dimension, offering a concise categorical overview of performance. Belgrade excels in the Social dimension but falls behind in the Environmental dimension. Vojvodina leads in the Institutional and Infrastructural dimensions, indicating stronger governance and infrastructure. Šumadija and Western Serbia lead in Economic and Social capital dimensions, although infrastructural capacity remains a key challenge. Southern and Eastern Serbia consistently rank as the lagging region in several areas, notably in Economic, Social capital, and Institutional resilience.
Table 18.
Dimension leaders and lagging regions, with categorical interpretation (H/RH/M/RL/Low) based on z-scores.
Figure 6.
(a–f) Spatial distribution of community disaster resilience across regions of Serbia. Regions are classified into five categories (high, relatively high, medium, relatively low, low) based on standardized z-score thresholds calculated separately for the environmental dimension. Color coding: RH (relatively high) = green; M (medium) = yellow; L/Low (low) = brown; RL (relatively low) = red. Enlarged versions of the maps are provided in Appendix B (Figure A1, Figure A2, Figure A3, Figure A4, Figure A5 and Figure A6).
3.6. Comparison with the Original (Pre-Reduction) Results
Table 19 shows how decreases in specific indicators affect regional scores across different dimensions and the overall index. Belgrade experiences significant declines in Economic (−0.192), Social (−0.083), and Social Capital (−0.074), but a slight rise in Environmental (+0.065). Vojvodina registers improvements in Social Capital (+0.053) and Environmental (+0.064), along with a modest overall increase in the BRIC index (+0.019). Šumadija and Western Serbia see gains in Social (+0.089), Economic (+0.109), and Social Capital (+0.091), boosting their composite BRIC (+0.037). Southern and Eastern Serbia improve in multiple areas, including Social (+0.089) and Economic (+0.105), resulting in a total increase of +0.042; however, they remain the lowest-ranked region after the recalculation.
Table 19.
Differences between recalculated and pre-reduction scores (New—Pre-reduction) by dimension and composite BRIC.
Table 20 shows how indicator screening affects the overall regional rankings. Vojvodina rises from second to first place (Up 1), while Šumadija and Western Serbia move from third to second (Up 1). Belgrade falls from first to third (Down 2). Southern and Eastern Serbia remains in fourth position, despite an increase in its overall score, highlighting persistent regional disparities even after methodological adjustments. These changes suggest that removing highly collinear indicators can shift the composite index’s balance toward socio-economic factors and away from institutional and infrastructural elements. Therefore, such shifts should be clearly reported when analyzing regional differences.
Table 20.
Pre-reduction vs. recalculated composite BRIC index and rank changes after indicator reduction.
4. Discussion
This study confirmed that community resilience is a multidimensional, dynamic social process influenced by many interacting factors. By applying and tailoring the BRIC methodology to Serbia’s local context, a predictive resilience model was created that reflects national specifics. Notably, this model is comparable with international studies. Although there is no universal set of indicators, studies vary from using a few to more than 50 indicators, typically grouped into up to six dimensions and adapted to local conditions [56]. This variation supports the premise that each country or region needs a tailored methodological framework considering its society, institutions, and data availability.
This procedure produced a resilience measurement tool that remains comparable with international BRIC applications while capturing locally salient features. Because the original BRIC framework does not fully represent several aspects relevant for Serbia (e.g., geographic–spatial factors, collaboration, and risk analysis), we expanded the indicator set to cover these areas. A similar localization has been used in other adaptations—for example, the Norwegian application introduced culture-specific proxies to reflect context-specific social capital [29]. Overall, this adaptability—localizing indicators while preserving methodological consistency—remains a key strength of the BRIC approach. The adapted method examined six dimensions with 57 indicators relevant to disaster resilience in Serbia. It offered comprehensive insights into regional differences in resilience and highlighted significant disparities across the country. The Belgrade Region scores highest in the socio-economic dimension, due to its concentration of resources and development level; however, it ranks lowest in the environmental dimension, with issues such as higher pollution and greater exposure to urban risks. Conversely, Southern and Eastern Serbia lag in nearly all areas, from economic measures to infrastructural capacity, and are classified as relatively low in resilience. The overall resilience index for Serbia is 0.497, indicating a medium level of resilience. Behind this average, notable differences exist: Belgrade (BRIC ≈ 0.557) approaches higher resilience, Vojvodina and Šumadija/Western Serbia are near the national average, while Southern/Eastern Serbia has about 0.414, indicating low resilience.
These findings align with patterns seen in other countries with internal regional disparities. For instance, resilience research in Italy shows that the more economically developed northern regions have much higher resilience index results than the southern areas [68]. Similarly, in Germany, urbanized regions exhibit greater resilience, while the less developed northeastern communities tend to be more vulnerable [69]. Even in Scandinavian nations like Norway, BRIC adaptation studies reveal that major urban centers generally have the highest resilience levels [29]. Regions with stronger economies and infrastructure—often capitals or more developed areas—tend to be more resilient. Conversely, rural or less developed areas are more susceptible to disasters, including Serbia.
It is crucial to note that urban settings do not automatically guarantee resilience; rather, they are often associated with certain resources. Our component analysis within the model showed that structural factors—such as socio-economic status and institutional capacities—are the most influential in shaping resilience. This aligns with findings from other regions: in urban areas, economic capital primarily drives resilience, whereas in rural areas, social capital—such as community cohesion and self-organization—takes precedence [26]. This suggests that resilience strategies should be tailored to context; a one-size-fits-all approach is ineffective, as our Serbian regional analysis shows.
Applying the BRIC index to Serbia enabled the detailed identification of each region’s strengths and weaknesses. For example, Belgrade excels in human resources, economic performance, and access to services, but faces environmental risks, including air pollution and urban flooding. Vojvodina has a strong infrastructure and institutional network, but less dynamic socio-economic activity than the capital. Šumadija and Western Serbia perform well environmentally, with lower pressures and better quality outside urban centers, but lag economically. Southern and Eastern Serbia consistently underperform, with weaker economies, demographic decline, and fragile institutions, leading to lower community resilience. These insights highlight that policies should be region-specific [70,71]. More developed areas also have vulnerabilities, especially environmental issues in urban centers. Targeted interventions are supported by Western European studies showing clear spatial patterns of resilience; policymakers should focus on the weakest points [72]. The index created provides evidence-based data to pinpoint these priorities in Serbia, making a key practical contribution.
A particularly important step in the model’s development was the analysis of indicator correlations. It revealed strong interrelationships among certain measures—especially within the social and economic dimensions—indicating that some variables in practice capture similar phenomena. On this basis, 14 indicators were eliminated as statistically redundant. This procedure increased the index’s robustness without losing substantive content. In the literature, factor analysis is sometimes proposed to reduce dimensionality; however, we concur with the views of some authors that this approach may be counterproductive in resilience research [44,63,73]. Excessive simplification can hinder interpretation and obscure important details. Our exploratory factor analysis produced expected groupings, but we retained the original categories to preserve analytical breadth. BRIC’s key advantage is the transparency and interpretability of indicator contributions, which support decision-making. Comparative evidence from England similarly highlights its intuitiveness despite differences observed under alternative weighting schemes [56]. The recalculated results after indicator reduction confirm the presence of pronounced regional disparities and show that the relative “resilience picture” changes when redundant measures are removed. At the dimension level (Table 16), the Belgrade Region retains the highest score in the Social dimension (M = 0.615). Still, it remains the lowest in the Environmental dimension (M = 0.293), highlighting an environmental deficit in the major urban center despite strong socio-economic resources. Vojvodina stands out with the highest Institutional (M = 0.654) and Infrastructural capacities (M = 0.586), whereas Šumadija and Western Serbia achieve the best results in the Economic dimension (M = 0.545) and Social capital (M = 0.621). Southern and Eastern Serbia continues to lag across several dimensions, particularly Institutional (M = 0.328) and Social capital (M = 0.392), indicating more persistent structural development and governance challenges.
At the level of the composite index and regional ranking, a reduction in indicators causes a reshuffling: Vojvodina emerges as the most resilient region (BRIC = 0.530; Z = 1.022; indicating relatively high resilience), followed closely by Šumadija and Western Serbia (BRIC = 0.522; Z = 0.750; also showing relatively high resilience). Meanwhile, Belgrade moves into the medium-resilience category (BRIC = 0.493; Z = −0.244), mainly because its Environmental dimension is significantly below average (Z = −1.628; see Table 18). Southern and Eastern Serbia remains the lowest-ranked region (BRIC = 0.456; Z = −1.528), exhibiting low resilience, highlighting that these gaps reflect not only methodological differences but also actual deficiencies in key capacities. The standardized, dimension-specific overview (Table 18 and Table 19) also reveals that Vojvodina excels in Institutional (Z = 1.325) and Infrastructural resilience (Z = 1.129). Šumadija and Western Serbia lead in Economic (Z = 1.419) and Social capital (Z = 0.932). Meanwhile, Belgrade is strong in Social resilience (Z = 1.031) but underperforms in Environmental resilience (Z = −1.628).
A comparison with the original (pre-reduction) results (Table 20) shows that removing highly collinear indicators shifts the main focus of resilience explanations and influences regional rankings. Belgrade experiences a combined decrease of −0.064, dropping from 1st to 3rd place (down 2), while Vojvodina increases by +0.019, moving into 1st place (up 1). Šumadija and Western Serbia rise by 0.037 to 2nd place (up 1). Southern and Eastern Serbia improve by 0.042 but stay 4th, highlighting persistent structural differences. These changes demonstrate that removing redundant indicators can alter the balance between socio-economic factors and institutional–infrastructural capacities in the composite index. Thus, transparent reporting of the methods and their effects is crucial for accurately understanding regional disparities.
The application of the adapted BRIC index in Serbia confirmed the practical value of this tool for measuring and comparing resilience. It provides quantitative indicators to develop local “resilience maps.” Based on these outputs, local and national authorities can identify where critical deficits exist. Such an application was proposed in the United Kingdom as a basis for steering a regional rebalancing fund to ensure a fairer allocation of resources in line with identified needs [74]. In this study, the computed values similarly indicate where investments can have the largest multiplicative effect on resilience—whether in infrastructure, workforce training, strengthening emergency services, or programs that empower citizens economically. In addition, the adapted index enables longitudinal monitoring, making it possible to evaluate resilience dynamics—whether implemented measures produce results and to what extent.
The comparison between the pre-reduction BRIC specification and its reduced version for Serbia shows that the main narrative of significant regional disparities remains consistent. However, the focus of explanation and regional rankings shifts after removing redundant indicators via Pearson correlation screening. Methodologically, the adapted index is “cleaner”: by omitting highly collinear measures, it reduces multicollinearity and avoids double-counting related socio-economic factors such as education, urbanization, employment, and connectivity, resulting in a clearer composite signal. This refinement also alters what the index emphasizes. Initially, resilience was more influenced by urban socio-economic development, favoring the capital region. Now, institutional–infrastructural capacity and environmental conditions stand out more as separate factors, changing the regional rankings while maintaining the overall gradient from more to less resilient areas.
From a policy standpoint, the findings indicate that economic growth alone cannot ensure resilience in Serbia; interventions should be region-specific and aligned with the key constraints identified across dimensions. Vojvodina should consolidate risk-informed governance through stronger multi-hazard planning, infrastructure maintenance, upgraded emergency services, and integrated land-use with flood and fire risk management. In Belgrade, high socio-economic capacity does not translate into balanced resilience, underscoring the need to reduce environmental and urban stressors (e.g., urban flooding, air quality, heat risk, and greener planning) as a priority. For Šumadija and Western Serbia, priorities include closing infrastructure and service gaps (transport, housing, utilities, health care, shelter capacity) and improving response logistics, particularly in dispersed settlements. Southern and Eastern Serbia remain the most vulnerable regions, even after removing redundancies, highlighting structural development issues rather than measurement errors. Resilience policies in these areas should focus on equity and investment: improving basic infrastructure such as water, electricity, roads, and health care; enhancing local institutions and emergency staffing; and supporting livelihoods and job diversification to lower long-term socio-economic vulnerabilities that can worsen disaster impacts. The updated BRIC framework offers a clearer basis for “policy mapping” across all regions by minimizing indicator overlap and pinpointing the key drivers—social, economic, institutional, infrastructural, social capital, or environmental—that shape regional resilience. This approach helps set investment priorities, track progress, and design comparable, nationally relevant interventions to address Serbia’s territorial disparities.
Naturally, several limitations should be acknowledged. The index estimates are valid only within Serbia’s specific spatial, socio-economic, and institutional setting. Direct generalization to other countries is not possible without renewed indicator localization and methodological adjustment. The analysis is performed at the regional level to enhance comparability across nations, but this can conceal variations within regions, such as informal settlements in flood-prone areas, localized heat islands, or uneven access to essential services. Consequently, the index should be viewed as a regional baseline diagnostic rather than a detailed local vulnerability assessment. Additionally, since the design is cross-sectional, it does not account for resilience trends over time or the causal impacts of policy measures. Future work could involve recalculating the framework at smaller scales, like municipal or neighborhood levels, and updating it longitudinally to monitor changes over time and assess the effects of interventions. Cross-national comparisons may still serve as useful benchmarks, but each national context would require its own tailored “calibration” of the method. This should not be interpreted as a weakness of the approach; rather, it reflects the reality that every society has a distinctive risk profile and capacity structure, and resilience assessment frameworks must therefore remain flexible and context-sensitive. A significant limitation of the proposed index is that it primarily measures resilience as baseline (pre-event) capacity, using indicators that are consistently available at the national level. As a result, it does not directly assess dynamic adaptive capacity—such as institutional learning, resource flexibility, cross-sector coordination, or real-time collective efficacy—which can be crucial during climate change-induced non-linear shocks. Therefore, the index should be viewed as a baseline tool for benchmarking and prioritization, and ideally, complemented by process-based and scenario-specific measures in future research. Besides that, several key aspects of adaptive capacity—such as institutional learning and memory, resource flexibility, social trust, collective efficacy, and cross-sector coordination—are not fully represented in the current indicator set. This is mainly due to the lack of standardized, comparable measures available at the national level. These capacities are especially critical in ‘disorderly’ climate adaptation contexts. They are best explored through complementary methods such as targeted surveys, governance network assessments, after-action reviews, and qualitative evaluations, which can be incorporated into the baseline index in future work.
Furthermore, our experience assembling the Serbian dataset highlights a persistent challenge: missing data and insufficiently granular local-level statistics. Several potentially relevant indicators had to be excluded because reliable sources or up-to-date time series were unavailable. This is a common constraint in constructing composite indices, and previous research similarly emphasizes that data collection and harmonization at finer spatial scales are resource-intensive and methodologically demanding, with uneven data quality across domains [75,76,77,78]. Consequently, the present results should be interpreted as the best attainable approximation of current conditions given available evidence, while recognizing that improved local statistics and more consistent longitudinal monitoring would enable more precise measurement and stronger inference in future applications. Also, adaptation to climate change increasingly involves complex events, such as heatwaves coinciding with power shortages or floods, that affect interconnected systems. Since BRIC-style indices are designed as hazard-agnostic baseline measures, they do not represent scenario-specific performance models. They cannot independently ‘stress-test’ capacities for particular return periods, such as 1-in-100-year floods, or climate-driven extremes. An effective advancement of this framework is to implement a two-tier system: first, the baseline BRIC–DROP capacity index presented here, and second, scenario-based stress tests that connect baseline capacities with hazard pathways, including multi-hazard matrices, infrastructure fragility curves, redundancy assessments, and cascade mappings across energy, transport, and health sectors. This integrated approach would allow for assessment of non-linear disruption pathways while maintaining the transparency and comparability of the baseline index.
5. Conclusions
The BRIC method’s theoretical foundation within the DROP framework, along with the careful selection and validation of indicators and the thorough analysis of local communities in Serbia, facilitated the creation of a predictive model for disaster resilience. This model is directly applicable in the Serbian context and methodologically comparable to international studies. Since there is no single universal approach to measuring resilience—due to variations in risk profiles, capacities, institutional setups, and data availability across territories—this study explored resilience dimensions and indicator categories both separately and interactively. The resulting framework captures not only an overall “level of resilience” but also the determinants that influence, shape, or limit resilience outcomes across different locations. The goal was not only to confirm the association between indicators and resilience but also to clarify the nature, direction, and significance of these relationships based on empirical evidence. A key methodological innovation is the application of Pearson correlation screening to identify and remove highly redundant indicators, especially within social and economic dimensions. From this process, 14 redundant indicators were discarded, resulting in a refined Serbian indicator set of 57 across six dimensions. All indicators were normalized to a 0–1 scale through min–max transformation, with negatively oriented indicators inverted (X_adj = 1 − X_norm) so that higher values uniformly indicated greater resilience. Dimension scores were calculated as the average of retained indicators, and the overall BRIC index was derived as an equal-weighted mean of the six dimensions. This approach minimizes multicollinearity and double-counting of related phenomena, enhances the transparency of the composite index, and provides a more stable basis for interpretation, while preserving core information through meaningful retained indicators. Hence, the model maintains international comparability while being adaptable and sensitive to Serbia’s specific context—an essential feature for modern BRIC adaptations.
The revised results after indicator reduction confirm notable regional disparities and show that the “resilience picture” shifts once redundant measures are eliminated. From a policy perspective, the findings clearly indicate that resilience strengthening in Serbia cannot follow a “one-size-fits-all” approach; rather, regionally differentiated interventions are required. In Southern and Eastern Serbia, key priorities include upgrading basic infrastructure, enhancing institutional capacity and emergency management, and encouraging local economic growth to reduce long-term vulnerability and bridge the resilience gap. In Belgrade, efforts should specifically focus on environmental and urban stressors, such as air pollution, urban flooding, and heat risks, to ensure that environmental issues do not undermine socio-economic strengths. Vojvodina, where institutional and infrastructural capacities are strongest in the reduced model, should focus on consolidating these improvements through risk-informed governance, multi-hazard planning, infrastructure maintenance, and integrating land-use with flood and fire risk strategies. In Šumadija and Western Serbia, policies should leverage economic and social advantages while improving infrastructural resilience and service access, especially in dispersed settlements and for response logistics.
Overall, the predictive model and the revised indicator set enhance the evidence base on disaster resilience in Serbia, transforming it from a theoretical idea into a transparent, measurable, and comparable framework. This enables the creation of resilience maps, the identification of critical gaps, the prioritization of investments, and the monitoring of changes over time. The shifts in rankings after reducing the number of indicators underscore the sensitivity of composite indices to their structure and selection, underscoring the importance of methodological transparency for accurate interpretation and policymaking. Future efforts should expand the model to smaller administrative units, such as municipalities and cities, and incorporate repeated measurements over time to monitor resilience dynamics and assess the effectiveness of interventions within Serbia’s integrated disaster risk management system. This study contributes in several ways: by offering a localized BRIC–DROP operationalization suitable for standardized baseline benchmarking; by developing an empirically grounded regional resilience profile to aid prioritization and targeted planning; and by providing a transparent workflow for index construction that can be adapted to other contexts. Future research should integrate baseline capacity indices with scenario-based stress testing across multiple extreme conditions, include process-oriented measures of dynamic adaptive capacity, and expand the assessment to more refined spatial scales and longitudinal studies.
The framework can be shared as a replicable methodological pipeline that includes dimension structure, normalization, aggregation, and reporting logic. However, the specific indicator set and operational definitions should be tailored to local governance structures, hazard scenarios, and data availability. To apply this approach in other countries, one should (i) align candidate indicators with the same conceptual dimensions, (ii) evaluate data comparability and coverage, (iii) test how sensitive the results are to different weighting and reduction methods, and (iv) validate the index against relevant outcomes and stakeholder expectations.
Author Contributions
Conceptualization, D.M. and V.M.C.; Methodology, D.M. and V.M.C.; Software, D.M.; Validation, V.M.C. and D.M.; Formal Analysis, D.M.; Investigation, D.M. and V.M.C.; Resources, D.M. and V.M.C.; Data Curation, D.M. and V.M.C.; Writing—Original Draft Preparation, D.M. and V.M.C.; Writing—Review and Editing, V.M.C. and T.L.; Visualization, D.M.; Supervision, V.M.C.; Project Administration, V.M.C.; Funding Acquisition, V.M.C., D.M. and T.L. All authors have read and agreed to the published version of the manuscript.
Funding
This research was funded by the Scientific–Professional Society for Disaster Risk Management, Belgrade (https://upravljanje-rizicima.com/, accessed on 10 January 2026), International Institute for Disaster Research (https://idr.edu.rs/, accessed on 10 January 2026), Belgrade, Serbia, and ProSafeNet—The Global Hub for Safety, Security, Risk & Emergency Professionals & Scientists (https://prosafenet.com/, accessed on 10 January 2026).
Institutional Review Board Statement
The study was conducted in accordance with the Declaration of Helsinki and was approved by the Institutional Review Board of the Scientific–Professional Society for Disaster Risk Management and the International Institute for Disaster Research (protocol code 003/2025, 15 July 2025).
Informed Consent Statement
Informed consent was obtained from all subjects involved in the study.
Data Availability Statement
Data are contained within the article.
Acknowledgments
This study was supported by the Scientific-Professional Society for Disaster Risk Management and ProSafeNet—The Global Hub for Safety, Security, Risk & Emergency Professionals and Scientists (https://prosafenet.com/). The authors acknowledge the use of Grammarly Premium (v1.2.242.1855) and ChatGPT 5.2 to improve the English in this manuscript. The AI tools were used to assist with language enhancement but were not involved in developing the scientific content. The authors take full responsibility for the originality, validity, and integrity of the manuscript.
Conflicts of Interest
The authors declare no conflicts of interest.
Appendix A. Enlarged Maps of Community Disaster Resilience Dimensions
Table A1.
Values of the observed indicators by region.
Table A2.
Min–max normalization of data within the observed sets.
Appendix B. Enlarged Maps of Community Disaster Resilience Dimensions
Figure A1.
Spatial distribution of the social dimension of community disaster resilience across regions of Serbia. Regions are classified into five categories (high, relatively high, medium, relatively low, low). Color coding: RH (relatively high) = green; M (medium) = yellow; L/Low (low) = brown; RL (rela-tively low) = red.
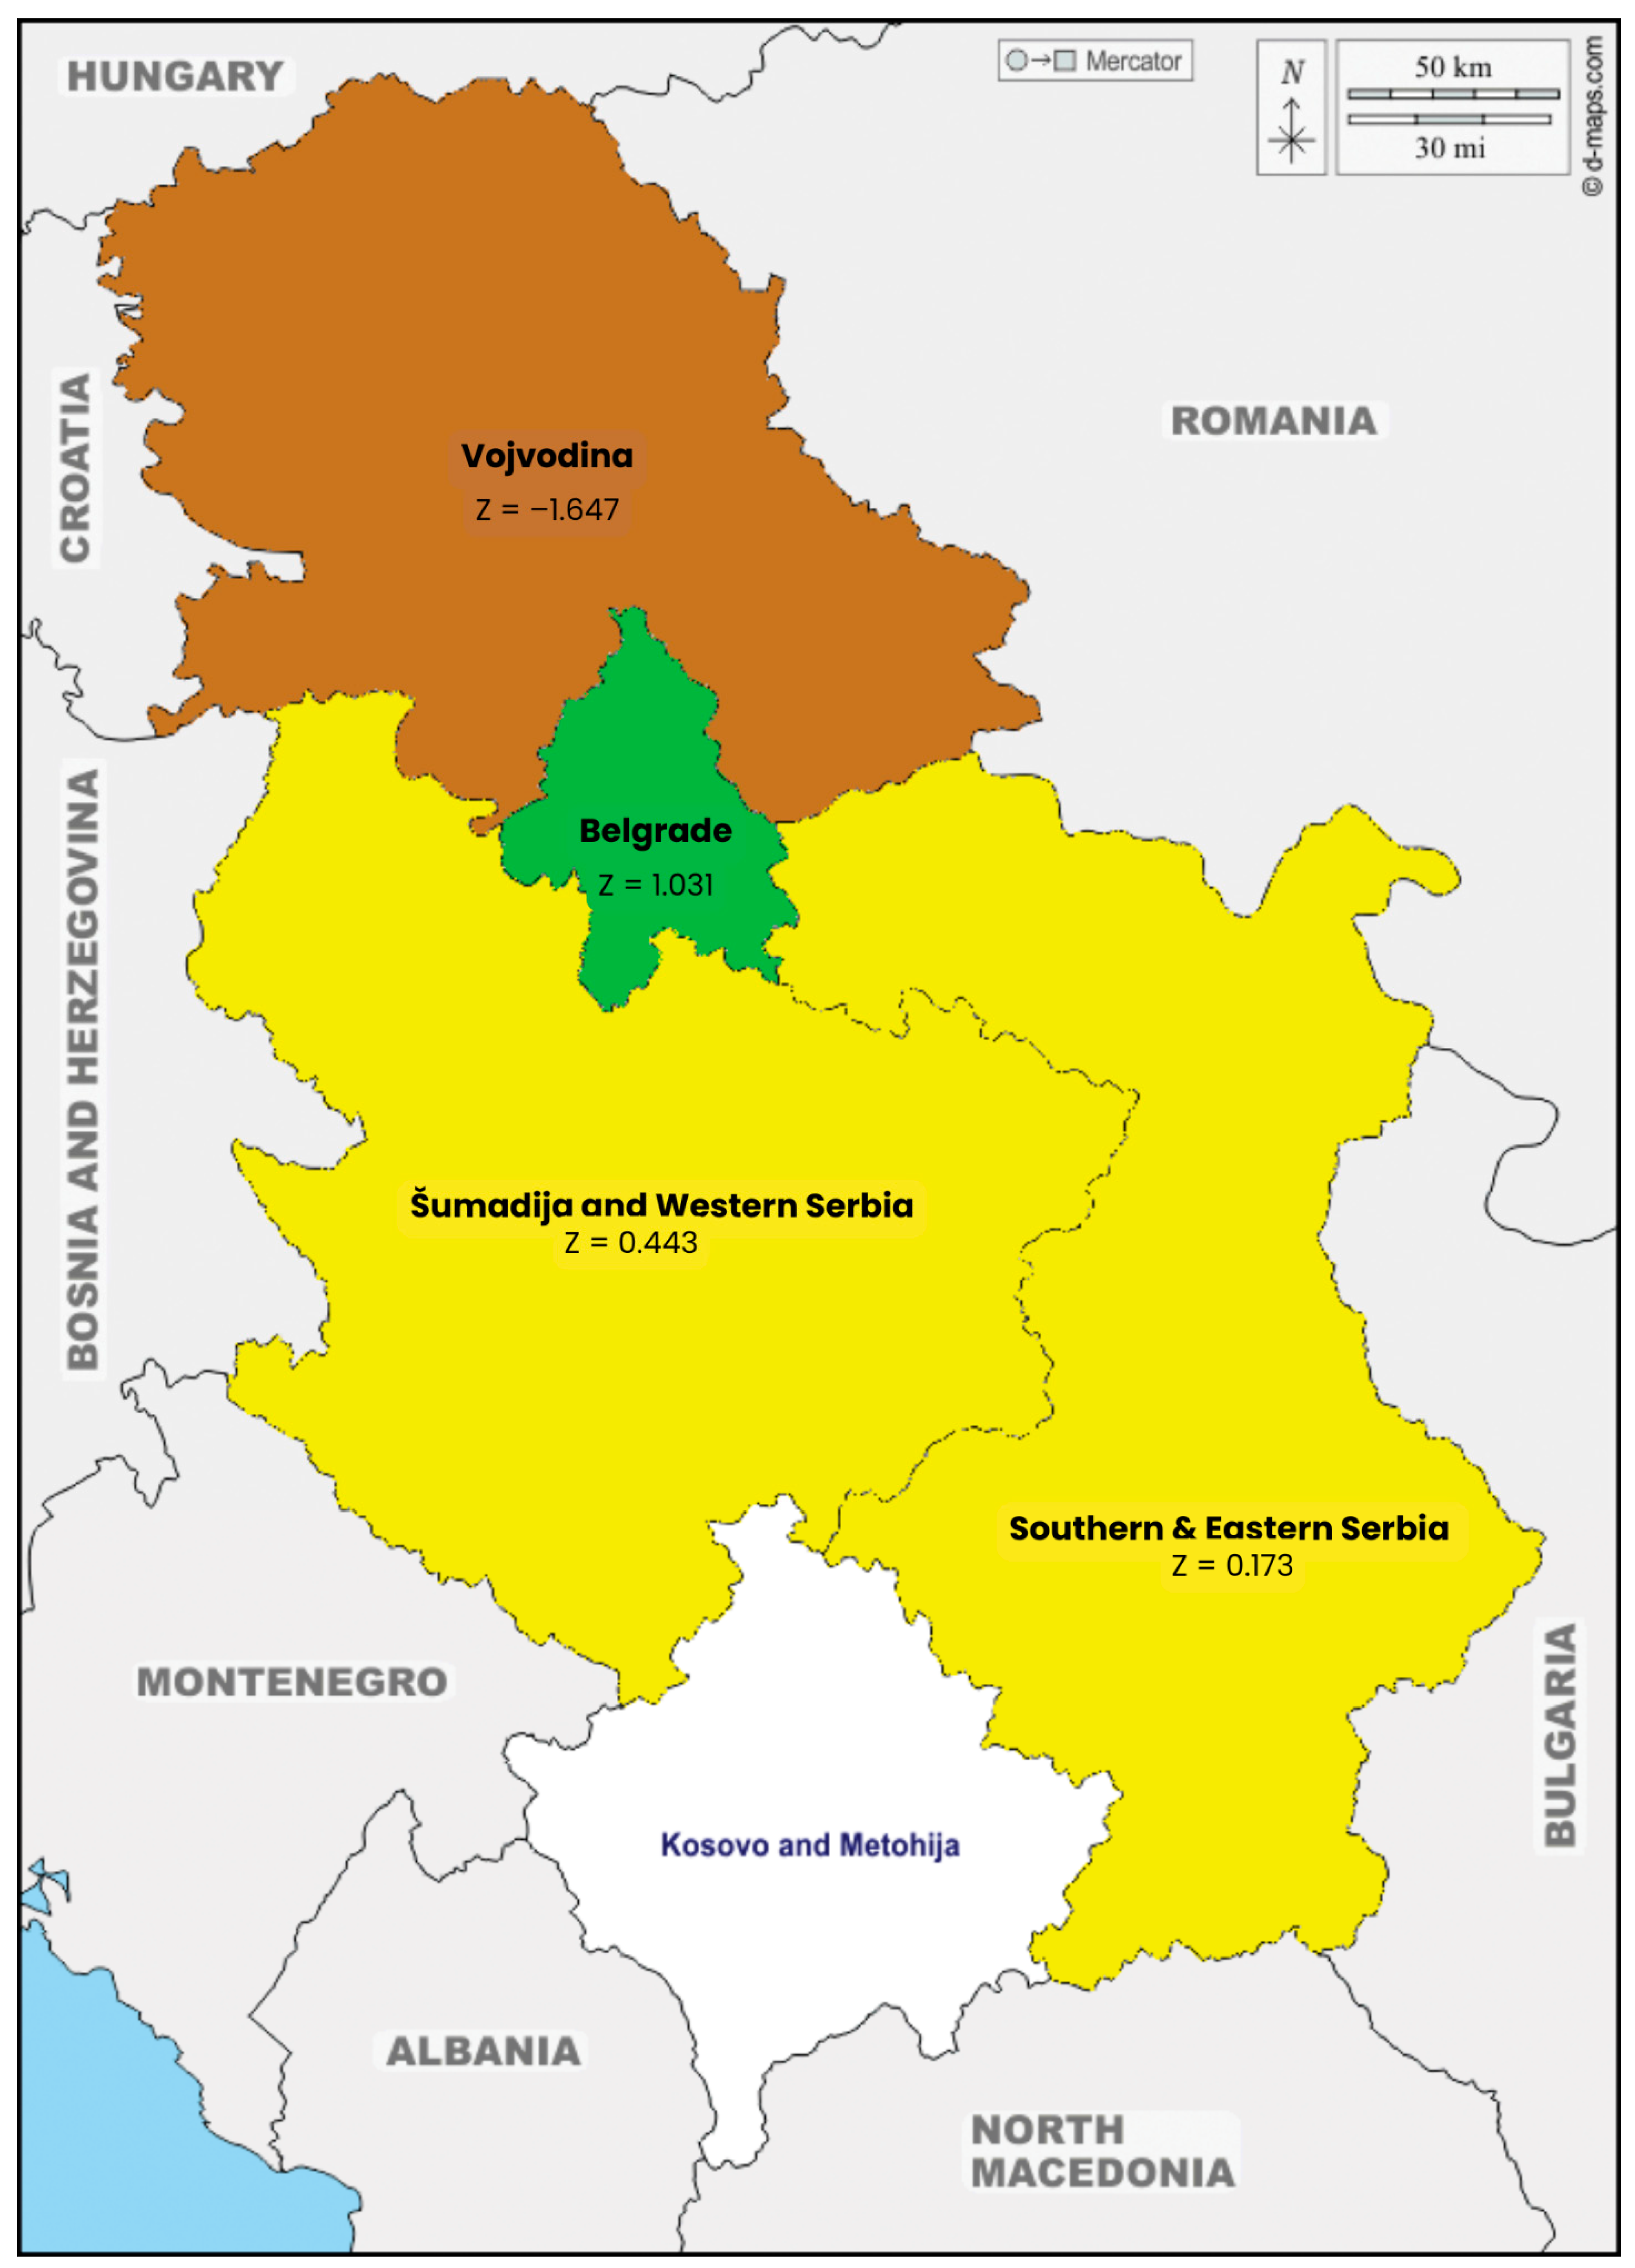
Figure A2.
Spatial distribution of the economic dimension of community disaster resilience across regions of Serbia. Regions are classified into five categories (high, relatively high, medium, relatively low, low). Color coding: RH (relatively high) = green; M (medium) = yellow; L/Low (low) = brown; RL (rela-tively low) = red.
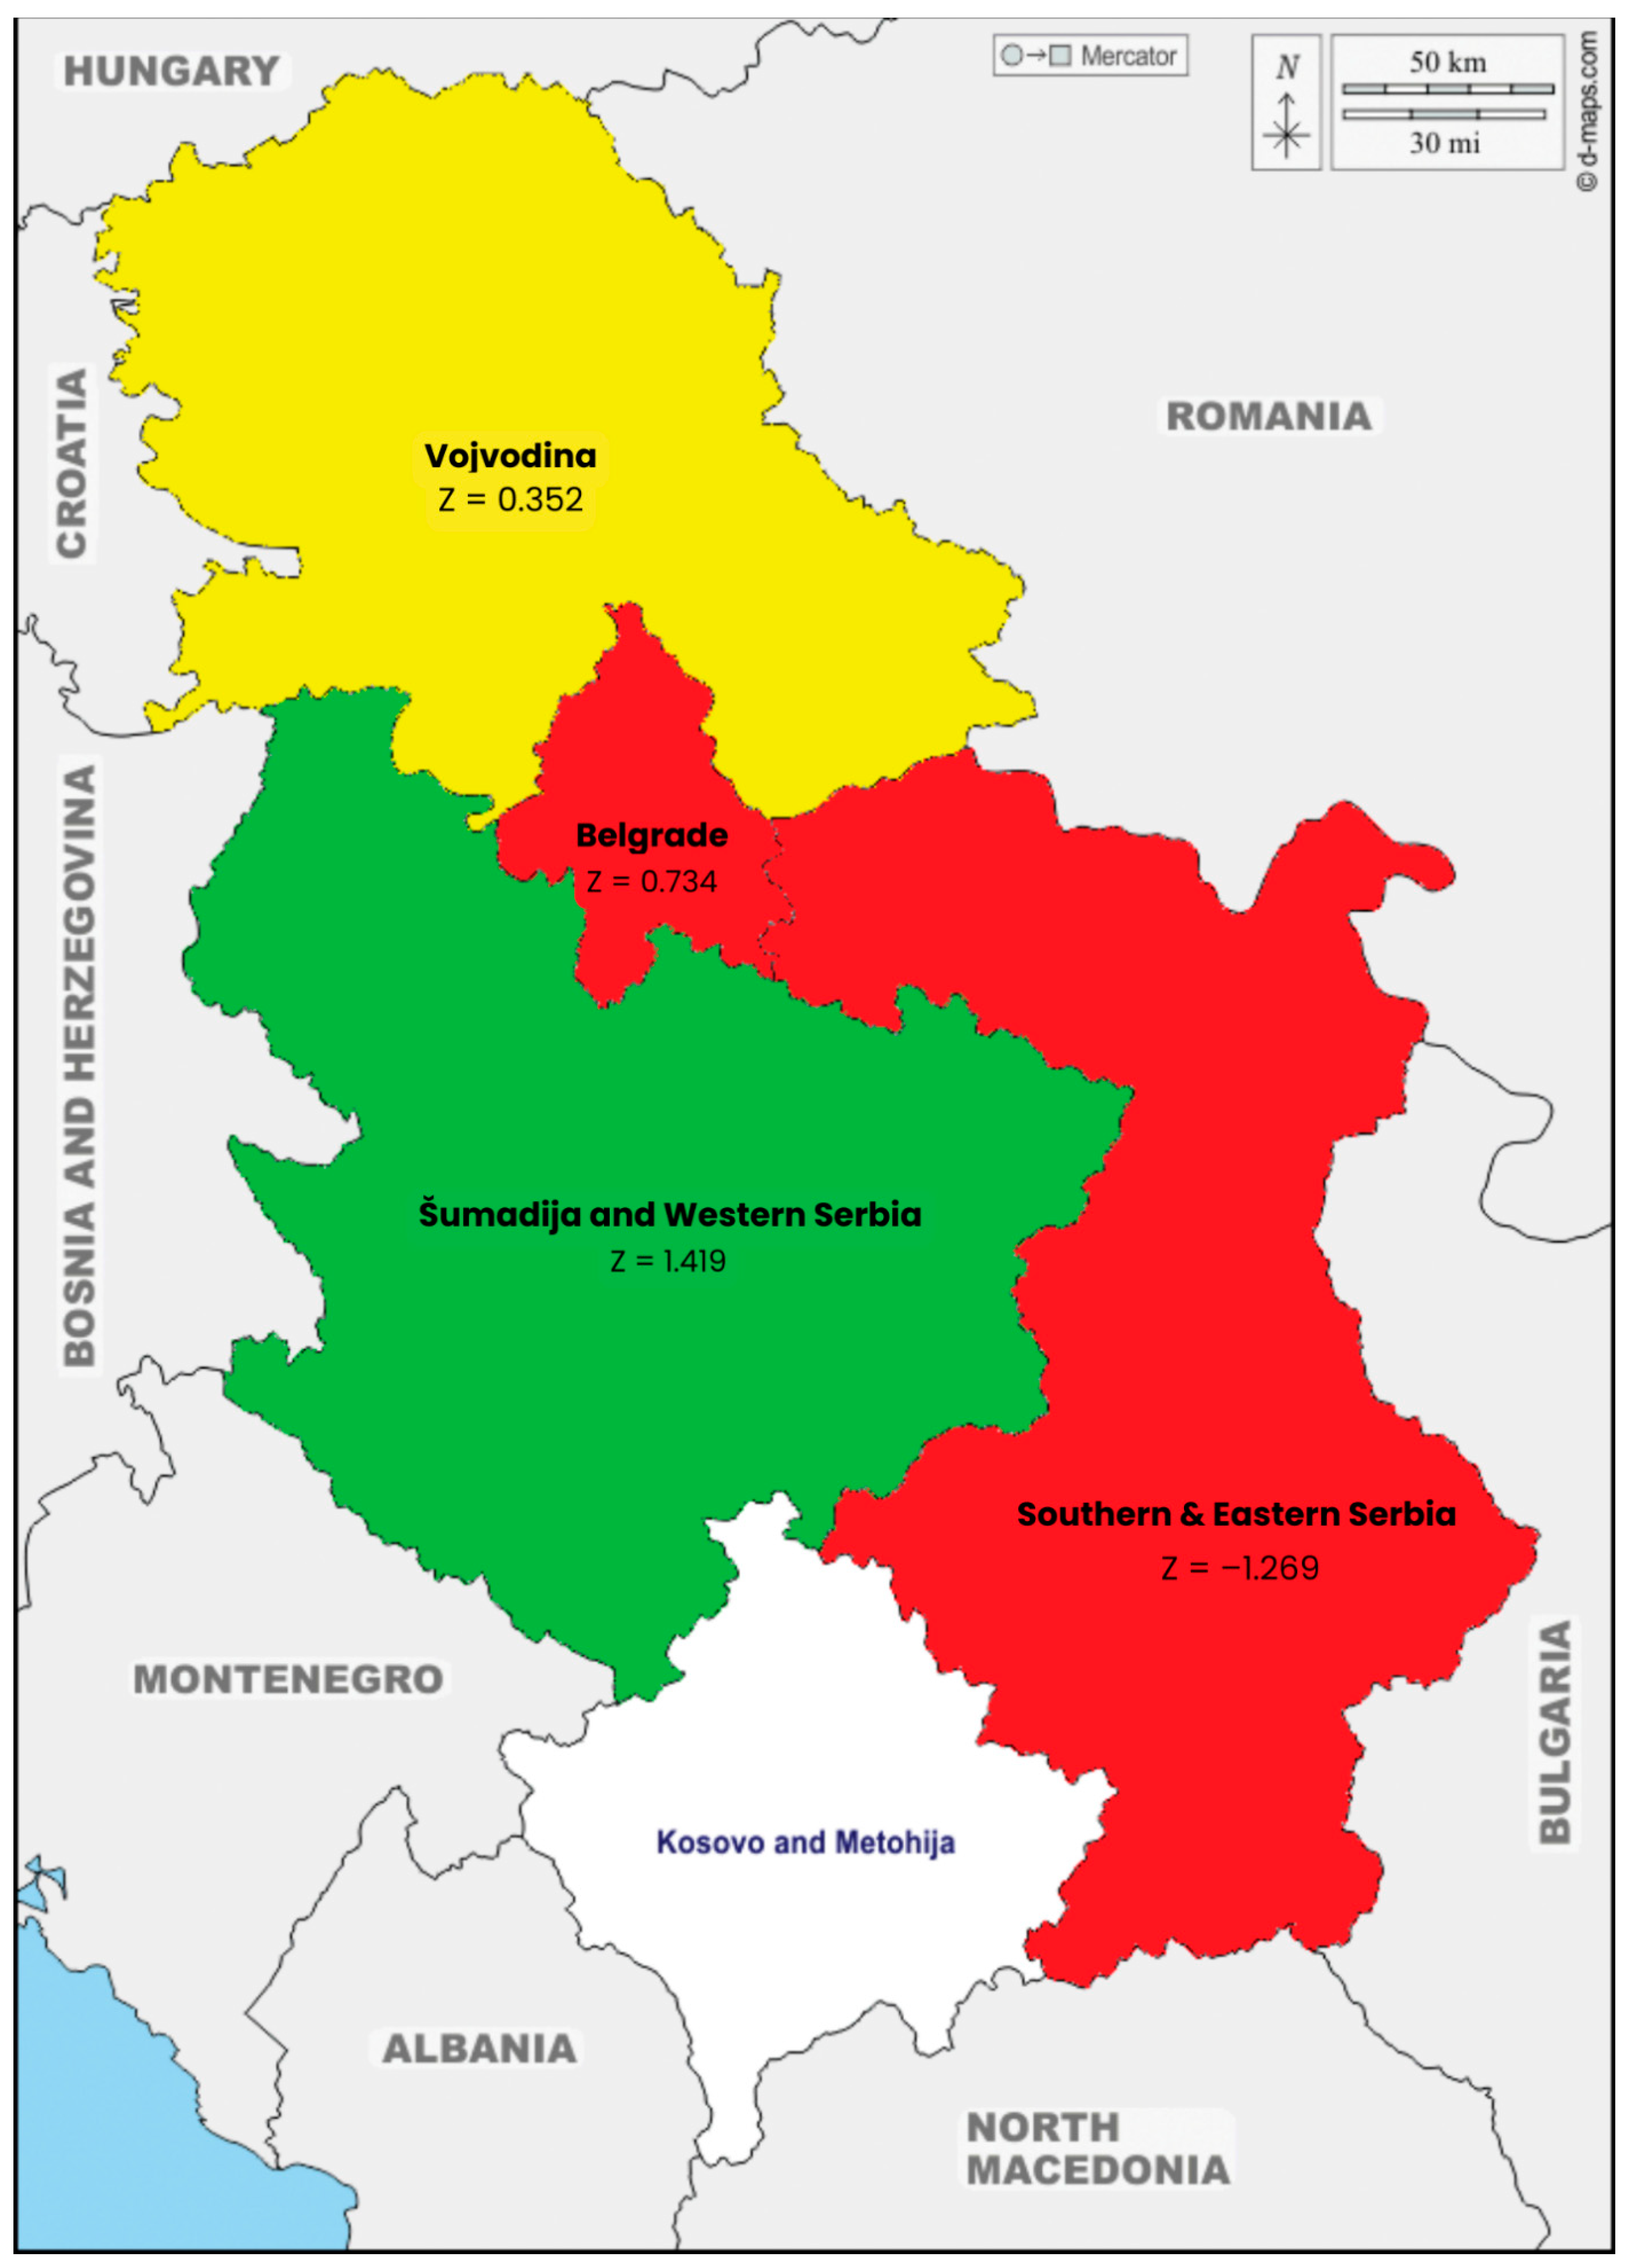
Figure A3.
Spatial distribution of the social capital dimension of community disaster resilience across regions of Serbia. Regions are classified into five categories (high, relatively high, medium, relatively low, low). Color coding: RH (relatively high) = green; M (medium) = yellow; L/Low (low) = brown; RL (relatively low) = red.
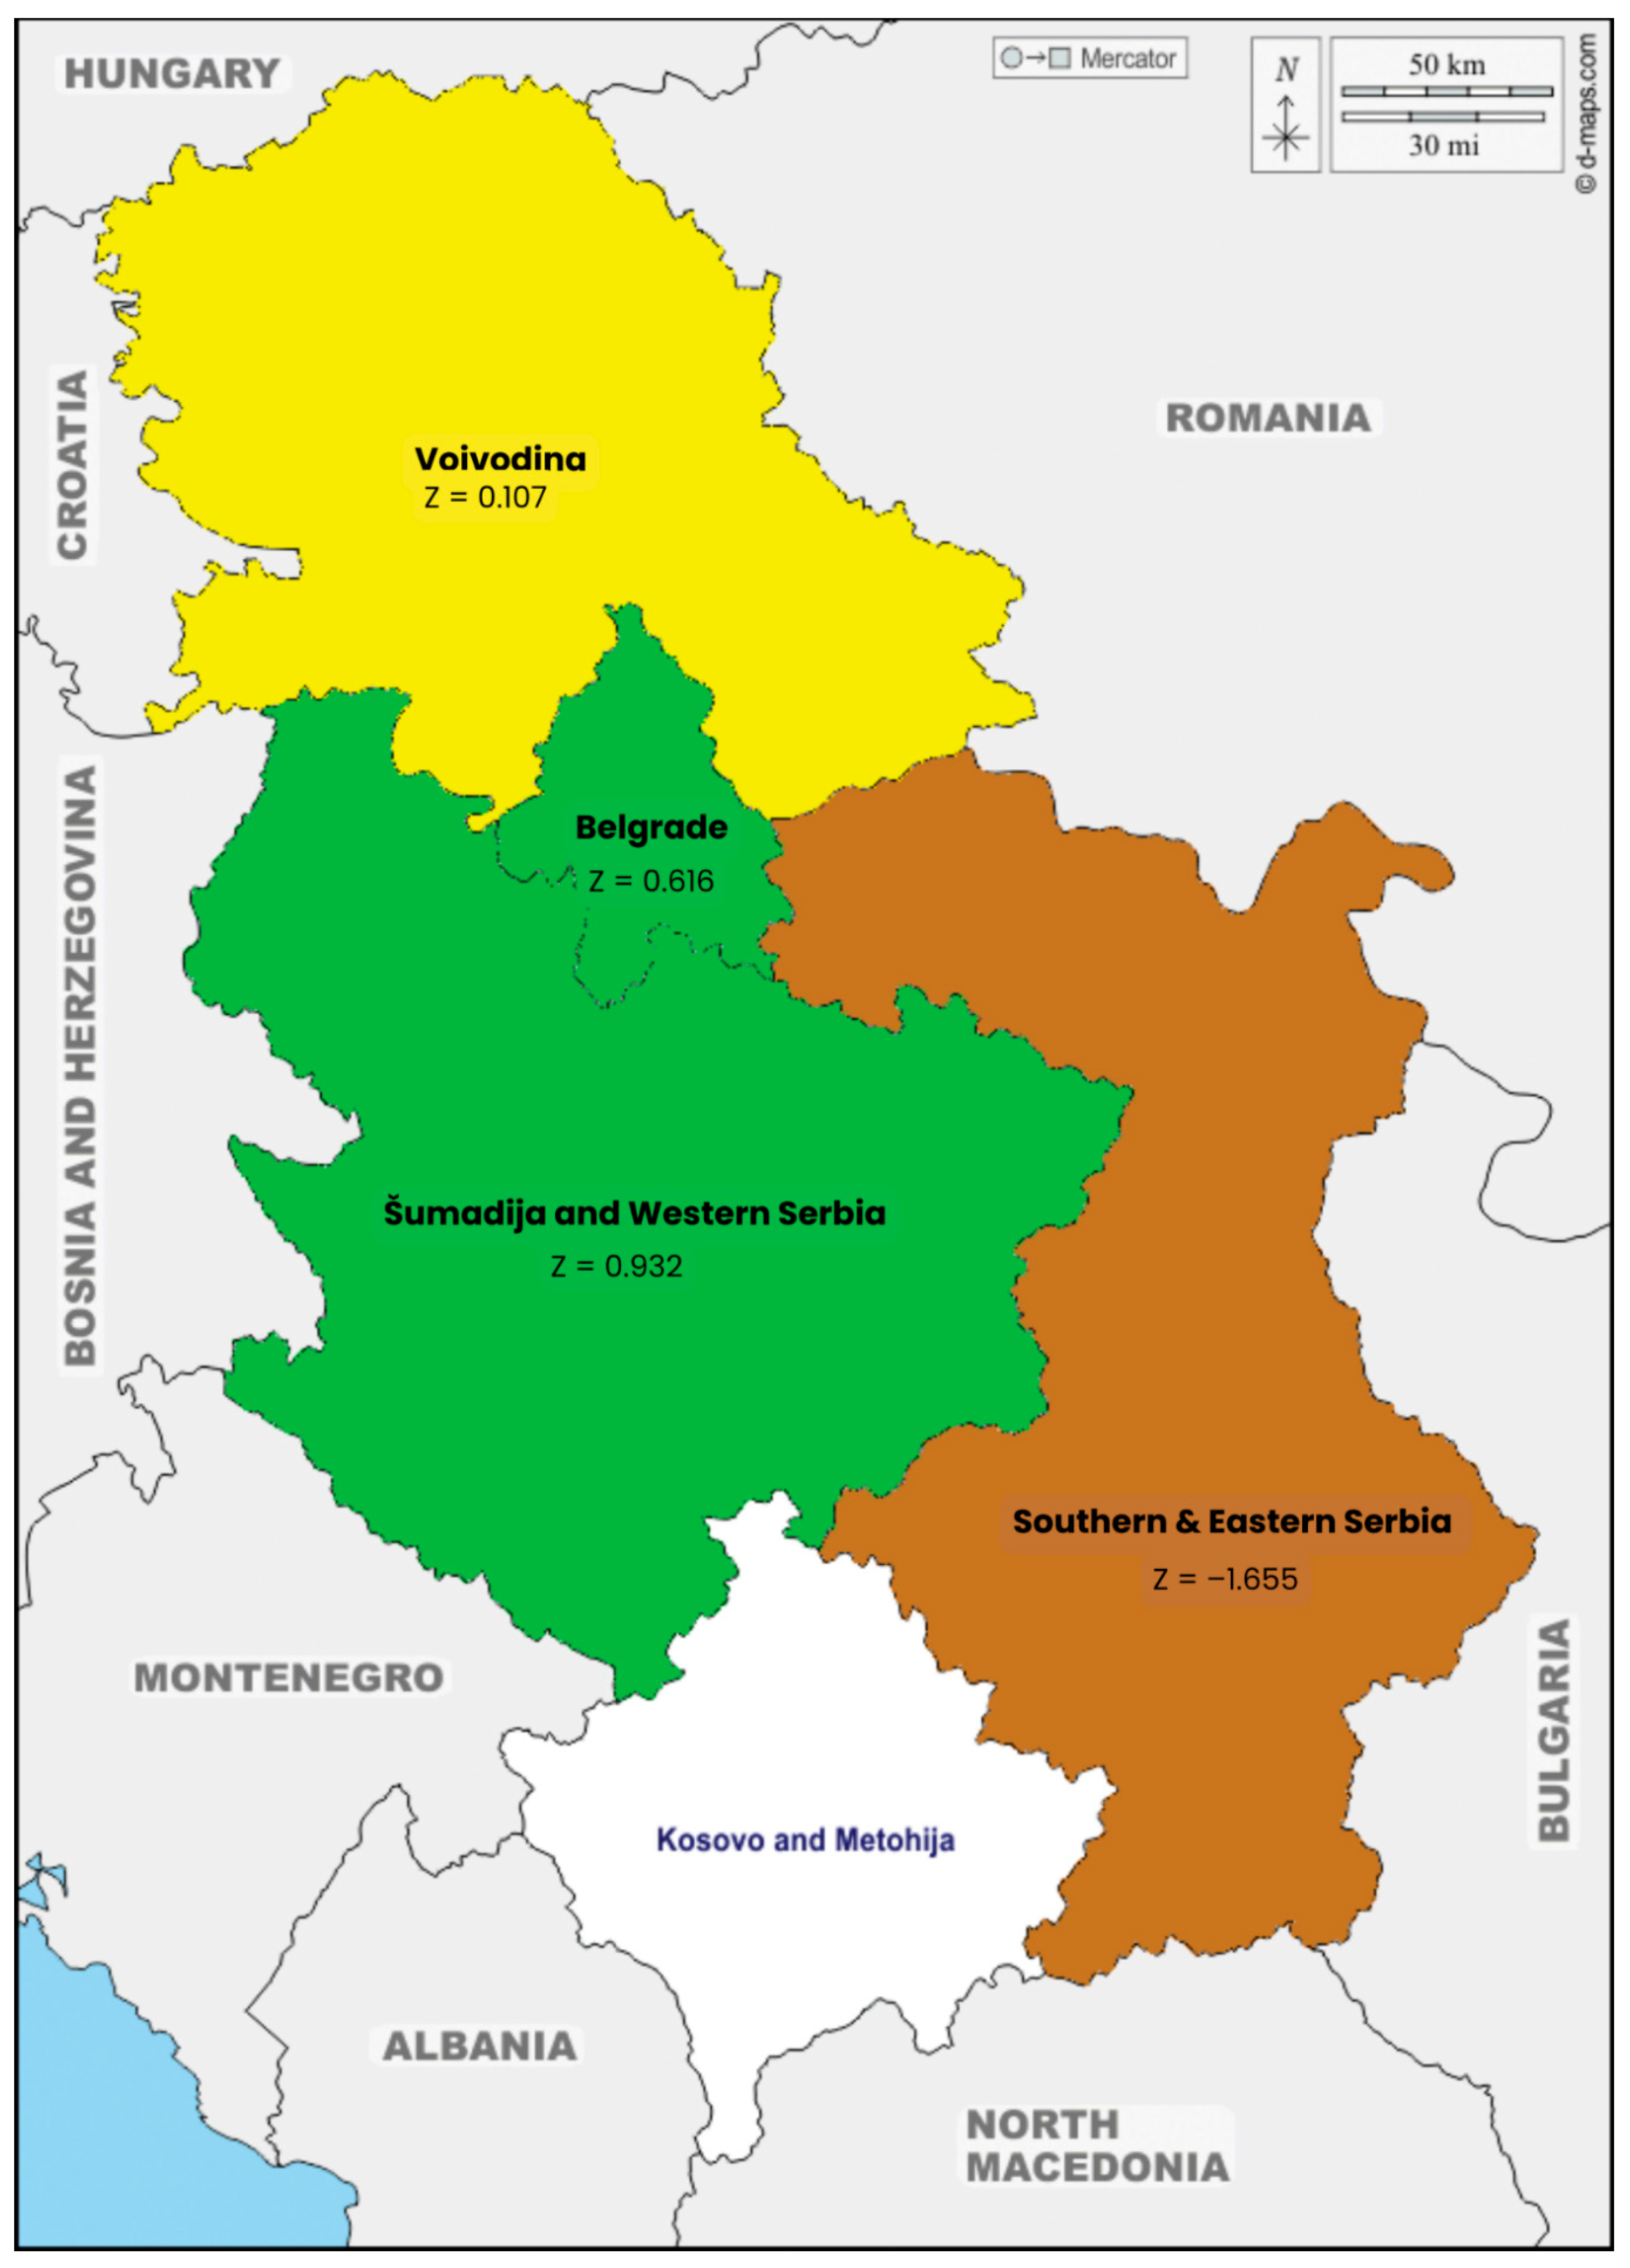
Figure A4.
Spatial distribution of the institutional dimension of community disaster resilience across regions of Serbia. Regions are classified into five categories (high, relatively high, medium, relatively low, low). Color coding: RH (relatively high) = green; M (medium) = yellow; L/Low (low) = brown; RL (relatively low) = red.
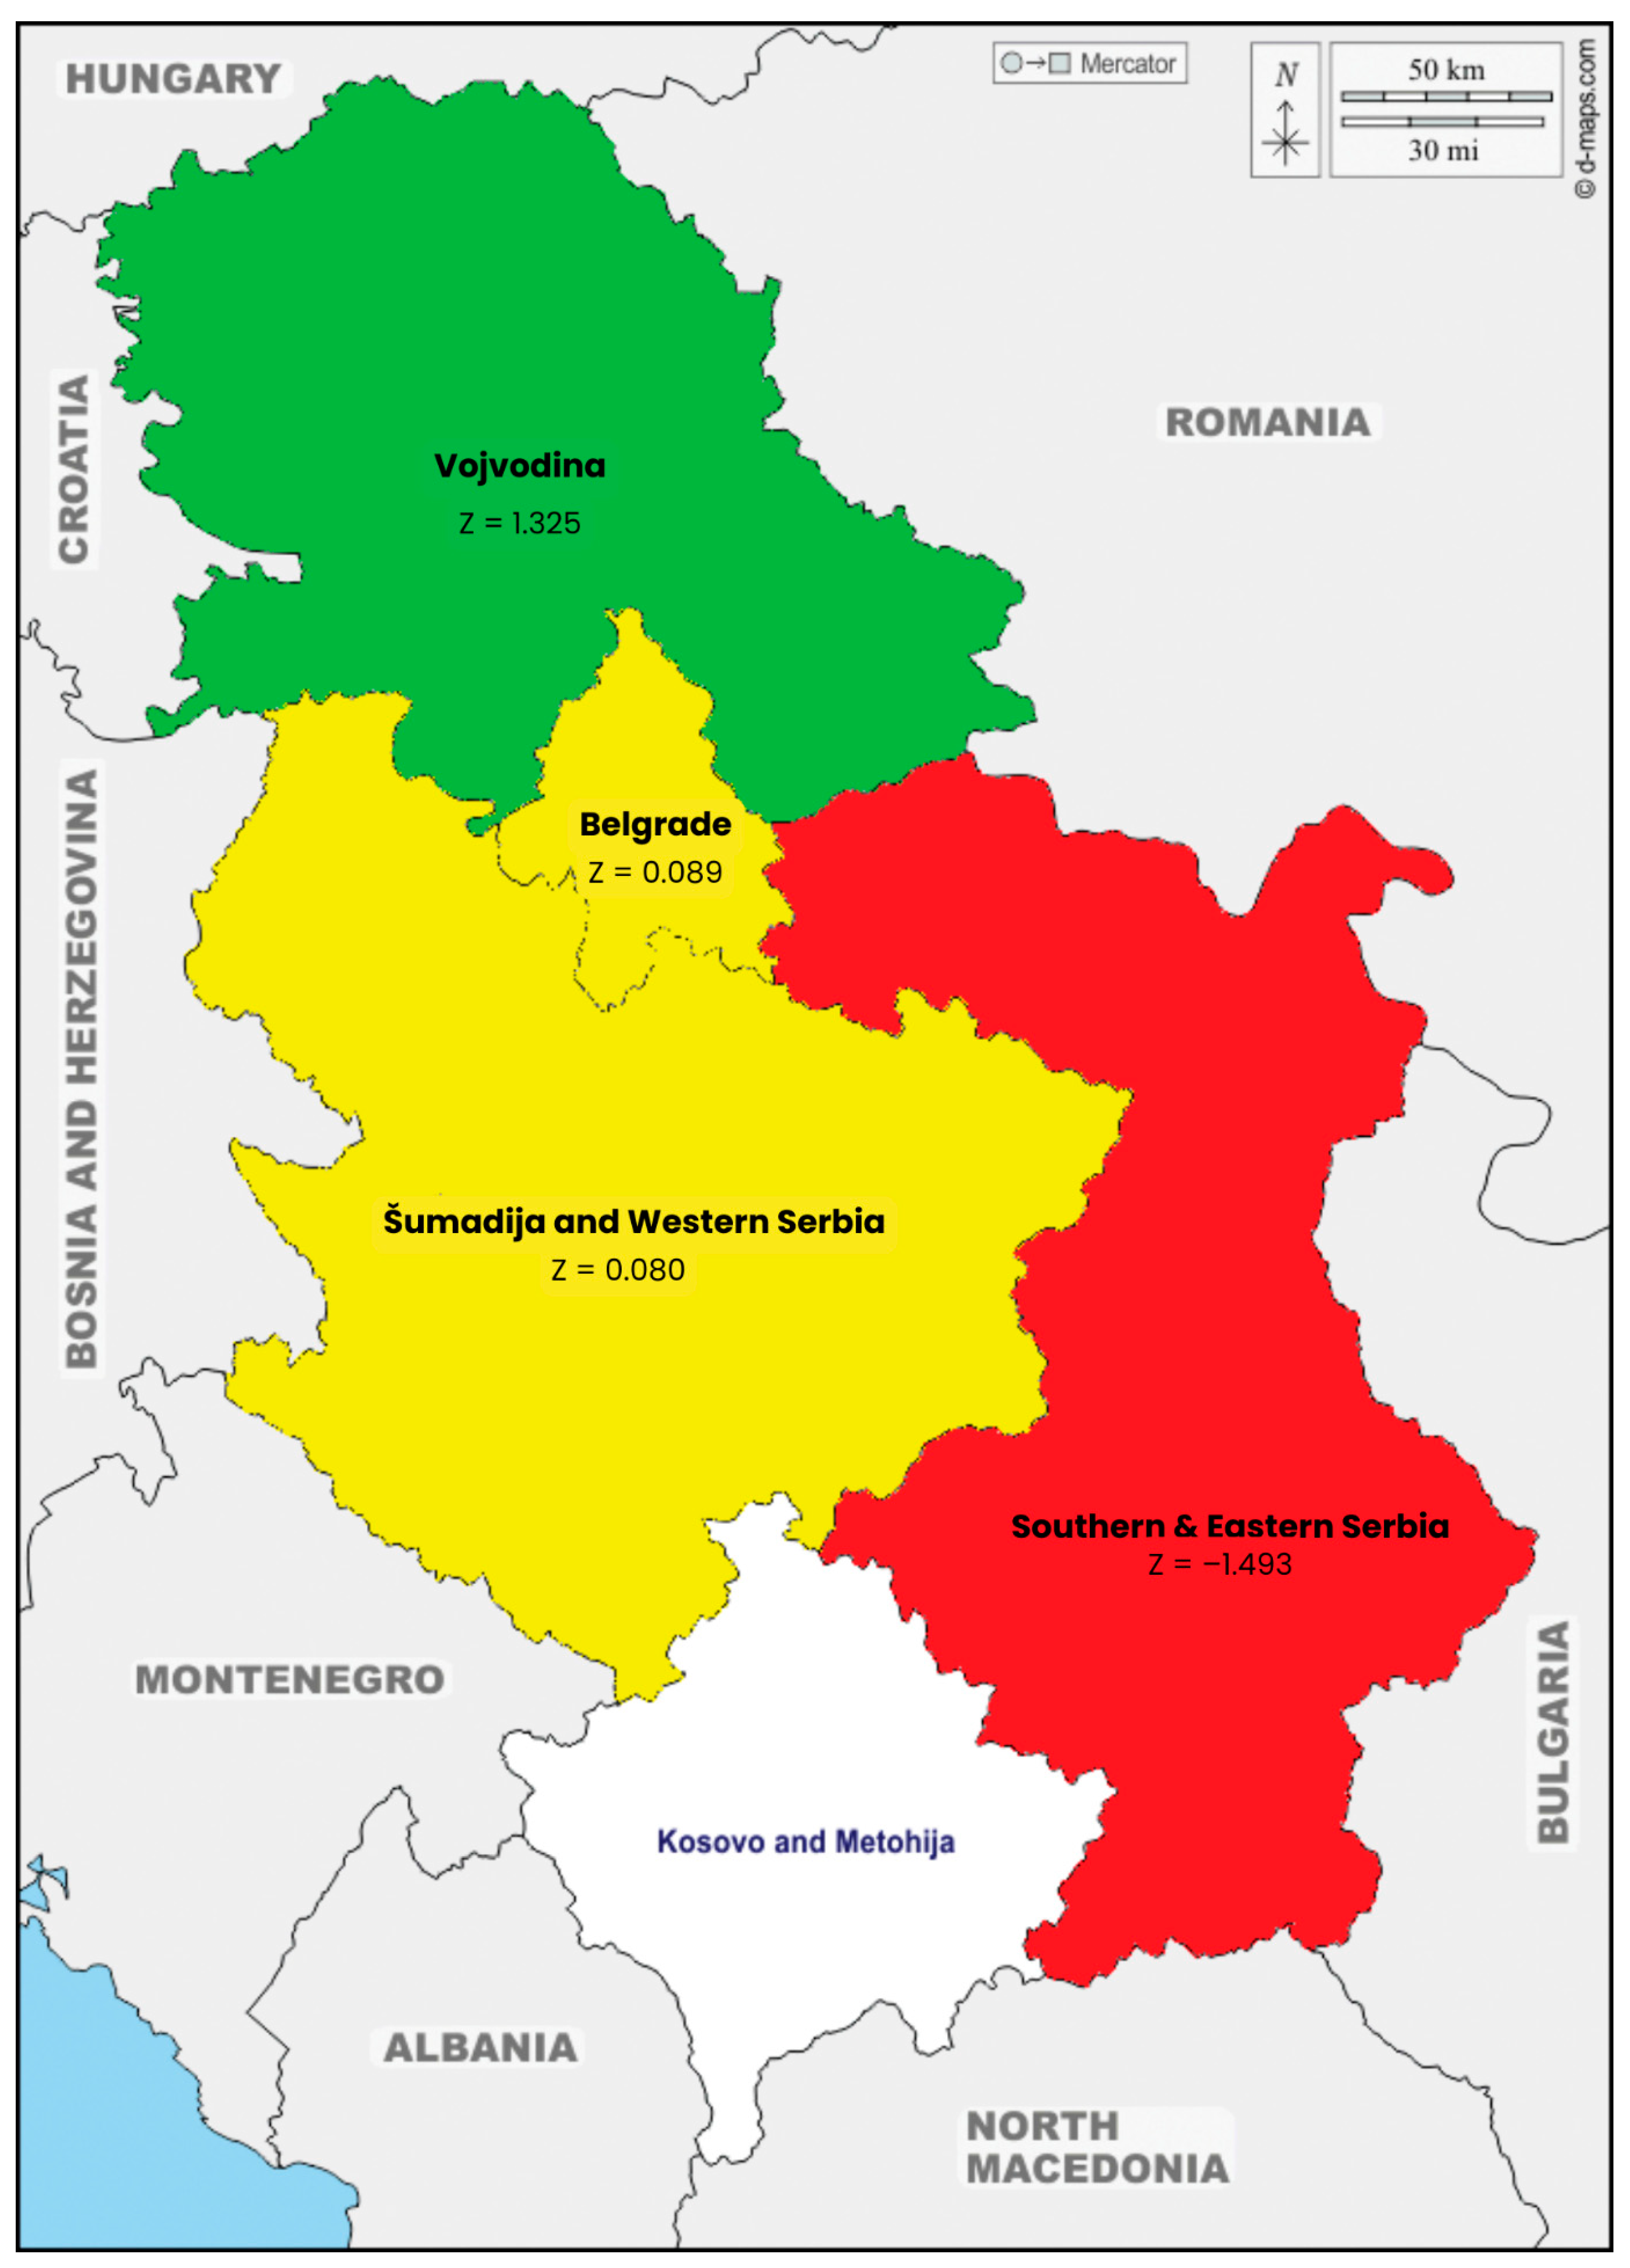
Figure A5.
Spatial distribution of the infrastructure dimension of community disaster resilience across regions of Serbia. Regions are classified into five categories (high, relatively high, medium, relatively low, low). Color coding: RH (relatively high) = green; M (medium) = yellow; L/Low (low) = brown; RL (relatively low) = red.
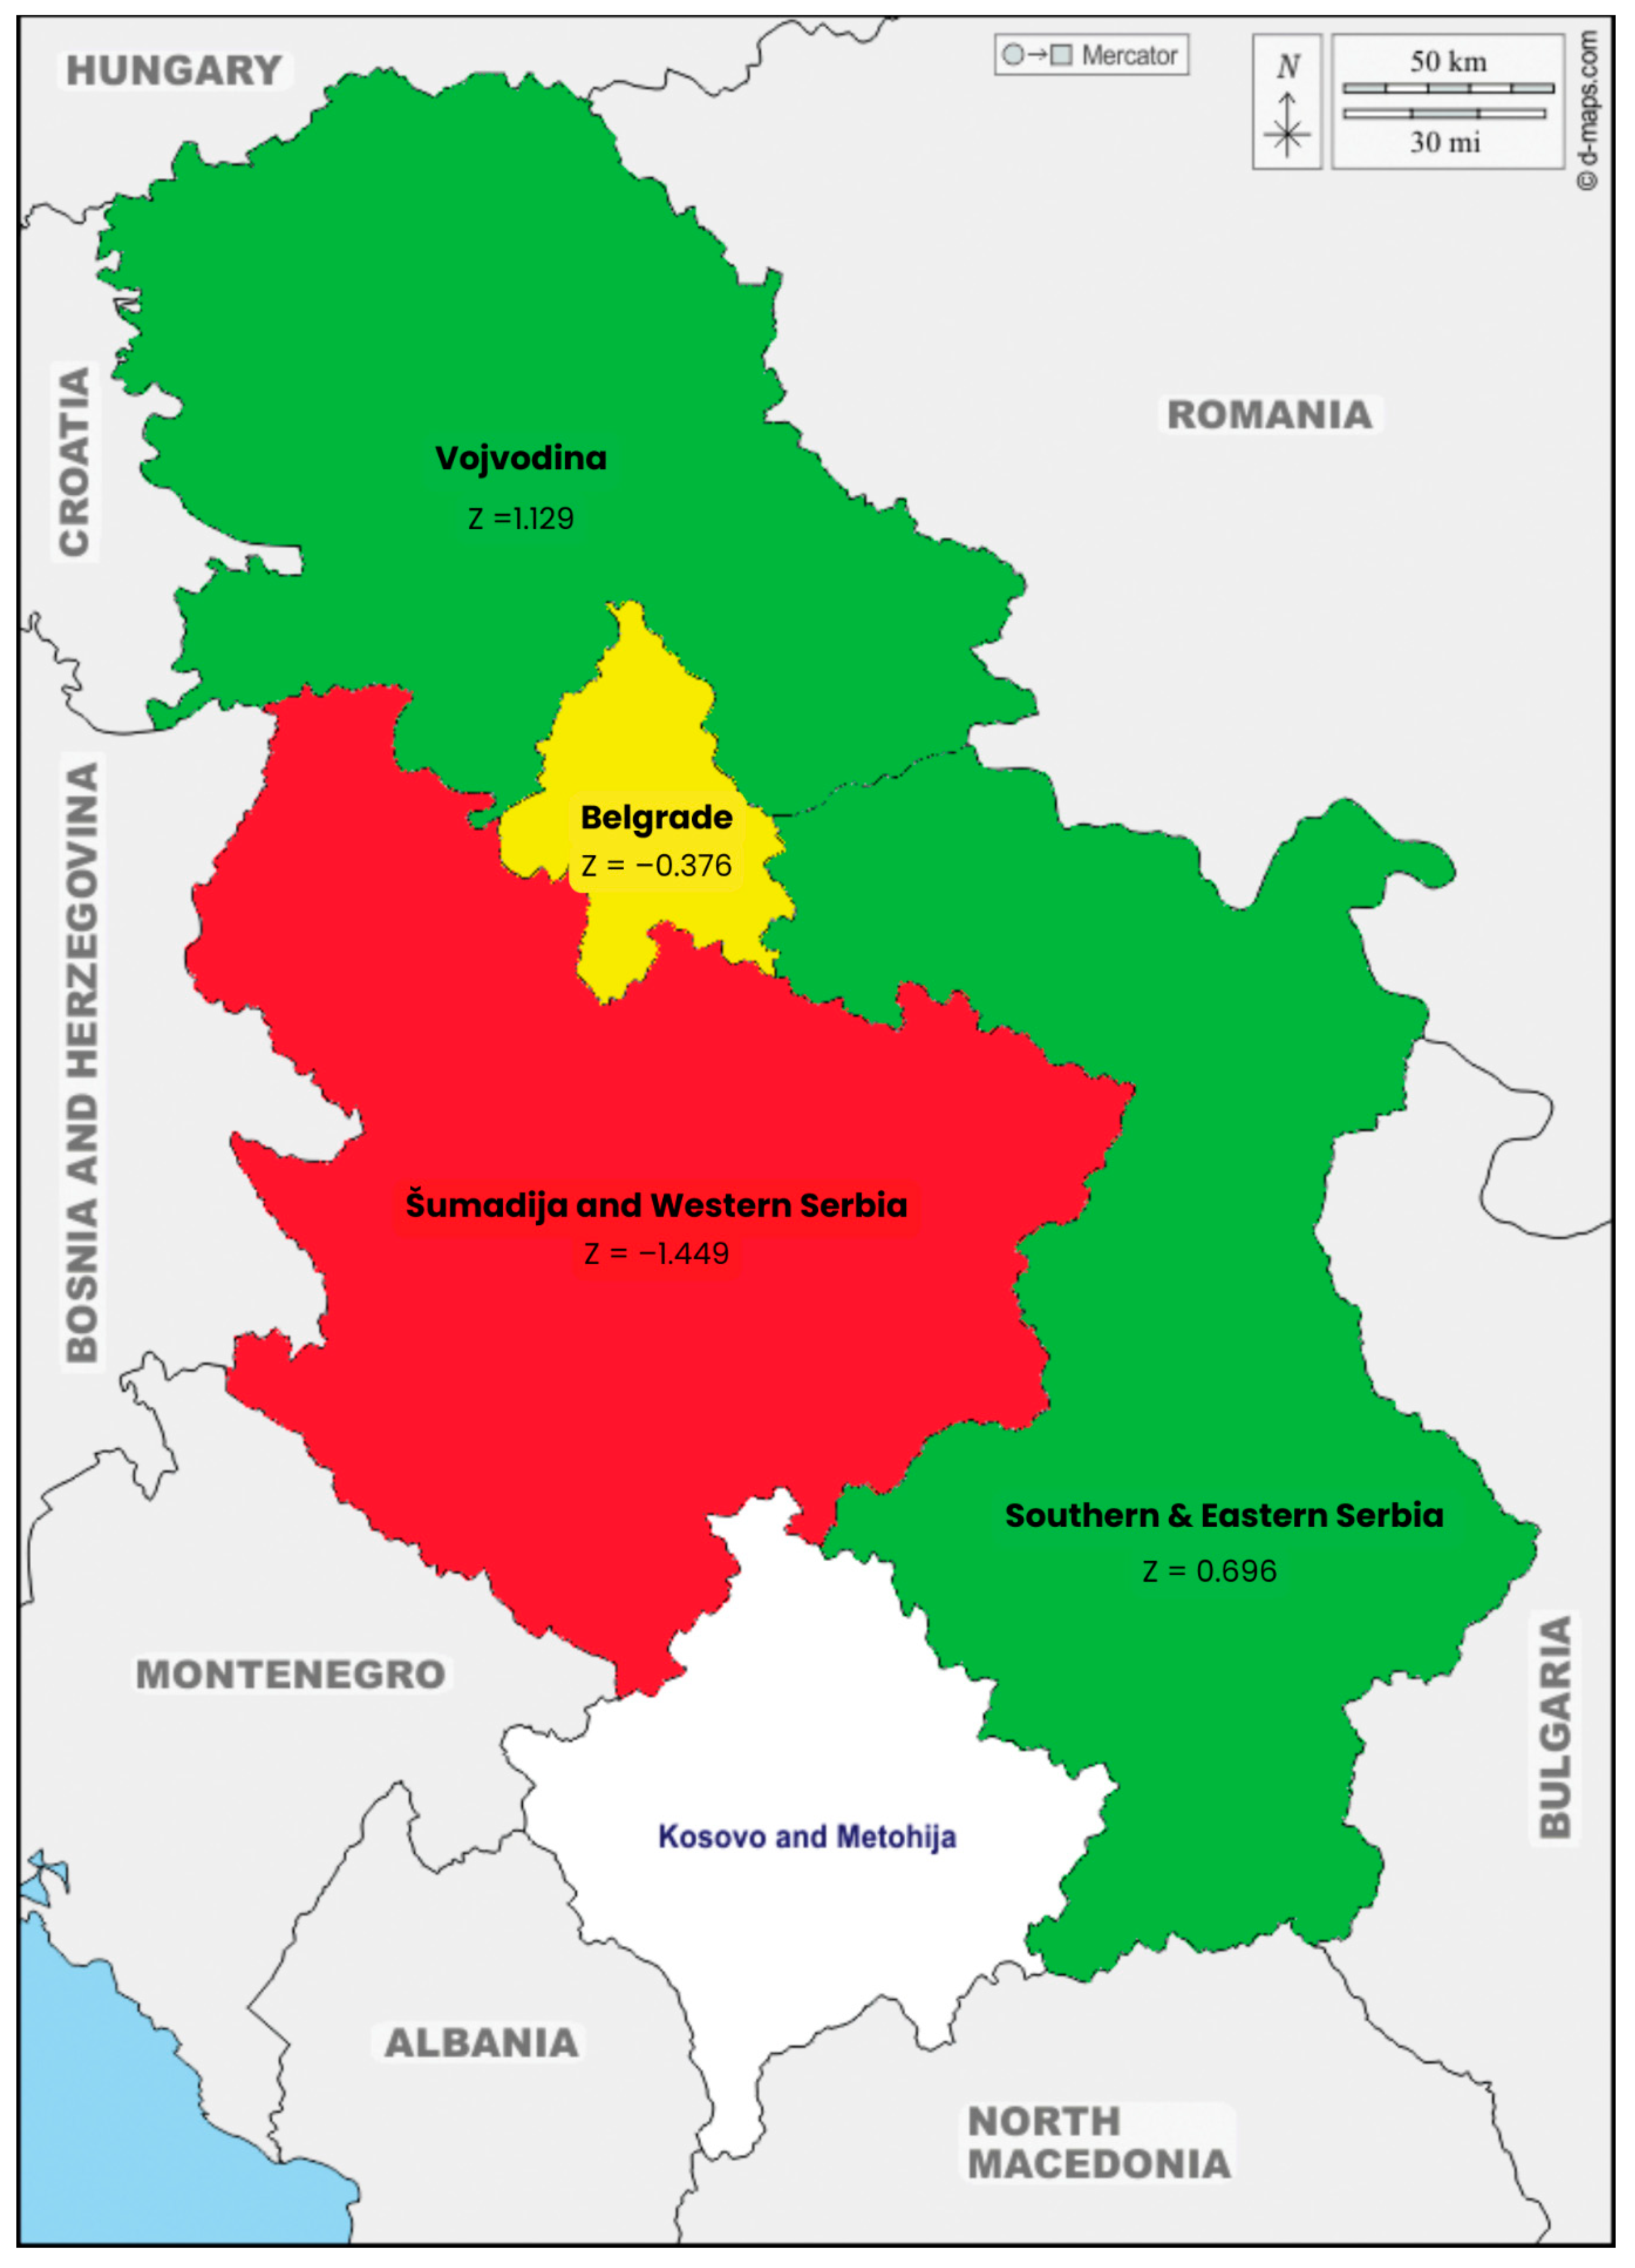
Figure A6.
Spatial distribution of the environmental dimension of community disaster resilience across regions of Serbia. Regions are classified into five categories (high, relatively high, medium, relatively low, low). Color coding: RH (relatively high) = green; M (medium) = yellow; L/Low (low) = brown; RL (relatively low) = red.
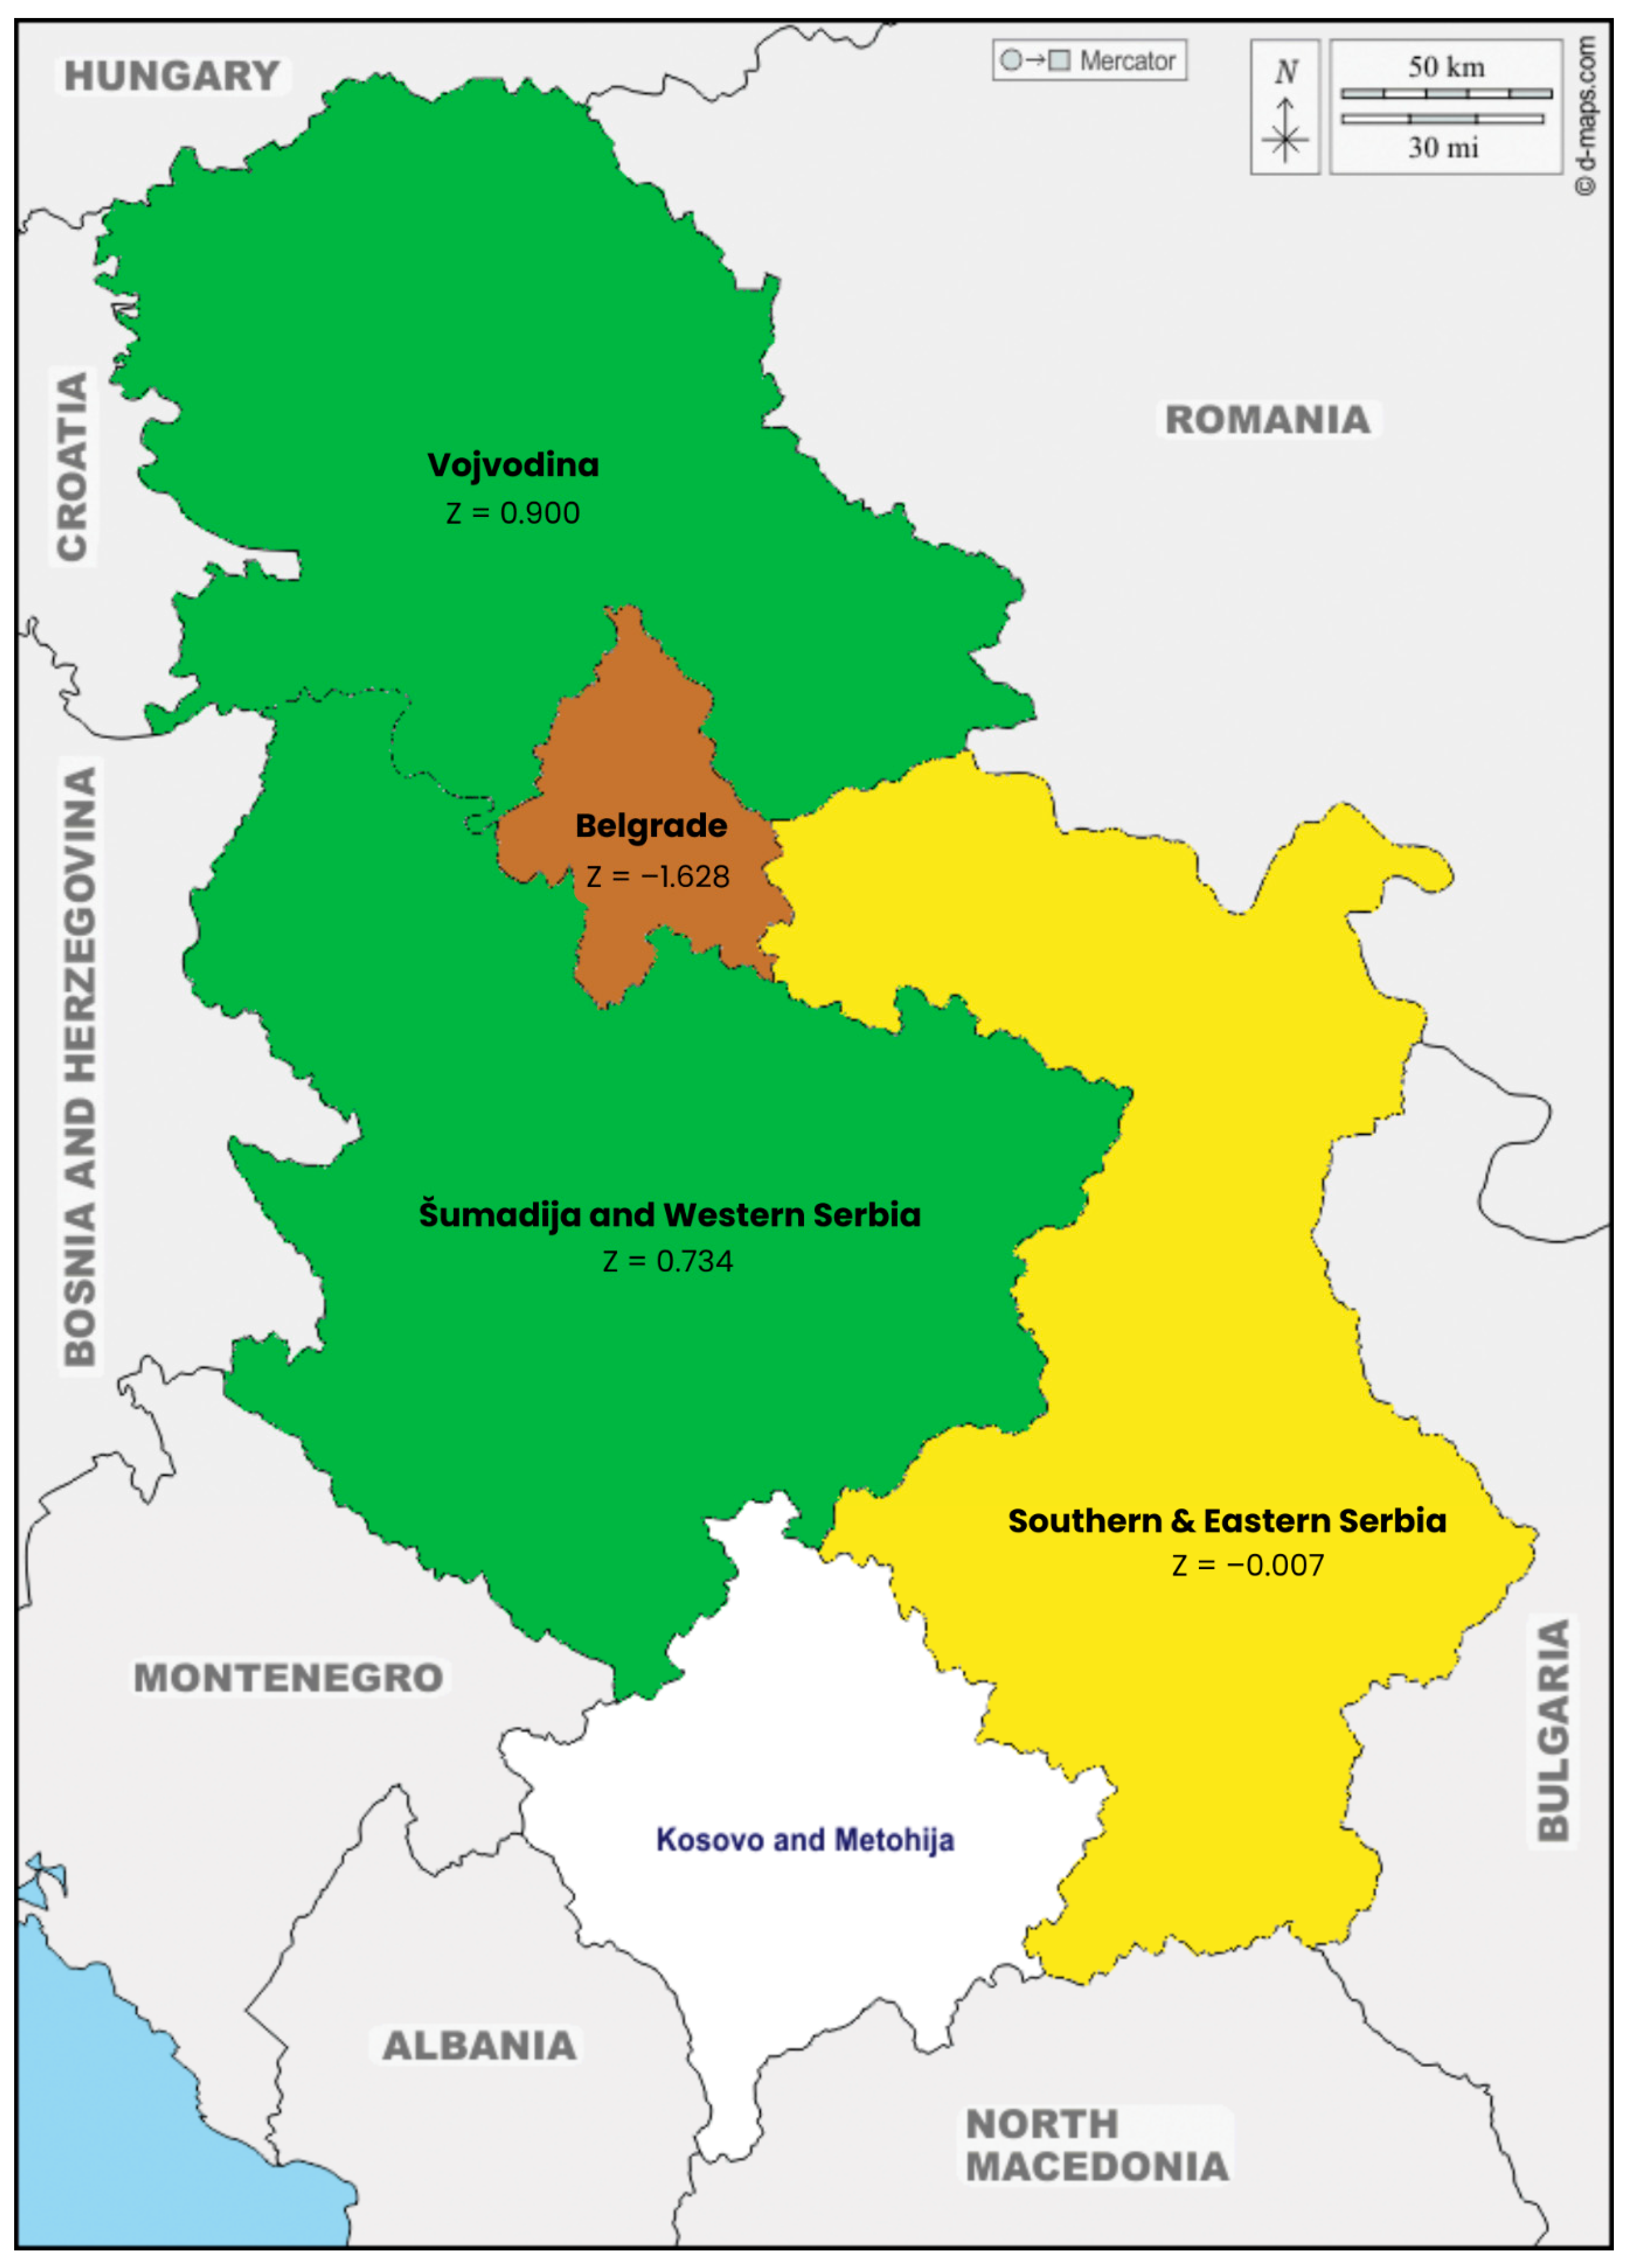
References
- Dalangin, F.I.J. Assessing Good Governance Practices in Disaster Risk Reduction and Management (Disaster Risk Reduction and Management) Among Education Institutions: A Systematic Literature Review. Int. J. Disaster Risk Manag. 2025, 7, 21–32. [Google Scholar] [CrossRef] [Scilit]
- Canete, R.; Joiner, D.; Binas, R. Putting People First: Why Pooled Funds Belong to Communities. Int. J. Disaster Risk Manag. 2025, 7, 417–442. [Google Scholar] [CrossRef] [Scilit]
- Mavrodieva, A.V.; Budiarti, D.S.; Yu, Z.; Pasha, F.A.; Shaw, R. Governmental Incentivization for SMEs’ Engagement in Disaster Resilience in Southeast Asia. Int. J. Disaster Risk Manag. 2019, 1, 32–50. [Google Scholar] [CrossRef] [Scilit]
- Hanif, S.; Awais, M.; Shah, S.A.A. Disaster Risk Assessment and Management Challenges Faced by University Libraries: A Case Study of Disaster-Prone Region Hazara, Pakistan. Int. J. Disaster Risk Manag. 2025, 7, 295–312. [Google Scholar] [CrossRef] [Scilit]
- Rahman, M.M.; Sarker, S.; Biswas, A.; Roy, S.; Mahmud, M.A. Exploring Flood-Induced Livelihood Vulnerabilities in Bangladesh: Insights from Teota, Manikganj and the Bangladesh Delta Plan 2100. Int. J. Disaster Risk Manag. 2025, 7, 333–360. [Google Scholar] [CrossRef] [Scilit]
- Roy, B.K.; Shawon, M.I.H.; Hasan, M.M. Community-Driven Risk Assessment: Integrating Local Perceptions into Quantifiable Risk Weights Using Analytical Hierarchy Process (Analytical Hierarchy Process)–Geographical Information System (Geographical Information System). Int. J. Disaster Risk Manag. 2025, 7, 131–152. [Google Scholar] [CrossRef] [Scilit]
- Sacyaten, C.S. Crisis Communication in Times of Disasters: Public Perceptions on the Timeliness and Clarity of Safety Announcements: A Systematic Literature Review. Int. J. Disaster Risk Manag. 2025, 7, 193–208. [Google Scholar] [CrossRef] [Scilit]
- Samira, D. Geospatial Analysis of COVID-19 Spread in Constantine, Algeria: Epidemiological Insights and Policy Recommendations. Int. J. Disaster Risk Manag. 2025, 7, 385–394. [Google Scholar] [CrossRef] [Scilit]
- Holling, S.C. Resilience and Stability of Ecological Systems. Annu. Rev. Ecol. Syst. 1973, 4, 1–23. [Google Scholar] [CrossRef] [Scilit]
- Cutter, S.L.; Burton, C.G.; Emrich, C.T. Disaster Resilience Indicators for Benchmarking Baseline Conditions. J. Homel. Secur. Emerg. Manag. 2010, 7, 51. [Google Scholar] [CrossRef] [Scilit]
- Al-Ramlawi, A.H.; Al-Agha, J.F.; El-Ashgar, N.M. The Impact of Political Variables on the Quality of Health Services in Governmental Hospitals—Case Study: Al-Shifa Medical Complex. Int. J. Disaster Risk Manag. 2025, 7, 517–528. [Google Scholar] [CrossRef] [Scilit]
- Islam, S.M. Shelter for People in Extreme Weather: Exploring the Options in the Coastal Areas of Bangladesh. Int. J. Disaster Risk Manag. 2025, 7, 469–490. [Google Scholar] [CrossRef] [Scilit]
- Milenković, D.; Cvetković, V.M. Rethinking Disaster Resilience: Conceptual Framework, Core Dimensions, and Key Actors. Int. J. Disaster Risk Manag. 2025, 7, 455–468. [Google Scholar] [CrossRef] [Scilit]
- Canete, R.; Biñas, R. Differential Risk and the Elements of Resilience: A Framework for Advancing Disaster Risk Reduction. Int. J. Disaster Risk Manag. 2025, 7, 209–238. [Google Scholar] [CrossRef] [Scilit]
- Quigley, M.; Blair, N.; Davison, K. Articulating a Social-Ecological Resilience Agenda for Urban Design. J. Urban Des. 2018, 23, 581–602. [Google Scholar] [CrossRef] [Scilit]
- Ahmed, S. UN Peacekeeping: Challenges and Reforms for Civilian Protection and Human Rights. Int. J. Contemp. Secur. Stud. 2025, 1, 245–254. [Google Scholar] [CrossRef] [Scilit]
- Pradhan, B.; Kumar, S.; Nayak, D. From Vulnerability to Resilience: A Systematic Review of Odisha’s Integrated Approach to Disaster Risk Reduction. Int. J. Disaster Risk Manag. 2025, 7, 519–532. [Google Scholar] [CrossRef] [Scilit]
- Hamza, J.M.; Sunday John, D.K. Assessment on the Level of Awareness and Adoption of Cloud Computing for Disaster-Resilient Library Management Systems: A Case Study of Federal University of Education, Zaria. Int. J. Contemp. Secur. Stud. 2025, 1, 83–103. [Google Scholar] [CrossRef] [Scilit]
- Karmaker, R. Advancing Faster than Male: Female Achievement and Employment Outcomes in Bangladesh. Int. J. Contemp. Secur. Stud. 2025, 1, 25–49. [Google Scholar] [CrossRef] [Scilit]
- Miletić, S.; Stojanović, T. Risks and Threats to Critical Infrastructure with Reference to Trends in the Protection of Critical Infrastructure in the Republic of Serbia. Int. J. Contemp. Secur. Stud. 2025, 1, 203–214. [Google Scholar] [CrossRef] [Scilit]
- Porel, T. A Nuclear Policy Framework: Identifying Challenges and Ways to Solutions. Int. J. Contemp. Secur. Stud. 2025, 1, 9–23. [Google Scholar] [CrossRef] [Scilit]
- Simonovic, S.P.; Peck, A. Dynamic Resilience to Climate Change Caused Natural Disasters in Coastal Megacities Quantification Framework. Br. J. Environ. Clim. Change 2013, 3, 378–401. [Google Scholar] [CrossRef] [Scilit]
- Johansen, C.; Horney, J.; Tien, I. Metrics for Evaluating and Improving Community Resilience. J. Infrastruct. Syst. 2017, 23, 04017007. [Google Scholar] [CrossRef] [Scilit]
- Ahmed, S. Impacts of Flooding Disaster Risk Management Policy For Resilience Building in Pastoral and Agro-Pastoral Community: The Case of Dassenech, Southern Ethiopia. Int. J. Disaster Risk Manag. 2025, 7, 137–162. [Google Scholar] [CrossRef] [Scilit]
- OECD/European Union/EC-JRC. Handbook on Constructing Composite Indicators: Methodology and User Guide; OECD Publishing: Paris, France, 2008. [Google Scholar] [CrossRef] [Scilit]
- Cutter, S.L.; Ash, K.D.; Emrich, C.T. Urban–Rural Differences in Disaster Resilience. Ann. Am. Assoc. Geogr. 2016, 106, 1236–1252. [Google Scholar] [CrossRef] [Scilit]
- Dinh, H.; Freyens, B.; Daly, A.; Vidyattama, Y. Measuring Community Economic Resilience in Australia: Estimates of Recent Levels and Trends. Soc. Indic. Res. 2017, 132, 1217–1236. [Google Scholar] [CrossRef] [Scilit]
- Milenković, D.; Cvetković, V.; Renner, R. A Systematic Literary Review on Community Resilience Indicators: Adaptation and Application of the BRIC Method for Measuring Disasters Resilience. Int. J. Disaster Risk Manag. 2024, 6, 79–103. [Google Scholar] [CrossRef] [Scilit]
- Scherzer, S.; Lujala, P.; Rød, J. A Community Resilience Index for Norway: An Adaptation of the Baseline Resilience Indicators for Communities (BRIC). Int. J. Disaster Risk Reduct. 2019, 36, 101107. [Google Scholar] [CrossRef] [Scilit]
- Camacho, C.; Bower, P.; Webb, R.T.; Munford, L. Measurement of community resilience using the Baseline Resilience Indicator for Communities (BRIC) framework: A systematic review. Int. J. Disaster Risk Reduct. 2023, 95, 103870. [Google Scholar] [CrossRef] [Scilit]
- Milenković, D. Theoretical, Institutional and Organizational Aspects of the Integrated Disaster Risk Reduction System: Towards a Deeper Understanding of Disaster Resilience in Serbia. Int. J. Contemp. Secur. Stud. 2025, 1, 175–189. [Google Scholar] [CrossRef] [Scilit]
- Cvetković, V.M.; Šišović, V. Capacity Building in Serbia for Disaster and Climate Risk Education. In Disaster and Climate Risk Education: Insights from Knowledge to Action; Springer Nature: Singapore, 2024; pp. 299–323. [Google Scholar] [CrossRef] [Scilit]
- Cutter, S.L.; Barnes, L.; Berry, M.; Burton, C.; Evans, E.; Tate, E.; Webb, J. A Place-Based Model for Understanding Community Resilience to Natural Disasters. Glob. Environ. Change 2008, 18, 598–606. [Google Scholar] [CrossRef] [Scilit]
- Garba, T.M.; Amuka, I.; Akaan, R. Female Gender Empowerment, Individualism, Collectivism, and Resilience: A Comparative Study in the Context of Disaster Risk Management. Int. J. Disaster Risk Manag. 2025, 7, 313–324. [Google Scholar] [CrossRef] [Scilit]
- Cutter, S.L.; Derakhshan, S. Implementing Disaster Policy: Exploring Scale and Measurement Schemes for Disaster Resilience. J. Homel. Secur. Emerg. Manag. 2019, 16, 20180029. [Google Scholar] [CrossRef] [Scilit]
- Muttarak, R.; Lutz, W. Is Education a Key to Reducing Vulnerability to Natural Disasters and Hence Unavoidable Climate Change? Ecol. Soc. 2014, 19, 42. [Google Scholar] [CrossRef] [Scilit]
- Aldrich, P.D. Building Resilience: Social Capital in Post-Disaster Recovery; The University of Chicago Press: Chicago, IL, USA, 2012. [Google Scholar]
- Tseng, T.H.; Stojadinović, B. CI-STR Interface for Disaster Resilience Assessment. Int. J. Disaster Risk Reduct. 2024, 93, 104763. [Google Scholar] [CrossRef] [Scilit]
- Bergstrand, K.; Mayer, B.; Brumback, B.; Zhang, Y. Assessing the Relationship Between Social Vulnerability and Community Resilience to Hazards. Soc. Indic. Res. 2014, 122, 391–409. [Google Scholar] [CrossRef] [Scilit]
- Pooyan, Z.; Hokugo, A. Community Resilience and Social Capital: Hindering vs. Fostering Factors. Int. J. Disaster Risk Reduct. 2025, 118, 105213. [Google Scholar] [CrossRef] [Scilit]
- Mohamad, N.; Jusoh, H.; Kassim, Z. Localizing of Community Resilience Indicators for Assessing the Urban Community Resilience in Putrajaya, Malaysia. Int. J. Eng. Adv. Technol. 2019, 8, 359–365. [Google Scholar] [CrossRef] [Scilit]
- Kim, H.; Marcouiller, D.W. Mitigating Flood Risk and Enhancing Community Resilience to Natural Disasters: Plan Quality Matters. Environ. Hazards 2018, 17, 397–417. [Google Scholar] [CrossRef] [Scilit]
- Irwin, S.; Schardong, A.; Simonovic, S.P.; Nirupama, N. ResilSIM—A Decision Support Tool for Estimating Resilience of Urban Systems. Water 2016, 8, 377. [Google Scholar] [CrossRef] [Scilit]
- Cutter, S.L.; Ash, K.D.; Emrich, C.T. The Geographies of Community Disaster Resilience. Glob. Environ. Change 2014, 29, 65–77. [Google Scholar] [CrossRef] [Scilit]
- Karanci, N.A.; Ikizer, G.; Doğulu, C.; Özceylan-Aubrecht, D. Perceptions of Individual and Community Resilience to Earthquakes: A Case Study from Turkey. In Framing Community Disaster Resilience: Resources, Capacities, Learning, and Action; Wiley: Hoboken, NJ, USA, 2018; pp. 237–256. [Google Scholar] [CrossRef] [Scilit]
- McAllister, T.P. A Guide to Develop Community Resilience Performance Goals and Assessment Metrics for Decision Making. In Proceedings of the 12th International Conference on Applications of Statistics and Probability in Civil Engineering (ICASP12), Vancouver, BC, Canada, 12–15 July 2015. [Google Scholar] [CrossRef] [Scilit]
- Macharia, D.; Kaijage, E.; Kindberg, L.; Koech, G.; Ndungu, L.; Wahome, A.; Mugo, R. Mapping Climate Vulnerability of River Basin Communities in Tanzania to Inform Resilience Interventions. Sustainability 2020, 12, 4102. [Google Scholar] [CrossRef] [Scilit]
- Zio, E. Challenges in the Vulnerability and Risk Analysis of Critical Infrastructures. Reliab. Eng. Syst. Saf. 2016, 152, 137–150. [Google Scholar] [CrossRef] [Scilit]
- Siebeneck, L.; Arlikatti, S.; Andrew, S.A. Using Provincial Baseline Indicators to Model Geographic Variations of Disaster Resilience in Thailand. Nat. Hazards 2015, 79, 955–975. [Google Scholar] [CrossRef] [Scilit]
- Mavhura, E.; Manyangadze, T.; Aryal, K. A Composite Inherent Resilience Index for Zimbabwe: An Adaptation of the Disaster Resilience of Place Model. Int. J. Disaster Risk Reduct. 2021, 57, 102152. [Google Scholar] [CrossRef] [Scilit]
- Sung, C.-H.; Liaw, S.-C. A GIS Approach to Analyzing the Spatial Pattern of Baseline Resilience Indicators for Community (BRIC). Water 2020, 12, 1401. [Google Scholar] [CrossRef] [Scilit]
- Singh-Peterson, L.; Salmon, P.; Goode, N.; Gallina, J. Translation and Evaluation of the Baseline Resilience Indicators for Communities on the Sunshine Coast, Queensland, Australia. Int. J. Disaster Risk Reduct. 2014, 10, 116–126. [Google Scholar] [CrossRef] [Scilit]
- Csizovszky, A.; Buzási, A. Analysis of community resilience in Hungary—An adaptation of the basic resilience indicators for communities (BRIC), 2020. Reg. Stat. 2023, 13, 752–778. [Google Scholar] [CrossRef] [Scilit]
- Csizovszky, A. Have Hungarian districts become more resilient?—A comparison of the 2014 and 2020 Baseline Resilience Indicators for Communities (BRICs). Eur. J. Sustain. Dev. 2023, 12, 185–197. [Google Scholar] [CrossRef] [Scilit]
- Javadpoor, M.; Sharifi, A.; Roosta, M. An adaptation of the Baseline Resilience Indicators for Communities (BRIC) for assessing resilience of Iranian provinces. Int. J. Disaster Risk Reduct. 2021, 66, 102609. [Google Scholar] [CrossRef] [Scilit]
- Camacho, C.; Webb, R.T.; Bower, P.; Munford, L. Adapting the Baseline Resilience Indicators for Communities (BRIC) Framework for England: Development of a Community Resilience Index. Int. J. Environ. Res. Public Health 2024, 21, 1012. [Google Scholar] [CrossRef] [Scilit] [PubMed]
- Ciccotti, L.; Rodrigues, A.C.; Boscov, M.; Günther, W. Building Indicators of Community Resilience to Disasters in Brazil: A Participatory Approach. Ambiente Soc. 2020, 23, e01231. [Google Scholar] [CrossRef] [Scilit]
- Pazhuhan, M.; Moradpour, N.; Hesarakizard, A.; Ayyoob, S. District-Based Baseline Resilience Indicators for Communities (DBRIC) for Assessment of a Global South City. Sustain. Cities Soc. 2023, 96, 104563. [Google Scholar] [CrossRef] [Scilit]
- Talubo, J.; Malenab, R.; Morse, S.; Saroj, D. Practitioners’ Participatory Development of Indicators for Island Community Resilience to Disasters. Sustainability 2022, 14, 4102. [Google Scholar] [CrossRef] [Scilit]
- Cohen, O.; Leykin, D.; Lahad, M.; Goldberg, A.; Aharonson-Daniel, L. The Conjoint Community Resiliency Assessment Measure as a Baseline for Profiling and Predicting Community Resilience for Emergencies. Technol. Forecast. Soc. Change 2013, 80, 1732–1741. [Google Scholar] [CrossRef] [Scilit]
- Tseng, Y.-P.; Huang, Y.-C.; Li, M.-S.; Jiang, Y.-Z. Selecting Key Resilience Indicators for Indigenous Community Using Fuzzy Delphi Method. Sustainability 2022, 14, 2018. [Google Scholar] [CrossRef] [Scilit]
- Tariq, H.; Pathirage, C.; Fernando, T. Measuring Community Disaster Resilience at Local Levels: An Adaptable Resilience Framework. Int. J. Disaster Risk Reduct. 2021, 62, 102358. [Google Scholar] [CrossRef] [Scilit]
- Derakhshan, S.; Blackwood, L.; Habets, M.; Effgen, J.F.; Cutter, S.L. Prisoners of Scale: Downscaling Community Resilience Measurements for Enhanced Use. Sustainability 2022, 14, 6927. [Google Scholar] [CrossRef] [Scilit]
- Dukiya, J.J.; Benjamine, O. Building Resilience through Local and International Partnerships: Nigeria Experiences. Int. J. Disaster Risk Manag. 2021, 3, 11–24. [Google Scholar] [CrossRef] [Scilit]
- Cvetković, V.M.; Šišović, V. Understanding the Sustainable Development of Community (Social) Disaster Resilience in Serbia: Demographic and Socio-Economic Impacts. Sustainability 2024, 16, 2620. [Google Scholar] [CrossRef] [Scilit]
- United Nations Development Programme. EU za Srbiju Otpornu na Katastrofe. Available online: https://www.undp.org/sr/serbia/projects/eu-za-srbiju-otpornu-na-katastrofe (accessed on 22 January 2026).
- Hluszko, C.; Ramos Huarachi, D.A.; Castillo Ulloa, M.I.; Salvador, R.; Puglieri, F.N.; de Francisco, A.C. How do the BRICS approach sustainable concerns? A systematic literature review. Environ. Dev. 2024, 52, 101075. [Google Scholar] [CrossRef] [Scilit]
- Imamachi, N.; Tani, H.; Mizutani, R.; Imamura, K.; Irie, T.; Suzuki, Y.; Akimitsu, N. BRIC-seq: A genome-wide approach for determining RNA stability in mammalian cells. Methods 2014, 67, 55–63. [Google Scholar] [CrossRef] [Scilit]
- Marzi, S.; Mysiak, J.; Essenfelder, A.H.; Amadio, M.; Giove, S.; Fekete, A. Constructing a comprehensive disaster resilience index: The case of Italy. PLoS ONE 2019, 14, e0221585. [Google Scholar] [CrossRef] [Scilit]
- Hiete, M.; Merz, M.; Comes, T.; Schultmann, F. Trapezoidal fuzzy DEMATEL method to analyze and correct for relations between variables in a composite indicator for disaster resilience. OR Spectr. 2012, 34, 971–995. [Google Scholar] [CrossRef] [Scilit]
- Cvetković, V.M.; Tanasić, J.; Ocal, A.; Kešetović, Ž.; Nikolić, N.; Dragašević, A. Capacity Development of Local Self-Governments for Disaster Risk Management. Int. J. Environ. Res. Public Health 2021, 18, 10406. [Google Scholar] [CrossRef] [Scilit] [PubMed]
- MacKinnon, D.; Derickson, K.D. From resilience to resourcefulness: A critique of resilience policy and activism. Prog. Hum. Geogr. 2013, 37, 253–270. [Google Scholar] [CrossRef] [Scilit]
- Hunsu, N.J.; Kehinde, O.J.; Oje, A.V.; Yli-Piipari, S. Single Versus Multiple Resilience Factors: An Investigation of the Dimensionality of the Academic Resilience Scale. J. Psychoeduc. Assess. 2022, 40, 346–359. [Google Scholar] [CrossRef] [Scilit]
- Cretney, R. Resilience for whom? Emerging critical geographies of socio-ecological resilience. Geogr. Compass 2014, 8, 627–640. [Google Scholar] [CrossRef] [Scilit]
- Cowley, S. Developing and measuring resilience for population health. Afr. Health Sci. 2008, 8, S41–S43. [Google Scholar]
- Ji, T.; Wei, H.-H.; Shohet, I.M.; Xiong, F. Risk-based resilience concentration assessment of community to seismic hazards. Nat. Hazards 2021, 108, 1731–1751. [Google Scholar] [CrossRef] [Scilit]
- Milenković, D.; Cvetković, M.V.; Beriša, H.; Jakovljević, V.; Gačić, J.; Cvetković, V. Beyond the Original BRIC Model: Gaps, Limitations, and Adaptation of Community Resilience Indicators for Local Contexts. Int. J. Disaster Risk Manag. 2026, 8, 55–76. [Google Scholar] [CrossRef] [Scilit]
- Kabir, M.H.; Hossain, T.; Haque, M.W. Resilience to natural disasters: A case study on southwestern region of coastal Bangladesh. Int. J. Disaster Risk Manag. 2022, 4, 91–105. [Google Scholar] [CrossRef] [Scilit]
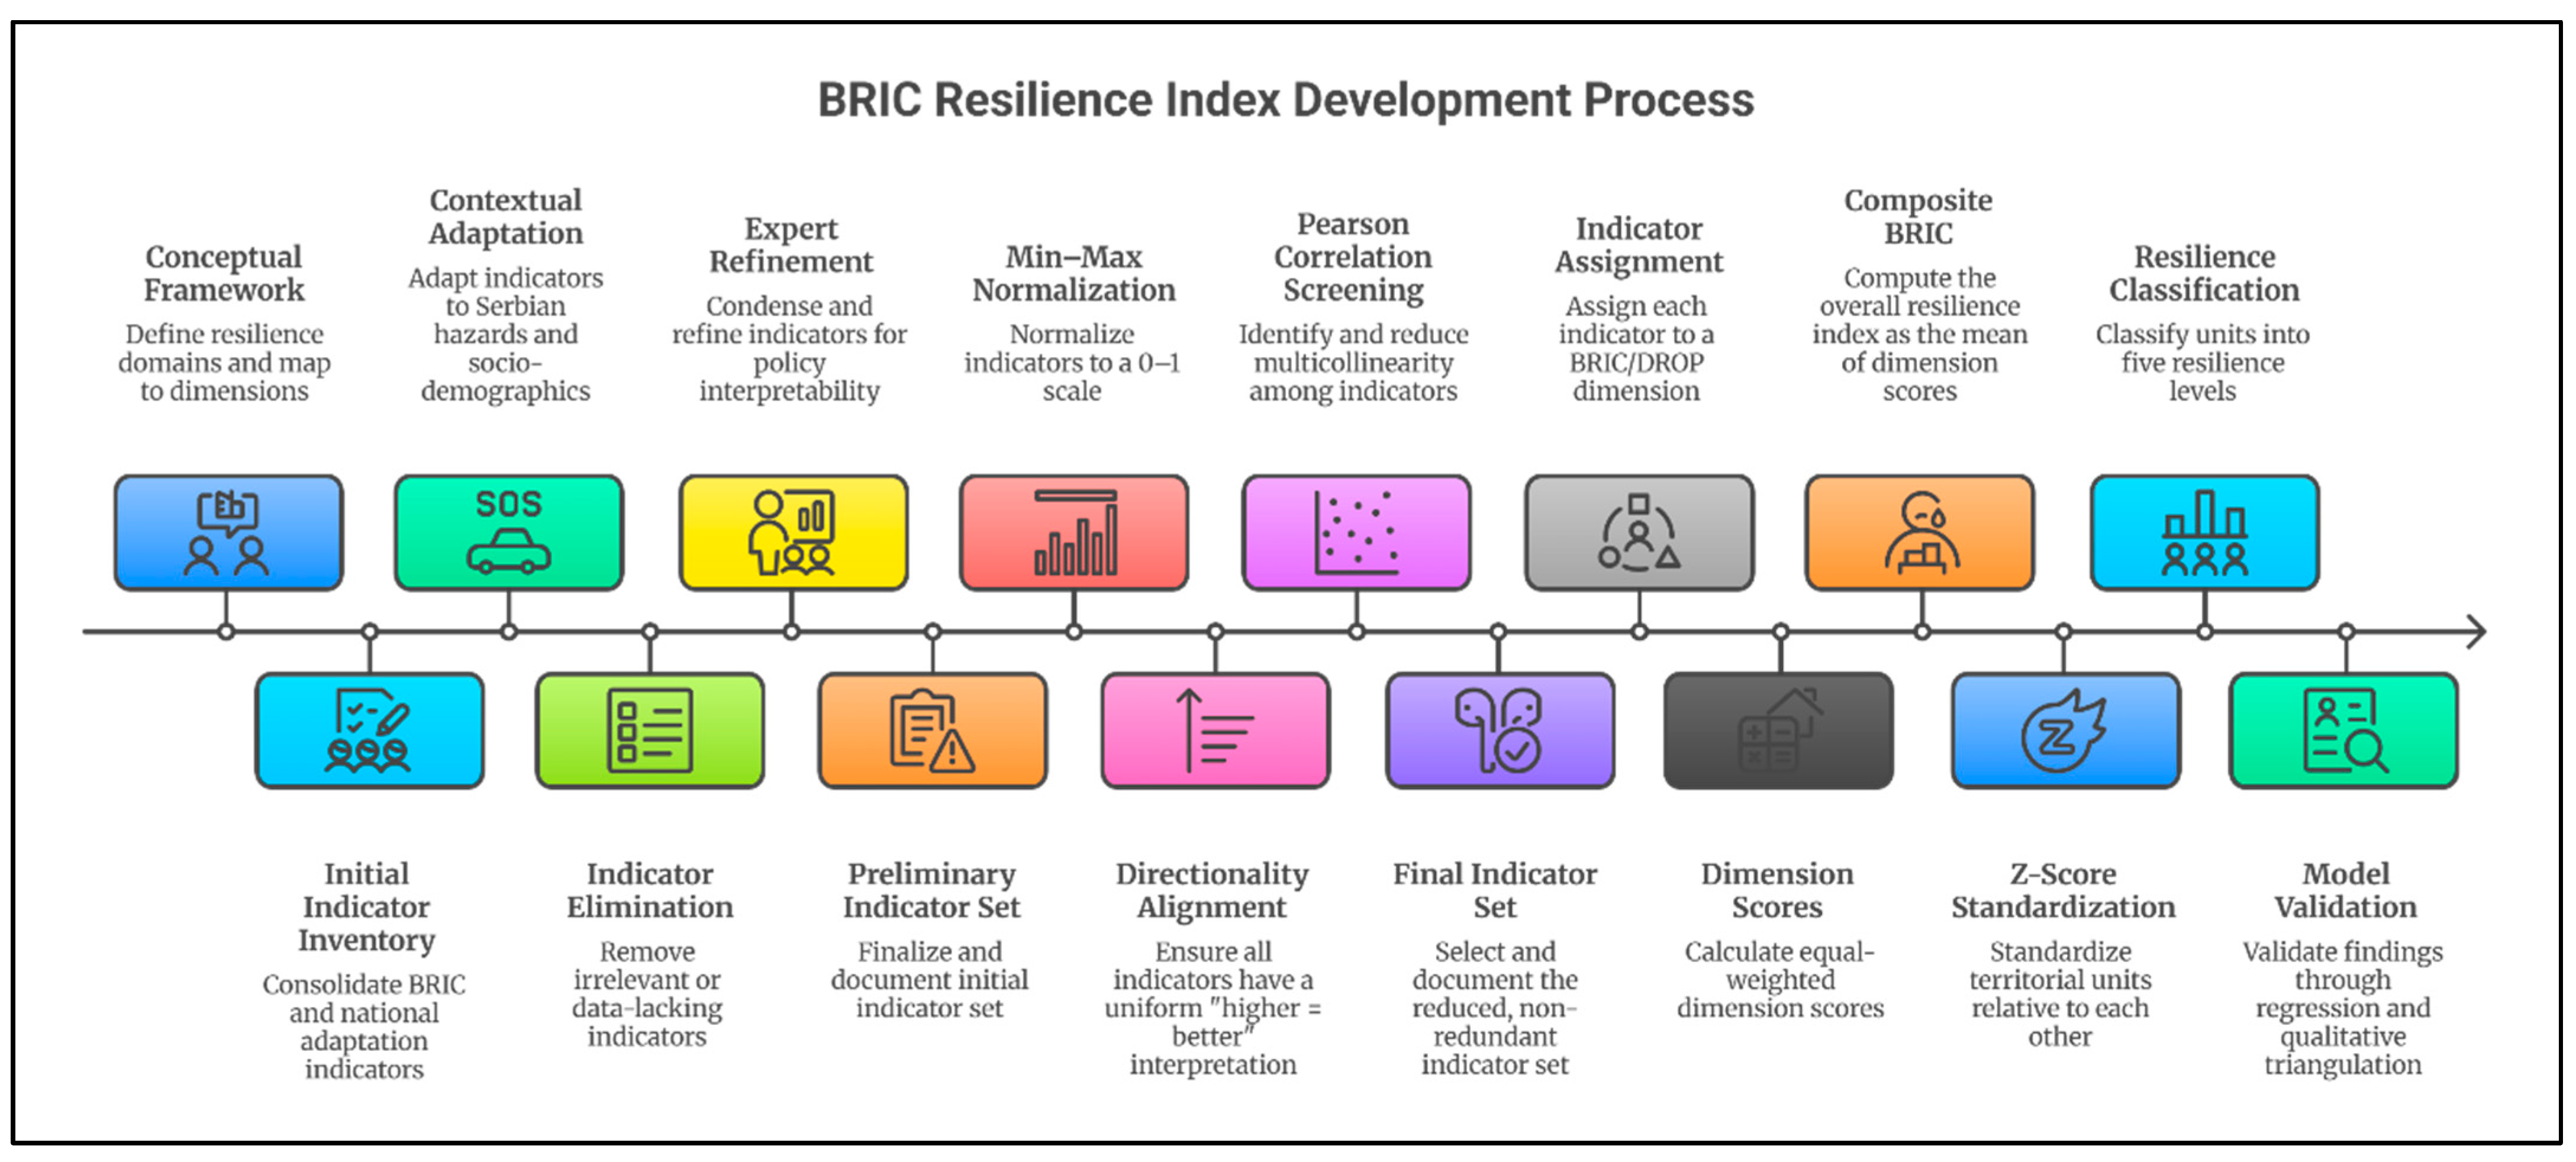
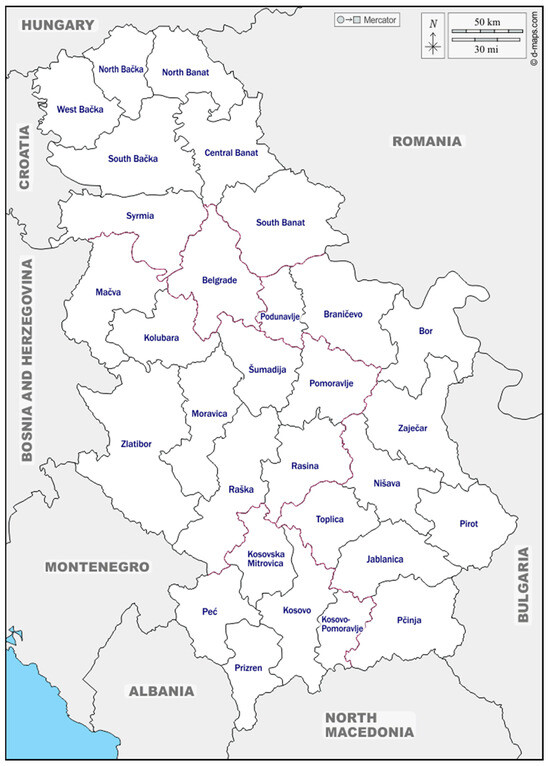
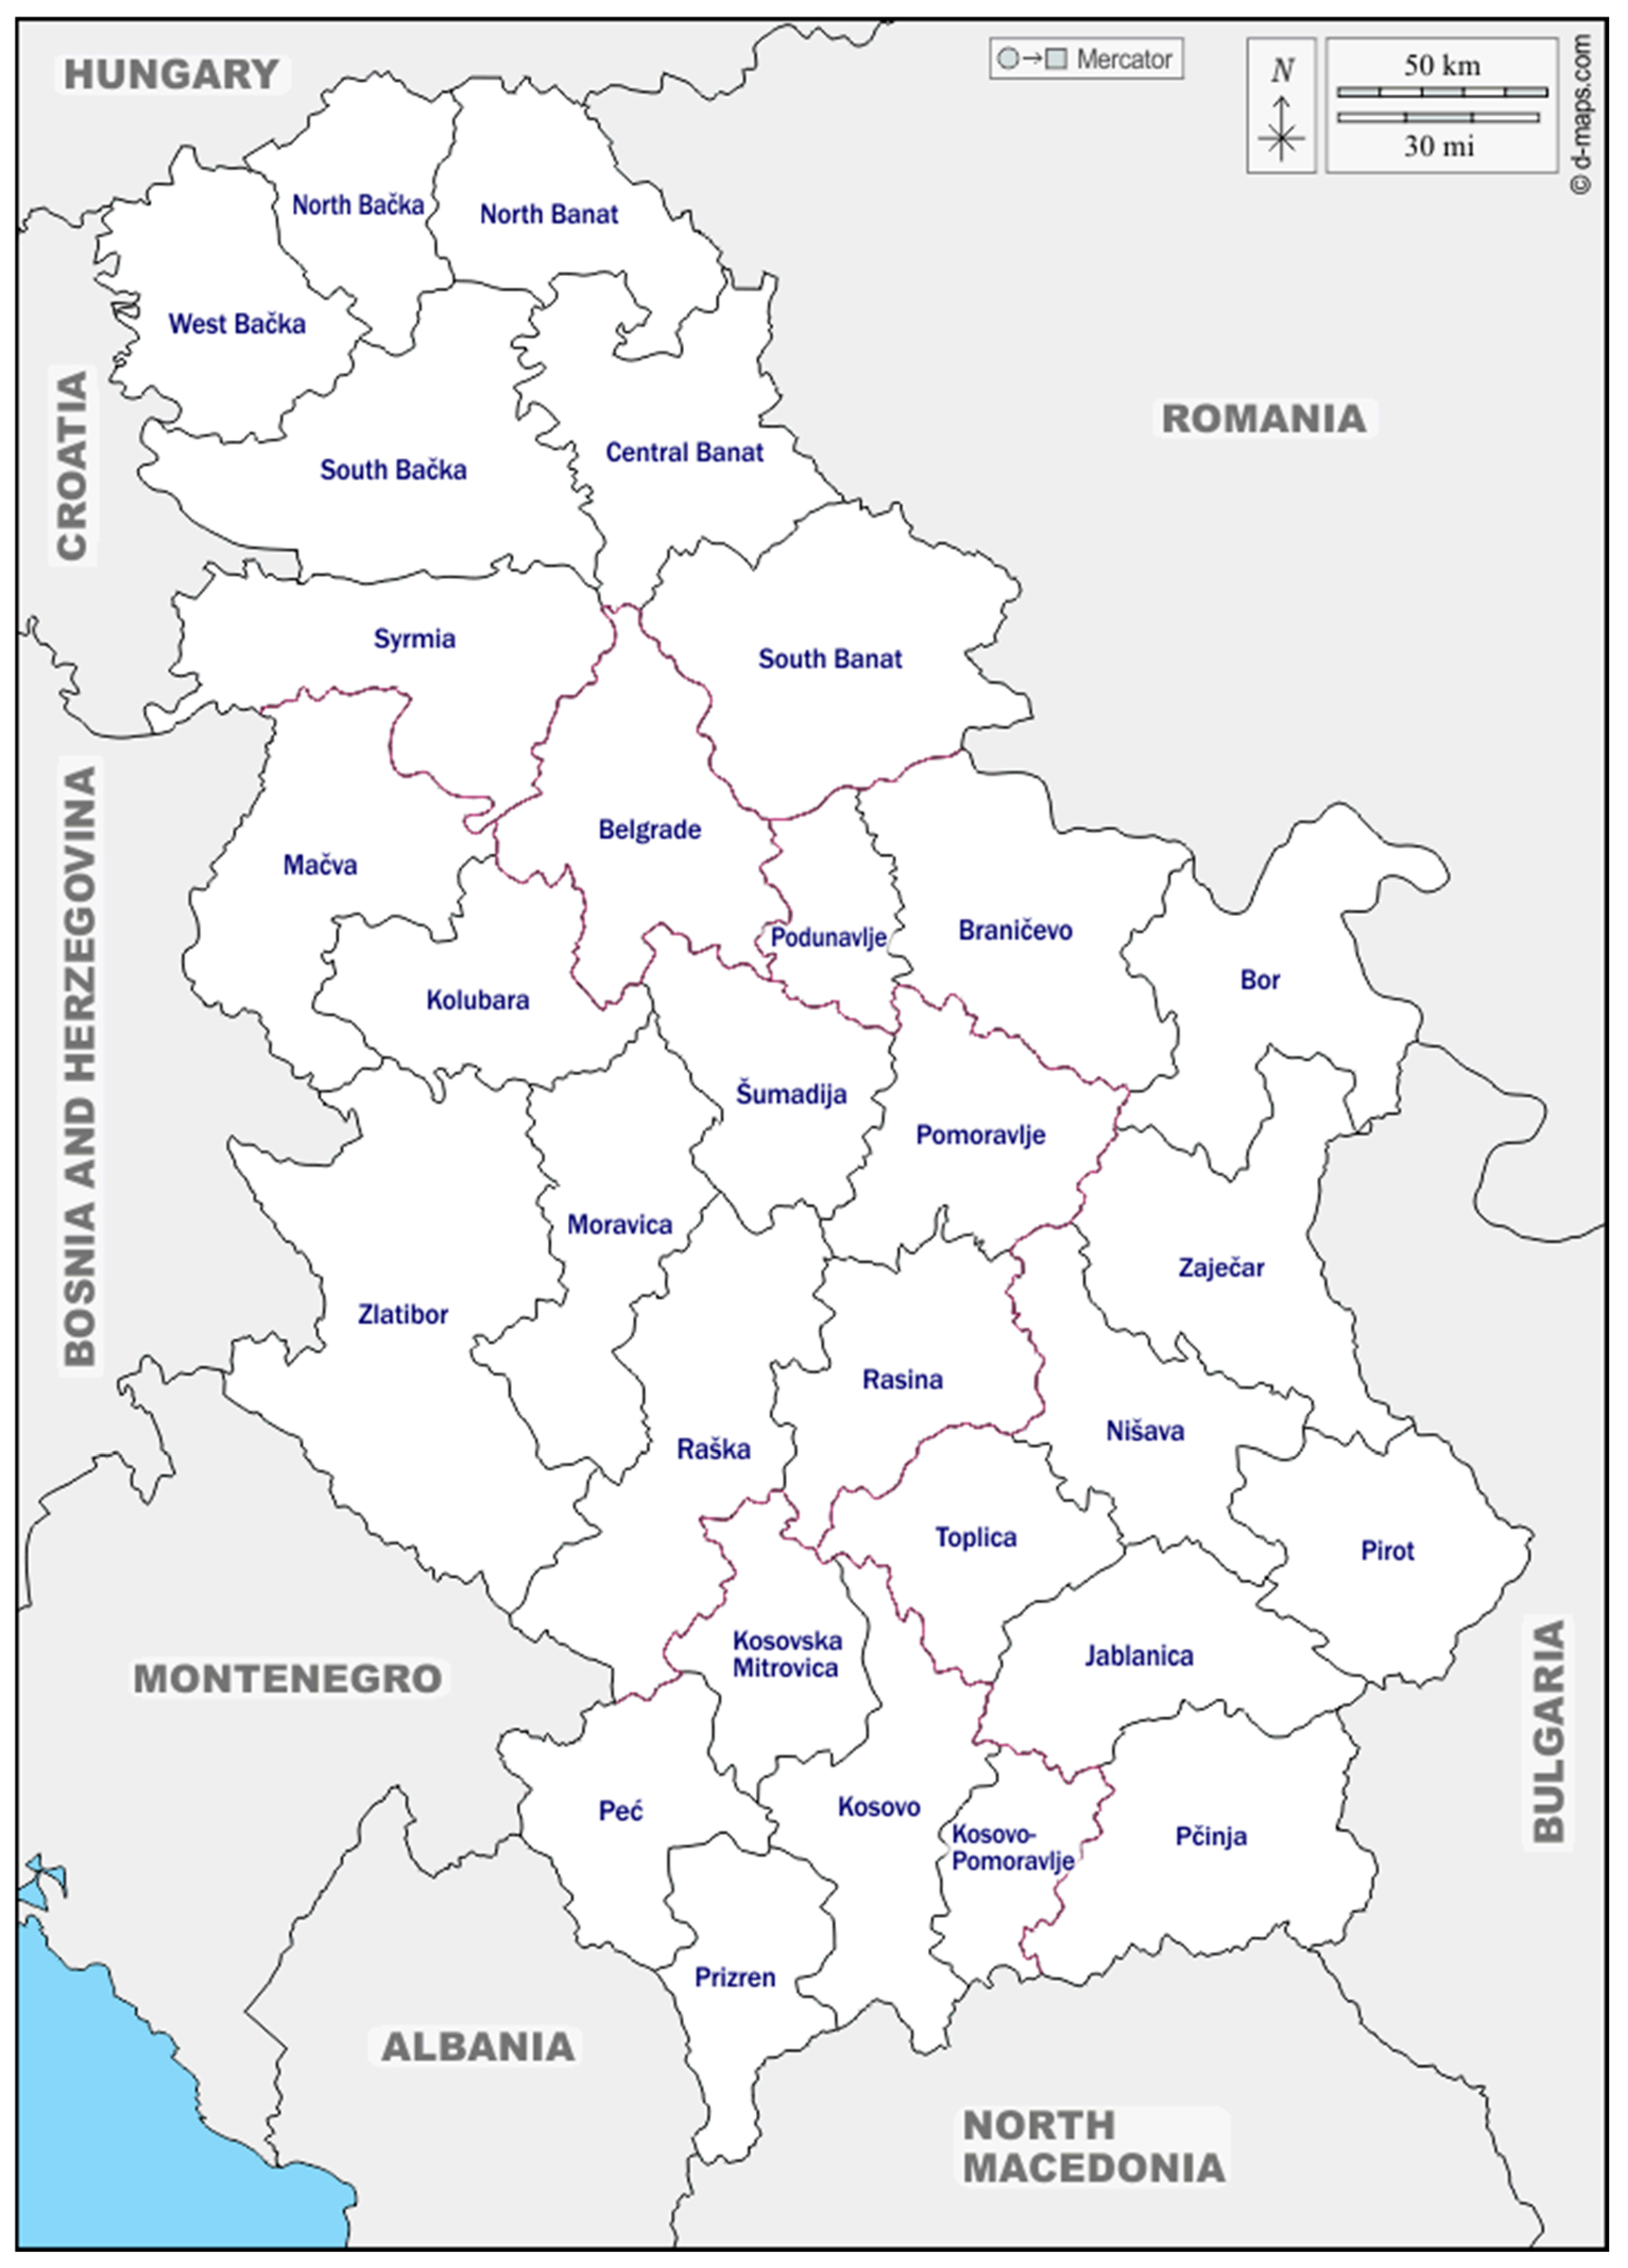
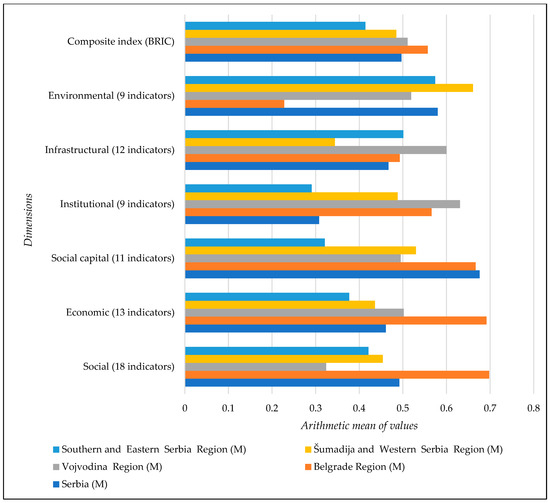
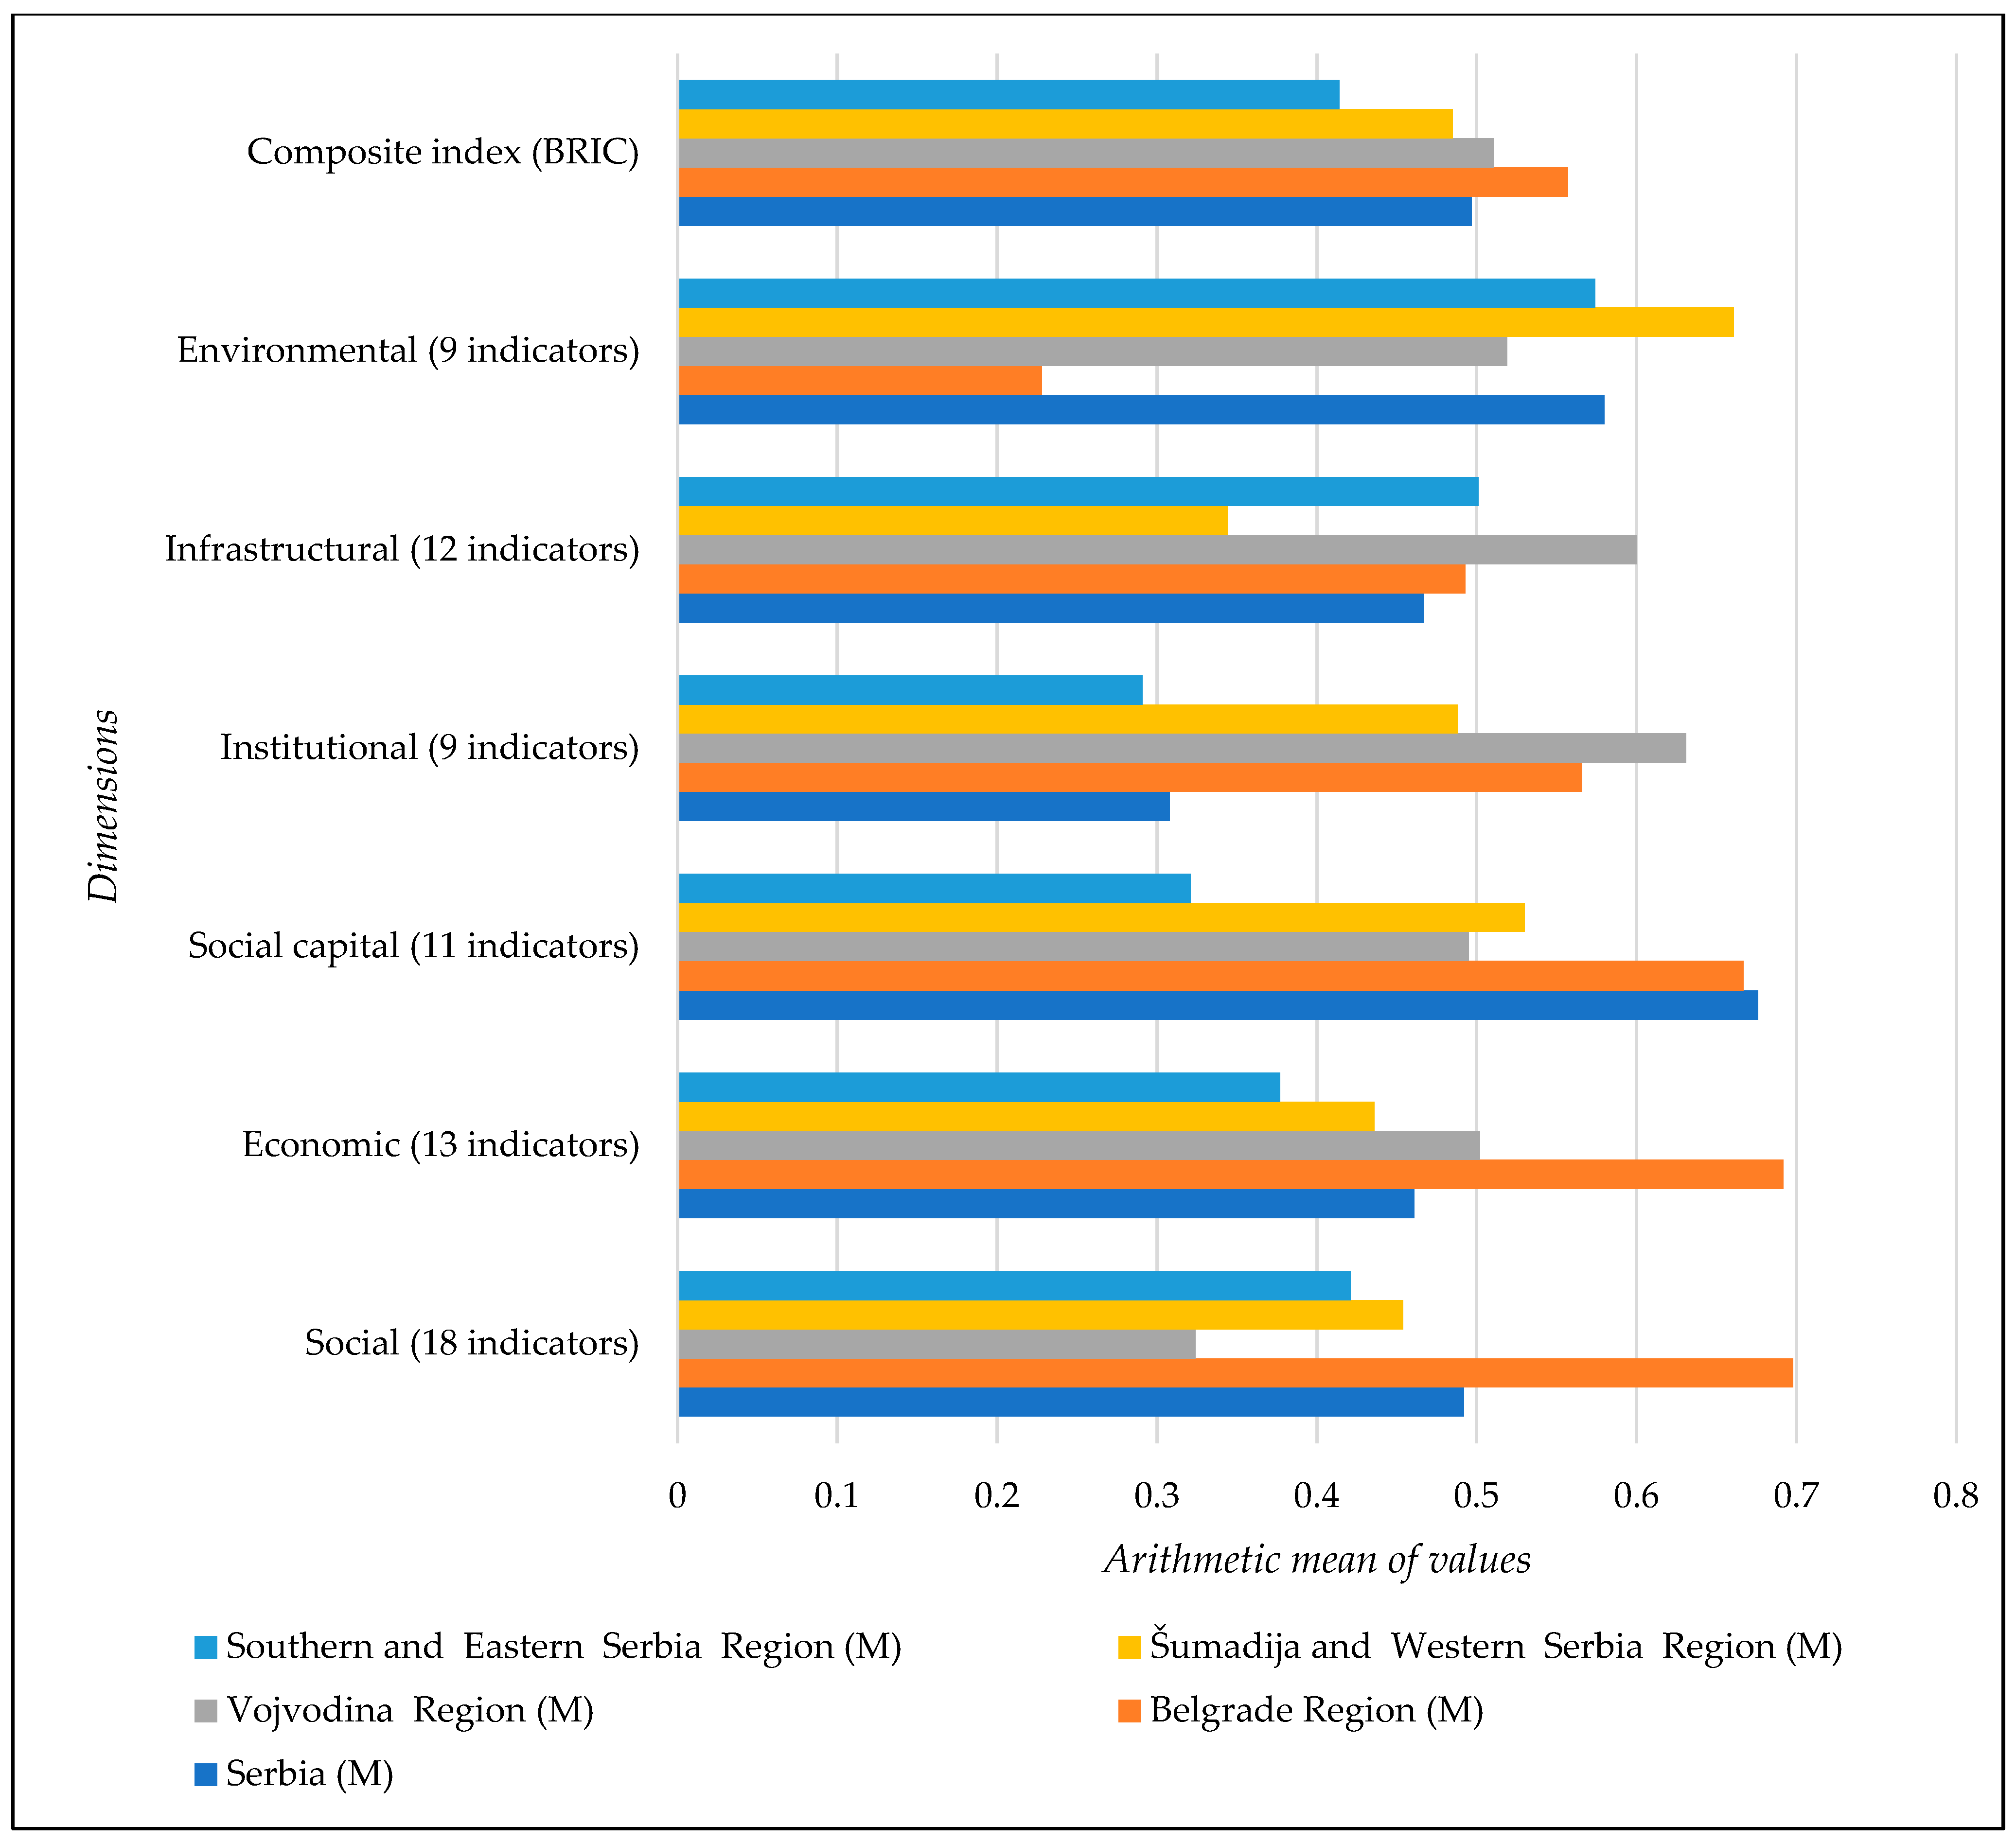
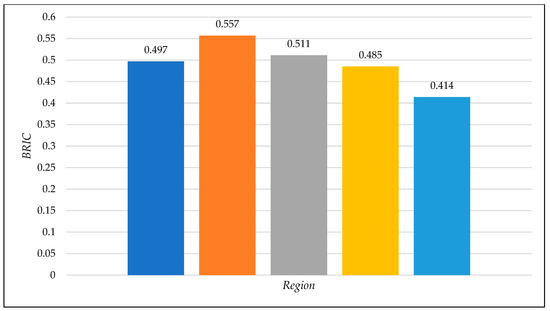
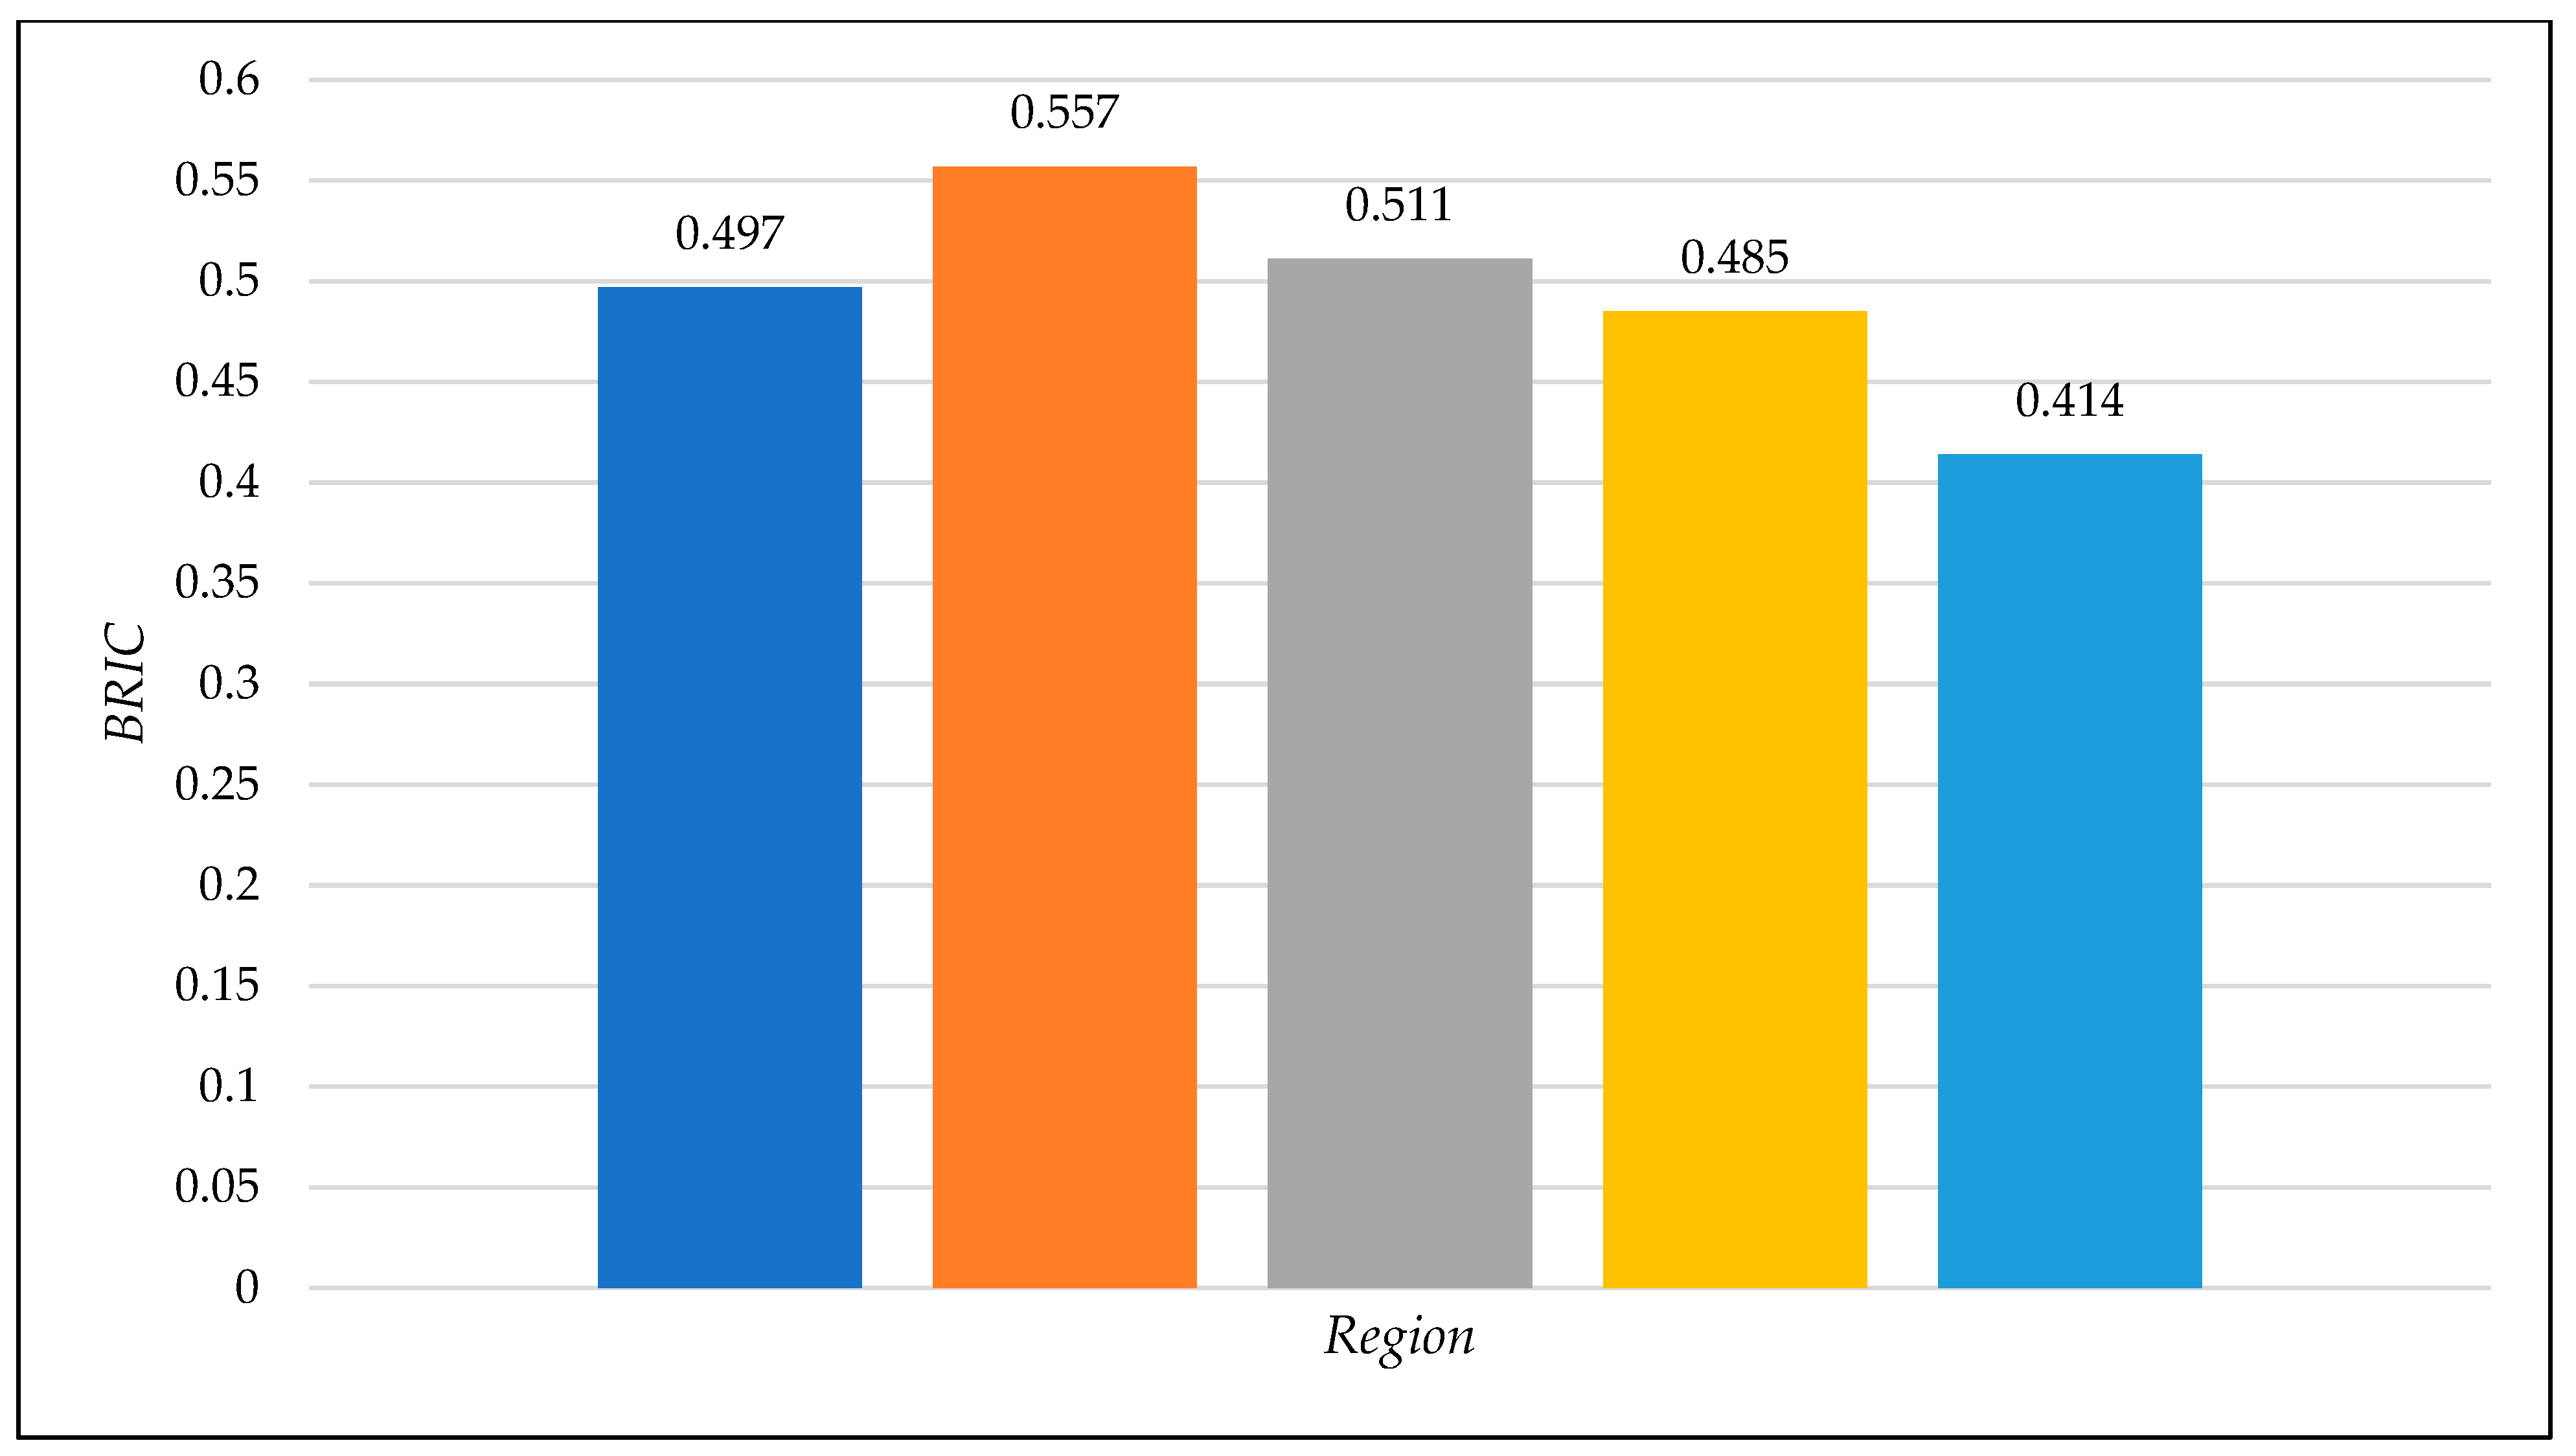
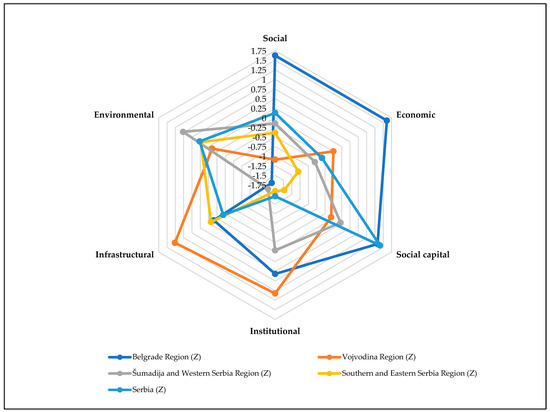
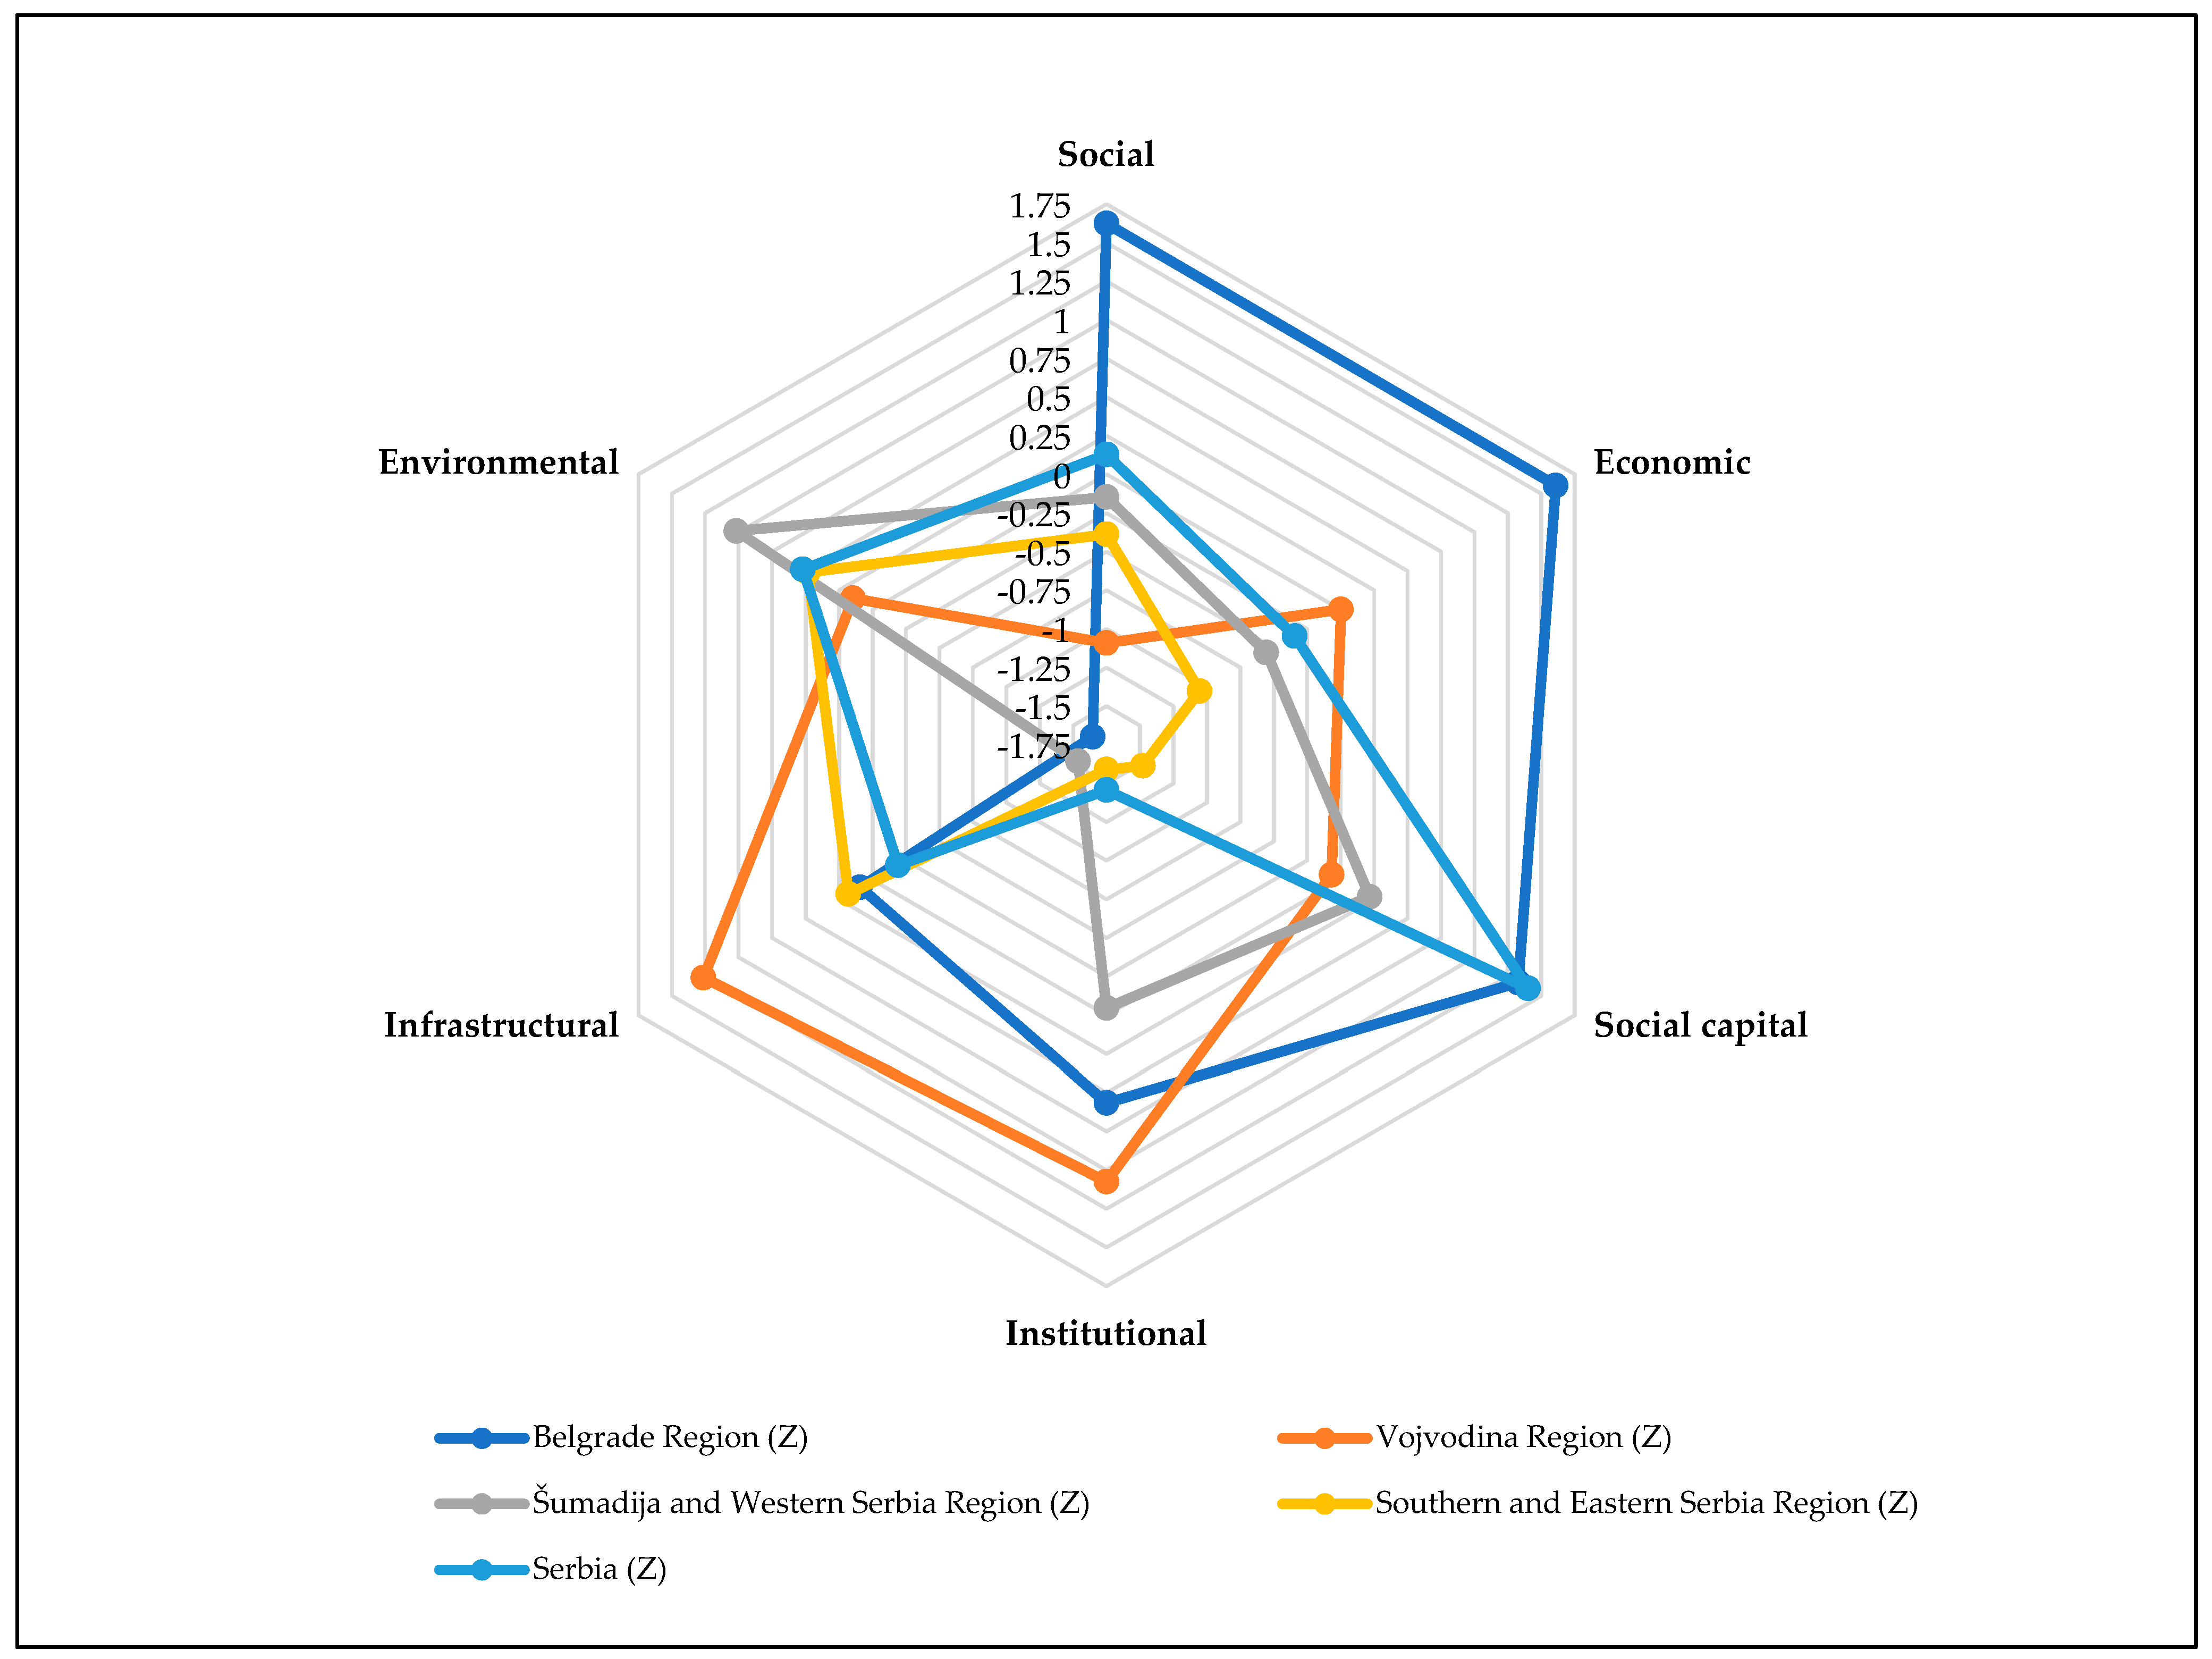
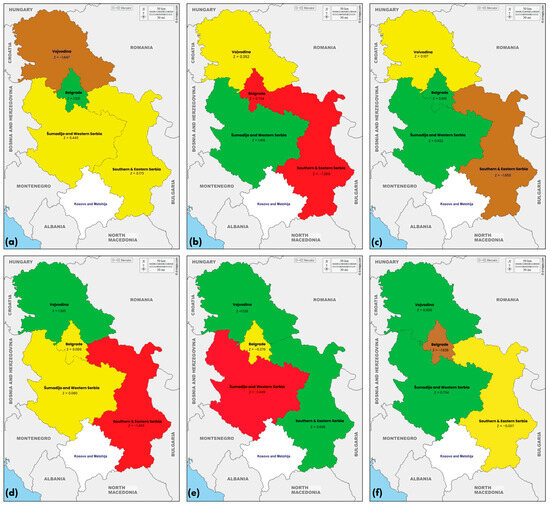
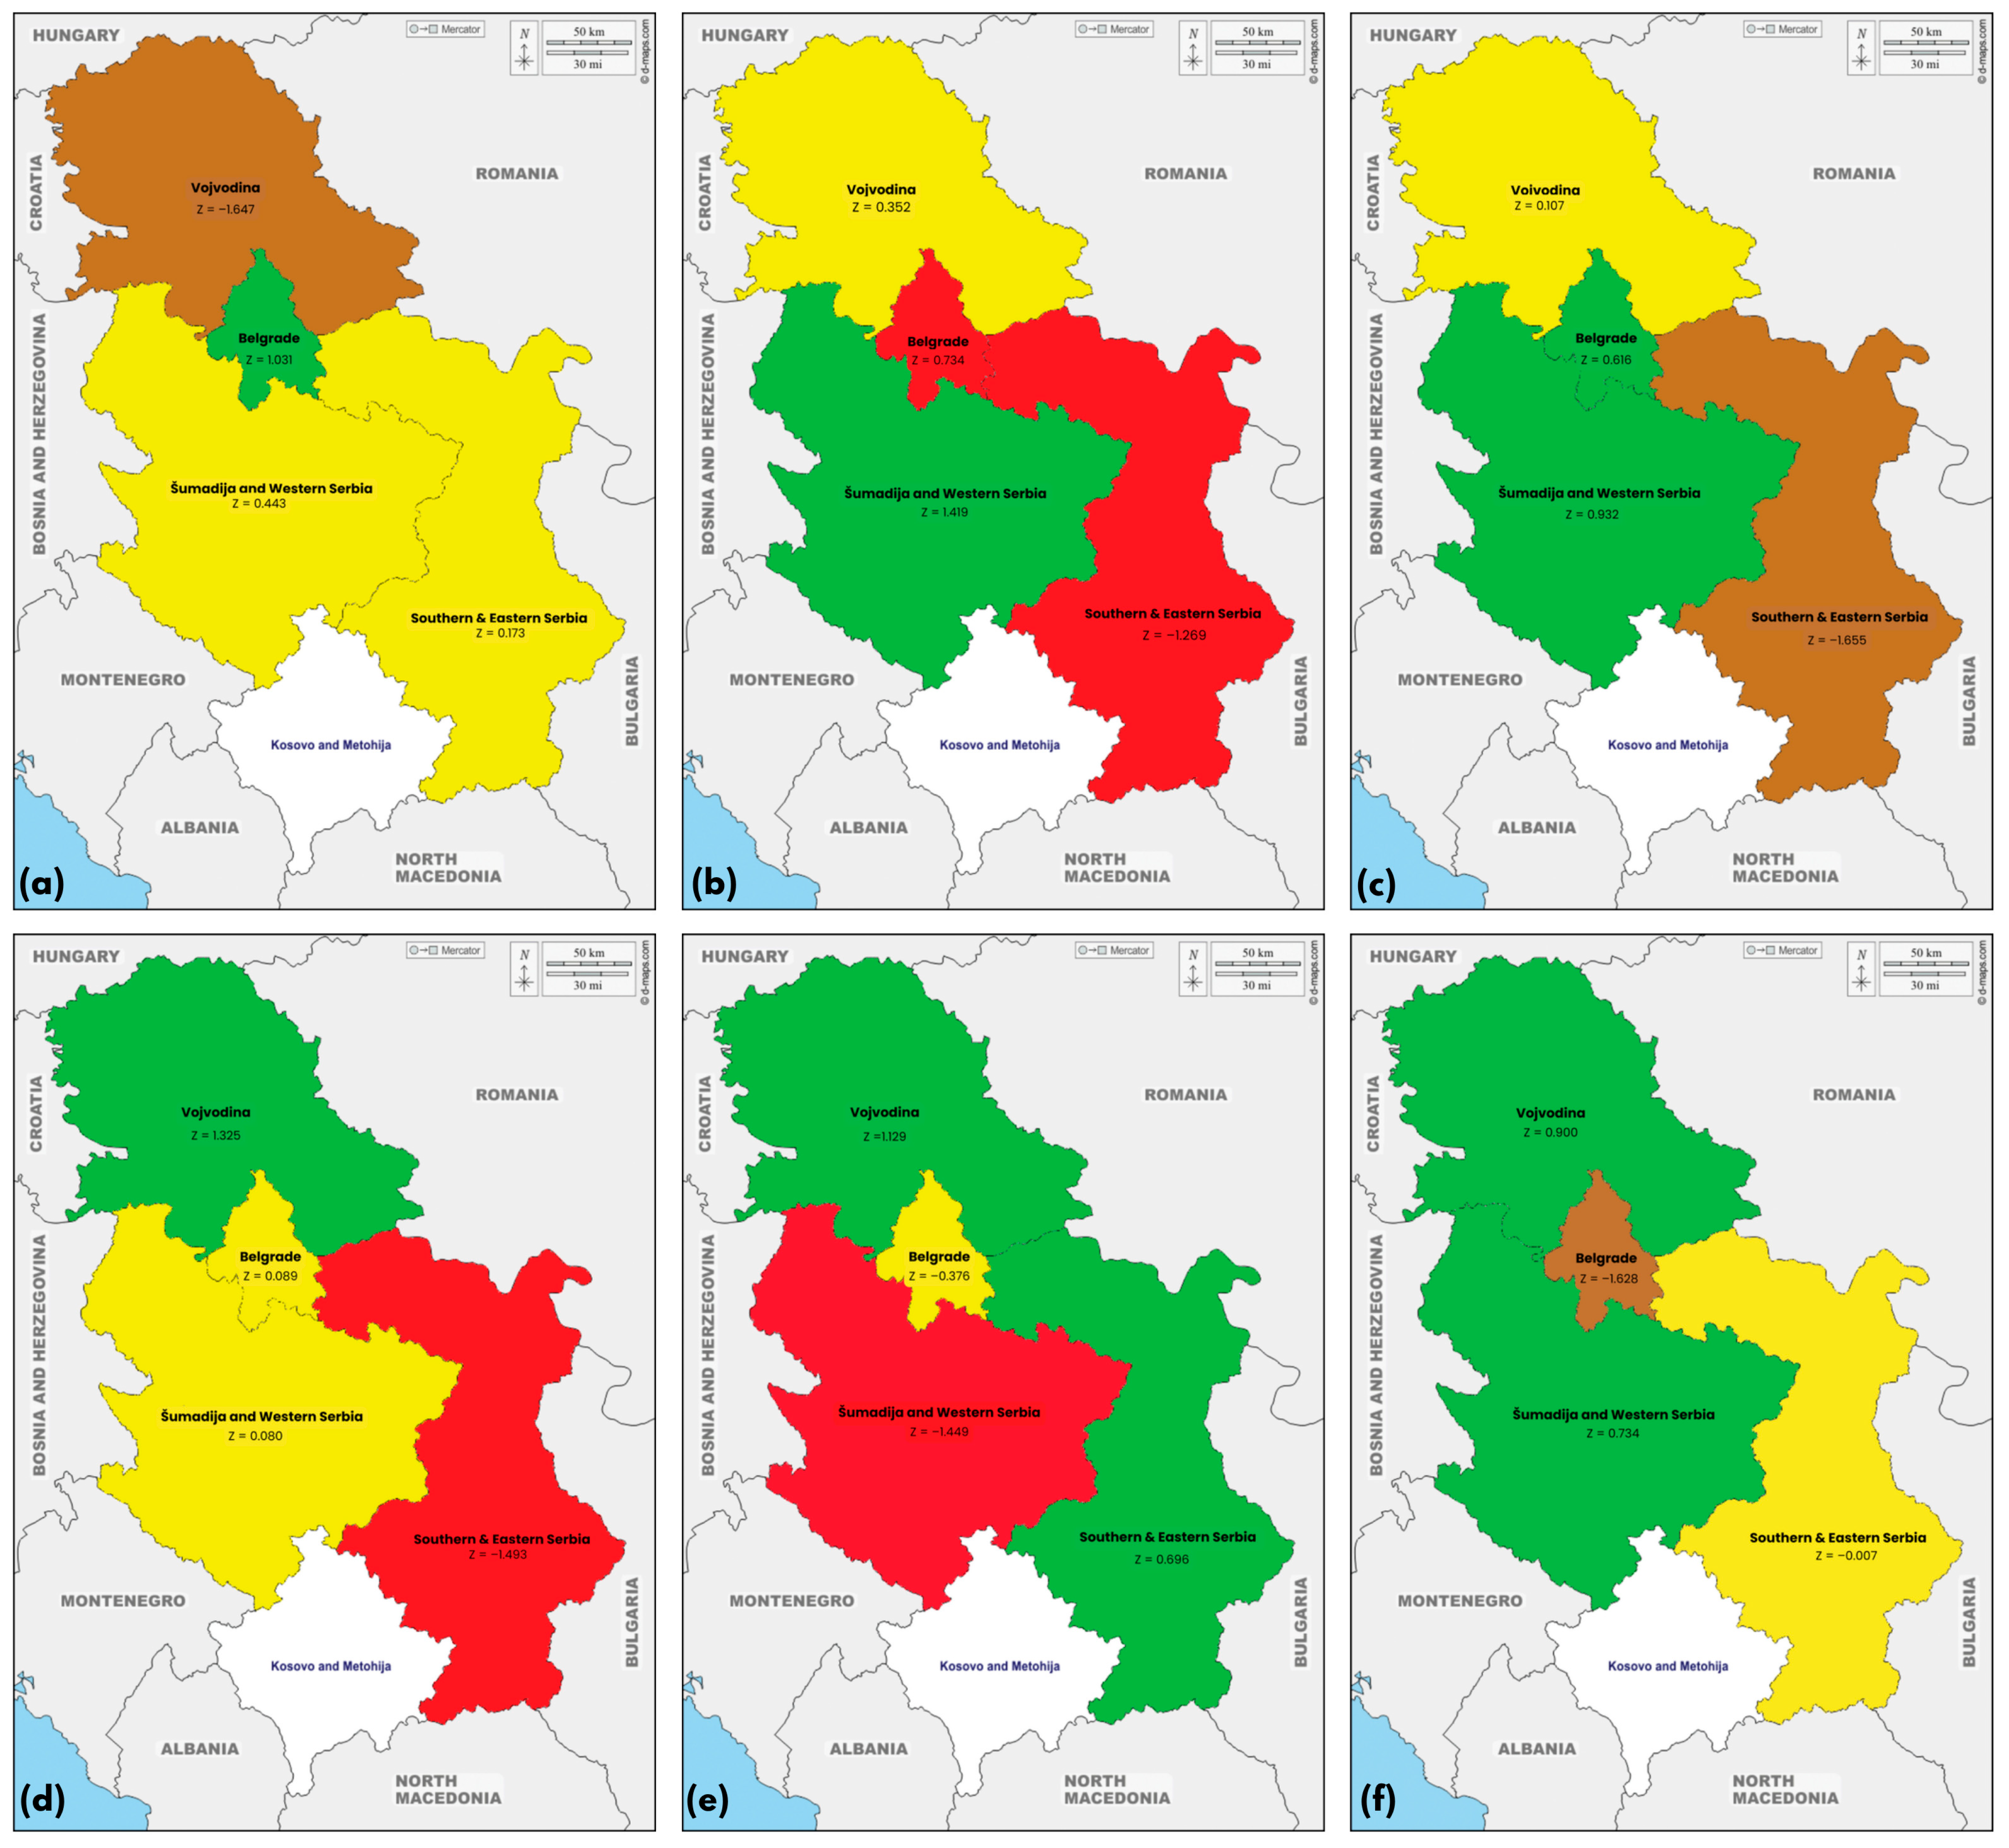

Disclaimer/Publisher’s Note: The statements, opinions and data contained in all publications are solely those of the individual author(s) and contributor(s) and not of MDPI and/or the editor(s). MDPI and/or the editor(s) disclaim responsibility for any injury to people or property resulting from any ideas, methods, instructions or products referred to in the content. |
© 2026 by the authors. Licensee MDPI, Basel, Switzerland. This article is an open access article distributed under the terms and conditions of the Creative Commons Attribution (CC BY) license.