


Abstract
This study presents the first comprehensive soil gas survey across southern Uruguay’s H2 prospective terranes. A pre-field trip selection was done on the basement rock nature, as well as vegetation anomalies in subcircular depressions and fault presence. The Neoproterozoic terrane, north of Punta del Este, and the Archean Rio de la Plata Craton, north of Montevideo, as well as along the suture zones between the two, were targeted. Our findings reveal substantial H2 concentrations, significantly outperforming many established basins worldwide. The suture zones act as critical migration conduits for H2 coming from a deeper structural level. Slightly abnormal helium signatures confirm an active, deep-sourced fluid system, particularly within the Sierra Ballena and Cordillera shear zones. The Archean Rio de la Plata Craton appears promising but has only been partially sampled and warrants further investigation. These results underscore the high potential of Uruguay as a new frontier for natural hydrogen exploration.
1. Introduction
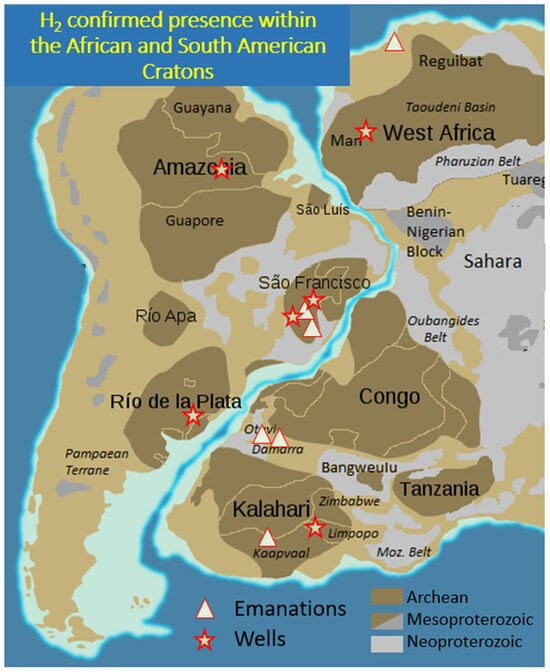
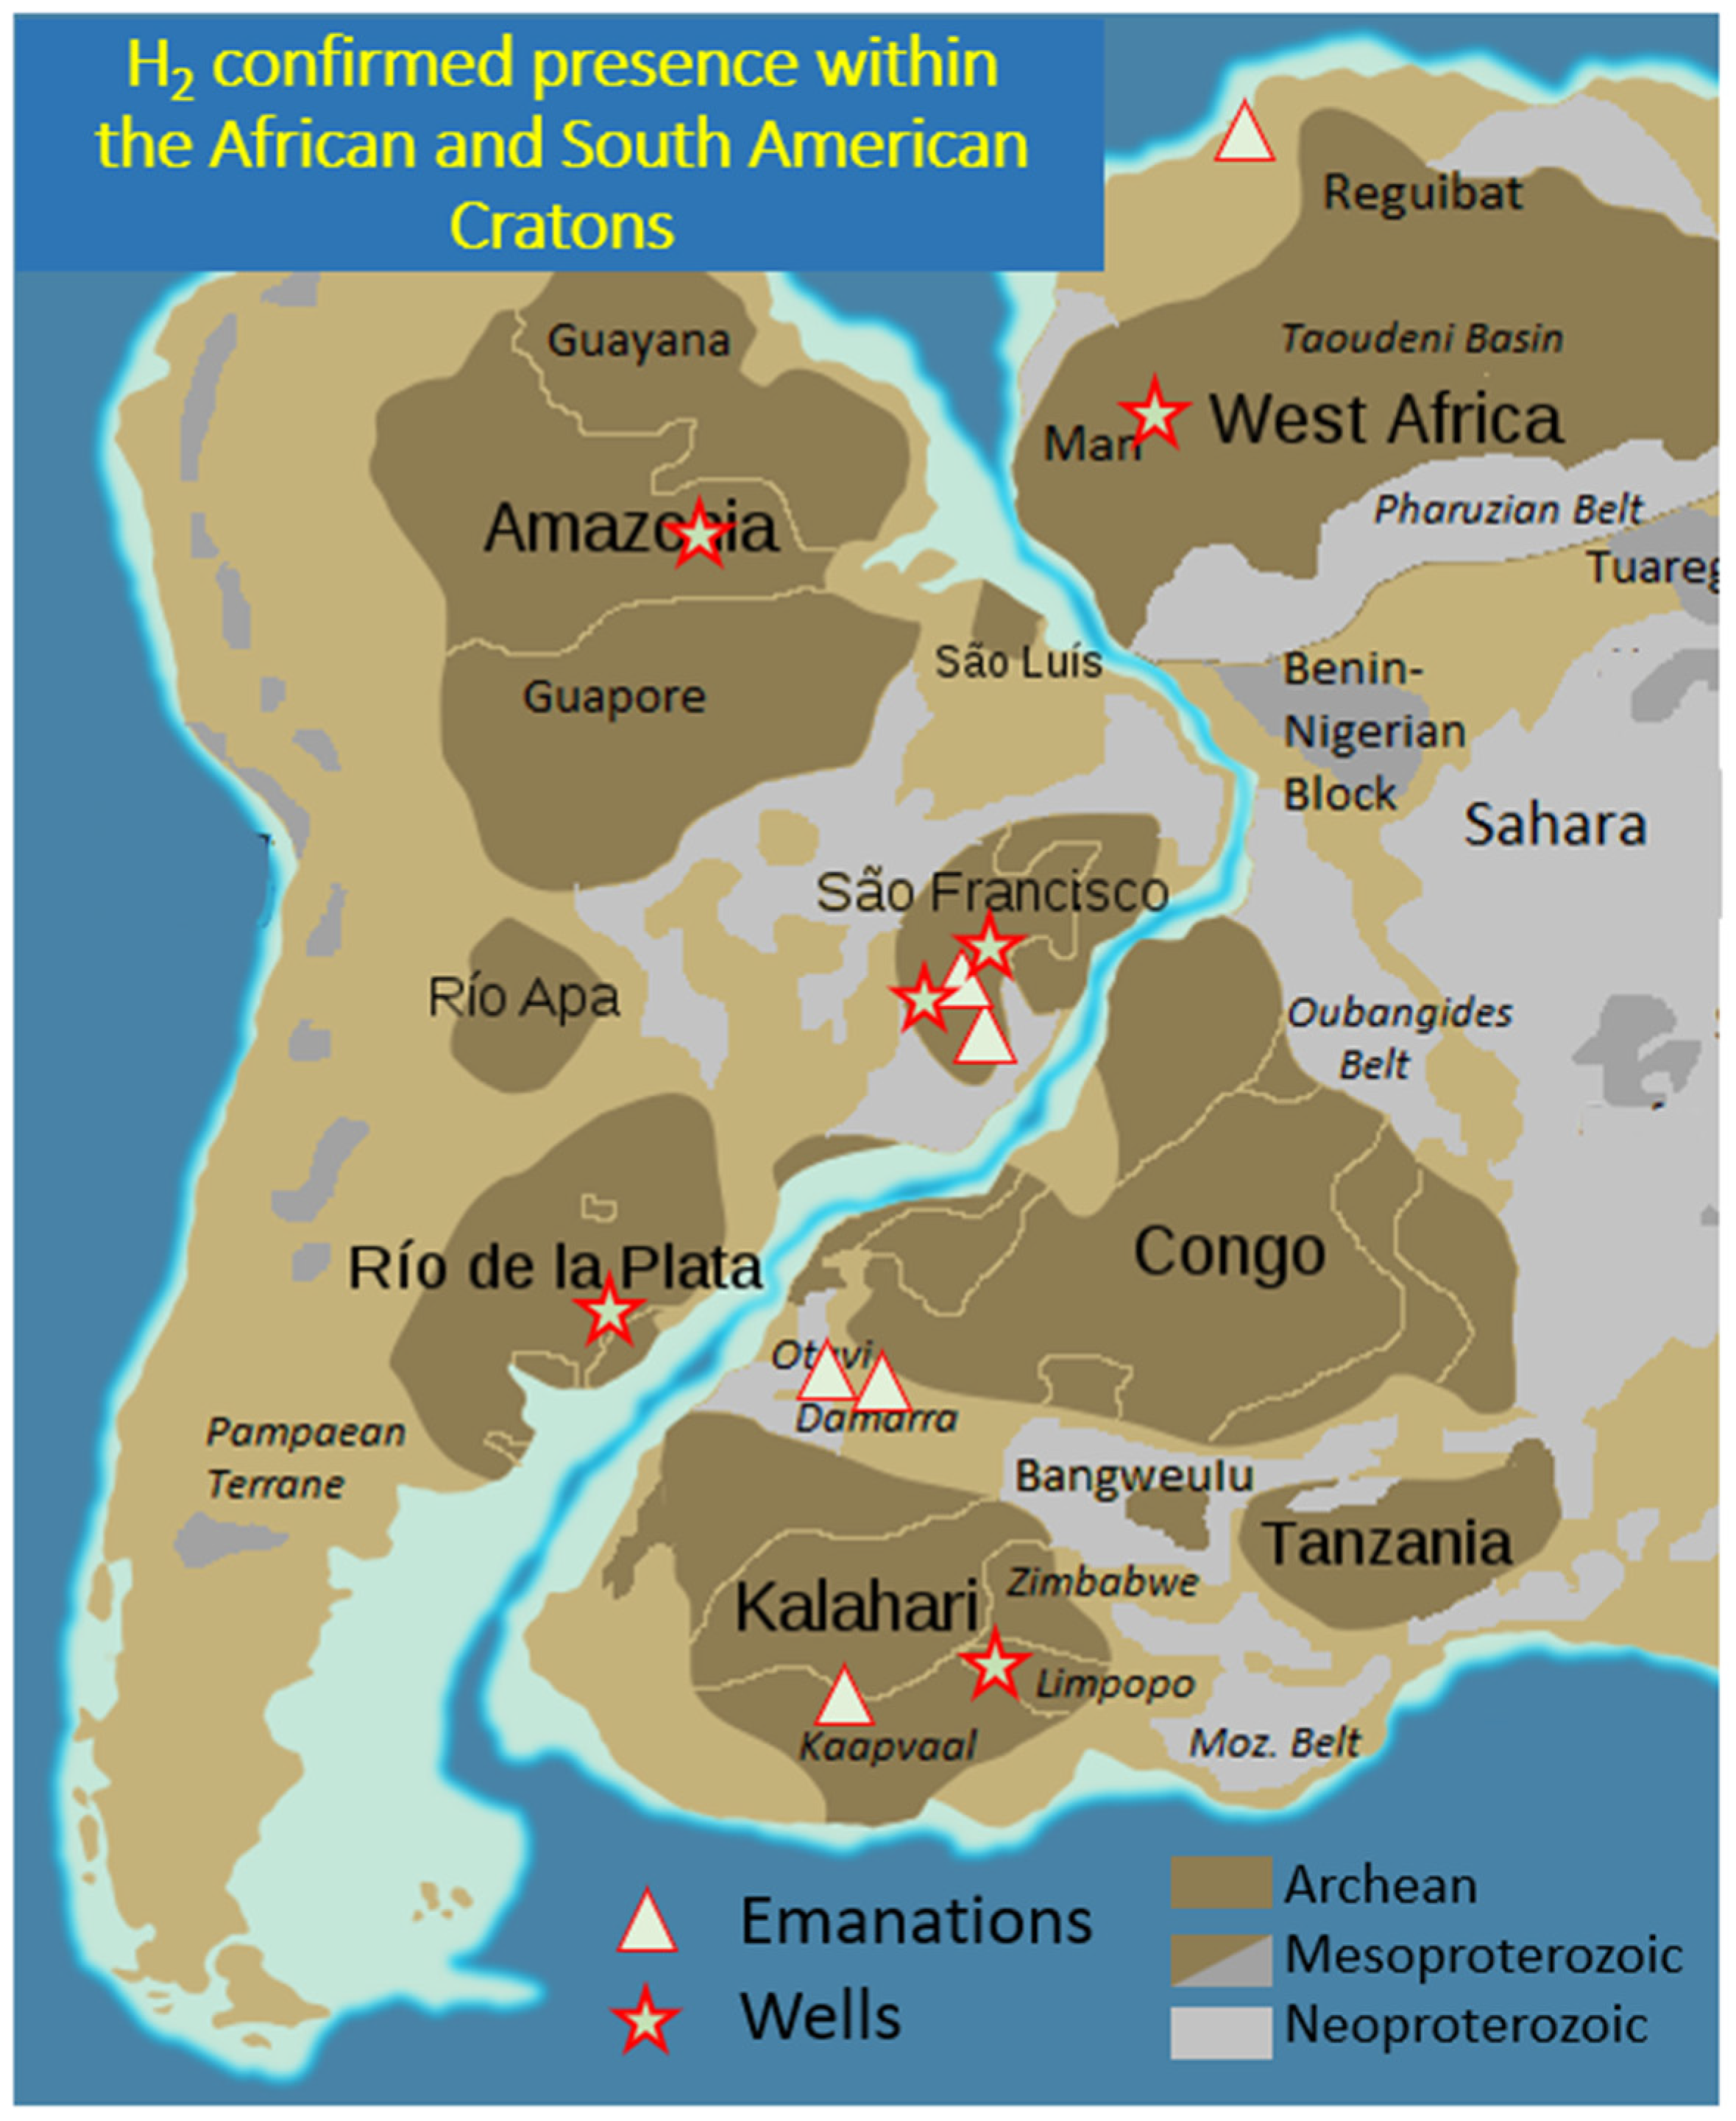
Natural H2 exploration is currently active in various parts of the world [1,2,3] in the hope of reducing the carbon footprint of human activities as H2 is a naturally carbon-free fuel. Cratons, both Archean and Neoproterozoic, have been shown to contain numerous H2-rich areas [4]. These have been identified in Mali [5], in Russia [6], in Namibia [7,8], in Australia [9] and in Brazil [10,11], among others. The H2 could be generated either by radiolysis [12,13] or by oxidation of the Fe-rich facies, such as Banded Iron Formation (BIF) [14], biotites in the granites [15] or greenstone belts [16]. In Uruguay, the Rio de la Plata Craton faces the Kalahari Craton in Namibia, where H2 has already been confirmed (Figure 1). It is, therefore, worthwhile to study the area. Potential H2-generating rocks have been mapped by [17], but no data has yet been published about the presence of natural H2 in the subsurface. Here, we present a set of new data on soil gas and some laboratory measurements that confirm the high potential of the country, at least of the southern central part, where the data have been collected. Measured helium anomalies confirm deep fluid transport to the surface.
Figure 1.
Cratons of South America, their relationship with the African ones and the presence of H2 already confirmed by well data or soil gas emanation measurements. Data from Amazonia [4], São Francisco [10,11], Rio de la Plata for the Brazilian part/Paraná Basin [18], Damara Belt, Namibia [7,8], South Africa [12], Mali [5,19], and Morocco [20].
1.1. Geological Setting of Uruguay
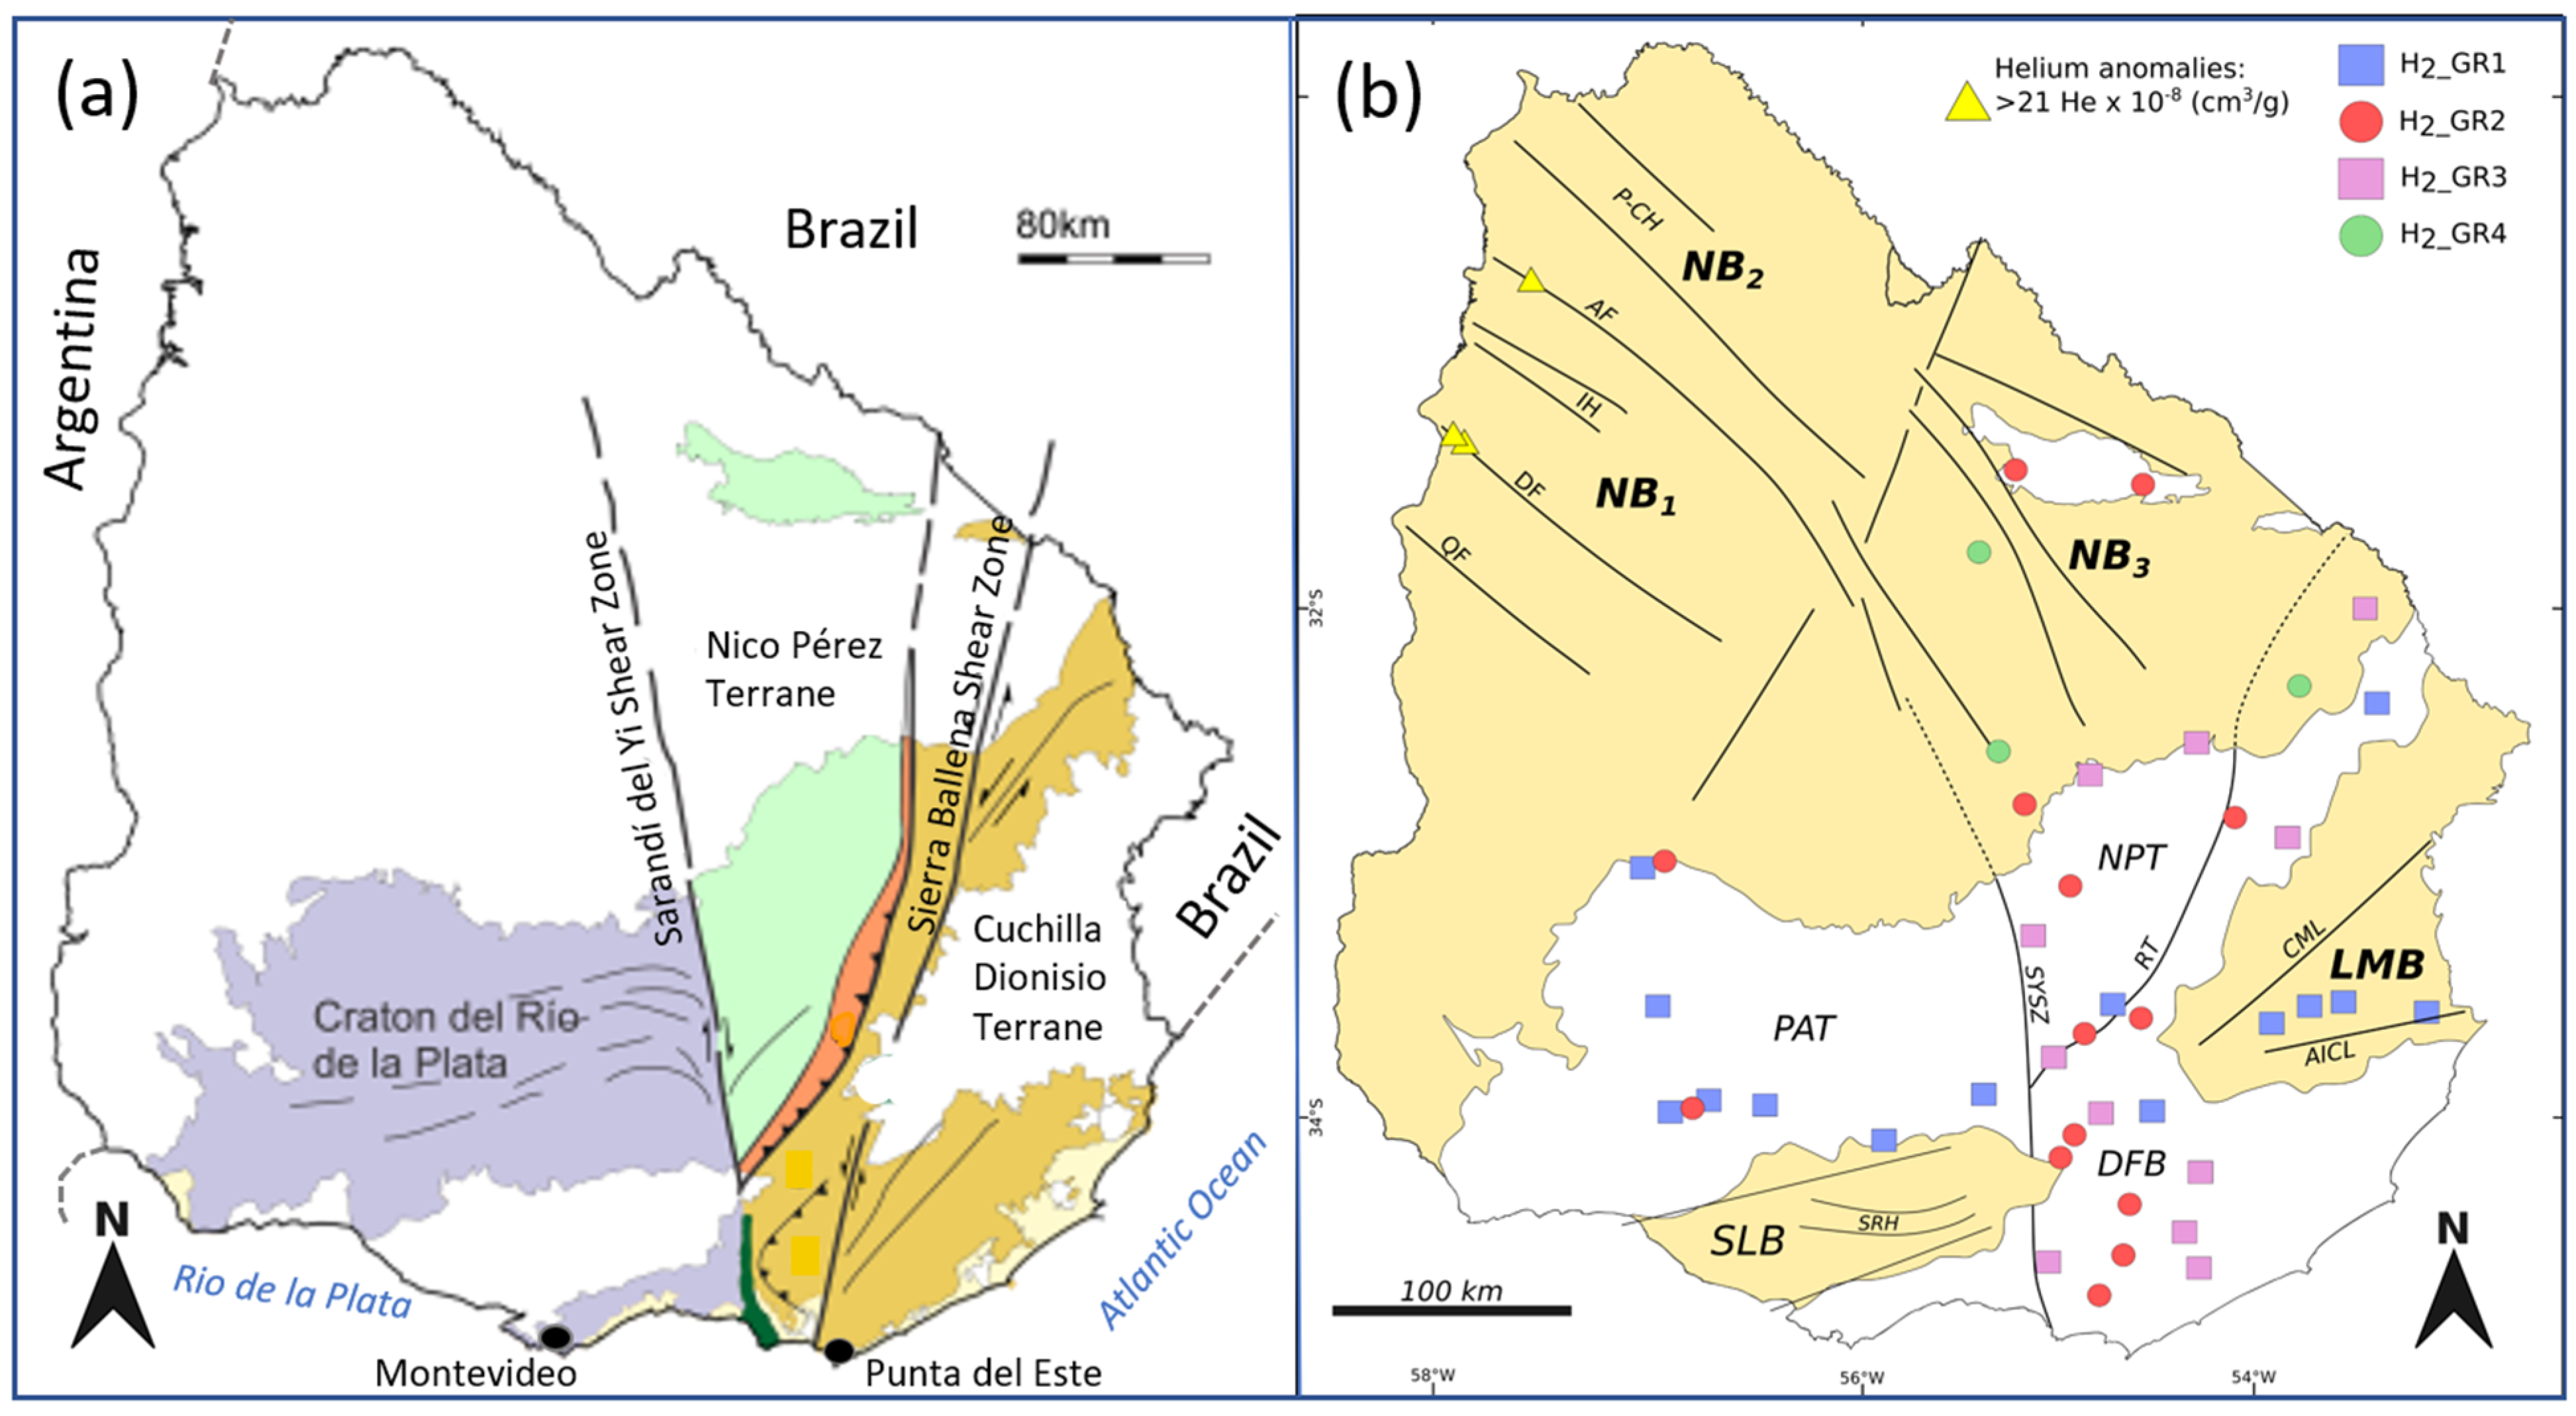
Under the umbrella term of the Rio de La Plata Craton, Uruguay’s geology consists of a Precambrian basement and three main sedimentary basins [21,22,23]. The basement is divided into three primary domains (Figure 2) from west to east:
- Piedra Alta Terrain (PAT): A Paleoproterozoic unit featuring metamorphic belts, granite-gneiss areas, and the Florida Dyke Swarm.
- Nico Pérez Terrain (NPT): A central region of Archean to Paleoproterozoic rocks reworked during the Brazilian-Panafrican cycle.
- Dom Feliciano Belt (DFB): An eastern belt formed during the Brazilian-Panafrican cycle (750–550 Ma), containing supracrustal rocks and granitic intrusions [24].
And there are three principal onshore basins:
- Norte Basin (NB1 to NB3, Figure 2): The Uruguayan portion of the Paraná Basin. It contains Paleozoic to Mesozoic sedimentary rocks and thick basalt flows (up to 1000 m). Its infill spans four mega-sequences: Devonian marine, Carboniferous-Permian glacial/fluvial, Jurassic-Cretaceous volcanic/continental, and Upper Cretaceous fluvial deposits [25].
- Santa Lucía Basin (SLB): A southern pull-apart basin featuring Mesozoic continental deposits and basaltic flows.
- Laguna Merín Basin (LMB): An eastern basin characterized by Jurassic-Cretaceous igneous rocks and a Cenozoic sedimentary cover [26].
Figure 2.
(a) Major geological provinces of Uruguay, modified from [27], (b) presence of H2_GR in Uruguay modified from [17]. H2_GR1: mafic and ultramafic rocks, H2_GR2: iron rich sedimentary or intrusive rocks, H2_GR3 radioactive facies, H2_GR4 organic rich rocks [28].
As stated before, Uruguay is surrounded by countries where natural H2 has already been mentioned. Northward in Brazil, wells with up to 8% of H2 have been reported in the Paraná Basin, mainly in the Paleozoic sediments [18]. The authors proposed, therefore, the coal of this basin as the source, but they do not disregard a deeper origin. Eastward, in Namibia, on the other side of the Atlantic Ocean, many vegetation anomalies (Sub Circular Depression, SCD) are associated with active flow of H2 in the soil [7,8]. In contrast to Brazil, the source of H2 appears to be different, and the authors favor H2 generation related to the alteration of Banded Iron Formation (BIF). Taking all these positive factors into account, it therefore seems reasonable to ask about the potential of Uruguay to contain natural H2.
1.2. Natural H2 Generation
H2 is generated in the subsurface mainly by the water-rock interaction (oxidoreduction reactions or radiolysis) or by the late maturation of organically rich rock [28]. These three main reactions and four main contexts were named from H2_GR1 to H2_GR4 by the previous authors and we will use this wording, which was also adopted by [17] who mapped them in Uruguay (Figure 2b). The water reduction is expected to be very active in presence of mafic and ultramafic rocks (reaction of serpentinization) or in the case of iron-rich sedimentary rock, such as BIFs [8,14] or siderite [29]. The BIFs, which may contain more than 50% of iron, are Archean or Neoproterozoic in age, and even if they are partially oxidized, they may still contain a large quantity of Fe2+. Iron formations are common in the South American platform and have been described in Brazil (especially in the São Francisco Craton) but also in Uruguay [30]. Radiolysis also generates H2 in the presence of H2O [31], and the late maturation of organic matter (above 250 °C [32,33]) constitute the last main processes. Other reactions may generate H2, such as the H2S oxidation [34], but it is mainly important for the volcanic area. In Uruguay, all four H2_GR are potentially present.
Serpentinization is fast at high temperature (around 300 °C, [35]) but clearly also at low temperature since H2 is observed in many ophiolitic nappes which are not so currently buried [36]. The optimum temperature rate for the H2_GR2 is lower, may be as low as 100 °C [14,37]. The radiolysis is not temperature dependent, and, as mentioned before, the late maturation of organic matter requires high temperature and is very unlikely in the first 6 km.
1.3. Natural H2 Transport, Accumulation and Dysmigration
Once generated, H2 will move through the subsurface, like all fluids, either as a free gas phase or dissolved within the formation waters, facilitated by its enhanced solubility under high-pressure, deep-subsurface conditions [38]. The H2 transport mode could be diffusive or advective but quantitative modeling indicates that the diffusion is virtually negligible, because it is too slow, at basin scale [39]. Carrier beds and aquifers serve as primary conduits facilitating long-distance H2 transport far from its generation zone [39,40]. Finally, the H2 may remain trapped as free gas in the reservoir below a seal, as in Mali [5,41], or be largely dissolved in aquifers but also reach the surface. Since H2 solubility decreases when depth decreases, exsolution is expected from the shallow aquifers, resulting in H2 emanations [39]. Additionally, reservoirs may not be perfectly sealed and may leak [42]. Features related to these emanations were first described in Russia [43] and in the US [44] and are now used daily as a proxy to de-risk H2 exploration. However, the presence of SCD is neither necessary nor sufficient to ensure the presence of an accumulation. These H2 escapes often affect the vegetation, which may disappear, as in the Minas Gerais in Brazil [10], or just be less developed, as in Colombia [45]. In all cases, vegetation indexes such as the NDVI (Normalized Difference Vegetation Index) or the SAVI (Soil Adjusted Vegetation Index) allow for the visualization of these anomalies [7].
Fault systems typically channel fluid migration, including water, hydrocarbons and other gases [46]. When the rocks are tight, bulk porosity and permeability may be very low, making fracture-related secondary permeability dominant. Consequently, the role of faults is predominant in tight-matrix, but in all cases, they play a role in the migration pathway. It has been observed regardless of the stress regime but is more pronounced when the faults are active [47]. Higher H2 contents have been observed in fault zones compared to values in the soils at larger distances from the structural discontinuities in compressive zones, such as the Pyrenean foreland [48] or the Dinarides [49], in extensional margin, such as the Perth Basin in Australia [50], or the Atlantic margin in Brazil [51]. In fault zones, the H2 signal often appears to be more constant and not subject to daily fluctuation, as observed in the soils [10,52]. In the Uruguayan craton, the rocks are rather tight and the faults are expected to play a key role in gas migration. The main ones are roughly N-S shear zones and converge toward Punta del Este (Figure 2a).
2. Methods
2.1. Selection of the a Priori Prospective Zones
In comparison to the H2 provinces in other countries, we first wanted to test the H2 presence in:
- The lithospheric shear zones (hypothesis: H2 generated in deep levels and migrating through the fault zone).
- The Neoproterozoic terranes and the Archean craton (hypothesis H2_GR2 or H2_GR3), as in Namibia.
- The area where coal seam could be present (hypothesis H2_GR4 as in the Parana Basin in south Brazil).
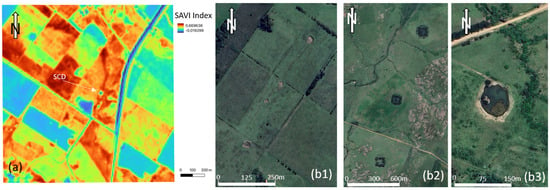
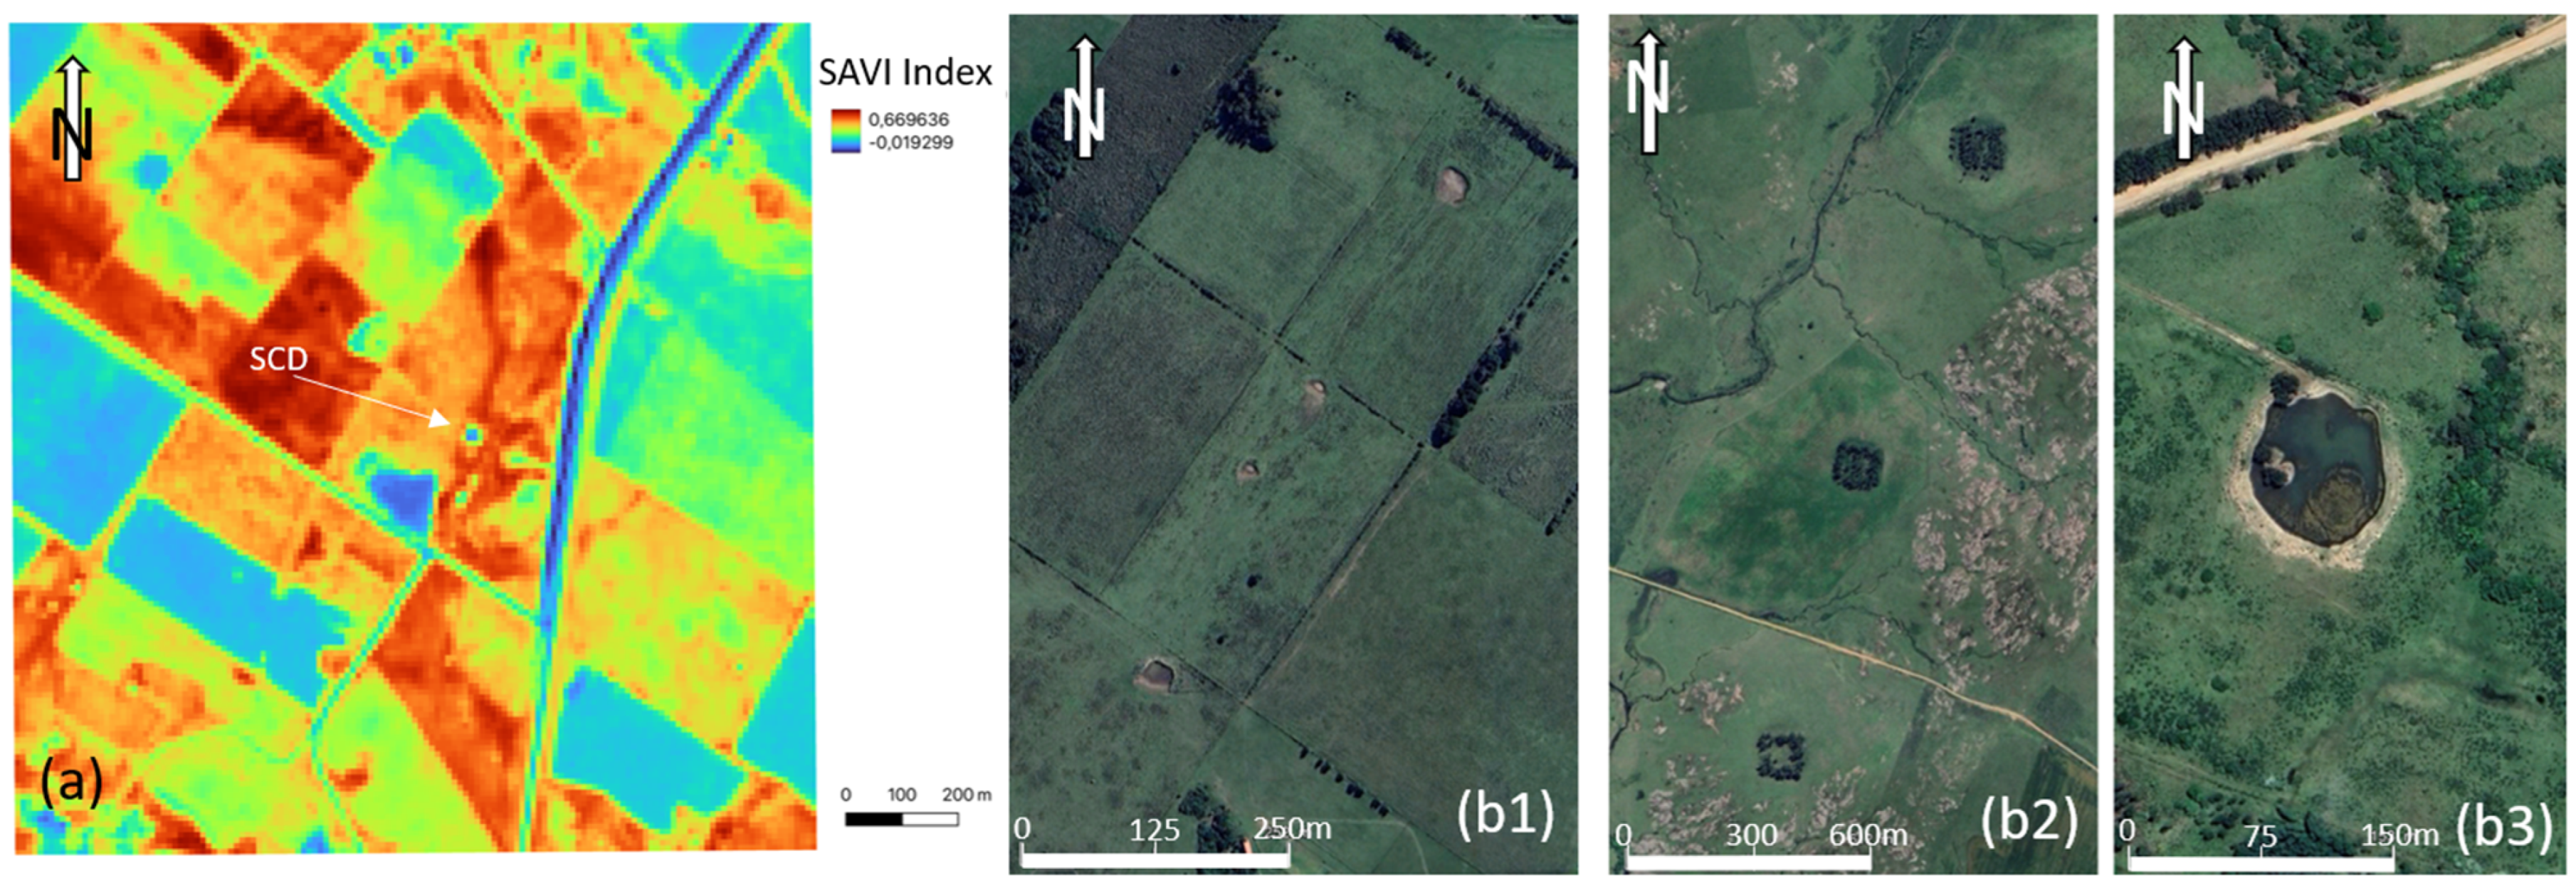
The remote sensing approach developed before the field trip allowed us to highlight the presence of many SCDs that were then targeted during the field acquisition. These SCDs were often aligned with the suture zones visible in Figure 3.
Figure 3.
Samples of SCDs that were mapped before the mission and gas measurements were taken on them. (a) Infrared vegetation index highlighting an SCD in the Rio de La Plata area, (b) satellite (GoogleEarth Pro) images showing (b1,b2) aligned SCDs between the two shear zones of Sarandi del Yi and Sierra Ballena and (b3) zoom on a typical Uruguayan CSD, rather small and full of water.
2.2. Field Acquisition and Laboratory Gas Analyses
The soil gas measurements were acquired with a GA5000. The version we used for this field trip analyses the soil-gas content in CO2, CH4, O2 in % (accuracy ±0.5% vol) and H2 in ppm (accuracy ±2.5% FS), a balance is computed, which usually corresponds to the N2. After digging a small hole in the ground, or in the rock depending on what is exposed, approximately 100 cm long and 15 mm in diameter, a tube is installed in the soil to collect the gas at that depth. Details on the protocol can be found in [28]. There is a wealth of literature on the best way to make this hole (rotation or not), the best season (dry or wet) [53], and the best time of day (before rain, during rain, midday) [7,52] to obtain the most representative measurement. But overall, everyone who takes this type of measurement recognizes that the signal varies over time and space and that it is the overall picture and geographical distribution of H2 anomalies, rather than any particular value, that is significant [28].
When the depth of penetration of the drill bit, and there of the tube, is lower, that could be the case when hard rocks are outcropping, it is indicated in the last column of the result table (Appendix A Table A1). Systematic deepest measurements, down to 7 m, have been done once, in Colombia [54], and results show that the gradient of H2 content versus depth is sometimes positive, sometimes negative. Even though there is greater dilution with air in the first few centimeters of soil, the standard depth of between 50 and 100 cm seems sufficient to verify that there is a deep signal. When we are above an H2 emanation zone, the pulses of H2 in the soil, similarly to gas bubbles rising in a water saturated zone, are random, as are their frequency and intensity. Only by staying in an area for a long time and taking many measurements can we be sure of its activity. In general, we took about ten measurements at each studied zone.
Microorganism activity can also influence the H2 content in the soils. In general, this influence is negative, as microorganisms consume H2 [55], but fermentation can also generate it [56]. These influences are generally considered to be of secondary importance, and statistical approaches can be developed to separate near-surface noise from deep flow [48]. These last authors find a threshold at 74 ppm in their case study (the foreland of the Pyrenees) but this value is not universal. GA5000 is very sensitive (1 ppm), and legitimate doubts may arise if the signal is weak (e.g., less than a few tens of ppm) and inconsistent with the geology.
Due to the internal pump in the GA5000, the small volume of gas around the tube is pumped during the 2 min of the measurement; it is classically replaced by air, and gas contents, other than O2 and N2, decrease, except when there is an active flow of deep gases. To test the existence of this deep flow, one may do monitoring and repeat the measurements; this has been done, for instance, in Brazil with one measurement each hour during months [10,52], but for a first acquisition campaign, we did not choose this rather heavy option. Due to time constraints, we only left the tube in place and closed it for a couple of minutes and measured the gas content afterwards. Any H2 content during the second or third measurement confirms H2 upward displacement and therefore some flow. As a matter of fact, in many SCDs, after an initial H2 peak measured with the GA5000, no measurable recharge is observed in the following hours of the day. However, sometimes, a recharge may be observed during several minutes or hours, indicating that hydrogen is actively seeping during the entire series of measurements [51]. It constitutes a proof of an active H2 system.
Another option to ensure that some active flow exists is the helium measurement. This will be discussed later.
At a few locations, samples of the soil gas have been taken with vial. They have been analyzed in a laboratory in France with a μGC and also allow the He and Ne content to be determined.
Classically, the measurements published using a GA5000 (or other similar tools) are the maximum of the H2 signal, which is reached after a few tens of seconds due to the velocity of the sensor but also due to the diffusion rate of the H2 toward the tube.
During the field campaign, 155 soil gas measurements were done (raw data in Appendix A) and 11 gas samples were collected.
3. Results
3.1. Soil Gas Measurements
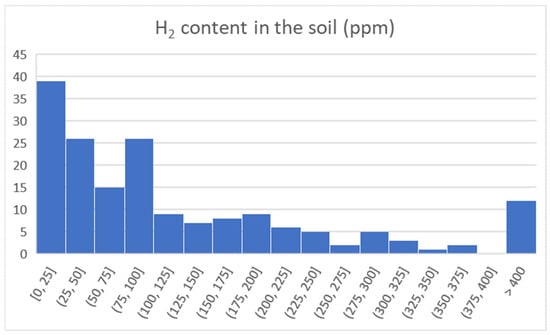
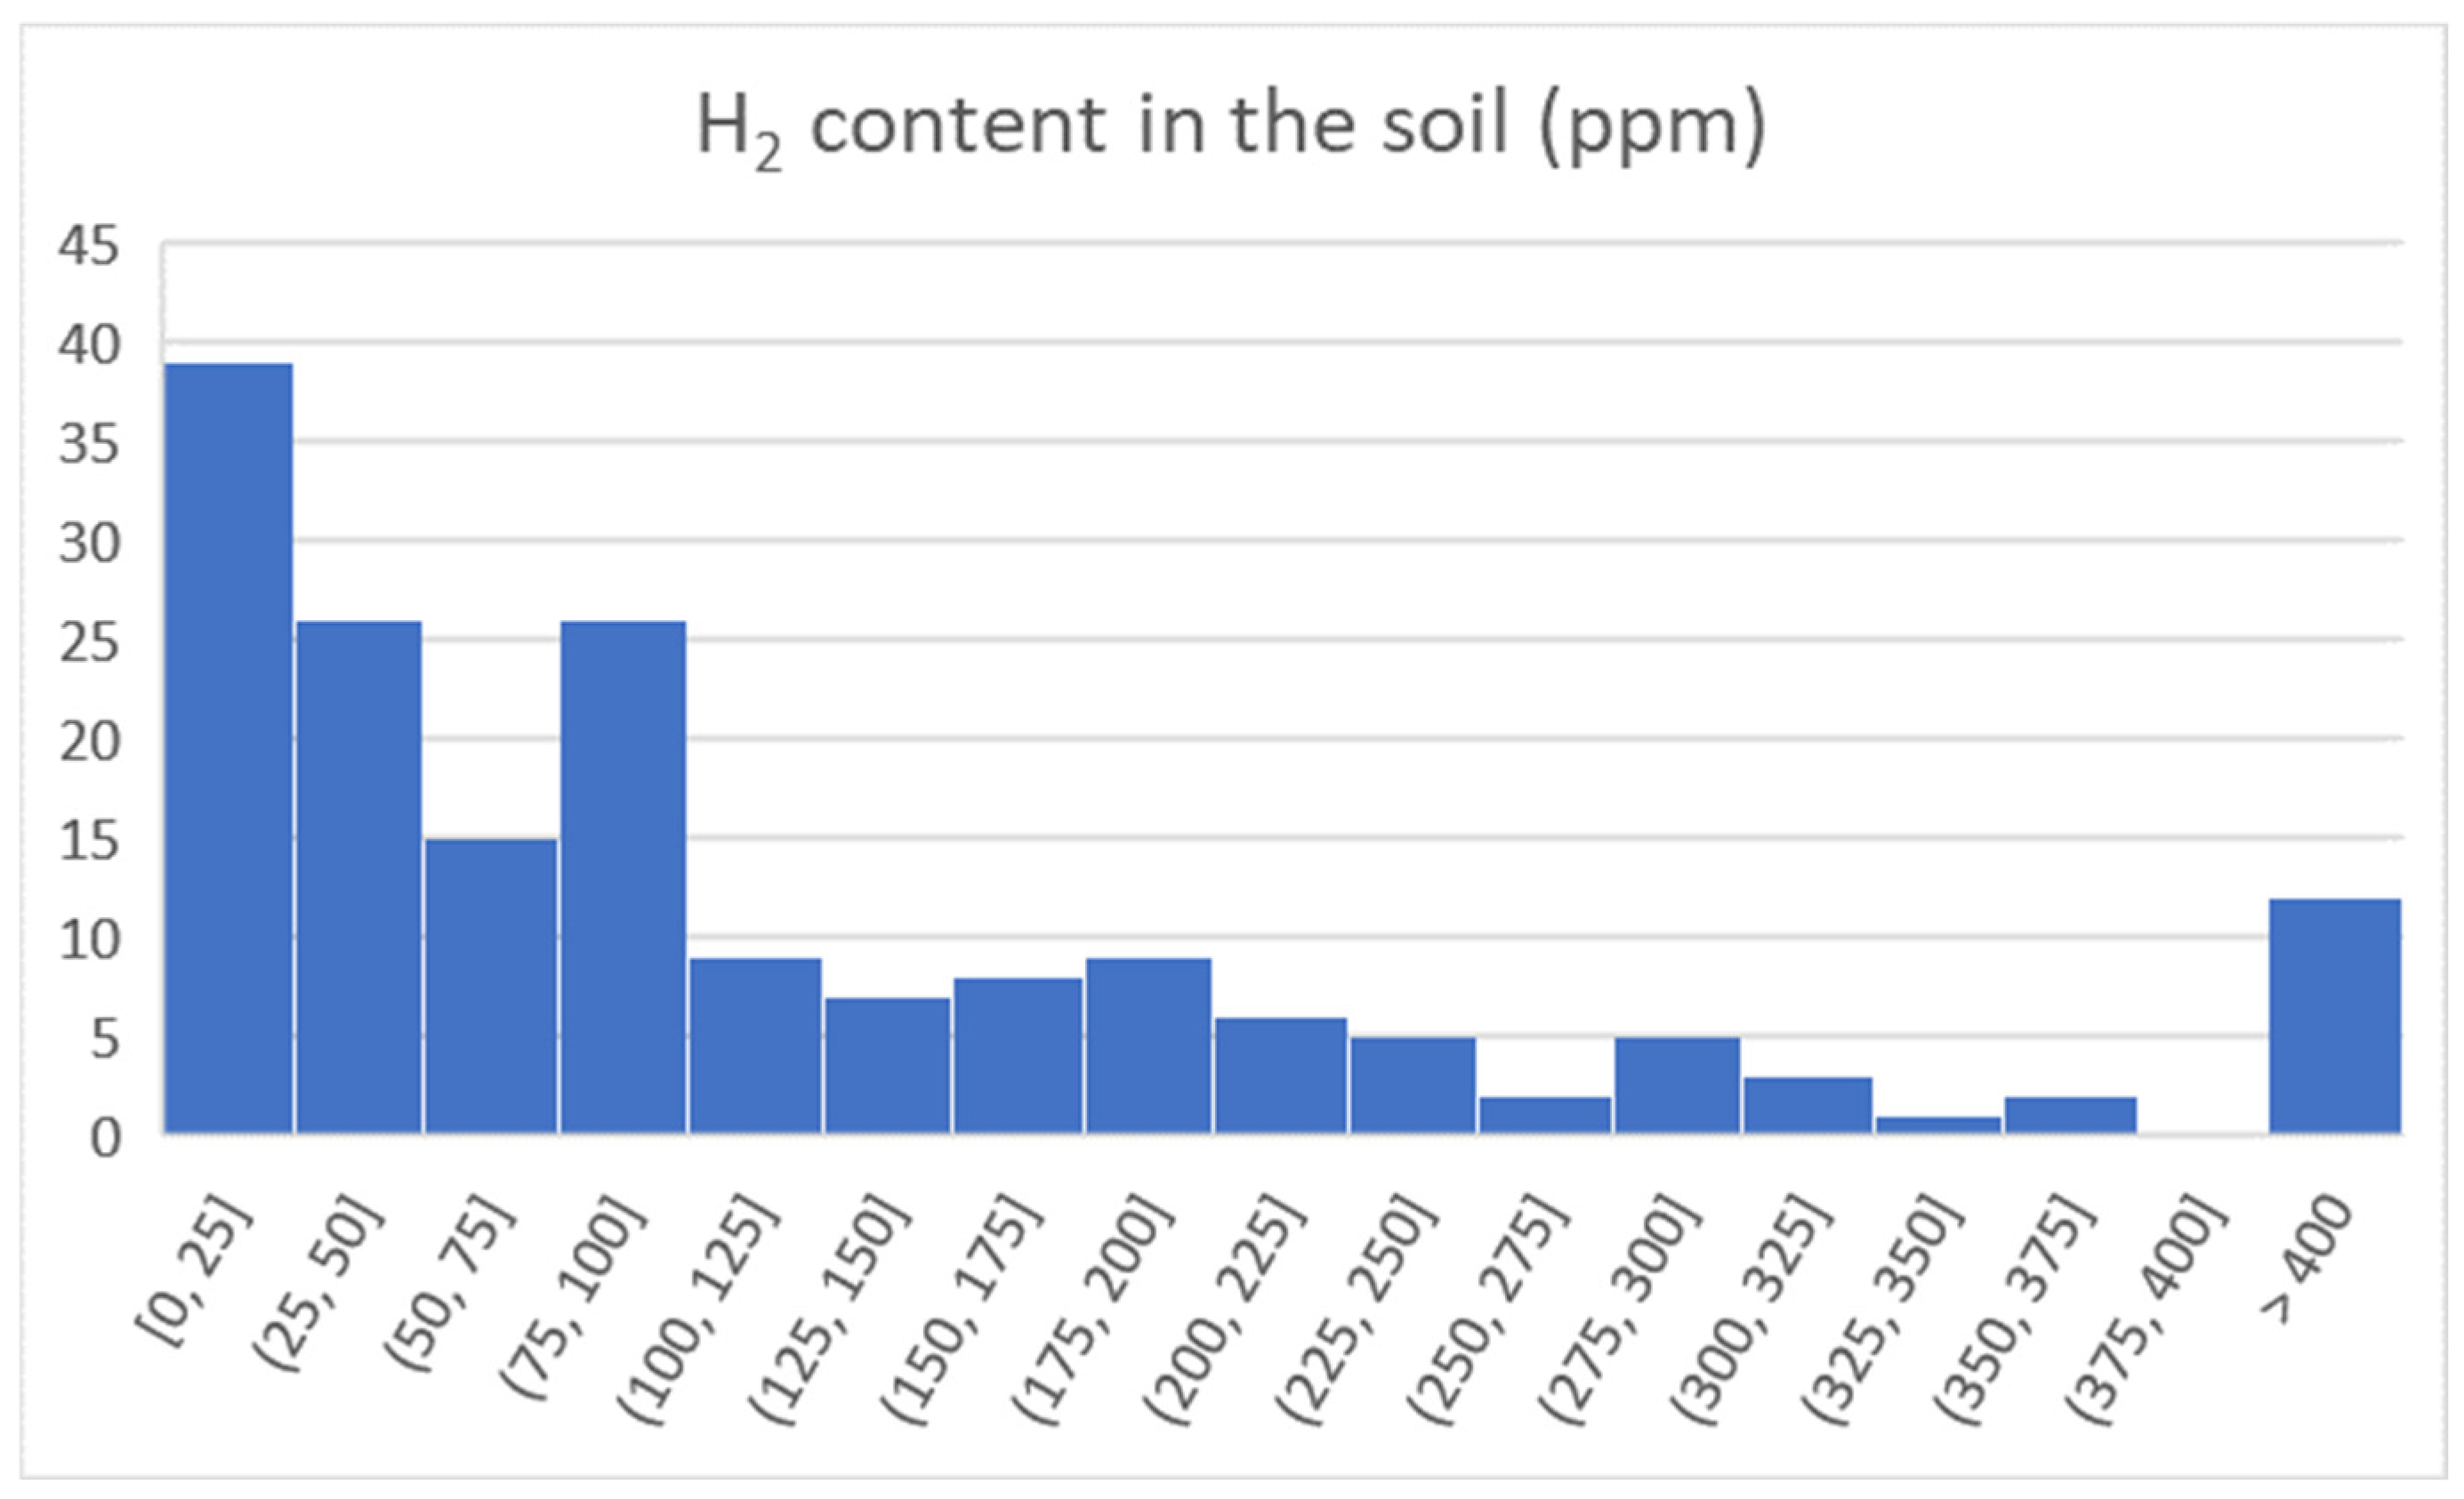
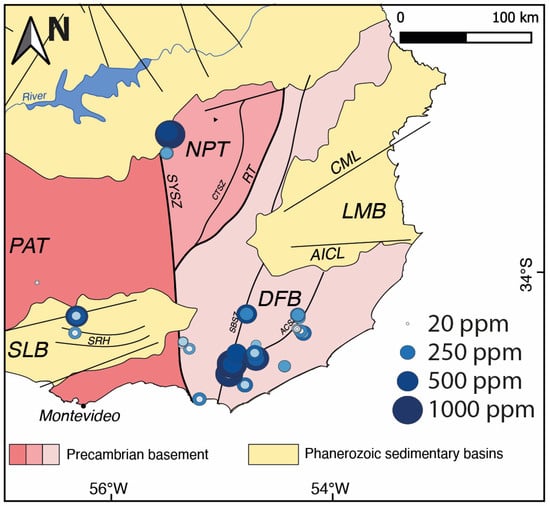
All the measurements are in Appendix A. The statistics are presented in Figure 4 and the values in the map in Figure 5.
Figure 4.
Statistical distribution of H2 soil content; raw data in Appendix A.
Figure 5.
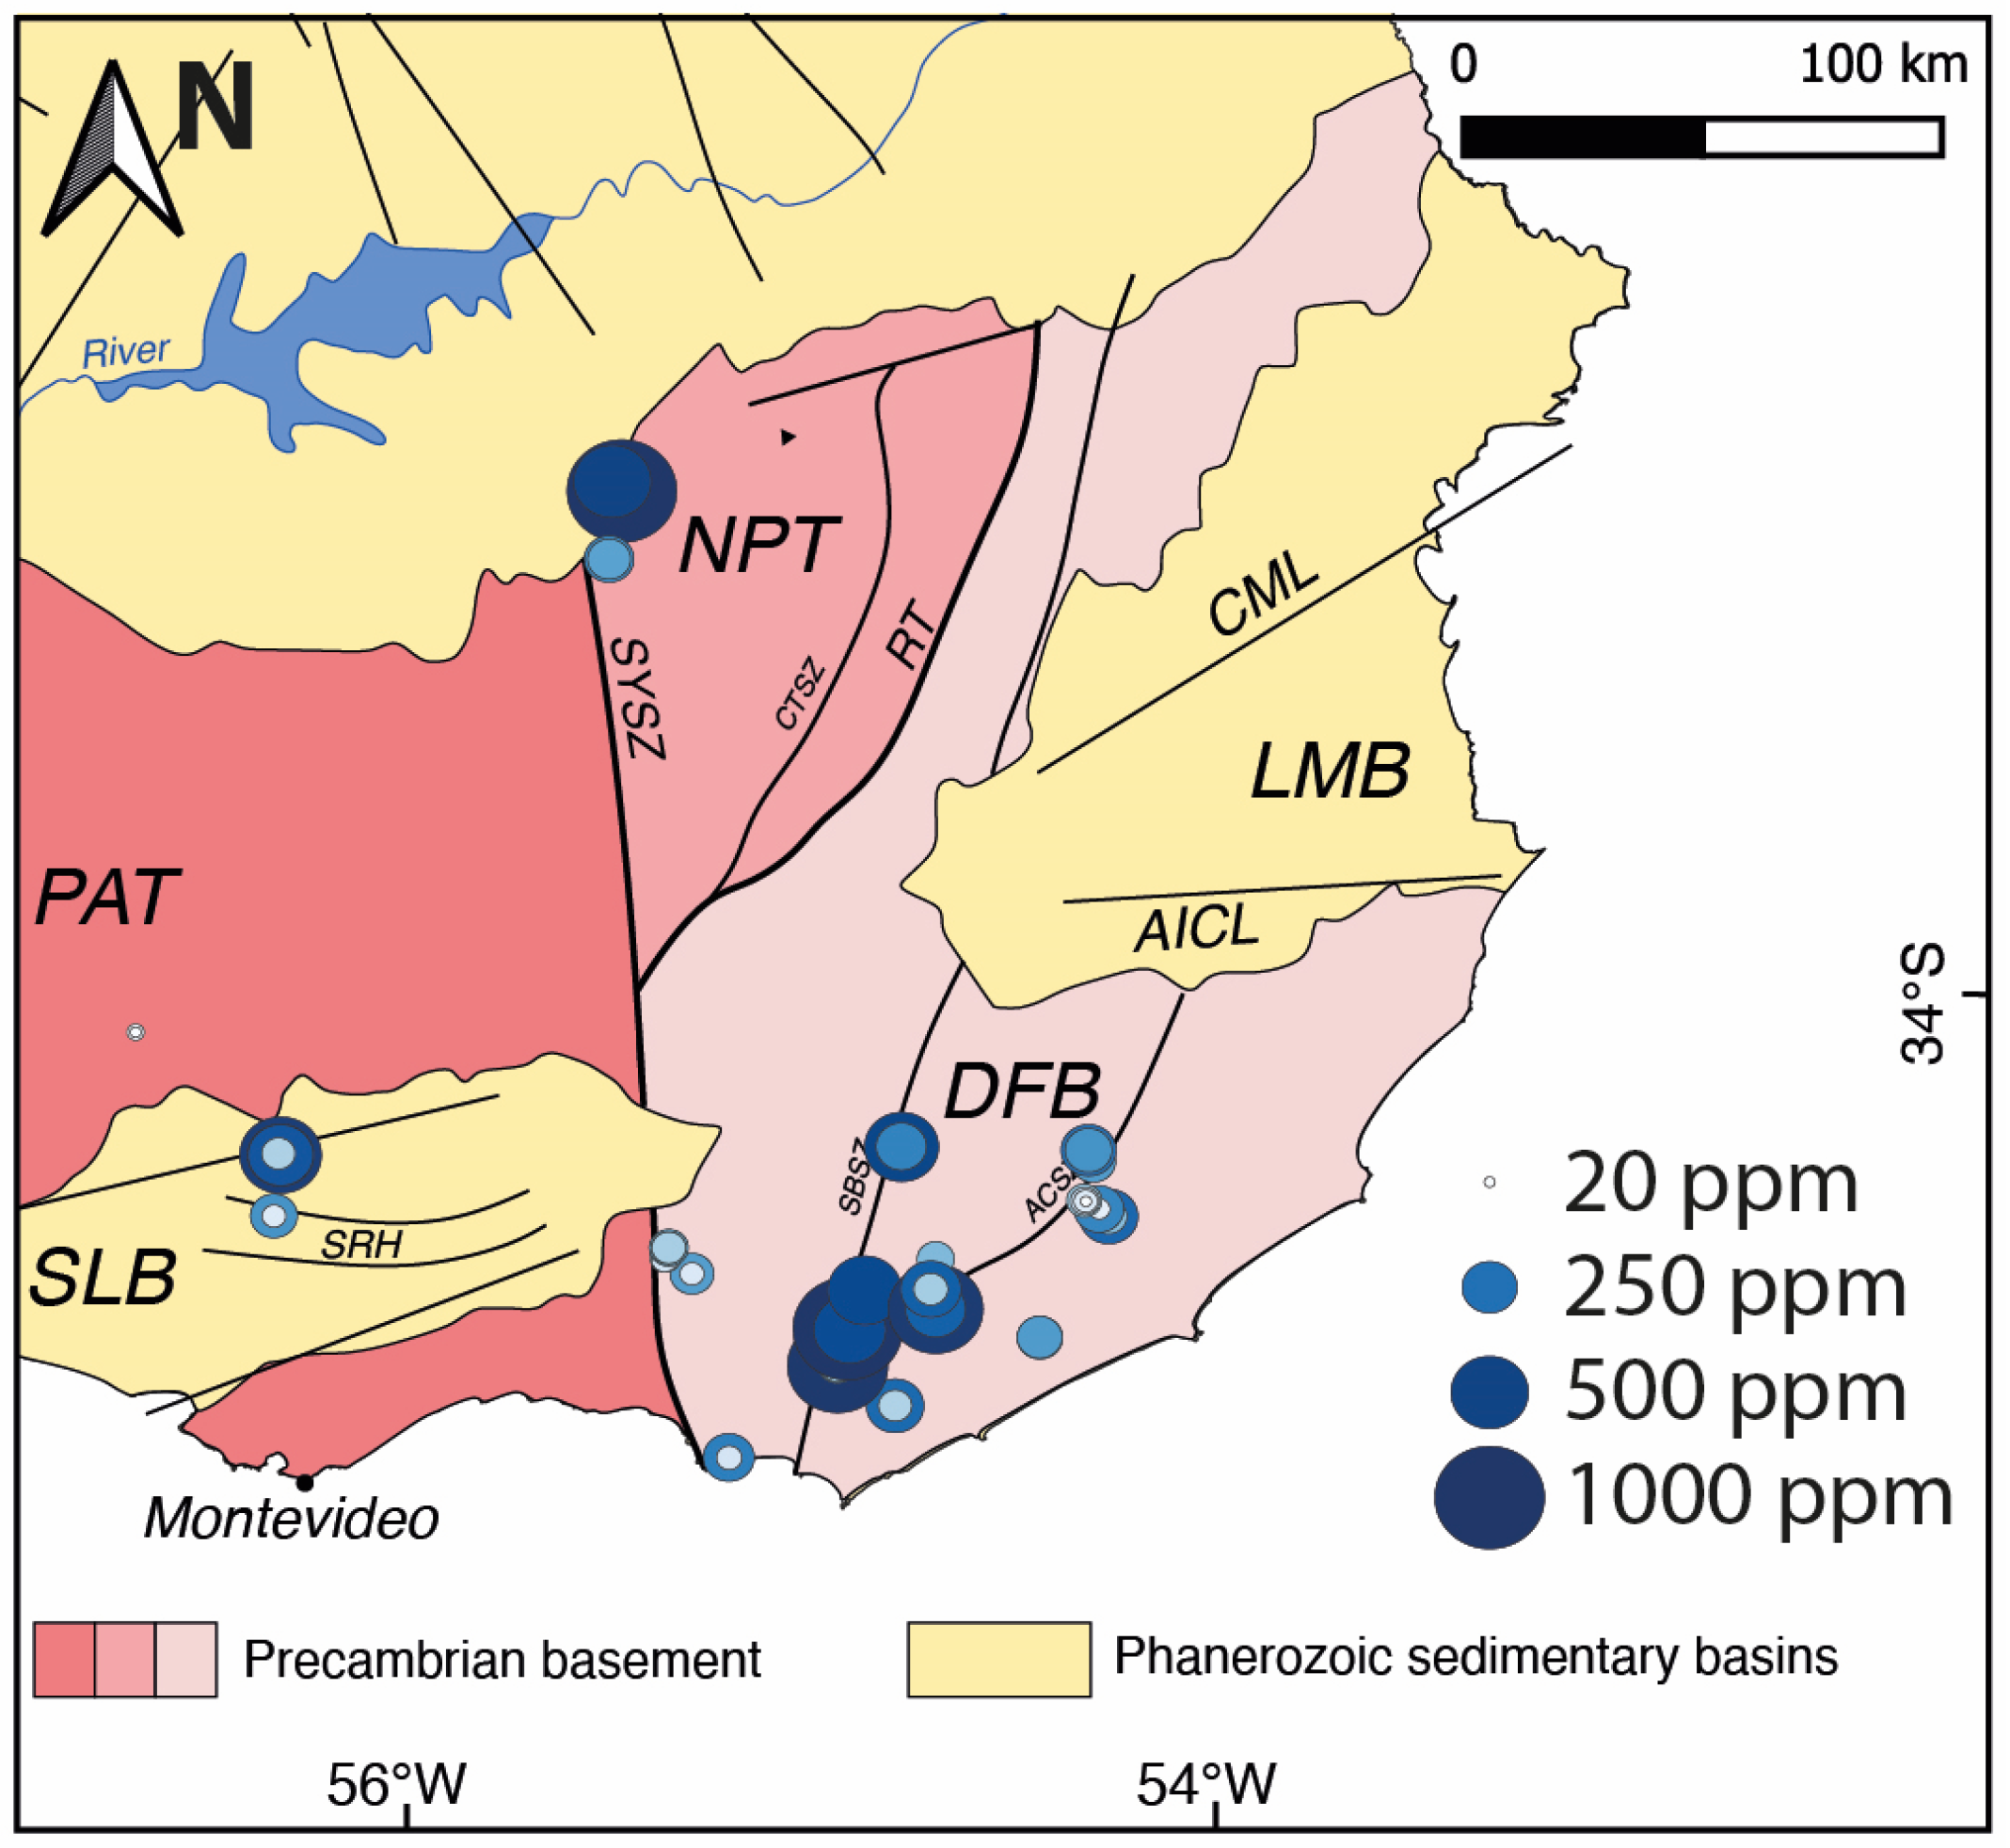
Location of the soil gas measurements. The size of the circles highlights the H2 content. The GA5000 threshold, 1000 ppm, was exceeded at three locations.
We first have to note that the values were high, with a mean value of around 140 ppm and roughly two-thirds of the measurements being above 50 ppm.
As expected, the fault zones are preferential migration pathways, and the highest values (saturation of the GA5000, large red circle, Figure 5) were above the faults.
3.2. Gas Geochemistry
Among the 155 measurements performed in the southeastern part of Uruguay, 11 gas samples were taken whose H2 concentrations were high, and a complete gas chromatographic measurement was made to measure precisely the concentrations of helium, neon, hydrogen, oxygen, nitrogen, methane and CO2 (Table 1).
Table 1.
Gas chromatography analyses and comparison with field measurements for the H2 (last column). The helium and hydrogen uncertainties are ±0.2 ppm. The other gases present uncertainties of 0.03%.
Two spots (PN 88 and PN 95) saturated the H2 detector GA5000 with concentrations above 1000 ppm. Six have shown concentrations above 500 ppm, and 73 samples had concentrations above 100 ppm. The maximum concentrations of methane and CO2 were 0.7% and 9.3%, respectively, and are probably related to superficial biological methanogenesis and soil respiration, respectively.
4. Discussion
4.1. Presence of H2 in the Uruguayan Subsurface
4.1.1. Suture Zones
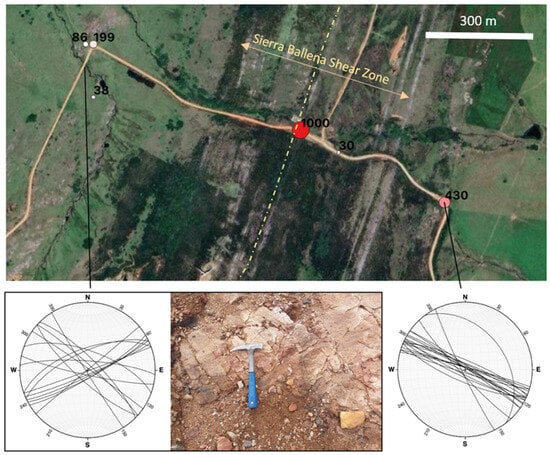
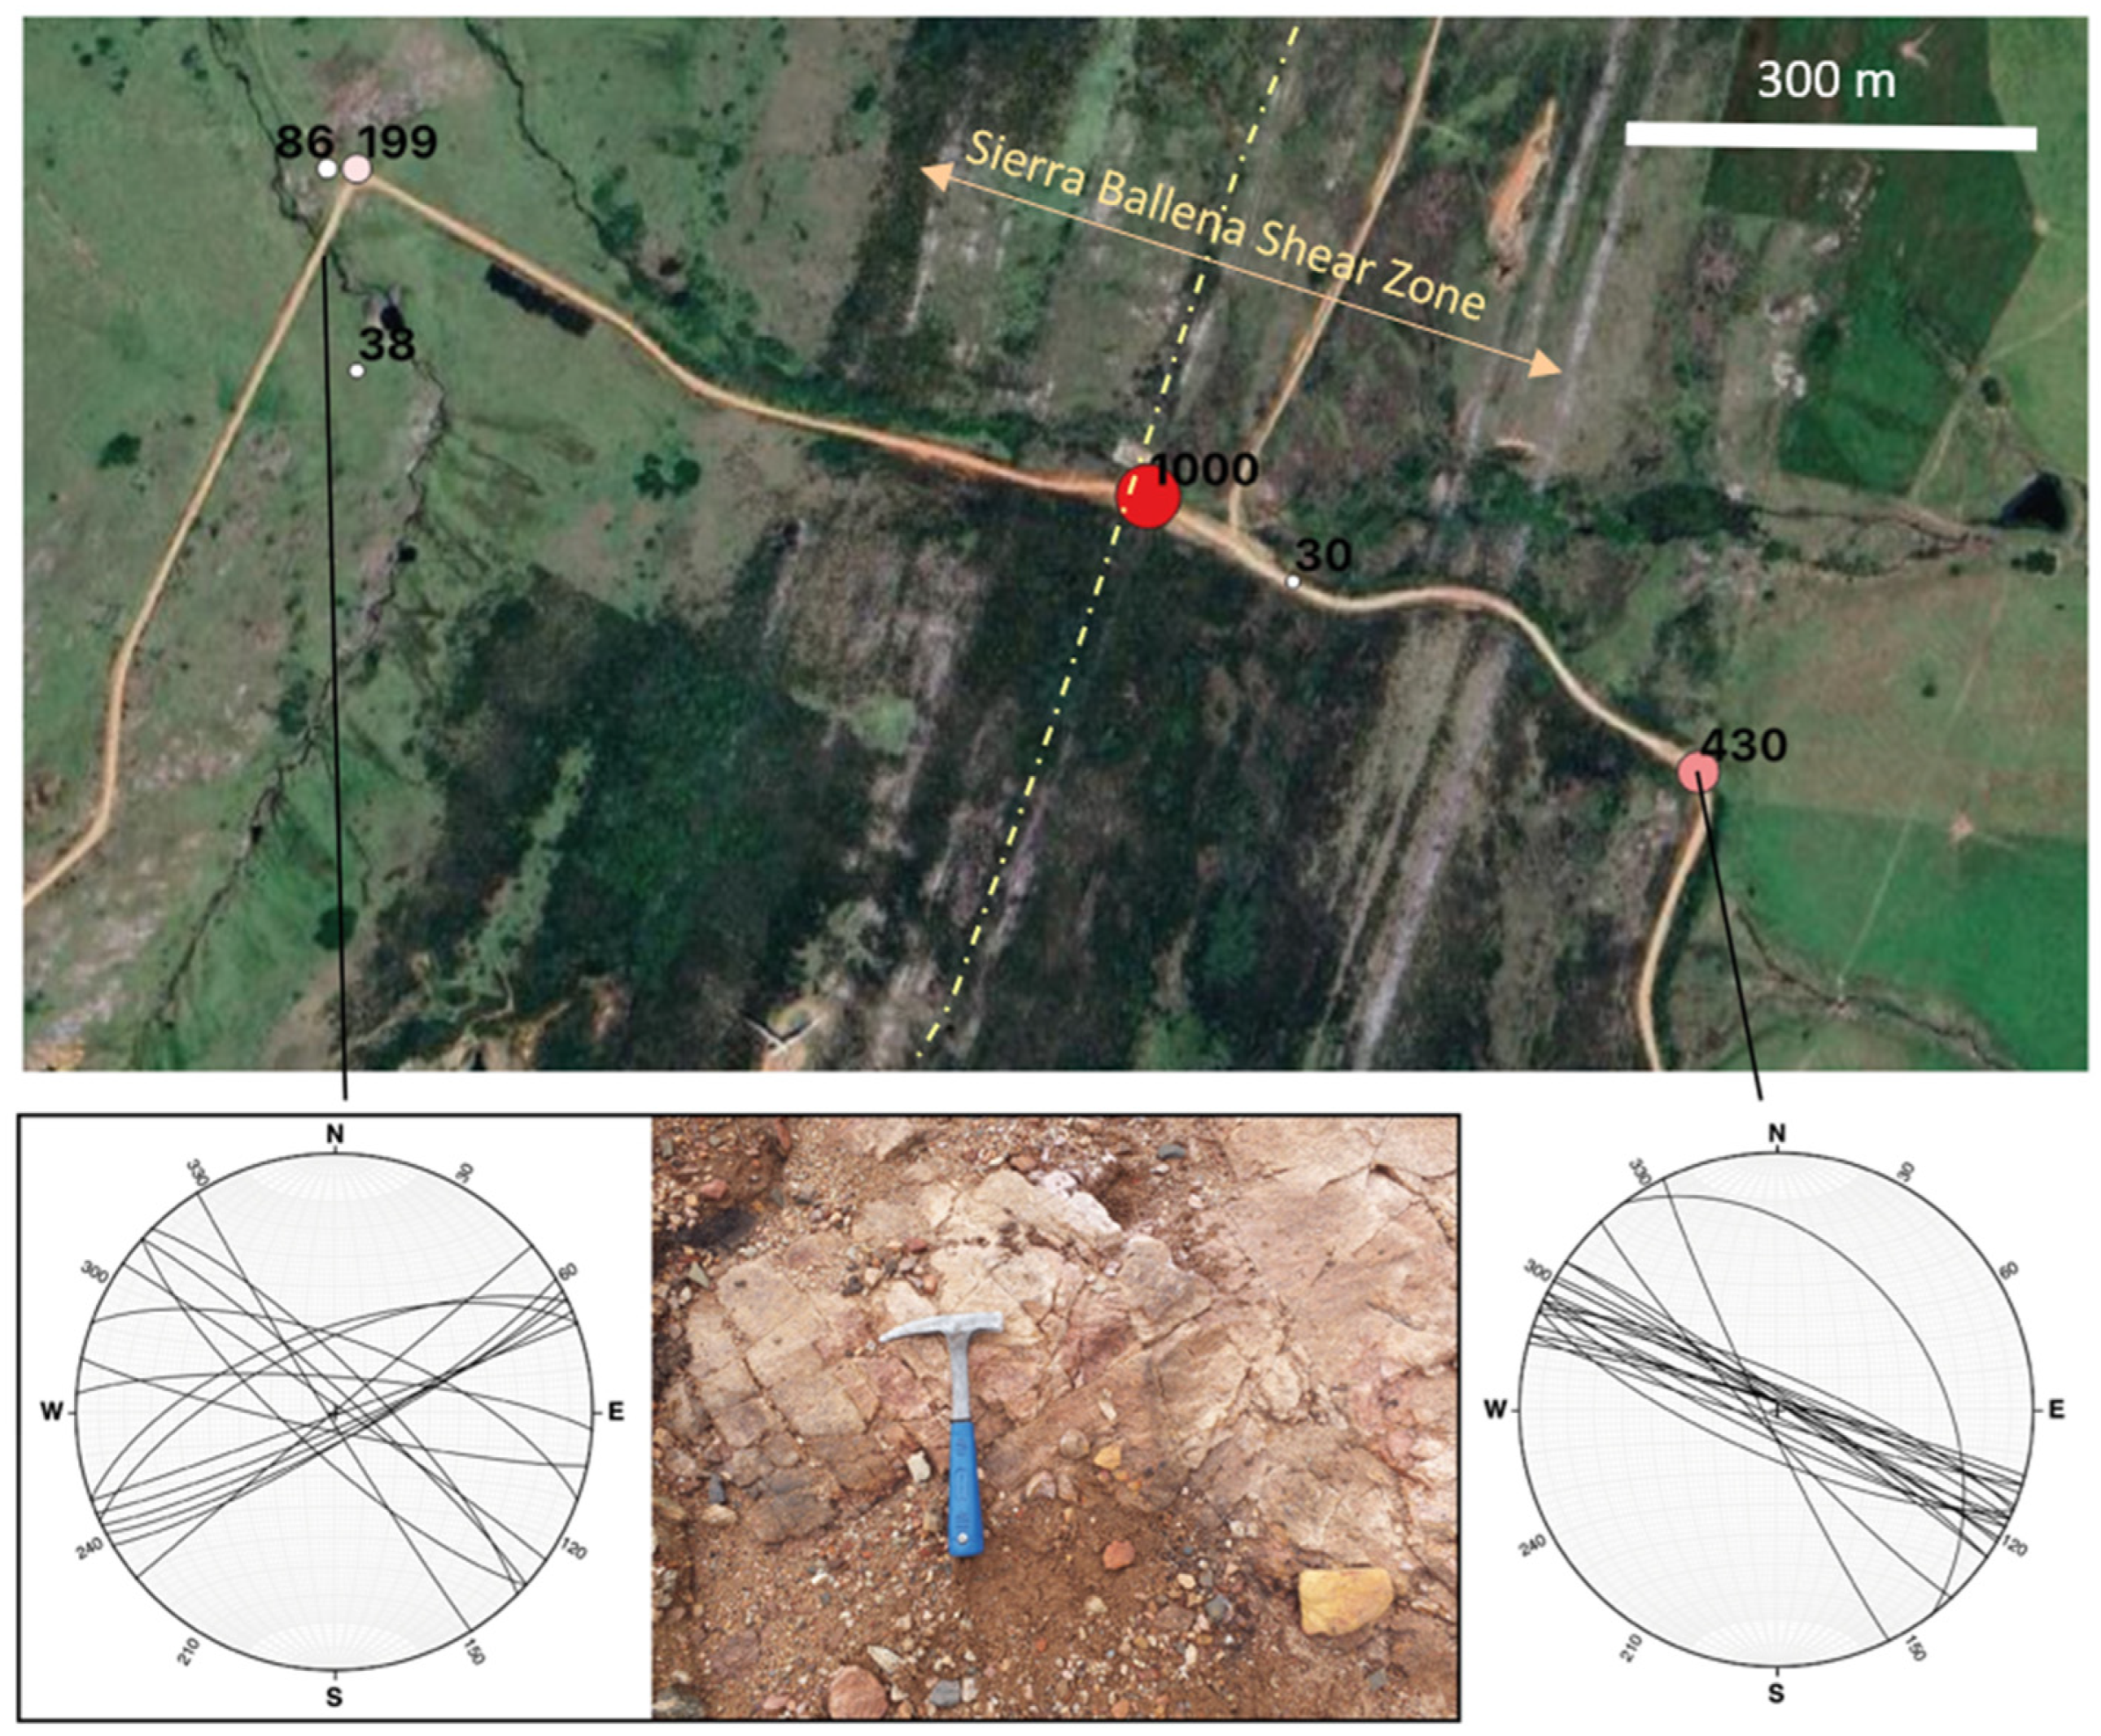
Measurements done on the Sierra Ballena (SBSZ) and Cordillera (CSZ) shear zones are uniformly high (Figure 6) and these fault zones appear to be drainage features for H2. The granite belt between the two shear zones is Neoproterozoic (Cryogenian) and displays very high values.
Figure 6.
Example of measurements across the SBSZ. The numbers indicate the H2 content in ppm at the location, and the color from white to red indicates the variation in this content. The highest H2 content is found on the fault (almost vertical). The width of the highly deformed zone is indicated by the double arrow, and the main slip plane by the dotted line. The zone has been crossed twice and the H2 content displays the same pattern. Measurements from points 98 to 103 in the table.
Westward in the Sarandi del Yi Shear Zone, values are lower in the south (Piriapolis area) but happen to be very high northward (contact Rio de la Plata Craton). More systematic data collection along this lineament should be done to conclude about its potential.
4.1.2. Regarding the Pre-Selected Sub-Circular Depression
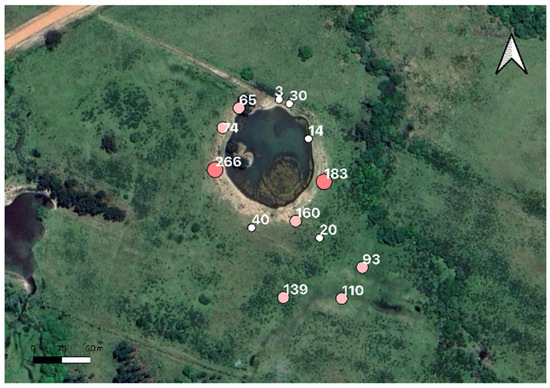
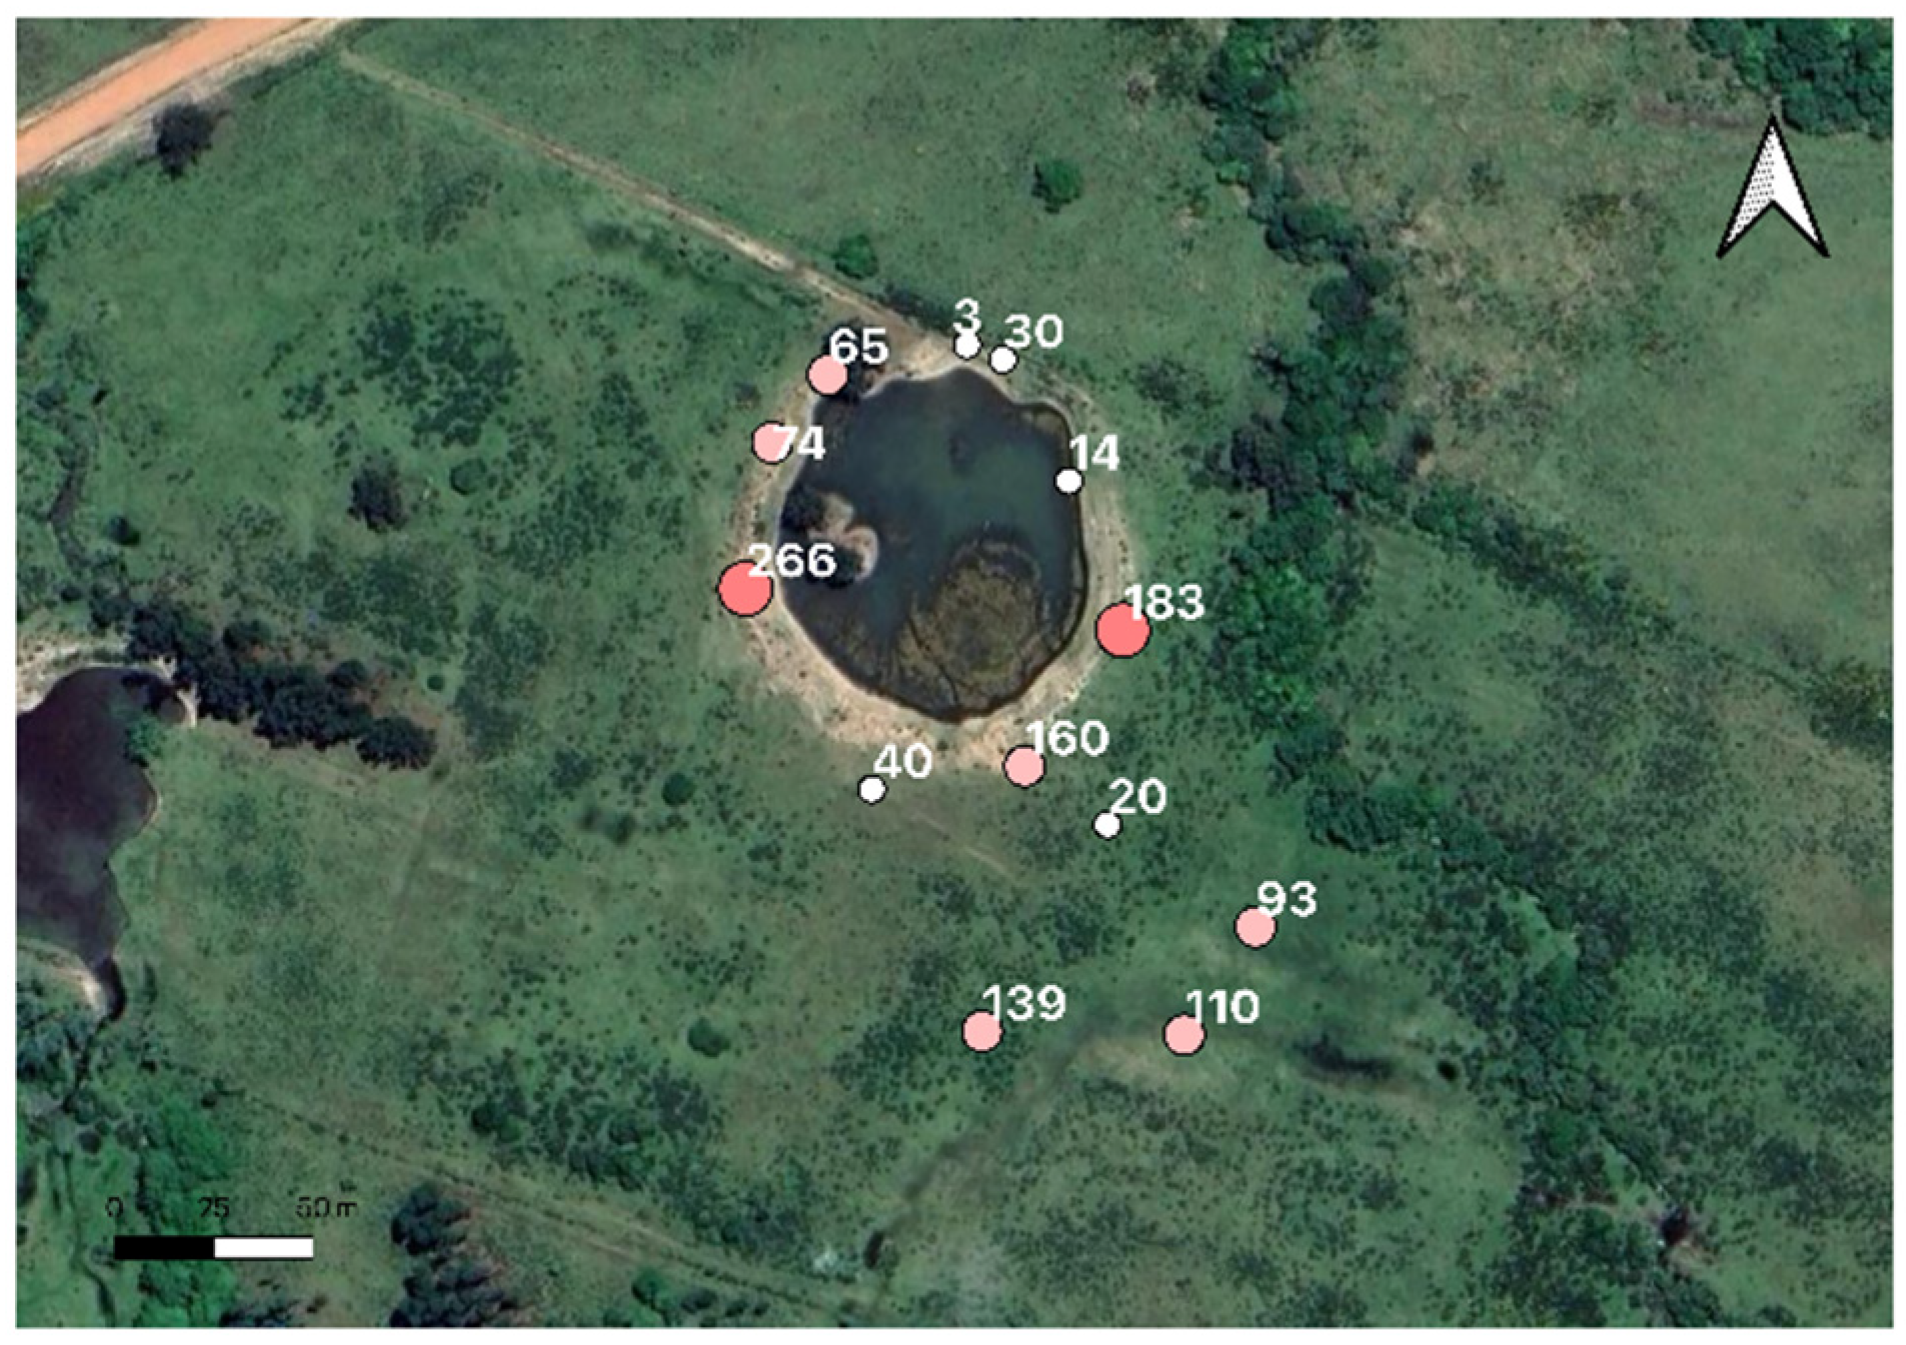
The SCD we had scouted had promising features (as the one in Figure 7), but we learned that all properties had to have a natural pond if they housed livestock. This raises the question of the origin, natural or otherwise, of these depressions. The soil gas measurements confirmed that they correspond, in the vast majority, to areas of H2 emanations but are deepened by earthwork to create water reserves. Their alignment with the direction of the faults leads us also to believe that the depressions existed before the farmers’ work.
Figure 7.
Measurements in one of the SCD (measurements number from 75 to 83 in the Appendix A, values H2 content in ppm), the apparent diameter of the area with water is about 100 m, but the depressed area is much larger. This example is representative of the SCD, where we measured H2. Earthworks had been carried out to create a water reserve (essential for the animals), taking advantage of an initial natural depression, probably due to gas escapes.
4.1.3. Archean Craton
Due to time constraints and heavy rains, only the southern part of the Rio de la Plata craton has been reached (points 40 to 61 in the Appendix A), north of Montevideo. Values were high, up to 556 ppm. We performed a recharge test (point 57): the initial value was 349 ppm. It dropped to close to 0 at the end of the two-minute measurement, but after 6 min it roses again up to 83 ppm and after half an hour to 198 ppm. This rapid recharge shows that H2 flow is active in the area.
4.2. Relation Between the Various Deep Gases
Comparing the H2 concentrations measured directly in the field and from laboratory measurements with a gas chromatograph (Table 1), it appears that the H2 concentrations observed in gas samples are systematically lower than the ones measured in the field. The fit is never perfect but such a gap is unusual. This may be explained by the fact that the field measurements with the GA5000 detector use an electrochemical sensor, which induces a time shift between the observed H2 peak and the real H2 presence in the tubing. This induces a difficulty in sampling the gas exactly during the real H2 maximum, different in time from the observed maximum with the GA5000. With a GA5000, the maximum is usually reached between 35 and 45 s, but the peak of the H2 is reached before and the sampling in the vial takes a few seconds. Therefore, in the vial, one samples a non-constant gas during an interval that rarely corresponds to the maximum of H2. As a result, the H2 content measured by both methods is never the same; GCs are usually smaller, and the field data is more accurate at measuring the maximum but both indicate similar trends [43].
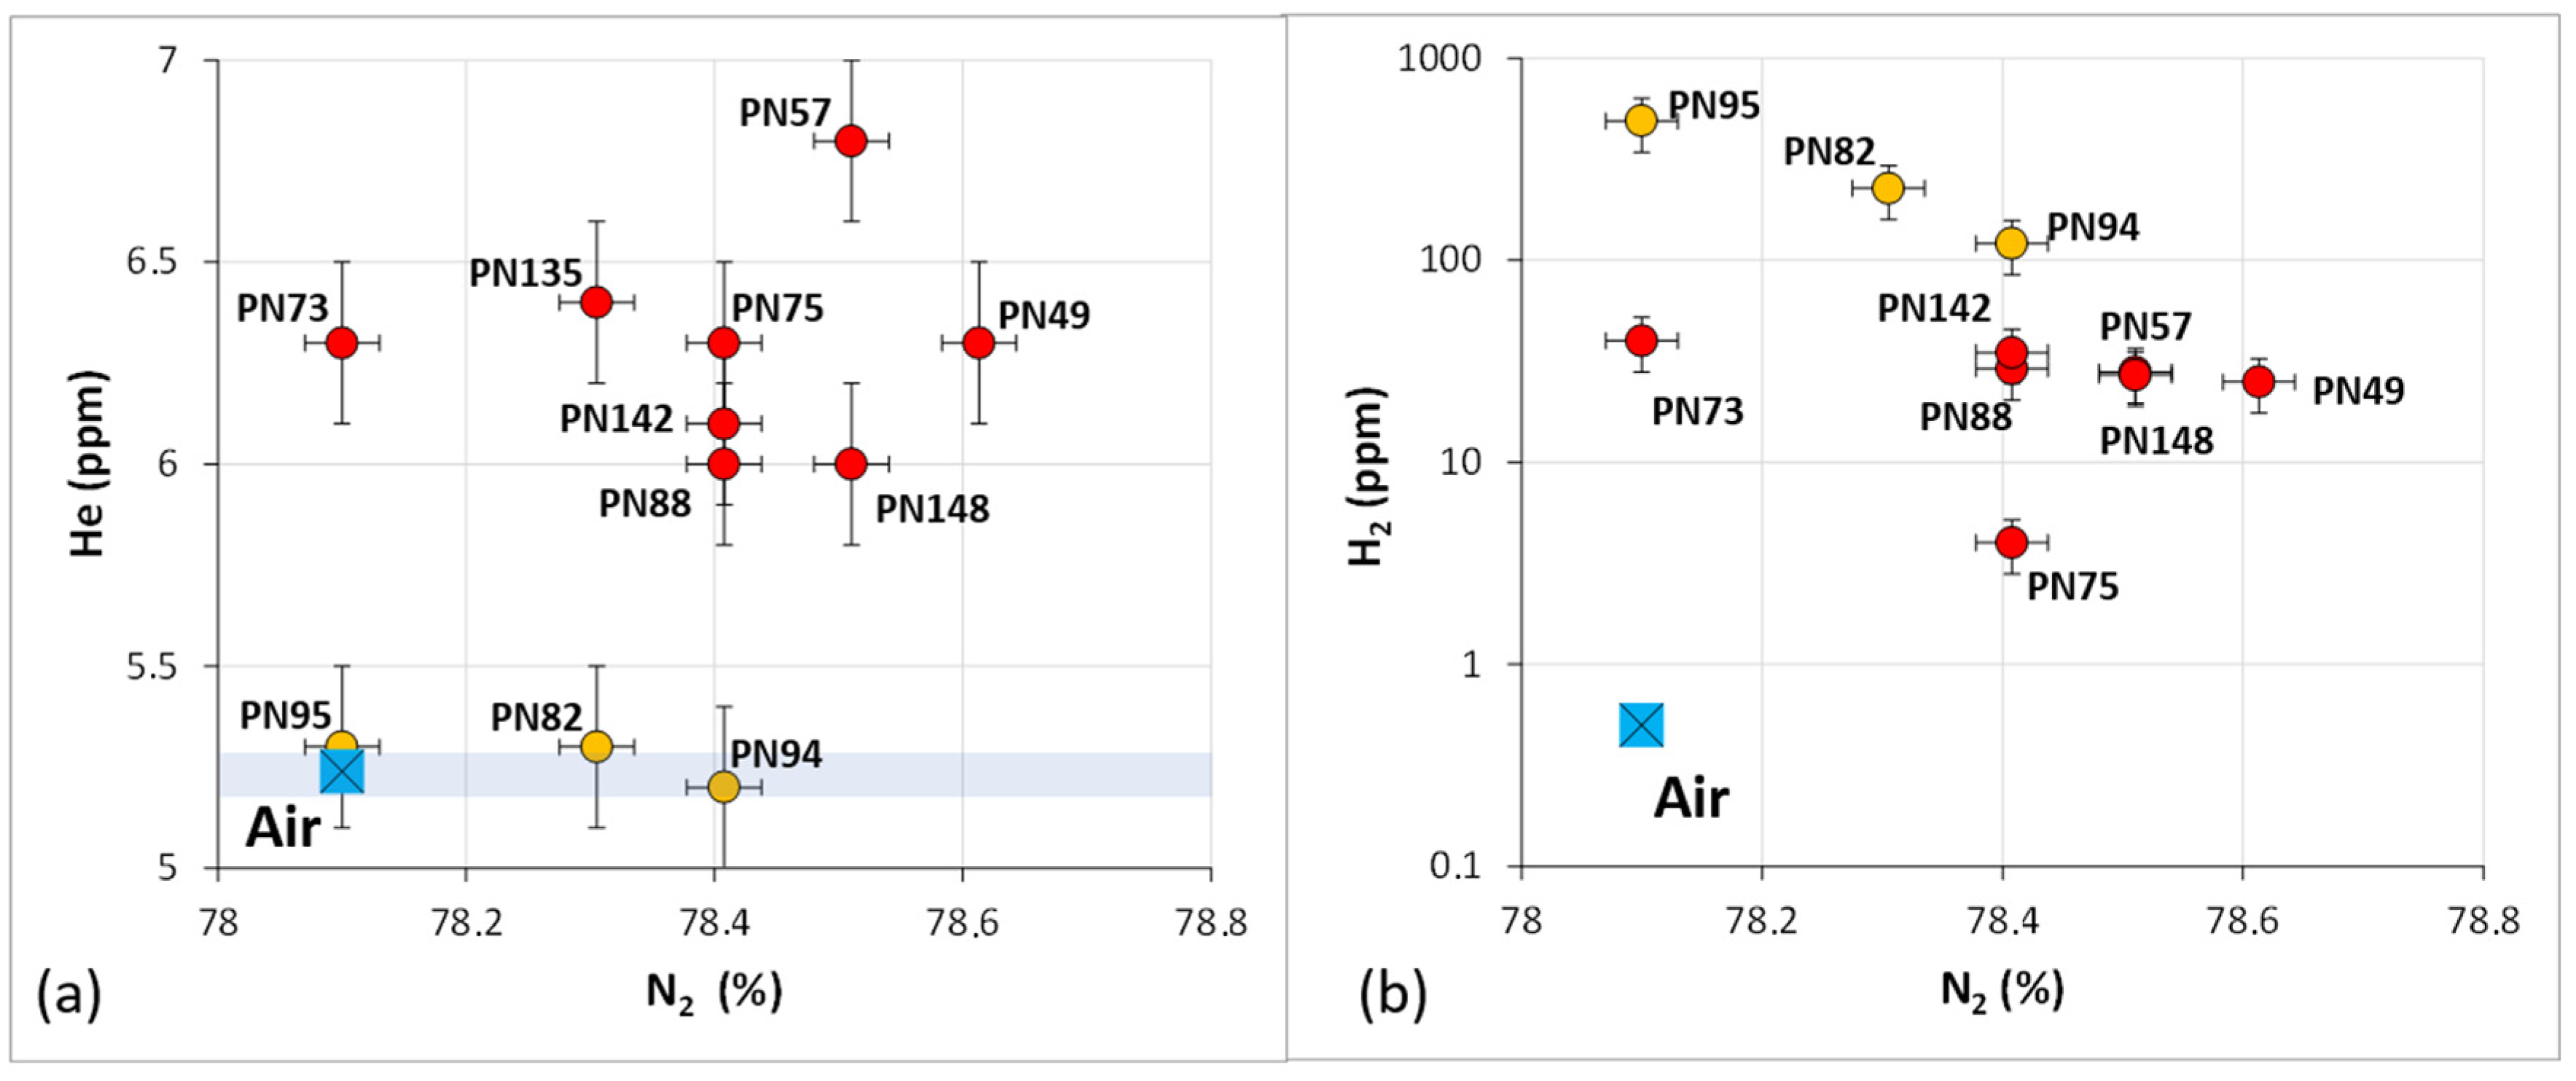
However, very important information may be observed with the laboratory analyses: the helium concentration of the air is 5.24 ppm. Any excess in the helium concentration indicates that a gas flow from the subsurface is active during the measurement. The helium measurements presented in Table 1 have an uncertainty of ±0.2 ppm. As a matter of fact, helium cannot be generated by any superficial process, biological or chemical, and cannot be adsorbed, and then desorbed, on the mineral surface, contrary to H2, which may be adsorbed on shale minerals, and may be generated either through biological generation or human artifact during the drilling [53]. No positive helium anomaly is observed except in the gases PN 82, PN 94 and PN 95. Even if some uranium and thorium may exist in low concentrations in soils, associated helium generation through natural radioactivity needs geological times in order to generate measurable helium amounts. A soil may be considered as an open system through geological times, indicating that absolutely no helium anomaly may be associated with soil production, but needs to migrate from the subsurface.
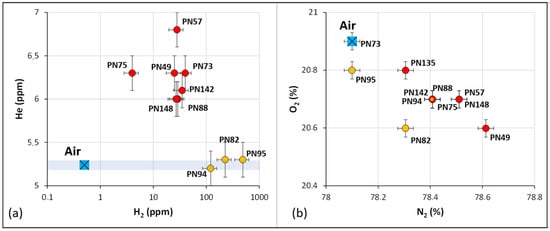
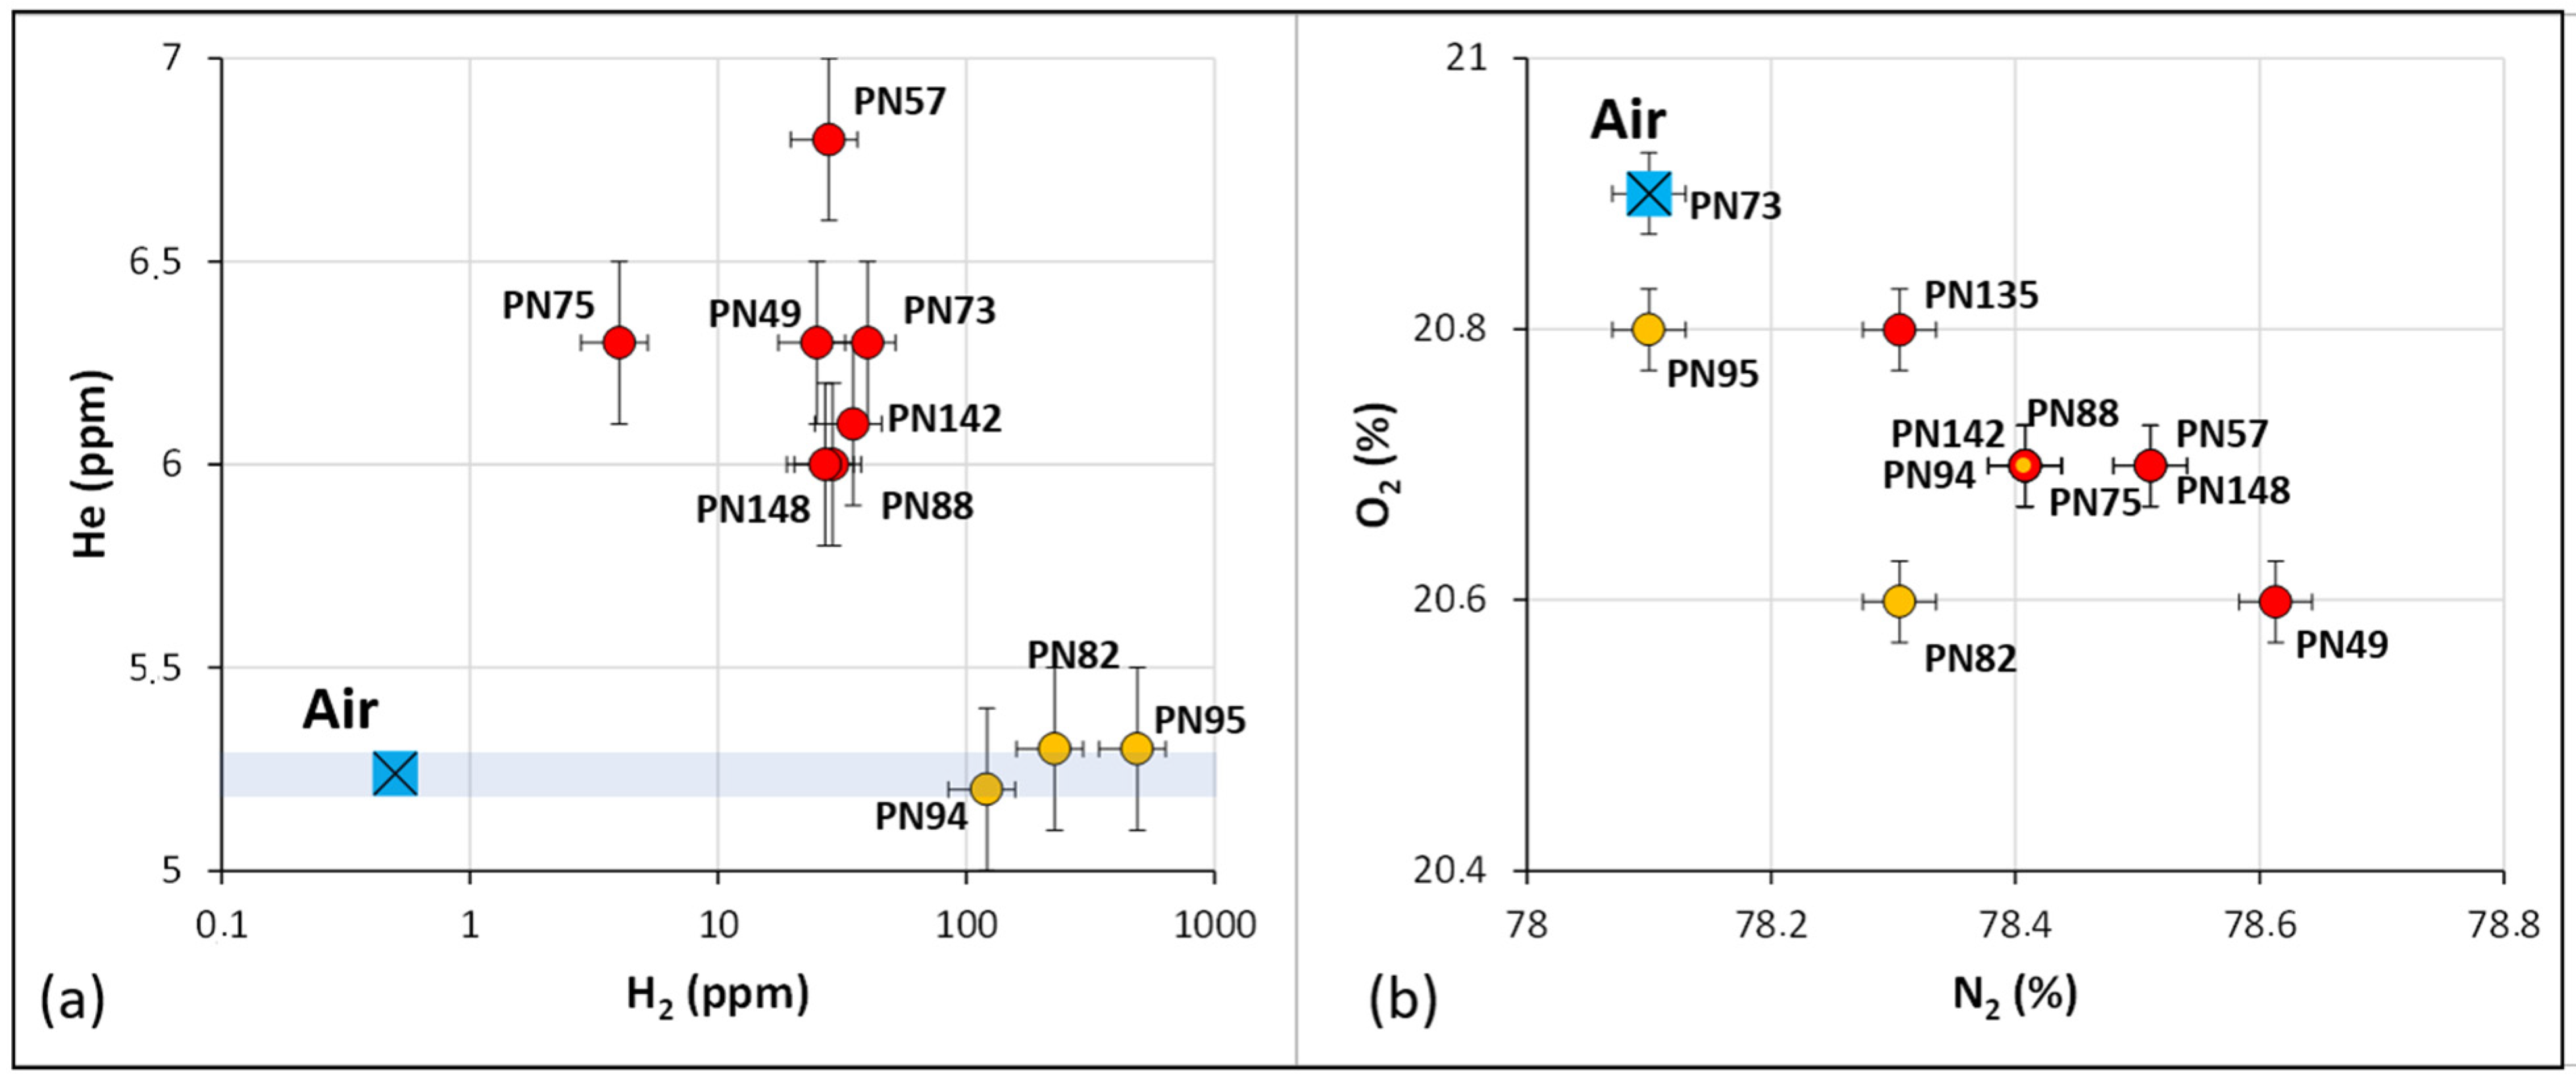
This direct proof of a deep flow of helium, and probably associated H2, may be confirmed for the other gas samples, even if the helium concentrations are only slightly but significantly above the air concentration (Figure 8a).
Figure 8.
(a) Correlation between the helium and hydrogen concentrations obtained with a gas chromatograph; (b) correlation between nitrogen and oxygen concentrations obtained with a gas chromatograph. The uncertainties are those presented in the Table 1 caption.
Comparing the nitrogen and oxygen concentrations (Figure 8b), an inverse correlation occurs only due to the 100% normalization of a gas analysis, and that N2 and O2 are the two main gas compounds. The decrease in O2 concentration is due to soil respiration, whereas the associated N2 increase may be either due to a simple normalization effect, or to an addition of deep N2. The fact that the neon concentrations remain constant and close to air values favors the second interpretation for the N2 concentrations
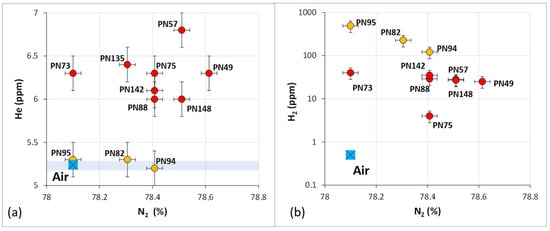
Figure 9 presents the relation between nitrogen and hydrogen concentrations and between nitrogen and helium concentrations. It is confirmed that the samples PN82, PN94 and PN95 do not present any helium anomalies. However, these three gases present relatively high hydrogen concentrations, maybe linked to superficial biological generation. As is usually observed, a rough correlation may be observed between helium and nitrogen, whereas the correlation is not clear between hydrogen and nitrogen. The usual interpretation of a correlation between helium and nitrogen is the area where both gases are generated, i.e., the metamorphic terrains at depth. Their generation is quite different, as helium is generated through the natural radioactive decay of uranium and thorium, whereas nitrogen is generated through the decomposition of ammonium ions and organic matter at great thermal stress.
Figure 9.
Correlation between nitrogen and helium (a) and hydrogen (b). The uncertainties are those presented in the Table 1 caption.
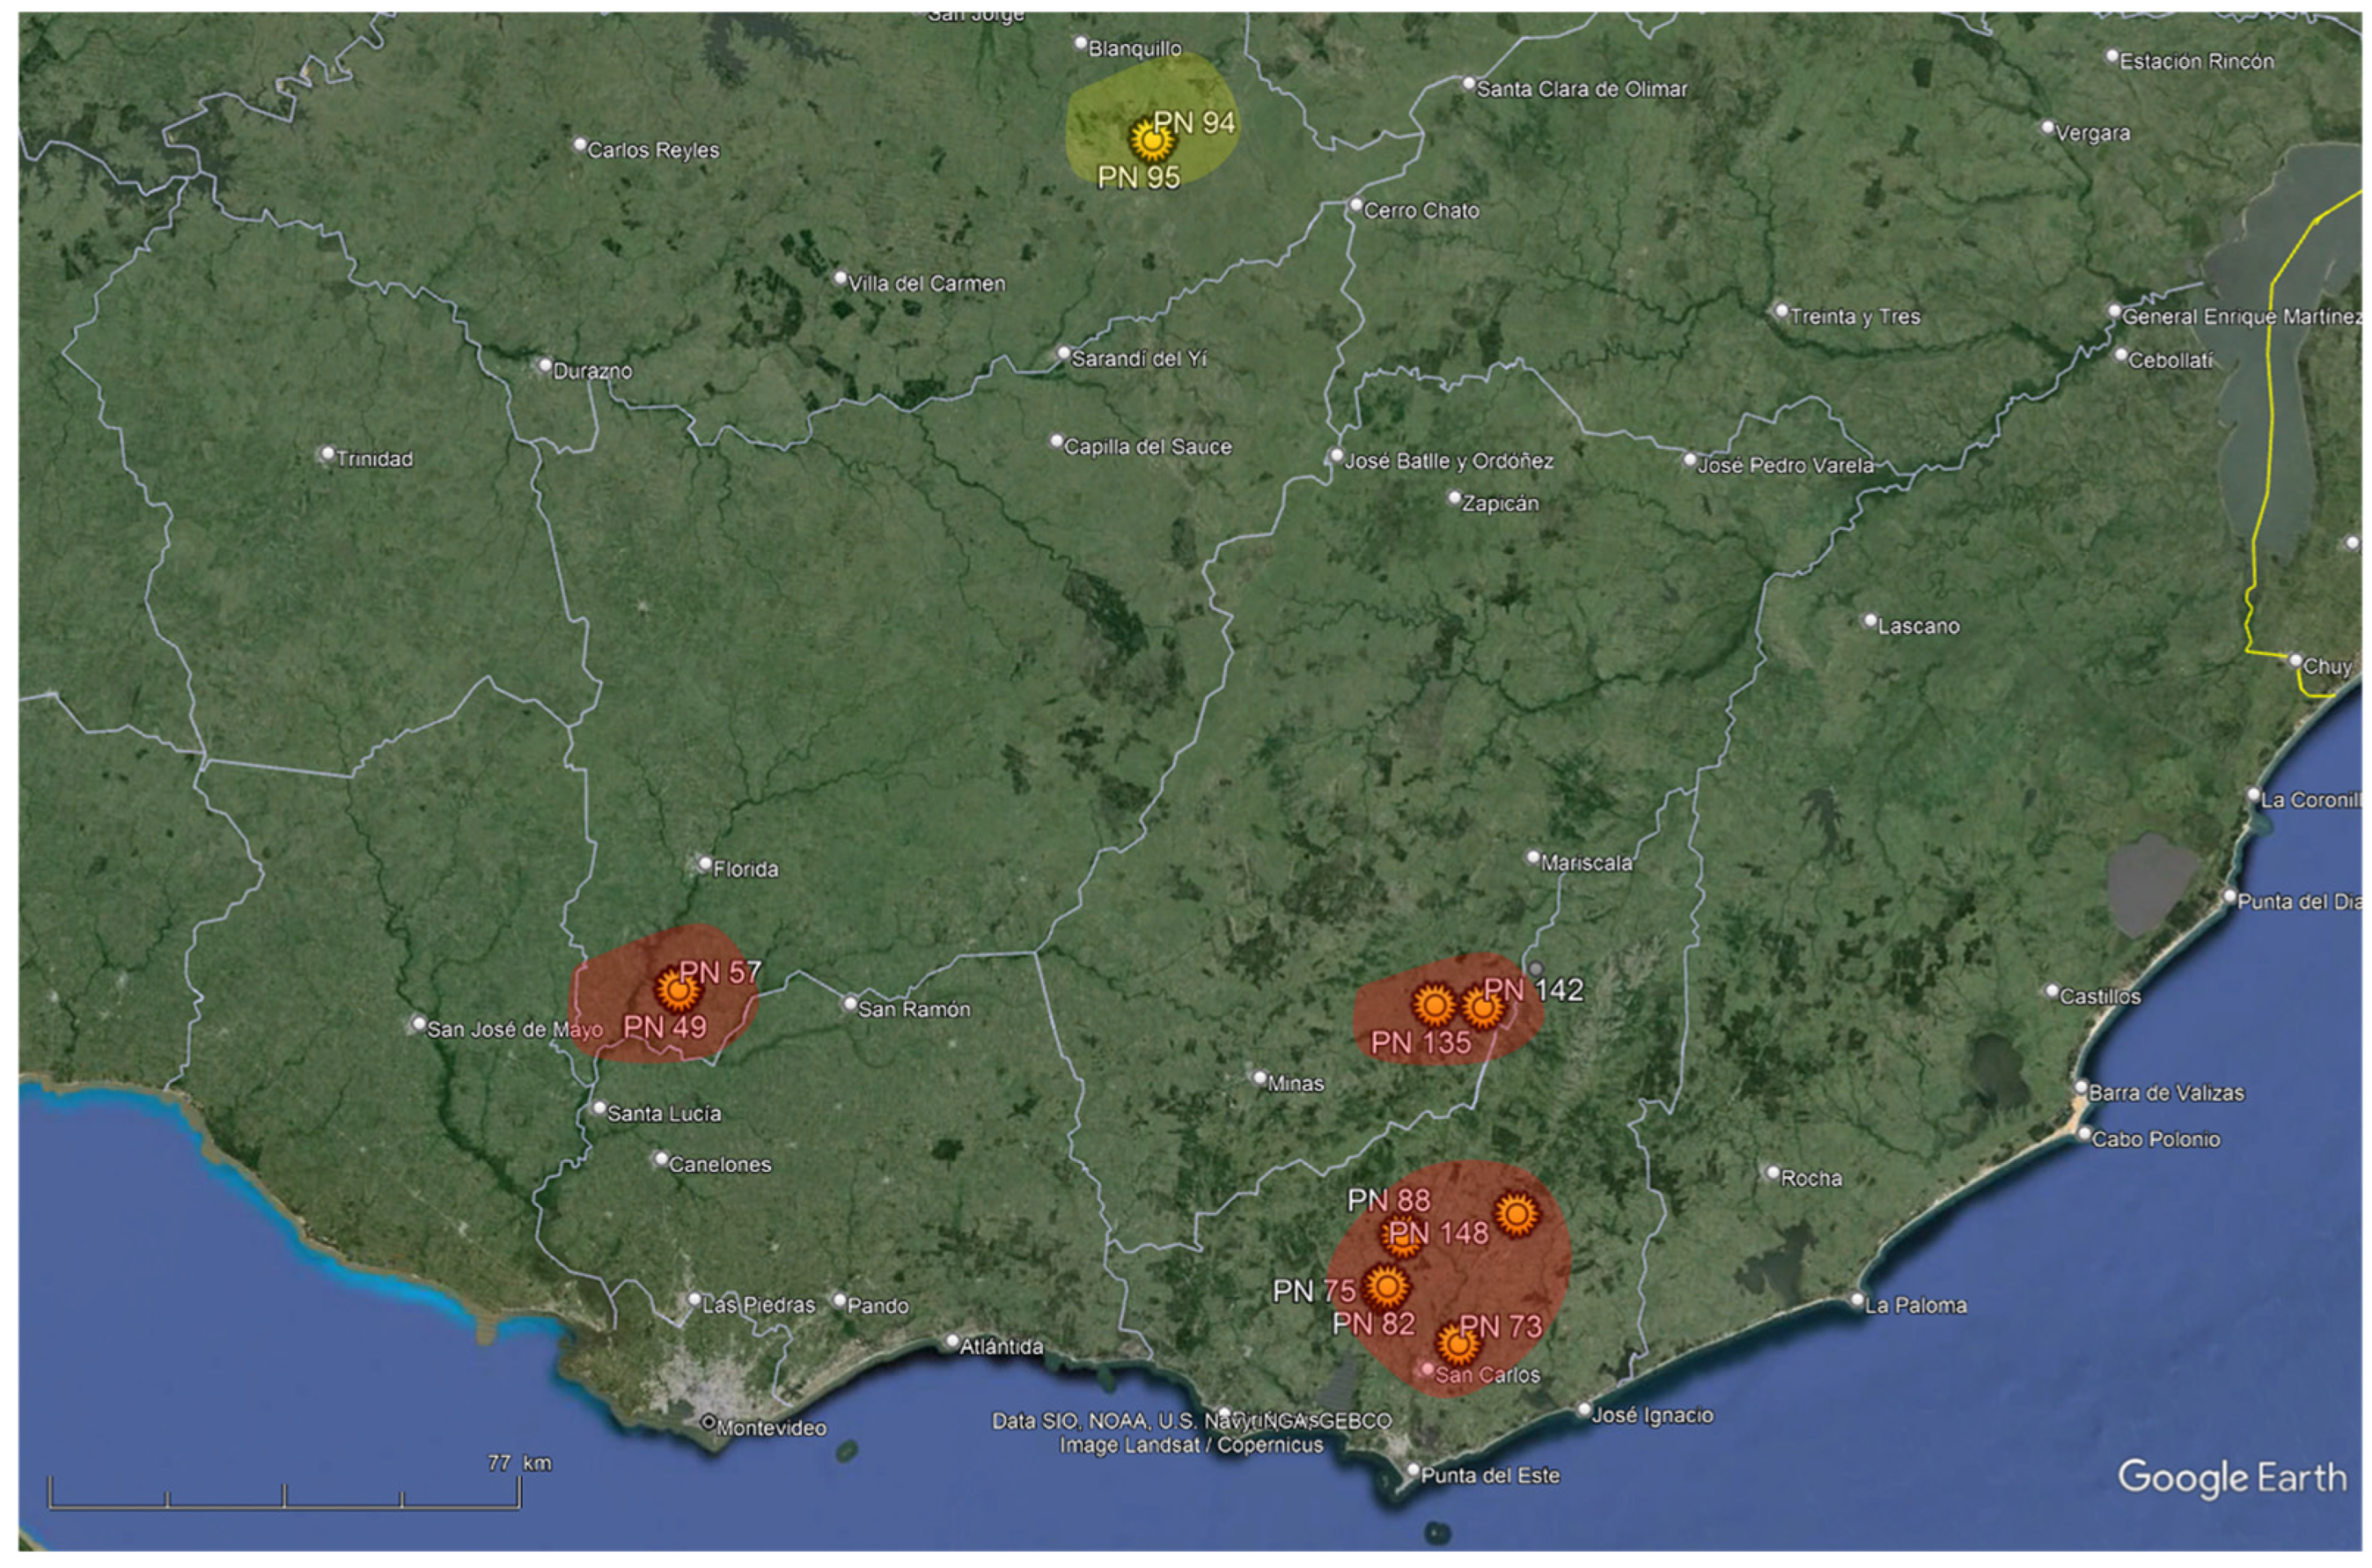
On a map of the studied area (Figure 10), we may define three areas with a confirmed hydrogen potential (red areas) because they are associated with small helium anomalies. The area north of the map (samples PN 94 and 95) does not show this evidence of helium. It could be interpreted in terms of the absence of deep gas flow in the two samples analyzed or another H2 generation process.
Figure 10.
Map of the studied area, with the red areas presenting the highest interest for hydrogen exploration. In the yellow area, the H2 content is high but there is no He, which may be due to a lack of deep flow or to another H2 generation process.
In conclusion, the gas analyses show that, apart from the H2 evidence in various spots of the studied area, adding the helium measurements allows us to distinguish areas affected by active deep gas flow from areas where the presence of H2 may be either due to gas desorption during our drilling operations or to artificial hydrogen generated during the drilling. Three sweet spots could be defined, as presented in Figure 10.
5. Conclusions
The Sierra Ballena and Cordillera shear zones act as leakage features for both H2 and helium; therefore, a review of potential aquifers, reservoirs and seals in the vicinity should be conducted. These zones also have the advantage of being close to the coast and to potential customers or export hubs should reserves be identified. The SBSZ extends northward into Brazil within the same geological context and warrants further attention.
The Sarandi del Yi Shear Zone exhibits lower H2 leakage in the south and does not contain helium anomalies in the north of the studied area. It may be considered as a second priority, but considering only a few data (Figure 4), additional measurements may be useful before drawing definitive conclusions, particularly as northern faults were reactivated during the Cenozoic [57].
The Archean craton looks promising and deserves more time for data acquisition. More generally, as only a small portion of Uruguay was covered through this first field trip, northward the presence of H2 also has to be tested. The reactivation of faults in this region, studied using high-resolution topographic data, has recently shown that this region is less stable than previously assumed [57]. This reactivation of ancient structures is confirmed by current seismicity [58] and may represent a highly favorable factor for the circulation of deep-sourced fluids, as confirmed here by the helium anomalies. In conclusion, the presence and concentration of H2 are very encouraging and strongly justify continued acquisitions to better understand the H2 and helium systems within the country.
Author Contributions
The three authors contributed equally: I.M., A.P. and V.R. participated in the field work, analyzed the data, and wrote, reviewed and edited the manuscript. All authors have read and agreed to the published version of the manuscript.
Funding
This research was also supported by the Pulsar Programme of Région Pays de la Loire.
Data Availability Statement
The original contributions presented in this study are included in the article. Further inquiries can be directed to the corresponding author.
Acknowledgments
We would like to express our warmest thanks to Ricardo Bertolotti and Juan Negro, who became passionate about natural H2 in the Southern Cone of South America, created Nativo, and made this work possible. We also benefited in the field from the presence and knowledge of Marcos Sequeira Callazo and Facundo Plenc, both students at the University of La Republica at Montevideo.
Conflicts of Interest
Author Isabelle Moretti was employed by the company MI-Energie. Author Alain Prinzhofer was employed by the company GEO4U. The authors declare that the research was conducted independently and that their affiliations did not influence the scientific outcomes of the study.
Appendix A
Field data. Data measured with a GA5000. CH4, CO2 and O2 in %, H2 in ppm, depth in cm. When depth is not specified, it is between 80 and 100 cm.
Table A1.
Identifier of the sample, coordinate and gas content of the soil gas; the remaining part is roughly the N2.
References
- Mao, S.; Yu, S.; Xu, J.; Chen, H.; Zhao, W.; Blunt, M.J.; Kang, Q.; Gross, M.; Chen, B.; Van Wijk, J.; et al. Geologic Hydrogen: A Review of Resource Potential, Subsurface Dynamics, Exploration, Production, Transportation, and Research Opportunities. Energy Environ. Sci. 2025, 18, 9991–10035. [Google Scholar] [CrossRef] [Scilit]
- Truche, L.; McCollom, T.M.; Martinez, I. Hydrogen and Abiotic Hydrocarbons: Molecules That Change the World. Elements 2020, 16, 13–18. [Google Scholar] [CrossRef] [Scilit]
- Hand, E. Hidden Hydrogen. Science 2023, 379, 630–636. [Google Scholar] [CrossRef] [Scilit]
- Reis, H.; Lhote, O. Exploring Natural Hydrogen in the Oldest Nuclei of Continents: Why Do Cratons Matter? In Natural Hydrogen Systems; Rezaee, R., Evans, B.J., Eds.; De Gruyter: Berlin, Germany, 2025; pp. 163–200. ISBN 978-3-11-143703-3. [Google Scholar]
- Maiga, O.; Deville, E.; Laval, J.; Prinzhofer, A.; Diallo, A.B. Trapping Processes of Large Volumes of Natural Hydrogen in the Subsurface: The Emblematic Case of the Bourakebougou H2 Field in Mali. Int. J. Hydrogen Energy 2024, 50, 640–647. [Google Scholar] [CrossRef] [Scilit]
- Zgonnik, V. The Occurrence and Geoscience of Natural Hydrogen: A Comprehensive Review. Earth-Sci. Rev. 2020, 203, 103140. [Google Scholar] [CrossRef] [Scilit]
- Moretti, I.; Geymond, U.; Pasquet, G.; Aimar, L.; Rabaute, A. Natural Hydrogen Emanations in Namibia: Field Acquisition and Vegetation Indexes from Multispectral Satellite Image Analysis. Int. J. Hydrogen Energy 2022, 47, 35588–35607. [Google Scholar] [CrossRef] [Scilit]
- Roche, V.; Geymond, U.; Boka-Mene, M.; Delcourt, N.; Portier, E.; Revillon, S.; Moretti, I. A New Continental Hydrogen Play in Damara Belt (Namibia). Sci. Rep. 2024, 14, 11655. [Google Scholar] [CrossRef] [Scilit]
- Boreham, C.J.; Edwards, D.S.; Czado, K.; Rollet, N.; Wang, L.; van der Wielen, S.; Champion, D.; Blewett, R.; Feitz, A.; Henson, P.A. Hydrogen in Australian Natural Gas: Occurrences, Sources and Resources. APPEA J. 2021, 61, 163. [Google Scholar] [CrossRef] [Scilit]
- Prinzhofer, A.; Moretti, I.; Françolin, J.; Pacheco, C.; D’Agostino, A.; Werly, J.; Rupin, F. Natural Hydrogen Continuous Emission from Sedimentary Basins: The Example of a Brazilian H2-Emitting Structure. Int. J. Hydrogen Energy 2019, 44, 5676–5685. [Google Scholar] [CrossRef] [Scilit]
- De Freitas, V.A.; Prinzhofer, A.; Françolin, J.B.; Ferreira, F.J.F.; Moretti, I. Natural Hydrogen System Evaluation in the São Francisco Basin (Brazil). Sci. Tech. Energ. Transition 2024, 79, 95. [Google Scholar] [CrossRef] [Scilit]
- Lollar, B.S.; Onstott, T.C.; Lacrampe-Couloume, G.; Ballentine, C.J. The Contribution of the Precambrian Continental Lithosphere to Global H2 Production. Nature 2014, 516, 379–382. [Google Scholar] [CrossRef] [Scilit]
- Lin, L.-H.; Slater, G.F.; Sherwood Lollar, B.; Lacrampe-Couloume, G.; Onstott, T.C. The Yield and Isotopic Composition of Radiolytic H2, a Potential Energy Source for the Deep Subsurface Biosphere. Geochim. Cosmochim. Acta 2005, 69, 893–903. [Google Scholar] [CrossRef] [Scilit]
- Geymond, U.; Ramanaidou, E.; Lévy, D.; Ouaya, A.; Moretti, I. Can Weathering of Banded Iron Formations Generate Natural Hydrogen? Evidence from Australia, Brazil and South Africa. Minerals 2022, 12, 163. [Google Scholar] [CrossRef] [Scilit]
- Murray, J.; Clément, A.; Fritz, B.; Schmittbuhl, J.; Bordmann, V.; Fleury, J.M. Abiotic Hydrogen Generation from Biotite-Rich Granite: A Case Study of the Soultz-Sous-Forêts Geothermal Site, France. Appl. Geochem. 2020, 119, 104631. [Google Scholar] [CrossRef] [Scilit]
- Hutchinson, I.P.; Jackson, O.; Stocks, A.E.; Barnicoat, A.C.; Lawrence, S.R. Greenstones as a Source of Hydrogen in Cratonic Sedimentary Basins. Geol. Soc. Lond. Spec. Publ. 2024, 547, 511–525. [Google Scholar] [CrossRef] [Scilit]
- Sequeira, M.; Morales, E.; Moretti, I.; Veroslavsky, G.; Plenc, F.; d’Avila, R.; De Santa Ana, H. Natural Hydrogen in Uruguay: Catalog of H2-Generating Rocks, Prospective Exploration Areas, and Potential Systems. Geosciences 2025, 15, 54. [Google Scholar] [CrossRef] [Scilit]
- Serratt, H.; Cupertino, J.A.; Cruz, M.F.; Girelli, T.J.; Lehn, I.; Teixeira, C.D.; Oliveira, H.O.S.; Chemale, F., Jr. Southern Brazil Hydrogen Systems Review. Int. J. Hydrogen Energy 2024, 69, 347–357. [Google Scholar] [CrossRef] [Scilit]
- Prinzhofer, A.; Tahara Cissé, C.S.; Diallo, A.B. Discovery of a Large Accumulation of Natural Hydrogen in Bourakebougou (Mali). Int. J. Hydrogen Energy 2018, 43, 19315–19326. [Google Scholar] [CrossRef] [Scilit]
- Es-sabbar, I.; Toubri, Y.; En-nabbadi, R.; Raji, O.; Berkat, N.E.; Ghadi, T.; El Baroudi, M.; Ouabid, M.; Rezouki, I.; Sadki, O.; et al. Natural Hydrogen Occurrences in Northwest Morocco: Evidence from Subsurface Data and Soil Gas Surveys. Int. J. Hydrogen Energy 2026, 204, 153344. [Google Scholar] [CrossRef] [Scilit]
- Bossi, J. Geología Del Uruguay; Departamento de Publicaciones, Universidad de La República: Montevideo, Uruguay, 1966. [Google Scholar]
- Fragoso Cesar, A.R.S. O Cráton Do Río de La Plata e o Cinturão Dom Feliciano No Escudo Uruguaio-Sul-Riograndense. Anais 1980, 5, 2879–2892. [Google Scholar]
- Gaucher, C.; Frei, R.; Samaniego, L.; Will, T.M.; Chemale, F.; Gargiulo, M.F.; Poiré, D.G.; Ling, X.; Li, X.-H.; Li, Q.-L. The Tapes Complex (Nico Pérez Terrane, Uruguay): Constraining the Mesoproterozoic Evolution of the Río de La Plata Craton. J. South Am. Earth Sci. 2021, 105, 102906. [Google Scholar] [CrossRef] [Scilit]
- Basei, M.A.S.; Frimmel, H.E.; Campos Neto, M.D.C.; De Araujo, C.E.G.; De Castro, N.A.; Passarelli, C.R. The Tectonic History of the Southern Adamastor Ocean Based on a Correlation of the Kaoko and Dom Feliciano Belts. In Geology of Southwest Gondwana; Siegesmund, S., Basei, M.A.S., Oyhantçabal, P., Oriolo, S., Eds.; Regional Geology Reviews; Springer International Publishing: Cham, Switzerland, 2018; pp. 63–85. ISBN 978-3-319-68919-7. [Google Scholar]
- Morales, E.; Pedro, A.; De León, R. Geothermal Gradients and Heat Flow in Norte Basin of Uruguay. Int. J. Terr. Heat Flow Appl. Geotherm. 2020, 3, 20–25. [Google Scholar] [CrossRef] [Scilit]
- Rossello, E.; De Santa Ana, H.; Veroslavsky, G. El Lineamiento Santa Lucía-Aiguá-Merín (Uruguay): Un Corredor Tectónico Extensivo y Transcurrente Dextral Precursor de La Apertura Atlántica. Rev. Bras. Geociências 2000, 30, 749–756. [Google Scholar] [CrossRef] [Scilit]
- Bossi, J.; Campal, N. Granitos Negros Filonianos Del Uruguay: Resultados de Las Investigaciones; CIID-Facultad de Agronomía: Montevideo, Uruguay, 1991; pp. 1–71. [Google Scholar]
- Lévy, D.; Roche, V.; Pasquet, G.; Combaudon, V.; Geymond, U.; Loiseau, K.; Moretti, I. Natural H2 Exploration: Tools and Workflows to Characterize a Play. Sci. Tech. Energ. Transition 2023, 78, 27. [Google Scholar] [CrossRef] [Scilit]
- Moretti, I.; Prinzhofer, A.; Ammouial, J.; Bouton, N. Natural Hydrogen Generation from Phanerozoic Sedimentary Siderite. Minerals 2025, 15, 1218. [Google Scholar] [CrossRef] [Scilit]
- Rosière, C.A.; Heimann, A.; Oyhantçabal, P.; Santos, J.O.S. The Iron Formations of the South American Platform. In Geology of Southwest Gondwana; Siegesmund, S., Basei, M.A.S., Oyhantçabal, P., Oriolo, S., Eds.; Regional Geology Reviews; Springer International Publishing: Cham, Switzerland, 2018; pp. 493–526. ISBN 978-3-319-68919-7. [Google Scholar]
- Ballentine, C.J.; Karolytė, R.; Cheng, A.; Sherwood Lollar, B.; Gluyas, J.G.; Daly, M.C. Natural Hydrogen Resource Accumulation in the Continental Crust. Nat. Rev. Earth Environ. 2025, 6, 342–356. [Google Scholar] [CrossRef] [Scilit]
- Moretti, I.; Bouton, N.; Ammouial, J.; Carrillo Ramirez, A. The H2 Potential of the Colombian Coals in Natural Conditions. Int. J. Hydrogen Energy 2024, 77, 1443–1456. [Google Scholar] [CrossRef] [Scilit]
- Horsfield, B.; Mahlstedt, N.; Weniger, P.; Misch, D.; Vranjes-Wessely, S.; Han, S.; Wang, C. Molecular Hydrogen from Organic Sources in the Deep Songliao Basin, P.R. China. Int. J. Hydrogen Energy 2022, 47, 16750–16774. [Google Scholar] [CrossRef] [Scilit]
- Arrouvel, C.; Prinzhofer, A. Genesis of Natural Hydrogen: New Insights from Thermodynamic Simulations. Int. J. Hydrogen Energy 2021, 46, 18780–18794. [Google Scholar] [CrossRef] [Scilit]
- McCollom, T.M.; Klein, F.; Robbins, M.; Moskowitz, B.; Berquó, T.S.; Jöns, N.; Bach, W.; Templeton, A. Temperature Trends for Reaction Rates, Hydrogen Generation, and Partitioning of Iron during Experimental Serpentinization of Olivine. Geochim. Cosmochim. Acta 2016, 181, 175–200. [Google Scholar] [CrossRef] [Scilit]
- Leong, J.A.; Nielsen, M.; McQueen, N.; Karolytė, R.; Hillegonds, D.J.; Ballentine, C.; Darrah, T.; McGillis, W.; Kelemen, P. H2 and CH4 Outgassing Rates in the Samail Ophiolite, Oman: Implications for Low-Temperature, Continental Serpentinization Rates. Geochim. Cosmochim. Acta 2023, 347, 1–15. [Google Scholar] [CrossRef] [Scilit]
- Geymond, U.; Briolet, T.; Combaudon, V.; Sissmann, O.; Martinez, I.; Duttine, M.; Moretti, I. Reassessing the Role of Magnetite during Natural Hydrogen Generation. Front. Earth Sci. 2023, 11, 1169356. [Google Scholar] [CrossRef] [Scilit]
- Lopez-Lazaro, C.; Bachaud, P.; Moretti, I.; Ferrando, N. Predicting the Phase Behavior of Hydrogen in NaCl Brines by Molecular Simulation for Geological Applications. BSGF Earth Sci. Bull. 2019, 190, 7. [Google Scholar] [CrossRef] [Scilit]
- Nicoletti, L.; Hidalgo, J.C.; Strąpoć, D.; Moretti, I. H2 Transport in Sedimentary Basin. Geosciences 2025, 15, 298. [Google Scholar] [CrossRef] [Scilit]
- Abdullahi, M.; Gay, A.; Saspiturry, N.; Hidalgo, J.C.; Godard, M. Modelling Radiolytic Natural Hydrogen from a Fractured Basement: Generation, Migration, and Sequestration Potential (Taranaki Basin–New Zealand). Basin Res. 2025, 37, e70078. [Google Scholar] [CrossRef] [Scilit]
- Maiga, O.; Deville, E.; Laval, J.; Prinzhofer, A.; Diallo, A.B. Characterization of the Spontaneously Recharging Natural Hydrogen Reservoirs of Bourakebougou in Mali. Sci. Rep. 2023, 13, 11876. [Google Scholar] [CrossRef] [Scilit]
- Prinzhofer, A.; Cacas-Stentz, M.-C. Natural Hydrogen and Blend Gas: A Dynamic Model of Accumulation. Int. J. Hydrogen Energy 2023, 48, 21610–21623. [Google Scholar] [CrossRef] [Scilit]
- Larin, N.; Zgonnik, V.; Rodina, S.; Deville, E.; Prinzhofer, A.; Larin, V.N. Natural Molecular Hydrogen Seepage Associated with Surficial, Rounded Depressions on the European Craton in Russia. Nat. Resour. Res. 2015, 24, 369–383. [Google Scholar] [CrossRef] [Scilit]
- Zgonnik, V.; Beaumont, V.; Deville, E.; Larin, N.; Pillot, D.; Farrell, K.M. Evidence for Natural Molecular Hydrogen Seepage Associated with Carolina Bays (Surficial, Ovoid Depressions on the Atlantic Coastal Plain, Province of the USA). Prog. Earth Planet. Sci. 2015, 2, 31. [Google Scholar] [CrossRef] [Scilit]
- Carrillo Ramirez, A.; Gonzalez Penagos, F.; Rodriguez, G.; Moretti, I. Natural H2 Emissions in Colombian Ophiolites: First Findings. Geosciences 2023, 13, 358. [Google Scholar] [CrossRef] [Scilit]
- Sibson, R.H. Crustal Stress, Faulting and Fluid Flow. Geol. Soc. Lond. Spec. Publ. 1994, 78, 69–84. [Google Scholar] [CrossRef] [Scilit]
- Donzé, F.V.; Bourdet, L.; Truche, L.; Dusséaux, C.; Huyghe, P. Modeling Deep Control Pulsing FLux of Native H2 throughout Tectonic Fault-Valve Systems. Int. J. Hydrogen Energy 2024, 58, 1443–1456. [Google Scholar] [CrossRef] [Scilit]
- Lefeuvre, N.; Truche, L.; Donzé, F.; Ducoux, M.; Barré, G.; Fakoury, R.; Calassou, S.; Gaucher, E.C. Native H2 Exploration in the Western Pyrenean Foothills. Geochem. Geophys. Geosyst. 2021, 22, e2021GC009917. [Google Scholar] [CrossRef] [Scilit]
- Truche, L.; Donzé, F.-V.; Goskolli, E.; Muceku, B.; Loisy, C.; Monnin, C.; Dutoit, H.; Cerepi, A. A Deep Reservoir for Hydrogen Drives Intense Degassing in the Bulqizë Ophiolite. Science 2024, 383, 618–621. [Google Scholar] [CrossRef] [Scilit] [PubMed]
- Frery, E.; Langhi, L.; Maison, M.; Moretti, I. Natural Hydrogen Seeps Identified in the North Perth Basin, Western Australia. Int. J. Hydrogen Energy 2021, 46, 31158–31173. [Google Scholar] [CrossRef] [Scilit]
- Prinzhofer, A.; Rigollet, C.; Lefeuvre, N.; Françolin, J.; Valadão De Miranda, P.E. Maricá (Brazil), the New Natural Hydrogen Play Which Changes the Paradigm of Hydrogen Exploration. Int. J. Hydrogen Energy 2024, 62, 91–98. [Google Scholar] [CrossRef] [Scilit]
- Moretti, I.; Prinzhofer, A.; Françolin, J.; Pacheco, C.; Rosanne, M.; Rupin, F.; Mertens, J. Long-Term Monitoring of Natural Hydrogen Superficial Emissions in a Brazilian Cratonic Environment. Sporadic Large Pulses versus Daily Periodic Emissions. Int. J. Hydrogen Energy 2021, 46, 3615–3628. [Google Scholar] [CrossRef] [Scilit]
- Davies, K.; Josse, R.; Frery, E.; Esteban, L.; Keshavarz, A.; Iglauer, S. Distinguishing Drilling-Induced Artifacts from Naturally Occurring Hydrogen in Soil Gas Surveys: Insights from Sub-Circular Depressions. Int. J. Hydrogen Energy 2025, 109, 1230–1240. [Google Scholar] [CrossRef] [Scilit]
- Patiño, C.; Piedrahita, D.; Colorado, E.; Aristizabal, K.; Moretti, I. Natural H2 Transfer in Soil: Insights from Soil Gas Measurements at Varying Depths. Geosciences 2024, 14, 296. [Google Scholar] [CrossRef] [Scilit]
- Myagkiy, A.; Brunet, F.; Popov, C.; Krüger, R.; Guimarães, H.; Sousa, R.S.; Charlet, L.; Moretti, I. H2 Dynamics in the Soil of a H2-Emitting Zone (São Francisco Basin, Brazil): Microbial Uptake Quantification and Reactive Transport Modelling. Appl. Geochem. 2020, 112, 104474. [Google Scholar] [CrossRef] [Scilit]
- Etiope, G.; Ciotoli, G.; Benà, E.; Mazzoli, C.; Röckmann, T.; Sivan, M.; Squartini, A.; Laemmel, T.; Szidat, S.; Haghipour, N.; et al. Surprising Concentrations of Hydrogen and Non-Geological Methane and Carbon Dioxide in the Soil. Sci. Total Environ. 2024, 948, 174890. [Google Scholar] [CrossRef] [Scilit] [PubMed]
- Haag, M.B.; Schoenbohm, L.M.; Dalla Lana Michel, R.; Dos Santos Scherer, C.M.; Veroslavsky, G.; Marmisolle, J. Morphometric Evidence for Cenozoic Intraplate Reactivation in NW Uruguay. Tectonics 2025, 44, e2025TC009070. [Google Scholar] [CrossRef] [Scilit]
- Bettucci, L.S.; Kacevas, M.R.; Castro, H.; Olivet, J.L.; Latorres, E. Summary of the Intracontinental Seismicity of Uruguay. J. South Am. Earth Sci. 2025, 161, 105578. [Google Scholar] [CrossRef] [Scilit]

Disclaimer/Publisher’s Note: The statements, opinions and data contained in all publications are solely those of the individual author(s) and contributor(s) and not of MDPI and/or the editor(s). MDPI and/or the editor(s) disclaim responsibility for any injury to people or property resulting from any ideas, methods, instructions or products referred to in the content. |
© 2026 by the authors. Licensee MDPI, Basel, Switzerland. This article is an open access article distributed under the terms and conditions of the Creative Commons Attribution (CC BY) license.