


Abstract
We present a high-resolution 3-D shear-wave velocity model of the Indonesian lithosphere and upper mantle, constructed through a weighted joint inversion of complementary surface wave datasets. Our model integrates teleseismic Rayleigh waves from 387 earthquakes recorded at 31 stations, analyzed using a modified two-plane-wave tomography method, with two years of ambient noise data from 30 stations processed via image transformation techniques. Our results provide new structural constraints on the four principal subduction systems in Indonesia. Along the Sunda–Java Trench, the slab exhibits a systematic along-strike transition from a continuous and well-defined geometry in the west to increasingly disrupted and thickened structures toward the east. This evolution correlates with the subduction of progressively older lithosphere. Beneath the Banda Arc, we image a continuous slab whose dramatic 180° curvature and deep coalescence of distinct segments provide direct evidence for a single-slab rollback and folding origin. In the Molucca Sea region, tomography reveals a shallow low-velocity zone and resolves the complex geometry of an active double-sided subduction system associated with arc–arc collision. Collectively, these findings provide unprecedented constraints on slab segmentation and deformation, highlighting the dominant control of lithospheric age and complex plate interactions on the geodynamic evolution of this exceptional convergent boundary.
1. Introduction
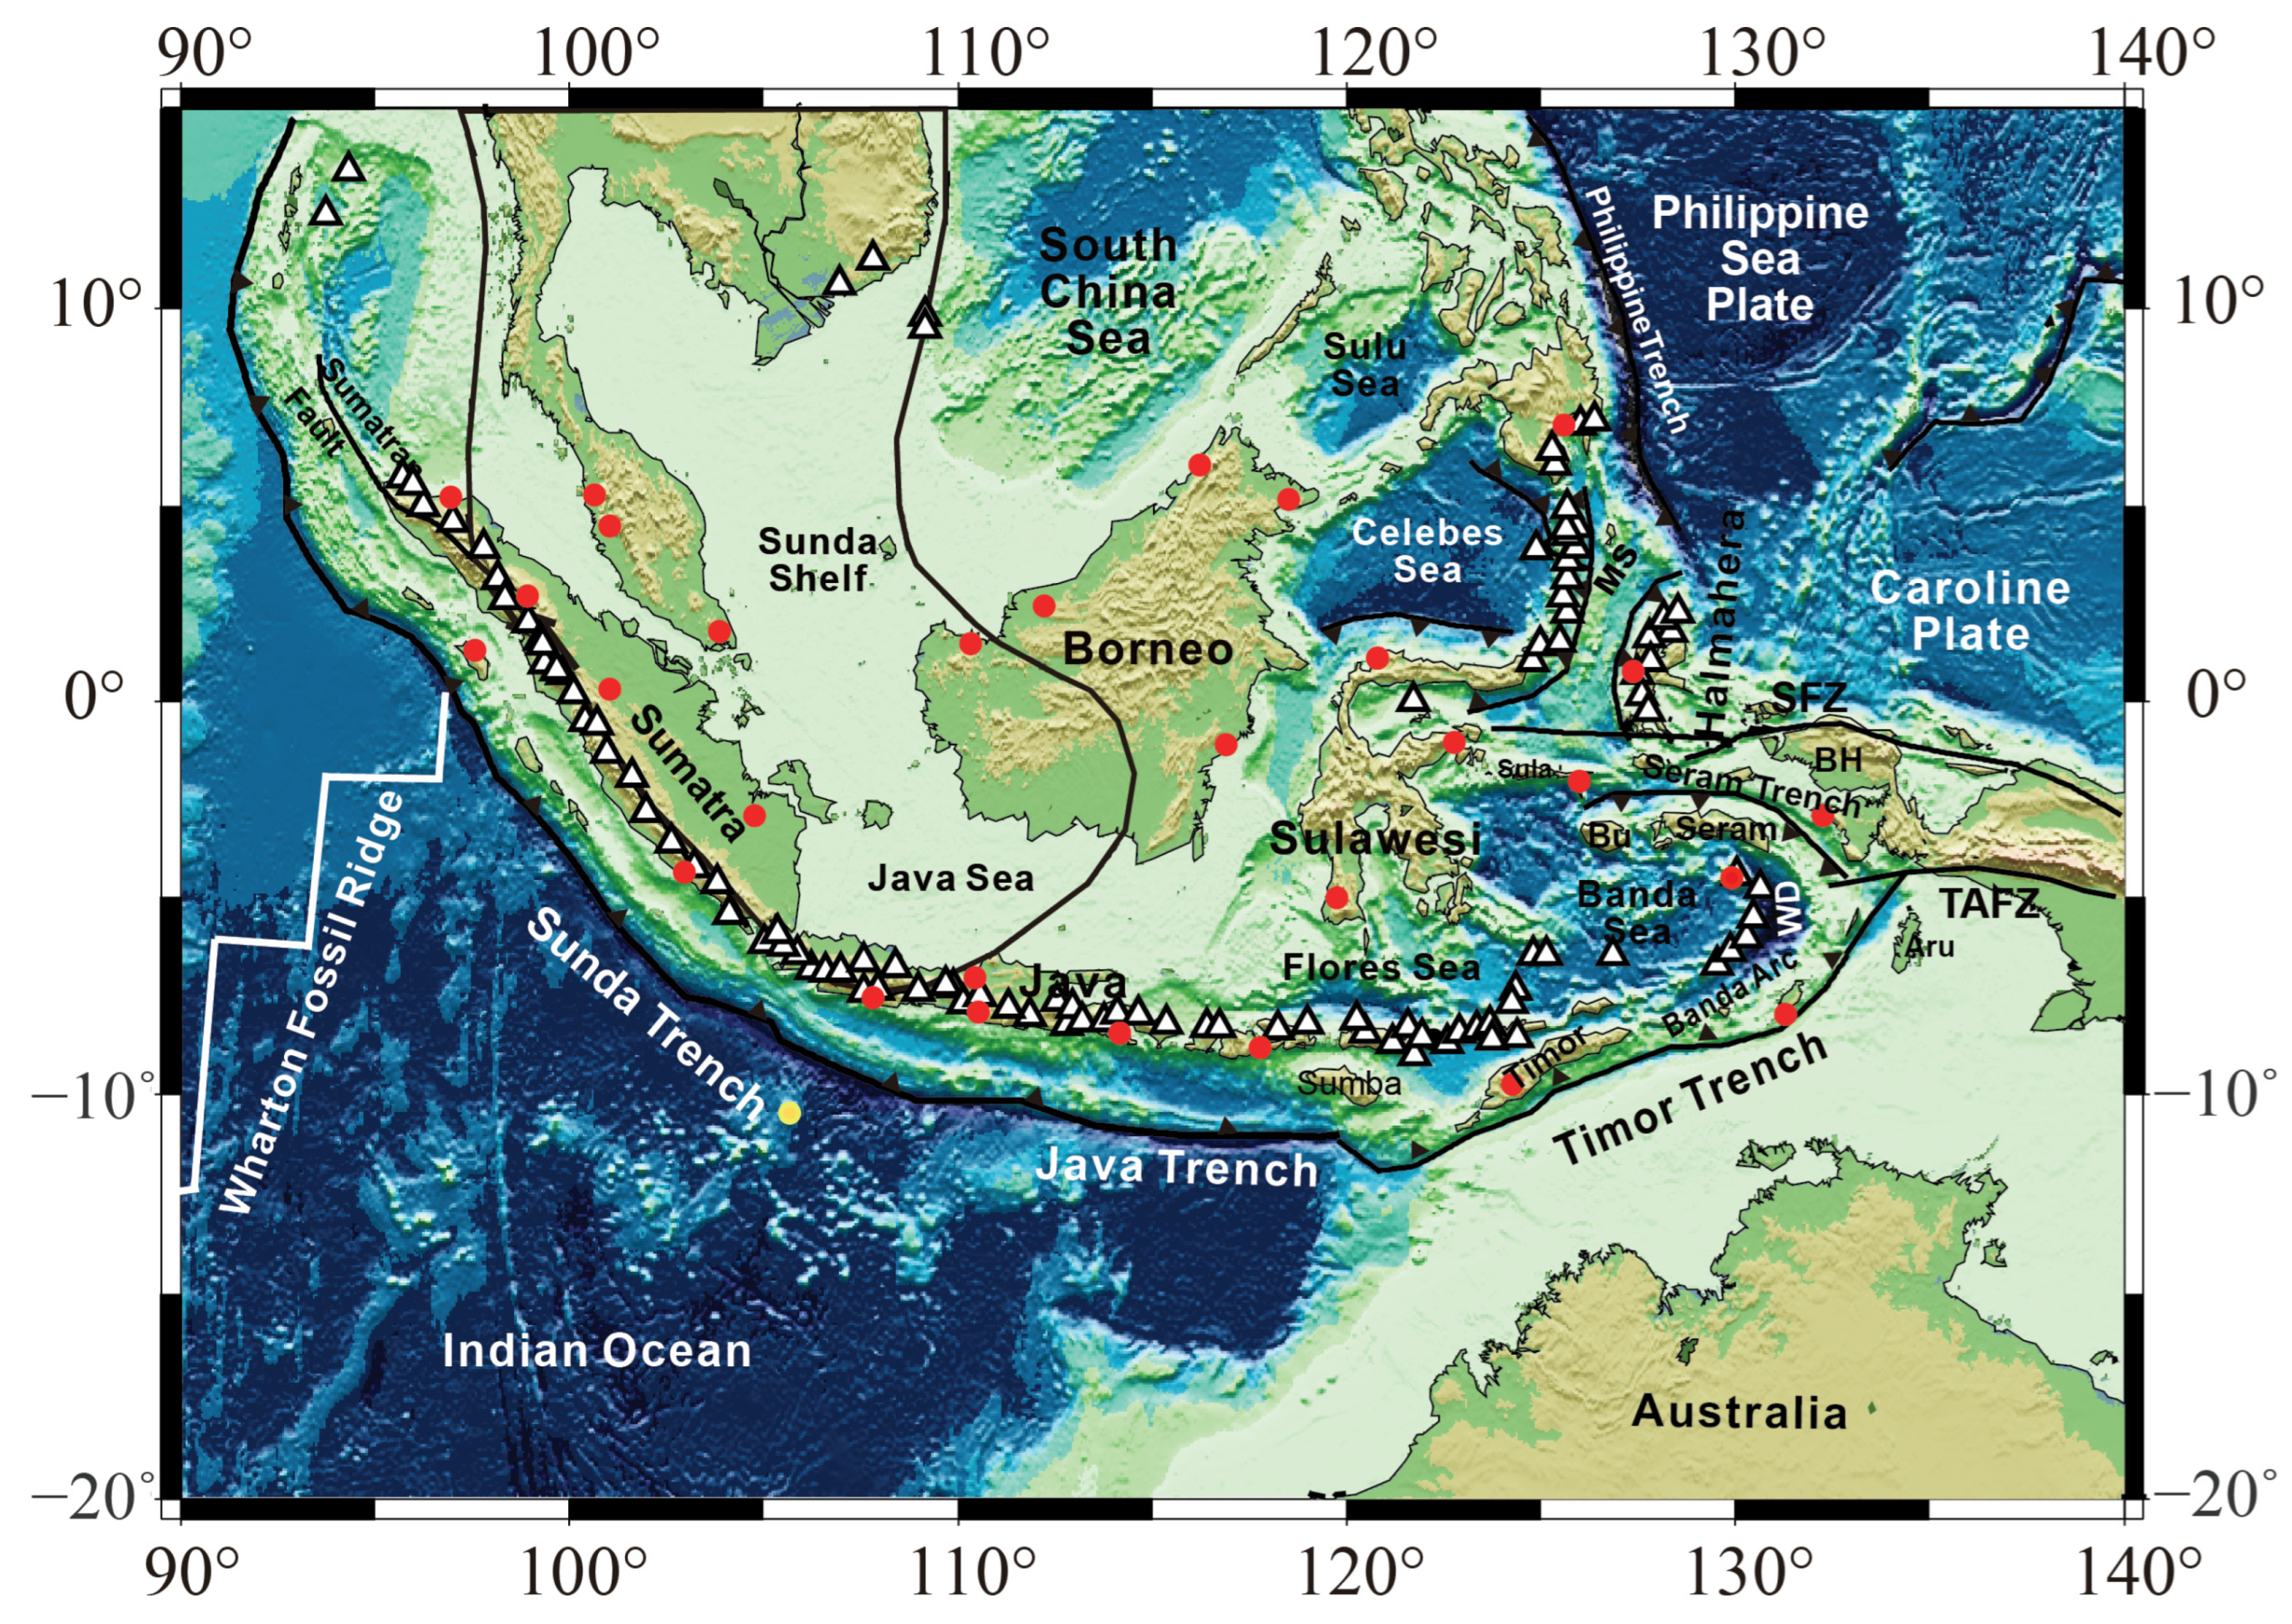
Located at the convergence of the Indian–Australian, Eurasian, and Philippine Sea plates, the Indonesian archipelago represents one of the most tectonically complex regions on Earth. It assembles subduction zones, arc–arc collisions, and lithospheric accretion both along and within plate boundaries, producing a unique geological and tectonic framework. The Sundaland shelf, forming the core of Southeast Asia, comprises Sumatra, the Indochina block, southwestern Borneo, and the Java Sea, as shown in Figure 1 [1]. As the Indian–Australian plate subducts beneath Eurasia, Borneo has undergone significant counter-clockwise rotation [2,3], and its southwestern margin has been involved in subduction-related accretion [4]. Fragments derived from the Australian plate, including parts of Sulawesi, have rifted and accreted to eastern Indonesia, forming marginal basins such as the Sulu and Celebes Seas [1]. The dynamics of such convergent margins are fundamentally expressed through subduction, a process whose kinematics vary systematically. Comprehensive kinematic analysis of global subduction systems reveals a first-order asymmetry between west-directed and east- or northeast-directed subduction zones, influencing patterns of back-arc extension, upper plate deformation, and the very driving forces of plate motion. The Indonesian subduction system, exemplified by the Andaman–Sunda–Indonesia Arc, exhibits a dominant NE- to NNE-directed plate motion in the no-net-rotation (NNR) reference frame. In contrast, the Banda Arc could be typical of W-directed subductions [5].
Figure 1.
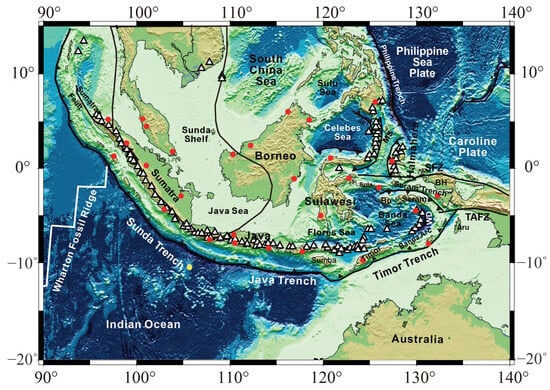
Map of Indonesia and adjacent regions with tectonic plate boundaries, subduction zones, major faults (redraw after refs. [6,7,8]), and seismic stations (red circles for onshore stations and yellow for offshore station) used in this study. According to refs. [7,9], Bu: Buru; BH: Bird’s Head; SFZ: Sorong Fault zone; TAFZ: Tarera Aiduna Fault zone; MS: Molucca Sea; WD: Weber Deep. The location of the extinct Wharton Fossil Ridge came from ref. [10].
The most prominent subduction system is the Sunda–Java Trench (Figure 1), where the Indian–Australian plate subducts beneath Sumatra and Java at ~60 mm/yr [11,12]. Although the trench appears continuous along strike, the age of the subducting oceanic lithosphere varies substantially, from ~40 Ma beneath southern Sumatra to ~160 Ma beneath eastern Java [10]. Seismicity patterns reflect such age variation: earthquakes beneath Sumatra rarely exceed depths of 300 km, whereas seismicity beneath Java extends to depths greater than 670 km [13]. Further east, collision between the Australian continental lithosphere and the Banda Arc began approximately 5 Ma ago [1,14,15,16], leading to forearc uplift and intense deformation. The Sulawesi region, bounded by the Banda, Molucca, and Celebes Seas, is among the most geodynamically complex areas on the planet. The Celebes Sea subducts beneath northern Sulawesi, while the Molucca Sea hosts an active double-sided subduction system beneath the Halmahera and Sangihe Arcs. This arc–arc collision represents the only currently active example of its kind on Earth [17,18,19]. The geometry of this double-sided subduction remains debated, with competing models proposing either opposing [3,7] or face-to-face slab configurations [8,20].
Owing to this geological and tectonic complexity, the region has been investigated using a wide range of methods, including geological reconstruction, seismicity and anisotropy analysis, mantle flow modeling, and seismic tomography [1,2,21,22,23,24,25,26]. Among these, seismic tomography has established itself as a cornerstone of geodynamics, providing the critical three-dimensional framework that connects seismic observations directly to the physics of mantle convection and plate tectonics. This utility stems from its evolving capability to image Earth’s interior. Foundational work demonstrated how tomographic models could be quantitatively compared with mantle circulation simulations, revealing large-scale consistencies while also highlighting the challenge of relating seismic velocity to density [27]. Subsequent methodological advances, such as tomographic filtering, have enabled more robust and equitable comparisons between seismic observations and numerical geodynamic models [28]. For subduction systems, tomography provides direct constraints on slab morphology and deformation, offering essential spatial benchmarks for dynamic models [29]. The field is now advancing beyond purely thermal interpretations; modern studies integrate mineral physics and thermodynamics with tomography to disentangle the competing effects of temperature, composition, melt, and volatiles, yielding a more nuanced, thermochemical view of the mantle state [30,31].
Despite this transformative potential, applying seismic tomography to unravel the specific complexities of the Indonesian margin presents a distinct challenge. Existing global P-wave tomographic models, including UU-P07 [32], successfully image deep slab structures, while they lack the resolution necessary to delineate lithospheric-scale architecture in detail. Therefore, high-resolution imaging of the lithosphere and uppermost mantle is essential to resolve the geometry of subducting slabs, the processes of arc–continent collision, and the structure of the shallow mantle across this uniquely complex convergent boundary.
Both surface wave tomography and ambient noise tomography provide high-resolution imaging of the lithosphere and upper mantle. These methods, when used individually or in joint inversion, have been successfully applied in various regions. For example, joint inversion for phase velocity maps in Hawaii [33], ambient noise tomography in the Hainan Plume [34], a 3-D experiment in engineering application [35], and surface wave tomography based on shortest-path ray tracing [36] have all yielded valuable insights.
To address the gap in shallow structural resolution across Indonesia, we apply a weighted joint inversion of teleseismic Rayleigh waves and ambient noise phase velocities recorded at more than 30 broadband stations from IRIS and GEOFON. The integration of these complementary datasets allows us to construct a robust three-dimensional shear-wave velocity model of the lithosphere and upper mantle. This model provides new and independent constraints on slab geometry and tectonic processes within this complex convergent boundary.
2. Data
2.1. Rayleigh Wave Dataset and Processing
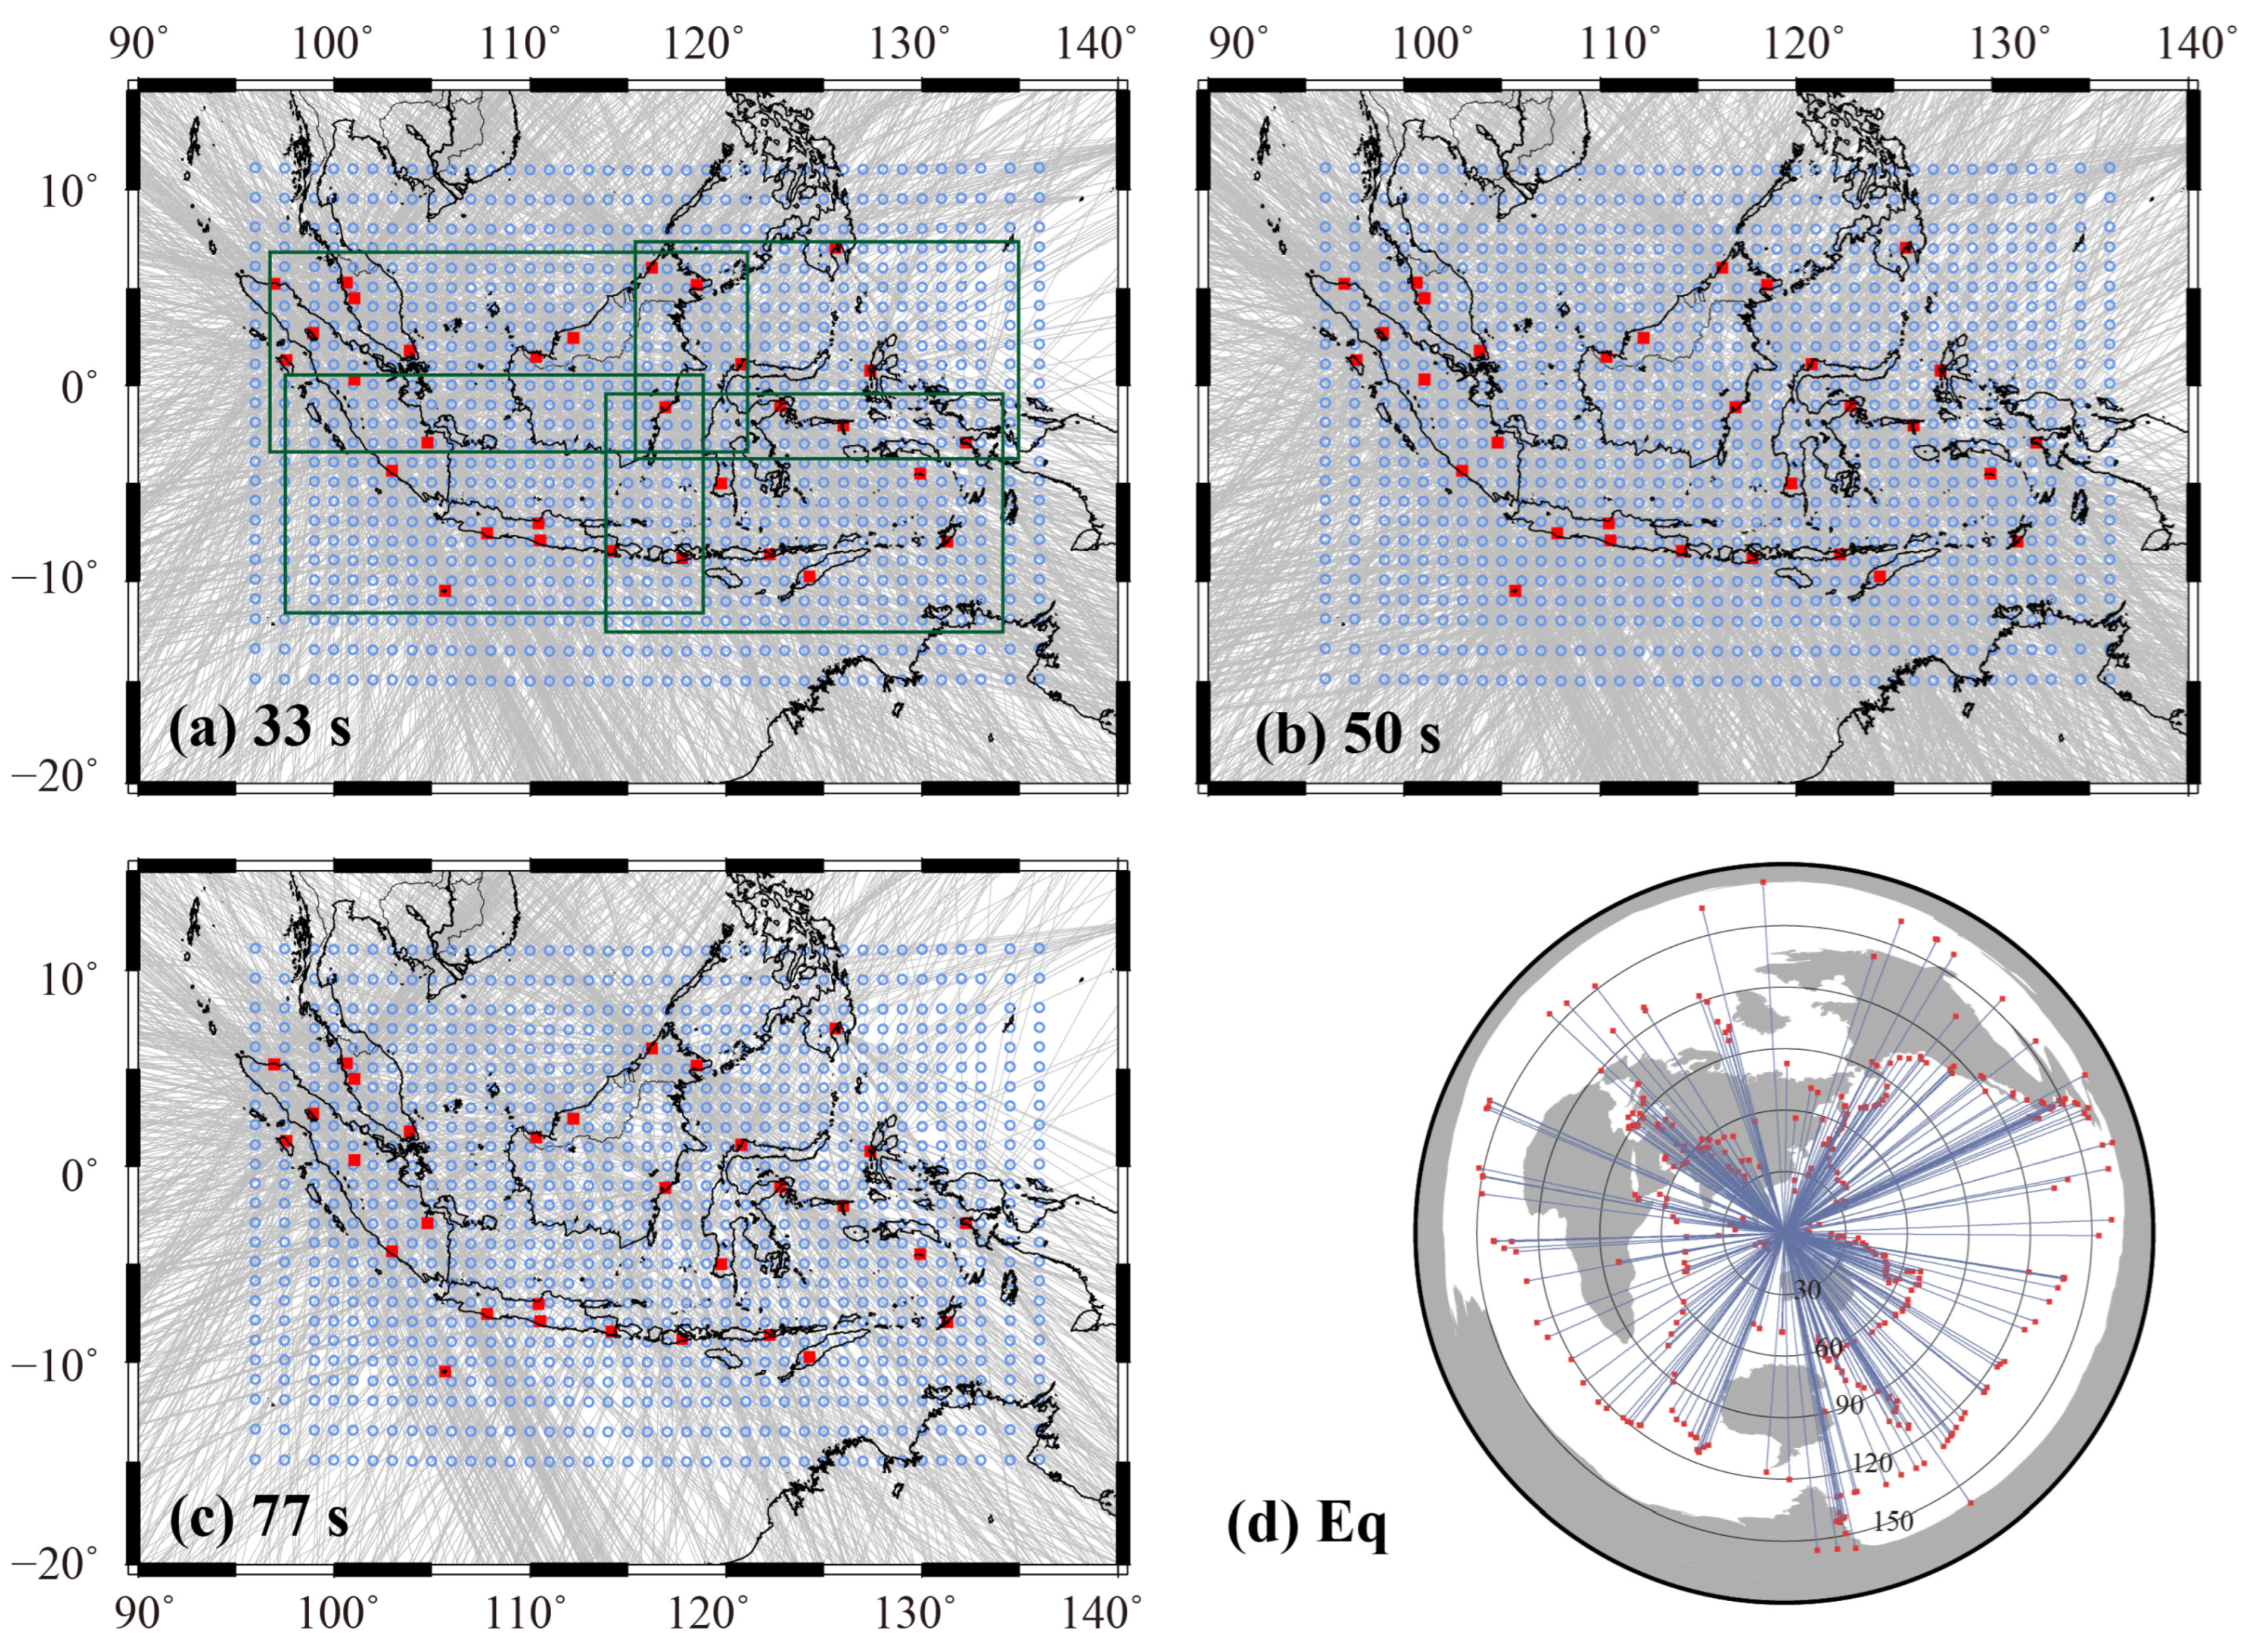
A total of 387 shallow earthquakes were selected from more than 1600 events with magnitudes MS ≥ 5.5 and epicentral distances between 25° and 170°, occurring between 2009 and 2013. Events were chosen to achieve the most uniform possible distribution of back azimuths (Figure 2). Rayleigh waves were recorded at 31 broadband stations distributed across Indonesia (Figure 1), including seven stations from IRIS and the remainder from GEOFON.
Figure 2.
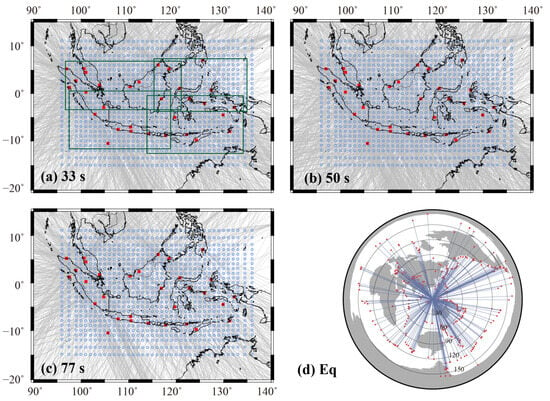
The study region is parameterized by grid nodes shown as open blue circles. Red squares mark seismic stations. The gray lines are great circle raypaths of all Rayleigh waves at the period of 33 s (a), 50 s (b) and 77 s (c). The stations in the four green rectangles were taken as a group in the inversion to inverse the initial two-plane wave parameters. (d) shows the distribution of the earthquakes used as Rayleigh wave sources.
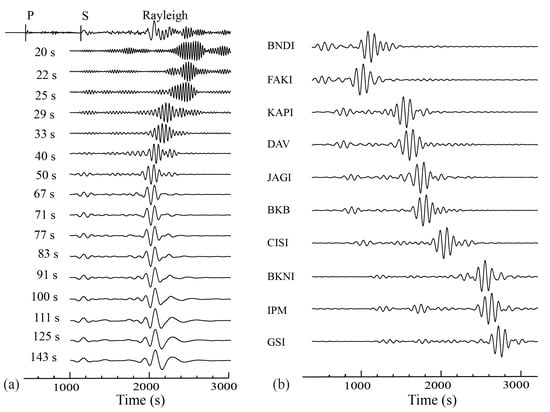
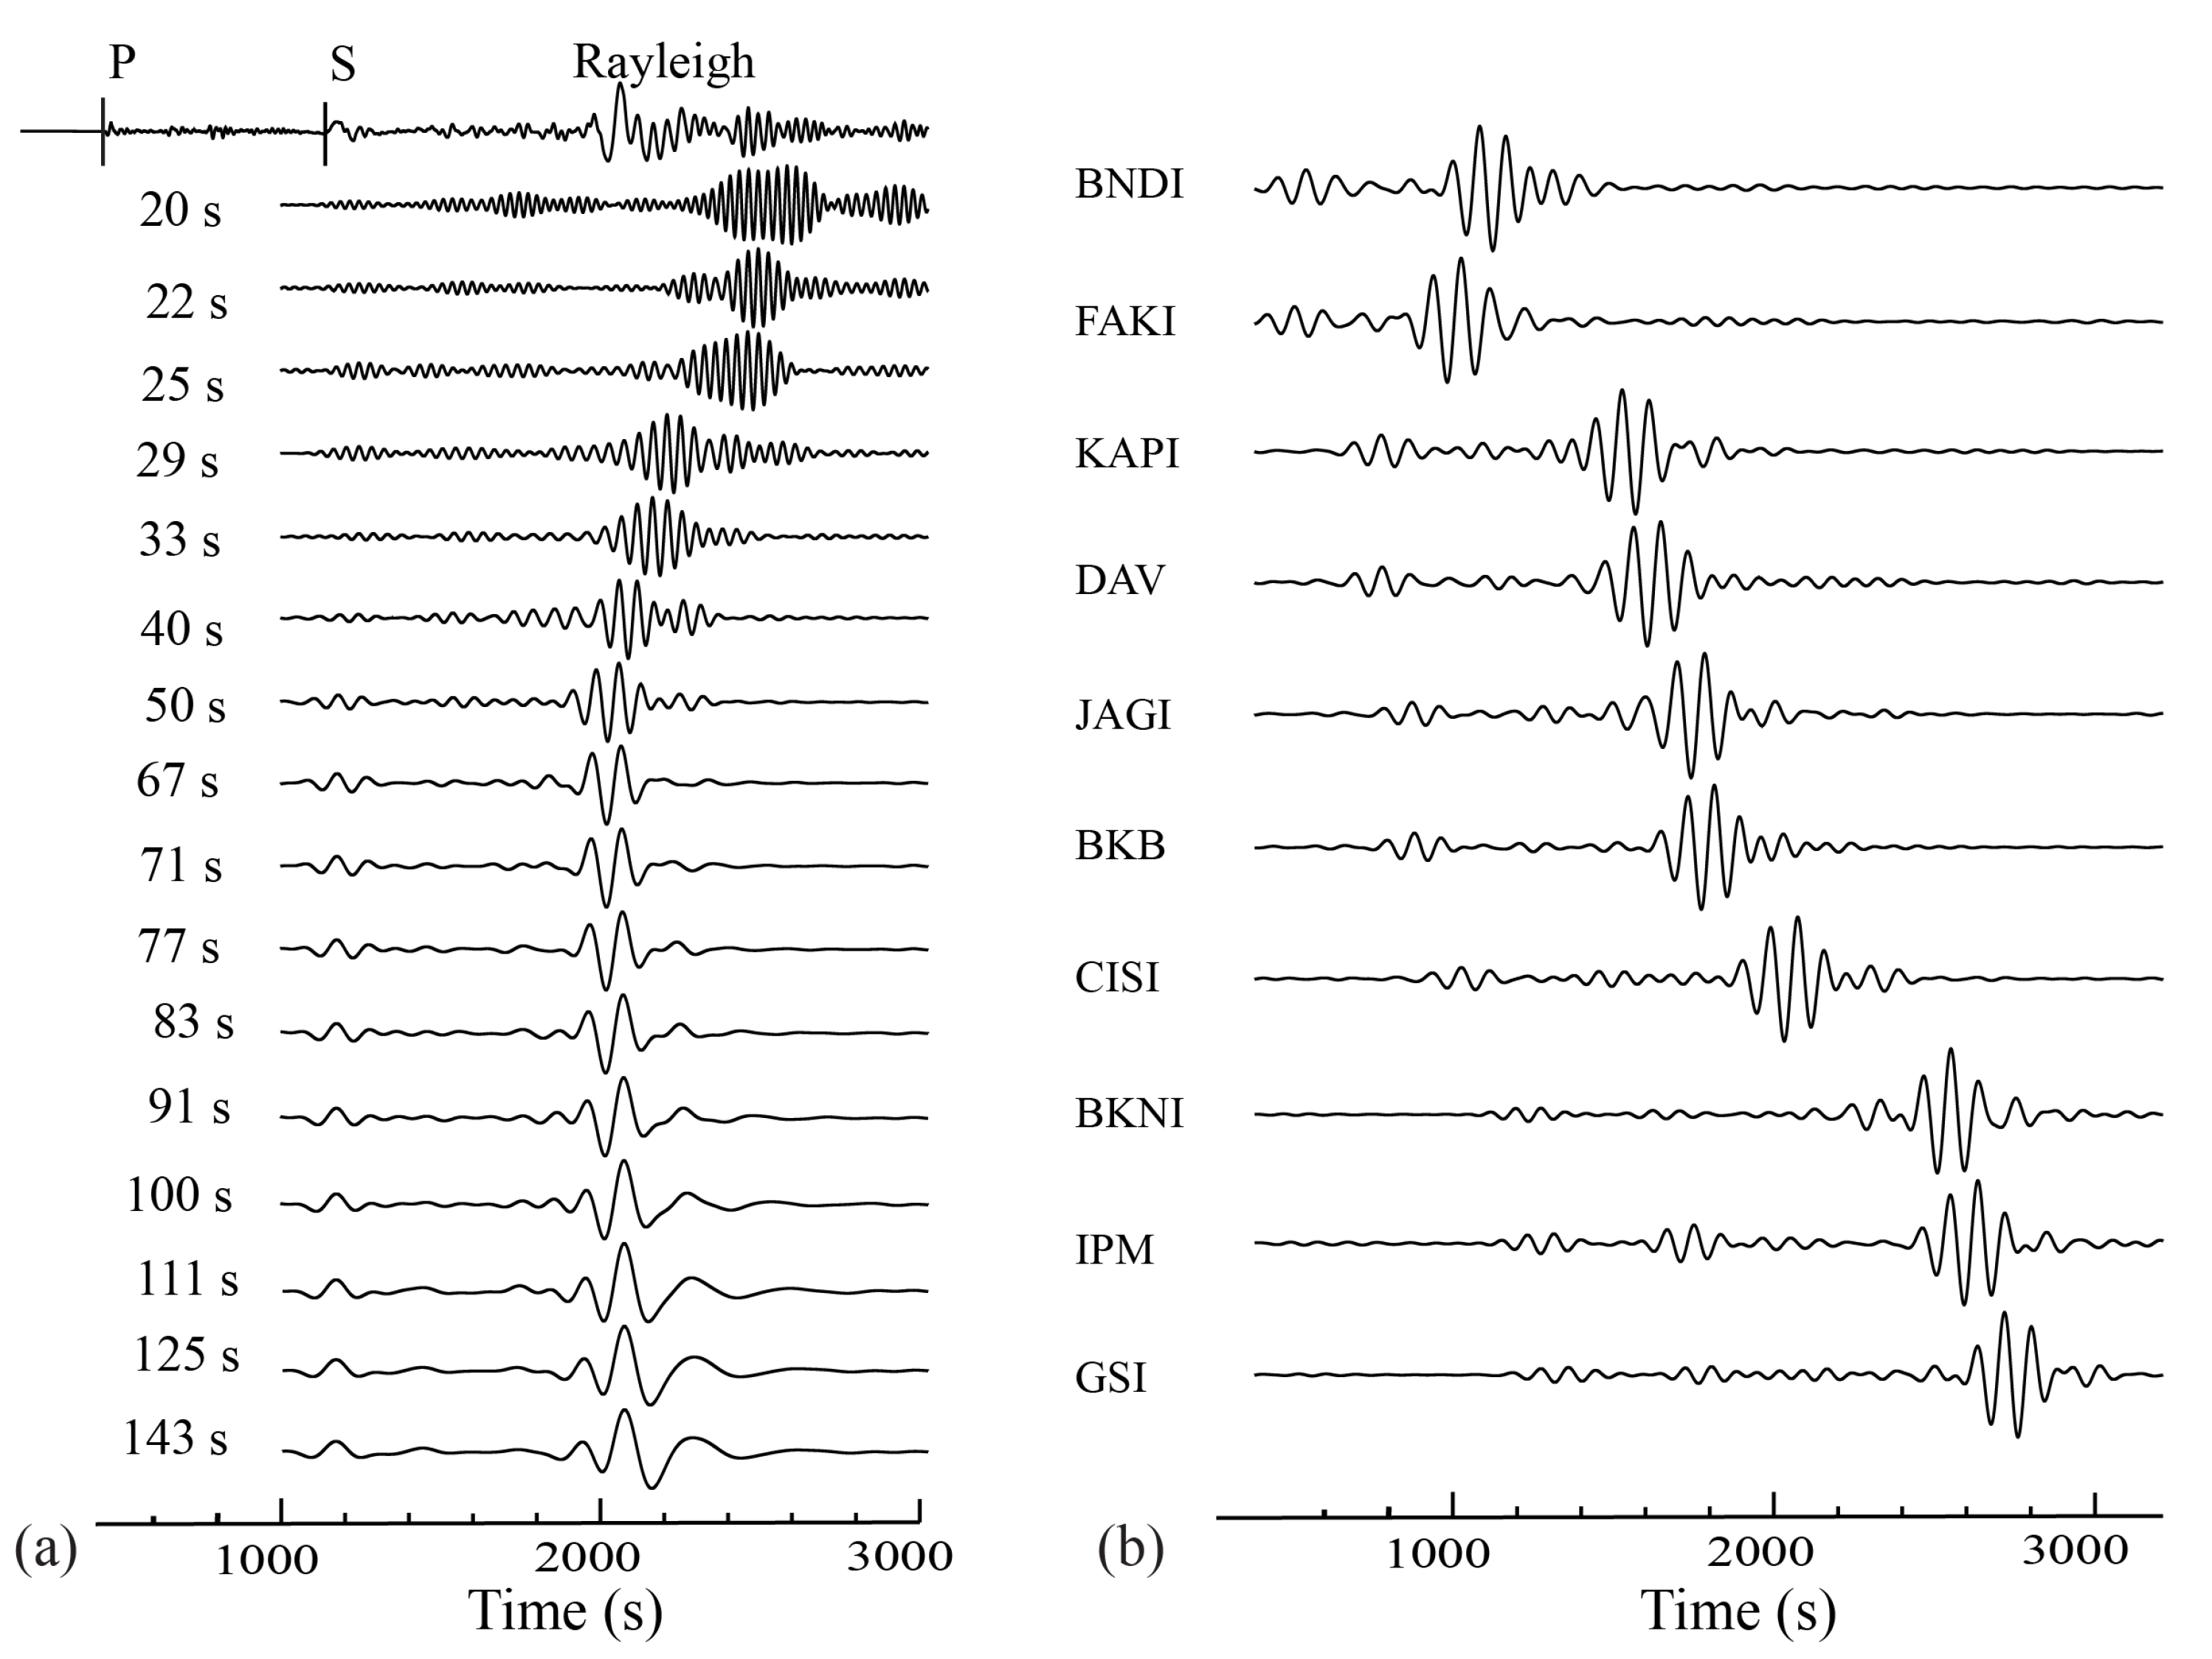
The vertical-component seismograms were corrected for the instrument response, detrended, and demeaned. Frequency–time analysis [37] was then applied to isolate the fundamental mode of Rayleigh waves. Amplitude and phase were measured at 16 periods between 20 s and 143 s using Fourier transforms. Records with low signal-to-noise ratios or poorly defined fundamental modes were discarded. Data rejection was more frequent at shorter periods, primarily due to complex topography and bathymetry within the study region. Figure 3a presents the vertical-component seismograms recorded at station CISI on Java Island from a MS 7.3 earthquake in the New Hebrides region. The records were bandpass-filtered between 20 s and 143 s to highlight the dispersive character of Rayleigh waves, which are clearly observed across different periods. Figure 3b displays corresponding Rayleigh wave seismograms at period of 50 s from additional stations within the study region.
Figure 3.
(a) Vertical component of seismograms recorded by station CISI at Java Island from an earthquake which occurred in the New Hebrides subduction zone (Ms is 7.3, the epicenter is at 19.70° S and 167.95° E), and those filtered by a narrow band (10 mHz) centered at periods from 20 s to 143 s. (b) Vertical-component seismograms at the period of 50 s of other stations in the study region from the same earthquake.
Despite careful event and period selection, residual wavefield interference remained [38]. To account for regional wavefield complexity, stations were divided into four groups for independent two-plane-wave parameter inversion (green rectangles in Figure 2). Events with misfits exceeding 1.5 times the median were rejected. An example of accepted raypaths at the 50 s period is shown in Figure 2.
2.2. Ambient Noise Dataset and Processing
We analyzed continuous vertical-component seismic records from 30 stations (2009–2010) for ambient noise tomography, excluding the offshore station XMIS (Figure 1, yellow station). The LHZ channel (1 Hz sampling rate) was downloaded daily. After instrument response removal, spectral whitening was applied in 2 h windows to broaden the usable frequency band and stabilize amplitudes.
Temporal normalization was performed using the running absolute mean method [39] to suppress transient earthquake signals while preserving ambient noise characteristics. Noise cross-correlation functions (NCFs) were computed for 435 station pairs.
The NCFs were normalized within six period bands (3–5 s, 5–10 s, 10–20 s, 20–40 s, 40–60 s, and 60–100 s) and then stacked to produce broadband NCFs with an improved signal-to-noise ratio [40]. All daily NCFs were subsequently stacked for each station pair to reduce seasonal variability.
Previous studies [41,42] showed that empirical Green functions (EGFs) can be demonstrated by NCFs, that meaning
where C and are the NCF and EGF between station A and station B, respectively. There is a π/2 phase shift between NCF and EGF. In this study, we employed NCFs to calculate the phase velocity. Due to the directional inhomogeneity of the noise sources, NCFs might be asymmetrical along the time axis [39,43,44]. We used the arithmetic mean of these NCFs as a simple and effective way to extract the dispersion curve.
3. Methods
Seismic tomography is a geophysical inverse method that reconstructs the three-dimensional distribution of seismic wave speeds or related parameters within the Earth by exploiting differences in travel times, amplitudes, or complete waveforms recorded across a network of stations [45,46]. Its resolution is fundamentally governed by the spatial distribution and directional coverage of seismic ray paths, which sample the subsurface volume. For lithospheric-scale investigations, surface wave tomography utilizing either teleseismic earthquakes or ambient seismic noise as sources is particularly powerful [39,47]. The following subsections detail the specific implementation of these principles in our study of the Indonesian archipelago.
3.1. Phase Velocity Inversion from Teleseismic Rayleigh Waves
Traditional surface wave tomography assumes that surface waves propagate along great circle paths, neglecting non-planar effects caused by heterogeneities. To account for this, we applied the two-plane-wave method [48], in which the observed wavefield is modeled as the interference of two plane waves with slightly different propagation directions.
The vertical displacement at each station is described by six wavefield parameters: the amplitude, initial phase, and propagation direction for each of the two plane waves. This is expressed as
where is the amplitude of each plane wave, and is the phase of each, including the direction and initial phase information at the kth station for ith event [38]. This representation effectively captures most observed wavefields and improves resolution in heterogeneous regions.
The study area was parameterized using 975 grid nodes with 1° × 1° spacing in the interior and 2° × 2° spacing near the margins to absorb boundary heterogeneity. Finite-frequency sensitivity kernels were Gaussian-smoothed with a width of 150 km to account for scattering and focusing effects.
An initial regional 1-D velocity model was derived from IASP91 [49]. Phase velocity inversion was performed iteratively for each period using simulated annealing [50] followed by a linearized damped least-squares inversion [51]. The least-squares inversion is given by
where is the phase velocity model at iteration , is the initial model, is the change to the model, is the difference between the observed and theoretical data in iteration , is the matrix of partial derivatives with six wavefield parameters and phase velocity, is the data matrix and assumed to be diagonal, and Cmm is the model covariance matrix.
3.2. Phase Velocity Inversion from Ambient Noise
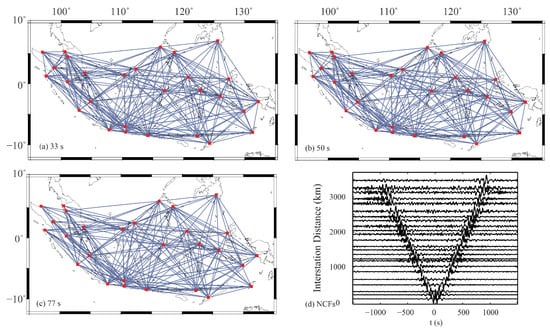
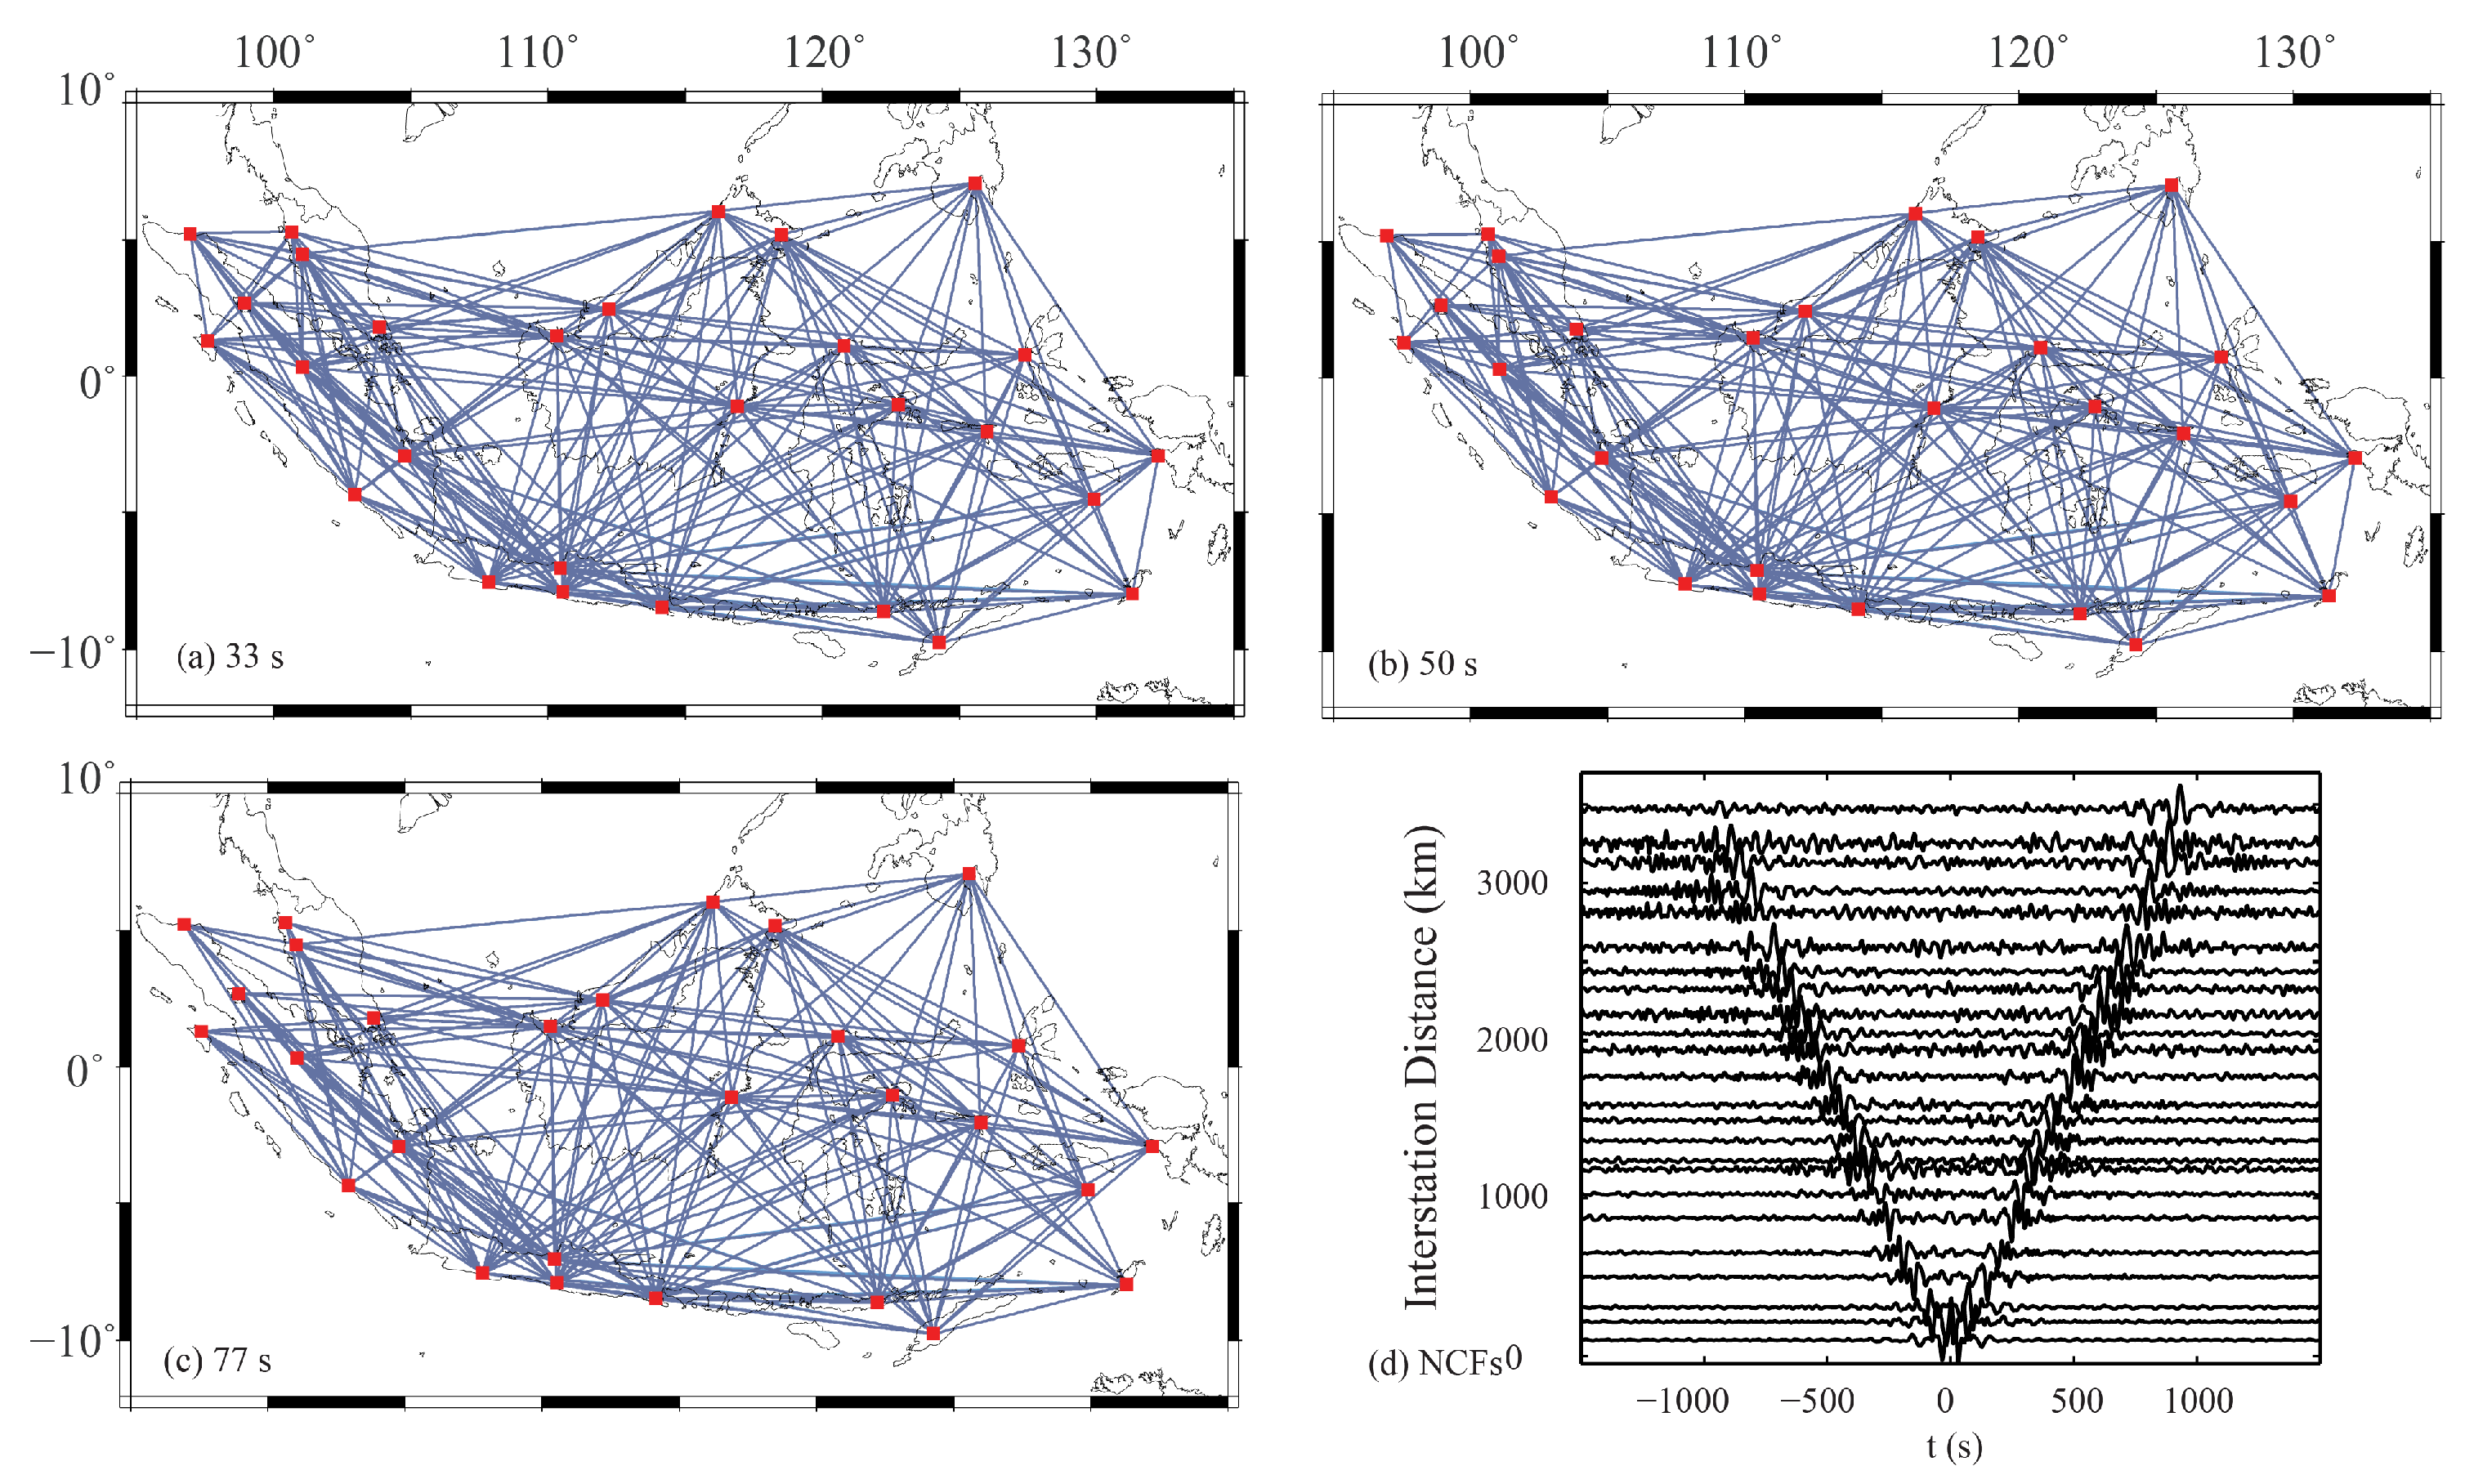
For ambient noise data, phase velocities were measured using the far-field approximation and the image-transformation technique of Yao et al. [52]. NCFs with a signal-to-noise ratio less than 3 were discarded. The NCFs were filtered using narrow-band Gaussian filters (0.4 s width) at central periods from 5 s to 100 s at 4 s intervals. The filtered traces were arranged by period to form a time–period (t–T) image. After amplitude normalization, this image was transformed into a phase velocity–period (c–T) image by dividing by the interstation distance. More than 239 high-quality dispersion curves were extracted from the 435 station pairs (Figure 4). At longer periods, fewer measurements were available because the interstation distance did not always satisfy the far-field criterion (distance > 3 wavelengths).
Figure 4.
AN path coverage examples at a period of 33 s (a), 50 s (b), and 77 s (c), and NCFs filtered at 20 s–100 s (d).
Phase velocity inversion followed the same linearized damped least-squares approach as used for Rayleigh waves and employed identical Gaussian-smoothed sensitivity kernels. Two-dimensional phase velocity maps were obtained for periods between 5 s and 100 s using IASP91 [49] as the initial model.
3.3. Inversion for Shear-Wave Velocity
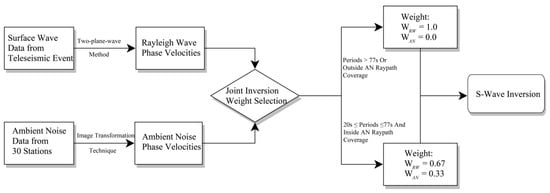
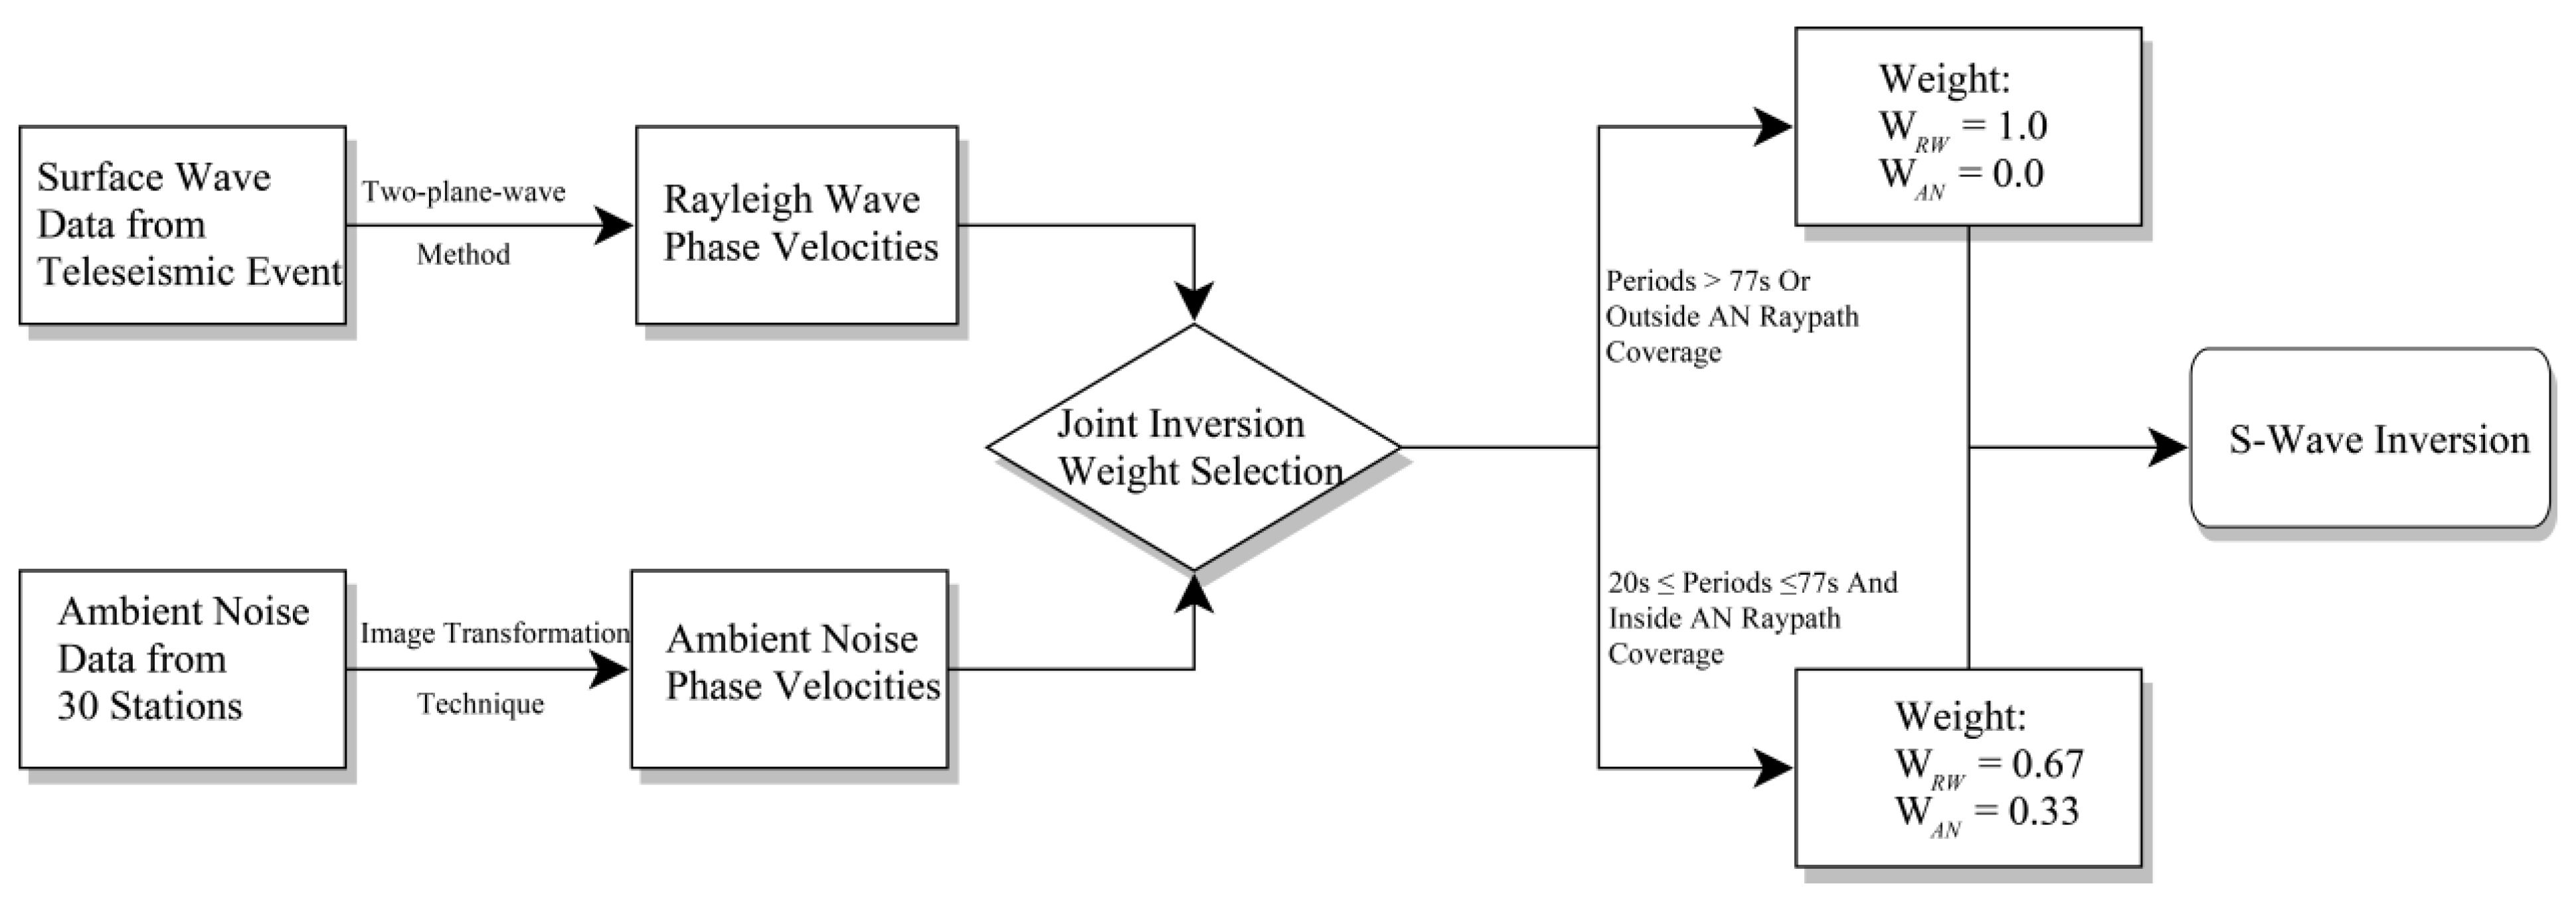
The final shear-wave velocity model was derived from a weighted joint inversion of Rayleigh wave (RW) phase velocities and ambient noise (AN) phase velocities. The weighting scheme was determined based on two principal considerations: 1. Disparity in raypath coverage—RW phase velocities, obtained from 387 teleseismic events, provide dense raypath coverage across the study region (Figure 2), whereas the raypaths for AN phase velocities depend solely on interstation pairs (Figure 4). The AN raypath coverage is substantially sparser, yielding a resolution confined primarily within the seismic array. A comparison of Figure 2 and Figure 4 reveals that while the raypath coverage varies between different periods, the differences are minimal. 2. The standard deviations of the phase velocity maps, calculated from inversions at representative periods, indicate that within the station network the uncertainty is below 0.12 km/s for 33 s ambient noise data and below 0.08 km/s for 50 s Rayleigh waves (Figure 5g,h). Integrating both the coverage and uncertainty analyses, the weight ratio was set as . Under the constraint , the final weights were assigned as = 0.67 and = 0.33, downweighing the incoherence brought by the high standard deviation of the ambient noise data. Based on the results of resolution tests and individual phase velocity inversions, the AN-derived phase velocities became less reliable at periods <20 s and >77 s. Therefore, for the S-wave velocity inversion at these periods, the weights were adjusted to = 1 and = 0. Similarly, in regions outside the AN raypath coverage where AN data had no resolution, was set to 1 and to 0. Within the 20 s–77 s period band, where the differences in AN raypath coverage were minimal, the original weights of = 0.67 and = 0.33 were maintained. We also examined alternative weighting schemes, including an equal weighting 1:1 scenario. This approach yielded less reliable results with spatially incoherent small-scale velocity perturbations in the shallow part of the model, lacking a clear geophysical interpretation.
Figure 5.
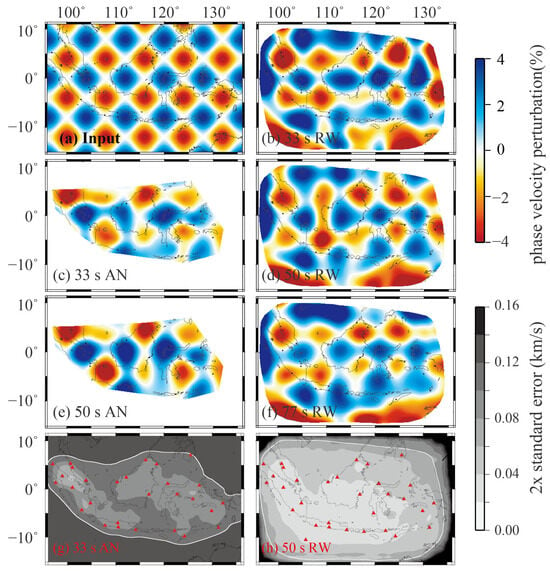
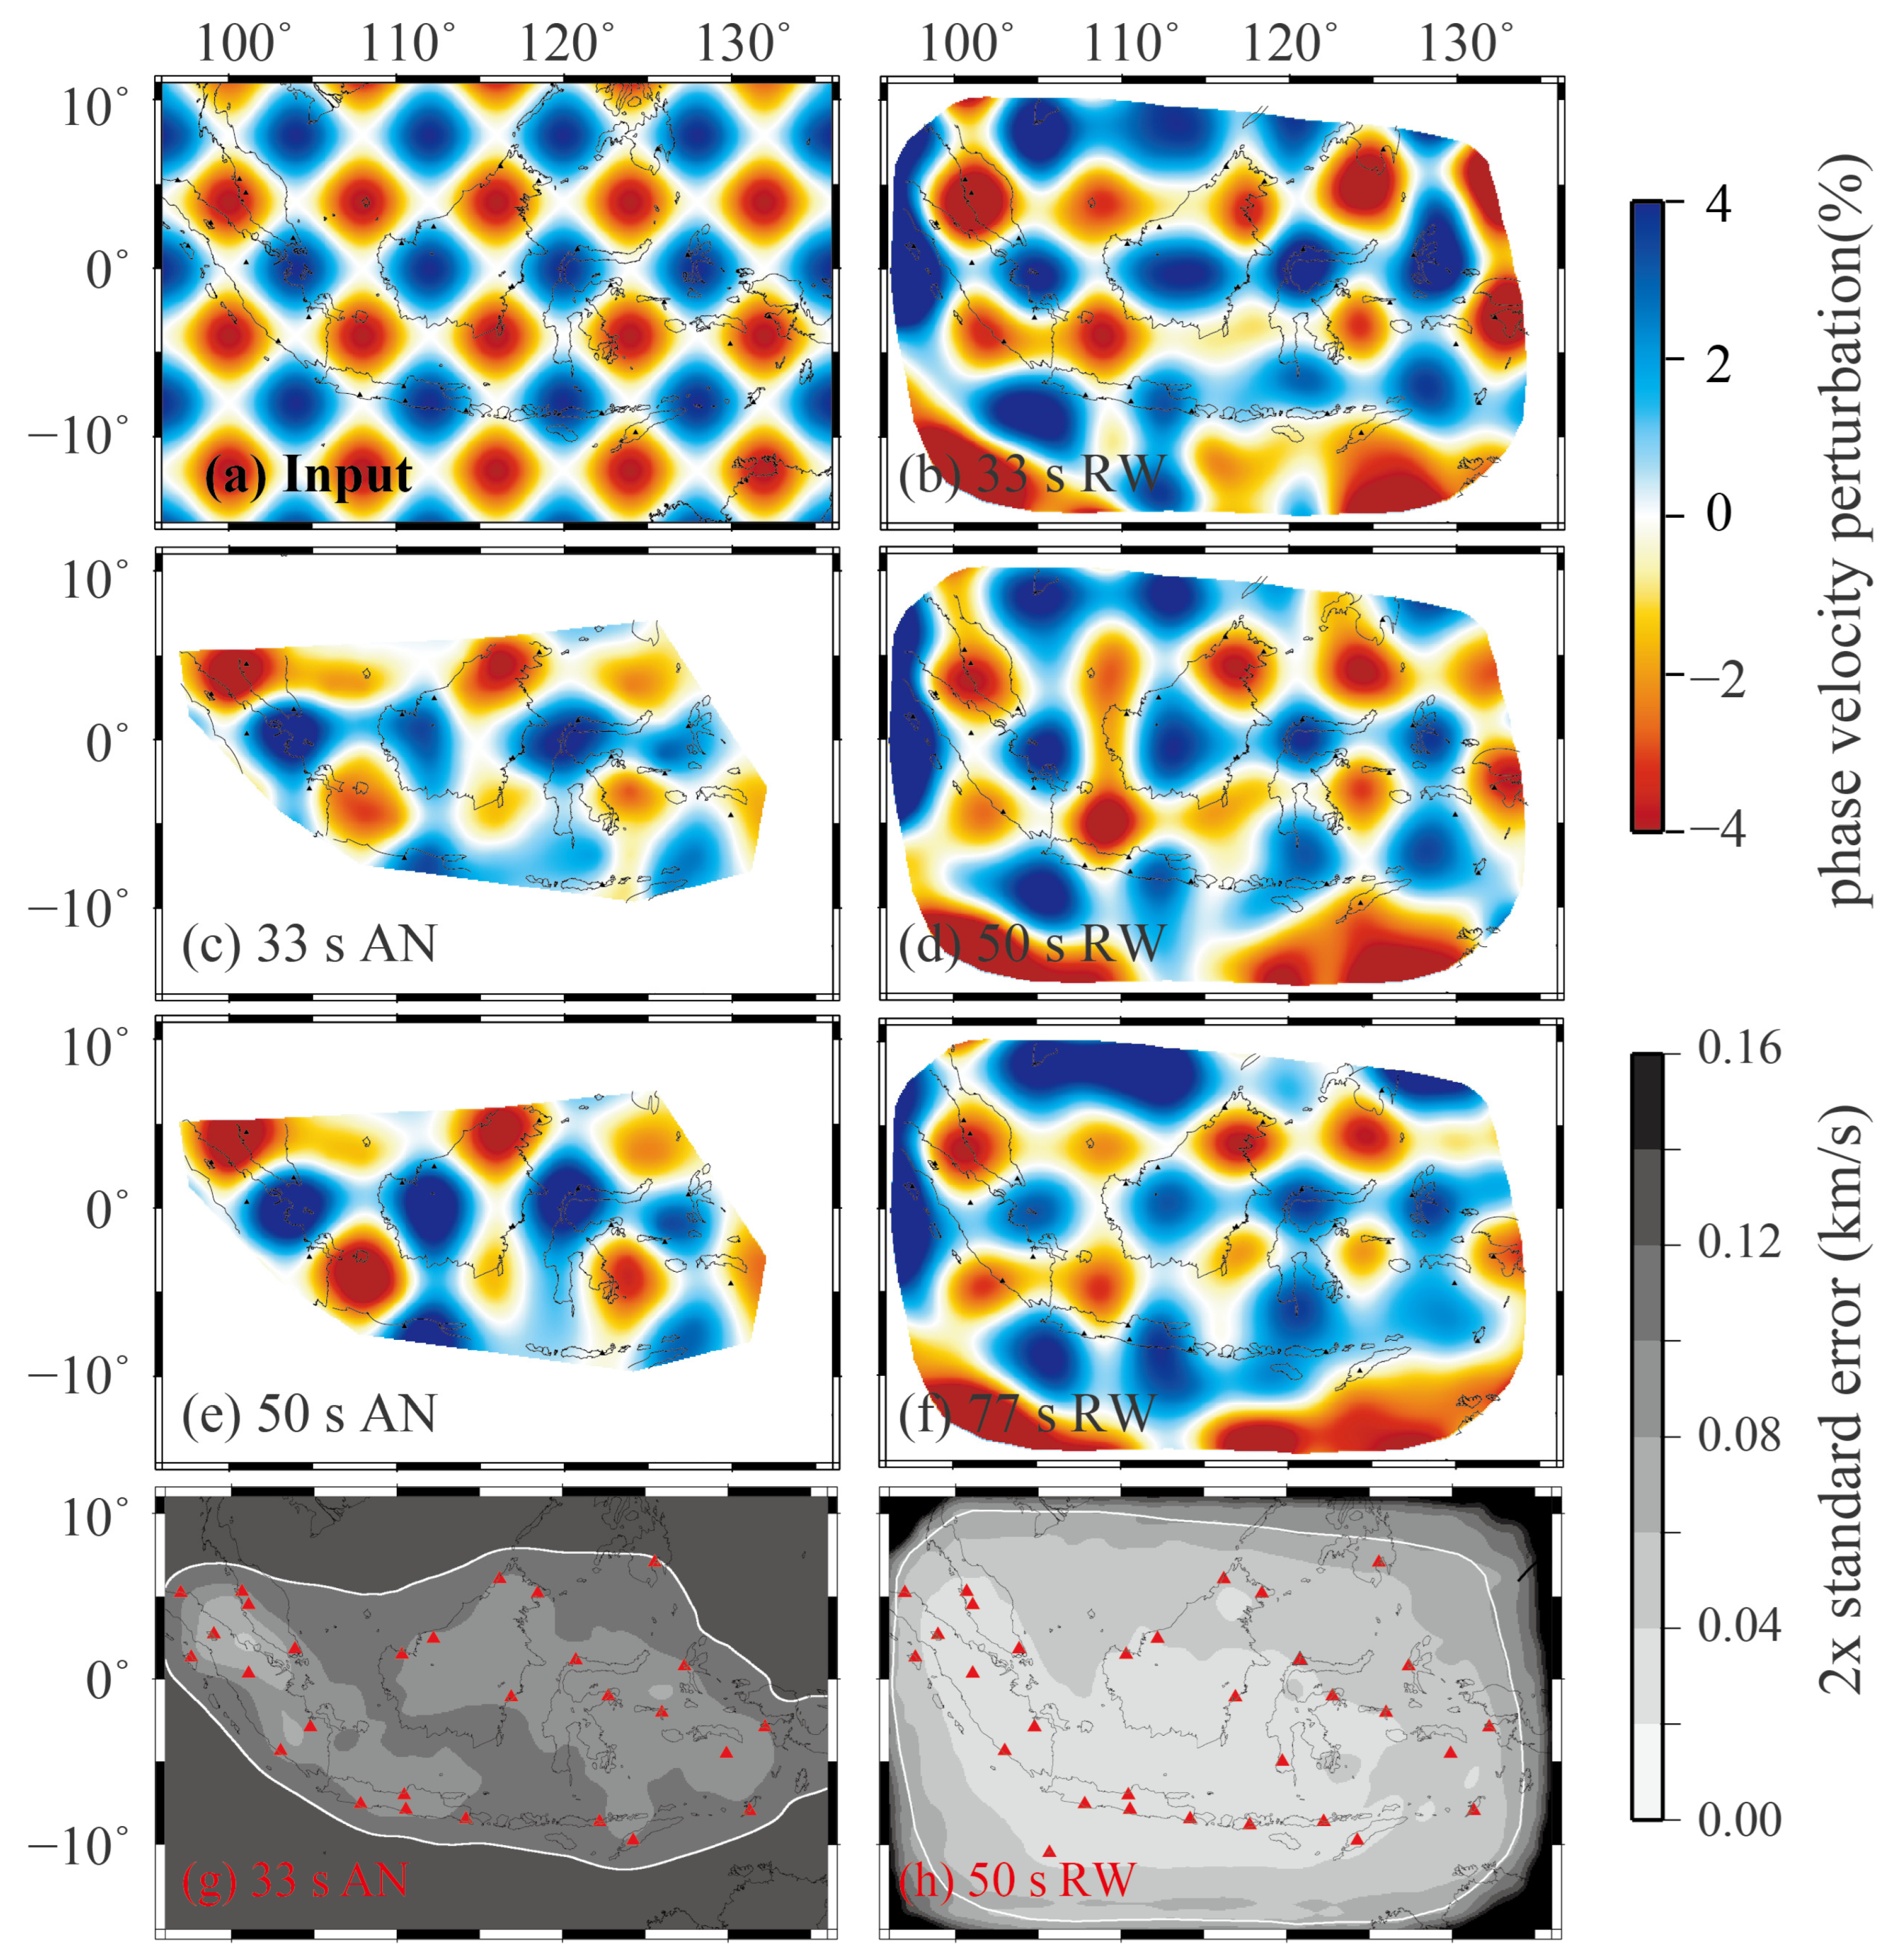
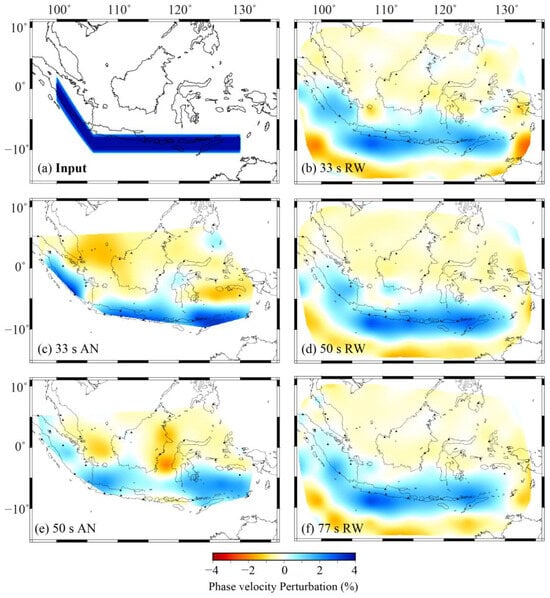
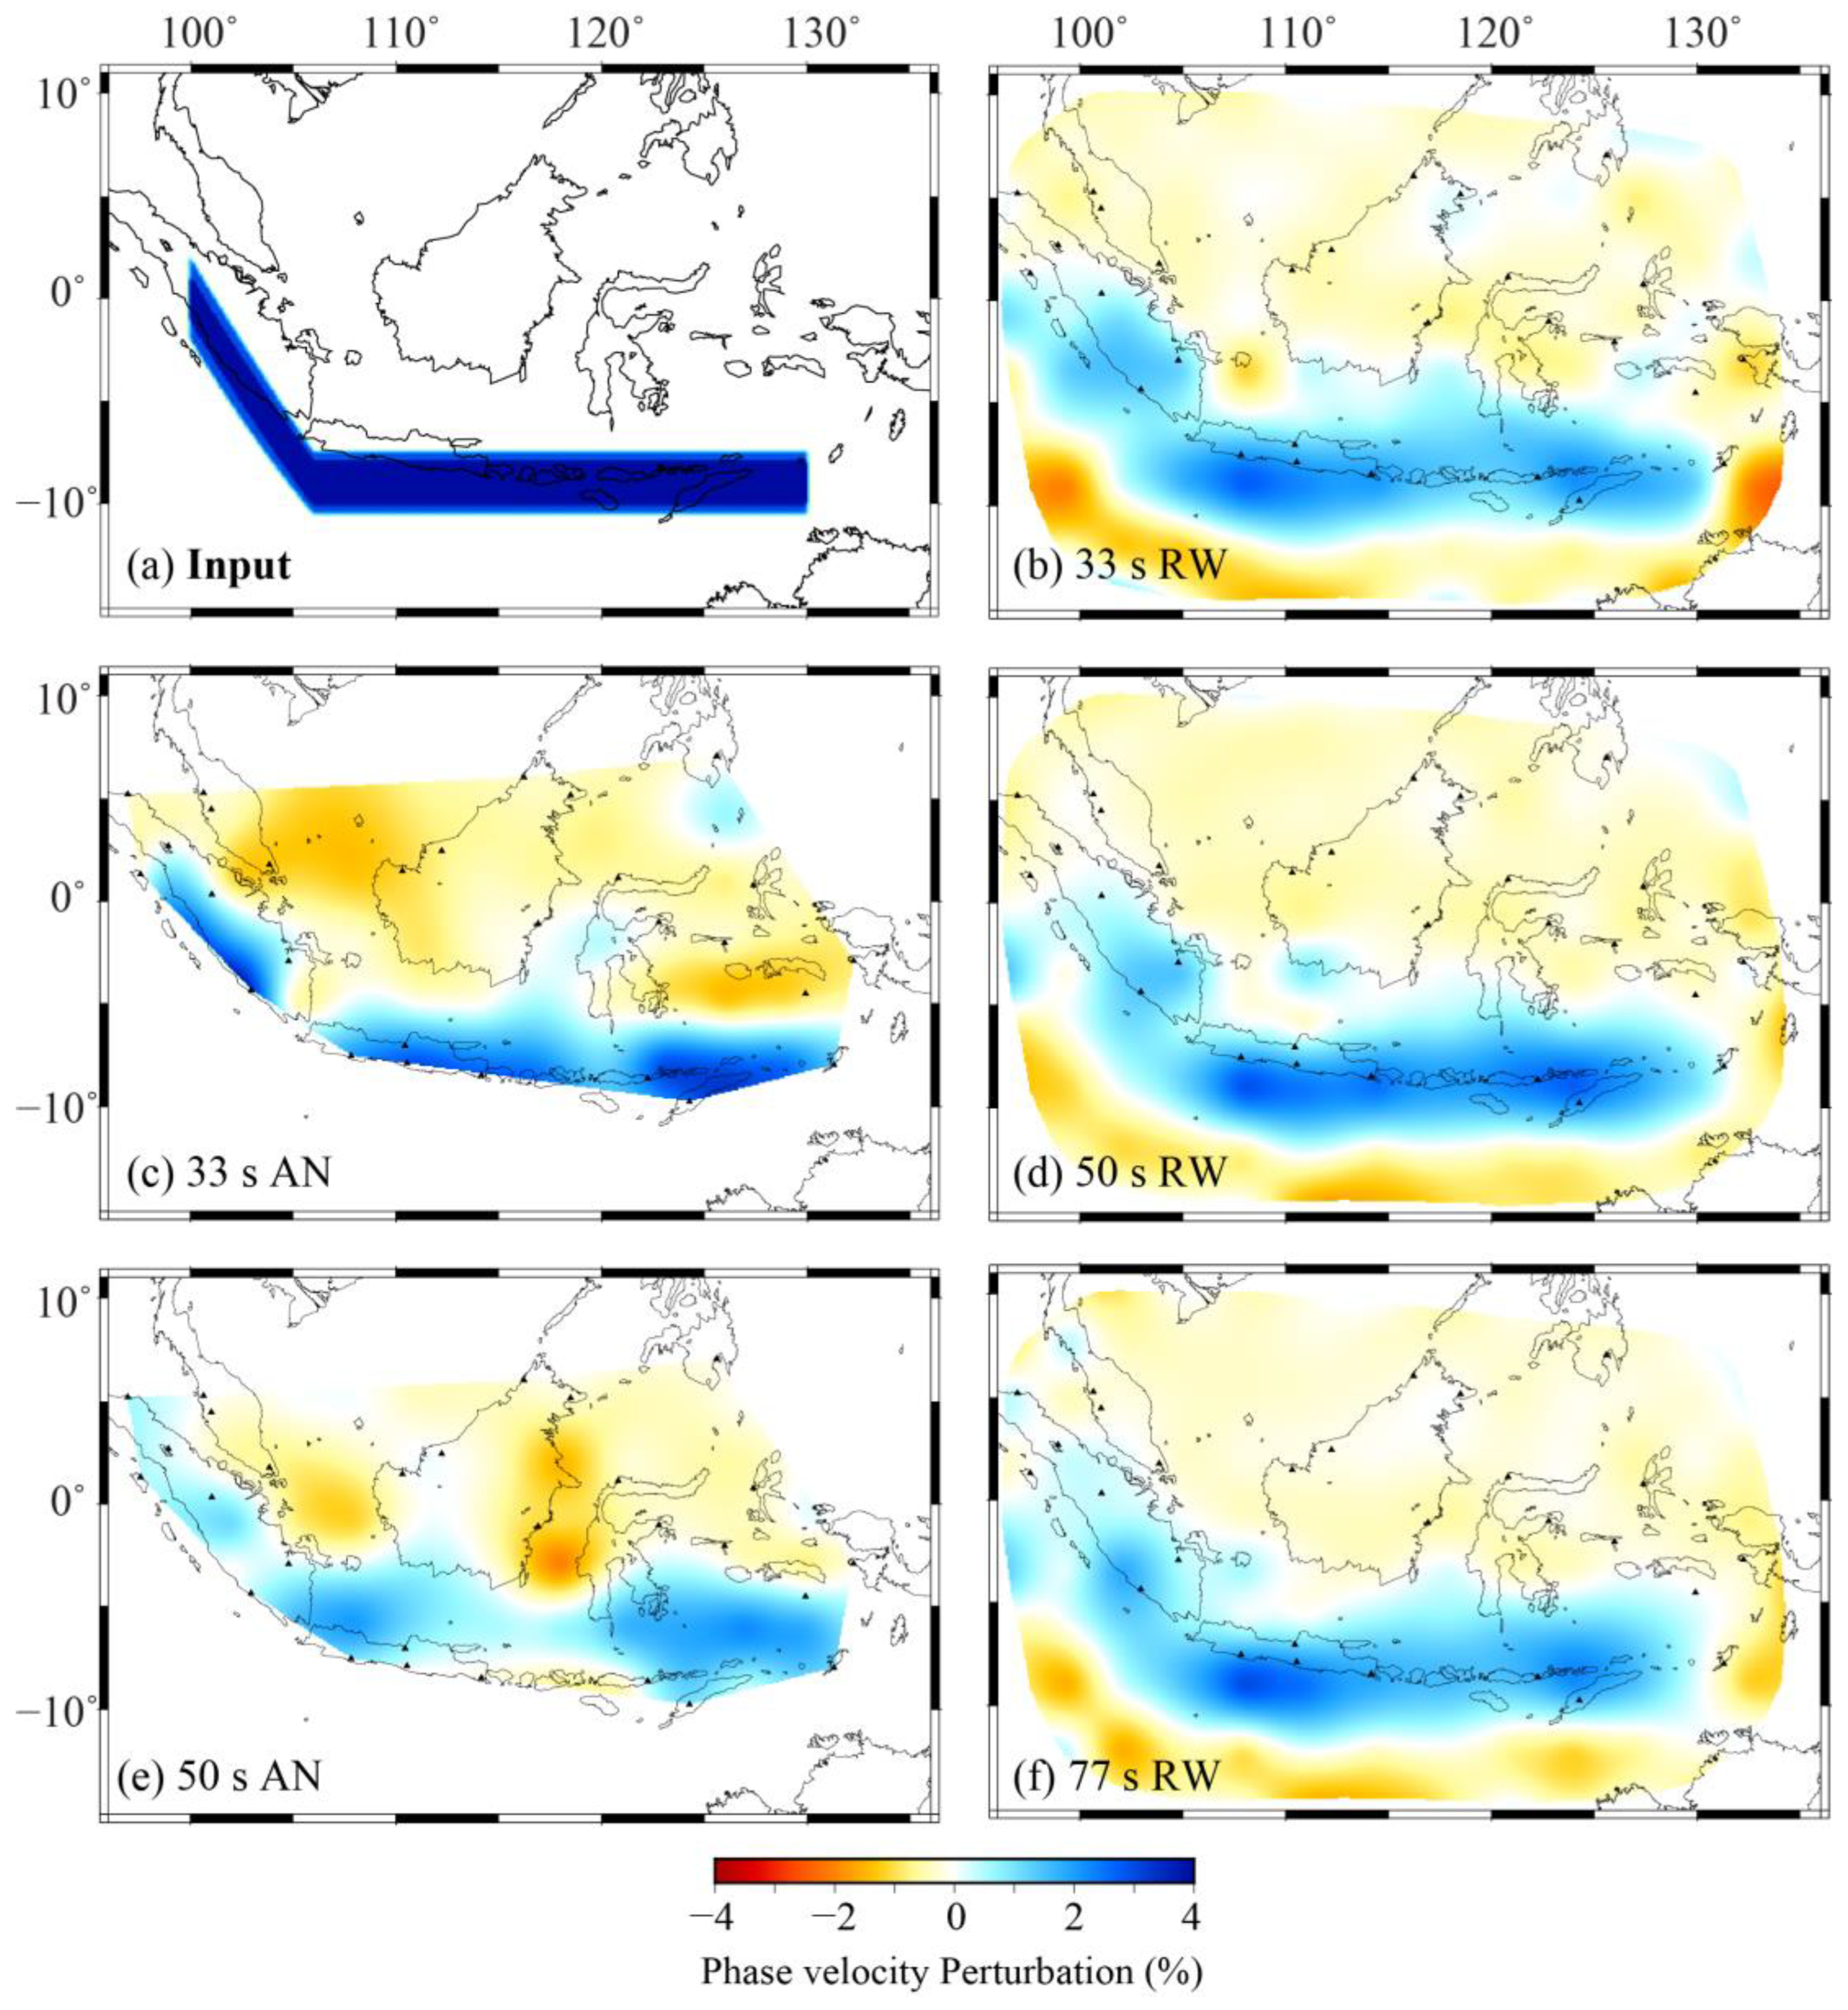
Checkerboard resolution tests and maps of twice the standard error for phase velocity inversions. (a) Input model with ±4% velocity perturbations on an 8° × 8° grid. (b,d,f) Recovered checkerboard patterns from Rayleigh wave tomography at periods of 33 s, 50 s, and 77 s, shown only in region where twice the standard error is below 0.08 km/s. (c,e) Recovered patterns from ambient noise tomography at 33 s and 50 s, clipped to the raypath coverage area. (g) Map of 2× standard error for ambient noise tomography at 33 s. (h) Map of 2× standard error for Rayleigh wave tomography at 50 s. The white contours outline the smoothed curve of 0.12 km/s (ambient noise) and 0.08 km/s (Rayleigh wave), respectively.
Shear-wave velocity profiles were computed from phase velocities using the DISPER80 algorithm [53]. Crustal thickness and bathymetry were constrained using CRUST1.0 [54], while the upper-mantle starting model was based on IASP91. The inversion employed a linearized damped least-squares approach, similar to Equation (3), with a prior standard deviation, , of 0.2 km/s for shear velocity.
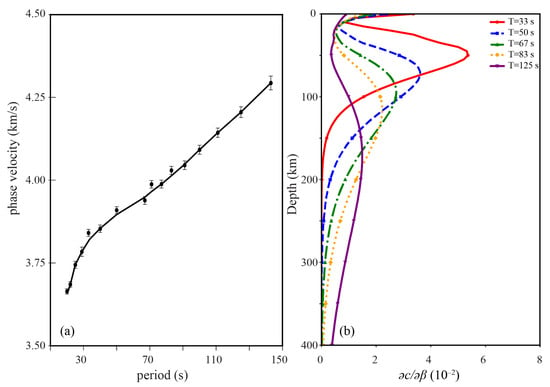
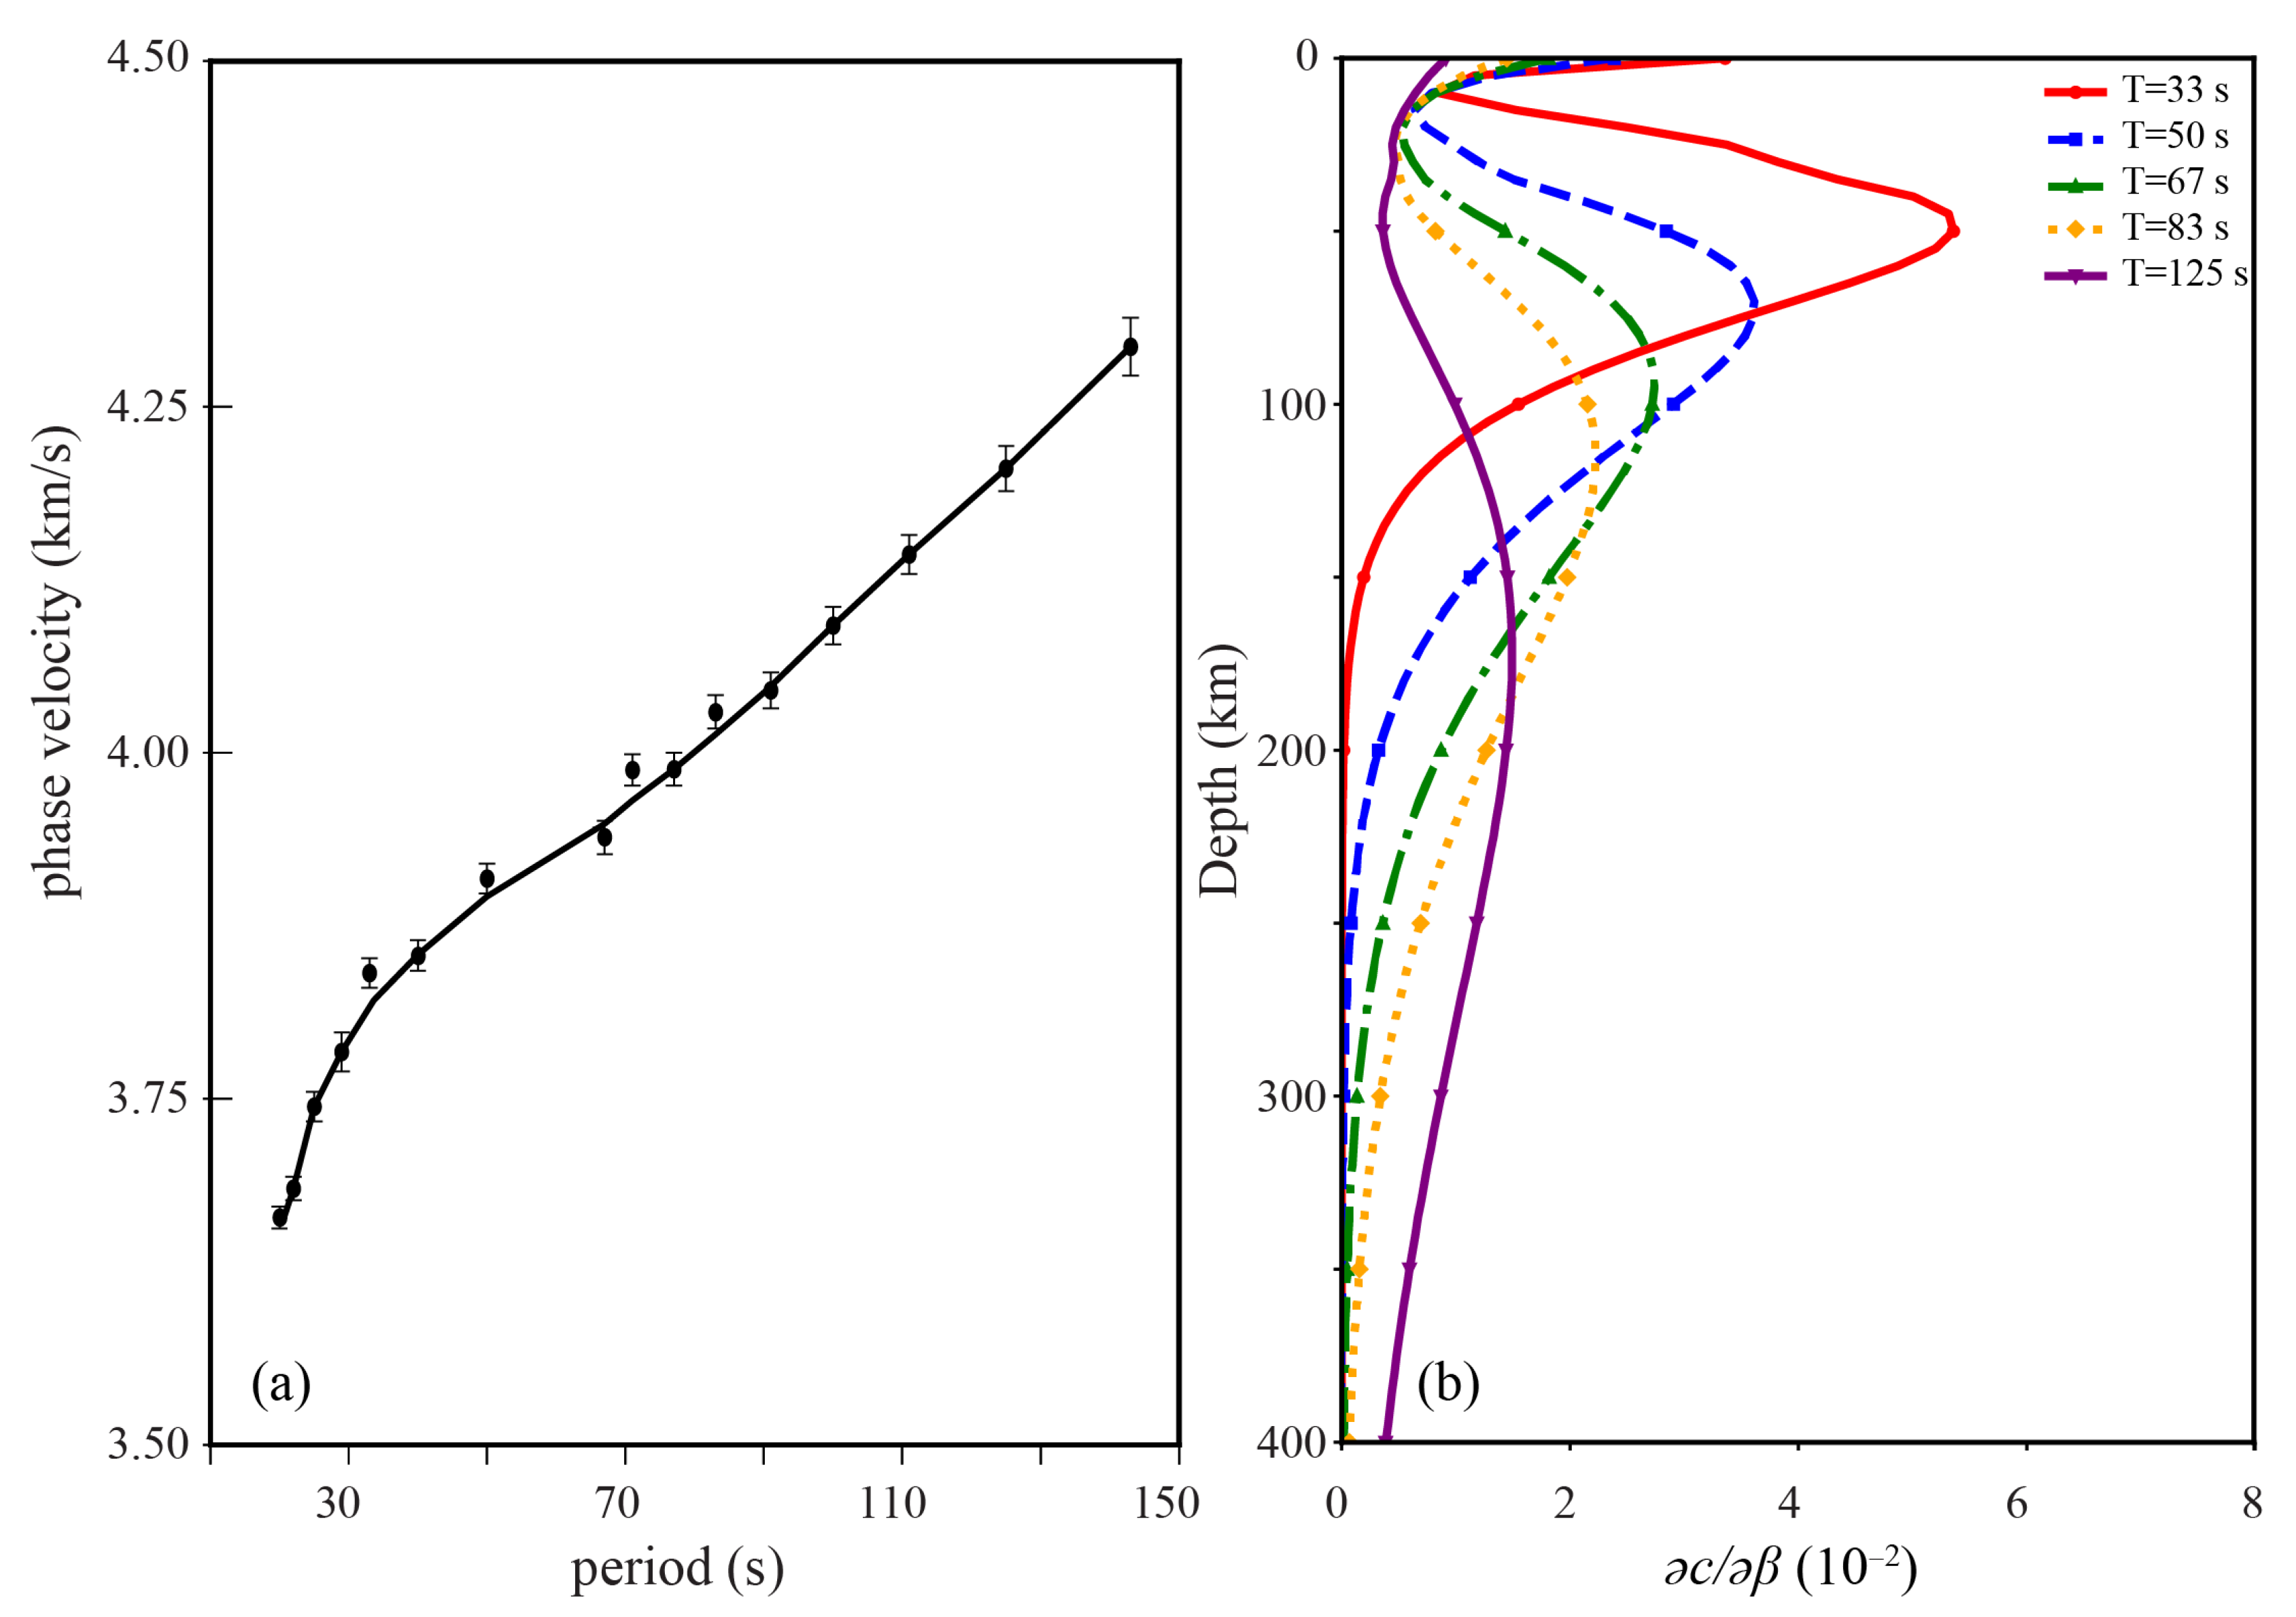
Figure 6a presents the 1-D velocity model derived from phase velocity inversion, with error bars indicating plus and minus two standard deviations from the mean. The S-wave velocity inversion was conducted using the DISPER80 algorithm, which follows a least-squares criterion and operates as a 1-D method. At each grid node, an independent 1-D S-wave velocity inversion was performed; the resulting models were then merged into a continuous 3-D volume through cubic spline interpolation and nodal smoothing. Figure 6b shows the 1-D sensitivity kernel employed in the joint weighted inversion, demonstrating good resolution between approximately 30 km and 250 km depth.
Figure 6.
(a) 1-D average phase velocities with error bars. (b) Depth sensitivity kernels for different periods used in this study.
A flowchart outlining the inversion procedure is presented in Figure 7.
Figure 7.
Flowchart of the shear-wave velocity inversion procedure.
4. Results
4.1. Resolution Tests
To evaluate the reliability of the phase velocity inversions, checkerboard resolution tests with ±4% velocity perturbations were performed on an 8° × 8° grid (Figure 5a). For the RW tests, synthetic datasets were generated using the same event–station geometry as the real data, with each wavefield represented by two interfering plane waves. The results at representative periods of 33 s, 50 s, and 77 s (Figure 5b,d,f) demonstrate good recovery in key tectonic regions, including the Sunda–Java–Banda subduction system, Sulawesi, the Celebes Sea, and the Molucca Sea. Minor smearing occurs near the model margins but does not affect the principal subduction zones. For the AN tests, synthetic data followed the actual station-pair raypaths. The resolution at the 33 s and 50 s periods (Figure 5c,e) is generally good within the station array, and areas outside raypath coverage are excluded. The resolution decreases at periods shorter than 13 s and longer than 77 s, consistent with the limitations imposed by interstation spacing and the far-field approximation. In contrast, RW inversion maintains a good resolution from 25 s to 100 s owing to denser raypath coverage (Figure 2 and Figure 4). To mitigate smearing brought by sparse and uneven raypath coverage in the Rayleigh wave analysis, we selectively incorporated teleseismic events with well-distributed back-azimuths. In ambient noise tomography, however, smearing remains unavoidable, especially outside the actual raypath network, which is therefore masked in joint inversion.
Resolution tests reveal areas of degraded recovery, such as near 105° E, 3° N, and clear smearing at 125° E, 8° S. For WR, smearing is evident around 130° E, 0° N, with the most severe artifacts occurring near 100° E, 10° S. Based on the standard deviation map for the 50 s Rayleigh waves (Figure 5h), which shows uncertainties below 0.08 km/s in regions with adequate raypath coverage (Figure 2), we masked all data exceeding this uncertainty threshold in the resolution tests, recovery tests, phase velocity inversions, and shear-wave velocity inversions. Although some smearing persists in the unmasked southwestern and southeastern corners (Figure 5b,d,f), these areas lie outside the primary subduction zone structure of interest, supporting the appropriateness of the chosen threshold. Similarly, for the 33 s AN data, the region with standard deviations below 0.12 km/s (Figure 5g) corresponds closely to the area of actual raypath coverage (Figure 4). Results outside this raypath envelope are unreliable. Therefore, we masked all regions beyond the raypath network in the corresponding tests and inversions.
In addition to resolution tests, we conducted a series of recovery tests. As illustrated in Figure 8, a slab-like high-velocity anomaly was inserted at the true location of the subducting slab. Recovery tests were then performed using RW and AN data at different periods. The results demonstrate that for RW, the high-velocity slab can be successfully recovered at periods of 33 s, 50 s, and 77 s, although its apparent width increases with longer periods. In the results derived from AN, the slab anomaly is recoverable at 33 s and 50 s. However, due to the sparser raypath coverage of the noise data, the recovered slab in the 50 s result appears partially disconnected near its bend, and its eastern portion exhibits a broader spatial extent.
Figure 8.
Recovery test of a high-velocity slab (+4% anomaly) in the Sunda–Java–Timor subduction zone. (a) Input model with +4% velocity perturbations near subduction zone. (b,d,f) Recovered patterns from Rayleigh wave tomography at periods of 33 s, 50 s, and 77 s. (c,e) Recovered patterns from ambient noise tomography at 33 s and 50 s.
4.2. 2-D Phase Velocity Structure
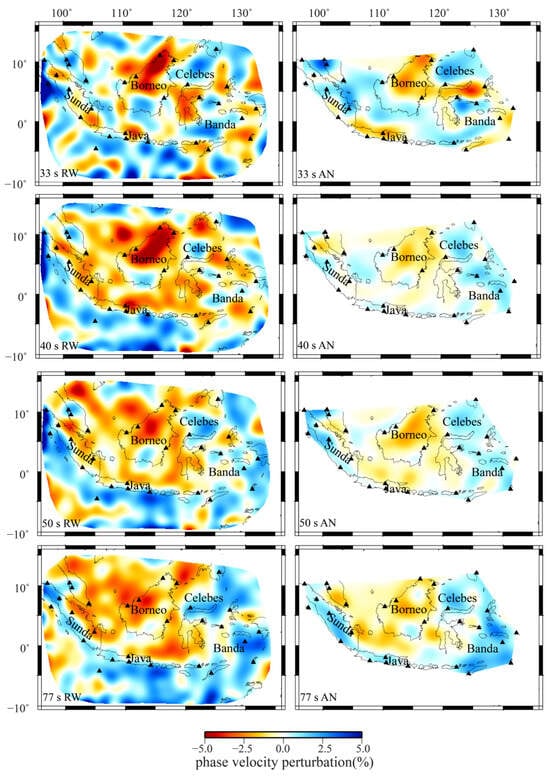
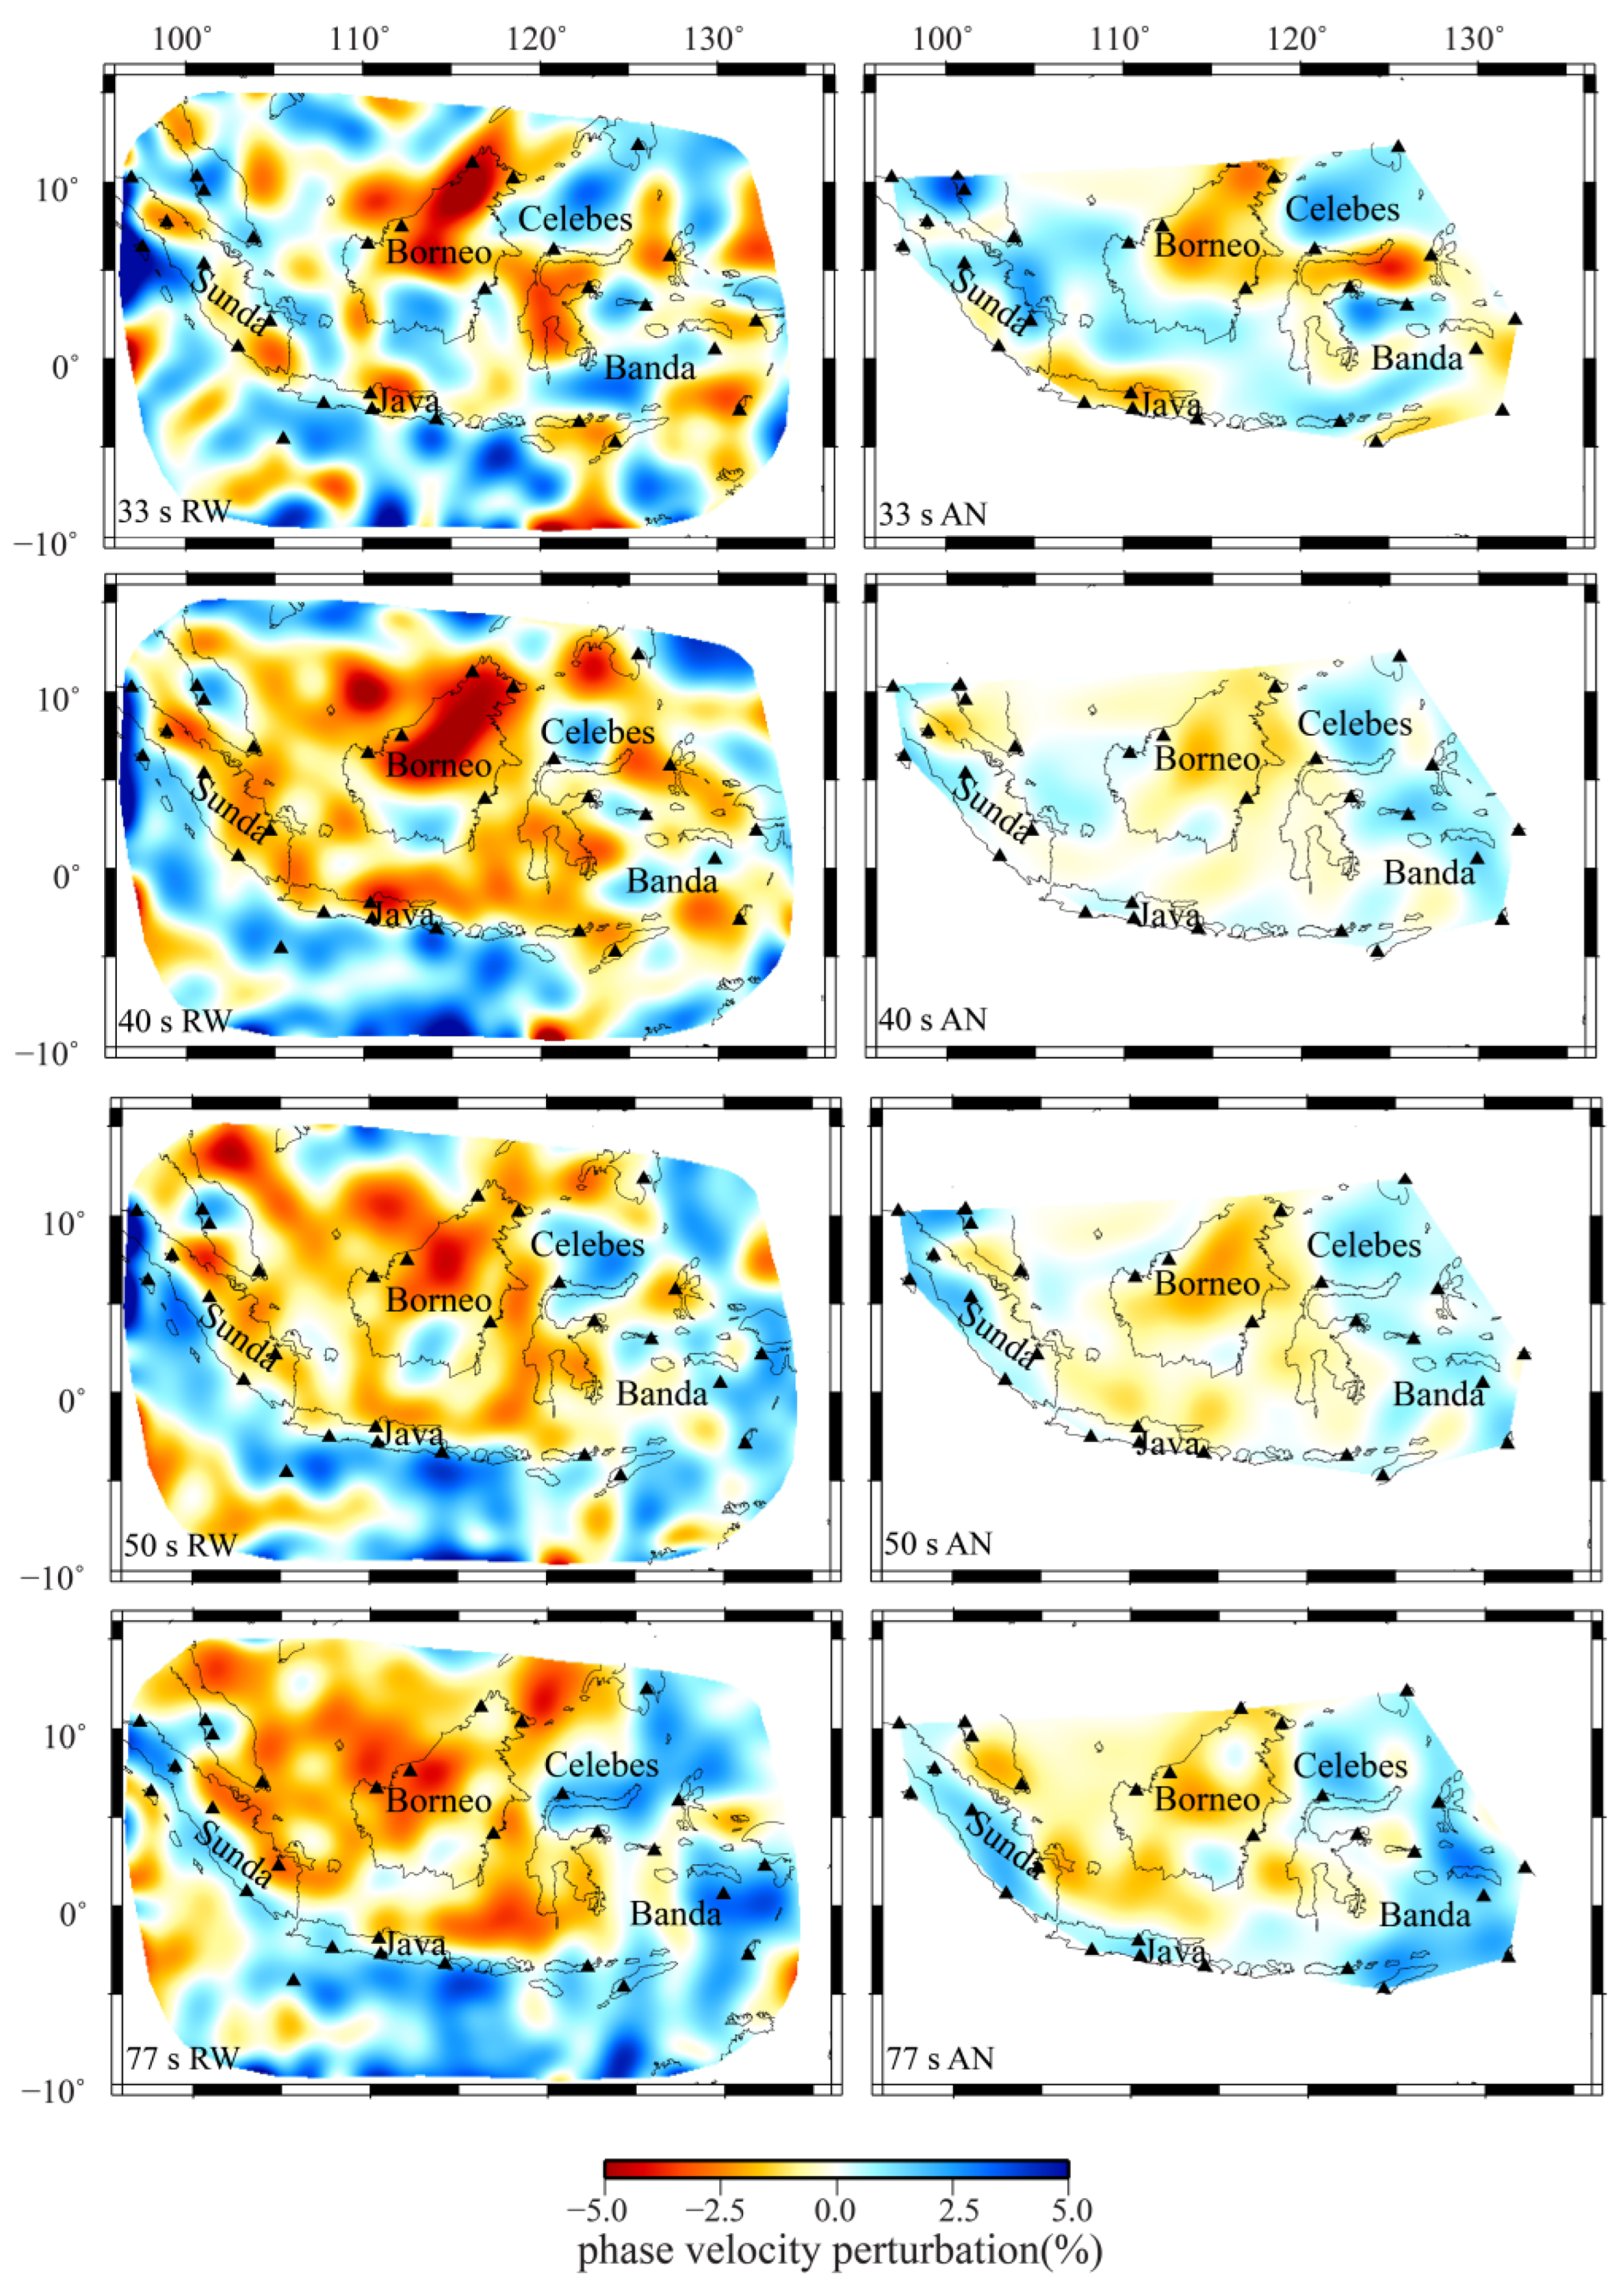
Figure 9 presents the 2-D phase velocity maps obtained from RW and AN data at periods of 33, 40, 50, and 77 s. The RW phase velocities exhibit stronger perturbations (higher amplitudes) than the AN results, indicating a greater sensitivity to deeper or more pronounced structural contrasts. Despite this amplitude difference, both datasets reveal consistent spatial patterns across most of the study region.
Figure 9.
Mapviews of the 2-D phase velocity perturbation at periods of 33 s, 40 s, 50 s, and 77 s from Rayleigh wave data (the left column) and ambient noise data (the right column).
A coherent low-velocity anomaly beneath northern Borneo and Sulawesi is apparent in all periods and expands with increasing period. High-velocity anomalies along the Sunda and Java Trenches become more prominent at periods of 40 s and longer, aligning with the direction of subduction. At longer periods (50 and 77 s), additional high-velocity anomalies emerge near the Philippine Trench, the Celebes Sea, and northern Sulawesi. A persistent high-velocity anomaly is observed beneath southern Borneo throughout all periods; in the RW maps at 77 s, this anomaly narrows and appears to separate the Sunda and Java Trenches from the main subducted slab.
In contrast, the AN-derived maps at 33, 40, and 50 s display a more extensive region of high velocities in the eastern area—encompassing the Celebes Sea, Molucca Sea, and Banda Sea—compared to the RW results. At 77 s, this high-velocity zone in the AN maps also connects spatially with the subduction-related anomalies. Based on checkerboard resolution tests, the RW phase velocity maps exhibit some smearing or edge effects at the southwestern and northwestern corners of the study area, though these artifacts do not significantly affect the imaging of the main subduction zones.
4.3. 3-D Shear-Wave Velocity Structure
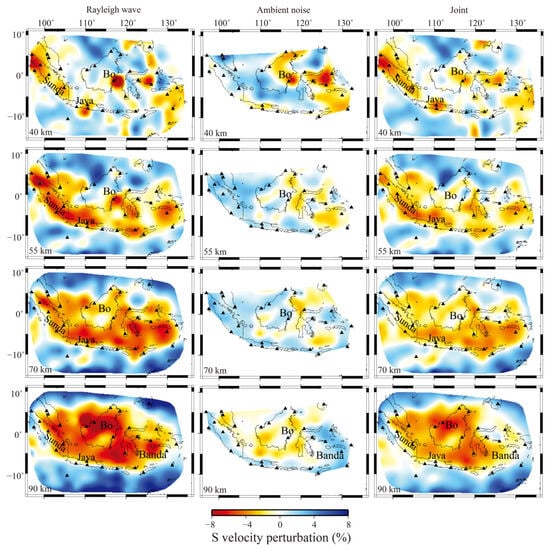
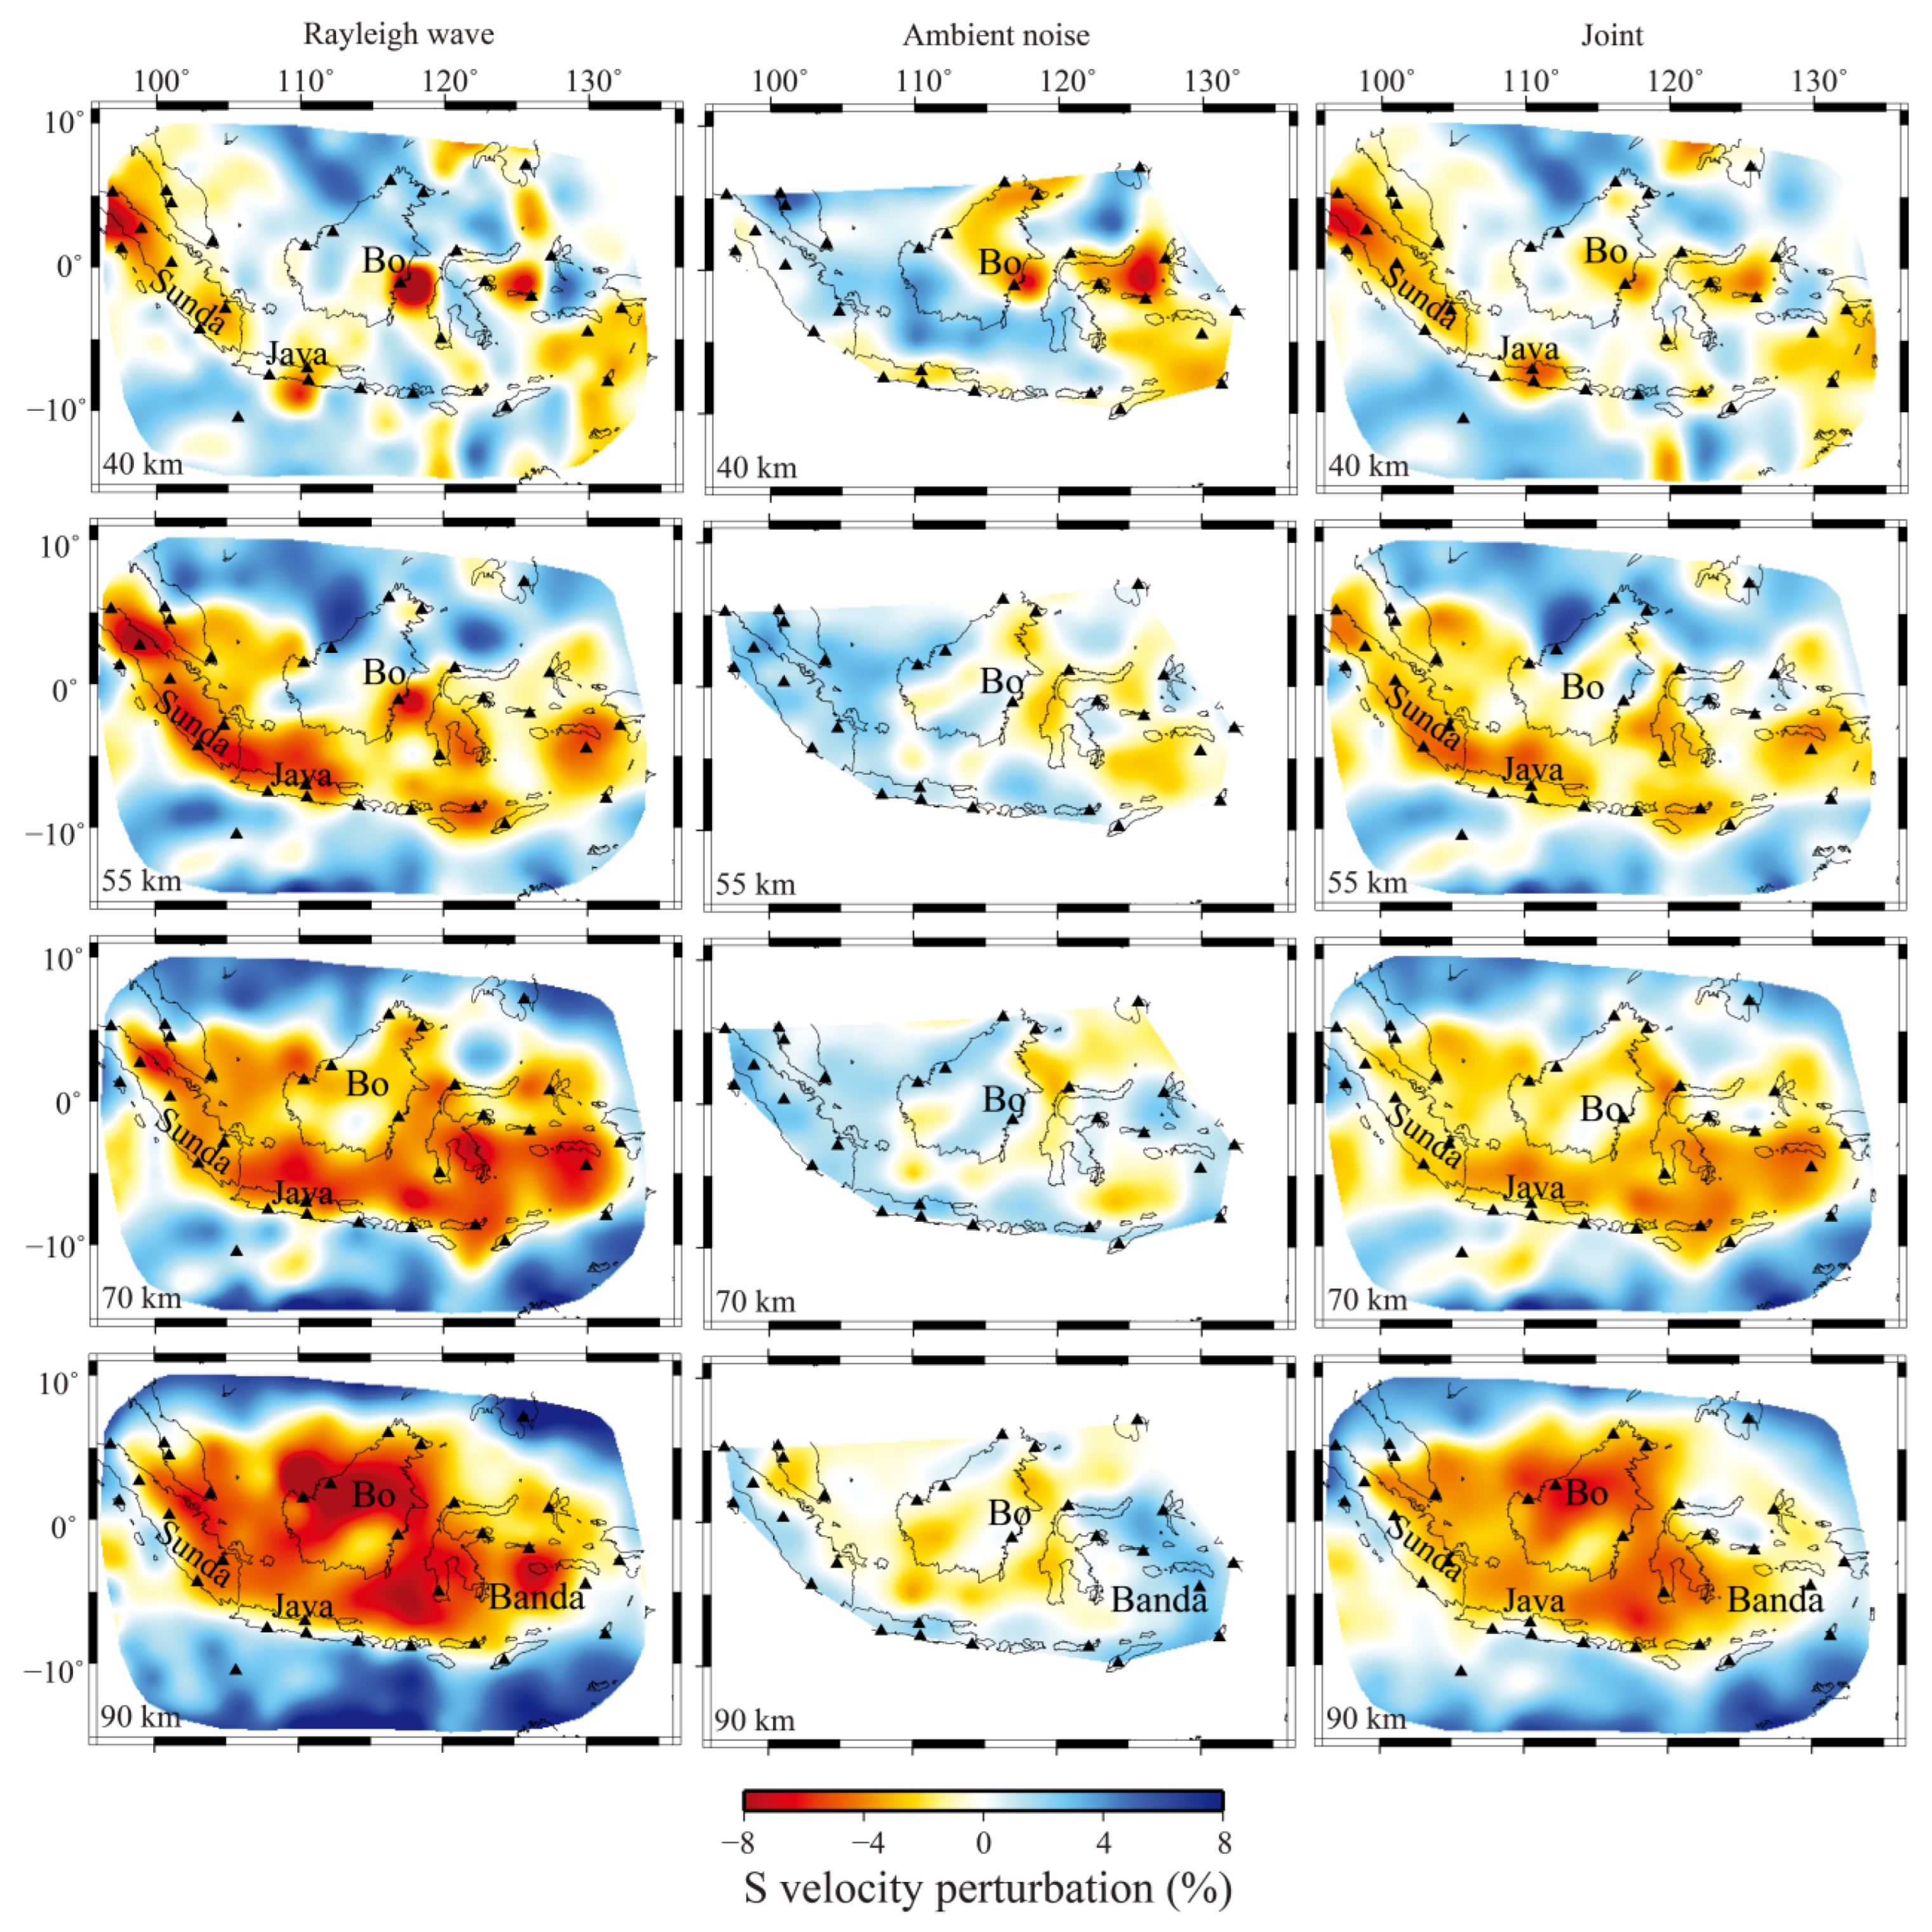
Figure 10 displays horizontal slices of the shear-wave velocity model at depths of 40, 55, 70, and 90 km, derived from individual Rayleigh wave (RW), ambient noise (AN), and joint inversions. The joint inversion results align more closely with the RW models, consistent with the higher weighting assigned to the RW data. This is evident in the reproduction of high-velocity anomalies observed in the RW maps and in the generally stronger velocity perturbations of the RW-derived models compared to the AN results, which aligns with the earlier phase velocity observations.
Figure 10.
Mapviews of the S-wave velocity structure at depths of 40 km, 55 km, 70 km and 90 km from Rayleigh wave data (left column), ambient noise data (middle column), and joint periods from 20 s to 50 s of both data (right column). Note: Bo denotes Borneo.
The most notable feature in the data at 40 km is the low-velocity anomalies beneath eastern Borneo and the Molucca Sea, which are revealed by AN, RW and the joint datasets. The anomaly beneath eastern Borneo is at the degree of −6% to −8% and extends deeper to 210 km, though the amplitude decreases at a depth larger than 150 km. In contrast, the low-velocity anomaly beneath the Molucca Sea decays significantly at 55 km both in the RW model and AN model, and disappears at greater depth in the NA model. Both the RW and joint models reveal significant low-velocity zones beneath Sumatra and Java. This anomaly expands with depth and appears tectonically confined by the surrounding subduction systems. At 90 km depth, the peak negative perturbation reaches −12% (3.51 km/s) beneath northwest Borneo, whereas the maximum velocity of 4.48 km/s (+9.4%) is located beneath the Timor Trench.
Notable discrepancies exist between the AN model and RW model. At 40–70 km depth, the AN model shows a pronounced high-velocity anomaly in the western part of the study area, which is absent in both the RW and in the joint models. At 90 km depth, a distinct high-velocity anomaly under the Banda Sea, Philippine Trench, and Molucca Sea in the AN model contrasts with a low-velocity perturbation in the same region within the RW model. A low-velocity anomaly beneath east Borneo is persistent across all depths in both individual models but exhibits a larger spatial extent in the RW and joint results.
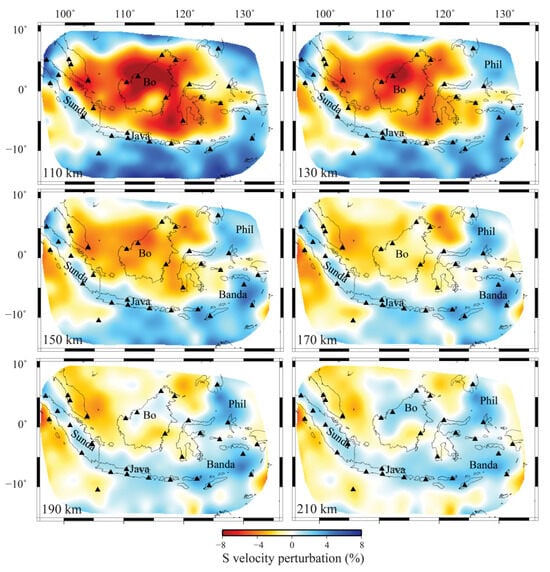
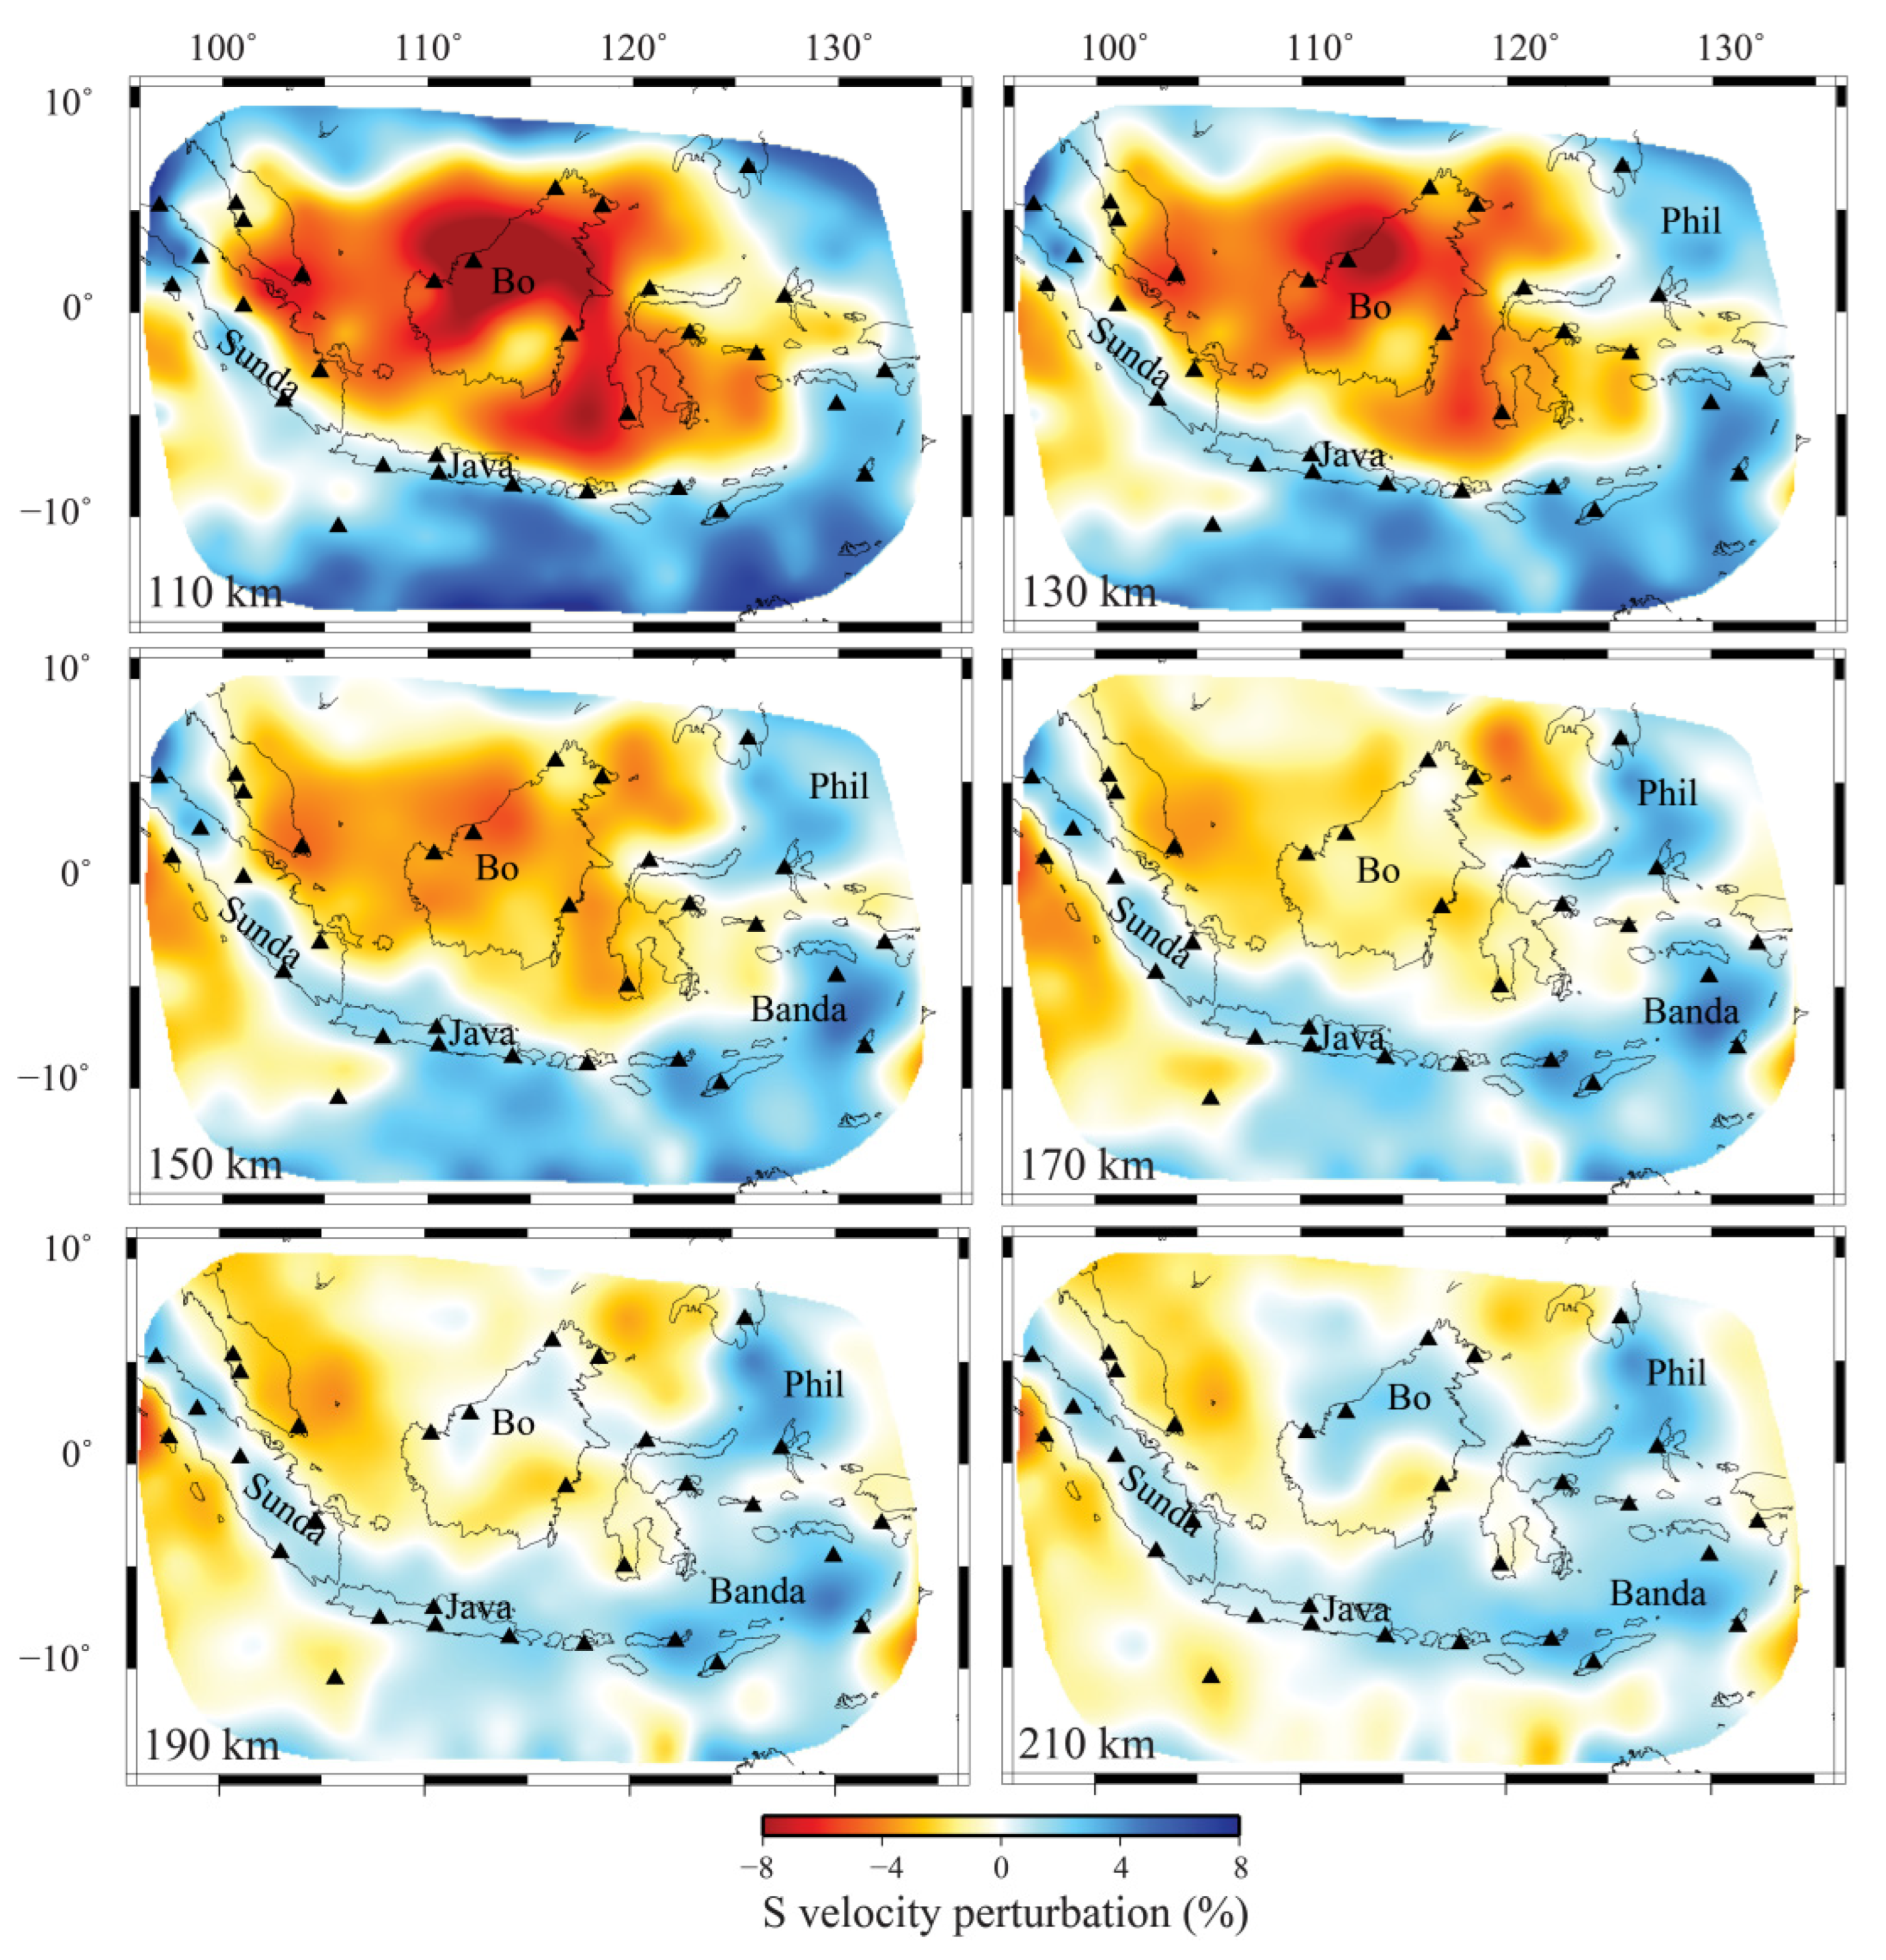
Due to the declining resolution of AN data at periods exceeding 77 s, the deeper structure (110 km–210 km) is resolved using RW data exclusively (Figure 11). With increasing depth, the amplitude of velocity perturbations generally decays. High-velocity anomalies linked to the Sunda, Java, Timor, and Seram subduction zones migrate consistently with the inferred slab dip. The Philippine Sea slab and the Molucca Sea region become more clearly defined by high-velocity anomalies at 130 km depth. At 190–210 km depth, the high-velocity anomalies beneath the Banda Sea and Molucca Sea connect with the Philippine Sea slab and extend beneath Borneo.
Figure 11.
Mapviews of the S-wave velocity structure at depths of 110 km, 130 km, 150 km, 170 km, 190 km and 210 km from Rayleigh wave data. Note: Bo denotes Borneo.
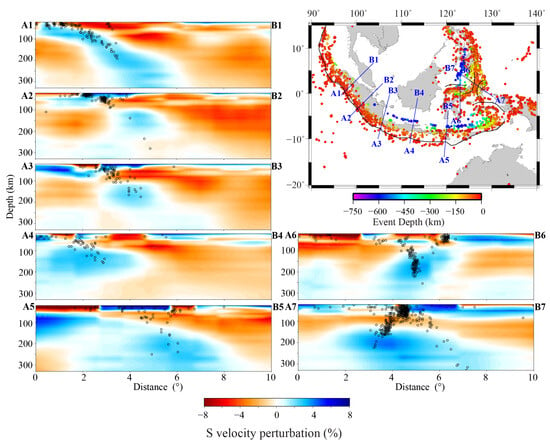
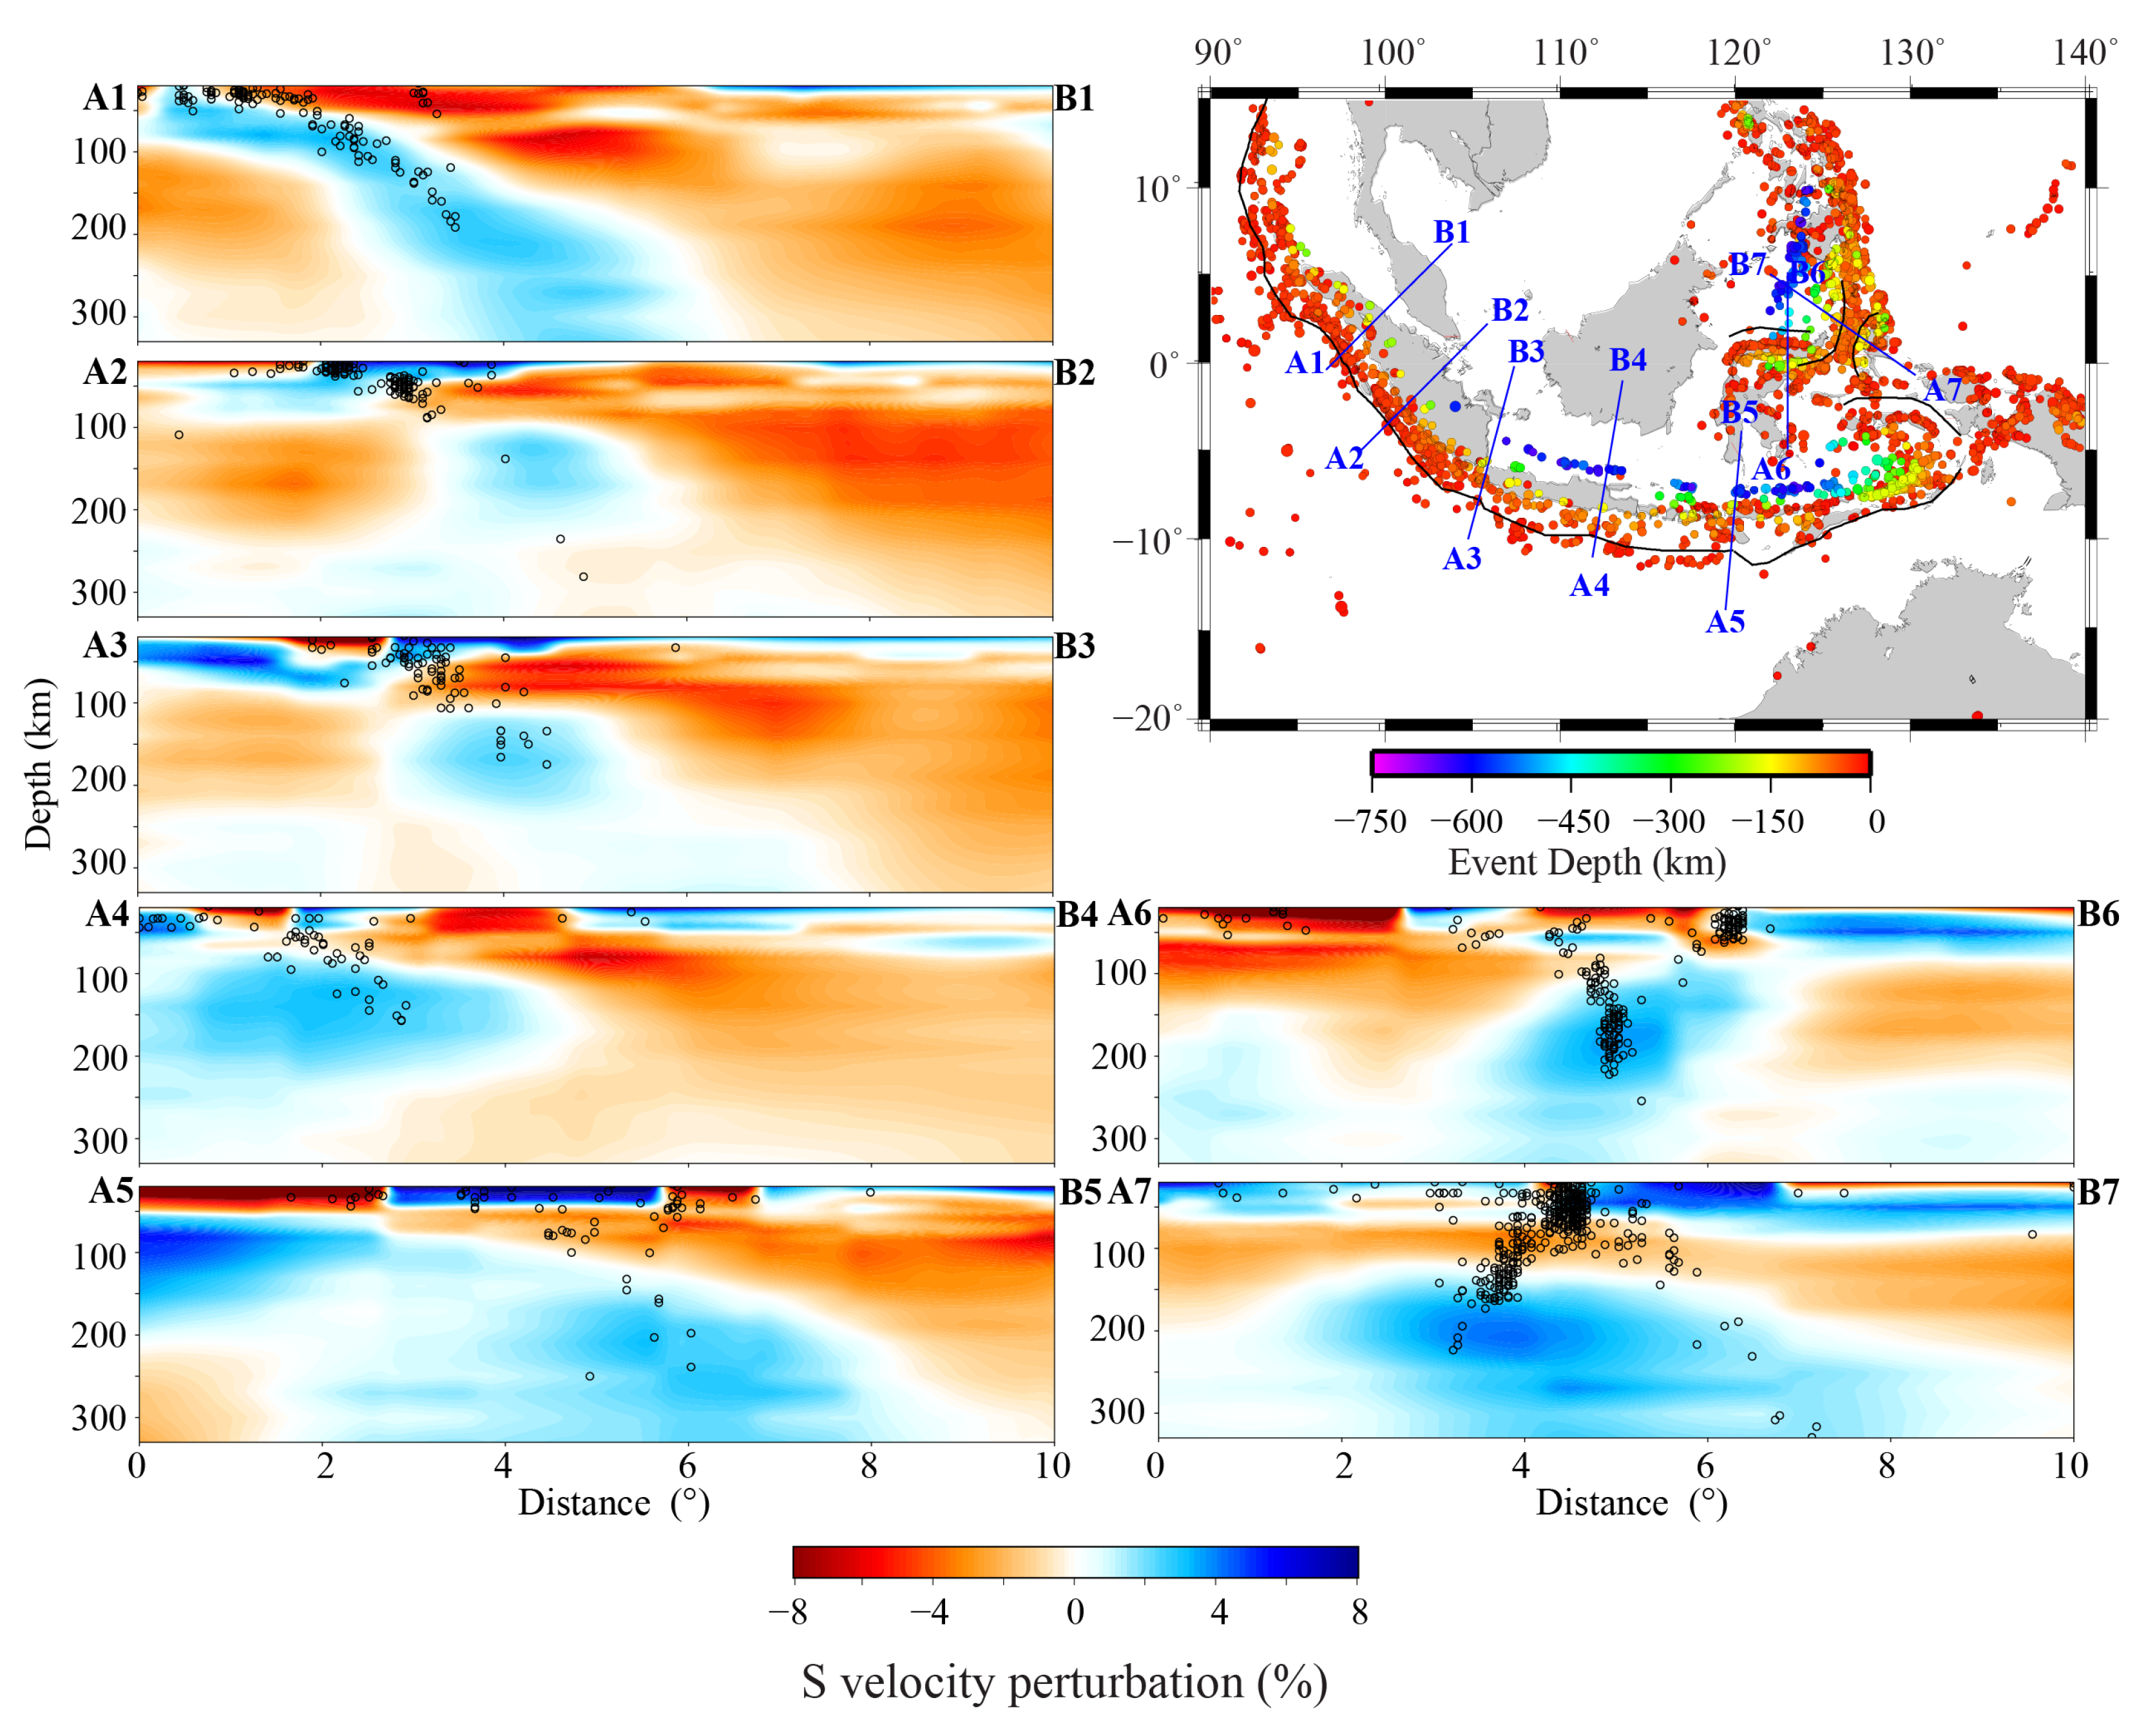
Figure 12 presents seven vertical cross-sections of the three-dimensional S-wave velocity model, arranged sequentially from west to east across the major subduction zones of the study area. Each profile is oriented sub-perpendicular to the local tectonic strike and incorporates earthquake hypocenters (MS ≥ 5.0 since 1985, sourced from the USGS) projected from a ±50 km-wide corridor aligned with the profile. All cross-sections span depths from 20 km to 330 km and extend 10° laterally, illustrating the velocity structures across the Sunda, Java, Timor, Celebes, and Molucca Sea subduction regions.
Figure 12.
Seven vertical cross-sections of the 3-D S-wave velocity structure across major subduction zones with seismicity information. Black dots show earthquakes (MS > 5.0) from USGS since 1985 projected to the section from a perpendicular distance of 1°. Major subduction trenches and seismicity are marked on the map at the right. Profile A1B1 and A2B2 located the Sunda Trench; Profile A3B3 located near the boundary between the Sunda and Java Trenches; Profile A4B4 located in the central Java Trench; Profile A5B5 located near the junction of the Java and Timor Trenches; Profile A6B6 located the Celebes Sea and the Molucca Sea; Profile A7B7 located near the Molucca Sea.
Profiles A1B1 and A2B2 transect the Sunda Trench, while A3B3 is located near the boundary between the Sunda and Java Trenches. In A1B1, near point A1, the high-velocity anomaly is ~80 km thick. At approximately 1.5° along the profile from point A1, it has expanded, becoming both wider and thicker, and continues extend downward beyond a depth of 300 km. Seismicity aligns closely with the velocity anomaly interface separating the positive and negative perturbations. The high-velocity anomalies in A2B2 and A3B3 exhibit similar geometries. At shallow depths, the anomaly extends laterally before being interrupted at ~100 km depth. A pronounced high-velocity anomaly between 120 km and 200 km depth appears at the subduction ward. These characteristics contrast with A1B1, where a continuous high-velocity anomaly is associated with sustained seismicity extending to ~200 km depth.
Profile A4B4, located in the central Java Trench, shows a thick high-velocity anomaly near point A4 with a gently dipping upper interface and a poorly defined lower boundary. The anomaly extends downdip for ~4.5° along the profile, beyond which no continuous slab-like high-velocity signal is detected. Seismicity is nearly absent between 200 km and 450 km depth, resuming only below 450 km. Profile A5B5, near the junction of the Java and Timor Trenches, contains an anomalously thick high-velocity body (~200 km thick) with a steeper dip than in A4B4, extending downdip for ~7°. Seismicity within this anomaly is generally sparse and irregular, with some concentration between 4° and 6° along the profile.
Profile A6B6 traverses the Celebes Sea subduction zone and the western branch of the Molucca Sea subduction system. Two distinct seismic trends are evident, correlating with the Celebes slab and the western Molucca slab, which converge at ~150 km depth and merge into a near-vertical distribution at greater depths. The dominant high-velocity anomaly follows the downdip direction of the Celebes slab, persists from ~100 km to 250 km depth, and shows noticeable thickening below 150 km.
Profile A7B7 crosses the double-sided subduction system of the Molucca Sea. A prominent low-velocity zone ~50 km thick is observed at ~50 km depth beneath this region, accompanied by intense seismicity; this zone thickens toward both ends of the profile. The high-velocity anomaly exhibits an asymmetric geometry, being thicker on the eastern side and thinner with a gentler dip on the western side. The highest wave speed within this anomaly occurs at ~200 km depth beneath the eastern subduction.
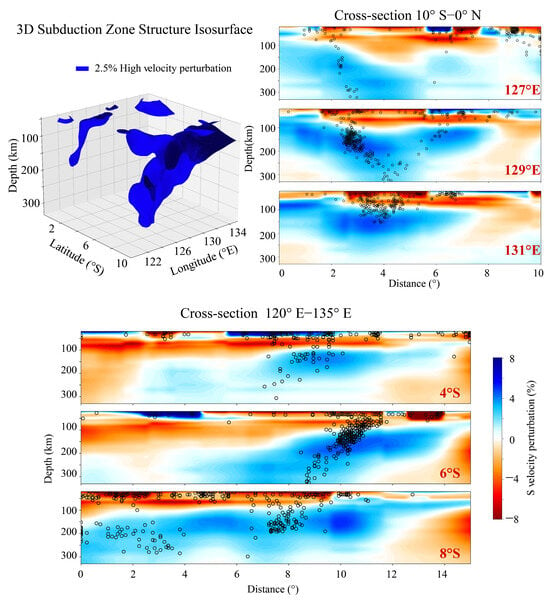
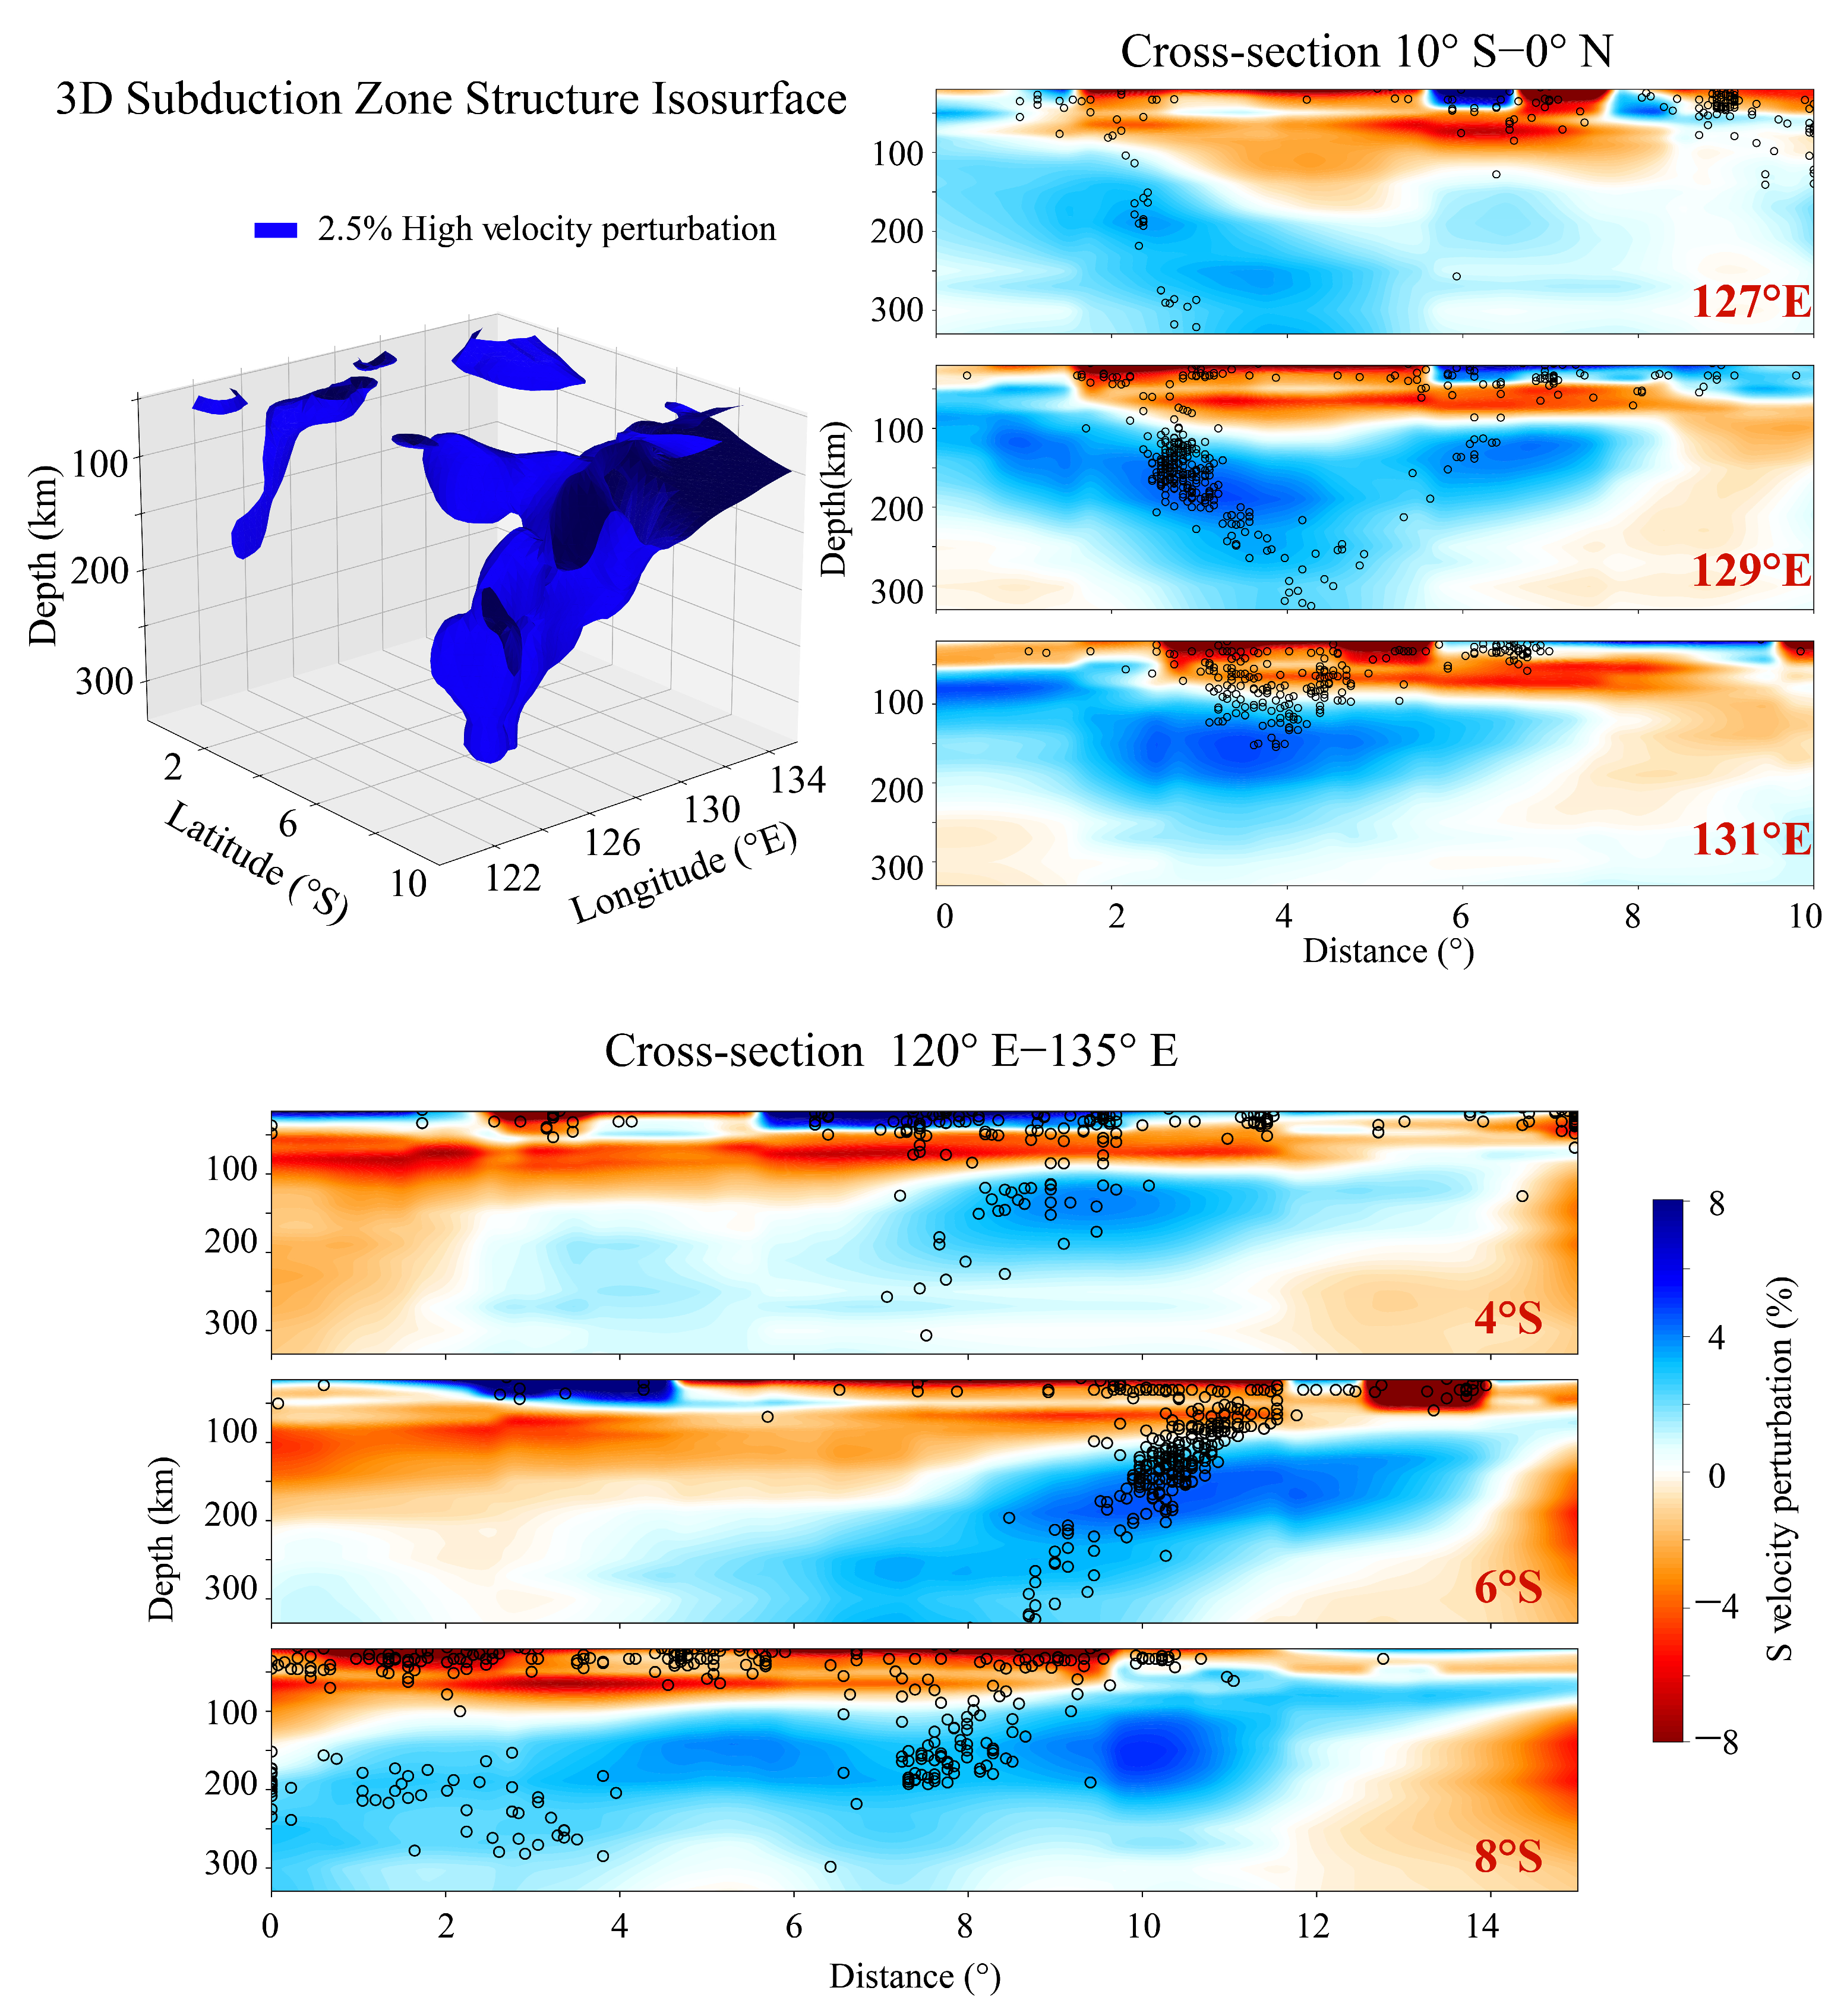
To reveal the structural complexity around the Banda Sea, we extract the 3-D isosurface of the +2.5% S-wave velocity anomaly within the region 0–10° S, 120–135° E (Figure 13). The isosurface is plotted between 50 km and 330 km depth to avoid the complex shallow crust. Figure 13 also includes three longitudinal cross-sections along 127°, 129°, and 131° E (extending from 10° S to 0° N) and three latitudinal cross-sections along 4°, 6°, and 8° S (spanning 120° E to 135° E). All profiles cover 20–330 km depth and show earthquake hypocenters, following the convention of Figure 12.
Figure 13.
The 2.5% high-velocity anomaly 3-D isosurface and six vertical cross-sections of the S-wave velocity structure crossing the Banda Arc with seismicities.
A consistent feature in the longitudinal profiles is the presence of two distinct subduction zones, which show clear asymmetry in both the morphology of high-velocity anomalies and seismicities. The southern high-velocity anomaly exhibits stronger velocity perturbation and higher seismic activity. Notably, hypocenter locations correlate poorly with the upper interface of these anomalies.
In contrast, the latitudinal profiles reveal an east-to-west subduction trend. The high-velocity anomaly is most prominent along the 6° S profile, where seismicity outlines a coherent, dipping slab. Earthquakes on the 4° S profile are more diffuse and concentrated above 200 km depth. The 8° S profile, which transects the Timor Trench, shows abundant seismicities on its western side; here, earthquakes are clustered between two high-velocity anomalies and are largely confined to depths shallower than 200 km.
5. Discussion
5.1. Comparison with Previous Tomographic Models
Our joint surface wave and ambient noise tomography reveals new details within the lithosphere and upper mantle structure beneath the Indo-Australian collision zone, implementing images derived from teleseismic body-wave travel times [25,55,56,57,58]. Earlier models consistently capture the large-scale geometry of subducting slabs, but our higher-resolution results refine several key features with important geodynamic implications.
Specifically, our model offers a better vertical resolution for slab interiors compared to prior studies. For instance, the global P-wave model UU-P07 [32] provides only six layers (~50 km thick each) between 50 and 300 km depth with a horizontal parameterization of 0.5° × 0.5°. The general dip and depth extent of the slabs have been imaged, yet such a coarse vertical resolution limits its capability to resolve fine-scale structures within subducting slabs. In contrast, our model is able to resolve the finer structure of slabs down to 330 km depth, with a particularly high resolution between 50 and 250 km. Figure S1 presents comparisons of selected profiles from Figure 12 and Figure 13 with the same cross-sections from the UU-P07 model.
Our results provide complementary and enhanced constraints on slab structure at the lithospheric to upper mantle depths, when compared to more recent regional models. For example, the teleseismic P- and S-wave study by Muttaqy et al. [58] images the upper interface of the subducting slab beneath the Java Trench well to ~200 km depth but lacks resolution on the slab’s internal structure at these and greater depths. Our model complements this by delineating the Java slab interior with greater clarity within the 0–330 km depth range. Similarly, in the Banda Arc, our findings within the resolved depth range are consistent with the anisotropic P- and S-wave tomography of Hua et al. [59], with both models identifying a high-velocity anomaly at ~150 km depth that intensifies toward 250 km.
Within this improved resolution framework, several key features are newly defined. Beneath northern Borneo, we resolve a previously undocumented vertical sequence of velocity anomalies: high velocities at 40–70 km depth, a distinct low-velocity layer near 90 km, and a return to high velocities below ~190 km. This fine-scale layering, absent in smoother global models, implies a complex interplay of processes such as entrapment of fossil slab material, pronounced compositional stratification, or localized vertical buckling of the lithosphere—challenging the conventional view of this region as a simple rigid block.
In summary, beyond confirming the regional tectonic framework, our high-resolution tomography newly identifies a redirected mantle anomaly core, a multilayered lithosphere beneath northern Borneo, and finely resolved slab interfaces that together provide stronger constraints on geodynamic models of lithospheric evolution, mantle flow, and plate coupling in this dynamic region. The detailed imaging results and their geodynamic implications for the Sunda–Java Trench, the Banda Arc, and the Molucca Sea will be analyzed in the following sections.
5.2. The Sunda–Java Trench
The Sunda–Java Trench is the most prominent subduction zone in the study region, as shown in both the phase velocity perturbation (Figure 9) and S-wave velocity perturbation maps (Figure 10 and Figure 11), particularly in the cross-section from Figure 12A1–A5,B1–B5.
The dominant feature is the high-velocity anomaly associated with the subducting slab. Horizontal slices reveal clear downdip propagation and lateral broadening with depth. Vertical cross-sections illustrate its evolution and significant along-strike geometric variability, with the five profiles in Figure 12 (left) corresponding to distinct trench segments.
At the west end of Sunda–Java Trench, close to the Wharton Fossil Ridge, the slab subducts to over 300 km, as shown in Profile A1B1, the most clearly defined slab. Hypocenters of earthquakes at <100 km depth align with the anomaly’s upper interface, while deeper earthquakes locate within the high-velocity anomalies.
Beneath the middle of Sunda to the boundary of Sunda and Java, the slab has the same dip as its western part; however, it has been torn apart at ~100 km, shown by Profiles A2B2 and A3B3. This depth of slab gap coincides with a marked decrease in seismicity below 100 km. We propose that the older, rigid slabs here have undergone vertical tearing at ~100 km. This allows hot asthenospheric material to rise through the slab window, thermally eroding and heating the upper part of the cold slab. This reduces the thermal contrast above 100 km, diminishing the expected high-velocity signature. The main slab body continues to descend below the tear, retaining its cold, high-velocity character below 100 km.
Beneath the central Java Trench, Profile A4B4, the slab is imaged only above 200 km, shallower than in other sections of the Sunda–Java Trench. This is possibly due to the older subducting lithosphere here compared to western segments. Correspondingly, the seismicity is absent between 200 and 450 km.
At the east end, it marks the ocean–continent subduction transition, shown in Profile A5B5. It exhibits an unusually thick slab (~200 km) with a steeper dip than beneath central Java. The slab extends horizontally ~7° along the profile, with generally low and irregular seismicity within the anomaly, though some clustering occurs between 4 and 6° along the profile.
The geometry of the high-velocity anomalies transitions systematically from west to east: continuous, intact slabs in the west give way to increasingly complex structures toward the east, characterized by disruption, thickening, and deep seismic gaps. This spatial progression reflects not only the transition from the juvenile oceanic to more mature continental lithosphere of the Indo-Australian plate but can also be understood within the global framework of subduction zone asymmetry [5]. According to this model, the Sunda–Java system, as a primarily NE-directed subduction zone, exhibits a dominant NE- to NNE-directed plate motion in the no-net-rotation (NNR) reference frame. In such settings, the slab tends to be relatively anchored in the mantle. Convergence often outpaces slab sinking, promoting slab buckling, thickening, and tearing at depth.
Our observations align well with this framework. The significant slab thickening, steep dip, and deep seismic gaps in the eastern segments (A4B4 and A5B5) likely manifest this resistance to sinking and associated deformation within an NNE-directed subduction context. The slab tearing at ~100 km depth and associated shallow thermal erosion in Profiles A2B2 and A3B3 further reveal the complex coupling between deep slab behavior and shallow thermal structure under this overarching kinematic regime. Thus, the along-strike morphological segmentation of the Sunda–Java Trench is not merely a function of age or lithology but reflects the combined effects of global plate kinematics and local lithospheric properties.
5.3. The Banda Arc
The Australian plate is moving northward at a high rate of approximately 70 mm/yr [60]. In the vicinity of Sumba Island (approximately 120° E), between the easternmost end of the Java Trench and the westernmost end of the Timor Trench, pronounced tectonic deformation has developed, demarcating the arc–continent collision boundary between the Australian plate and the Banda Arc. As demonstrated in Figure 10 and Figure 11, horizontal slices of the lithosphere and upper mantle at depths below approximately 90 km reveal the full lateral extent of the distinct high-velocity Banda slab. This slab extends from Sumba in the west to Aru in the east and continues northward toward Seram.
Vertical cross-sections were constructed at 2° intervals (Figure 13), in both the longitudinal and latitudinal directions. When integrated with seismicity distributions, these sections indicate that the pronounced curvature (approximately 180°) of the Banda Arc is likely the result of the interaction of two distinct subduction systems. The initial system is indicative of the northward subduction of the Australian plate along the Timor Trench, which appears to terminate in proximity to the Tarera–Aiduna Fault Zone. This segment exhibits intense seismicity, with the highest concentration of earthquakes occurring between 100 and 200 km depth, coinciding with the core of the local high-wave-speed anomaly. The second system is characterized by south-directed subduction beneath Seram, a process that is likely associated with the underthrusting of the Bird’s Head Block. In contrast, this zone exhibits significantly reduced seismicity and is distinguished by a comparatively lower-amplitude high-wave-speed anomaly. Among the three longitudinal profiles, the 127° E profile, located at the western boundary of the Seram Trench, exhibits an irregular high-velocity anomaly. This anomaly is connected with Timor at approximately 200 km, while the 129° E profile is connected at 100 km. The high-velocity anomaly body begins to converge and narrow around 250 km. At the 131° E profile, seismic activity occurs at depths not exceeding 150 km, with the high-velocity anomaly bodies fully coalescing into a shape resembling a “table knife”. It is evident from the three latitudinal profiles that the subduction angle demonstrates a gradual decline in steepness, moving from the western to the eastern boundary of the Timor Trench. The maximum velocity of the high-velocity anomaly is observed to occur in the vicinity of 130° E. The seismic activity distribution exhibited in the 6° S profile manifests distinct subduction tectonic characteristics. During its northward subduction, the Timor Trench subduction zone gradually turns northwestward in the Aru region.
Our high-resolution tomography provides critical new constraints on the long-standing debate between “single-slab bending” and “double-slab” subduction models for the Banda Arc. The key finding comes from the 131° E longitudinal profile, which shows that previously distinct high-velocity anomalies fully merge below ~250 km depth into a unified, “table-knife”-shaped structure. Shallow sections show two different domains: a seismically active Timor segment and a quieter Seram segment. However, their deep connection indicates that both are parts of a single, highly curved slab. The Timor segment represents the actively subducting, seismogenic core. In contrast, the Seram segment corresponds to the slab’s northern limb, which has experienced vertical tearing, delamination, or thermal erosion. These results support and refine the single-slab rollback model of Spakman and Hall [9]. The along-strike change from a steep western slab to a merged, folded eastern structure records how the slab responded to increasing mantle resistance during rapid southward rollback. Within the global kinematic framework of Doglioni et al. [5], the Banda Arc represents a W-directed, slow-sinking system dominated by hinge retreat. The morphology of the imaged slab, characterized by deep coherence, upper plate extension, and localized tearing, directly reflects this dynamic setting.
5.4. The Molucca Sea Region
Our tomography provides clear images of the complex double-sided subduction system in the Molucca Sea region. Profiles A6B6 and A7B7 (Figure 12) transect this unique setting, where the Molucca Sea plate subducts eastward beneath the Halmahera Arc and westward beneath the Sangihe Arc.
Although no clear trench or active arc–arc collision is presently observed [17,20,61], the convergence of two distinct seismic zones below 150 km depth in A6B6 suggests that the subducting Celebes slab and the western Molucca slab collide at this level. However, our S-wave velocity model predominantly reveals a unified, pronounced high-velocity anomaly at corresponding depths, whose morphology and orientation align more definitively with the main body of the Celebes Sea slab.
A key finding from Profile A7B7 is a pronounced, ~50 km thick low-velocity zone (LVZ) centered at ~50 km depth beneath the collision zone. This LVZ, accompanied by intense shallow seismicity and thickening toward the profile ends, is resolved in greater detail by our high-resolution surface wave tomography compared to previous body-wave models [32]. Two back-to-back subduction zones centered near 4° display different dip angles, with the highest velocity anomaly occurring at about 200 km depth beneath the eastern subduction.
Due to the resolution limit of our model (~330 km depth), the full morphology of the slab’s lower interface cannot be discerned from this profile. Although the eastern subduction of the Molucca Sea is characterized by a larger velocity anomaly and more abundant seismicity at intermediate depths, the western subduction exhibits seismic activity extending to greater focal depths. This pattern indicates an overall asymmetric, inverted “U-shaped” geometry of the dual subduction system. In explaining such asymmetry, Zhang et al. [62] attributed it to earlier and faster initiation of subduction on the western side, which could account for the present-day structural configuration.
The shallow LVZ likely results from the unique dynamics of this collisional setting. We interpret it as a zone of intensely deformed, serpentinized mantle wedge material and fragmented crust, trapped and heated between the two converging slabs. The Molucca Sea is likely caught between two converging island arcs and is currently in an advanced stage of collapse. This observed state aligns with the terminal collisional phase predicted by numerical models of divergent double subduction.
6. Conclusions
We present a new 3-D shear-wave velocity model of the Indonesian subduction system derived from a joint inversion of Rayleigh wave and ambient noise. This approach significantly enhances the resolution of lithospheric and uppermost mantle structures compared to previous P- and S-wave global tomographic models, particularly in resolving the shape and finer structure of subducting slabs.
The model reveals systematic along-strike variations in slab morphology from west to east in the Sunda–Java Trench subduction zone. Beneath the Sunda–Java Trench, a coherent high-velocity anomaly depicts a continuous slab that subducts over 300 km depth in the west. The slab transits to increasingly disrupted and thickened structures eastward, with evidence of slab tearing near 100 km depth, a deep seismic gap beneath central Java, and pronounced slab thickening near the Timor–Banda junction. These morphological changes not only reflect the lateral transition in the age and character of the subducting Indo-Australian Plate but also align with the predicted signatures of subduction zone asymmetry in a global kinematic framework. The observed progression is consistent with the dynamics of a northeast-directed subduction zone, where the absolute motion of the slab enhances mantle resistance and promotes complex internal deformation.
In the Banda Arc region, our high-resolution tomography model provides a key constraint on the slab structure at depth. The results show that the distinct high-velocity anomalies associated with the Timor and Seram segments merge into a single, coherent “table-knife”-shaped structure below ~250 km depth. This deep continuity supports a single-slab rollback model for the pronounced arc curvature. The imaged slab morphology clearly expresses the dynamics of a west-directed, hinge-retreat-dominated subduction system. It is characterized by deep coherence at depth, extension in the upper plate, and localized tearing within the slab.
Beneath the Molucca Sea collision zone, our high-resolution tomography reveals a shallow (about 50 km depth), seismically active low-velocity zone that is not resolved in previous global models. This feature likely reflects ongoing arc–arc collision dynamics, illustrating how double-sided subduction and slab interaction are accommodated in the upper mantle.
Overall, this study provides details of the lithosphere and uppermost mantle for understanding one of Earth’s most tectonically complex convergent margins. The high-resolution imaging not only clarifies the geometry and segmentation of subducting slabs but also highlights the interplay between subduction dynamics, slab tearing, and plate-scale bending. These results provide a foundation for future geodynamic modeling aimed at quantifying the temporal evolution of subduction and collision processes in the region and for further implementing our understanding of plate theory.
Supplementary Materials
The following supporting information can be downloaded at: https://www.mdpi.com/article/10.3390/geosciences16030101/s1. Figure S1: Selected profiles from Figure 12 and Figure 13 compared with same profile from the UU-P07 model.
Author Contributions
Conceptualization, F.L. and T.Y.; methodology, T.Y.; software, F.L. and T.Y.; validation, F.L. and D.S.; formal analysis, F.L. and D.S.; data curation, F.L., D.S. and Y.D.; writing—original draft preparation, F.L.; writing—review and editing, F.L.,D.S. and Y.D.; visualization, D.S.; supervision, T.Y.; project administration, F.L.; funding acquisition, F.L. All authors have read and agreed to the published version of the manuscript.
Funding
This research is funded by the Shanghai Science and Technology Committee (grant 23DZ1200200).
Data Availability Statement
The waveform data utilized in this study were obtained from two sources: 7 stations waveform data were obtained from Incorporated Research Institutions for Seismology (IRIS; https://www.iris.edu, accessed on 5 January 2014), and the remaining 24 stations waveform data were collected from the GEOFON seismic network (GFZ; https://geofon.gfz.de/, accessed on 10 January 2014).
Acknowledgments
We thank Huajian Yao for providing the code for image-transformation techniques and Aibing Li for sharing her code for synthetic data generation. The figures were prepared using GMT6.
Conflicts of Interest
The authors declare no conflicts of interest. The funders had no role in the design of the study; in the collection, analyses, or interpretation of data; in the writing of the manuscript; or in the decision to publish the results.
References
- Hall, R. The Eurasian SE Asian margin as a modern example of an accretionary orogen. Geol. Soc. Lond. Spec. Publ. 2009, 318, 351–372. [Google Scholar] [CrossRef] [Scilit]
- Hall, R.; Blundell, D.J. Tectonic evolution of SE Asia: Introduction. Geol. Soc. Lond. Spec. Publ. 1996, 106, vii–xiii. [Google Scholar] [CrossRef] [Scilit]
- Di Leo, J.F.; Wookey, J.; Hammond, J.O.S.; Kendall, J.-M.; Kaneshima, S.; Inoue, H.; Yamashina, T.; Harjadi, P. Mantle flow in regions of complex tectonics: Insights from Indonesia. Geochem. Geophys. Geosyst. 2012, 13, Q12008. [Google Scholar] [CrossRef] [Scilit]
- Hamilton, W. Tectonics of the Indonesian Region; U. S. Geological Survey Professional Paper; US Government Printing Office: Washington, DC, USA, 1979; Volume 1078, 345p.
- Doglioni, C.; Carminati, E.; Cuffaro, M.; Scrocca, D. Subduction kinematics and dynamic constraints. Earth-Sci. Rev. 2007, 83, 125–175. [Google Scholar] [CrossRef] [Scilit]
- Bird, P. An updated digital model of plate boundaries. Geochem. Geophys. Geosyst. 2003, 4, 1027. [Google Scholar] [CrossRef] [Scilit]
- Djajadihardja, Y.S.; Taira, A.; Tokuyama, H.; Aoike, K.; Reichert, C.; Block, M.; Schluter, H.U.; Neben, S. Evolution of an accretionary complex along the north arm of the island of Sulawesi, Indonesia. Isl. Arc 2004, 13, 1–17. [Google Scholar] [CrossRef] [Scilit]
- Hall, R.; Wilson, M.E. Neogene sutures in eastern Indonesia. J. Asian Earth Sci. 2000, 18, 781–808. [Google Scholar] [CrossRef] [Scilit]
- Spakman, W.; Hall, R. Surface deformation and slab–mantle interaction during Banda arc subduction rollback. Nat. Geosci. 2010, 3, 562–566. [Google Scholar] [CrossRef] [Scilit]
- Sdrolias, M.; Müller, R.D. Controls on back-arc basin formation. Geochem. Geophys. Geosyst. 2006, 7, Q04016. [Google Scholar] [CrossRef] [Scilit]
- Muller, C.; Barckhausen, U.; Ehrhardt, A.; Engels, M.; Gaedicke, C.; Keppler, H.; Flueh, E.R.; Djajadihardja, Y.S.; Soemantri, D.; Seeber, L. From Subduction to Collision: The Sunda-Banda Arc Transition. Eos Trans. Am. Geophys. Union 2008, 89, 49–50. [Google Scholar] [CrossRef] [Scilit]
- Kundu, B.; Gahalaut, V.K. Slab detachment of subducted Indo-Australian plate beneath Sunda arc, Indonesia. J. Earth Syst. Sci. 2011, 120, 193–204. [Google Scholar] [CrossRef] [Scilit]
- Widiyantoro, S.; Pesicek, J.D.; Thurber, C.H. Subducting slab structure below the eastern Sunda arc inferred from non-linear seismic tomographic imaging. Geol. Soc. Lond. Spec. Publ. 2011, 355, 139–155. [Google Scholar] [CrossRef] [Scilit]
- Bowin, C.; Purdy, G.M.; Johnston, C.; Shor, G.; Lawver, L.; Hartono, H.M.S.; Jezek, P. Arc–continent collision in the Banda Sea region. AAPG Bull. 1980, 64, 868–915. [Google Scholar]
- Hinschberger, F.; Malod, J.; Rehault, J.; Villeneuve, M.; Royer, J.; Burhanuddin, S. Late Cenozoic geodynamic evolution of eastern Indonesia. Tectonophysics 2005, 404, 91–118. [Google Scholar] [CrossRef] [Scilit]
- Fichtner, A.; De Wit, M.J.; Van Bergen, M. Subduction of continental lithosphere in the Banda Sea region: Combining evidence from full waveform tomography and isotope ratios. Earth Planet. Sci. Lett. 2010, 297, 405–412. [Google Scholar] [CrossRef] [Scilit]
- Silver, E.A.; Moore, J.C. The Molucca Sea Collision Zone, Indonesia. J. Geophys. Res. 1978, 83, 1681–1691. [Google Scholar] [CrossRef] [Scilit]
- McCaffrey, R. Earthquakes and ophiolite emplacement in the Molucca Sea Collision Zone, Indonesia. Tectonics 1991, 10, 433–453. [Google Scholar] [CrossRef] [Scilit]
- Jaffe, L.A.; Hilton, D.R.; Fischer, T.P.; Hartono, U. Tracing magma sources in an arc-arc collision zone: Helium and carbon isotope and relative abundance systematics of the Sangihe Arc, Indonesia. Geochem. Geophys. Geosyst. 2004, 5, Q04J10. [Google Scholar] [CrossRef] [Scilit]
- McCaffery, R.; Silver, E.A. Crustal Structure of the Molucca Sea Collision Zone, Indonesia. Tecton. Geol. Evol. Southeast Asian Seas Isl.—Geophys. Monogr. 1980, 23, 161–177. [Google Scholar]
- Hall, R. Cenozoic geological and plate tectonic evolution of SE Asia and the SW Pacific: Computer-based reconstructions, models, and animations. J. Asian Earth Sci. 2001, 20, 351–431. [Google Scholar] [CrossRef] [Scilit]
- Replumaz, A.; Tapponnier, P. Reconstruction of the deformed collision zone Between India and Asia by backward motion of lithospheric blocks. J. Geophys. Res. 2003, 108, 2285. [Google Scholar] [CrossRef] [Scilit]
- Planert, L.; Kopp, H.; Lueschen, E.; Mueller, C.; Flueh, E.R.; Shulgin, A.; Djajadihardja, Y.S.; Krabbenhoeft, A. Lower plate structure and upper plate deformational segmentation at the Sunda-Banda arc transition, Indonesia. J. Geophys. Res. 2010, 115, B08107. [Google Scholar] [CrossRef] [Scilit]
- Miller, M.S.; O’Driscoll, L.J.; Roosmawati, N.; Harris, C.W.; Porritt, R.W.; Widiyantoro, S.; Cost, L.T.D.; Soares, E.; Becker, T.; West, A.J. Banda Arc Experiment—Transitions in the Banda Arc-Australian Continental Collision. Seismol. Res. Lett. 2016, 87, 1417–1423. [Google Scholar] [CrossRef] [Scilit]
- Zenonos, A.; De Siena, L.; Widiyantoro, S.; Rawlinson, N. P and S wave travel time tomography of the SE Asia-Australia collision zone. Phys. Earth Planet. Inter. 2019, 293, 106267. [Google Scholar] [CrossRef] [Scilit]
- Dou, H.; Xu, Y.; Lebedev, S.; de Melo, B.C.; van der Hilst, R.D.; Wang, B.; Wang, W. The upper mantle beneath Asia from seismic tomography, with inferences for the mechanisms of tectonics, seismicity, and magmatism. Earth-Sci. Rev. 2024, 255, 104841. [Google Scholar] [CrossRef] [Scilit]
- Becker, T.W.; Boschi, L. A comparison of tomographic and geodynamic mantle models. Geochem. Geophys. Geosyst. 2002, 3, 2001GC000168. [Google Scholar] [CrossRef] [Scilit]
- Ritsema, J.; McNamara, A.K.; Bull, A.L. Tomographic filtering of geodynamic models: Implications for model interpretation and large-scale mantle structure. J. Geophys. Res. Solid Earth 2007, 112, B01303. [Google Scholar] [CrossRef] [Scilit]
- Butterworth, N.P.; Talsma, A.S.; Müller, R.D.; Seton, M.; Bunge, H.P.; Schuberth, B.S.A.; Shephard, G.; Heine, C. Geological, tomographic, kinematic and geodynamic constraints on the dynamics of sinking slabs. J. Geodyn. 2014, 73, 1–13. [Google Scholar] [CrossRef] [Scilit]
- Sokolov, S.Y.; Trifonov, V.G. Arc Tectonic Elements and Upper Mantle Structure of Central and Southeast Asia: Seismic Tomography and Seismicity Data. Geotectonics 2024, 58, 23–40. [Google Scholar] [CrossRef] [Scilit]
- Lo Bue, R.; Rappisi, F.; Vanderbeek, B.P.; Faccenda, M. Tomographic image interpretation and Central-Western Mediterranean-like upper mantle dynamics from coupled seismological and geodynamic modeling approach. Front. Earth Sci. 2022, 10, 884100. [Google Scholar] [CrossRef] [Scilit]
- Amaru, M.L. Global Travel Time Tomography with 3-D Reference Models. Ph.D. Thesis, Utrecht University, Utrecht, The Netherlands, 2007. [Google Scholar]
- Le, B.M.; Yang, T.; Morgan, J.P. Seismic Constraints on Crustal and Uppermost Mantle Structure Beneath the Hawaiian Swell: Implications for Plume-Lithosphere Interactions. J. Geophys. Res. Solid Earth 2022, 127, e2021JB023822. [Google Scholar] [CrossRef] [Scilit]
- Pan, M.; Yang, T.; Le, B.M.; Dai, Y.; Xiao, H. The Magmatic Patterns Formed by the Interaction of the Hainan Mantle Plume and Lei–Qiong Crust Revealed through Seismic Ambient Noise Imaging. Geosciences 2024, 14, 63. [Google Scholar] [CrossRef] [Scilit]
- Orfanos, C.; Leontarakis, K.; Apostolopoulos, G. Surface wave tomography using active sources in engineering applications: A 3D experiment at a test site of known conditions. J. Appl. Geophys. 2022, 200, 104617. [Google Scholar] [CrossRef] [Scilit]
- Du, N.; Yang, T.; Xu, T.; Liu, Q. Incorporating topographic effects in surface wave tomography based on shortest-path ray tracing. Geophys. J. Int. 2024, 237, 1235–1248. [Google Scholar] [CrossRef] [Scilit]
- Levshin, A.L.; Yanocskaya, T.B.; Lander, A.V.; Bukchin, B.G.; Barmin, M.P.; Ratnikova, L.I.; Its, E.N. Seismic Surface Waves in a Laterally Inhomogeneous Earth; Keilis-Borok, V.I., Ed.; Kluwer Academic Publishers: Dordrecht, The Netherlands, 1989; pp. 153–163. [Google Scholar]
- Forsyth, D.W.; Li, A. Array analysis of two-dimensional variations in surface wave phase velocity and azimuthal anisotropy in the presence of multipathing interference. In Seismic Earth: Array Analysis of Broadband Seismograms; AGU Geophysical Monograph Series; AGU Publications: Washington, DC, USA, 2005; pp. 81–98. [Google Scholar]
- Bensen, G.D.; Ritzwoller, M.H.; Barmin, M.; Levshin, A.L.; Lin, F.C.; Moschetti, M.P.; Shapiro, N.M.; Yang, Y. Processing seismic ambient noise data to obtain reliable broadband surface wave dispersion measurements. Geophys. J. Int. 2007, 169, 1239–1260. [Google Scholar] [CrossRef] [Scilit]
- Yao, H.; van der Hilst, R.D.; de Hoop, M.V. Surface-wave array tomography in SE Tibet from ambient seismic noise and two-station analysis: I-Phase velocity maps. Geophys. J. Int. 2006, 166, 732–744. [Google Scholar] [CrossRef] [Scilit]
- Lobkis, O.I.; Weaver, R.L. On the emergence of the Green’s function in the correlations of a diffusive field. J. Acoust. Soc. Am. 2001, 110, 3011–3017. [Google Scholar] [CrossRef] [Scilit]
- Weaver, R.L.; Lobkis, O.I. Diffuse fields in open systems and the emergence of the Green’s function. J. Acoust. Soc. Am. 2004, 116, 2731–2734. [Google Scholar] [CrossRef] [Scilit]
- Lin, F.C.; Ritzwoller, M.H.; Townend, J.; Bannister, S.; Savage, M.K. Ambient noise Rayleigh wave tomography of New Zealand. Geophys. J. Int. 2007, 170, 649–666. [Google Scholar] [CrossRef] [Scilit]
- Liang, C.; Langston, C.A. Ambient seismic noise tomography and structure of eastern North America. J. Geophys. Res. 2008, 113, B03309. [Google Scholar] [CrossRef] [Scilit]
- Aki, K.; Lee, W.H.K. Determination of three-dimensional velocity anomalies under a seismic array using first P arrival times from local earthquakes: 1. A homogeneous initial model. J. Geophys. Res. 1976, 81, 4381–4399. [Google Scholar] [CrossRef] [Scilit]
- Rawlinson, N.; Fichtner, A.; Sambridge, M.; Young, M.K. Seismic tomography and the assessment of uncertainty. Adv. Geophys. 2010, 52, 1–76. [Google Scholar]
- Shapiro, N.M.; Campillo, M.; Stehly, L.; Ritzwoller, M.H. High-resolution surface-wave tomography from ambient seismic noise. Science 2005, 307, 1615–1618. [Google Scholar] [CrossRef] [Scilit]
- Forsyth, D.W.; Webb, S.C.; Dorman, L.M.; Shen, Y. Phase velocities of Rayleigh waves in the MELT experiment on the East Pacific Rise. Science 1998, 280, 1235–1238. [Google Scholar] [CrossRef] [Scilit]
- Kennett, B.L.N.; Engdahl, E.R. Travel times for global earthquake location and phase association. Geophys. J. Int. 1991, 105, 429–465. [Google Scholar] [CrossRef] [Scilit]
- Press, W.H.; Teukolsky, S.A.; Vetterling, W.T.; Flannery, B.P. Numerical Recipes in FORTAN: The Art of Scientific Computing, 2nd ed.; Cambridge University Press: Cambridge, UK, 1992; p. 963. [Google Scholar]
- Tarantola, A.; Valette, B. Generalized nonlinear inverse problems solved using the least squares criterion. Rev. Geophys. Space Phys. 1982, 20, 219–232. [Google Scholar] [CrossRef] [Scilit]
- Yao, H.; Xu, G.; Zhu, L.; Xiao, X. Mantle structure from inter-station Rayleigh wave dispersion and its tectonic implication in western China and neighboring regions. Phys. Earth Planet. Inter. 2005, 148, 39–54. [Google Scholar] [CrossRef] [Scilit]
- Saito, M. DISPER80: A subroutine package for the calculation of seismic normal mode solutions. In Seismological Algorithms: Computational Methods and Computer Programs; Doornbos, D.J., Ed.; Elsevier: Amsterdam, The Netherlands, 1988; pp. 293–319. [Google Scholar]
- Laske, G.; Masters, G.; Ma, Z.; Pasyanos, M. Update on CRUST1.0—A 1-degree Global Model of Earth’s crust. Geophys. Res. Abstr. 2013, 15, 2658. [Google Scholar]
- Hall, R.; Spakman, W. Mantle structure and tectonic history of SE Asia. Tectonophysics 2015, 658, 14–45. [Google Scholar] [CrossRef] [Scilit]
- Legendre, C.P.; Zhao, L.; Chen, Q.-F. Upper-mantle shear-wave structure under East and Southeast Asia from Automated Multimode Inversion of waveforms. Geophys. J. Int. 2015, 203, 707–719. [Google Scholar] [CrossRef] [Scilit]
- Toyokuni, G.; Zhao, D.; Kurata, K. Whole-mantle tomography of Southeast Asia: New insight into plumes and slabs. J. Geophys. Res. Solid Earth 2022, 127, e2022JB024298. [Google Scholar] [CrossRef] [Scilit]
- Muttaqy, F.; Nugraha, A.D.; Mori, J.; Puspito, N.T.; Supendi, P.; Rohadi, S. Seismic imaging of lithospheric structure beneath Central-East Java region, Indonesia: Relation to recent earthquakes. Front. Earth Sci. 2022, 10, 756806. [Google Scholar] [CrossRef] [Scilit]
- Hua, Y.; Zhao, D.; Xu, Y.-G. P and S wave anisotropic tomography of the Banda subduction zone. Geophys. Res. Lett. 2023, 50, e2023GL105611. [Google Scholar] [CrossRef] [Scilit]
- Bock, Y.; Prawirodirdjo, L.M.; Genrich, J.F.; Stevens, C.; McCaffrey, R.; Subarya, C.; Puntodewo, S.S.O.; Calais, E. Crustal motion in Indonesia from Global Positioning System measurements. J. Geophys. Res. 2003, 108, 2367. [Google Scholar] [CrossRef] [Scilit]
- Hall, R. Plate boundary evolution in the Halmahera region, Indonesia. Tectonophysics 1987, 144, 337–352. [Google Scholar] [CrossRef] [Scilit]
- Zhang, Q.; Guo, F.; Zhao, L.; Wu, Y. Geodynamics of divergent double subduction: 3-D numerical modeling of a Cenozoic example in the Molucca Sea region, Indonesia. J. Geophys. Res. Solid Earth 2017, 122, 3977–3998. [Google Scholar] [CrossRef] [Scilit]
Disclaimer/Publisher’s Note: The statements, opinions and data contained in all publications are solely those of the individual author(s) and contributor(s) and not of MDPI and/or the editor(s). MDPI and/or the editor(s) disclaim responsibility for any injury to people or property resulting from any ideas, methods, instructions or products referred to in the content. |
© 2026 by the authors. Licensee MDPI, Basel, Switzerland. This article is an open access article distributed under the terms and conditions of the Creative Commons Attribution (CC BY) license.