


Simple Summary
Temperature fluctuations pose a challenge to rainbow trout farming, highlighting the need for nutritional strategies that support fish growth and physiological function. This study investigated whether dietary gamma-aminobutyric acid, a naturally occurring compound involved in nerve signaling, could improve growth and influence responses to a brief increase in water temperature. Young rainbow trout were fed diets containing different levels of this compound for eight weeks. GABA supplementation improved growth and feed utilization, while higher dietary levels increased blood cortisol concentrations measured during recovery from exposure to warmer water. This increase could reflect a stronger stress response, slower recovery, or slower removal of cortisol from the blood. Because cortisol was measured at only one recovery time point, this study cannot distinguish these possibilities or demonstrate improved heat tolerance or faster recovery. These findings support the potential use of gamma-aminobutyric acid in feeds to improve rainbow trout production. Further research is needed to clarify its role in responses to temperature stress.
Abstract
γ-aminobutyric acid (GABA) is a functional feed additive that may improve growth and stress resilience. The study evaluated the effects of dietary GABA on growth performance and recovery-phase physiological responses after short-term acute thermal exposure in juvenile rainbow trout. Two hundred twenty-five fish (18.9 ± 0.1 g) were fed five diets for 8 weeks: a control diet containing 68 mg/kg (GABA68) and diets with 108 (GABA108), 149 (GABA149), 183 (GABA183), and 218 (GABA218) mg/kg GABA. Fish were then subjected to short-term acute thermal exposure (20 °C for 2 h) followed by 2 h recovery at 15 °C. Dietary GABA significantly improved weight gain and specific growth rate, with the provisional model-based dietary GABA level for weight gain estimated to be approximately 198–210 mg/kg diet based on broken-line regression models, and increased feed and protein efficiency (p < 0.05). Fish fed the GABA183 and GABA218 diets had significantly higher plasma cortisol concentrations than those fed GABA68 and GABA108 when averaged across temperature treatments, with a significant temperature × GABA interaction (p < 0.05). During recovery, hepatic hsp70α and hsp90βα expression was significantly lower following 20 °C exposure than in fish maintained at 15 °C, whereas dietary GABA and its interaction with temperature had no significant effects on the stress-related genes analyzed. Dietary GABA improved growth performance and feed utilization; however, cortisol measured at a single recovery time point cannot distinguish a stronger stress response, delayed recovery, or altered cortisol clearance and does not demonstrate improved thermal tolerance or a faster recovery rate.
1. Introduction
Climate change has caused increased fluctuations in water temperatures, presenting significant challenges for cold-water aquaculture species, particularly salmonids [1]. Major mortality events attributed to temperature stress have been reported in salmonid aquaculture worldwide, with rising temperatures contributing to physiological stress, immune suppression, and reduced survival rates [2,3,4]. As poikilothermic organisms, fish are susceptible to environmental temperature changes, which directly impact critical physiological processes, including growth, enzyme activity, metabolic rates, immune function, overall health, and survival [4,5,6,7,8,9].
As a globally important cold-water aquaculture fish, rainbow trout (Oncorhynchus mykiss) has attracted widespread attention due to its high nutritional and economic value in aquaculture [10]. However, its susceptibility to temperature-induced stress presents a major challenge for sustainable production. The optimal temperature range for rainbow trout is 10–18 °C, with temperatures above this threshold disrupting metabolic balance, inducing oxidative stress, impairing immune function, and ultimately leading to increased mortality and reduced productivity [4]. For instance, when the temperature reaches above 20 °C, its appetite decreases, and growth becomes slow [10]. Once the temperature exceeds 24 °C, it ceases intake, with its life activities continuing to decline until death [4,10]. Given the projected increase in temperature variability due to climate change, developing effective strategies to enhance the temperature resilience of rainbow trout is critical for ensuring the sustainability of aquaculture operations.
Nutritional interventions have emerged as promising strategies to improve stress tolerance in aquaculture species [11]. One such intervention is the dietary supplementation of gamma-aminobutyric acid (GABA), a non-proteinogenic amino acid that acts as an inhibitory neurotransmitter in vertebrates. GABA plays a vital role in modulating neuronal excitability and stress responses, influencing growth, immune function, and overall physiological resilience in fish [12,13,14]. Several studies have shown that dietary GABA supplementation improves growth performance and metabolic efficiency in various aquaculture species, including olive flounder (Paralichthys olivaceus) [15], Nile tilapia (Oreochromis niloticus) [16,17], and juvenile grass carp (Ctenopharyngodon idellus) [18]. Despite the extensive research on GABA’s effects on growth and feed utilization, its potential role in mitigating temperature-induced stress in salmonids remains largely unexplored.
Therefore, this study evaluated the effects of dietary GABA supplementation on growth performance, feed utilization, whole-body composition, plasma biochemical indices, plasma and brain free amino acid profiles, growth-related gene expression, and physiological responses during recovery from acute thermal exposure in juvenile rainbow trout. Based on the measured parameters, this study aimed to determine the practical dietary GABA inclusion level for growth and to assess whether dietary GABA modulates metabolic and stress-related responses after short-term thermal exposure.
2. Materials and Methods
2.1. Ethics Statement
The research was carried out in strict compliance with the ethical guidelines and regulatory standards established by the Animal Care and Use Committee of Pukyong National University, Republic of Korea (Approval No. PKNUIACUC-2022-34, Approval date: 15 June 2022). All procedures involving fish including handling, rearing, sampling, and thermal stress challenges were designed to minimize discomfort, stress, and mortality. Husbandry conditions were monitored throughout the experimental period to ensure compliance with national and institutional standards for the ethical use of aquatic animals in research. Every effort was made to reduce the number of animals used and to refine experimental protocols to safeguard the welfare of the juvenile rainbow trout throughout the study.
2.2. Experimental Diets
To determine the optimal dietary supplementation level of γ-aminobutyric acid (GABA) for juvenile rainbow trout, five experimental diets were formulated to be isonitrogenous and isolipidic. GABA (≥99% purity; Sigma-Aldrich, St. Louis, MO, USA; catalog no. A2129; CAS no. 56-12-2) was used as the test additive and stored in a tightly closed container under dry conditions before diet preparation. A basal diet without supplemental GABA (GABA68) and four diets supplemented with 50 mg (GABA108), 100 mg (GABA149), 150 mg (GABA183), and 200 mg (GABA218) GABA per kilogram of diet were prepared, with α-cellulose substituted accordingly. Because ingredients such as fishmeal contained endogenous GABA, the basal diet (GABA68) also provided some naturally occurring GABA. Protein sources included anchovy fishmeal, squid liver powder, poultry by-product meal, soybean meal, tankage meal, and soy protein concentrate. Wheat flour and fish oil were used as carbohydrate and lipid sources, respectively. The schematic diagram of the experiment is illustrated in Figure 1.
Figure 1.
This schematic diagram illustrates the experimental design used to evaluate the effects of GABA-supplemented diets on fish growth, physiological stress responses, and metabolic changes. The growth trial consisted of an 8-week feeding period with diets containing different levels of GABA supplementation (68–217 mg/kg), followed by sampling for plasma metabolites, liver and brain gene expression, and whole-body nutrient composition. The acute thermal exposure and recovery test was then conducted, in which fish were either maintained at 15 °C or exposed to 20 °C for 2 h, followed by a 2 h recovery period at 15 °C. Plasma and liver samples were subsequently collected for metabolite, cortisol, and gene expression analyses.
Diet preparation and storage followed the procedures of Bai and Kim [19]. Briefly, dry ingredients were thoroughly mixed using a mixer (Model KB-108, Kimhill, Chia Yi, Taiwan). The mixture was moistened with water (~45% of total ingredient weight), and fish oil was gradually added until complete homogenization was achieved. The dough was pelleted through a 2-mm die (Baokyong Commercial Co., Busan, Republic of Korea), broken into small pellets by hand, spread on trays, and dried overnight in a room equipped with a dehumidifier. Dried pellets were individually bagged and stored at –20 °C until use in the feeding trial.
Proximate composition of the diets was analyzed at the Feeds and Foods Nutrition Research Center (FFNRC), Pukyong National University (Busan, Republic of Korea), following the Association of Official Analytical Chemists (AOAC) [20] methods. Moisture was determined by drying samples at 105 °C; ash by incineration at 550 °C using a muffle furnace (DAIHAN, WiseTherm®, Seoul, Republic of Korea); crude lipid by Soxhlet extraction using a Soxtec system 1046 (Tecator AB, Höganäs, Sweden); and crude protein by the Kjeldahl method (N × 6.25) using an Auto Kjeldahl system (B 324/435/412, BÜCHI Labortechnik AG, Flawil, Switzerland; 8-719/806, Metrohm AG, Herisau, Switzerland) after acid digestion. Total GABA concentrations in the finished diets were determined by high-performance liquid chromatography (HPLC) at FFNRC after overnight drying. The analyzed concentrations were 67.7, 108.0, 149.1, 183.1, and 217.8 mg/kg diet. GABA recovery during feed processing was not directly quantified because paired measurements before and after processing were not performed. The dried diets were stored at −20 °C until use; however, GABA stability during storage was not evaluated. The formulation and proximate composition of the five experimental diets are presented in Table 1.
Table 1.
Formulation and proximate composition of the five experimental diets supplemented with different levels of γ-aminobutyric acid (GABA) for juvenile rainbow trout.
2.3. Experimental Fish and Feeding Trial
An eight-week feeding trial was conducted at the Aquafeed Nutrition Laboratory, Pukyong National University (PKNU). Juvenile rainbow trout were obtained from An-il Fish Farm (Andong-si, Gyeongsangbuk-do, Republic of Korea) and transported to PKNU. Fish were stocked into rectangular tanks (77 L capacity; 30 L working volume) supplied with continuous freshwater flow (1.2 L/min) and aeration. Prior to the trial, fish underwent a two-week acclimation in an indoor semi-recirculating system and were fed a basal diet; all fish remained clinically healthy and lesion-free. The sex of the experimental fish was not determined.
For the feeding trial, 225 fish (initial body weight, IBW: 18.9 ± 0.1 g; mean ± SEM) were randomly allocated to 15 tanks (15 fish per tank). Tanks were then randomly assigned to one of five dietary treatments, with three replicate tanks per diet. The photoperiod during the feeding trial was maintained at 9 h light and 15 h dark. Water quality was monitored twice daily: temperature was maintained at 15.0 ± 1.0 °C using a Sun-Cool water temperature regulator (Model DH-2010, Daeil, Republic of Korea); pH was 7.35 ± 0.03; and dissolved oxygen (DO) was 7.02 ± 0.06 mg/L (means ± SEM). Fish were hand-fed their respective diets twice daily (09:00 and 16:00) at a daily ration of 2.0–2.5% body weight, adjusted based on observed feed intake. Every two weeks, the total number and biomass in each tank were recorded and rations recalculated accordingly. Tanks were siphoned after each feeding to remove uneaten feed and feces. Feed intake used to calculate FE and PER was determined by subtracting the quantity of recovered uneaten feed from the total feed supplied for each tank. Mortality was checked daily; any dead fish were removed immediately, and rations were recalculated to maintain the target feeding rate. Dead-fish biomass was not included in the biomass gain used to calculate FE and PER.
2.4. Sample Collection and Analyses
2.4.1. Growth Performance
At the end of the feeding trial, fish were fasted for 24 h to allow complete gut evacuation. Final weighing was then conducted to record the weight and number of individuals in each tank. These data were used to calculate final body weight (FBW), weight gain (WG), specific growth rate (SGR), feed efficiency (FE), protein efficiency ratio (PER), and survival rate (SR). From each tank, six fish were randomly selected and anesthetized with 300 ppm phenoxyethanol for 5–10 min, while the remaining fish were returned to the tanks for the acute thermal exposure and recovery test. Anesthetized fish were individually measured for wet weight and total length to calculate condition factor (CF). Blood samples were collected from each fish using 1 mL syringes containing ethylenediaminetetraacetic acid (EDTA), pooled by tank into 3.0 mL blood collection tubes, and transferred to 1.5 mL microfuge tubes. Plasma was separated by centrifugation at 13,000 rpm for 5 min using a CF-10 centrifuge (Daihan Scientific, Seoul, Republic of Korea), immediately frozen in liquid nitrogen, and stored at −80 °C until analysis. Liver and brain tissues were excised, pooled by tank on aluminum foil, frozen in liquid nitrogen, and stored at −80 °C until analysis. After blood collection, three anesthetized fish per tank were placed in zipper bags and stored at −20 °C for whole-body proximate composition analysis. The remaining three fish were dissected to collect liver and viscera for the calculation of hepatosomatic index (HSI) and viscerosomatic index (VSI) as indicators of morphological changes in response to dietary treatments. Additional liver and brain samples were collected for amino acid profiling and gene expression analysis.
2.4.2. Whole-Body Proximate Composition Analysis
Whole-body proximate composition was analyzed to evaluate the nutritional status of juvenile rainbow trout in response to dietary treatments. At the end of the feeding trial, fish samples were homogenized and freeze-dried for 48 h prior to analysis. The parameters measured included moisture, crude protein, crude lipid, and crude ash. Analytical procedures were identical to those used for the proximate composition of the experimental diets, as described above.
2.4.3. Plasma Biochemical Parameters Analysis
Plasma samples were analyzed for biochemical parameters, including glutamic oxaloacetic transaminase (GOT), glutamic pyruvate transaminase (GPT), total protein (TP), triglycerides (TG), total cholesterol (TCHO), and glucose (GLU), using a chemical analyzer (Fuji DRI-CHEM NX500i, Fuji Photo Film Ltd., Tokyo, Japan). Plasma cortisol was measured using an enzyme-linked immunosorbent assay (ELISA) kit (CUSABIO, Houston, TX, USA; catalog no. CSB-E08487f). Standard reagents and plasma samples were processed according to the manufacturer’s instructions. Absorbance was determined at 450 nm with a microplate reader (AMR-100, Allsheng, Hangzhou, China). All measurements were performed in triplicate.
2.4.4. Free Amino Acids Profile of Plasma and Brain Analysis
The free amino acid profiles of plasma and brain samples were determined by high-performance liquid chromatography (HPLC) at the Feeds and Foods Nutrition Research Center (FFNRC). Briefly, 0.3 g of tissue (solid) was homogenized using a hand-held homogenizer (Model D-130, Wiggens Co., Ltd., Beijing, China), after which 10 mL of HPLC-grade distilled water was added. The mixture was vortexed for 1 min at 5000 rpm using a multifunction vortex mixer (Maxshake™, Daihan Scientific, Wonju, Gangwon-do, Republic of Korea), followed by sonication for 20 min. Samples were then centrifuged at 4500 rpm for 10 min at 4 °C. A 0.7 mL aliquot of the supernatant was transferred to 1.5 mL microtubes, mixed with 0.7 mL of 7% sulfosalicylic acid (1:1, v/v), and incubated in the dark at 4 °C overnight. The mixture was centrifuged again at 4500 rpm for 10 min at 4 °C, and a 1 mL aliquot of the resulting supernatant was filtered through a 0.2 μm membrane filter before transfer to HPLC vials for analysis. For plasma samples, the same procedures were followed except that the homogenization step was omitted, as the sample was already liquid.
2.4.5. Gene Expression of the Liver and Brain
Total RNA was extracted from liver and brain samples using the Hybrid-RTM kit (GeneAll, Seoul, Republic of Korea) following the manufacturer’s instructions. RNA quantity and quality were assessed spectrophotometrically using a NanoDrop Lite Plus spectrophotometer (Thermo Fisher Scientific, Waltham, MA, USA). Complementary DNA (cDNA) was synthesized using the PrimeScript™ 1st Strand cDNA Synthesis Kit (Takara Bio, Kusatsu, Shiga, Japan) according to the manufacturer’s protocol. The cDNA samples were stored at −20 °C until use for quantitative PCR (qPCR). qPCR was performed to evaluate mRNA expression levels of ghr-I, ghr-II, igf-I, igf-II, gh1, gh2, gabarapl1, wap65-1, wap65-2, hsp90βα, and hsp70α. β-actin served as the internal control (housekeeping gene). The stability of β-actin expression across dietary treatments was not independently validated; this represents a limitation of the relative expression analysis. Reactions were carried out on a StepOne Real-Time PCR system (Applied Biosystems, Waltham, MA, USA) using TB Green® Premix Ex Taq™ II (Tli RNaseH Plus; Takara Bio, Kusatsu, Japan). Primer sequences for all target genes are shown in Table 2. The thermal cycling program consisted of an initial denaturation at 95 °C for 30 s, followed by 40 cycles of denaturation at 95 °C for 5 s and annealing/extension at 60 °C for 30 s. A melting curve analysis was performed at the end of the amplification to confirm product specificity. For each target gene, qPCR reactions were performed in triplicate. Relative mRNA expression levels were normalized to β-actin and calculated using the 2−ΔΔCt method. The mean Ct value from technical triplicates was used for each biological replicate, and ΔCt values were calculated by subtracting the Ct value of β-actin from that of each target gene. For statistical analysis, ΔCt values were used, whereas 2−ΔΔCt fold-change values are presented in the tables and figures for biological interpretation. Data analysis was performed with StepOne Software version 2.0 (Applied Biosystems, Waltham, MA, USA).
Table 2.
List of primers used for liver and brain gene expression.
2.4.6. Acute Thermal Exposure and Recovery Test
An acute thermal exposure and recovery test was conducted 24 h after the final weighing to evaluate short-term physiological responses during the recovery phase. From each replicate tank, six healthy fish were randomly selected and divided into two groups. Three fish were maintained at 15 °C, which was the rearing temperature used during the feeding trial, while the other three fish were abruptly exposed to 20 °C for 2 h. Water temperature was controlled using an artificial thermostat. After the 2 h exposure period, fish from both temperature groups were transferred to separate tanks maintained at 15 °C for a 2 h recovery period. Fish from each original dietary replicate tank were exposed separately under each temperature condition, and samples collected from fish originating from the same replicate tank were pooled. Therefore, the original replicate tank, rather than individual fish, was used as the biological experimental unit for statistical analysis. Each dietary treatment therefore had three biological tank replicates under each temperature condition. The three fish sampled within each tank–temperature group were pooled to provide one biological observation. Therefore, individual fish and technical replicate measurements did not increase the biological sample size.
After recovery, fish were anesthetized, and plasma was collected for metabolite and cortisol analyses. Liver samples were also excised for gene expression analysis. This test was designed to assess recovery-phase physiological responses after short-term acute thermal exposure, rather than chronic thermal tolerance, survival capacity, or long-term heat-stress resistance. The procedures for anesthesia, blood collection, and liver sampling were identical to those described previously. Cortisol and hepatic gene expression were measured only at the end of the 2 h recovery period. This single sampling point cannot characterize response dynamics or distinguish a stronger cortisol response, altered cortisol clearance, or delayed recovery. The short-term exposure protocol does not reproduce chronic or fluctuating thermal conditions encountered in aquaculture.
2.5. Calculations and Statistical Analysis
2.5.1. Determination of Growth Parameters and Body Indices
At the end of the 8-week feeding trial, all fish in each tank were counted and bulk-weighed 24 h after the last feeding to evaluate growth performance, feed utilization, and survival. The measured growth and feed utilization parameters included weight gain (WG), specific growth rate (SGR), feed efficiency (FE), and survival rate (SR). In addition, three fish were randomly selected from each tank, anesthetized with 2-phenoxyethanol (300 ppm; Sigma-Aldrich, St. Louis, MO, USA), and individually measured for hepatosomatic index (HSI), and viscerosomatic index (VSI). For FE and PER, biomass gain was calculated as final surviving tank biomass minus initial tank biomass, without correction for dead-fish biomass. The growth performance and morphological indices were calculated using the following equations:
WG (%) = [final weight (g) − initial weight (g)]/intial weight (g) × 100
SGR (%) = [ln final weight (g) − ln intial weight (g)]/days of trial × 100
FE (%) = [final weight (g) − initial weight (g)]/feed consumed (g) × 100
SR (%) = final number of fish/initial number of fish × 100
CF = fish weight (g)/total length (cm)3 × 100
HSI (%) = liver weight (g)/fish weight (g) × 100
VSI (%) = viscera weight (g)/fish weight (g) × 100
2.5.2. Determination of the Optimum Inclusion Level
A dose–response regression analysis was performed to estimate provisional model-based dietary GABA levels for weight gain (WG) in juvenile rainbow trout. The actual analyzed GABA concentrations in the diets were used as the independent variable (x), and tank-level WG was used as the response variable (y). Four regression models were evaluated: one-slope straight broken-line model, two-slope straight broken-line model, quadratic broken-line model, and quadratic model, following Lee et al. [32,33].
For the one-slope straight broken-line model, the response changes linearly up to a breakpoint and then reaches a plateau:
y = β0 + β1(R − x), if x < R
y = β0, if x ≥ R
For the two-slope straight broken-line model, the response changes slope after the breakpoint:
y = β0 + β1(R − x), if x < R
y = β0 + β2(x − R), if x ≥ R
For the quadratic broken-line model, the response follows a quadratic curve before reaching a plateau:
y = β0 + β1(R − x)2, if x < R
y = β0, if x ≥ R
For the quadratic model, the response was described as:
y = β0 + β1x + β2x2
Here, R denotes the breakpoint, and β0, β1, and β2 denote model coefficients. For the quadratic model, a candidate maximum was calculated as −β1/(2β2) only when the fitted curve was concave and its vertex occurred within the tested dietary range. For the broken-line models, R represents the estimated point at which the fitted response changes slope or reaches a plateau, depending on the model.
Model fit was evaluated using the adjusted coefficient of determination (adjusted R2) and corrected Akaike information criterion (AICc), with higher adjusted R2 and lower AICc indicating better fit. A provisional dietary GABA range was interpreted using model-fit criteria and the plateau responses represented by the one-slope and quadratic broken-line models. This range represents breakpoint estimates from two different models, rather than a 95% confidence interval or a definitively established dietary requirement.
2.5.3. Statistical Analysis
Data from the eight-week feeding trial were analyzed using one-way ANOVA to evaluate the effects of dietary treatments on growth performance, body indices, and whole-body composition. When significant differences were detected, Tukey’s honestly significant difference (HSD) test was applied for post hoc comparisons among treatment groups. Exploratory linear and quadratic trend analyses were performed to characterize dose-related patterns across dietary GABA levels. These analyses complemented the assessment of overall dietary differences using one-way ANOVA. Significant trends detected without a significant overall ANOVA were interpreted cautiously and were not considered evidence of significant pairwise differences. Linear and quadratic trends were evaluated to assess dose-related patterns across dietary GABA levels. These tests assessed specific response patterns, whereas overall differences among dietary groups were assessed using one-way ANOVA. Significant trends detected in the absence of a significant overall ANOVA were interpreted cautiously and were not considered evidence of significant pairwise differences. Data from the acute thermal exposure and recovery test, including plasma metabolites, cortisol, and hepatic gene expression, were analyzed using a linear mixed-effects model. Dietary GABA, temperature, and their interaction were specified as fixed effects, and original tank nested within dietary treatment was included as a random effect to account for the shared source tank of samples evaluated under both temperature conditions. Gene expression analyses were performed on ΔCt values. When no significant interaction was observed, the main effects of GABA supplementation and temperature were tested separately. All statistical analyses were conducted using SAS software (version 9.4, SAS Institute Inc., Cary, NC, USA). The assumptions of normality and homogeneity of variance were assessed using the Shapiro–Wilk and Levene’s tests, respectively. Differences were considered statistically significant at p < 0.05. Data are presented as means ± standard error of the mean (SEM).
3. Results
3.1. Growth Performance
Table 3 illustrates the effects of dietary GABA inclusion on the growth performance of juvenile rainbow trout over eight weeks. Survival rates remained high, exceeding 97% across all groups, with no significant differences (p > 0.05). Dietary GABA significantly influenced final body weight (FBW), weight gain (WG), and specific growth rate (SGR). The highest numerical FBW, WG, and SGR values were observed in the GABA218 group, and significant positive linear trends were detected for these parameters (p < 0.05). Specifically, FBW was significantly higher in the GABA149 and GABA218 groups than in the GABA68 and GABA108 groups, whereas the GABA183 group showed an intermediate value. For WG and SGR, the GABA218 group showed significantly higher values than the GABA68 and GABA108 groups, while the GABA149 and GABA183 groups showed intermediate values that were not significantly different from either the lower or higher GABA groups. These results indicate that dietary GABA improved growth performance in juvenile rainbow trout, with the strongest growth response observed in fish fed the GABA218 diet. Regression analysis further estimated the provisional model-based dietary GABA level for WG to be approximately 198–210 mg/kg diet, depending on the model used (Figure 2).
Table 3.
Growth performance of juvenile rainbow trout fed the experimental diets for eight weeks 1.
Figure 2.
The optimal dietary inclusion level of γ-aminobutyric acid (GABA) for weight gain (WG) in juvenile rainbow trout using four regression models. The one-slope broken-line (BL) model estimated an optimum of 210 mg/kg diet, whereas the two-slope BL and quadratic BL models estimated optimum levels of 149 and 198 mg/kg diet, respectively. The quadratic model did not provide a clearly defined optimum within the tested dietary range. Model fit was evaluated using the adjusted coefficient of determination (adjusted R2) and corrected Akaike information criterion (AICc). A provisional model-based range of approximately 198–210 mg/kg diet was derived from the one-slope and quadratic broken-line models, which had similar AICc values.
In terms of feed efficiency (FE), the GABA218 group showed significantly higher values than the GABA68 group (p < 0.05), although there were no significant differences among the other test diets. Similarly, the protein efficiency ratio (PER) was significantly higher in the GABA218 group compared to the GABA68 and GABA108 groups, with no significant differences between the GABA149 and GABA183 groups. Regarding survival rate (SR), condition factor (CF), hepatosomatic index (HSI), and viscerosomatic index (VSI), no significant differences were observed, and both linear and quadratic trends were not significant (p > 0.05).
The estimated dietary GABA levels for weight gain were 210, 149, and 198 mg/kg diet using the one-slope, two-slope, and quadratic broken-line models, respectively. The highest adjusted R2 was obtained with the quadratic model (0.6410; AICc = 105.6), but no defined optimum was obtained within the tested dietary range. Among the broken-line models, the highest adjusted R2 and lowest AICc were obtained with the one-slope model (0.6089 and 105.6), followed by the quadratic broken-line model (0.6002 and 105.9). The lowest adjusted R2 and highest AICc were obtained with the two-slope model (0.5738 and 109.3). Therefore, approximately 198–210 mg/kg diet was interpreted as a provisional model-based range derived from the two plateau models with similar AICc values. The range of 198–210 mg/kg diet represents the breakpoint estimates obtained from two different regression models and is not a 95% confidence interval. It should therefore be interpreted as a provisional model-based range rather than a precisely established dietary requirement.
3.2. Whole-Body Proximate Composition
The whole-body proximate composition of juvenile rainbow trout fed the experimental diets for eight weeks is presented in Table 4. Moisture content was significantly lower in the GABA183 group than in the GABA68 group (p < 0.05). Intermediate values were observed in the GABA108, GABA149, and GABA218 groups, which did not differ significantly from either GABA68 or GABA183. No significant differences among dietary groups were observed for crude protein, crude lipid, or crude ash contents (p > 0.05). However, trend analysis showed a significant linear response for moisture and crude lipid contents and a significant quadratic response for crude ash content. These results indicate that, apart from the moisture difference between GABA68 and GABA183, no significant pairwise differences were detected in whole-body composition. The significant trend results should be interpreted cautiously and do not establish differences between individual dietary groups.
Table 4.
Whole-body proximate compositions (% of as-is basis) of juvenile rainbow trout fed the experimental diets for 8 weeks 1.
3.3. Plasma Biochemical Parameters
The plasma biochemical parameters of juvenile rainbow trout fed the experimental diets for eight weeks are shown in Table 5. There were no significant differences among dietary groups in plasma glutamic oxaloacetic transaminase, glutamic pyruvic transaminase, total protein, triglyceride, total cholesterol, or glucose levels (p > 0.05). However, trend analysis showed a significant quadratic response for glutamic pyruvic transaminase and a significant linear response for triglyceride. These results suggest that dietary GABA supplementation did not markedly alter plasma biochemical parameters under normal rearing conditions, although selected trend responses were detected for GPT and TG.
Table 5.
Plasma metabolites of juvenile rainbow trout fed the experimental diets for 8 weeks 1.
3.4. Free Amino Acid Profile of Plasma and Brain
The free amino acid profiles of plasma and brain in juvenile rainbow trout fed the experimental diets for eight weeks are presented in Table 6 and Table 7, respectively. No significant dietary differences were detected in the plasma profile except for taurine. Fish fed the GABA108 diet exhibited significantly higher plasma taurine levels (114 ± 10 ppm) than those fed the GABA68 (85.4 ± 1.3 ppm) and GABA149 (82.2 ± 2.6 ppm) diets (p < 0.05). Intermediate values were observed in the GABA183 and GABA218 groups, which did not differ significantly from the other dietary groups. No significant linear or quadratic trend was detected for plasma taurine (p > 0.05). No significant dietary differences were detected in any measured brain free amino acids (p > 0.05).
Table 6.
Plasma-free amino acid profile (% of as-is basis) of rainbow trout fed the experimental diets for 8 weeks 1.
Table 7.
Brain-free amino acid profile (% of as-is basis) of rainbow trout fed the experimental diets for 8 weeks 1.
3.5. Gene Expression
The results of the relative gene expression levels in the brain and liver of juvenile rainbow trout fed different experimental diets for eight weeks are shown in Table 8 and Table 9, respectively. There were no significant differences in the expression of the gh1, gh2, and gabarapl1 genes in the brains of fish fed the experimental diets (p > 0.05). The expression of the ghr-I and igf-II genes in the liver showed no significant differences among fish fed the five experimental diets (p > 0.05). Hepatic ghr-II expression was significantly lower in fish fed GABA108 than in those fed GABA68 and GABA218, whereas intermediate values were observed in the GABA149 and GABA183 groups. Hepatic igf-I expression was significantly higher in fish fed GABA218 than in those fed GABA108, whereas intermediate values were observed in the remaining dietary groups (p < 0.05). However, there were no significant differences among fish fed GABA68, GABA149, GABA183, and GABA218 diets (p > 0.05).
Table 8.
Relative gene expression levels 1 in the brain of juvenile rainbow trout fed the experimental diets for 8 weeks 2.
Table 9.
Relative gene expression levels 1 in the liver of juvenile rainbow trout fed the experimental diets for 8 weeks 2.
3.6. Acute Thermal Exposure and Recovery Test
The effects of the acute thermal exposure and recovery test on plasma biochemical parameters and cortisol levels in juvenile rainbow trout fed the experimental diets are presented in Table 10 and Supplementary Figure S1. No significant interactions between temperature and GABA were observed for plasma glutamic oxaloacetic transaminase, glutamic pyruvic transaminase, total protein, triglyceride, total cholesterol, or glucose levels (p > 0.05). Similarly, temperature had no significant main effect on these plasma biochemical parameters (p > 0.05). However, dietary GABA had a significant main effect on total protein, with the GABA183 group showing a significantly higher value than the control group (p < 0.05).
Table 10.
Plasma metabolites and cortisol response of rainbow trout after the acute thermal exposure (20 °C) and recovery test 1.
For cortisol, a significant interaction effect between temperature and dietary GABA was observed (p < 0.05). The GABA68 group maintained at 15 °C exhibited the lowest cortisol level, whereas the GABA218 group exposed to 20 °C showed the highest cortisol concentration. The GABA218 group exposed to 20 °C had the highest mean cortisol concentration and differed significantly from all groups except the GABA183 group exposed to 20 °C. A significant main effect of temperature was also observed (p < 0.05), with cortisol levels being significantly higher at 20 °C than at 15 °C. Likewise, a significant main effect of dietary GABA was observed (p < 0.05), with the GABA183 and GABA218 groups showing significantly higher cortisol levels than the control (GABA68) and GABA108 groups. However, there were no significant differences between the GABA108 and GABA149 groups, nor among the GABA149, GABA183, and GABA218 groups. The box plot further illustrates the temperature-dependent increase in cortisol, particularly in fish fed higher dietary GABA levels (Supplementary Figure S1G). These results indicate that dietary GABA influenced plasma cortisol concentration during the recovery phase after short-term acute thermal exposure.
The relative hepatic expression levels of stress-related genes in juvenile rainbow trout after the acute thermal exposure and recovery test are presented in Table 11 and Figure 3. Temperature significantly affected hsp70α (p = 0.0195) and hsp90βα (p = 0.0004) expression, with lower mean expression in fish exposed to 20 °C for 2 h followed by 2 h recovery at 15 °C than in fish maintained at 15 °C. Temperature had no significant effect on wap65-1, wap65-2, or gabarapl1 expression (p > 0.05). Neither dietary GABA nor the temperature × GABA interaction significantly affected any of the genes analyzed (p > 0.05). The heatmap further illustrates variation in the relative expression of these genes across treatment groups (Figure 3); statistical significance is reported in Table 11.
Table 11.
Relative gene expression levels in the liver after the acute thermal exposure (20 °C) and recovery test 1.
Figure 3.
Heatmap of hepatic stress-related gene expression in juvenile rainbow trout after the acute thermal exposure and recovery test. Relative mRNA expression levels of wap65-1, wap65-2, hsp70α, hsp90βα, and gabarapl1 were measured in the liver after fish were maintained at 15 °C or exposed to 20 °C for 2 h, followed by 2 h recovery at 15 °C. Columns represent the interactive treatment groups, temperature main effects, and dietary GABA main effects. Color intensity indicates relative expression level, with blue representing lower expression and red representing higher expression. Expression values were normalized to β-actin, and T15GABA68 was used as the control group.
4. Discussion
This study examined the effects of dietary gamma-aminobutyric acid (GABA) supplementation on growth performance, feed utilization, physiological status, and recovery-phase responses after short-term acute thermal exposure in juvenile rainbow trout (Oncorhynchus mykiss). Growth parameters, including final body weight (FBW), weight gain (WG), specific growth rate (SGR), protein efficiency ratio (PER), and feed efficiency (FE), showed a significant linear increase with higher GABA supplementation, with the GABA218 group exhibiting significantly superior growth performance compared to the control (GABA68), indicating enhanced nutrient utilization and growth efficiency. These findings align with previous reports on olive flounder (Paralichthys olivaceus) [15], Nile tilapia (Oreochromis niloticus) [16,17], juvenile grass carp (Ctenopharyngodon idellus) [18], and juvenile Pacific white shrimp (Litopenaeus vannamei) [34], which similarly demonstrated improved growth performance with GABA supplementation. Regression analysis of weight gain in the present study estimated the provisional model-based dietary GABA level to be approximately 198–210 mg/kg diet, based on the one-slope broken-line and quadratic broken-line models. This range is comparable to the 237 mg/kg reported for olive flounder [15], but higher than the 87.5 mg/kg and 88.6 mg/kg reported for grass carp [18] and Chinese mitten crab [35], respectively. However, only five dietary GABA levels were evaluated, limiting the precision with which the response shape and breakpoint could be characterized. A plateau was assumed in the one-slope and quadratic broken-line models, whereas a second slope was permitted after the breakpoint in the two-slope model. The estimated range of 198–210 mg/kg diet should therefore be interpreted cautiously, and additional dietary levels around and above this range are needed for confirmation. Despite the positive effects on growth performance, dietary GABA supplementation had no significant impact on survival rate (SR), condition factor (CF), hepatosomatic index (HSI), or viscerosomatic index (VSI), consistent with previous studies on olive flounder [13,15], suggesting that while GABA enhances growth efficiency, it does not influence body morphology or organ indices in this species.
Furthermore, our analysis of whole-body proximate composition revealed that dietary GABA inclusion had minimal effects on macronutrient composition, with only moisture content showing significant reduction in the GABA183 group compared to the control. This observation aligns with those of Li et al. [36] and Barido et al. [37] who reported that dietary GABA inclusion reduced muscle moisture content in pharaoh cuttlefish (Sepia pharaonis) and Hanwoo steers (Bos taurus coreanae), respectively. Although intracellular water content has been associated with muscle strength and functional capacity [38], these outcomes were not measured in the present study. The observed whole-body moisture difference therefore does not establish altered water retention or muscle quality. Similarly, the significant trends in crude lipid and ash, without significant overall dietary differences, do not establish changes in lipid deposition or mineral metabolism. On the contrary, in Labeo rohita fingerlings and juvenile Litopenaeus vannamei, GABA supplementation did not affect whole-body composition [39,40], suggesting that the influence of GABA in influencing moisture levels may depend on the type of species being reared.
Monitoring free amino acid profiles can provide insights into nutrient availability, metabolic utilization, and physiological responses to dietary interventions [14,41]. In the present study, no significant dietary differences were detected in the measured plasma or brain free amino acid (FAA) profiles, except for plasma taurine. These results provide limited evidence of changes in the measured FAA profiles following dietary GABA supplementation. Dietary protein deficiency has been reported to lead to the utilization of both essential and non-essential amino acids to meet metabolic demands [13], which can alter the free amino acid profile [42]. Additionally, plasma amino acid profiles in rainbow trout have been shown to be influenced by different dietary nutrient conditions [43]. However, the absence of significant differences in the present study does not establish that amino acid homeostasis was unaffected or identify the mechanisms maintaining FAA concentrations.
Plasma taurine levels were significantly affected by dietary GABA supplementation, with the highest value observed in the GABA108 group. However, no significant linear or quadratic trend was detected, indicating that the response was not clearly dose-dependent. Although non-linear and biphasic responses have been described in other biological systems [44,45] and in animals or aquatic models exposed to bioactive compounds or environmental stressors [46,47,48,49,50], such interpretations are not supported by the present taurine data. This isolated difference should therefore be interpreted cautiously rather than as evidence of a consistent effect on taurine metabolism. Further investigation is needed to determine whether it reflects altered taurine metabolism or normal biological variation [51]. Overall, dietary GABA had limited effects on the measured FAA profiles, and no significant dietary differences were detected in brain FAA concentrations.
Haematological and blood biochemistry parameters are valuable tools increasingly used in aquaculture studies to assess fish metabolism and overall health status [52]. In the present study, we investigated the effects of dietary GABA supplementation on plasma metabolites after the termination of the feeding trial. These metabolites included key indicators of liver function, including glutamate oxaloacetate transaminase (GOT) and glutamate pyruvate transaminase (GPT). Additionally, we analyzed total protein (TP), which plays a vital role in immune response and growth; triglycerides (TG), a major energy reserve; total cholesterol (TCHO), essential for cell membrane integrity and steroid hormone synthesis; and glucose (GLU), a primary source of metabolic energy. Our observations showed that dietary GABA supplementation had no significant effects on these metabolites. However, TG levels exhibited a significant linear trend, increasing with higher GABA inclusion, while GPT levels showed a significant quadratic trend, initially rising before declining at higher inclusion levels. These findings suggest that while GABA does not markedly alter key metabolic indicators, it may subtly influence lipid metabolism and liver enzyme activity. Similar findings have been reported in previous studies. Bae et al. [53] observed no significant changes in aspartate aminotransferase (AST/GOT), alanine aminotransferase (ALT/GPT), total protein (TP), and glucose (GLU) levels in olive flounder fed GABA-supplemented diets. Likewise, Gunathilaka et al. [54] found that plasma triglyceride (TG) levels in juvenile red seabream (Pagrus major) were unaffected by dietary GABA supplementation. Additionally, Temu et al. [16] reported no significant effects of GABA supplementation on plasma total cholesterol (TCHO) levels in Nile tilapia. Although significant linear and quadratic trends were observed for plasma TG and GPT, respectively, no significant overall differences were detected among dietary groups. These findings should be interpreted cautiously, and further investigation is needed to clarify their relevance to lipid metabolism and liver enzyme activity.
Metabolic and physiological processes in fish are governed by complex molecular mechanisms, particularly within key organs such as the brain and liver, where cells integrate metabolic information into core molecular processes like transcription to adapt to environmental changes [55]. By examining gene expression in these tissues, we can gain valuable insights into how dietary interventions influence biological functions. In this study, we assessed the effects of dietary GABA supplementation on metabolic pathways in the brain and liver of juvenile rainbow trout before exposing them to stress. Specifically, we focused on genes involved in growth regulation, hormonal signaling, and metabolic processes. In the brain, we analyzed growth hormone 1 (gh1), growth hormone 2 (gh2), and GABA receptor-associated protein like 1 (gabarapl1), while in the liver, we investigated growth hormone receptor 1 (ghr-I), growth hormone receptor 2 (ghr-II), insulin-like growth factor 1 (igf-I), and insulin-like growth factor 2 (igf-II). Significant dietary differences were detected in hepatic ghr-II and igf-I expression, with lower values observed in the GABA108 group. However, a consistent increase across dietary GABA levels was not observed. These differences therefore do not establish a dose-dependent stimulation of growth-related pathways, and the observed growth improvement cannot be attributed directly to these transcript measurements. Consistent with our results, Lee et al. [56] also found no significant alterations in the expression of related genes in olive flounder following GABA supplementation. These findings indicate that improved growth performance was not accompanied by consistent dietary responses across the growth-related genes analyzed. In contrast, Ruenkoed et al. [17] reported that GABA supplementation upregulated ghr-II and igf-I expression, while Kumar et al. [40] observed significant changes in igf-I mRNA expression in Labeo rohita. Similarly, Athapaththu et al. [57] found that GABA treatment in zebrafish larvae (Danio rerio) resulted in increased growth, attributed to upregulation.
Gene expression is regulated by multiple factors, making it difficult to isolate the specific determinants of transcriptional variation [58,59]. Understanding how these factors interact to influence organismal phenotypes remains a significant challenge [60]. The discrepancies observed across studies may be attributed to GABA’s dual mode of action, which operates both centrally through the nervous system and directly at the pituitary level. The dual sites of GABA action likely account for its excitatory and inhibitory effects, influencing hormone secretion dynamics. The resulting physiological outcomes may vary depending on the specific site of action within the hypothalamic-pituitary unit and the hormonal environment at the time [61]. These findings highlight the need for further research to explore species-specific and context-dependent mechanisms regulating the physiological effects of dietary GABA.
Temperature stress in aquaculture affects key physiological processes, including nutrient uptake, hormonal regulation, and metabolism. In this study, we investigated how dietary GABA supplementation influences plasma metabolite profiles during the recovery phase following a two-hour stress exposure. Given the critical roles of liver function and metabolic homeostasis in stress resilience, we measured changes in GOT (AST) and GPT (ALT) as indicators of hepatic function, TP as a marker of protein metabolism, and TG, TCHO, and GLU to assess shifts in lipid metabolism and energy balance. To further elucidate the physiological stress response, we quantified cortisol (CORT) levels and analyzed the expression of key stress-related genes, including wap65-1 and wap65-2 (temperature acclimation genes), hsp70 and hsp90βα (genes encoding heat shock proteins), and gabarapl1 (associated with GABAergic signaling and autophagy regulation). During the recovery phase, dietary GABA significantly affected plasma total protein, while temperature, dietary GABA, and their interaction significantly affected plasma cortisol. Temperature also significantly affected hepatic hsp70α and hsp90βα expression. No significant dietary GABA effects or temperature × GABA interactions were detected for any of the stress-related genes analyzed. This suggests that while temperature stress and dietary interventions can influence specific metabolic and stress-related biomarkers, their effects may be selective rather than broadly systemic. This selectivity aligns with the concept that thermodynamics constrains physiological performance and may impose novel selective pressures on temperature physiology and metabolic regulation [62]. Moreover, the relationship between GABA and stress is complicated, as it is influenced by multiple physiological and environmental factors [14,63,64], which may explain the selectivity in the biochemical variable responses observed in our biochemical analyses.
For TP, no significant main effect of temperature was observed, suggesting that acute thermal exposure alone did not markedly alter plasma protein levels during the recovery phase. However, dietary GABA significantly affected TP levels, with the GABA183 group showing a higher value than the control group. This result may indicate that dietary GABA influenced protein metabolic status during recovery from acute thermal exposure. Similar effects of dietary GABA on protein-related physiological responses have been reported in Nile tilapia and rohu [16,40]. However, because protein turnover markers, amino acid flux, or related protein synthesis and degradation pathways were not directly measured, further mechanistic studies are needed to confirm whether GABA directly enhances protein synthesis or reduces protein degradation.
Cortisol is a major endocrine indicator of the physiological stress response in fish and plays an important role in energy mobilization and adaptation to environmental challenges, including temperature stress [65,66]. Cortisol dynamics during stress and recovery can vary depending on stressor intensity, exposure duration, and recovery status, and prolonged or repeated stress may alter HPI-axis responsiveness in fish [67,68,69]. In the present study, plasma cortisol measured after a 2 h recovery period was significantly affected by temperature, dietary GABA, and their interaction. The highest mean concentration occurred in fish fed GABA218 following exposure to 20 °C, although this group did not differ significantly from the GABA183 group exposed to 20 °C. These findings demonstrate differences in recovery-phase plasma cortisol concentrations but do not establish the underlying endocrine mechanism. Higher cortisol concentrations could reflect a stronger stress response, delayed recovery, or altered cortisol clearance. Because cortisol was measured at only one recovery time point, these explanations cannot be distinguished, and the results do not demonstrate improved thermal tolerance or a faster recovery rate. The absence of pre-exposure cortisol measurements further limits interpretation of these differences. Moreover, the provisional dietary GABA range estimated from weight gain applies specifically to growth under the feeding-trial conditions and does not establish that the higher cortisol response was adaptive. Therefore, measurements before exposure, during exposure, and at multiple recovery time points are needed to clarify the cortisol response.
Furthermore, at the molecular level, hepatic hsp70α and hsp90βα expression was significantly affected by temperature, with lower mean expression in fish previously exposed to 20 °C than in fish maintained at 15 °C. Hsp70 and Hsp90 are molecular chaperones involved in protein folding, stabilization, and remodeling [70,71], and heat shock proteins are closely associated with thermal stress responses in aquatic species [72]. However, expression was measured only after a 2 h recovery period, preventing determination of whether the observed differences reflect changes during exposure, recovery-phase regulation, or other temporal responses. The transcript measurements also do not establish changes in chaperone protein abundance or impaired protein homeostasis [73]. Further time-course studies are therefore needed to characterize hsp70α and hsp90βα responses during thermal exposure and recovery. Neither dietary GABA nor its interaction with temperature significantly affected any of the stress-related genes analyzed. The thermal exposure test included only three biological replicates per diet–temperature combination. This limited replication, together with variability in the expression measurements, may have reduced sensitivity to dietary effects and temperature × GABA interactions. Accordingly, nonsignificant findings do not establish the absence of biologically relevant effects. Future studies should include greater biological replication, with sample sizes determined prospectively to detect biologically meaningful effects, particularly interactions between dietary GABA and temperature. Although GABA concentrations were measured in the finished diets, processing recovery and storage stability were not directly evaluated. Therefore, the extent of any GABA loss during diet preparation or storage remains uncertain.
5. Conclusions
This study demonstrated that dietary γ-aminobutyric acid (GABA) supplementation improved growth performance and feed utilization in juvenile rainbow trout. Fish fed higher dietary GABA levels showed increased final body weight, weight gain, specific growth rate, feed efficiency, and protein efficiency ratio, with the provisional model-based dietary GABA level for weight gain estimated to be approximately 198–210 mg/kg diet based on broken-line regression models. Dietary GABA had limited effects on whole-body proximate composition, plasma biochemical parameters, and free amino acid profiles under normal rearing conditions, although moisture content and plasma taurine showed some dietary differences without a clear dose-dependent response. During the recovery phase after acute thermal exposure, dietary GABA influenced plasma total protein and cortisol concentrations. In particular, cortisol was significantly affected by temperature, dietary GABA, and their interaction, demonstrating differences in plasma cortisol concentrations at the measured recovery time point. However, because cortisol was measured at a single post-recovery time point, the present data cannot distinguish a stronger stress response, delayed recovery, or altered cortisol clearance and do not establish improved thermal tolerance or a faster recovery rate. In addition, although plasma total protein was affected by dietary GABA, protein turnover markers were not measured; therefore, the observed change should be interpreted as an alteration in protein metabolic status rather than direct evidence of increased protein synthesis or reduced protein degradation. At the molecular level, hepatic hsp70α and hsp90βα expression was significantly affected by temperature, with lower mean expression following 20 °C exposure and recovery than in fish maintained at 15 °C. Neither dietary GABA nor the temperature × GABA interaction significantly affected the stress-related genes analyzed. Overall, dietary GABA supplementation improved growth performance and feed utilization and affected selected physiological parameters during the recovery phase following acute thermal exposure in juvenile rainbow trout. Protein turnover, key molecular components of the HPI axis, thermal tolerance, and survival outcomes following thermal exposure were not assessed. Therefore, these findings do not establish direct modulation of the HPI axis, improved thermal tolerance, or faster recovery from heat stress. Although growth benefits were demonstrated, the functional significance of the observed recovery-phase physiological responses remains to be clarified. Field validation and longer-term studies under chronic or fluctuating thermal conditions, including assessment of survival and multiple sampling time points, are needed before practical benefits under thermal stress can be established.
Supplementary Materials
The following supporting information can be downloaded at: https://www.mdpi.com/article/10.3390/ani16203324/s1, Figure S1. Plasma biochemical parameters and cortisol levels in juvenile rainbow trout after the acute thermal exposure and recovery test. Box plots showing plasma glutamic oxaloacetic transaminase, glutamic pyruvic transaminase, total protein, triglyceride, total cholesterol, glucose, and cortisol levels in juvenile rainbow trout maintained at 15 °C or exposed to 20 °C for 2 h, followed by 2 h recovery at 15 °C after dietary γ-aminobutyric acid (GABA) supplementation. Blue and red boxes represent the 15 °C and 20 °C groups, respectively. Boxes indicate the interquartile range, horizontal lines indicate the median, whiskers indicate data range, and open circles represent individual observations. GOT, glutamic oxaloacetic transaminase; GPT, glutamic pyruvic transaminase; TP, total protein; TG, triglyceride; TCHO, total cholesterol; GLU, glucose. The original contributions presented in this study are included in the article. Further inquiries can be directed to the corresponding authors.
Author Contributions
Conceptualization, S.L. (Suhyun Lee), H.K. and S.L. (Seunghyung Lee); methodology, S.L. (Suhyun Lee), T.K., M.H.R. and S.L. (Seunghyung Lee); software, M.H.R.; formal analysis, S.L. (Suhyun Lee), D.A., T.K., H.J., M.H.R., S.Y. and A.O.O.; investigation, S.L. (Suhyun Lee), T.K., H.K., H.J. and S.Y.; data curation, D.A., H.J., M.H.R. and S.Y.; writing—original draft preparation, D.A. and M.H.R.; writing—review and editing, M.H.R., A.O.O. and S.L. (Seunghyung Lee); visualization, M.H.R.; supervision, S.L. (Seunghyung Lee); project administration, H.K.; funding acquisition, S.L. (Seunghyung Lee). All authors have read and agreed to the published version of the manuscript.
Funding
This work was supported by the National Research Foundation of Korea (NRF) grant funded by the Korean government (MSIT) in 2026 (RS-2022-00166643, Project Title: Studies on enhancement of temperature stress tolerance in cultured fish species by functional amino acids, Contribution Rate: 70%; RS-2026-25605818, Project Title: Effects of Feeding Rate and Dietary Protein-to-Energy (P/E) Ratio on Mortality and Post-stress Recovery in Olive Flounder (Paralichthys olivaceus) during High Water Temperature Periods, Contribution Rate: 30%).
Institutional Review Board Statement
The experimental protocol was approved by the Animal Care and Use Committee of Pukyong National University, Busan, Republic of Korea (Approval No. PKNUIACUC-2022-34, Approval date: 15 June 2022). All fish were handled in accordance with relevant institutional guidelines to minimize stress.
Informed Consent Statement
The animals used in this study were obtained from and maintained in an institutional research facility rather than from a private farm, veterinary clinic, or owner-submitted source. Therefore, written informed consent from animal owners was not required.
Data Availability Statement
The original contributions presented in this study are included in the article. Further inquiries can be directed to the corresponding authors.
Acknowledgments
We would like to thank all members of the Feeds and Foods Nutrition Research Center (Pukyong National University, Busan, Republic of Korea) for their contributions to the biochemical analyses.
Conflicts of Interest
The authors declare that there are no competing interests related to this work.
References
- Hosseinpour, F.; Vazirzadeh, A.; Farhadi, A.; Sajjadi, S.H. Acclimation to higher temperature and antioxidant supplemented diets improved rainbow trout (Oncorhynchus mykiss) resilience to heatwaves. Sci. Rep. 2024, 14, 11375. [Google Scholar] [CrossRef] [Scilit]
- Vikeså, V.; Nankervis, L.; Hevrøy, E.M. High dietary energy level stimulates growth hormone receptor and feed utilization in large Atlantic salmon (Salmo salar L.) under hypoxic conditions. Aquac. Nutr. 2017, 23, 1193–1203. [Google Scholar] [CrossRef] [Scilit]
- Soto, D.; León-Muñoz, J.; Dresdner, J.; Luengo, C.; Tapia, F.J.; Garreaud, R. Salmon farming vulnerability to climate change in southern Chile: Understanding the biophysical, socioeconomic and governance links. Rev. Aquac. 2019, 11, 354–374. [Google Scholar] [CrossRef] [Scilit]
- Jiang, X.; Dong, S.; Liu, R.; Huang, M.; Dong, K.; Ge, J.; Gao, Q.; Zhou, Y. Effects of temperature, dissolved oxygen, and their interaction on the growth performance and condition of rainbow trout (Oncorhynchus mykiss). J. Therm. Biol. 2021, 98, 102928. [Google Scholar] [CrossRef] [Scilit]
- Pepin, P. Effect of temperature and size on development, mortality, and survival rates of the pelagic early life history stages of marine fish. Can. J. Fish. Aquat. Sci. 1991, 48, 503–518. [Google Scholar] [CrossRef] [Scilit]
- Fonds, M.; Cronie, R.; Vethaak, A.D.; Van der Puyl, P. Metabolism, food consumption and growth of plaice (Pleuronectes platessa) and flounder (Platichthys flesus) in relation to fish size and temperature. Neth. J. Sea Res. 1992, 29, 127–143. [Google Scholar] [CrossRef] [Scilit]
- Dominguez, M.; Takemura, A.; Tsuchiya, M. Effects of changes in environmental factors on the non-specific immune response of Nile tilapia, Oreochromis niloticus L. Aquac. Res. 2005, 36, 391–397. [Google Scholar] [CrossRef] [Scilit]
- Afonso, P.; Fontes, J.; Morato, T.; Holland, K.N.; Santos, R.S. Reproduction and spawning habitat of white trevally, Pseudocaranx dentex, in the Azores, central north Atlantic. Sci. Mar. 2008, 72, 373–381. [Google Scholar] [CrossRef] [Scilit]
- Aly, S.M.; ElBanna, N.I.; Fathi, M. Chlorella in aquaculture: Challenges, opportunities, and disease prevention for sustainable development. Aquac. Int. 2024, 32, 1559–1586. [Google Scholar] [CrossRef] [Scilit]
- Li, S.; Liu, Y.; Li, B.; Ding, L.; Wei, X.; Wang, P.; Chen, Z.; Han, S.; Huang, T.; Wang, B.; et al. Physiological responses to heat stress in the liver of rainbow trout (Oncorhynchus mykiss) revealed by UPLC-QTOF-MS metabolomics and biochemical assays. Ecotoxicol. Environ. Saf. 2022, 242, 113949. [Google Scholar] [CrossRef] [Scilit]
- Varghese, T.; SanalEbeneeza; Dar, S.A.; Pal, A.K. Mitigation of stress in fish through nutraceuticals. Development 2021, 3, 1014. [Google Scholar]
- Li, X.; Zheng, S.; Wu, G. Nutrition and metabolism of glutamate and glutamine in fish. Amino Acids 2020, 52, 671–691. [Google Scholar] [CrossRef] [Scilit]
- Bae, J.; Moniruzzaman, M.; Je, H.W.; Lee, S.; Choi, W.; Min, T.; Kim, K.W.; Bai, S.C. Evaluation of gamma-aminobutyric acid (GABA) as a functional feed ingredient on growth performance, immune enhancement, and disease resistance in olive flounder (Paralichthys olivaceus) under high stocking density. Antioxidants 2024, 13, 647. [Google Scholar] [CrossRef] [Scilit]
- Ogun, A.O.; Kim, H.; Yoon, S.; Lee, S.; Jeon, H.; Aulia, D.; Hur, J.; Lee, S. Effects of dietary gamma-aminobutyric acid (GABA) inclusion on acute temperature stress responses in juvenile olive flounder (Paralichthys olivaceus). Animals 2025, 15, 809. [Google Scholar] [CrossRef] [Scilit]
- Farris, N.W.; Hamidoghli, A.; Bae, J.; Won, S.; Choi, W.; Biró, J.; Lee, S.; Bai, S.C. Dietary supplementation with γ-aminobutyric acid improves growth, digestive enzyme activity, non-specific immunity and disease resistance against Streptococcus iniae in juvenile olive flounder, Paralichthys olivaceus. Animals 2022, 12, 248. [Google Scholar] [CrossRef] [Scilit]
- Temu, V.; Kim, H.; Hamidoghli, A.; Park, M.; Won, S.; Oh, M.; Han, J.K.; Bai, S.C. Effects of dietary gamma-aminobutyric acid in juvenile Nile tilapia, Oreochromis niloticus. Aquaculture 2019, 507, 475–480. [Google Scholar] [CrossRef] [Scilit]
- Ruenkoed, S.; Nontasan, S.; Phudkliang, J.; Phudinsai, P.; Pongtanalert, P.; Panprommin, D.; Mongkolwit, K.; Wangkahart, E. Effect of dietary gamma aminobutyric acid (GABA) modulated the growth performance, immune and antioxidant capacity, digestive enzymes, intestinal histology and gene expression of Nile tilapia (Oreochromis niloticus). Fish. Shellfish Immunol. 2023, 141, 109056. [Google Scholar] [CrossRef] [Scilit]
- Wu, F.; Liu, M.; Chen, C.; Chen, J.; Tan, Q. Effects of dietary gamma aminobutyric acid on growth performance, antioxidant status, and feeding-related gene expression of juvenile grass carp, Ctenopharyngodon idellus. J. World Aquac. Soc. 2016, 47, 820–829. [Google Scholar] [CrossRef] [Scilit]
- Bai, S.S.; Kim, K.W. Effects of dietary animal protein sources on growth and body composition in Korean rockfish, Sebates schlegelii. J. Aquac. 1997, 10, 77–85. [Google Scholar]
- AOAC. Official Methods of Analysis, 18th ed.; Association of Official Analytical Chemists: Arlington, VA, USA, 2005. [Google Scholar]
- Wiseman, S.; Osachoff, H.; Bassett, E.; Malhotra, J.; Bruno, J.; VanAggelen, G.; Mommsen, T.P.; Vijayan, M.M. Gene expression pattern in the liver during recovery from an acute stressor in rainbow trout. Comp. Biochem. Physiol. Part D Genom. Proteom. 2007, 2, 234–244. [Google Scholar] [CrossRef] [Scilit]
- Liu, G.; Wang, L.; Yu, H.; Pan, M.; Yang, M.; Zhang, W.; Mai, K. Effects of dietary protein levels on growth performance, digestibility, anti-oxidative responses and expressions of growth-related genes in triploid rainbow trout Oncorhynchus mykiss farmed in seawater. Aquac. Nutr. 2021, 27, 998–1008. [Google Scholar] [CrossRef] [Scilit]
- Cleveland, B.M.; Weber, G.M. Effects of sex steroids on expression of genes regulating growth-related mechanisms in rainbow trout (Oncorhynchus mykiss). General. Comp. Endocrinol. 2015, 216, 103–115. [Google Scholar] [CrossRef] [Scilit]
- Dobrochna, A.; Jerzy, Ś.; Teresa, O.; Magda, F.; Małgorzata, R.; Yuichiro, M.; Kacper, M. Effect of copper and silver nanoparticles on trunk muscles in rainbow trout (Oncorhynchus mykiss, Walbaum, 1792). Turk. J. Fish. Aquat. Sci. 2018, 18, 781–788. [Google Scholar]
- Vazirzadeh, A.; Marhamati, A.; Chisti, Y. Seaweed-based diets lead to normal growth, improved fillet color but a down-regulated expression of somatotropic axis genes in rainbow trout (Oncorhynchus mykiss). Aquaculture 2022, 554, 738183. [Google Scholar] [CrossRef] [Scilit]
- Adamek, A.; Kasprzak, A. Insulin-Like Growth Factor (IGF) System in Liver Diseases. Int. J. Mol. Sci. 2018, 19, 1308. [Google Scholar] [CrossRef] [Scilit]
- Aksakal, E.; Ceyhun, S.B.; Beydemir, S.; Erdogan, O. Alterations in growth related genes (GH-I, IGF-I and IGF-II) expression with acute copper exposure in rainbow trout. J. Anim. Vet. Adv. 2011, 10, 3334–3339. [Google Scholar] [CrossRef] [Scilit]
- Mennigen, J.A.; Magnan, J.; Touma, K.; Best, C.; Culbert, B.M.; Bernier, N.J.; Gilmour, K.M. Social status-dependent regulation and function of the somatotropic axis in juvenile rainbow trout. Mol. Cell. Endocrinol. 2022, 554, 111709. [Google Scholar] [CrossRef] [Scilit]
- Seiliez, I.; Gutierrez, J.; Salmerón, C.; Skiba-Cassy, S.; Chauvin, C.; Dias, K.; Kaushik, S.; Tesseraud, S.; Panserat, S. An in vivo and in vitro assessment of autophagy-related gene expression in muscle of rainbow trout (Oncorhynchus mykiss). Comp. Biochem. Physiol. Part B Biochem. Mol. Biol. 2010, 157, 258–266. [Google Scholar] [CrossRef] [Scilit]
- Roh, H.; Park, J.; Park, J.; Kim, B.S.; Park, C.I.; Kim, D.H. Identification and characterization of warm temperature acclimation proteins (Wap65s) in rainbow trout (Oncorhynchus mykiss). Dev. Comp. Immunol. 2022, 135, 104475. [Google Scholar] [CrossRef] [Scilit]
- Ojima, N.; Yamashita, M.; Watabe, S. Quantitative mRNA expression profiling of heat-shock protein families in rainbow trout cells. Biochem. Biophys. Res. Commun. 2005, 329, 51–57. [Google Scholar] [CrossRef] [Scilit]
- Lee, S.; Wang, Y.; Hung, S.S.; Strathe, A.B.; Fangue, N.A.; Fadel, J.G. Development of optimum feeding rate model for white sturgeon (Acipenser transmontanus). Aquaculture 2014, 433, 411–420. [Google Scholar] [CrossRef] [Scilit]
- Lee, S.; Kim, H.C.; Park, C.J.; Park, J.W.; Noh, G.E.; Lee, Y.M.; Kim, W.J. A comparison of one-slope straight broken-line, two-slope straight broken-line, quadratic broken-line and quadratic models to estimate an accurate optimum feeding rate for juvenile olive flounder (Paralichthys olivaceus). Aquac. Nutr. 2019, 25, 1183–1193. [Google Scholar] [CrossRef] [Scilit]
- Xie, S.W.; Li, Y.T.; Zhou, W.W.; Tian, L.X.; Li, Y.M.; Zeng, S.L.; Liu, Y.J. Effect of γ-aminobutyric acid supplementation on growth performance, endocrine hormone and stress tolerance of juvenile Pacific white shrimp, Litopenaeus vannamei, fed low fishmeal diet. Aquac. Nutr. 2017, 23, 54–62. [Google Scholar] [CrossRef] [Scilit]
- Zhang, C.; Wang, X.; Su, R.; He, J.; Liu, S.; Huang, Q.; Qin, C.; Zhang, M.; Qin, J.; Chen, L. Dietary gamma-aminobutyric acid (GABA) supplementation increases food intake, influences the expression of feeding-related genes and improves digestion and growth of Chinese mitten crab (Eriocheir sinensis). Aquaculture 2022, 546, 737332. [Google Scholar] [CrossRef] [Scilit]
- Li, J.; Jiang, M.; Han, Q.; Peng, R.; Jiang, X. Effects of γ-aminobutyric acid supplementation on the growth performance, serum biochemical indices and antioxidant status of pharaoh cuttlefish, Sepia pharaonic. Aquac. Nutr. 2020, 26, 1026–1034. [Google Scholar] [CrossRef] [Scilit]
- Barido, F.H.; Lee, C.W.; Park, Y.S.; Lee, S.K. The effect of a finishing diet supplemented with γ-aminobutyric acids on carcass characteristics and meat quality of Hanwoo steers. Anim. Biosci. 2021, 34, 621. [Google Scholar] [CrossRef] [Scilit]
- Lorenzo, I.; Serra-Prat, M.; Yébenes, J.C. The role of water homeostasis in muscle function and frailty: A review. Nutrients 2019, 11, 1857. [Google Scholar] [CrossRef] [Scilit]
- Bae, J.; Hamidoghli, A.; Farris, N.W.; Olowe, O.S.; Choi, W.; Lee, S.; Won, S.; Ohh, M.; Lee, S.; Bai, S.C. Dietary γ-aminobutyric acid (GABA) promotes growth and resistance to Vibrio alginolyticus in whiteleg shrimp Litopenaeus vannamei. Aquac. Nutr. 2022, 2022, 9105068. [Google Scholar] [CrossRef] [Scilit]
- Kumar, M.; Gupta, G.; Varghese, T. Effect of dietary gamma-aminobutyric acid on growth performance, haemato-immunological responses, antioxidant enzymes activity, ghrelin and IGF-I expression of Labeo rohita (Hamilton, 1822) fingerlings. Comp. Clin. Pathol. 2023, 32, 53–65. [Google Scholar] [CrossRef] [Scilit]
- Tandon, P.N.; Kushwaha, K. A study of nutritional transport in capillary-tissue exchange system. Int. J. Biomed. Comput. 1992, 30, 1–15. [Google Scholar] [CrossRef] [Scilit]
- Vysotskiĭ, V.G.; Vlasova, T.F.; Ushakov, A.S.; Nevolina, T.V. Diagnostic value of the free amino acid content in blood plasma during human dietary protein deficiency. Kosm. Biol. I Aviakosmicheskaia Meditsina 1976, 10, 59–64. [Google Scholar]
- Tantikitti, C.; March, B.E. Dynamics of plasma free amino acids in rainbow trout (Oncorhynchus mykiss) under variety of dietary conditions. Fish. Physiol. Biochem. 1995, 14, 179–194. [Google Scholar] [CrossRef] [Scilit]
- Agathokleous, E.; Kitao, M.; Calabrese, E.J. Hormesis: Highly generalizable and beyond laboratory. Trends Plant Sci. 2020, 25, 1076–1086. [Google Scholar] [CrossRef] [Scilit]
- Ramesh, V.; Krishnan, J. A unified approach to dissecting biphasic responses in cell signaling. eLife 2023, 12, e86520. [Google Scholar] [CrossRef] [Scilit]
- Halldner, L.; Ådén, U.; Dahlberg, V.; Johansson, B.; Ledent, C.; Fredholm, B.B. The adenosine A1 receptor contributes to the stimulatory, but not the inhibitory effect of caffeine on locomotion: A study in mice lacking adenosine A1 and/or A2A receptors. Neuropharmacology 2004, 46, 1008–1017. [Google Scholar] [CrossRef] [Scilit]
- Dey, A.; Guha, P.; Chattopadhyay, S.; Bandyopadhyay, S.K. Biphasic activity of resveratrol on indomethacin-induced gastric ulcers. Biochem. Biophys. Res. Commun. 2009, 381, 90–95. [Google Scholar] [CrossRef] [Scilit]
- Bain, P.A.; Kumar, A. Cytotoxicity of binary mixtures of human pharmaceuticals in a fish cell line: Approaches for non-monotonic concentration–response relationships. Chemosphere 2014, 108, 334–342. [Google Scholar] [CrossRef] [Scilit]
- Zhan, J.; Wang, S.; Li, F.; Ji, C.; Wu, H. Dose-dependent responses of metabolism and tissue injuries in clam Ruditapes philippinarum after subchronic exposure to cadmium. Sci. Total Environ. 2021, 779, 146479. [Google Scholar] [CrossRef] [Scilit]
- Zhan, J.; Wang, S.; Li, F.; Ji, C.; Wu, H. Global characterization of dose-dependent effects of cadmium in clam Ruditapes philippinarum. Environ. Pollut. 2021, 273, 116443. [Google Scholar] [CrossRef] [Scilit]
- Beckon, W.N.; Parkins, C.; Maximovich, A.; Beckon, A.V. A general approach to modeling biphasic relationships. Environ. Sci. Technol. 2008, 42, 1308–1314. [Google Scholar] [CrossRef] [Scilit]
- Esmaeili, N. Blood performance: A new formula for fish growth and health. Biology 2021, 10, 1236. [Google Scholar] [CrossRef] [Scilit]
- Bae, J.; Hamidoghli, A.; Won, S.; Choi, W.; Lim, S.G.; Kim, K.W.; Lee, B.J.; Hur, S.W.; Bai, S.C. Evaluation of seven different functional feed additives in a low fish meal diet for olive flounder, Paralichthys olivaceus. Aquaculture 2020, 525, 735333. [Google Scholar] [CrossRef] [Scilit]
- Gunathilaka, B.E.; Jeong, S.M.; Kim, K.W.; Lee, S.; Hur, S.W.; You, S.G.; Lee, S.M. Evaluation of gamma aminobutyric acid and sodium butyrate in juvenile red seabream (Pagrus major) diets containing graded levels of fish meal and soy protein concentrate. Animals 2024, 14, 1973. [Google Scholar] [CrossRef] [Scilit]
- Sahu, V.; Lu, C. Metabolism-driven chromatin dynamics: Molecular principles and technological advances. Mol. Cell 2025, 85, 262–275. [Google Scholar] [CrossRef] [Scilit]
- Lee, S.; Moniruzzaman, M.; Farris, N.; Min, T.; Bai, S.C. Interactive effect of dietary gamma-aminobutyric acid (GABA) and water temperature on growth performance, blood plasma indices, heat shock proteins and GABAergic gene expression in juvenile olive flounder Paralichthys olivaceus. Metabolites 2023, 13, 619. [Google Scholar] [CrossRef] [Scilit]
- Athapaththu, A.M.G.K.; Molagoda, I.M.N.; Jayasooriya, R.G.P.T.; Choi, Y.H.; Jeon, Y.J.; Park, J.H.; Lee, B.J.; Kim, G.Y. Gamma-aminobutyric acid (GABA) promotes growth in zebrafish larvae by inducing IGF-1 expression via GABAA and GABAB receptors. Int. J. Mol. Sci. 2021, 22, 11254. [Google Scholar] [CrossRef] [Scilit]
- Dahan, O.; Gingold, H.; Pilpel, Y. Regulatory mechanisms and networks couple the different phases of gene expression. Trends Genet. 2011, 27, 316–322. [Google Scholar] [CrossRef] [Scilit]
- Singh, J.; Michel, D.; Chitanda, J.M.; Verrall, R.E.; Badea, I. Evaluation of cellular uptake and intracellular trafficking as determining factors of gene expression for amino acid-substituted gemini surfactant-based DNA nanoparticles. J. Nanobiotechnology 2012, 10, 7. [Google Scholar] [CrossRef] [Scilit]
- Rivera, H.E.; Aichelman, H.E.; Fifer, J.E.; Kriefall, N.G.; Wuitchik, D.M.; Smith, S.J.; Davies, S.W. A framework for understanding gene expression plasticity and its influence on stress tolerance. Mol. Ecol. 2021, 30, 1381–1397. [Google Scholar] [CrossRef] [Scilit]
- Powers, M. GABA supplementation and growth hormone response. Med. Sport Sci. 2012, 59, 36–46. [Google Scholar] [CrossRef] [Scilit]
- Angilletta, M.J.; Huey, R.B.; Frazier, M.R. Thermodynamic effects on organismal performance: Is hotter better? Physiol. Biochem. Zool. 2010, 83, 197–206. [Google Scholar] [CrossRef] [Scilit]
- Maguire, J. The relationship between GABA and stress: “it’s complicated”. J. Physiol. 2018, 596, 1781. [Google Scholar] [CrossRef] [Scilit]
- Aulia, D.; Kim, H.; Jeon, H.; Hur, J.; Ogun, A.O.; Lee, S. Effects of dietary supplementation of γ-aminobutyric acid on salinity tolerance in juvenile olive flounder Paralichthys olivaceus. Korean J. Fish. Aquat. Sci. 2025, 58, 33–45. [Google Scholar]
- Gesto, M.; Hernández, J.; López-Patiño, M.A.; Soengas, J.L.; Míguez, J.M. Is gill cortisol concentration a good acute stress indicator in fish? A study in rainbow trout and zebrafish. Comp. Biochem. Physiol. Part A Mol. Integr. Physiol. 2015, 188, 65–69. [Google Scholar] [CrossRef] [Scilit]
- Tanaka, Y.; Salleh, N.A.B.M.; Tan, M.R.; Vij, S.; Wee, C.L.; Sutarlie, L.; Su, X. A gold nanoparticle-based cortisol aptasensor for non-invasive detection of fish stress. Biomolecules 2024, 14, 818. [Google Scholar] [CrossRef] [Scilit]
- Foo, J.T.W.; Lam, T.J. Serum cortisol response to handling stress and the effect of cortisol implantation on testosterone level in the tilapia, Oreochromis mossambicus. Aquaculture 1993, 115, 145–158. [Google Scholar] [CrossRef] [Scilit]
- Pankhurst, N.W. The endocrinology of stress in fish: An environmental perspective. General. Comp. Endocrinol. 2011, 170, 265–275. [Google Scholar] [CrossRef] [Scilit]
- Moltesen, M.; Laursen, D.C.; Thörnqvist, P.O.; Andersson, M.Å.; Winberg, S.; Höglund, E. Effects of acute and chronic stress on telencephalic neurochemistry and gene expression in rainbow trout (Oncorhynchus mykiss). J. Exp. Biol. 2016, 219, 3907–3914. [Google Scholar] [CrossRef] [Scilit]
- Genest, O.; Wickner, S.; Doyle, S.M. Hsp90 and Hsp70 chaperones: Collaborators in protein remodeling. J. Biol. Chem. 2019, 294, 2109–2120. [Google Scholar] [CrossRef] [Scilit]
- Wickramaratne, A.C.; Wickner, S.; Kravats, A.N. Hsp90, a team player in protein quality control and the stress response in bacteria. Microbiol. Mol. Biol. Rev. 2024, 88, e00176-22. [Google Scholar] [CrossRef] [Scilit]
- Alfonso, S.; Gesto, M.; Sadoul, B. Temperature increase and its effects on fish stress physiology in the context of global warming. J. Fish. Biol. 2021, 98, 1496–1508. [Google Scholar] [CrossRef] [Scilit]
- Ciechanover, A.; Kwon, Y.T. Protein quality control by molecular chaperones in neurodegeneration. Front. Neurosci. 2017, 11, 185. [Google Scholar] [CrossRef] [Scilit]
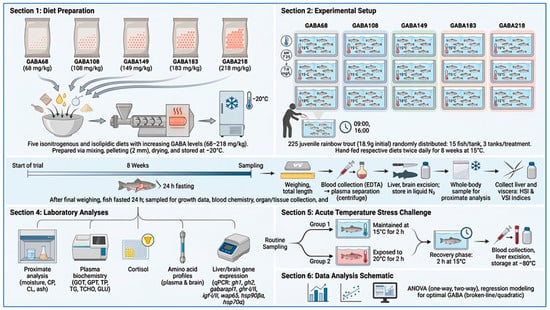
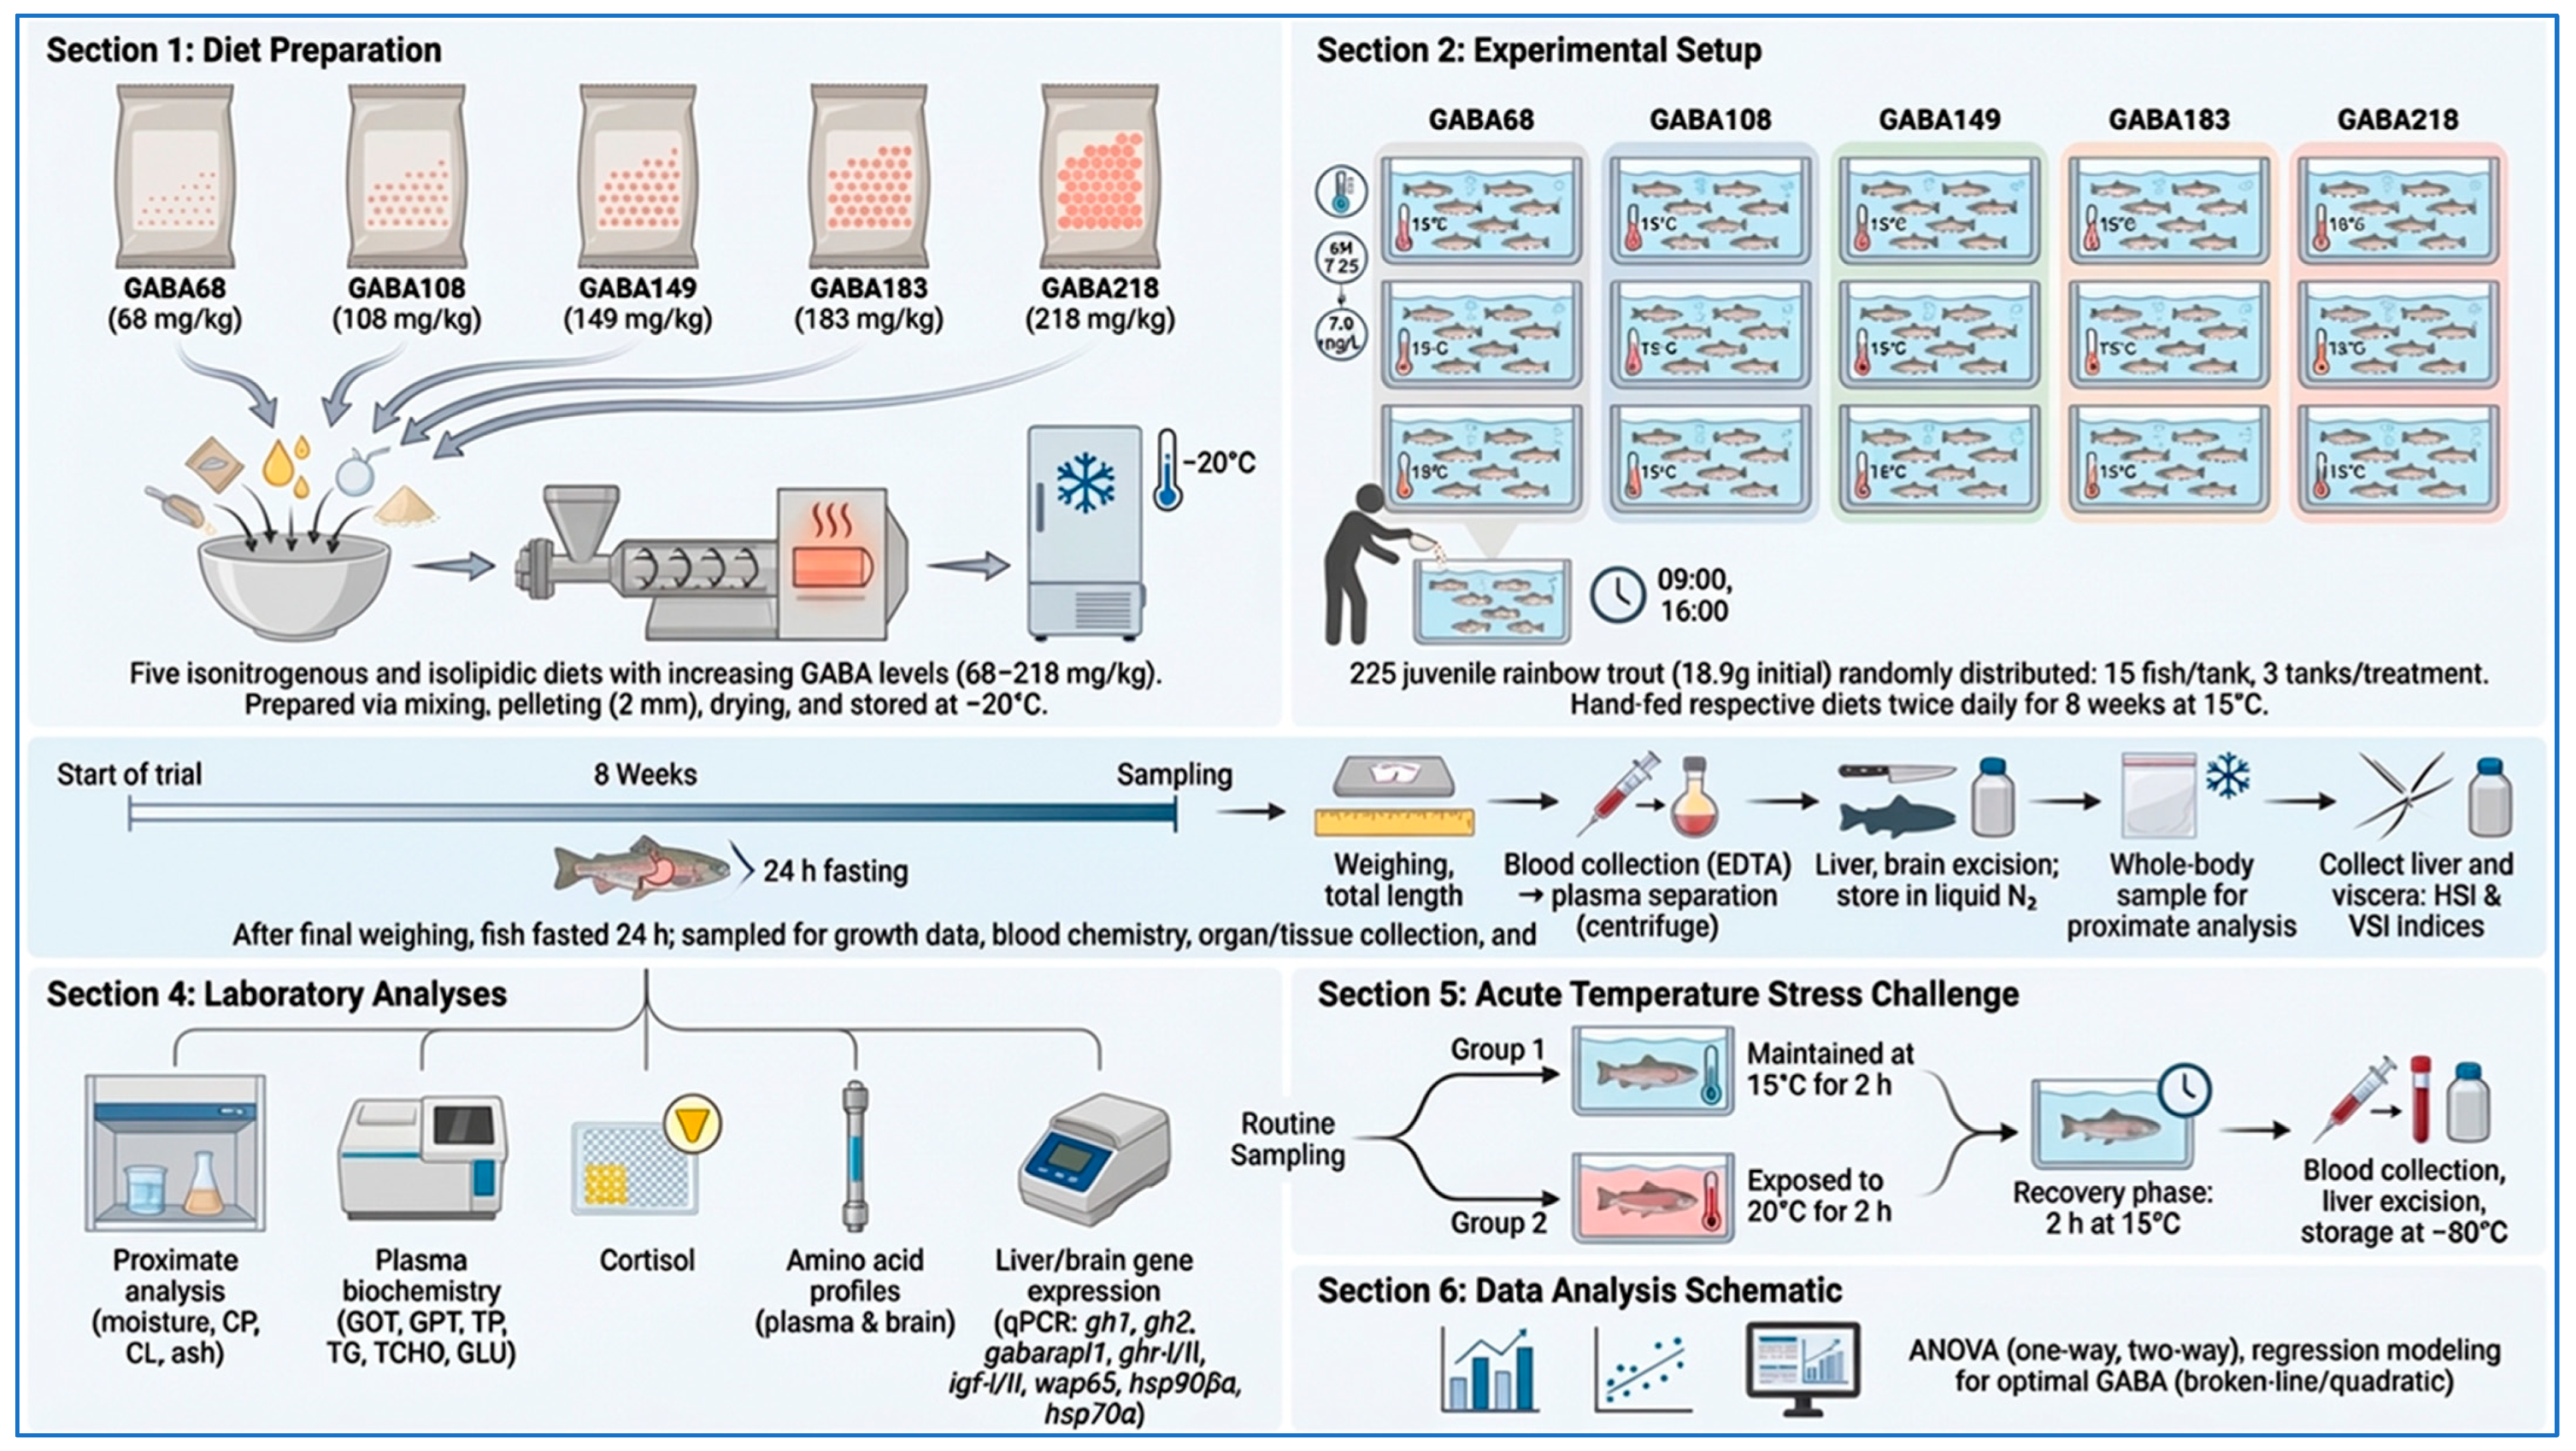
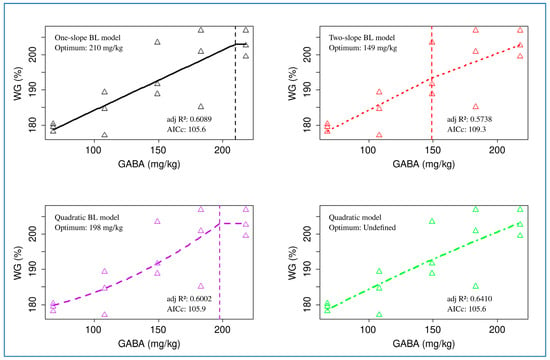
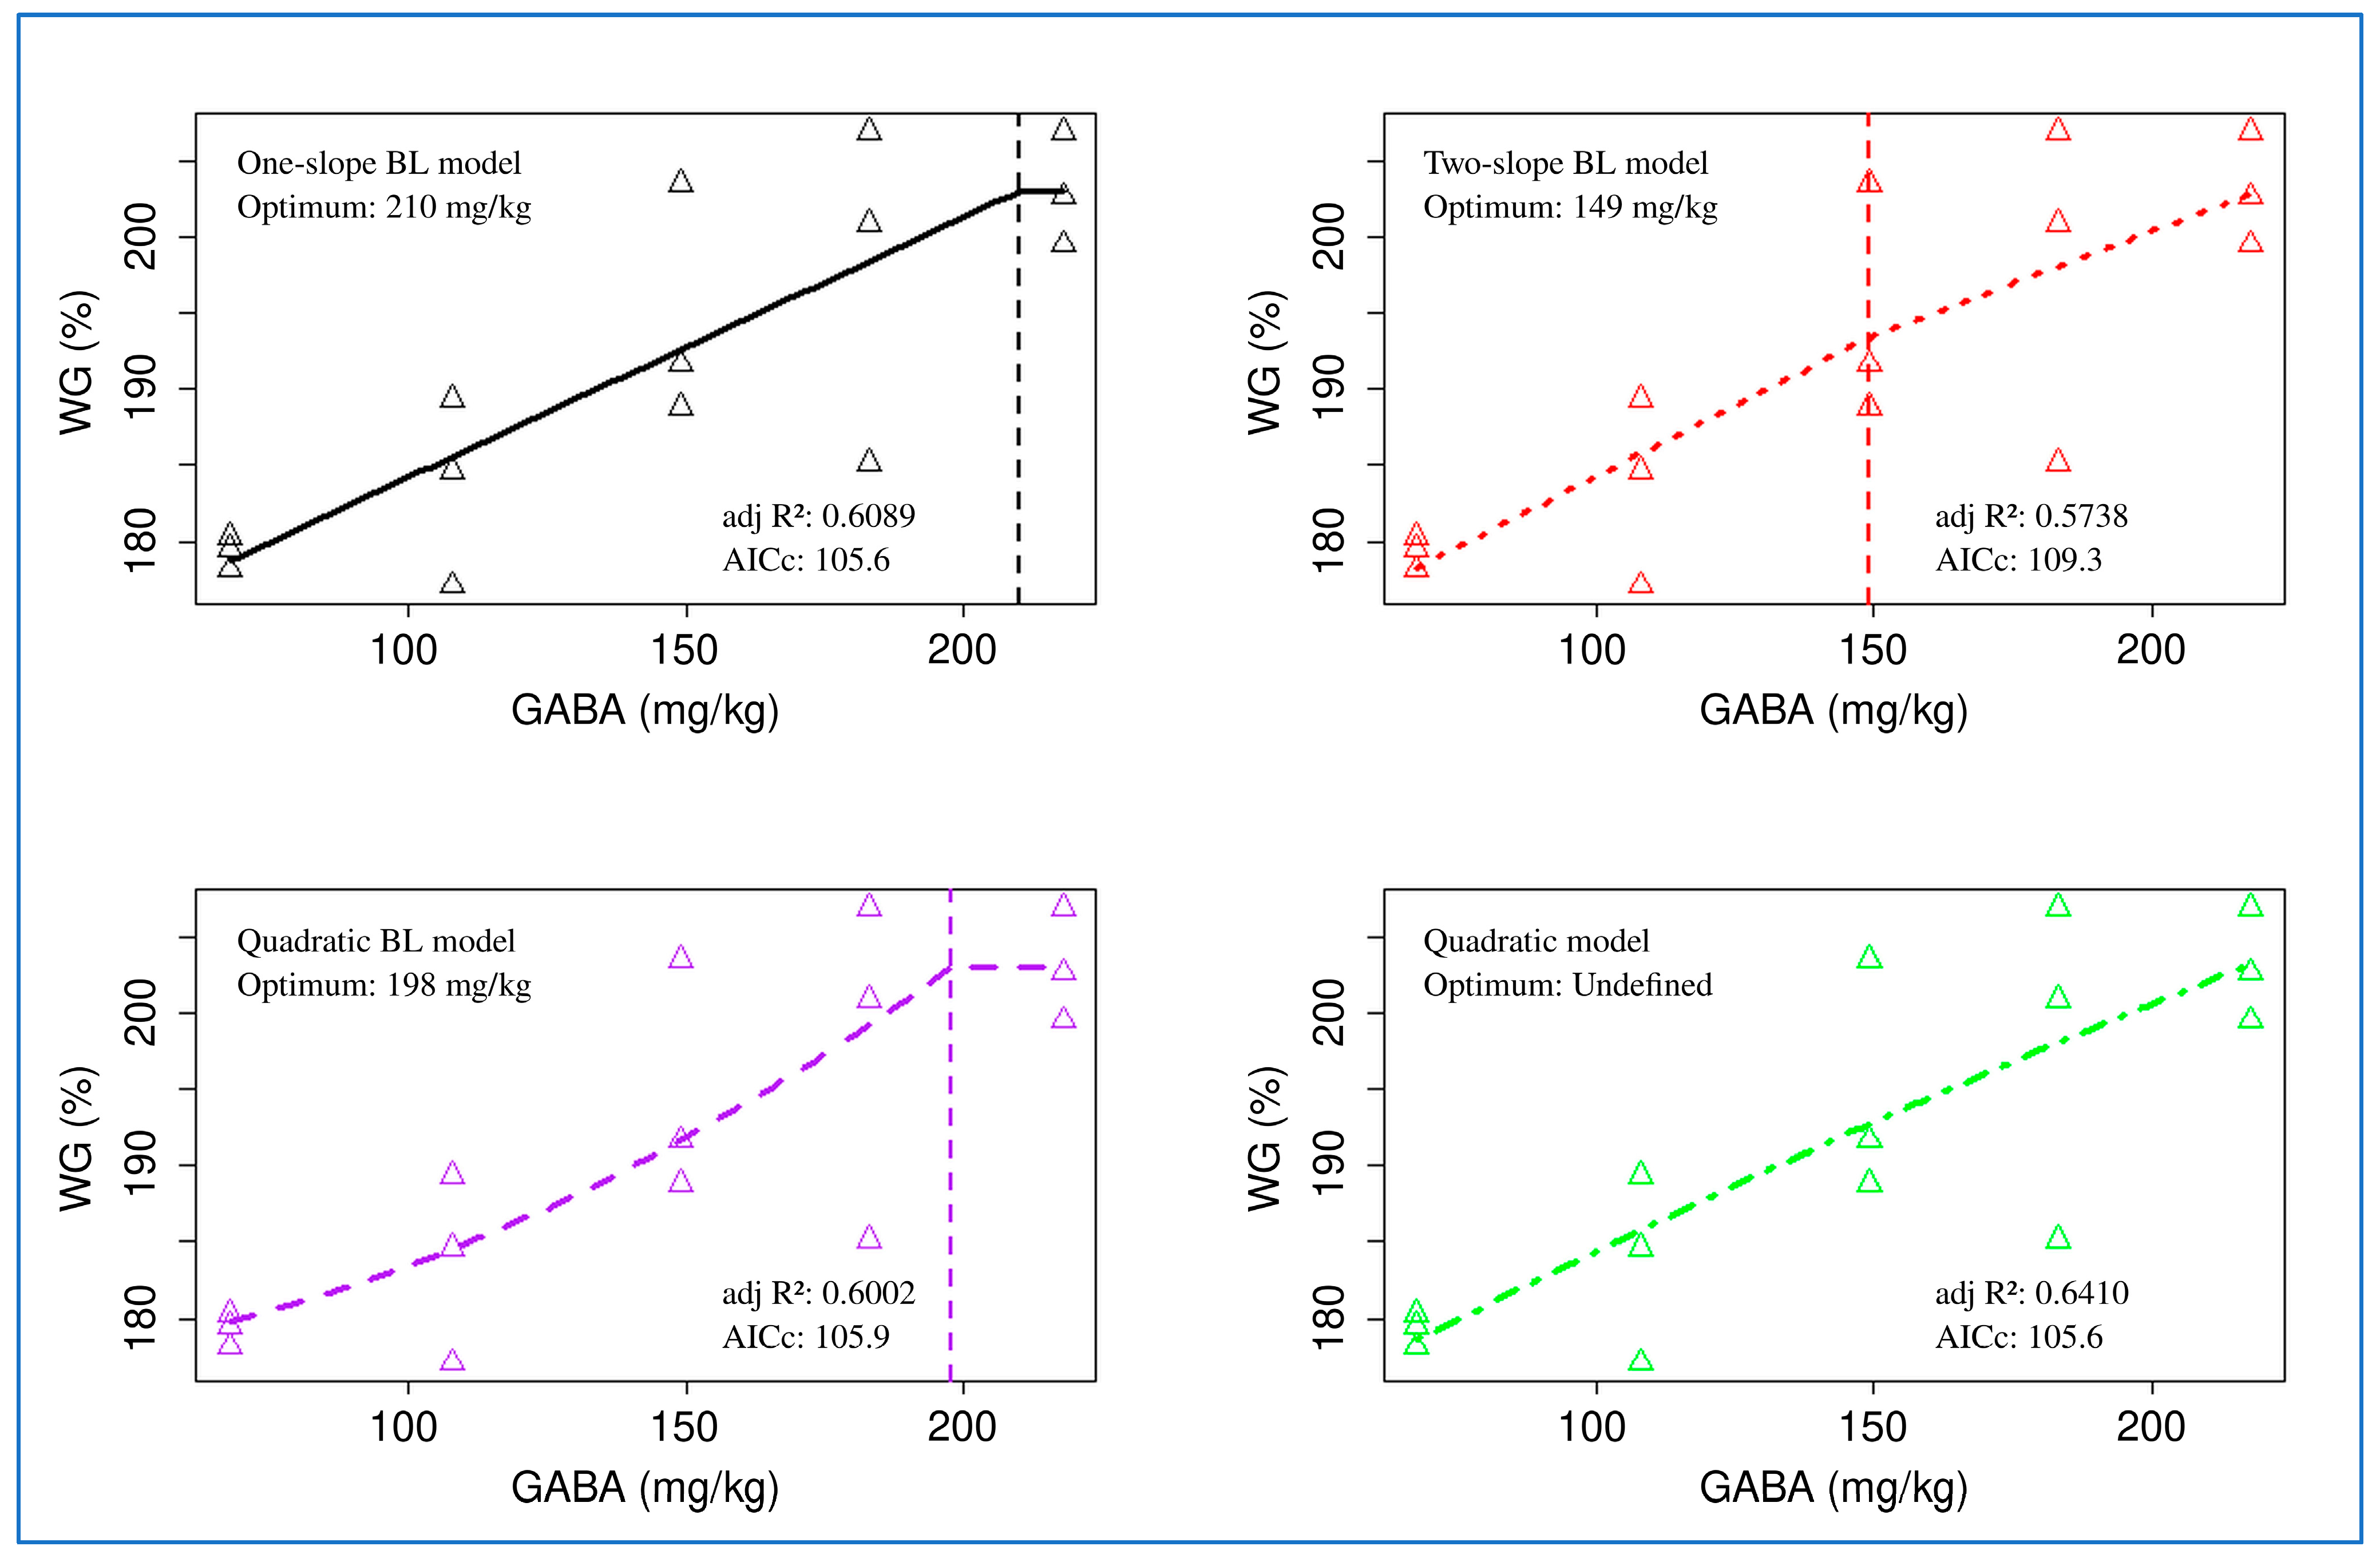
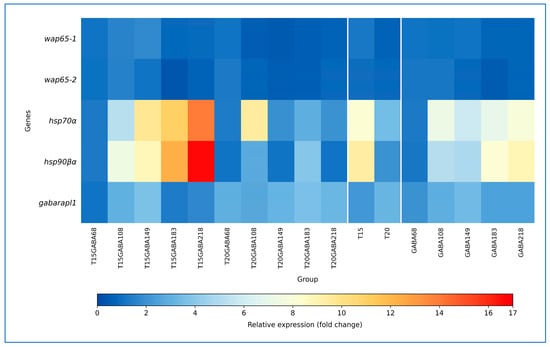
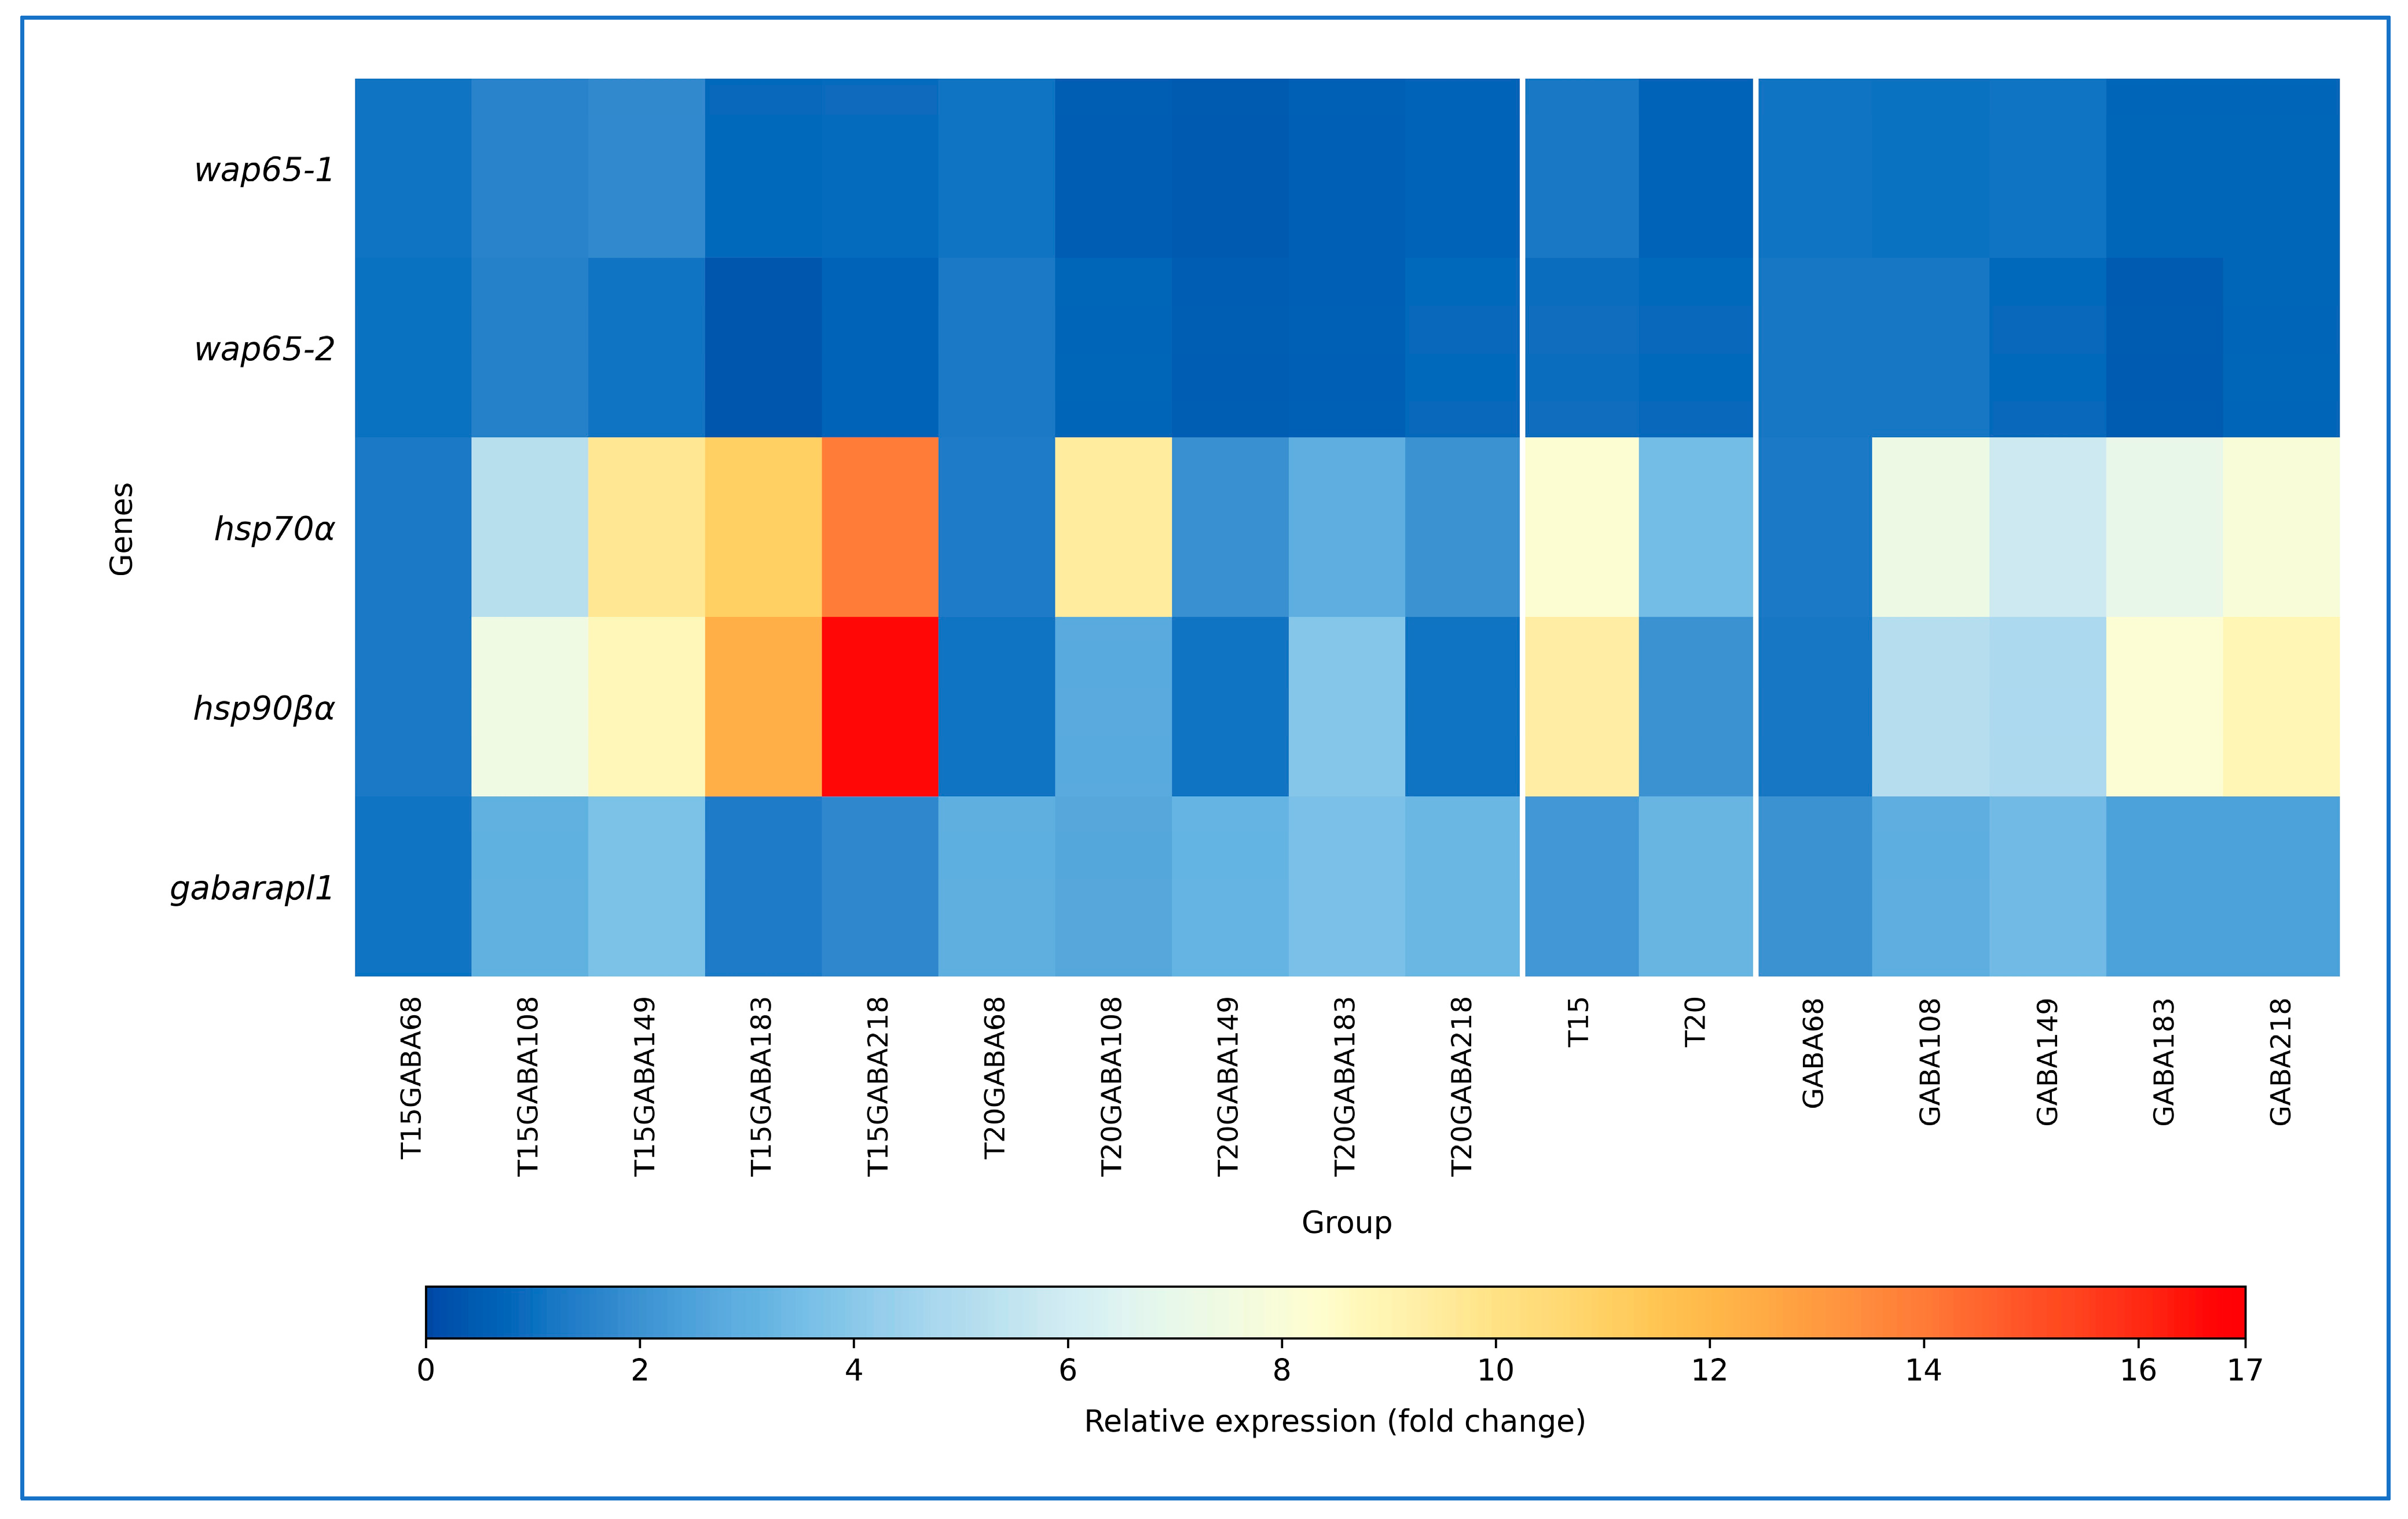

Disclaimer/Publisher’s Note: The statements, opinions and data contained in all publications are solely those of the individual author(s) and contributor(s) and not of MDPI and/or the editor(s). MDPI and/or the editor(s) disclaim responsibility for any injury to people or property resulting from any ideas, methods, instructions or products referred to in the content. |
© 2026 by the authors. Licensee MDPI, Basel, Switzerland. This article is an open access article distributed under the terms and conditions of the Creative Commons Attribution (CC BY) license.