


Simple Summary
Hanwoo breeding in South Korea has focused on bulls, leading to frozen semen preference bias and concern about reduced genetic diversity. This study aims to assess the genomic structure and genetic diversity of Hanwoo cows using a customized SNP chip. Estimated effective population size declined over past generations, and ROH-based inbreeding was higher in recent birth cohorts, whereas heterozygosity did not decline. These results provide a scientific foundation for monitoring genetic diversity, breed conservation, and more effective cow breeding systems.
Abstract
This study aimed to utilize genomic information to elucidate the genetic diversity and structure of Hanwoo cows and develop a more efficient improvement system. Genomic DNA was extracted from hair root samples of 7273 Hanwoo cows, and genotypes were determined using a customized Illumina Hanwoo SNP50k BeadChip. A total of 41,884 single-nucleotide polymorphisms (SNPs) covering approximately 2500 Mb of the genome were selected for analysis, along with 7166 Hanwoo cows that passed quality control. The mean observed and expected heterozygosity were 0.358 ± 0.125 and 0.357 ± 0.124, respectively. A total of 94,560 runs of homozygosity (ROHs) were observed, with an average of 13.2 per animal. Linkage disequilibrium (LD) was estimated using two parameters, D’ and r2, which were found to be 0.381 ± 0.309 and 0.054 ± 0.126, respectively, on autosomes. LD declined sharply from< 50 kb to 50–100 kb. In addition, 1818 haplotype blocks were identified on autosomes, totaling 88.27 Mb (3.53% of the autosomal length). The most common haplotype block size was two SNPs, with 1101 blocks. Finally, the effective population size (Ne) was 2853 at 1691 generations but decreased to 277 at 13 generations. These results provide genomic information for further studies and will be helpful for Hanwoo breeding programs.
1. Introduction
Hanwoo cattle, the native cattle of Korea, include four varieties: brown Hanwoo, brindle Hanwoo, black Hanwoo, and Jeju black. Currently, brown Hanwoo is the most widely raised variety, accounting for approximately 3.1 million heads [1]. Since the 1960s, Hanwoo has played an essential role as a valuable resource for meat production alongside Korean economic growth. Hanwoo breeding programs aim to enhance quality traits, such as marbling and flavor, as well as quantity traits, such as meat yield, to improve Hanwoo meat quality [2]. These breeding programs use performance and progeny testing to select proven bulls, which are assigned Korean Proven Bull Numbers (KPNs) [3]. Semen from these proven bulls is distributed to breeding farms for artificial insemination (AI) of cows. Recently, KPNs have become widely used on commercial farms, raising concerns about preserving Hanwoo genetic diversity. Therefore, greater attention to the genetic contribution of Hanwoo cows may be important for maintaining genetic diversity in the breed.
With the development of high-density genomic maps and the availability of large-scale SNP datasets in cattle [4], numerous studies have investigated population structure and genetic diversity using genomic information, including linkage disequilibrium (LD) and SNP marker data [5,6]. Genetic markers, especially single-nucleotide polymorphisms (SNPs), have been widely employed in cattle genomic studies for diverse applications, including marker-assisted selection [7], quantitative trait loci (QTL) mapping [8], genome-wide association studies (GWAS) [9], genomic selection (GS) [10], and assessment of the accuracy of genomic estimated breeding values (GEBV) [11]. The application of SNP markers has also been extended to other livestock species, including horses [12], pigs [13], and sheep [14]. In particular, a Hanwoo-specific customized SNP chip, the Illumina Hanwoo SNP50k BeadChip (Illumina Inc., San Diego, CA, USA), has been developed for Hanwoo, and this platform has been utilized in genomic prediction and GWASs of economically important traits [15,16]. Despite these advances, genomic characterization of genetic diversity and population structure in Hanwoo cows remains warranted.
Runs of homozygosity (ROHs) are long continuous stretches of homozygous genomic segments that can arise from the inheritance of identical-by-descent (IBD) segments from common ancestors [17]. Long ROHs suggest recent inbreeding within the population, whereas shorter segments indicate more distant relationships with common ancestors [18]. ROH analysis is a useful approach for investigating genomic patterns of homozygosity and population history in cattle and other livestock species [19]. Several studies have used genomic data to estimate ROHs and elucidate the population structure of Hanwoo [3,20].
LD represents the non-random associations of alleles at two loci within a population and can be influenced by factors such as physical distance, allele frequency, genetic drift, and selection [21]. The extent of LD can provide information on historical recombination patterns and Ne, which can contribute to the evaluation of population structure and genetic diversity. Moreover, LD plays a crucial role in determining the accuracy of genomic selection [22].
Haplotype blocks are regions within a chromosome that exhibit low recombination rates and high levels of LD [23,24]. Haplotype blocks are influenced by factors such as recombination, mutation, selection, and population bottlenecks [25]. Haplotype block structure can affect genomic prediction accuracy [26] and contribute to the interpretation of GWAS results [27]. Therefore, understanding the haplotype block structure can provide useful information for interpreting genomic association studies in Hanwoo [23].
Characterizing the genetic diversity and genomic structure of Hanwoo cows is important for developing sustainable breeding strategies and maintaining genetic diversity in the breed. However, genomic studies focusing on Hanwoo cows remain limited. Therefore, this study utilized genomic data from Hanwoo cows to estimate ROHs and analyze LD, haplotype block structure, and Ne. These analyses provide insights into the genetic diversity and population structure of Hanwoo cows and may contribute to the development of appropriate breeding and conservation strategies.
2. Materials and Methods
2.1. Animal Sampling and Quality Control
A total of 7273 Hanwoo cows were sampled, with cows from 7 regions in Gyeongbuk province selected. All cows were the progeny of 401 sires (18.1 progeny per sire) and 5526 dams (1.3 progeny per dam). Outsourcing facilities obtained consent from each Hanwoo cow farm, collected hair roots, extracted genomic DNA, and genotyped it using the Illumina Hanwoo SNP50k BeadChip (Illumina Inc., San Diego, CA, USA), which contained 53,866 SNPs. The results were provided in PLINK format (ped and map files). Quality control was performed using PLINK v1.9 (Harvard University, Boston, MA, USA) [28]. Only autosomal markers were retained. Samples with a call rate < 0.90 (‘--mind 0.1′) and duplicate samples, defined as pairs with a genomic relationship ≥ 0.9 and a genotype concordance ≥ 0.99 (one cow per pair), were removed. Markers with a call rate < 0.90 (‘--geno 0.1′) and one marker of each pair at an identical position were removed. Parental IDs were then set to zero (‘--make-founders’) so that all 7166 cows were used for all calculations, and markers with minor allele frequency (MAF) < 0.05 (‘--maf 0.05′) were removed.
2.2. Genetic Diversity
Genetic diversity was analyzed by calculating observed heterozygosity (HO), expected heterozygosity (HE), the inbreeding coefficient (F), and MAF. HO, HE, and F values were obtained for each autosome using the ‘--hardy’ option and F was calculated for each SNP as 1 − HO/HE. MAF was estimated using the ‘--freq’ option in PLINK v1.9. To show the effect of the MAF filter, MAF was grouped into six categories before filtering: (1) 0–0.05, (2) 0.05–0.1, (3) 0.1–0.2, (4) 0.2–0.3, (5) 0.3–0.4, and (6) 0.4–0.5. HO, HE, and the mean MAF refer to the final dataset (MAF ≥ 0.05). Genomic relationships among cows were estimated as the variance-standardized genomic relationship matrix (G) with PLINK v1.9 (‘--make-rel square’) from the 41,884 SNPs; the mean of the off-diagonal elements and the proportion of cow pairs with G ≥ 0.25, which corresponds approximately to a half-sib or closer relationship, were determined. To examine temporal trends, HO and sample size corrected HE (HE × 2n/(2n − 1), where n is the number of cows in a cohort) were calculated for the 7088 cows with a known birth date, grouped into 11 birth cohorts (≤2011 to 2021; 198–1238 cows per cohort).
2.3. ROHs
ROHs were estimated individually for each Hanwoo cow using PLINK v1.9 with the ‘--homozyg’ option. Because the mean marker interval in this panel was 59.7 kb, the default minimum of 100 SNPs would have restricted detection to segments longer than approximately 6 Mb. Therefore, the following thresholds adapted to the marker density were applied [29]: (1) minimum number of consecutive SNPs in ROHs of 30; (2) minimum ROH length of 1 Mb; (3) density of 1 SNP per 200 kb; (4) maximum gap between consecutive homozygous SNPs of 1000 kb; (5) sliding window of 30 SNPs across the genome; (6) maximum of 1 heterozygous locus per window; (7) proportion of homozygous overlapping windows of 0.05. The detected ROHs were categorized into five groups: 1–4, 4–10, 10–20, 20–30, and >30 Mb. For each individual, the total number of ROHs, the mean number of ROHs per cow, and the average length of ROHs were determined. Genomic inbreeding (F_ROH) was computed as the total ROH length divided by the autosomal genome length (2500.1 Mb). The percentage of each chromosome covered by ROHs was obtained as the total ROH length on that chromosome divided by the product of the number of cows and the chromosome length. F_ROH (ROH ≥ 1 Mb and ≥ 4 Mb) was also derived for each birth cohort.
2.4. LD
LD estimates the non-random association between two loci. D’ and r2 are the most commonly used parameters for calculating LD [30]. For each chromosome, D’ and r2 were estimated for all SNP pairs within 1000 kb (‘--r2 dprime --ld-window 99999 --ld-window-kb 1000 --ld-window-r2 0′). D’ was calculated using the following equation [31]:
and
where freq(A), freq(a), freq(B) and freq(b) are the allele frequencies of SNPs and freq(AB), freq(ab), freq(Ab) and freq(aB) are the four haplotypes in Hanwoo cow.
r2 between syntenic SNP markers was calculated using the following equation [32]:
2.5. Haplotype Block Structure
Haplotype blocks were estimated for each chromosome with PLINK v1.9 using the ‘--blocks no-pheno-req’ option, following the method described in [23]. The maximum distance between marker pairs was 500 kb (‘--blocks-max-kb 500′). Results were visualized using Haploview v4.2 (Broad Institute, Cambridge, MA, USA) [33], displaying pairwise r2 values.
2.6. Ne
Ne was estimated from the relationship between LD and the recombination rate (c) between SNPs [34] using R v4.5.3 [35]. In this study, we calculated Ne using the following equation:
where NT is the Ne t generations ago, t is calculated as [36], ct is the recombination rate, is the LD value (r2) adjusted for the sample size and is calculated as (n is the sample size and β = 1 because genotypes were unphased), and α is a correction for the occurrence of mutations [37] and was set to 1. The recombination rate (c) was derived from the physical distance between SNPs, which was converted into the linkage distance d (in Morgans) assuming 1 Mb = 1 cM, and c was calculated as [38]. Only SNPs with MAF ≥ 0.05 on autosomes were used. For this analysis, r2 was calculated for all SNP pairs within 4000 kb on each autosome using PLINK v1.9 (‘--r2 --ld-window 99999 --ld-window-kb 4000 --ld-window-r2 0′), which yielded 2,918,857 SNP pairs. The pairs were grouped into 80 distance bins of 50 kb (each bin containing at least 34,489 pairs), and Ne was calculated for each bin from the mean r2 and the mean distance of the bin.
3. Results
3.1. Data Description
In the present study, the numbers of cows and SNPs removed at each quality control step are shown in Table 1. Of the 7273 sampled cows, 7166 (98.5%) and, of the 52,195 autosomal SNPs, 41,884 (80.2%) were retained. These markers spanned 2500.10 Mb of the genome. The fewest SNPs on a chromosome were 730 on chromosome 28, and the most were 2626 on chromosome 1. The longest chromosome was chromosome 1 (158.09 Mb), and the shortest was chromosome 25 (42.65 Mb). The average marker interval was 0.0597 ± 0.0629 Mb.
Table 1.
Quality control of Hanwoo cows and SNPs.
3.2. Estimation of Genetic Diversity
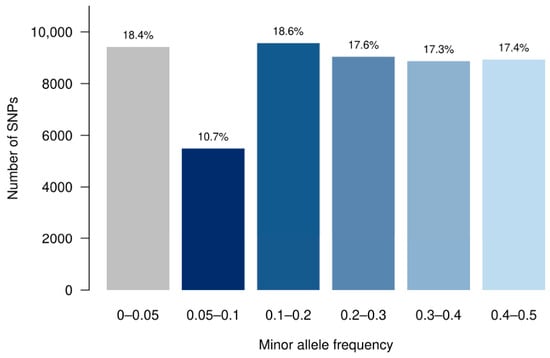
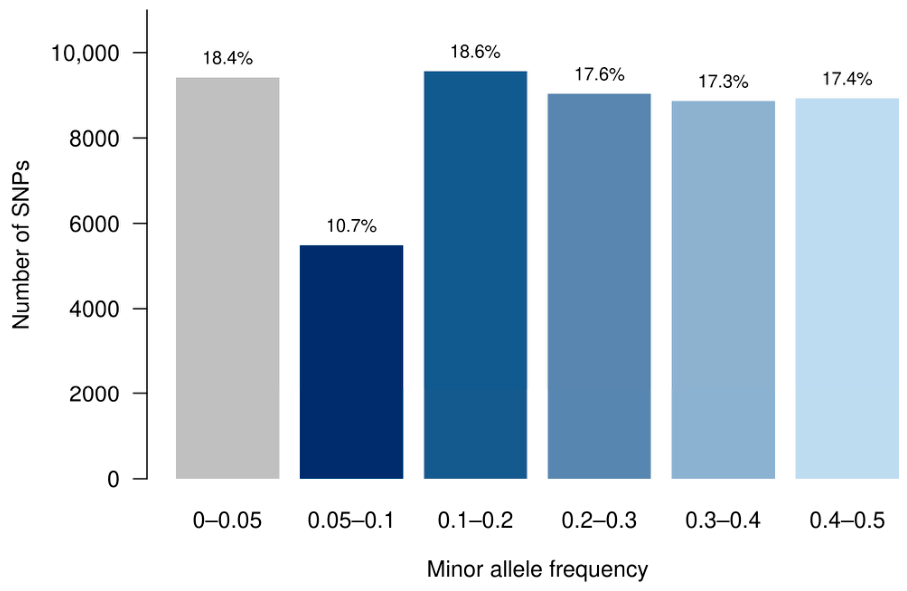
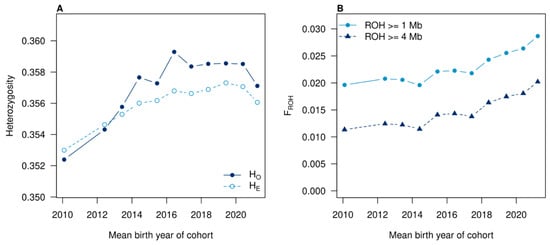
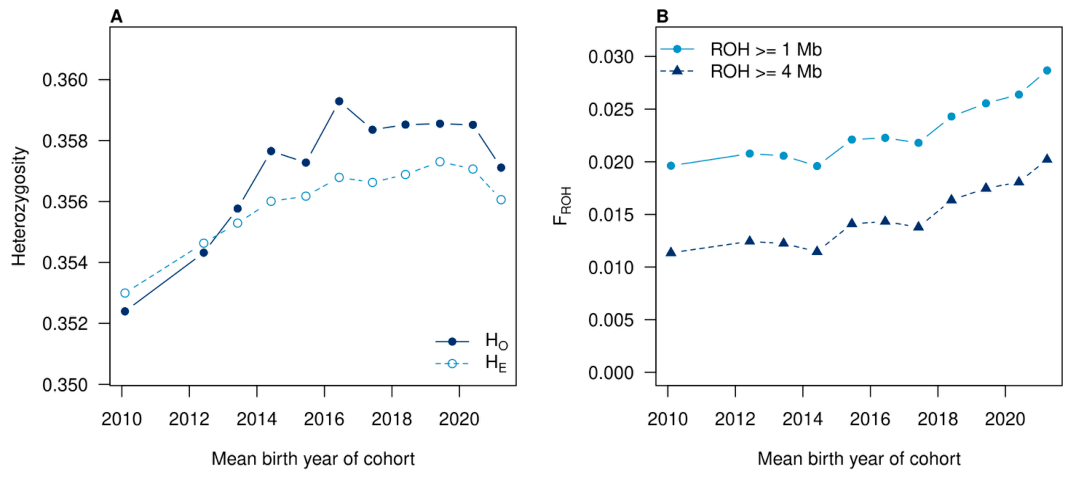
The number of SNPs, heterozygosity, and MAF per chromosome are summarized in Table 2. The average number of SNPs was 1444, with HO and HE averaging 0.358 ± 0.125 and 0.357 ± 0.124, respectively. HO and HE were nearly identical, differing by 0.001. The inbreeding coefficient (F) was −0.002 ± 0.034. Before MAF filtering, 18.4% of the SNPs (9418 of 51,302) had an MAF < 0.05 (Figure 1); these SNPs were removed. The mean MAF of the final dataset was 0.268 ± 0.132. The highest average MAF was observed on chromosome 25 at 0.280 ± 0.136, while the lowest was on chromosome 14 at 0.252 ± 0.126. The genomic relationship among the 7166 cows was low on average (mean off-diagonal G = −0.00014), and only 0.29% of the cow pairs had G ≥ 0.25 (approximately half-sib level or closer). Among the 7088 cows with a known birth date, grouped into 11 birth cohorts, HO ranged from 0.352 to 0.359 and sample-size-corrected HE from 0.353 to 0.357. Heterozygosity did not decline over time. HO was 0.352 in the oldest cohort (≤2011) and 0.357 in the 2021 cohort, and HE was 0.353 and 0.356 (Table 3).
Table 2.
Summary of observed heterozygosity (HO), expected heterozygosity (HE), and minor allele frequency (MAF) by chromosome.
Figure 1.
Distribution of MAFs of 51,302 autosomal SNPs in 7166 Hanwoo cows before MAF filtering. Percentages indicate the proportion of SNPs in each MAF class.
Table 3.
Heterozygosity and ROH-based inbreeding by birth cohort.
3.3. Detection of ROHs
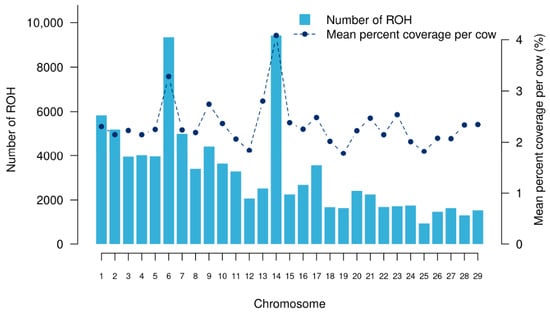
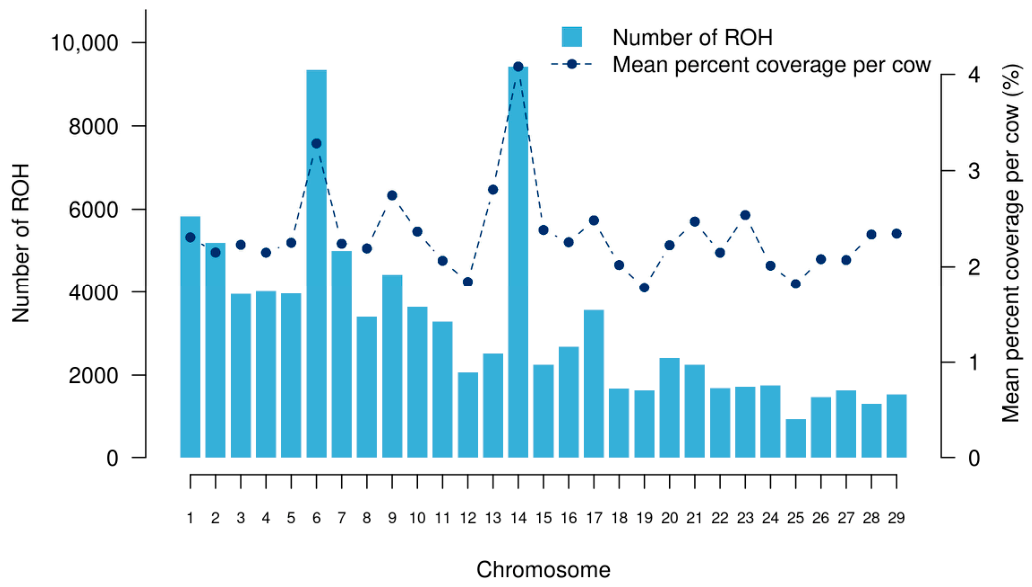
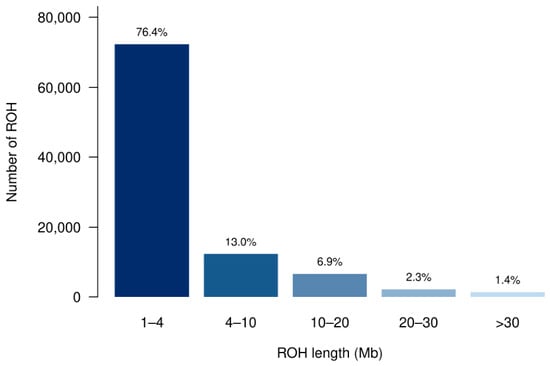
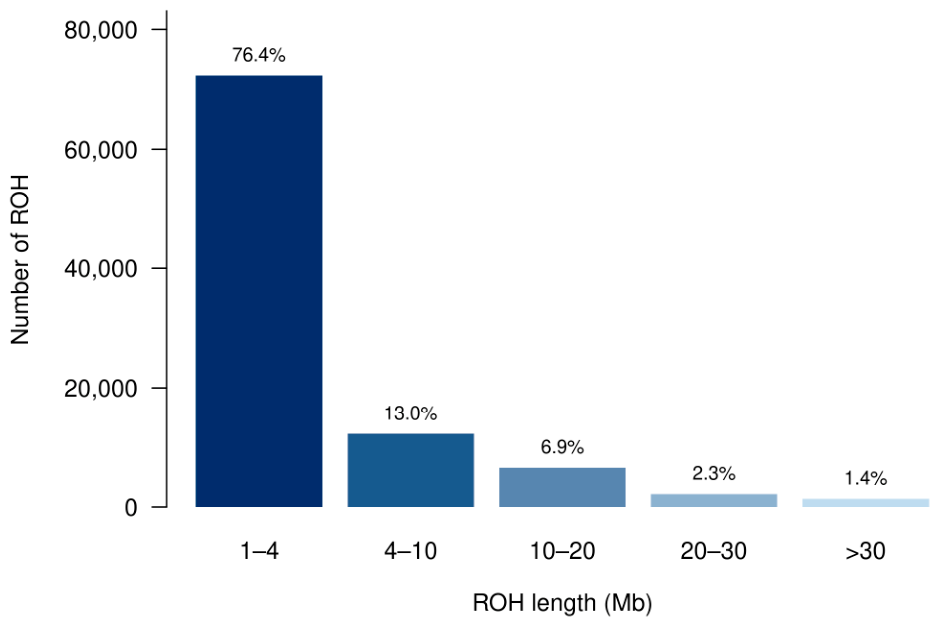
A total of 94,560 ROHs were detected, averaging 13.2 ROHs per cow; all 7166 cows carried at least one ROH. The mean ROH length was 4.47 ± 6.51 Mb, and the mean F_ROH was 0.024. ROHs were detected on all autosomes (Figure 2). The most ROHs were detected on chromosome 14 (9424), followed by chromosome 6 (9347), and the fewest on chromosome 25 (940). Percent coverage was highest on chromosome 14 (4.08%), followed by chromosome 6 (3.28%). ROH lengths were classified into five categories (1–4, 4–10, 10–20, 20–30, and >30 Mb; Figure 3). Most ROHs measured 1–4 Mb (72,265 ROHs, 76.4%; carried by all 7166 cows), and the number of ROHs larger than 4 Mb decreased. Very few ROHs (1357, 1.4%; 1030 cows) measured over 30 Mb. F_ROH for ROH ≥ 1 Mb increased across birth cohorts from 0.0196 (≤2011) to 0.0287 (2021), and F_ROH for ROH ≥ 4 Mb from 0.0114 to 0.0202 with the largest values in the 2018–2021 cohorts (Table 3, Figure 4).
Figure 2.
Number of ROHs per chromosome and percent coverage in Hanwoo cows.
Figure 3.
Frequency and proportion of detected ROHs by length.
Figure 4.
Changes in heterozygosity and F_ROH by birth cohort in Hanwoo cows. (A) HO and HE; the y-axis is truncated. (B) F_ROH calculated from ROH ≥ 1 Mb and ≥4 Mb. Points are plotted at the mean birth year of each cohort.
3.4. Estimation of LD
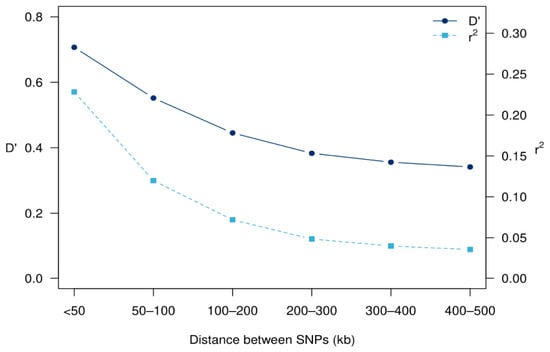
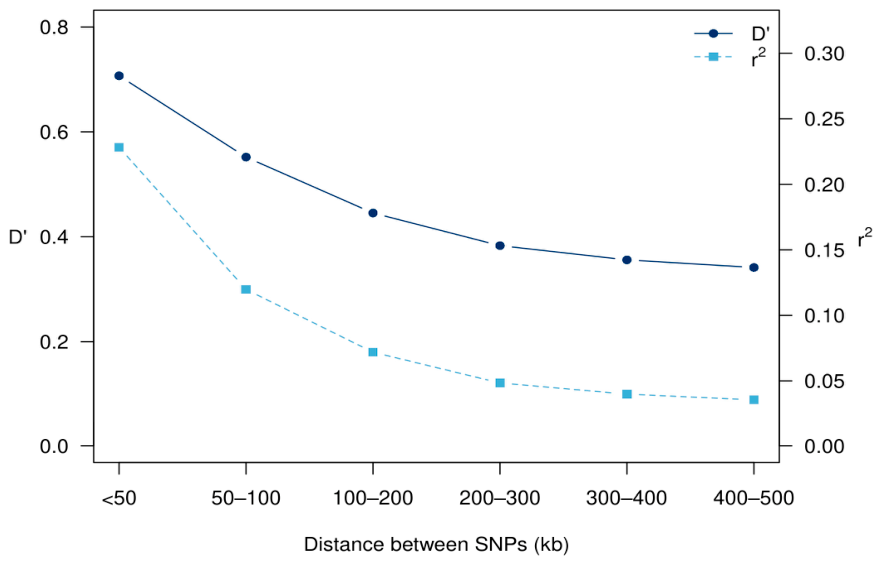
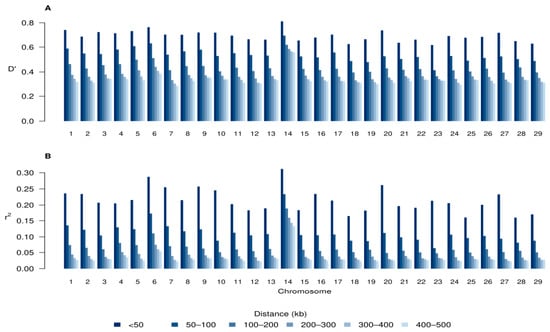
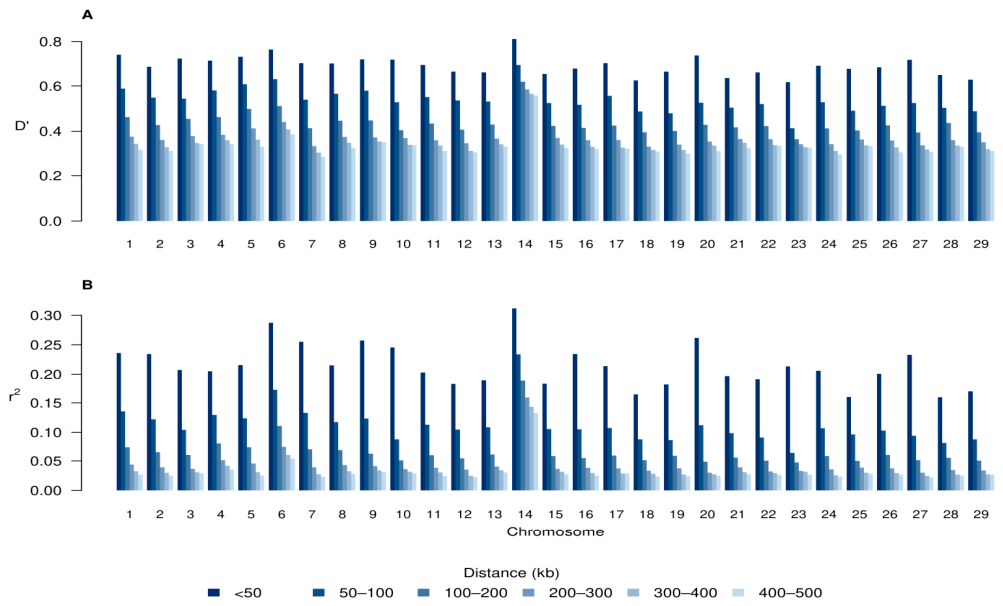
Table 4 summarizes the number of SNP pairs by autosome within 0–1000 kb and the average D’ and r2 for each chromosome. The total number of SNP pairs was estimated to be 777,565, with a maximum of 68,475 on chromosome 6. The average D’ and r2 values were 0.3807 ± 0.3093 and 0.0538 ± 0.1260, respectively. The highest values of D’ (0.5759 ± 0.3593) and r2 (0.1510 ± 0.2414) were observed on chromosome 14. Additionally, the lowest value of D’ (0.3270 ± 0.2803) was on chromosome 7, and the lowest value of r2 (0.0364 ± 0.0869) was on chromosome 12 (Table 4). LD decay of the two parameters over six distance intervals (<50, 50–100, 100–200, 200–300, 300–400, and 400–500 kb) is shown in Figure 5. The value of D’ decreased from 0.707 at a distance of <50 kb to 0.552 at 50–100 kb and finally to 0.341 at 400–500 kb. Similarly, the value of r2 decreased from 0.228 at a distance of <50 kb to 0.120 at 50–100 kb and eventually to 0.036 at 400–500 kb (Figure 5). Figure 6 shows the average D’ and r2 of each chromosome in these intervals. Both parameters decreased with increasing distance on every chromosome, and chromosome 14 remained the highest across the intervals. In the <50 kb interval, the average r2 exceeded 0.2 on 19 of the 29 chromosomes, with the highest value of 0.312 on chromosome 14 (Figure 6B).
Table 4.
Mean and standard deviation of D’ and r2 by the number of SNP pairs for each chromosome.
Figure 5.
Decay of LD with physical distance between SNPs on autosomes. Mean D’ (left axis) and r2 (right axis) are shown for six distance intervals.
Figure 6.
Average LD of each chromosome across distance intervals in Hanwoo cows. (A) D’ and (B) r2. Bars within each chromosome represent the six distance intervals, from the shortest (darkest) to the longest (lightest).
3.5. Characteristics of Haplotype Block Structure
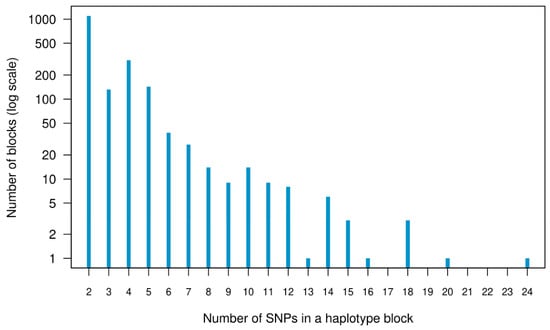
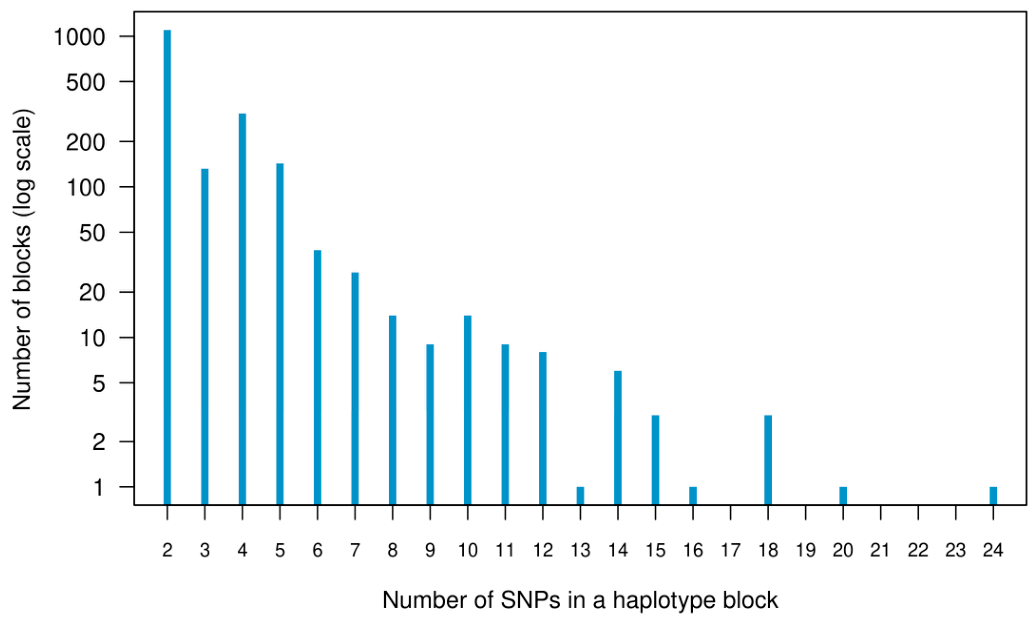
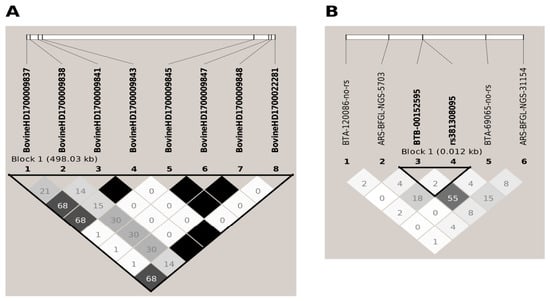
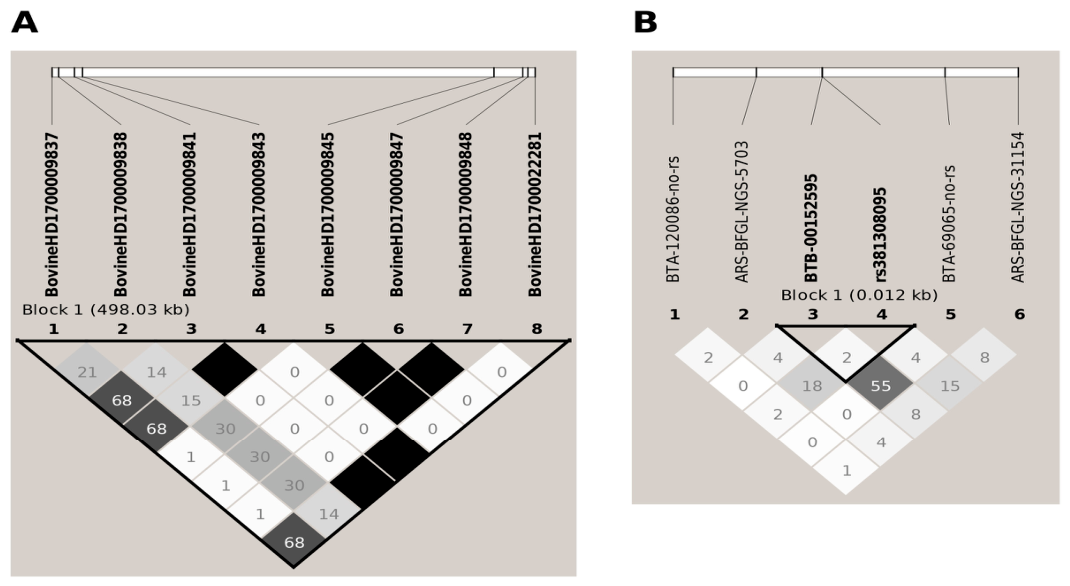
The distribution of genome-wide haplotype block structures is presented in Table 5. A total of 1818 haplotype blocks covering 88.27 Mb (3.53% of the autosomal genome) were detected. The average length of the haplotype blocks was 48.55 ± 75.32 kb. The largest number of haplotype blocks was 245, with a total block length of 13,176.41 kb (0.53% of the autosomal genome) on chromosome 6. These blocks had an average size of 53.78 ± 80.61 kb and were composed of 844 SNPs. The largest average block size was 70.997 ± 76.01 kb on chromosome 8. The average number of SNPs forming haplotype blocks was 3.16 ± 2.11, with a maximum of 24 SNPs on chromosome 5 and a minimum of 2. The number of SNPs located in blocks ranged from 32 on chromosome 28 to 844 on chromosome 6. There were 1101 haplotype blocks with 2 SNPs (60.6%) and 307 haplotype blocks with 4 SNPs (Figure 7). The longest haplotype block was 498.03 kb on chromosome 17 and included eight SNP markers, while the shortest was 0.012 kb on chromosome 3 and included two SNP markers (Figure 8).
Table 5.
Summary statistics for the haplotype block structure of each chromosome.
Figure 7.
Number of SNPs per haplotype block in Hanwoo cows.
Figure 8.
Haploview LD (r2) plot. (A) The longest haplotype block (~498 kb) on chromosome 17. (B) The shortest haplotype block (~0.012 kb) on chromosome 3. Shading indicates pairwise r2 between SNPs (white, r2 = 0; grey, 0 < r2 < 1; black, r2 = 1), and numbers in the diamonds are r2 × 100. Haplotype blocks are outlined by black triangles.
3.6. Past Ne
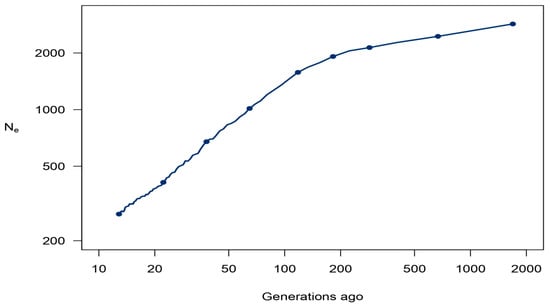
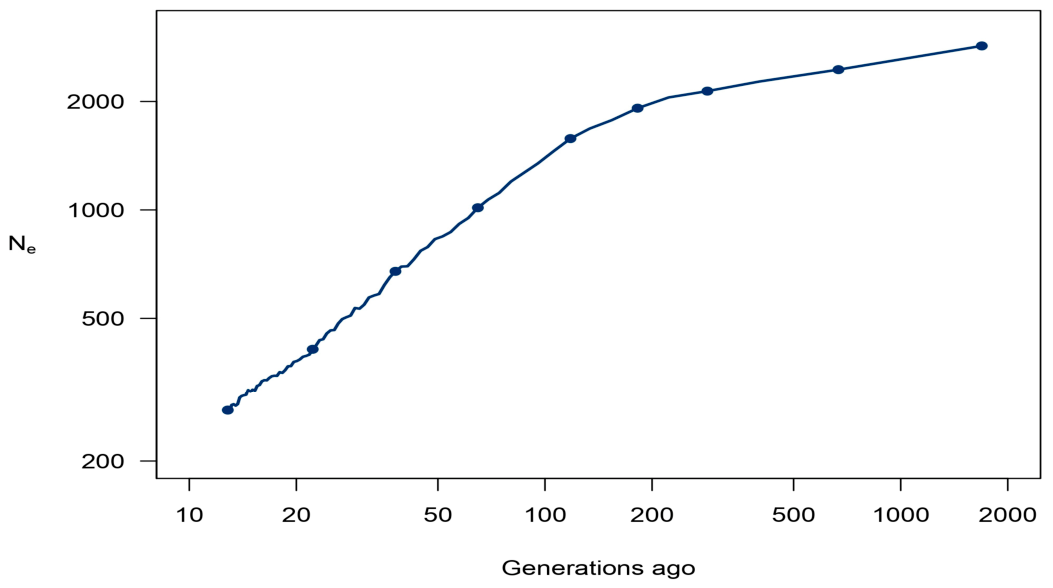
To assess the magnitude of size change in the cow population from the past to the present, past Ne was estimated using the extent of LD (r2). Ne decreased from 2853 (1691 generations ago) to 277 (13 generations ago), a decrease of about 10-fold (Figure 9). The decline was gradual until approximately 180 generations ago (Ne = 1916 at 182 generations ago) and became steeper thereafter (1346 at 95, 830 at 49, and 381 at 20 generations ago).
Figure 9.
Estimated Ne over past generations using LD (r2). Both axes are on a log scale.
4. Discussion
To our knowledge, this study represents the first to estimate the genetic diversity, ROHs, LD, haplotype blocks, and Ne in a large population of Hanwoo cows using a customized Hanwoo SNP50k BeadChip. Some studies have previously examined LD [39], ROHs [3], haplotype block structure [40], and Ne [41] in cattle using Hanwoo genomic data. In particular, the study by [42] was the first to estimate LD and Ne in Hanwoo using low-density SNP arrays. As SNP arrays continue to advance, studies using these arrays are increasingly common [20,43]. In South Korea, the Hanwoo SNP50k BeadChip was developed and is used in Hanwoo breeding programs. Moreover, many studies have been conducted in various cattle breeds using diverse SNP arrays [44,45,46,47].
The genetic parameters (HO, HE, F, and MAF) were used to evaluate the level of genetic variation within the Hanwoo cow population. An HO value of 0.37 ± 0.12 was reported using the Bovine SNP50k BeadChip [40], close to the value obtained in this study (difference of about 0.01), although the two chips differ. Another cattle breed study estimated the inbreeding coefficient of Hanwoo cattle from SNP markers as −0.04 [48]; our estimate (−0.002) is closer to zero, but a direct comparison is difficult because of the large difference in sample size (18 vs. 7166). The MAF values above 0.05 were distributed fairly evenly, as in [40]. The F value close to zero indicates that observed and expected heterozygosity were almost identical, that is, no overall excess or deficit of heterozygotes.
Genomic relationships among the cows were low on average, but a small fraction of pairs (0.29% with G ≥ 0.25) were closely related. HO did not decline across birth cohorts, whereas F_ROH increased from 0.0196 to 0.0287, which suggests a modest rise in ROH-based inbreeding whose cause cannot be determined from these data. These cohort comparisons are descriptive because the cohorts differed in size, the older cohorts include only cows alive at sampling, and all cows came from one province.
ROHs occur in all breeds but vary in length and frequency by breed. In Hanwoo cattle, short ROH segments were common across three distinct breeds [20], consistent with the findings of the current study. Similar patterns were reported across various cattle breeds examined for ROHs utilizing SNP chips [49,50,51]. Both inbreeding and selection pressures influence the presence of ROHs. Long ROHs suggest recent inbreeding, whereas short ROHs reflect more distant common ancestors [18,52]. In this study, 76.4% of ROHs were 1–4 Mb and 23.6% were ≥4 Mb (22,295 ROHs), which suggests that most ROHs trace back to distant common ancestors rather than to recent common ancestors; nevertheless, ROHs ≥ 4 Mb were found in most cows (5377 of 7166 cows carried ROHs of 4–10 Mb) and F_ROH for ROH ≥ 4 Mb increased in recent birth cohorts (Table 3). Chromosomes 6 and 14 had the most ROHs (9347 and 9424) and the highest coverage (3.28% and 4.08%). QTLs for growth and carcass traits have been reported on these chromosomes in Hanwoo [16,53], but selection was not tested in this study, so the overlap should be regarded as a hypothesis for further study. Currently, most agricultural operations in South Korea use a limited set of KPNs for AI applications [3]. Further validation involving larger populations and a broader range of KPNs is necessary to determine the potential occurrence of inbreeding.
One factor affecting the ROH detection is the density of SNP chips used in ROH studies [54]. A high frequency of short ROHs may be overestimated when a medium-density chip (50K) is used [55]. In this study, the mean marker interval was 59.7 kb and 76.4% of ROHs were 1–4 Mb, so part of the short ROHs may represent homozygous stretches that are not IBD, and the number of ROHs should be interpreted as a relative rather than an absolute measure. We therefore adapted the ROH criteria to the marker density following published guidelines [29]. Even in an analysis of Hanwoo ROHs using a 777k SNP chip [20], the average proportion of ROH was highest in the shortest class (0.5–1 Mb), which suggests that short ROHs are abundant in this breed irrespective of chip density; however, a direct test of the effect of density on our estimates was not performed.
The power of QTL mapping and GWAS, as well as the accuracy of genomic selection, depend on the extent of LD between SNP markers and QTLs [26,56]. According to [57], an LD of r2 ≥ 0.2 is required for genomic selection to achieve an accuracy of 85% in GEBV. Except for 10 chromosomes, the r2 value exceeded 0.2 when the distance between SNPs was 0–50 kb (Figure 6B). The average r2 value across autosomes was 0.228 at 0–50 kb, yet it decreased to 0.120 at 50–100 kb (Figure 5). Because the mean marker interval (59.7 kb) is larger than 50 kb, many adjacent SNP pairs fall in distance classes with r2 well below 0.2, so the marker density may limit the LD between markers and QTLs. An LD level of r2 ≥ 0.3 was suggested to increase power for QTL mapping and GWAS [6]; for chromosome 14, the average r2 was highest (0.312) at 0–50 kb (Figure 6B). Many QTLs that affect growth and carcass traits have been reported on chromosomes 6 and 14 in Hanwoo cattle [16,53,58]; both chromosomes also showed the two highest D’ and r2 (Table 4), but whether this reflects selection was not tested.
In some studies of other cattle breeds, r2 was used because D’ could be overestimated due to limited sample sizes or low allele frequencies [44,59,60]. Since few studies have used both D’ and r2 for Hanwoo cattle, this study evaluated LD using both parameters. Studies on Hanwoo cattle consistently showed that LD was highest when SNPs were closest in physical distance and decreased rapidly as the distance between SNPs increased [40,41,42]. This pattern aligns with findings from other breeds including Eringer cattle [61], Limousin, Simmental, and Polish Red cattle [62], and Bali cattle [63]. Directly comparing and interpreting LD results between studies is challenging because of numerous factors, including sample size and marker types [64]. Nevertheless, the present study provides a basis for further research on genetic diversity in Hanwoo cattle.
Haplotype block structure can vary depending on genetic background and marker density. In this study, the number and length of haplotype blocks varied among chromosomes, with differences observed in the number of SNPs within the identified blocks. Most blocks (60.6%) contained only two SNPs, and the blocks covered only 3.53% of the autosomal genome, which reflects the marker spacing (mean 59.7 kb) and the 500 kb maximum distance; the blocks therefore describe the structure detectable with this chip rather than the complete haplotype structure of the genome. The largest numbers of haplotype blocks were found on chromosomes 6, 14, and 7 (245, 190, and 124). Chromosomes 6 and 14 have shown significant QTL associations with carcass traits such as carcass weight and backfat thickness in Hanwoo cattle [65,66,67]. In other breeds, specifically composite beef cattle breeds composed of Red Angus, Charolais, and Tarentaise cattle, SNPs associated with fat thickness have been reported on BTA14 [68]. In addition, QTLs associated with female fertility traits in cows have been reported in Nordic Red cattle [69]. Understanding the haplotype block structure can help in designing conservation programs, maintaining genetic diversity, and avoiding inbreeding [70].
The LD-based Ne method relies on correlations between alleles over distance, and low LD between distant SNPs can lead to underestimation of Ne [71]. In this study, Ne was estimated for the period from 1691 to 13 generations ago. Ne decreased from 2853 to 277, a decrease of about 10-fold, and the decline became steeper from about 180 generations ago. For interpretation, the history of the breed is relevant: Hanwoo has been used as a draft animal for at least 5000 years [42]. Its role changed to meat production from the 1960s [2], and progeny testing for bull selection began in the 1980s [72,73]. The generation interval of Hanwoo has been reported as 5.1–5.5 years in breeding herds [72] and as 4.3 years (dam-daughter) and 7.5 years (sire-daughter), with an average of 5.9 years, in a cow improvement population [73]. With an assumed generation interval of 5–6 years, 13, 100, 1000, and 1691 generations correspond to approximately 65–80, 500–600, 5000–6000, and 8500–10,000 years, respectively. Estimates older than about 1000 generations therefore refer to a period before the earliest records of Hanwoo as a draft animal and to the ancestral populations of the breed, and they should be interpreted with caution. Organized breeding since the 1960s covers only about the last 10 generations, so the decline that became steeper from about 180 generations ago (approximately 900–1100 years) largely predates modern breeding programs, and the present data cannot identify its cause. All estimates also depend on SNP density, sample structure, and the assumed recombination rate.
The Food and Agriculture Organization of the United Nations (FAO) states that a Ne of 50 is required for a stable population [74]. Moreover, ref. [75] suggested that the threshold Ne to maintain genetic diversity within a population is 100. The recent Ne value (277) is above these thresholds; however, because Ne has been decreasing, continuous monitoring and appropriate breeding programs are required to maintain genetic diversity. These Ne values describe the sampled cows and should not be taken as the Ne of the whole Hanwoo breed.
5. Conclusions
This study used the Hanwoo SNP50k BeadChip to analyze the genetic diversity and genomic structure of Hanwoo cows. Genetic diversity was assessed using various genetic parameters. We analyzed the ROHs in Hanwoo cows and confirmed their genomic structure by measuring LD and haplotype block structure. In addition, we found that the effective population size decreased from past to recent generations; heterozygosity did not decline across recent birth cohorts, but ROH-based inbreeding increased modestly. These findings are expected to provide valuable insights for future studies (GWAS and GS). Based on these results, the genetic diversity of Hanwoo cows should be continuously monitored, and appropriate breeding programs are required to preserve it.
Author Contributions
Conceptualization, S.O. and D.Y.; methodology, S.O.; software, S.O.; validation, S.O. and D.Y.; formal analysis, S.O.; investigation, S.O.; resources, D.Y.; writing—original draft preparation, S.O.; writing—review and editing, D.Y.; visualization, S.O.; supervision, D.Y. All authors have read and agreed to the published version of the manuscript.
Funding
This research was supported by Basic Science Research Program through the National Research Foundation of Korea (NRF) funded by the Ministry of Education (Grant No. RS-2025-25415283).
Institutional Review Board Statement
Ethical review and approval were not required for this study because the authors did not conduct any animal experiment. According to the outsourcing facility, genomic DNA was extracted from hair root samples and genotyped with the Illumina Hanwoo SNP50k BeadChip. The authors received the resulting SNP data and did not collect the samples or perform the genotyping.
Informed Consent Statement
Informed consent was obtained from the owner of the Hanwoo cow farm for the collection of hair samples used in this study.
Data Availability Statement
The data presented in this study are available on request from the corresponding author.
Conflicts of Interest
The authors declare no conflicts of interest.
Abbreviations
The following abbreviations are used in this manuscript:
| AI | Artificial insemination |
| BTA | Bos taurus chromosome |
| Chr | Chromosome |
| F | Inbreeding coefficient |
| F_ROH | ROH-based inbreeding coefficient |
| FAO | Food and agriculture organization of the united nations |
| G | Genomic relationship matrix |
| GEBV | Genomic estimated breeding value |
| GS | Genomic selection |
| GWAS | Genome-wide association study |
| HE | Expected heterozygosity |
| HO | Observed heterozygosity |
| IBD | Identical-by-descent |
| KPN | Korean Proven Bull number |
| LD | Linkage disequilibrium |
| MAF | Minor allele frequency |
| Ne | Effective population size |
| QC | Quality control |
| QTL | Quantitative trait loci |
| ROH | Runs of homozygosity |
| SD | Standard deviation |
| SNP | Single-nucleotide polymorphism |
References
- KOSIS. Number of Korean Native Cattle and Cattle Farms by City and Province/Herd Size. Available online: https://kosis.kr/statHtml/statHtml.do?orgId=101&tblId=DT_1EO221&conn_path=I2 (accessed on 28 September 2026).
- Lee, S.-H.; Park, B.-H.; Sharma, A.; Dang, C.-G.; Lee, S.-S.; Choi, T.-J.; Choy, Y.-H.; Kim, H.-C.; Jeon, K.-J.; Kim, S.-D.; et al. Hanwoo cattle: Origin, domestication, breeding strategies and genomic selection. J. Anim. Sci. Technol. 2014, 56, 2. [Google Scholar] [CrossRef] [Scilit]
- Kim, K.; Jung, J.; Caetano-Anollés, K.; Sung, S.; Yoo, D.; Choi, B.-H.; Kim, H.-C.; Jeong, J.-Y.; Cho, Y.-M.; Park, E.-W.; et al. Artificial selection increased body weight but induced increase of runs of homozygosity in Hanwoo cattle. PLoS ONE 2018, 13, e0193701. [Google Scholar] [CrossRef] [Scilit]
- Arias, J.A.; Keehan, M.; Fisher, P.; Coppieters, W.; Spelman, R. A high density linkage map of the bovine genome. BMC Genet. 2009, 10, 18. [Google Scholar] [CrossRef] [Scilit]
- Qanbari, S.; Pimentel, E.; Tetens, J.; Thaller, G.; Lichtner, P.; Sharifi, A.; Simianer, H. The pattern of linkage disequilibrium in German Holstein cattle. Anim. Genet. 2010, 41, 346–356. [Google Scholar] [CrossRef] [Scilit]
- O’Brien, A.M.P.; Mészáros, G.; Utsunomiya, Y.T.; Sonstegard, T.S.; Garcia, J.F.; Van Tassell, C.P.; Carvalheiro, R.; da Silva, M.V.; Sölkner, J. Linkage disequilibrium levels in Bos indicus and Bos taurus cattle using medium and high density SNP chip data and different minor allele frequency distributions. Livest. Sci. 2014, 166, 121–132. [Google Scholar] [CrossRef] [Scilit]
- Hayes, B.; Chamberlain, A.; McPartlan, H.; Macleod, I.; Sethuraman, L.; Goddard, M. Accuracy of marker-assisted selection with single markers and marker haplotypes in cattle. Genet. Res. 2007, 89, 215–220. [Google Scholar] [CrossRef] [Scilit]
- Naserkheil, M.; Manzari, Z.; Dang, C.G.; Lee, S.S.; Park, M.N. Exploring and Identifying Candidate Genes and Genomic Regions Related to Economically Important Traits in Hanwoo Cattle. Curr. Issues Mol. Biol. 2022, 44, 6075–6092. [Google Scholar] [CrossRef] [Scilit]
- Hay, E.H.; Roberts, A. Genomic Analysis of Heterosis in an Angus× Hereford Cattle Population. Animals 2023, 13, 191. [Google Scholar] [CrossRef] [Scilit]
- Mehrban, H.; Lee, D.H.; Moradi, M.H.; Cho, C.; Naserkheil, M.; Ibáñez-Escriche, N. Predictive performance of genomic selection methods for carcass traits in Hanwoo beef cattle: Impacts of the genetic architecture. Genet. Sel. Evol. 2017, 49, 1. [Google Scholar] [CrossRef] [Scilit]
- Lee, H.S.; Kim, Y.; Lee, D.H.; Seo, D.; Lee, D.J.; Do, C.H.; Dinh, P.T.N.; Ekanayake, W.; Lee, K.H.; Yoon, D.; et al. Comparison of accuracy of breeding value for cow from three methods in Hanwoo (Korean cattle) population. J. Anim. Sci. Technol. 2023, 65, 720. [Google Scholar] [CrossRef] [Scilit]
- Ablondi, M.; Dadousis, C.; Vasini, M.; Eriksson, S.; Mikko, S.; Sabbioni, A. Genetic diversity and signatures of selection in a native Italian horse breed based on SNP data. Animals 2020, 10, 1005. [Google Scholar] [CrossRef] [Scilit]
- Yang, B.; Cui, L.; Perez-Enciso, M.; Traspov, A.; Crooijmans, R.P.; Zinovieva, N.; Schook, L.B.; Archibald, A.; Gatphayak, K.; Knorr, C.; et al. Genome-wide SNP data unveils the globalization of domesticated pigs. Genet. Sel. Evol. 2017, 49, 71. [Google Scholar] [CrossRef] [Scilit]
- Edea, Z.; Dessie, T.; Dadi, H.; Do, K.-T.; Kim, K.-S. Genetic diversity and population structure of Ethiopian sheep populations revealed by high-density SNP markers. Front. Genet. 2017, 8, 218. [Google Scholar] [CrossRef] [Scilit]
- Lopez, B.I.; Lee, S.-H.; Park, J.-E.; Shin, D.-H.; Oh, J.-D.; de Las Heras-Saldana, S.; Van Der Werf, J.; Chai, H.-H.; Park, W.; Lim, D. Weighted genomic best linear unbiased prediction for carcass traits in Hanwoo cattle. Genes 2019, 10, 1019. [Google Scholar] [CrossRef] [Scilit]
- Srikanth, K.; Lee, S.-H.; Chung, K.-Y.; Park, J.-E.; Jang, G.-W.; Park, M.-R.; Kim, N.Y.; Kim, T.-H.; Chai, H.-H.; Park, W.C.; et al. A gene-set enrichment and protein–protein interaction network-based GWAS with regulatory SNPs identifies candidate genes and pathways associated with carcass traits in hanwoo cattle. Genes 2020, 11, 316. [Google Scholar] [CrossRef] [Scilit]
- Purfield, D.C.; Berry, D.P.; McParland, S.; Bradley, D.G. Runs of homozygosity and population history in cattle. BMC Genet. 2012, 13, 70. [Google Scholar] [CrossRef] [Scilit]
- McQuillan, R.; Leutenegger, A.-L.; Abdel-Rahman, R.; Franklin, C.S.; Pericic, M.; Barac-Lauc, L.; Smolej-Narancic, N.; Janicijevic, B.; Polasek, O.; Tenesa, A.; et al. Runs of homozygosity in European populations. Am. J. Hum. Genet. 2008, 83, 359–372. [Google Scholar] [CrossRef] [Scilit]
- Wang, W.; Shi, Y.; He, F.; Fang, D.; Gan, J.; Wu, F.; Ag, Y.; Deng, X.; Cao, Q.; Duo, C.; et al. Runs of Homozygosity Analysis Reveals Genomic Diversity and Population Structure of an Indigenous Cattle Breed in Southwest China. Animals 2022, 12, 3239. [Google Scholar] [CrossRef] [Scilit]
- Kim, S.; Cheong, H.S.; Shin, H.D.; Lee, S.-S.; Roh, H.-J.; Jeon, D.-Y.; Cho, C.-Y. Genetic diversity and divergence among Korean cattle breeds assessed using a BovineHD single-nucleotide polymorphism chip. Asian-Australas. J. Anim. Sci. 2018, 31, 1691. [Google Scholar] [CrossRef] [Scilit]
- Khatkar, M.S.; Nicholas, F.W.; Collins, A.R.; Zenger, K.R.; Cavanagh, J.A.; Barris, W.; Schnabel, R.D.; Taylor, J.F.; Raadsma, H.W. Extent of genome-wide linkage disequilibrium in Australian Holstein-Friesian cattle based on a high-density SNP panel. BMC Genom. 2008, 9, 187. [Google Scholar] [CrossRef] [Scilit]
- Daetwyler, H.D.; Pong-Wong, R.; Villanueva, B.; Woolliams, J.A. The impact of genetic architecture on genome-wide evaluation methods. Genetics 2010, 185, 1021–1031. [Google Scholar] [CrossRef] [Scilit]
- Gabriel, S.B.; Schaffner, S.F.; Nguyen, H.; Moore, J.M.; Roy, J.; Blumenstiel, B.; Higgins, J.; DeFelice, M.; Lochner, A.; Faggart, M.; et al. The structure of haplotype blocks in the human genome. Science 2002, 296, 2225–2229. [Google Scholar] [CrossRef] [Scilit]
- Khatkar, M.S.; Zenger, K.R.; Hobbs, M.; Hawken, R.J.; Cavanagh, J.A.; Barris, W.; McClintock, A.E.; McClintock, S.; Thomson, P.C.; Tier, B.; et al. A primary assembly of a bovine haplotype block map based on a 15,036-single-nucleotide polymorphism panel genotyped in Holstein–Friesian cattle. Genetics 2007, 176, 763–772. [Google Scholar] [CrossRef] [Scilit][Green Version]
- Phillips, M.; Lawrence, R.; Sachidanandam, R.; Morris, A.; Balding, D.; Donaldson, M.; Studebaker, J.; Ankener, W.; Alfisi, S.; Kuo, F.-S.; et al. Chromosome-wide distribution of haplotype blocks and the role of recombination hot spots. Nat. Genet. 2003, 33, 382–387. [Google Scholar] [CrossRef] [Scilit]
- Hayes, B.J.; Bowman, P.J.; Chamberlain, A.J.; Goddard, M.E. Invited review: Genomic selection in dairy cattle: Progress and challenges. J. Dairy Sci. 2009, 92, 433–443. [Google Scholar] [CrossRef] [Scilit]
- Meuwissen, T.; Goddard, M.E. Fine mapping of quantitative trait loci using linkage disequilibria with closely linked marker loci. Genetics 2000, 155, 421–430. [Google Scholar] [CrossRef] [Scilit]
- Purcell, S.; Neale, B.; Todd-Brown, K.; Thomas, L.; Ferreira, M.A.; Bender, D.; Maller, J.; Sklar, P.; De Bakker, P.I.; Daly, M.J. PLINK: A tool set for whole-genome association and population-based linkage analyses. Am. J. Hum. Genet. 2007, 81, 559–575. [Google Scholar] [CrossRef] [Scilit]
- Meyermans, R.; Gorssen, W.; Buys, N.; Janssens, S. How to study runs of homozygosity using PLINK? A guide for analyzing medium density SNP data in livestock and pet species. BMC Genom. 2020, 21, 94. [Google Scholar] [CrossRef] [Scilit]
- Zhao, H.; Nettleton, D.; Soller, M.; Dekkers, J. Evaluation of linkage disequilibrium measures between multi-allelic markers as predictors of linkage disequilibrium between markers and QTL. Genet. Res. 2005, 86, 77–87. [Google Scholar] [CrossRef] [Scilit]
- Lewontin, R.C. The interaction of selection and linkage. I. General considerations; heterotic models. Genetics 1964, 49, 49. [Google Scholar] [CrossRef] [Scilit]
- Hill, W.; Robertson, A. Linkage disequilibrium in finite populations. Theor. Appl. Genet. 1968, 38, 226–231. [Google Scholar] [CrossRef] [Scilit]
- Barrett, J.C.; Fry, B.; Maller, J.; Daly, M.J. Haploview: Analysis and visualization of LD and haplotype maps. Bioinformatics 2005, 21, 263–265. [Google Scholar] [CrossRef] [Scilit]
- Sved, J. Linkage disequilibrium and homozygosity of chromosome segments in finite populations. Theor. Popul. Biol. 1971, 2, 125–141. [Google Scholar] [CrossRef] [Scilit]
- R Core Team. R: A Language and Environment for Statistical Computing; R Foundation for Statistical Computing: Vienna, Austria, 2023. [Google Scholar]
- Hayes, B.J.; Visscher, P.M.; McPartlan, H.C.; Goddard, M.E. Novel multilocus measure of linkage disequilibrium to estimate past effective population size. Genome Res. 2003, 13, 635–643. [Google Scholar] [CrossRef] [Scilit]
- Corbin, L.J.; Liu, A.; Bishop, S.; Woolliams, J. Estimation of historical effective population size using linkage disequilibria with marker data. J. Anim. Breed. Genet. 2012, 129, 257–270. [Google Scholar] [CrossRef] [Scilit]
- Sved, J.; Feldman, M. Correlation and probability methods for one and two loci. Theor. Popul. Biol. 1973, 4, 129–132. [Google Scholar] [CrossRef] [Scilit]
- Song, J.-S.; Seong, H.-S.; Choi, B.-H.; Lee, C.-W.; Hwang, N.-H.; Lim, D.; Lee, J.-H.; Kim, J.S.; Kim, J.-D.; Park, Y.-S.; et al. Genome-wide analysis of Hanwoo and Chikso populations using the BovineSNP50 genotyping array. Genes Genom. 2018, 40, 1373–1382. [Google Scholar] [CrossRef] [Scilit]
- Li, Y.; Kim, J.-J. Effective population size and signatures of selection using bovine 50K SNP chips in Korean native cattle (Hanwoo). Evol. Bioinform. 2015, 11, 143–153. [Google Scholar] [CrossRef] [Scilit]
- Sudrajad, P.; Seo, D.; Choi, T.; Park, B.; Roh, S.; Jung, W.; Lee, S.; Lee, J.; Kim, S.; Lee, S. Genome-wide linkage disequilibrium and past effective population size in three Korean cattle breeds. Anim. Genet. 2017, 48, 85–89. [Google Scholar] [CrossRef] [Scilit]
- Lee, S.; Cho, Y.; Lim, D.; Kim, H.; Choi, B.; Park, H.; Kim, O.; Kim, S.; Kim, T.; Yoon, D.; et al. Linkage disequilibrium and effective population size in Hanwoo Korean cattle. Asian-Australas. J. Anim. Sci. 2011, 24, 1660–1665. [Google Scholar] [CrossRef] [Scilit]
- Won, S.; Park, J.-E.; Son, J.-H.; Lee, S.-H.; Park, B.H.; Park, M.; Park, W.-C.; Chai, H.-H.; Kim, H.; Lee, J.; et al. Genomic prediction accuracy using haplotypes defined by size and hierarchical clustering based on linkage disequilibrium. Front. Genet. 2020, 11, 134. [Google Scholar] [CrossRef] [Scilit]
- Fabbri, M.C.; Dadousis, C.; Bozzi, R. Estimation of Linkage Disequilibrium and Effective Population Size in Three Italian Autochthonous Beef Breeds. Animals 2020, 10, 1034. [Google Scholar] [CrossRef] [Scilit]
- Jemaa, S.B.; Thamri, N.; Mnara, S.; Rebours, E.; Rocha, D.; Boussaha, M. Linkage disequilibrium and past effective population size in native Tunisian cattle. Genet. Mol. Biol. 2019, 42, 52–61. [Google Scholar] [CrossRef] [Scilit]
- Laodim, T.; Koonawootrittriron, S.; Elzo, M.A.; Suwanasopee, T. Genome-wide linkage disequilibrium in a Thai multibreed dairy cattle population. Livest. Sci. 2015, 180, 27–33. [Google Scholar] [CrossRef] [Scilit]
- Xu, L.; Zhu, B.; Wang, Z.; Xu, L.; Liu, Y.; Chen, Y.; Zhang, L.; Gao, X.; Gao, H.; Zhang, S.; et al. Evaluation of Linkage Disequilibrium, Effective Population Size and Haplotype Block Structure in Chinese Cattle. Animals 2019, 9, 83. [Google Scholar] [CrossRef] [Scilit]
- Edea, Z.; Bhuiyan, M.; Dessie, T.; Rothschild, M.; Dadi, H.; Kim, K. Genome-wide genetic diversity, population structure and admixture analysis in African and Asian cattle breeds. Animal 2015, 9, 218–226. [Google Scholar] [CrossRef] [Scilit]
- Ma, X.; Cheng, H.; Liu, Y.; Sun, L.; Chen, N.; Jiang, F.; You, W.; Yang, Z.; Zhang, B.; Song, E.; et al. Assessing Genomic Diversity and Selective Pressures in Bohai Black Cattle Using Whole-Genome Sequencing Data. Animals 2022, 12, 665. [Google Scholar] [CrossRef] [Scilit]
- Marras, G.; Gaspa, G.; Sorbolini, S.; Dimauro, C.; Ajmone-Marsan, P.; Valentini, A.; Williams, J.L.; Macciotta, N.P. Analysis of runs of homozygosity and their relationship with inbreeding in five cattle breeds farmed in Italy. Anim. Genet. 2015, 46, 110–121. [Google Scholar] [CrossRef] [Scilit]
- Saravanan, K.; Panigrahi, M.; Kumar, H.; Parida, S.; Bhushan, B.; Gaur, G.; Kumar, P.; Dutt, T.; Mishra, B.; Singh, R. Genome-wide assessment of genetic diversity, linkage disequilibrium and haplotype block structure in Tharparkar cattle breed of India. Anim. Biotechnol. 2022, 33, 297–311. [Google Scholar] [CrossRef] [Scilit]
- Mastrangelo, S.; Tolone, M.; Di Gerlando, R.; Fontanesi, L.; Sardina, M.; Portolano, B. Genomic inbreeding estimation in small populations: Evaluation of runs of homozygosity in three local dairy cattle breeds. Animal 2016, 10, 746–754. [Google Scholar] [CrossRef] [Scilit]
- Bhuiyan, M.S.; Lim, D.; Park, M.; Lee, S.; Kim, Y.; Gondro, C.; Park, B.; Lee, S. Functional partitioning of genomic variance and genome-wide association study for carcass traits in Korean Hanwoo cattle using imputed sequence level SNP data. Front. Genet. 2018, 9, 217. [Google Scholar] [CrossRef] [Scilit]
- Ghoreishifar, S.M.; Moradi-Shahrbabak, H.; Parna, N.; Davoudi, P.; Khansefid, M. Linkage disequilibrium and within-breed genetic diversity in Iranian Zandi sheep. Arch. Anim. Breed. 2019, 62, 143–151. [Google Scholar] [CrossRef] [Scilit]
- Ferenčaković, M.; Sölkner, J.; Curik, I. Estimating autozygosity from high-throughput information: Effects of SNP density and genotyping errors. Genet. Sel. Evol. 2013, 45, 42. [Google Scholar] [CrossRef] [Scilit]
- Raven, L.-A.; Cocks, B.G.; Hayes, B.J. Multibreed genome wide association can improve precision of mapping causative variants underlying milk production in dairy cattle. BMC Genom. 2014, 15, 62. [Google Scholar] [CrossRef] [Scilit]
- Meuwissen, T.H.; Hayes, B.J.; Goddard, M.E. Prediction of total genetic value using genome-wide dense marker maps. Genetics 2001, 157, 1819–1829. [Google Scholar] [CrossRef] [Scilit]
- Seo, D.; Lee, D.H.; Jin, S.; Won, J.I.; Lim, D.; Park, M.; Kim, T.H.; Lee, H.K.; Kim, S.; Choi, I.; et al. Long-term artificial selection of Hanwoo (Korean) cattle left genetic signatures for the breeding traits and has altered the genomic structure. Sci. Rep. 2022, 12, 6438. [Google Scholar] [CrossRef] [Scilit]
- Mokry, F.B.; Buzanskas, M.E.; de Alvarenga Mudadu, M.; do Amaral Grossi, D.; Higa, R.H.; Ventura, R.V.; de Lima, A.O.; Sargolzaei, M.; Conceição Meirelles, S.L.; Schenkel, F.S.; et al. Linkage disequilibrium and haplotype block structure in a composite beef cattle breed. BMC Genom. 2014, 15, S6. [Google Scholar] [CrossRef] [Scilit]
- Niu, H.; Zhu, B.; Guo, P.; Zhang, W.; Xue, J.; Chen, Y.; Zhang, L.; Gao, H.; Gao, X.; Xu, L.; et al. Estimation of linkage disequilibrium levels and haplotype block structure in Chinese Simmental and Wagyu beef cattle using high-density genotypes. Livest. Sci. 2016, 190, 1–9. [Google Scholar] [CrossRef] [Scilit]
- Flury, C.; Tapio, M.; Sonstegard, T.; Drögemüller, C.; Leeb, T.; Simianer, H.; Hanotte, O.; Rieder, S. Effective population size of an indigenous Swiss cattle breed estimated from linkage disequilibrium. J. Anim. Breed. Genet. 2010, 127, 339–347. [Google Scholar] [CrossRef] [Scilit]
- Jasielczuk, I.; Gurgul, A.; Szmatoła, T.; Ząbek, T.; Pawlina, K.; Semik, E.; Bugno-Poniewierska, M. Linkage disequilibrium and haplotype block structure in Limousin, Simmental and native Polish Red cattle. Livest. Sci. 2016, 191, 57–63. [Google Scholar] [CrossRef] [Scilit]
- Sudrajad, P.; Kusminanto, R.Y.; Volkandari, S.D.; Cahyadi, M. Genomic structure of Bali cattle based on linkage disequilibrium and effective population size analyses using 50K single nucleotide polymorphisms data. Vet. World 2022, 15, 449. [Google Scholar] [CrossRef] [Scilit]
- Pritchard, J.K.; Przeworski, M. Linkage disequilibrium in humans: Models and data. Am. J. Hum. Genet. 2001, 69, 1–14. [Google Scholar] [CrossRef] [Scilit]
- Kim, H.; de las Heras-Saldana, S.; Clark, S.; van der Werf, J. A genome-wide association study (GWAS) for carcass traits in Hanwoo cattle using imputed whole genome sequence data. In Proceedings of the 12th World Congress on Genetics Applied to Livestock Production (WCGALP), Rotterdam, The Netherlands, 3–8 July 2022; pp. 2632–2635. [Google Scholar]
- Lee, S.H.; Choi, B.H.; Lim, D.; Gondro, C.; Cho, Y.M.; Dang, C.G.; Sharma, A.; Jang, G.W.; Lee, K.T.; Yoon, D.; et al. Genome-wide association study identifies major loci for carcass weight on BTA14 in Hanwoo (Korean cattle). PLoS ONE 2013, 8, e74677. [Google Scholar] [CrossRef] [Scilit]
- Li, Y.; Kim, J.-J. Multiple linkage disequilibrium mapping methods to validate additive quantitative trait loci in Korean native cattle (Hanwoo). Asian-Australas. J. Anim. Sci. 2015, 28, 926. [Google Scholar] [CrossRef] [Scilit]
- Roberts, A. Genome-wide association study for carcass traits in a composite beef cattle breed. Livest. Sci. 2018, 213, 35–43. [Google Scholar] [CrossRef] [Scilit]
- Höglund, J.K.; Buitenhuis, B.; Guldbrandtsen, B.; Lund, M.S.; Sahana, G. Genome-wide association study for female fertility in Nordic Red cattle. BMC Genet. 2015, 16, 110. [Google Scholar] [CrossRef] [Scilit]
- Zhao, Q.-b.; Sun, H.; Zhang, Z.; Xu, Z.; Olasege, B.S.; Ma, P.-p.; Zhang, X.-z.; Wang, Q.-s.; Pan, Y.-c. Exploring the structure of haplotype blocks and genetic diversity in Chinese indigenous pig populations for conservation purpose. Evol. Bioinform. 2019, 15, 1176934318825082. [Google Scholar] [CrossRef] [Scilit]
- Hollenbeck, C.; Portnoy, D.; Gold, J. A method for detecting recent changes in contemporary effective population size from linkage disequilibrium at linked and unlinked loci. Heredity 2016, 117, 207–216. [Google Scholar] [CrossRef] [Scilit]
- Song, C.W.; Lopez, B.I.M.; Seo, K.S. Inbreeding Coefficient and Pedigree Analysis of Hanwoo Cattle Population. J. Anim. Breed. Genom. 2018, 2, 223–230. [Google Scholar] [CrossRef] [Scilit]
- Koo, Y.-M.; Alam, M.; Park, M.; Lee, S.; Lee, D.; Dang, C.-G.; Rho, S.-H.; Lee, K.; Choi, T.-J. Estimation of pedigree completeness index, inbreeding coefficient and effective population size of breeding stock for Hanwoo cows. J. Anim. Breed. Genom. 2021, 5, 73–83. [Google Scholar] [CrossRef] [Scilit]
- Bradley, D.; Fries, R.; Bumstead, N.; Nicholas, F.; Cothran, E.; Ollivier, L.; Crawford, A. Secondary Guidelines for Development of National Farm Animal Genetic Resources Management Plans; Food and Agricultural Organization of United Nations (FAO): Roma, Italy, 2004. [Google Scholar]
- Meuwissen, T.H. Accuracy of breeding values of ‘unrelated’ individuals predicted by dense SNP genotyping. Genet. Sel. Evol. 2009, 41, 35. [Google Scholar] [CrossRef] [Scilit]

Disclaimer/Publisher’s Note: The statements, opinions and data contained in all publications are solely those of the individual author(s) and contributor(s) and not of MDPI and/or the editor(s). MDPI and/or the editor(s) disclaim responsibility for any injury to people or property resulting from any ideas, methods, instructions or products referred to in the content. |
© 2026 by the authors. Licensee MDPI, Basel, Switzerland. This article is an open access article distributed under the terms and conditions of the Creative Commons Attribution (CC BY) license.