


Abstract
Reliable qPCR normalization requires validation of reference genes under specific experimental conditions. We evaluated eight candidate endogenous controls in the dinoflagellate Prorocentrum cordatum exposed to short-term thermal, osmotic, and copper stressors across two datasets. Expression stability was ranked using geNorm, NormFinder, and BestKeeper, followed by consensus rank aggregation. Depending on the dataset, the most stable reference gene pairs were SAM and RPS9 (encoding S-adenosylmethionine synthase and ribosomal protein S9, respectively) or SAM and Crn (coding for coronin). In turn, genes encoding malate dehydrogenase (MDH), elongation factor 2 (EF2), and cyclophilin (Cyp) ranked lowest. We assessed normalization consequences for three target genes—a Mei2-like gene Mei2_s3929, serine/threonine protein kinase gene Phkg2, and alpha/beta hydrolase gene Hydr—using separate linear models with experimental group and culture series as fixed effects. In Dataset 1, hypo-osmotic treatment significantly upregulated Mei2_s3929 only under optimal normalization (RPS9 + SAM); this effect was not statistically significant under suboptimal normalization (EF2 + MDH). In contrast, the difference in Mei2_s3929 expression between light and dark controls in Dataset 2 remained significant under both normalization strategies. These findings demonstrate that reference gene selection can alter statistical power in microalgal qPCR and affect the statistical detection of target-gene expression changes, even when candidate genes meet conventional stability criteria.
1. Introduction
Quantitative PCR (qPCR) is a sensitive method for targeted gene expression analysis, particularly when a limited number of genes should be examined across defined experimental conditions. Despite general accessibility, it requires a whole series of preparatory steps and additional tests, especially when working with non-model organisms such as various protists. The reliability of qPCR measurements depends not only on primer specificity and amplification efficiency but also on the normalization strategy used to account for variation in RNA quantity, RNA quality, reverse-transcription efficiency, and template input. Normalization is commonly performed using one or more reference genes assumed to have relatively stable expression across the samples being compared. However, the accuracy of the resulting expression estimates depends strongly on the choice of these genes. Conventional housekeeping genes are not necessarily expressed constitutively, and their transcript levels may vary with developmental state, tissue or cell type, environmental conditions, or experimental treatment [1,2,3]. They should not be used without experimental validation [2]; the Minimum Information for Publication of Quantitative Real-Time PCR Experiments (MIQE) guidelines recommend reporting the basis for reference gene selection and demonstrating its suitability for the study design [3,4]. The need for condition-specific validation is also illustrated by the fact that transcriptomic screening can identify genes that are more stable than traditional controls in a defined biological system [5].
Dinoflagellates are ecologically important unicellular algae whose responses to changing environmental conditions and various stressors influence their growth, physiology, and choice of developmental strategy [6,7,8,9]. Understanding these responses requires reliable measurements of internal alterations, in particular, gene expression changes, and qPCR can be used for this purpose. Several studies have evaluated reference genes for qPCR normalization in dinoflagellates. The candidate sets have included genes encoding tubulins, actin, glyceraldehyde-3-phosphate dehydrogenase, 18S ribosomal RNA, translation-related proteins, metabolic enzymes, and other conserved cellular proteins [10,11,12,13,14,15,16,17,18] (see Table S1). Although some candidates have performed well in more than one study, the optimal reference genes have differed among species, treatments, exposure durations, and experimental designs. These observations argue against treating any conventional housekeeping gene as a universal endogenous control for dinoflagellate qPCR.
In the present study, we evaluated eight candidate endogenous controls in the marine planktonic dinoflagellate Prorocentrum cordatum (Ostenfeld) Dodge, 1975 exposed to short-term hypo- and hyper-osmotic conditions, low and high temperature, and copper treatment. We focused specifically on identifying endogenous controls suitable for normalizing gene expression during short-term stress, namely exposure for no more than 4 h. Short-term stress experiments require particular care in the selection of reference genes. On the one hand, for some processes, such an exposure time is not yet sufficient for changes to become noticeable at the expression level, but, on the other hand, acute exposure can trigger rapid and transient changes in transcription, even when cell mortality remains low [19,20]. Genes that appear stable during prolonged acclimation, across growth phases, or under a different environmental treatment may therefore be unsuitable for normalizing transcript levels during an acute stress response. From the perspective of understanding processes occurring in the natural environment, such studies are also important, as they provide data for predicting the cellular response of dinoflagellates to abrupt changes, comparable, for example, to the release of ballast water into a new habitat or to extreme weather events [21].
P. cordatum has previously been used in gene-expression studies, but the available reference gene validation data do not establish a universal normalization strategy applicable to all experimental conditions [12]. Reliable normalization requires the combined assessment of candidate-gene stability using complementary statistical approaches and verification of the consequences of reference gene selection for the expression of genes of interest [22,23,24,25]. The candidate genes that we selected represent diverse cellular functions, including central metabolism, protein synthesis, ribosomal structure, and cytoskeletal regulation. Expression stability was assessed using three statistical algorithms, and the resulting rankings were integrated to obtain a consensus assessment. Finally, the biological relevance of the selected controls was examined by comparing the expression patterns of three genes of interest after normalization with the most stable and least stable candidate combinations. This design allowed us to determine not only which candidate genes showed the greatest statistical stability under the tested conditions, but also how reference gene choice affected the detection and interpretation of stress-associated changes in target gene expression.
2. Materials and Methods
2.1. Cell Culture and Experimental Design
The clonal culture of Prorocentrum cordatum, strain CCAP1136/16 (The Culture Collection of Algae and Protozoa, Oban, UK), was cultivated in the artificial seawater-based f/2 medium containing no silicate and sterilized by autoclaving at salinity of 25 [26]. A filter-sterilized vitamin mixture was added separately after autoclaving and cooling. Batch cultures were grown under a 12 h light:12 h dark cycle at 100 µmol photons m−2 s−1 and 18 °C.
The experimental cultures (250 mL, initial cell concentration of 4 × 10⁴ cells mL−1) were grown for 6–7 days until reaching the exponential growth phase. To ensure sample homogeneity and avoid harvesting bottom culture layers, the required volume of each experimental culture was transferred to a clean flask and gently mixed. Then, samples were collected, with volumes adjusted to achieve a cell count of approximately 3 × 10⁶ cells per sample. To evaluate gene expression stability and target gene responses under stress, two independent experimental sets, designated as Dataset 1 and Dataset 2, were conducted.
For Dataset 1, samples were subjected to various stress conditions for 4 h under standard illumination of 100 µmol photons m−2 s−1. Control samples were incubated under standard cultivation conditions at 18 °C. The low-temperature treatment (low_T) was achieved by placing the sample in a refrigerator equipped with an algal cultivation lamp and additionally overlaying it with ice to maintain a temperature of 2 °C. The increase in salinity by 10 (hyper_OS) was performed by adding the required volume of 0.94 M NaCl to the sample, whereas decrease in salinity by 10 (hypo_OS) was achieved by adding the required volume of distilled water. To study the effects of copper toxicity (Cu), the required volume of 3.13 mM CuSO4 solution was added to the sample to achieve a final concentration of 3.13 µM, corresponding to a copper content of 200 µg. Initially, three independent experimental series were designed to ensure three biological replicates for each treatment. However, as several samples failed to meet quality control criteria during RNA extraction, additional series were performed, with detailed sample distribution across series provided in Table 1. Ultimately, Dataset 1 comprised four biological replicates for the control group and three biological replicates for each experimental stress group. A control sample was omitted from the fifth experimental series, as a sufficient number of valid control replicates had already been obtained.
Table 1.
Distribution of samples across treatment types and series of experiments in Dataset 1.
Dataset 2 was conducted to evaluate short-term thermal stress. For the high-temperature treatment (high_T), incubation was carried out at 37 °C, and the exposure duration was shortened to 1 h to prevent a dramatic increase in cell mortality observed during longer incubations. Due to the technical impossibility of placing an illumination source inside the incubator set to 37 °C, the high_T treatment was performed in darkness. Consequently, two distinct control conditions with a 1 h exposure time were established to separate the effect of darkness from thermal stress: a light control kept under standard cultivation conditions at 18 °C with illumination of 100 µmol photons m−2 s−1 (C_light) and a dark control incubated at 18 °C in the dark (C_dark). Dataset 2 consisted of four independent experimental series, yielding four biological replicates for each treatment group. All harvested RNA samples in Dataset 2 met the required quality control criteria, and no samples were excluded from the analysis.
Following incubation, all samples from both datasets were immediately centrifuged at 4500× g for 3 min, the supernatant was removed, and the cell pellet was snap-frozen in liquid nitrogen and stored at −80 °C prior to RNA extraction. Additionally, 100 µL of each sample were collected before centrifugation for a cell viability test with propidium iodide staining. The proportion of dead stained cells was assessed using a Countess II FL automated cell counter (Invitrogen, Thermo Fisher Scientific, Waltham, MA, USA).
2.2. Total RNA Extraction and cDNA Synthesis
Total RNA was isolated using a lysis buffer described by Li et al. [27] of the following composition: 1% (w/v) SDS, 400 mM NaCl, and 20 mM EDTA in 10 mM Tris/HCl (pH 8.0). The isolation was performed as described previously [28] with a single cycle of cell lysis via bead-beating. The extracted RNA was treated with DNase I (EN0521, Thermo Fisher Scientific, Waltham, MA, USA). The integrity of the RNA samples was assessed by agarose gel electrophoresis (2% w/v in 1 × TAE buffer). To image gels, a dual-wavelength 365/312 nm UV transilluminator TCP-20.LM V1 (Vilber, Collégien, France) 365/312 nm and a gel documentation system “Vzglyad” 2.0 (Helicon, Moscow, Russia) with resolution of 2592 × 1944 pixels were used. The purity of the samples and RNA concentration were determined using a NanoDrop One spectrophotometer (Thermo Fisher Scientific, Waltham, MA, USA). To minimize the effects of potential reverse transcription inhibitors, all RNA samples were then diluted 4-fold with nuclease-free water. Finally, 200 ng of total RNA from each sample was reverse-transcribed using a QuantiTect Reverse Transcription Kit (205311, Qiagen, Hilden, Germany) in a reaction volume of 20 µL according to the manufacturer’s protocol, with the cDNA synthesis time extended to 30 min. The resulting cDNA solutions were diluted 5-fold with nuclease-free water to a final volume of 100 µL and stored at −80 °C until further use.
2.3. Selection of Candidate Reference Genes and Genes of Interest
Candidate reference genes involved in diverse cellular processes were selected to evaluate their expression stability under the experimental conditions tested (Table 2). This selection was mainly based on previous studies of other organisms, including dinoflagellates (Table S1). Conversely, genes of interest were chosen to validate the robustness of the selected reference genes (Table 2), utilizing data from our previous transcriptomic study on cold-induced temporary cysts in P. cordatum [29] and analysis of diversity of MEI2 homologs in dinoflagellates [30].
Table 2.
List of candidate reference genes and genes of interest used in this study. GenBank contig accession numbers, corresponding locus tags, and coding sequence (CDS) identifiers from the Prorocentrum cordatum reference genome assembly GCA_963575745.1 are provided. For MDH, the partial coding sequence deposited in GenBank under accession number JF715161.1 by Guo and Ki [12] is listed.
For the candidate reference gene MDH encoding malate dehydrogenase, the primer pair designed by Guo and Ki [12] and the corresponding partial coding sequence (CDS) deposited in GenBank under accession number JF715161.1 were used (Table 2 and Table 3). The CDSs of all other selected genes were retrieved from the P. cordatum CCMP1329 reference genome assembly GCA_963575745.1 [31] via GenBank (Table 2). To identify the specific sequences of the candidate reference genes, homologous amino acid sequences from human, mouse, plant or apicomplexan were used as queries in tBLASTn searches against the GCA_963575745.1 genome assembly. After checking the presence of conserved domains using the CDSearch tool (search against database CDD-71136 PSSMs), we retrieved the corresponding CDS. For the genes of interest, CDS were obtained directly from the assembly using the available annotations from transcriptome. The identification of genes and their products was based on the feature notes provided in the protein records, as well as their conserved domain composition. Where necessary, a BLASTp search against the ClusteredNR NCBI protein sequence database was performed.
Table 3.
List of primers used for qPCR. All primer pairs were designed in this study, except for the MDH primers adopted from Guo and Ki [12].
2.4. Primer Design and qPCR
Specific primers for the candidate reference genes and genes of interest were designed manually, except for those targeting MDH. The thermodynamic parameters of the selected primers were evaluated utilizing the OligoAnalyzer tool (Integrated DNA Technologies, Coralville, IA, USA). To ensure optimal amplification efficiency, the following primer design criteria were applied: a primer length of 18–24 bp, an amplicon size of 80–250 bp, a primer melting temperature (Tm) within 64–65 °C (so an optimal annealing temperature [Ta] of all primer pairs was ~62 °C), a Tm difference of <5 °C between primers in each pair, and a G/C content of 40–60%. The thresholds for secondary structures were set as follows: no 3′-end hairpins with ΔG < −2 kcal/mol, no overall hairpins with ΔG < −3 kcal/mol, a ΔG > −5 kcal/mol for the 3′-end and ΔG > −6 kcal/mol overall for the most stable homodimers and heterodimers. To prevent potential amplification of non-specific targets, all primers were used as queries in local BLASTn searches against the P. cordatum CCMP1329 CDS database [31]. A primer pair passed this validation only if the forward and reverse primers showed no simultaneous matches to any single non-specific target, or if at least two nucleotides at the 3′-end mismatched the non-specific sequence. The selected primers (Table 3) were synthesized by a commercial supplier (Evrogen, Moscow, Russia).
The performance of each primer pair was evaluated via PCR amplification with cDNA as a template under the conditions described below for qPCR. The target amplicon sizes were verified by agarose gel electrophoresis (2% w/v in 1 × TAE buffer), yielding clear DNA bands of the expected sizes (Figure S1). Additionally, all PCR products were sequenced to confirm that the sequences obtained from the experimental strain matched those used to design the primers, and to verify the specificity of the primers (Data S1). Next, to determine the primer amplification efficiency (E) of the selected primer pairs, standard curves were constructed by plotting Cq values obtained from a 5-fold cDNA dilution series against log10-transformed cDNA quantities. The slopes of the linear regression lines were used to calculate amplification efficiency using the equation E = (10−1/slope − 1) × 100%. For each primer pair, the coefficients of determination (R2) were also derived from the corresponding regression analysis (Table 3, Figure S2).
qPCR was conducted using a CFX96 Real-Time PCR Detection System (Bio-Rad Laboratories, Hercules, CA, USA). A sample maximization strategy was applied [32], i.e., all biological samples within a dataset were analyzed simultaneously on the same plate, evaluating either one or two target genes per run depending on dataset size. All reactions were run in technical triplicate; each 12.5 µL reaction contained 2.5 µL of 5X qPCRmix-HS SYBR mix (PK147L, Evrogen, Moscow, Russia), 400 nM of both forward and reverse primer (0.25 µL of a 10 μM solution each), 2.5 µL of cDNA solution (corresponding to the cDNA reverse-transcribed from 5 ng of RNA), and 7 µL of deionized nuclease-free water. Each assay included no-template control (NTC) reactions, for which Cq values were either above 35 cycles or undetectable (Table S2). Additionally, no-reverse transcriptase (no-RT) controls were included in Dataset 2 assays, prepared from two randomly selected RNA samples by omitting reverse transcriptase during cDNA synthesis. No amplification signal was detected in any no-RT control. Although no-RT controls were not prepared during the initial work on Dataset 1, the application of identical RNA extraction and DNase digestion protocols across all samples and the negative results obtained for Dataset 2 provides high confidence that residual gDNA contamination was negligible throughout the study. Thermocycling included 95.0 °C for 5 min, followed by 40 cycles of 95 °C for 15 s, 62 °C for 30 s, and 70 °C for 30 s, immediately succeeded by a melting curve analysis to confirm amplification specificity: the samples were heated from 60 °C to 95.5 °C with increments of 0.5 °C every 15 s. The analysis revealed a single melting peak for each tested amplicon (Figures S3 and S4), indicating specific amplification of the target product. Raw Cq data, presented as the mean of technical replicates for biological samples and individual replicate values for NTC and no-RT reactions, are provided in Table S2.
2.5. Assessment of Expression Stability of the Candidate Reference Genes
To identify the most stable endogenous controls for data normalization, the expression stability of eight candidate reference genes was evaluated separately for each dataset. The analysis of Dataset 1 included 16 biological samples representing the control and four experimental stress treatments (low_T, hyper_OS, hypo_OS, and Cu), whereas the analysis of Dataset 2 included 12 samples, corresponding to the high-temperature treatment (high_T) and two control conditions (C_light and C_dark). All steps of data processing were performed in R v.4.6.0 [33], utilizing the tidyverse v.2.0.0 framework [34]. The comprehensive validation was executed using three independent mathematical algorithms: BestKeeper [24], geNorm [22], and NormFinder [23].
The BestKeeper algorithm calculates the standard deviation and coefficient of variation from the input Cq values, with lower values indicating greater expression stability. These calculations were performed using the ctrlGene package v.1.0.1 [35]. The statistic labelled SD [±CP] by ctrlGene is calculated as the mean absolute deviation from the arithmetic mean (MAD), rather than the conventional sample standard deviation. This distinction between the BestKeeper Excel implementation, which uses the AVEDEV function, and conventional standard deviation calculations has also been reported previously (e.g., [36]). To distinguish these metrics, we refer to the AVEDEV-based statistic reported by BestKeeper as BestKeeper SD and to the conventional sample standard deviation as SD. We refer to the coefficient of variation derived from the BestKeeper SD as BestKeeper CV. Candidate genes with a BestKeeper SD > 1.0 were considered unstable.
The geNorm and NormFinder algorithms were executed via the RQdeltaCT package v.1.3.3 [37]. The geNorm calculates the gene stability measure (M) for each tested gene, and then iteratively excludes the least stable genes exhibiting the highest M-value. A new M-value is repeatedly calculated until a pair of genes with the lowest M is obtained. This algorithm also determines the optimal number of reference genes required for accurate normalization by evaluating the pairwise variation (Vn/n+1) between normalization factors. To verify the robustness of pairwise variation estimations against small sample size artifacts, an exhaustive leave-2-out jackknife analysis was conducted using custom R scripts separately for each dataset. For Dataset 1 (N = 16), all 120 possible unique subsamples of size N = 14 were analyzed. For Dataset 2 (N = 12), all 66 possible unique subsamples of size N = 10 were analyzed. These subsamples were used to calculate the empirical distributions and 95% confidence intervals for each Vn/n+1 value.
NormFinder is an ANOVA-based algorithm that calculates the expression stability value (SV) of a given gene by combining its minimal inter- and intra-group expression variation. The gene exhibiting the lowest SV is considered the most stable.
Finally, to combine the results of the three tests and generate a consensus reference gene ranking, a rank aggregation method based on a Monte Carlo cross-entropy algorithm was implemented using the RankAggreg package v.0.6.5 [38] with default settings and the following parameters: method = “CE”, distance = “Spearman”, convIn = 7, seed = 100.
2.6. Validation of Selected Reference Genes
To assess the impact of reference gene selection on the detection of target gene expression changes, target gene expression levels were normalized separately using either the two most stable reference genes (optimal normalization strategy) or the two least stable reference genes (suboptimal normalization strategy) identified within each dataset. Normalization was performed using the RQdeltaCT package v.1.3.3 [37].
The resulting ΔCq values were analyzed using separate linear models for each target gene and normalization strategy. Each model included Group and Series as categorical fixed effects. Group represented sample type (five levels in Dataset 1 and three levels in Dataset 2), whereas Series represented the experimental series (five levels in Dataset 1 and four levels in Dataset 2). Series was included as a blocking factor to account for systematic differences among experimental series, with samples within each series originating from the same culture.
Estimated marginal means (EMMs) were obtained using the emmeans package v.2.0.3 [39]. In Dataset 1, treatment groups were compared with the Control group using treatment-versus-control contrasts with Dunnett adjustment based on the multivariate t distribution (mvt). In Dataset 2, all pairwise comparisons among groups were performed using Tukey adjustment. This approach was selected for Dataset 2 to enable all required comparisons, including those of the high_T treatment with both types of controls, as well as between C_dark and C_light. Multiplicity-adjusted p-values were used for statistical inference, with the adjustment applied separately within each model. Residual normality was assessed visually using Q–Q plots. The significance threshold was set at α = 0.05.
The contribution of the experimental series (Series) was additionally assessed in each fitted model using partial F-tests, comparing the full model, which included both Group and Series as factors, with a reduced model containing Group only. This analysis was performed for all six target gene–normalization strategy models in Dataset 1 and both normalization strategy models in Dataset 2. The resulting p-values were adjusted for multiple testing across the eight models using the Holm method. The adjusted p-values were used to assess the overall contribution of Series at a significance level of α = 0.05.
3. Results
3.1. Cell Culture Growth and Mortality Test
Dinoflagellate cells at the exponential growth phase with a mean growth rate of 0.114 ± 0.006 day−1 were exposed to various short-term stressors (temperature, osmotic, chemical). These conditions were supposed to have an impact on cell physiology but did not result in high cell mortality. The mortality rate of cells ranged from 3.0% ± 0.02% in “Cu” treatment to 6.6% ± 0.03% in “hypo_OS” treatment (mean ± SE). Since incubation at 37 °C (“high_T”) for 4 h led to the death of the vast majority of cells, the treatment time was reduced to 1 h in Dataset 2 (mortality rate 5.8% ± 0.04%).
3.2. Expression Profile of Candidate Reference Genes
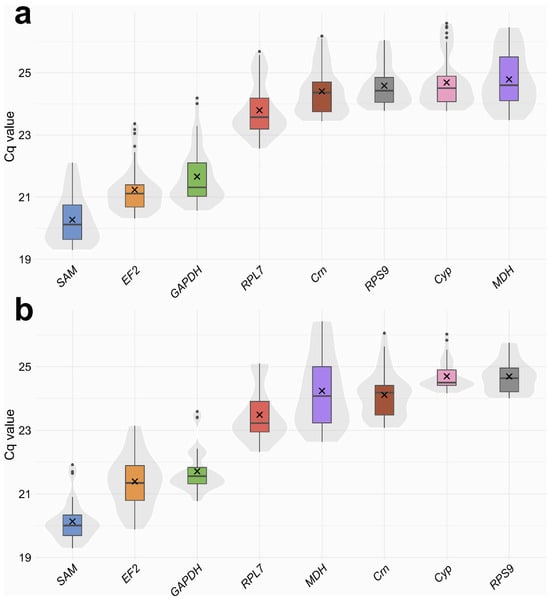
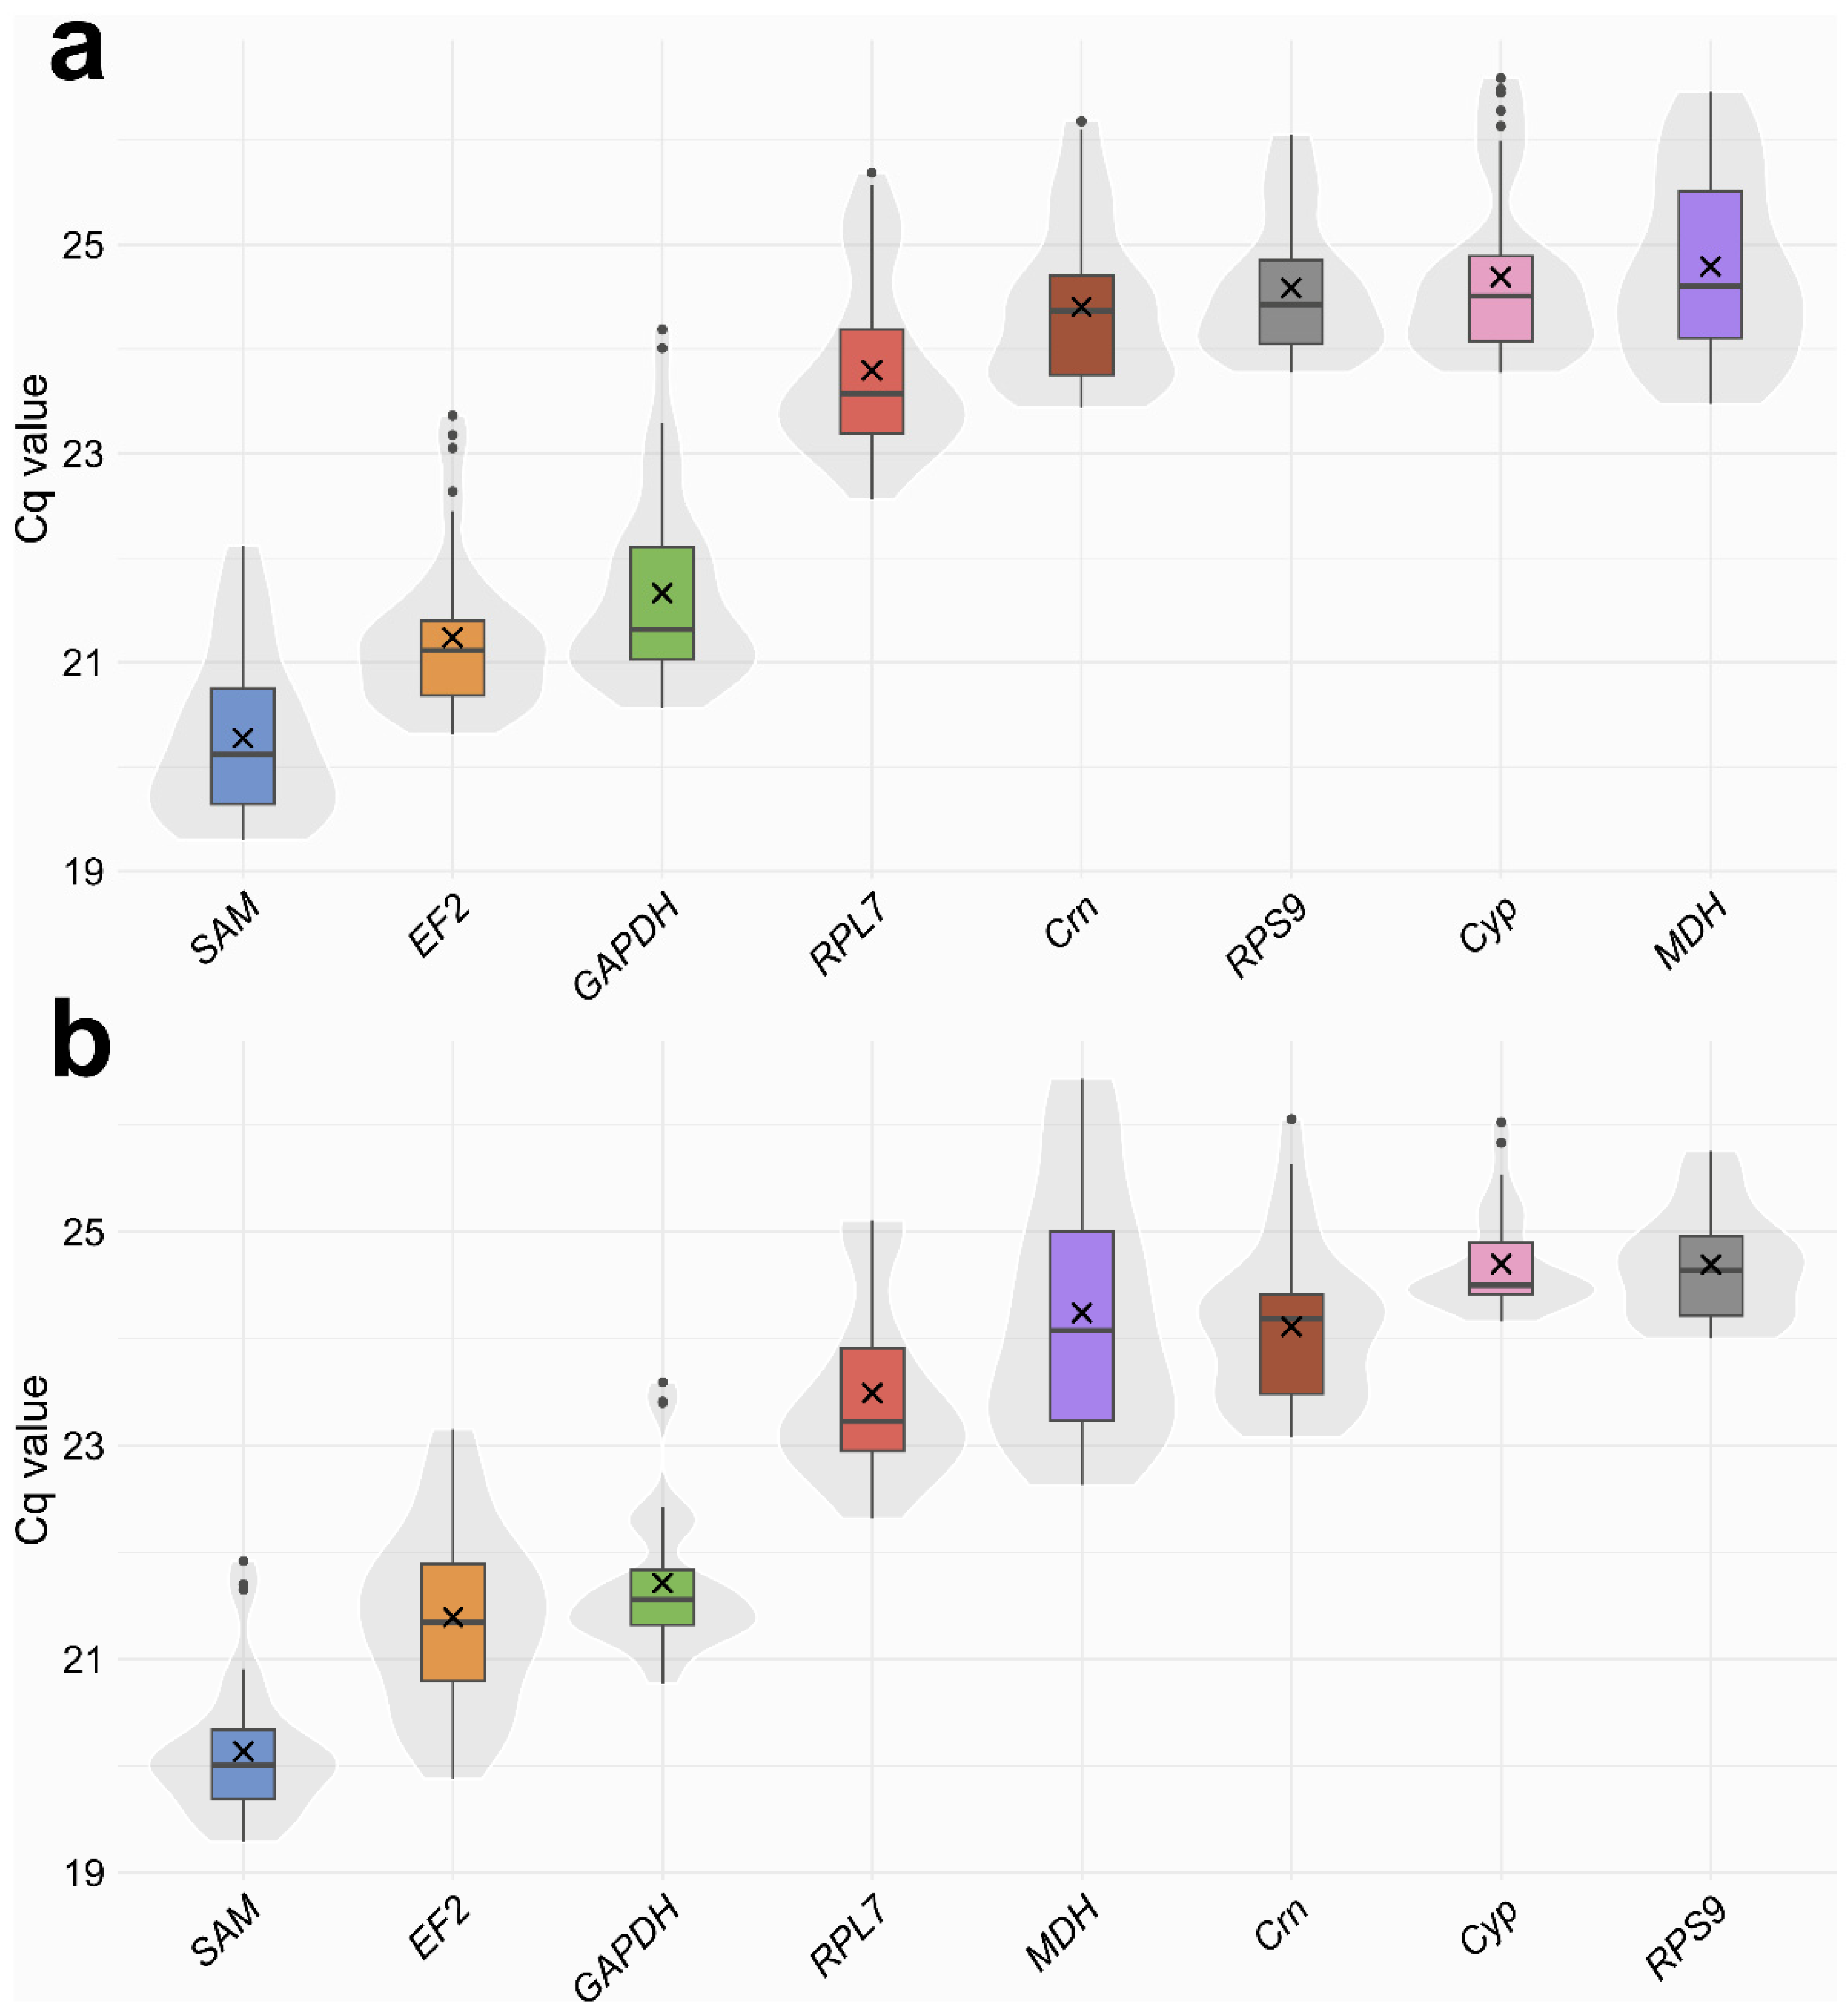
The overall expression levels and variability of the candidate reference genes across all experimental conditions were evaluated using raw individual technical replicate Cq values for both Dataset 1 (Figure 1a) and Dataset 2 (Figure 1b).
Figure 1.
Distribution of Cq values for the eight candidate reference genes pooled across experimental samples obtained using qPCR in Dataset 1 (a), and in Dataset 2 (b). Boxplots mark the median (horizontal line), mean (×), and 25th (lower) and 75th (upper) percentiles. The underlying violin plots depict the overall data density distribution for each candidate gene.
In Dataset 1, candidate genes were moderately to highly expressed, with mean Cq values ranging from 20.27 to 24.79. SAM exhibited the highest expression level (lowest Cq), with values ranging from 19.30 to 22.12 (mean 20.27 ± 0.79), followed by EF2 (mean 21.24 ± 0.74) and GAPDH (mean 21.66 ± 0.87). Conversely, MDH showed the lowest average expression level (mean 24.79 ± 0.88). Among all tested candidates in dataset 1, RPS9 displayed the narrowest Cq range (23.77–26.05, a difference of 2.28 cycles; SD = 0.65), whereas GAPDH had the widest overall Cq variation (20.56–24.19, a difference of 3.63 cycles; SD = 0.87).
In Dataset 2, mean Cq values spanned from 20.14 to 24.70. SAM showed the highest expression level (mean 20.14 ± 0.64, range 19.29–21.92), followed by EF2 (mean 21.39 ± 0.84) and GAPDH (mean 21.71 ± 0.67). Conversely, Cyp showed the lowest average expression level (mean 24.70 ± 0.47, range 24.16–26.03). RPS9 displayed the narrowest Cq range in this dataset (24.00–25.76, a difference of 1.76 cycles; SD = 0.51), while MDH exhibited the widest overall Cq variation (22.63–26.44, a difference of 3.80 cycles; SD = 1.14).
Overall, the observed Cq variations in the candidate reference genes across all samples were within a suitable range for qPCR normalization, allowing for further analysis of expression stability.
3.3. Expression Stability of Candidate Reference Genes
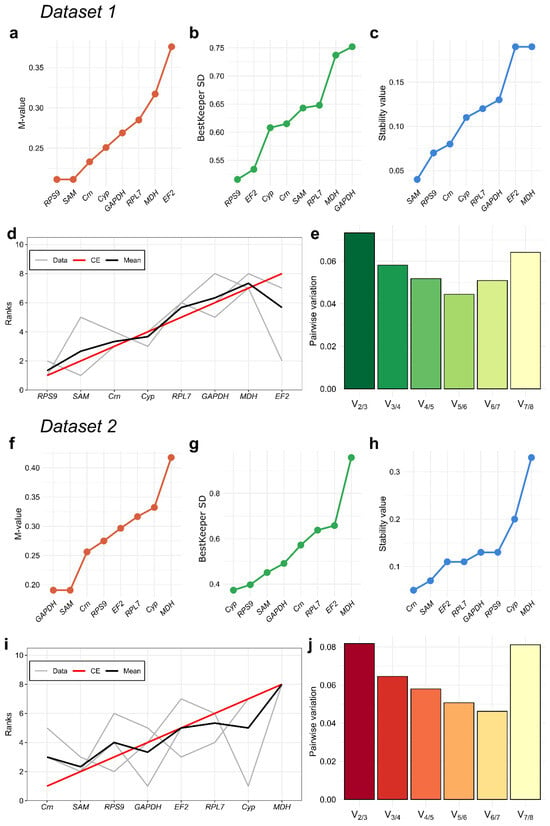
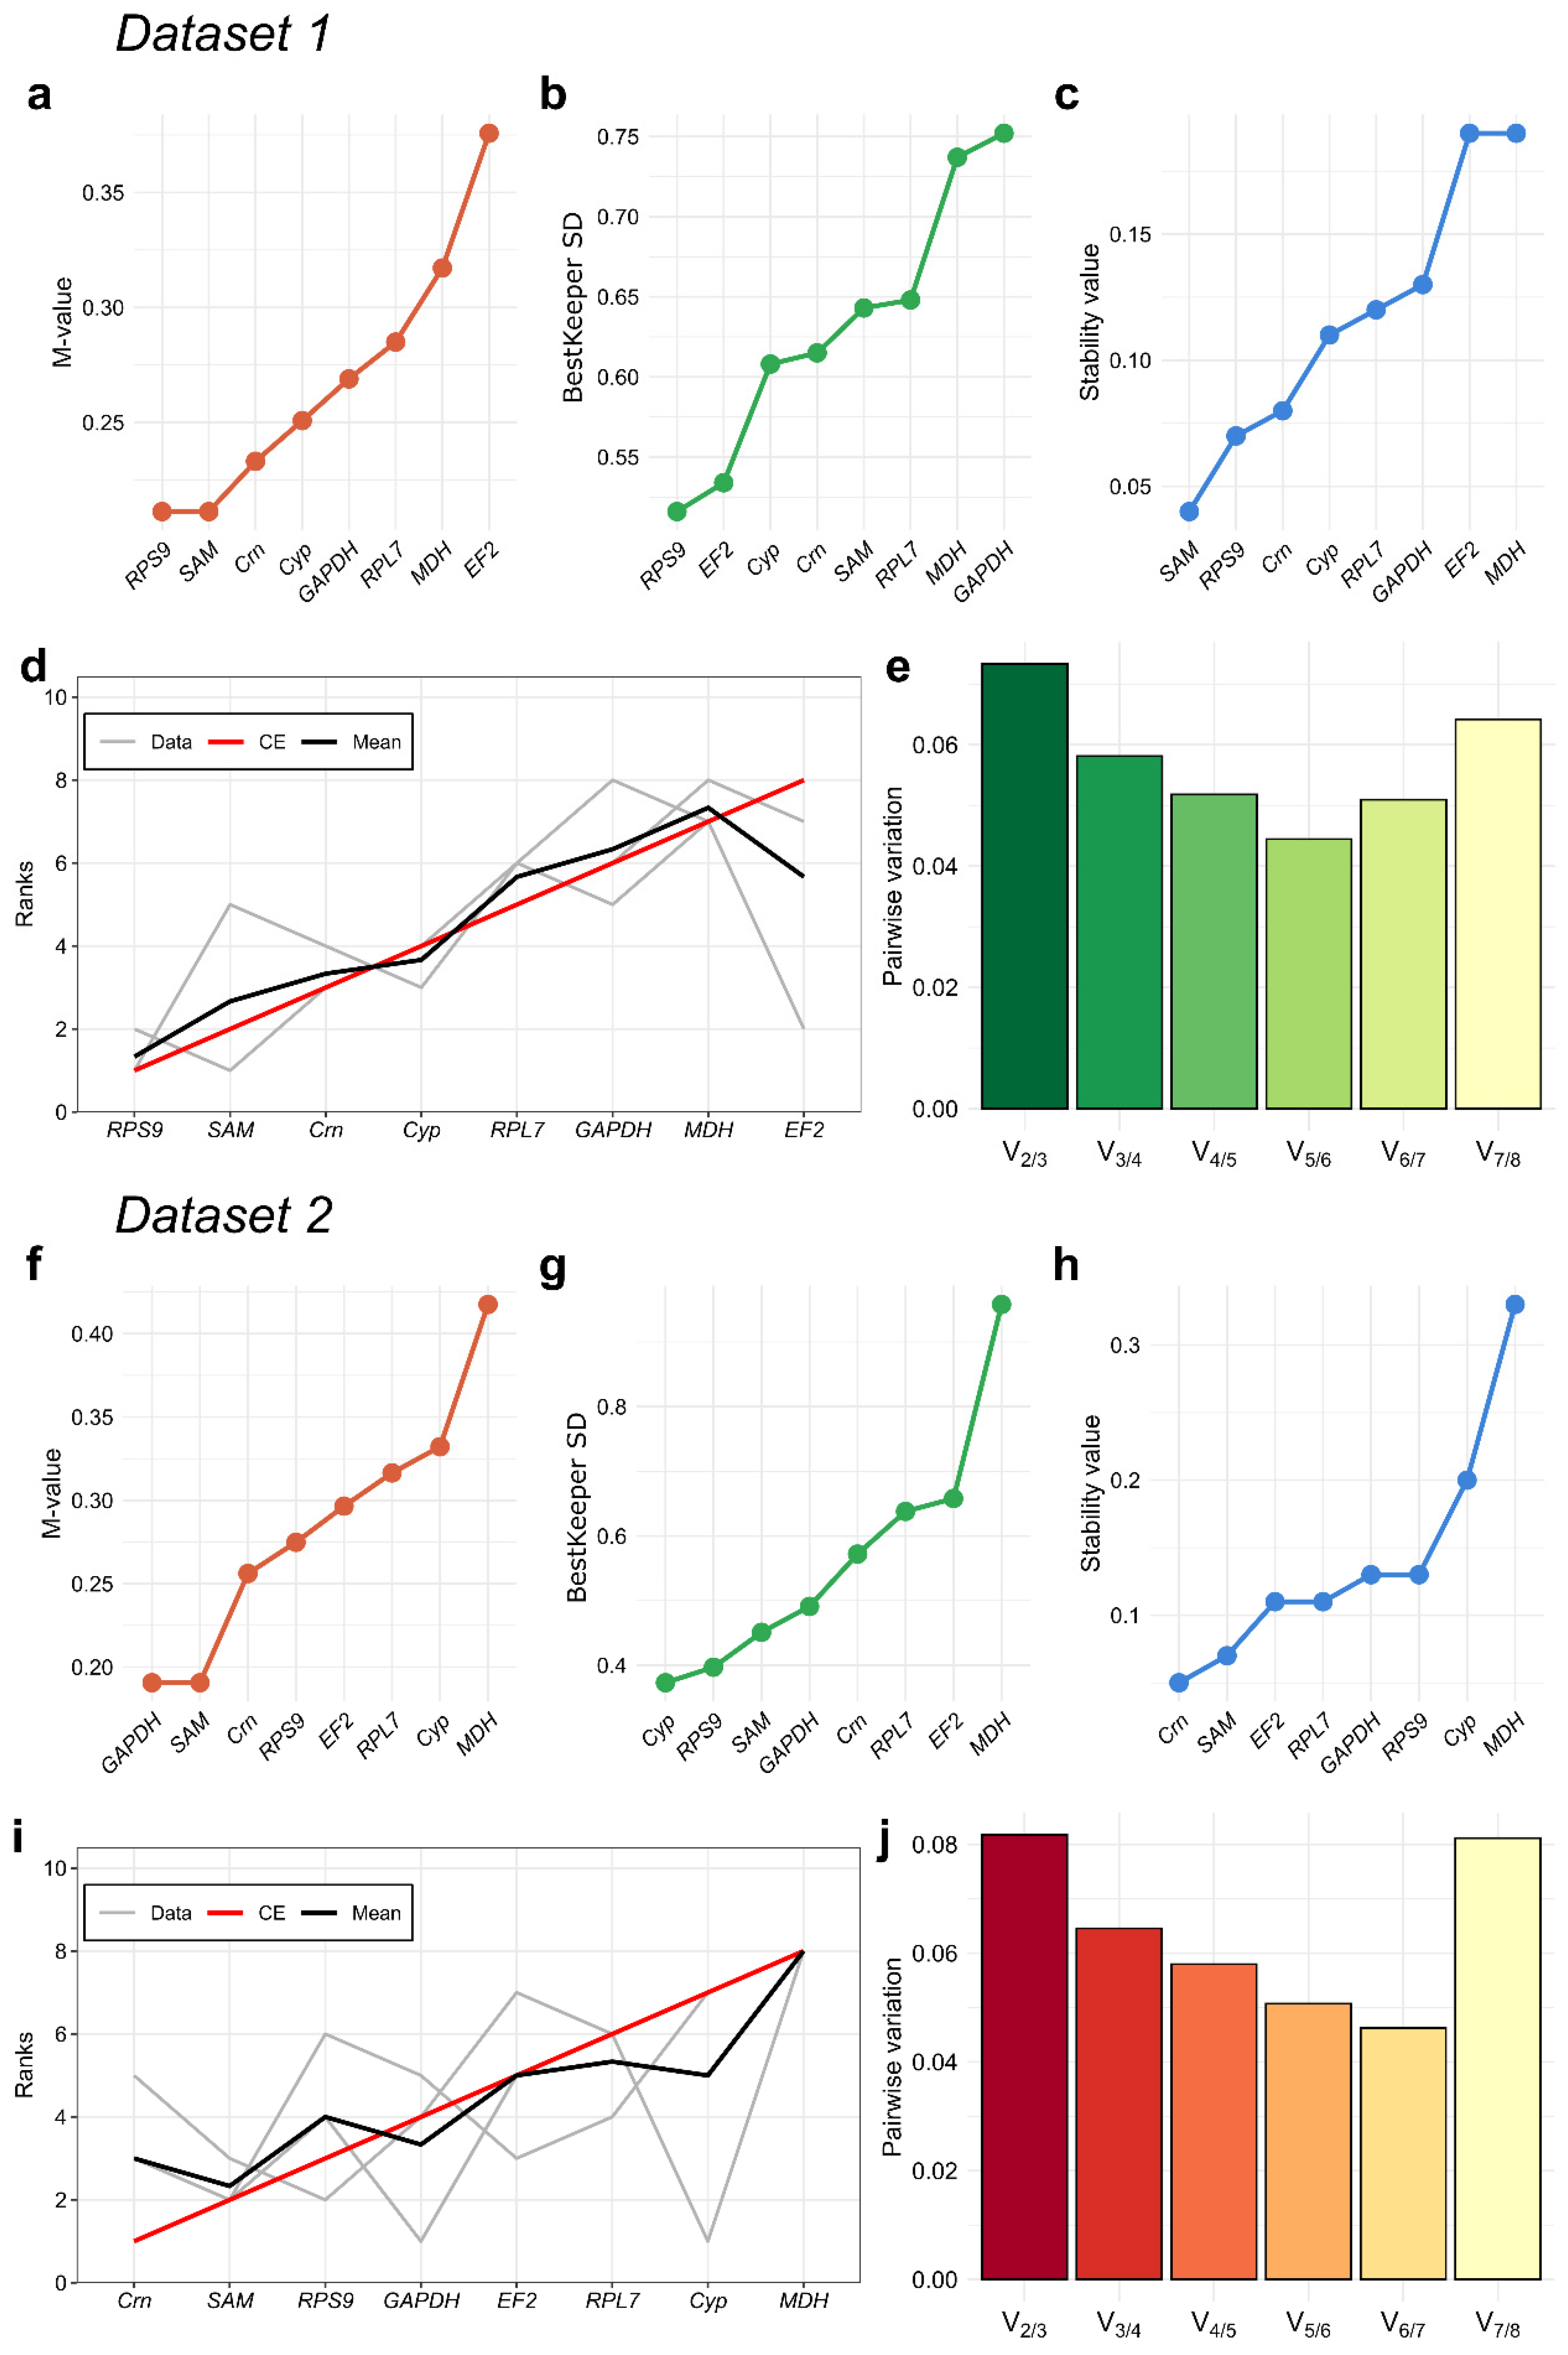
The expression stability of the eight candidate reference genes was evaluated separately for Dataset 1 and Dataset 2 using three complementary algorithms: geNorm, BestKeeper, and NormFinder. The results were subsequently integrated using the Monte Carlo Cross-Entropy (CE) rank aggregation algorithm to obtain a consensus ranking for each dataset (Figure 2).
Figure 2.
Expression stability rankings of candidate reference genes and determination of the optimal number of reference genes for Dataset 1 (a–e) and Dataset 2 (f–j). Expression stability was assessed using geNorm (a,f) BestKeeper (b,g), and NormFinder (c,h). (d,i) Consensus rankings generated using the Monte Carlo Cross-Entropy (CE) algorithm by aggregating the rankings obtained from geNorm, BestKeeper, and NormFinder. Grey lines represent the rankings from individual algorithms, the red line represents the CE-based ranking, and the black line indicates the mean rank. (e,j) geNorm pairwise variation analysis showing successive Vn/n+1 values used to determine the optimal number of reference genes required for reliable normalization relative to the standard threshold of 0.15.
The geNorm algorithm evaluates expression stability using the average pairwise variation (M) of each candidate gene relative to the other candidates, with lower M-values indicating greater stability (Figure 2a,f). In Dataset 1, RPS9 and SAM had the lowest M-value (0.211), followed by Crn (0.233) and Cyp (0.251). EF2 had the highest M-value (0.376), followed by MDH (0.317). In Dataset 2, GAPDH and SAM shared the lowest M-value (0.191), followed by Crn (0.256) and RPS9 (0.275). MDH had the highest M-value (0.417). All candidate genes in both datasets had M-values below the commonly used geNorm threshold of 1.5, indicating relatively stable expression across the respective experimental conditions.
BestKeeper assesses gene expression stability by calculating the BestKeeper standard deviation (BestKeeper SD) and coefficient of variation (BestKeeper CV) of Cq values (Figure 2b,g; Table 4). Candidates with lower BestKeeper SD and BestKeeper CV are more stable; genes with a BestKeeper SD > 1.0 should be excluded from further consideration. In Dataset 1, RPS9 showed the lowest BestKeeper SD (0.516) and BestKeeper CV (2.097%), whereas GAPDH showed the highest values (0.752 and 3.459%, respectively). In Dataset 2, Cyp had the lowest BestKeeper SD (0.373) and BestKeeper CV (1.507%), while MDH had the highest values (0.958 and 3.954%, respectively). All eight candidate genes in both datasets met the predefined stability criterion of BestKeeper SD ≤ 1.0.
Table 4.
Stability values of candidate reference genes as determined by BestKeeper in Dataset 1 and Dataset 2. BestKeeper SD represents the mean absolute deviation from the arithmetic mean, as calculated by the ctrlGene package, rather than the conventional sample standard deviation.
NormFinder is an ANOVA-based algorithm that estimates the expression stability value (SV) of each candidate gene by accounting for both intra- and inter-group expression variation. Lower SVs indicate greater expression stability. NormFinder rankings also differed between the datasets (Figure 2c,h). In Dataset 1, SAM had the lowest stability value (SV = 0.04), followed by RPS9 (0.07), Crn (0.08), and Cyp (0.11). EF2 and MDH had the highest SVs (0.19 each). In Dataset 2, Crn was the most stable gene (SV = 0.05), followed by SAM (0.07). EF2 and RPL7 had SVs of 0.11, while MDH showed the highest SV (0.33).
To integrate the results of the three algorithms, a consensus ranking was generated using the Monte Carlo Cross-Entropy method (Figure 2d,i). In Dataset 1, RPS9 ranked first, followed by SAM, Crn, Cyp, RPL7, GAPDH, MDH, and EF2. In Dataset 2, Crn ranked first, followed by SAM, RPS9, GAPDH, EF2, RPL7, Cyp, and MDH. Thus, RPS9 and SAM were the two highest-ranked candidate reference genes in Dataset 1, whereas Crn and SAM ranked highest in Dataset 2. The different rankings indicate that the relative suitability of individual reference genes depends on the experimental conditions represented by each dataset.
The optimal number of reference genes was evaluated using the geNorm pairwise variation measure (Vn/n+1), with the genes ordered according to their respective consensus rankings (Figure 2e,j). In the complete datasets, the V2/3 values were 0.073 for Dataset 1 and 0.082 for Dataset 2, both below the commonly used threshold of 0.15. To assess the robustness of these estimates to sample-size effects, an exhaustive leave-2-out jackknife analysis was performed. For Dataset 1, all 120 possible subsamples of 14 out of 16 biological samples were evaluated. The mean V2/3 across these subsamples was 0.073 (95% CI: 0.061–0.079), with a maximum of 0.079. For Dataset 2, all 66 possible subsamples of 10 out of 12 biological samples were evaluated; the mean V2/3 was 0.081 (95% CI: 0.049–0.090), with a maximum of 0.090. All evaluated Vn/n+1 values remained below 0.15 across the jackknife subsamples (Table S3). These results support the use of two reference genes for normalization in each dataset: RPS9 and SAM for Dataset 1, and Crn and SAM for Dataset 2.
3.4. Validation of Reference Genes via Target Gene Expression Profiling
To further validate the selected reference genes, we examined the expression of three target genes (Mei2_s3929, Phkg2, and Hydr) in Dataset 1 and of Mei2_s3929 in Dataset 2 using the optimal and suboptimal normalization strategies identified independently for each dataset. In Dataset 1, expression levels were normalized using RPS9 + SAM (optimal) or EF2 + MDH (suboptimal), whereas in Dataset 2, the corresponding combinations were Crn + SAM and Cyp + MDH, respectively. The resulting ΔCq values were analyzed using separate linear models that included Group and Series as fixed effects (Table S4). Treatment-versus-Control contrasts with Dunnett adjustment were used for Dataset 1 (Table 5), and Tukey-adjusted pairwise comparisons were used for Dataset 2 (Table 6).
Table 5.
Dunnett-adjusted treatment-versus-Control contrasts for target gene expression in Dataset 1, under optimal and suboptimal normalization. Contrasts were calculated from separate linear models for Mei2_s3929, Phkg2, and Hydr. Dunnett adjustment was implemented using the multivariate t distribution (adjust = ‘mvt’). The adjustment was applied to the four treatment-versus-Control contrasts separately within each target gene by normalization model. Estimates are treatment minus Control, and intervals are simultaneous 95% confidence intervals of estimates. Bold indicates adjusted p < 0.05.
Table 6.
Tukey-adjusted pairwise comparisons of Mei2_s3929 expression among groups in Dataset 2, under optimal and suboptimal normalization. All pairwise contrasts were calculated separately within each normalization model using Tukey adjustment. The adjustment was applied to the three pairwise comparisons within each model. Estimates are the first-listed group minus the second-listed group, and intervals are simultaneous 95% confidence intervals of estimates. Bold indicates adjusted p < 0.05.
Mei2_s3929 is a gene belonging to the PCOR1329_LOCUS49414 locus in the GCA_963575745.1 genome assembly (CDS Pcordatum_s3929_g43962) and encoding the protein sequence CAK0860443.1, which contains the RNA-recognition motif 3 (RRM3) domain and is identified as a homolog of MEI2. We selected this gene as one from a large pool of Mei2-like genes that may be associated with the stressor-induced response [30]. The Phkg2 gene corresponds to the PCOR1329_LOCUS42723 locus (CDS Pcordatum_s3168_g39010) and codes for CAK0850290.1, a serine/threonine protein kinase. Hydr belongs the PCOR1329_LOCUS71934 locus (CDS Pcordatum_s7169_g59915) and encodes CAK0892216.1, a putative alpha/beta hydrolase containing nucleophilic site according to the conserved domain search. Phkg2 and Hydr were selected as among the genes downregulated in cold-induced temporary cysts in P. cordatum [29].
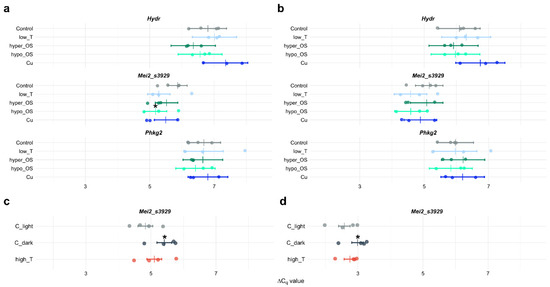
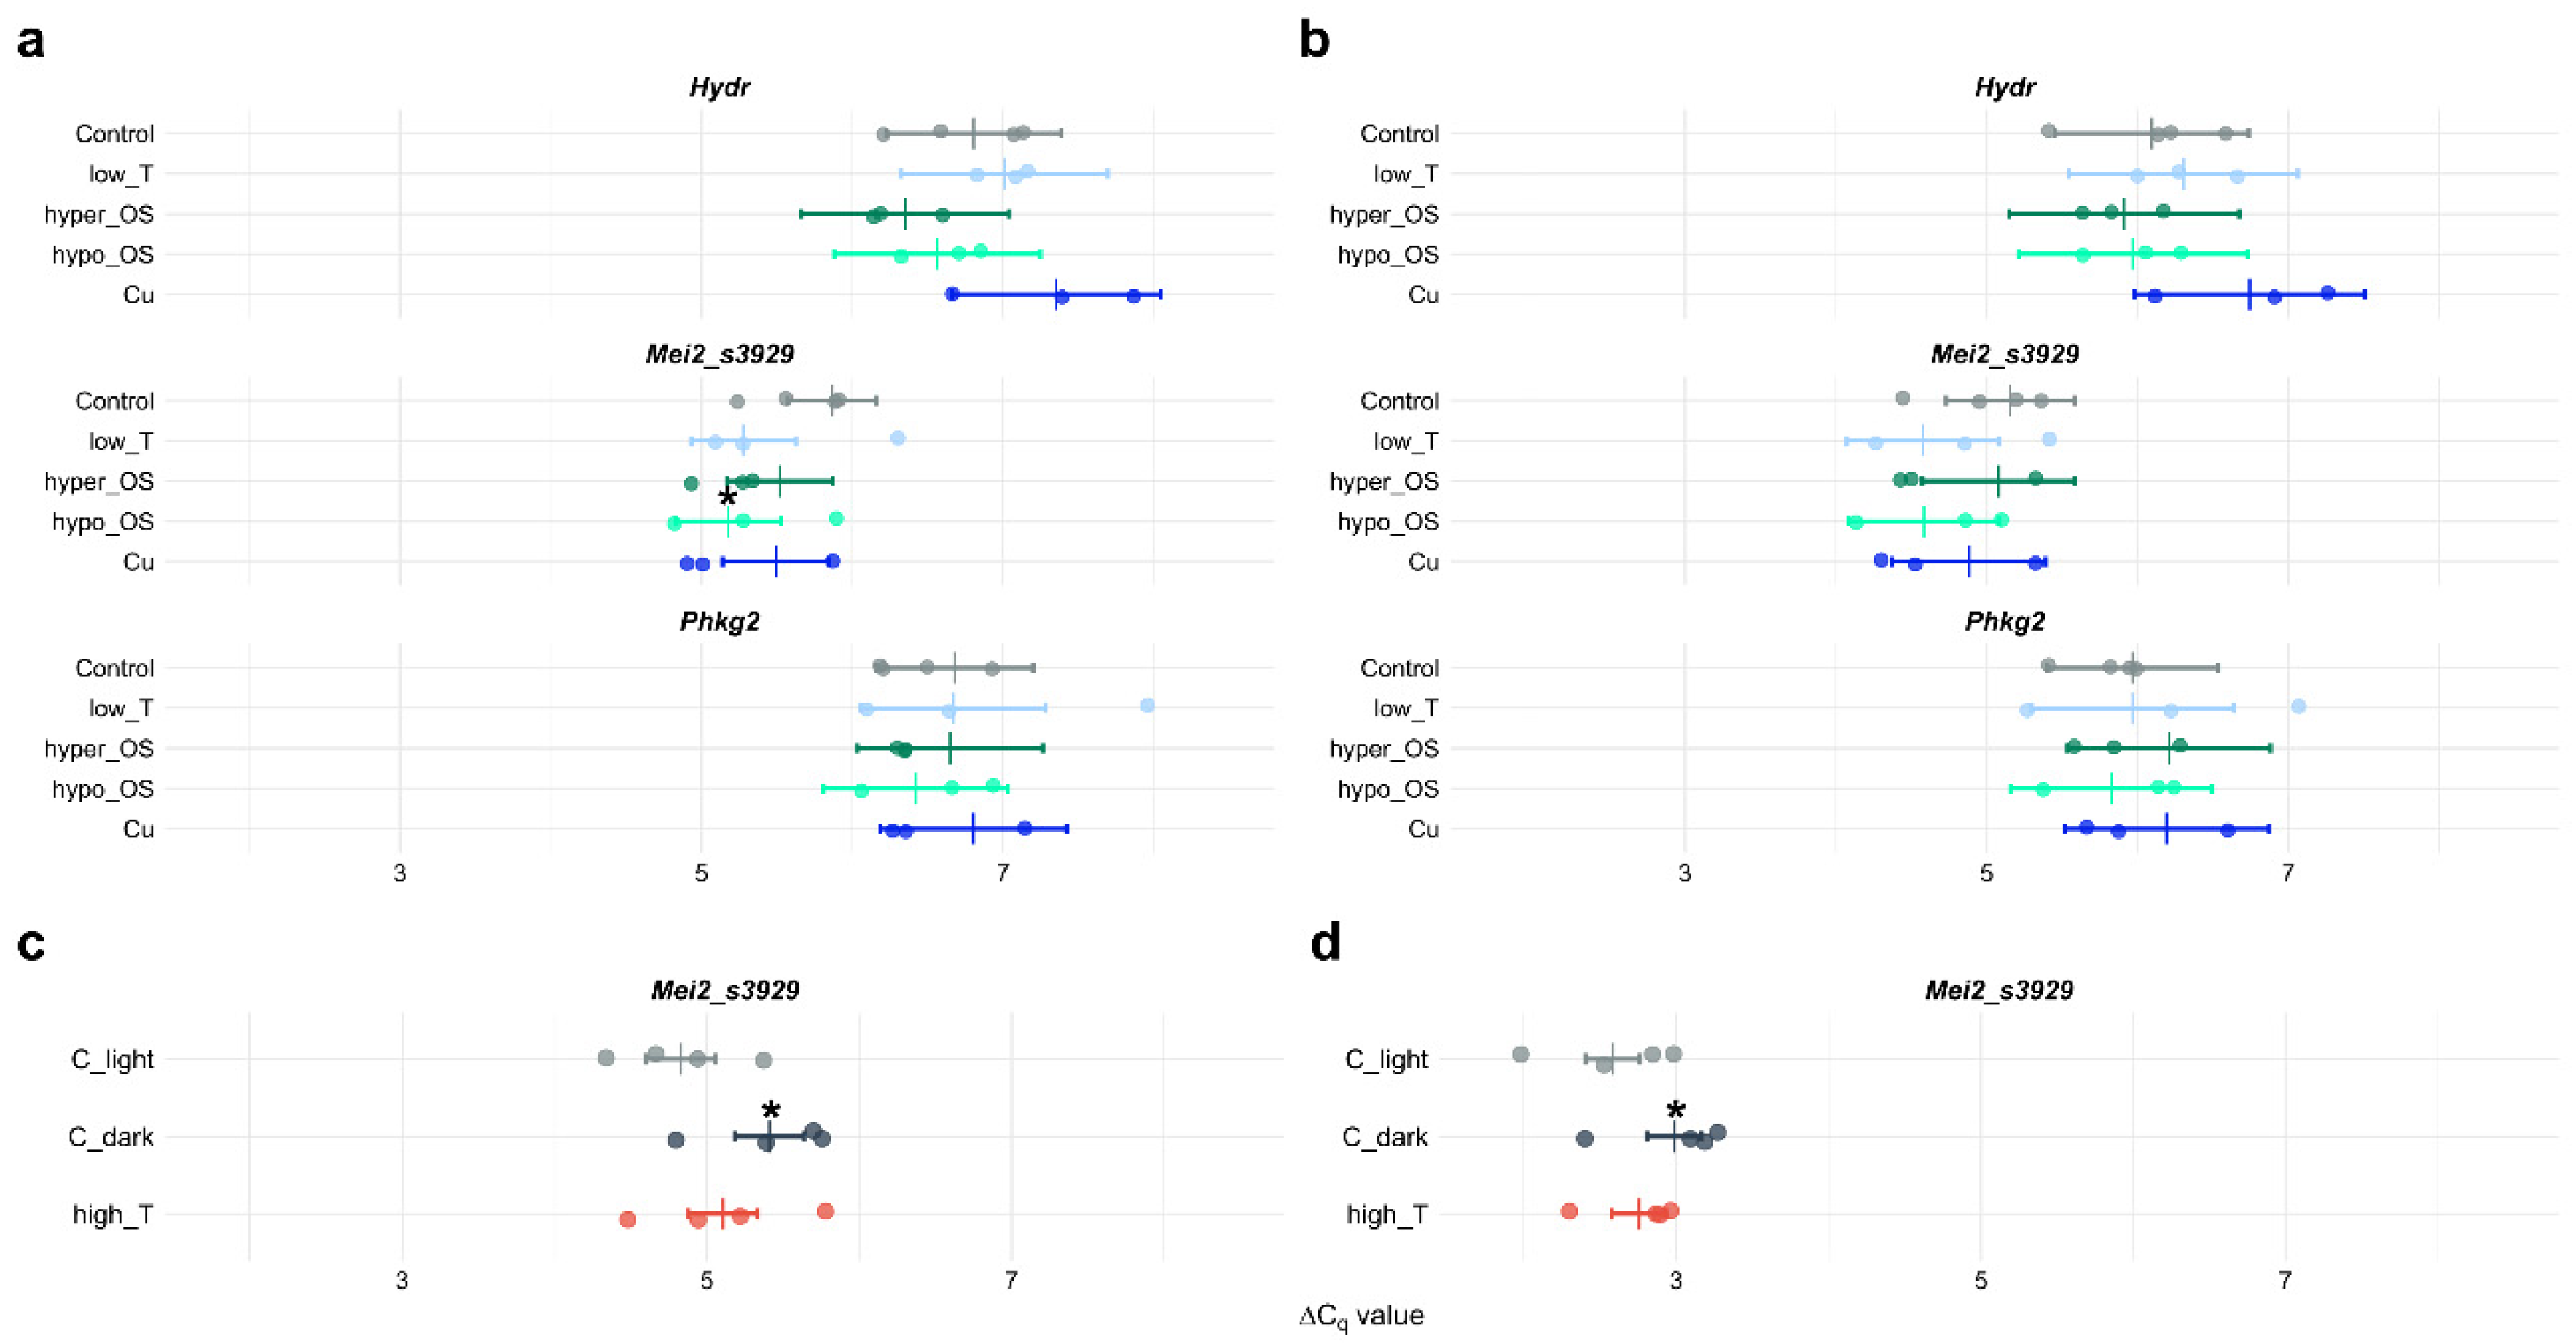
In Dataset 1, the response of Mei2_s3929 to hypo-osmotic stress depended on the normalization strategy (Figure 3a,b; Table 5). Under optimal normalization, the hypo_OS treatment showed a significant difference from the Control group (contrast estimate = −0.689 ΔCq units, Dunnett-adjusted p = 0.035), corresponding to an approximately 1.61-fold increase. Under suboptimal normalization, the corresponding estimate was also negative (−0.574 ΔCq units), but the difference was not statistically significant (adjusted p = 0.250). Thus, the response to hypo-osmotic stress was detected only under optimal normalization, illustrating a normalization-dependent change in detection. Comparisons with the Control group showed no statistically significant changes under copper and low temperature exposure or hyper-osmotic stress, regardless of the normalization strategy. The expression levels of Phkg2 and Hydr likewise did not differ significantly from the Control group under any tested condition with either reference gene combination (Figure 3a,b; Table 5).
Figure 3.
Expression profiles of target genes across experimental conditions. Panels (a,b) present expression levels of Hydr, Mei2_s3929, and Phkg2 from Dataset 1 normalized using the two most stable reference genes (RPS9 + SAM, (a)) and two least stable reference genes (EF2 + MDH, (b)). Panels (c,d) display expression profiles of Mei2_s3929 from Dataset 2 normalized using the optimal reference gene pair (Crn + SAM, (c)) and suboptimal reference gene pair (Cyp + MDH, (d)). Vertical markers denote estimated marginal means (EMMs) derived from linear models. Individual points represent ΔCq values for individual biological replicates, and horizontal bars indicate 95% confidence intervals. Asterisks denote statistically significant differences relative to the respective control group (p < 0.05; Dunnett’s test for Dataset 1, Tukey’s test for Dataset 2).
In Dataset 2, Mei2_s3929 expression differed significantly between the light-grown Control (C_light) and the dark Control (C_dark) under both normalization strategies (Figure 3c,d; Table 6). Under optimal normalization, the contrast estimate for C_light minus C_dark was −0.581 ΔCq units (Tukey-adjusted p = 0.011), corresponding to approximately 1.50-fold higher relative expression under C_light than under C_dark. Under suboptimal normalization, the difference remained significant (estimate = −0.404 ΔCq units, adjusted p = 0.019), corresponding to an approximately 1.32-fold higher relative expression under C_light. These results indicate that the lower relative expression associated with the exposure in dark was detectable irrespective of the normalization strategy.
By contrast, the high_T condition did not differ significantly from C_light under either normalization strategy (optimal: adjusted p = 0.170; suboptimal: adjusted p = 0.294). The direct comparison between C_dark and high_T was also not statistically significant (optimal: adjusted p = 0.128; suboptimal: adjusted p = 0.141).
The contribution of the Series factor was assessed by applying partial F-tests to each model. A significant overall Series effect was detected for Mei2_s3929 in Dataset 1 under optimal normalization (F4,7 = 9.12, p = 0.0066) and in Dataset 2 under both optimal and suboptimal normalization (F3,6 = 17.66, p = 0.0022 and F3,6 = 19.06, p = 0.0018, respectively). These effects remained significant after Holm correction across the eight model-level tests (Table S5). In contrast, no significant Series effect was detected for Phkg2 or Hydr in Dataset 1.
4. Discussion
Accurate assessment of target gene expression in qPCR assays depends fundamentally on the choice of stably expressed reference genes for data normalization [1,3]. In this study, we evaluated the performance of eight candidate reference genes in the dinoflagellate Prorocentrum cordatum exposed to short-term osmotic, thermal, and chemical stressors. Below, we discuss the specific outcomes of our research in the broader context of dinoflagellate qPCR studies.
To select candidate endogenous controls for further assessment in P. cordatum, we reviewed earlier research on the validation of reference genes for qPCR in dinoflagellates. Quite expectedly, the sets of genes featured in previously published works partially overlapped (Table S1). The most frequently evaluated candidates included classical eukaryotic housekeeping genes, such as those coding for tubulins, actin, glyceraldehyde-3-phosphate dehydrogenase (GAPDH), and the 18S ribosomal RNA (Table S1). Among other candidates were genes encoding proteins involved in translation and basic cellular metabolism, such as eukaryotic initiation factor 4E (eIF4E), S-adenosyl methionine synthetase (SAM), malate dehydrogenase (MDH), and cyclophilin (Cyp, Table S1). At the same time, it is noteworthy that the suitability of these genes appears to be strongly context-dependent. For example, the alpha-tubulin gene (TUA) and eIF4E were identified as stable across several short-term salinity, temperature, and nutrient treatments in Karenia mikimotoi, whereas other candidates, including GAPDH and MDH, showed condition-specific stability [18]. GAPDH and MDH, as well as TUA in most of the cases examined, could be considered among the most stable and effective reference genes during short-term exposure to stressors [11,12,13,14,18]. By contrast, the expression stability of eIF4E and, for example, the cyclophilin gene varied across experimental conditions (Table S1). In studies involving prolonged nutrient limitation or other long-term treatments, identifying universal reference genes is even more difficult. With some assumption, potentially stable candidates include, again, GAPDH and tubulins genes, or PCNA, coding for proliferating cell nuclear antigen [10,13,17]. Nevertheless, different combinations of endogenous controls have been employed for different species and treatments (Table S1), meaning that reference gene stability cannot be reliably extrapolated across experimental conditions and taxa [2,3].
Thus, the resulting pool of genes selected for further assessment of expression stability in our research included GAPDH, MDH, Cyp, SAM, EF2 (elongation factor 2 gene), as well as genes encoding large ribosomal subunit protein L7 (RPL7), small ribosomal subunit protein S9 (RPS9), and coronin (Crn). Unlike the 18S rRNA gene, ribosomal protein genes have rarely been used in similar studies on dinoflagellates (see Rp-S4 only in Table S1). Nevertheless, genes coding for various ribosomal proteins, for example, RPL32 or RPL17, have been validated as internal controls in studies of other algae, including chlorophytes and various heterokontophytes (e.g., [40,41,42,43]). We therefore expanded our candidate set by including such genes to increase the functional diversity among the controls tested.
Using genes that encode proteins involved in different intracellular processes and metabolic pathways may reduce the likelihood of co-regulation and thereby potentially improve accuracy of expression analysis [22,25]. Moreover, we have also chosen the gene coding for coronin, an actin-binding protein that participates in the regulation of actin dynamics, vesicular trafficking, and cytokinesis [44]. To the best of our knowledge, no other studies have defined coronin as a standard or validated reference gene for qPCR normalization in algae or other organisms. In dinoflagellates, coronin homologs have been identified ([45]; Table S3 in [31]), but specific functions of coronin have not been examined. For example, it was not listed among the differentially expressed genes in Prorocentrum shikokuense under nitrogen deficiency, although upregulation of genes encoded proteins involved in endocytosis and phagocytosis occurred [46]. On the one hand, the expression of coronin, as one of the conserved and important cytoskeleton regulators, can remain stable in cells irrespective of external triggers—at least those examined in the present study. On the other hand, it may be modulated at the post-transcriptional or translational level, which has been shown to be characteristic of dinoflagellate gene expression (reviewed in [47]). Thus, we propose coronin as a novel possible reference gene, but its suitability must be validated in other species and under fundamentally different experimental designs.
Next, three widely accepted methods—geNorm [22], NormFinder [23], and BestKeeper [24]—were employed to evaluate the expression stability of the chosen candidates. For Dataset 1, the rankings generated by geNorm and NormFinder were highly congruent, whereas the results obtained with BestKeeper differed notably. Both geNorm and NormFinder identified RPS9 and SAM as the most stable endogenous controls. BestKeeper also ranked RPS9 as the most stable candidate, but placed SAM fifth (Figure 2b). In Dataset 2, both geNorm and NormFinder ranked SAM among the two most stable candidates, although the other top-ranked gene differed between the algorithms. In contrast, BestKeeper identified Cyp and RPS9 as the most stable endogenous controls (Figure 2g).
Similar discrepancies among reference gene stability rankings have been reported in various organisms, including dinoflagellates (e.g., [15,18]), and are not unexpected because the three algorithms use different mathematical frameworks, as discussed previously (e.g., [48]). Nevertheless, SAM consistently ranked among the most stable candidates in both datasets, supporting its suitability as a reference gene for the short-term stress conditions examined in P. cordatum. The consensus ranking identified RPS9 and SAM for Dataset 1 and Crn and SAM for Dataset 2 as the most reliable reference pairs, whereas MDH, and, depending on the dataset, EF2 or Cyp were the least stable. Notably, SAM also exhibited the most stable expression in Symbiodinium dinoflagellate cells subjected to short-term thermal and light stress, but along with the cyclophilin gene [11].
It is worth mentioning that SAM, RPS9, and Crn showed different expression levels. The mean Cq values for SAM were 20.27 and 20.13 in Dataset 1 and 2, respectively, compared with 24.58 for RPS9 in Dataset 1 and 24.11 for Crn in Dataset 2. Thus, the use of these pairs of genes for normalization may reduce the influence of abundance-specific technical variation [1].
Comparing our results with the only previous study in P. cordatum highlights the importance of accurate selection and validation of candidate reference genes. Specifically, Guo and Ki [12] examined thermal and chemical stressors, albeit over a fairly broad range of temperatures and concentrations, with exposures lasting 12, 24, or 48 h. As a result, TUA and MDH were determined as the most stable candidates, followed by GAPDH. Thus, even within a single species of microalgae, i.e., a unicellular organism lacking specialized tissues, the choice of potential reference genes is not universal. These observations support the view that reference genes for qPCR in dinoflagellates should be validated empirically for each species and experimental design rather than selected solely on the basis of their conventional use as endogenous controls.
Besides different experimental designs, our study and that of Guo and Ki [12] also diverge in methodology. Guo and Ki relied only on geNorm and did not validate the selected genes by analyzing the expression of target genes, whereas we compared candidate stability using geNorm, NormFinder, and BestKeeper and integrated these results using Monte Carlo Cross-Entropy rank aggregation. We additionally evaluated the practical consequences of reference gene choice by normalizing target genes with either the two highest- or the two lowest-ranked candidates. Our experiment was restricted to short-term treatments of cells harvested during exponential growth; consequently, it covered a narrower physiological range than studies incorporating multiple growth phases, prolonged treatments, or diel cycles. Moreover, all of the tested reference genes exhibited rather high expression stability, as all of them met the applied stability criteria. Despite these circumstances, in Dataset 1, the hypo-osmotic response of Mei2_s3929 was statistically significant when expression was normalized to the optimal reference pair (RPS9 + SAM), but not when the suboptimal pair (EF2 + MDH) was used. In contrast, the C_light–C_dark difference in Dataset 2 remained significant under both normalization strategies (Crn + SAM and Cyp + MDH). Thus, the effect of reference gene selection on statistical detection was dependent on the target gene and experimental contrast rather than representing a uniform loss of sensitivity under suboptimal normalization. This outcome is consistent with qPCR studies showing that suboptimal reference genes can change whether inter-group differences reach statistical significance (e.g., [49]).
Among all target genes, only Mei2_s3929 showed sensitivity to the experimental conditions examined. In dinoflagellates, MEI2-like proteins appear to be associated with the transition to the sexual phase of the life cycle and with stressor-induced encystment, including cold-induced temporary cyst formation, as reported for Scrippsiella acuminata (syn. S. trochoidea) and P. cordatum [20,29,30,50]. However, the present data do not indicate changes in Mei2_s3929 expression under low-temperature conditions. Instead, its expression was upregulated under hypo-osmotic conditions in Dataset 1 and downregulated under dark conditions in Dataset 2 (control C_dark). Notably, no significant change in Mei2_s3929 expression was detected in the high_T treatment combining elevated temperature (37 °C) and darkness.
Interestingly, pellicle cyst formation in S. acuminata was induced under combined cold and darkness conditions [20]. Since these stressors were applied simultaneously, their individual contributions to the observed changes in gene expression could not be distinguished. Thus, the altered expression of some Mei2-like genes in S. acuminata may reflect a response to darkness rather than to low temperature, although a contribution of both stressors cannot be excluded. These observations highlight the complexity of the relationship between environmental conditions and Mei2-like gene expression and raise the possibility that MEI2-like proteins may have a broader range of functions extending beyond the regulation of life-cycle transitions. Nevertheless, a comprehensive analysis of Mei2-like gene expression patterns and the functional characterization of MEI2-like proteins in dinoflagellates are beyond the scope of the present study and would require a broader range of experimental conditions.
Neither Phkg2 nor Hydr showed significant changes in expression under the experimental conditions examined. Again, we refrain from drawing conclusions regarding the stability of their expression or their cellular functions based on the present experimental design. The primary aim of this study was to demonstrate the importance of using optimal validated reference genes for qPCR normalization and, more broadly, to highlight the critical need for thorough validation of candidate reference genes under the specific experimental conditions in which they are to be used.
Supplementary Materials
The following supporting information can be downloaded at: https://www.mdpi.com/article/10.3390/microorganisms14112573/s1, Figure S1. Agarose gel electrophoresis of PCR products amplified from cDNA template. The expected size of each amplicon (in bp) is indicated. The 100 bp Step100 DNA ladder (Biolabmix) was used as the molecular weight standard; the sizes (in bp) of the ladder bands are indicated. Figure S2. qPCR amplification efficiency curves generated from a 5-fold dilution series of cDNA. Log10-transformed cDNA quantities are plotted on the x-axis, and raw Cq values are plotted on the y-axis. Figure S3. Melting curves generated by all primer pairs used in Dataset 1. The analysis was conducted after cycle 40 by heating the samples from 60 °C to 95.5 °C with increments of 0.5 °C every 15 s. Figure S4. Melting curves generated by all primer pairs used in Dataset 2. The analysis was conducted after cycle 40 by heating the samples from 60 °C to 95.5 °C with increments of 0.5 °C every 15 s. Table S1. Studies on reference gene validation for qRT-PCR in dinoflagellates under different experimental conditions. Table S2. Raw Cq values obtained for all candidate reference genes and target genes across Dataset 1 and Dataset 2. For all biological and experimental sample groups, the values represent the mean Cq of technical replicates. For no template controls (NTC) and no reverse transcriptase (no-RT) controls, individual Cq values for each technical replicate are shown. Table S3. Leave-2-out jackknife analysis of geNorm pairwise variation (Vn/n+1) in Dataset 1 and Dataset 2. For Dataset 1, all 120 unique leave-2-out subsamples (14 of 16 samples) were evaluated; for Dataset 2, all 66 unique leave-2-out subsamples (10 of 12 samples) were evaluated. The table reports the mean, standard deviation (SD), median, empirical 95% confidence interval (2.5th–97.5th percentiles), and maximum of the pairwise-variation estimates across subsamples. Table S4. Fixed-effect coefficient estimates of the linear models used to evaluate target gene expression under optimal and suboptimal normalization. Coefficient p-values are unadjusted. Models included Group and Series as fixed effects. The intercept corresponds to the Control group in the reference Series. Table S5. Partial F-tests assessing the overall contribution of experimental series (Series) to the linear models of target gene expression in Dataset 1 and Dataset 2. Df denotes the numerator degrees of freedom for Series; the denominator degrees of freedom were 7 for Dataset 1 and 6 for Dataset 2. Partial F-tests compare the full model (Group + Series) with the reduced model (Group only). Unadjusted p-values and Holm-adjusted p-values across the eight model-level tests are reported. Bold indicates p (Holm) < 0.05. Data S1. Verification of primer specificity and sequence identity. A ZIP archive containing FASTA files with multiple sequence alignments for each gene included in the analysis. Each alignment includes the corresponding coding sequence (CDS) and two sequencing reads obtained by Sanger sequencing of PCR products amplified from cDNA of the experimental strain using the forward (“Forward”) and reverse (“Reverse”) primers. CDSs from the Prorocentrum cordatum genome assembly GCA_963575745.1, which was used for primer design, are provided for all genes except MDH, for which the partial CDS deposited in GenBank under accession number JF715161.1 by Guo and Ki [12] is used. For reads obtained using the reverse primer, reverse-complement sequences were generated (indicated by the “revcompl” label). Multiple sequence alignments were performed using Unipro UGENE software (version 53.0) with ClustalW (Crn, EF2, GAPDH, RPL7, RPS9, SAM, Hydr, MDH) or ClustalO (Cyp, Mei2_s3929, Phkg2) algorithm.
Author Contributions
Conceptualization, P.S. and M.B.; Methodology, P.S. and M.B.; Formal Analysis, P.S. and M.B.; Investigation, O.P., M.P., P.S. and M.B.; Data Curation, P.S. and O.P.; Writing—Original Draft Preparation, P.S., M.B. and O.P.; Writing—Review and Editing, P.S., M.B. and S.S.; Visualization, P.S. and O.P.; Project Administration, S.S.; Funding Acquisition, S.S. All authors have read and agreed to the published version of the manuscript.
Funding
This study was funded by the Russian Science Foundation, project # 22-14-00056-Π.
Institutional Review Board Statement
Not applicable.
Informed Consent Statement
Not applicable.
Data Availability Statement
The original contributions presented in this study are included in the article/Supplementary Materials. Further inquiries can be directed to the corresponding authors.
Acknowledgments
The authors sincerely thank Alexandra Kostina and Artem Kiselev for their assistance in mastering qPCR methods and for their kind consultations. Furthermore, the authors are grateful to Vadim Khaitov for his advice regarding statistical analysis.
Conflicts of Interest
The authors declare no conflicts of interest.
References
- Huggett, J.; Dheda, K.; Bustin, S.; Zumla, A. Real-Time RT-PCR Normalisation; Strategies and Considerations. Genes Immun. 2005, 6, 279–284. [Google Scholar] [CrossRef] [Scilit] [PubMed]
- Guénin, S.; Mauriat, M.; Pelloux, J.; Van Wuytswinkel, O.; Bellini, C.; Gutierrez, L. Normalization of qRT-PCR Data: The Necessity of Adopting a Systematic, Experimental Conditions-Specific, Validation of References. J. Exp. Bot. 2009, 60, 487–493. [Google Scholar] [CrossRef] [Scilit] [PubMed]
- Bustin, S.A.; Ruijter, J.M.; van den Hoff, M.J.B.; Kubista, M.; Pfaffl, M.W.; Shipley, G.L.; Tran, N.; Rödiger, S.; Untergasser, A.; Mueller, R.; et al. MIQE 2.0: Revision of the Minimum Information for Publication of Quantitative Real-Time PCR Experiments Guidelines. Clin. Chem. 2025, 71, 634–651. [Google Scholar] [CrossRef] [Scilit] [PubMed]
- Bustin, S.A.; Benes, V.; Garson, J.A.; Hellemans, J.; Huggett, J.; Kubista, M.; Mueller, R.; Nolan, T.; Pfaffl, M.W.; Shipley, G.L.; et al. The MIQE Guidelines: Minimum Information for Publication of Quantitative Real-Time PCR Experiments. Clin. Chem. 2009, 55, 611–622. [Google Scholar] [CrossRef] [Scilit] [PubMed]
- Pombo, M.A.; Zheng, Y.; Fei, Z.; Martin, G.B.; Rosli, H.G. Use of RNA-Seq Data to Identify and Validate RT-qPCR Reference Genes for Studying the Tomato-Pseudomonas Pathosystem. Sci. Rep. 2017, 7, 44905. [Google Scholar] [CrossRef] [Scilit] [PubMed]
- Jauzein, C.; Erdner, D.L. Stress-Related Responses in Alexandrium tamarense Cells Exposed to Environmental Changes. J. Eukaryot. Microbiol. 2013, 60, 526–538. [Google Scholar] [CrossRef] [Scilit] [PubMed]
- Bravo, I.; Figueroa, R.I. Towards an Ecological Understanding of Dinoflagellate Cyst Functions. Microorganisms 2014, 2, 11–32. [Google Scholar] [CrossRef] [Scilit] [PubMed]
- Akbar, M.A.; Ahmad, A.; Usup, G.; Bunawan, H. Current Knowledge and Recent Advances in Marine Dinoflagellate Transcriptomic Research. J. Mar. Sci. Eng. 2018, 6, 13. [Google Scholar] [CrossRef] [Scilit]
- Cai, C.-J.; Zhang, W.-P.; Dong, Z.-C.; Xin, Y.-H.; Xie, Z.-X.; Zhang, S.-F.; Wang, D.-Z. Physiological and Transcriptomic Responses of a Harmful Algal Bloom-Causing Dinoflagellate Karenia mikimotoi to Multiple Environmental Factors. Water Res. 2026, 291, 125131. [Google Scholar] [CrossRef] [Scilit] [PubMed]
- Boldt, L.; Yellowlees, D.; Leggat, W. Measuring Symbiodinium sp. Gene Expression Patterns with Quantitative Real-Time PCR. In Proceedings of the 11th ICRS, Ft. Lauderdale, FL, USA, 7–11 July 2008; pp. 118–122. [Google Scholar]
- Rosic, N.N.; Pernice, M.; Rodriguez-Lanetty, M.; Hoegh-Guldberg, O. Validation of Housekeeping Genes for Gene Expression Studies in Symbiodinium Exposed to Thermal and Light Stress. Mar. Biotechnol. 2011, 13, 355–365. [Google Scholar] [CrossRef] [Scilit] [PubMed]
- Guo, R.; Ki, J.-S. Evaluation and Validation of Internal Control Genes for Studying Gene Expression in the Dinoflagellate Prorocentrum minimum Using Real-Time PCR. Eur. J. Protistol. 2012, 48, 199–206. [Google Scholar] [CrossRef] [Scilit] [PubMed]
- Deng, Y.; Hu, Z.; Ma, Z.; Tang, Y.Z. Validation of Reference Genes for Gene Expression Studies in the Dinoflagellate Akashiwo sanguinea by Quantitative Real-Time RT-PCR. Acta Oceanol. Sin. 2016, 35, 106–113. [Google Scholar] [CrossRef] [Scilit]
- Deng, Y.; Hu, Z.; Chai, Z.; Tang, Y.Z. Cloning and Partial Characterization of a Cold Shock Domain-Containing Protein Gene from the Dinoflagellate Scrippsiella trochoidea. J. Eukaryot. Microbiol. 2019, 66, 393–403. [Google Scholar] [CrossRef] [Scilit] [PubMed]
- Chong, G.; Kuo, F.-W.; Tsai, S.; Lin, C. Validation of Reference Genes for Cryopreservation Studies with the Gorgonian Coral Endosymbiont Symbiodinium. Sci. Rep. 2017, 7, 39396. [Google Scholar] [CrossRef] [Scilit] [PubMed]
- Lauritano, C.; De Luca, D.; Ferrarini, A.; Avanzato, C.; Minio, A.; Esposito, F.; Ianora, A. De Novo Transcriptome of the Cosmopolitan Dinoflagellate Amphidinium carterae to Identify Enzymes with Biotechnological Potential. Sci. Rep. 2017, 7, 11701. [Google Scholar] [CrossRef] [Scilit] [PubMed]
- Niaz, Z.; Sui, Z.; Riaz, S.; Liu, Y.; Shang, E.; Xing, Q.; Khan, S.; Du, Q.; Zhou, W.; Wang, J. Identification of Valid Reference Genes for the Normalization of RT-qPCR Gene Expression Data in Alexandrium catenella under Different Nutritional Conditions. J. Appl. Phycol. 2019, 31, 1819–1833. [Google Scholar] [CrossRef] [Scilit]
- Shi, X.; Xiao, Y.; Liu, L.; Xie, Y.; Ma, R.; Chen, J. Exploring Reliable Reference Genes for Gene Expression Normalization in Karenia mikimotoi Using Real-Time PCR. J. Appl. Phycol. 2020, 32, 431–440. [Google Scholar] [CrossRef] [Scilit]
- Romero-Geraldo, R.d.J.; Hernández-Saavedra, N.Y. Stress Gene Expression in Crassostrea gigas (Thunberg, 1793) in Response to Experimental Exposure to the Toxic Dinoflagellate Prorocentrum lima (Ehrenberg) Dodge, 1975. Aquac. Res. 2014, 45, 1512–1522. [Google Scholar] [CrossRef] [Scilit]
- Guo, X.; Wang, Z.; Liu, L.; Li, Y. Transcriptome and Metabolome Analyses of Cold and Darkness-Induced Pellicle Cysts of Scrippsiella trochoidea. BMC Genom. 2021, 22, 526. [Google Scholar] [CrossRef] [Scilit] [PubMed]
- Hallegraeff, G.M. Transport of Toxic Dinoflagellates via Ships Ballast Water: Bioeconomic Risk Assessment and Efficacy of Possible Ballast Water Management Strategies. Mar. Ecol. Prog. Ser. 1998, 168, 297–309. [Google Scholar] [CrossRef] [Scilit]
- Vandesompele, J.; De Preter, K.; Pattyn, F.; Poppe, B.; Van Roy, N.; De Paepe, A.; Speleman, F. Accurate Normalization of Real-Time Quantitative RT-PCR Data by Geometric Averaging of Multiple Internal Control Genes. Genome Biol. 2002, 3, research0034.1. [Google Scholar] [CrossRef] [Scilit] [PubMed]
- Andersen, C.L.; Jensen, J.L.; Ørntoft, T.F. Normalization of Real-Time Quantitative Reverse Transcription-PCR Data: A Model-Based Variance Estimation Approach to Identify Genes Suited for Normalization, Applied to Bladder and Colon Cancer Data Sets. Cancer Res. 2004, 64, 5245–5250. [Google Scholar] [CrossRef] [Scilit] [PubMed]
- Pfaffl, M.W.; Tichopad, A.; Prgomet, C.; Neuvians, T.P. Determination of Stable Housekeeping Genes, Differentially Regulated Target Genes and Sample Integrity: BestKeeper—Excel-Based Tool Using Pair-Wise Correlations. Biotechnol. Lett. 2004, 26, 509–515. [Google Scholar] [CrossRef] [Scilit] [PubMed]
- Noceda, C.; Peixe, A.; Arnholdt-Schmitt, B. Selection of Reference Genes for Transcription Studies Considering Co-Regulation and Average Transcriptional Stability: Case Study on Adventitious Root Induction in Olive (Olea europaea L.) Microshoots. Agronomy 2022, 12, 3201. [Google Scholar] [CrossRef] [Scilit]
- Guillard, R.R.L.; Ryther, J.H. Studies of Marine Planktonic Diatoms. I. Cyclotella nana Hustedt, and Detonula confervacea (Cleve) Gran. Can. J. Microbiol. 1962, 8, 229–239. [Google Scholar] [CrossRef] [Scilit] [PubMed]
- Li, J.; Tang, C.; Song, C.; Chen, M.; Feng, Z.; Pan, Y. A Simple, Rapid and Effective Method for Total RNA Extraction from Lentinula edodes. Biotechnol. Lett. 2006, 28, 1193–1197. [Google Scholar] [CrossRef] [Scilit] [PubMed]
- Kalinina, V.; Palii, O.; Safonov, P.; Skarlato, S.; Berdieva, M. Transcriptomic Response of Marine Dinoflagellate Prorocentrum cordatum to Phosphorus Deficiency. Sci. Rep. 2025, 15, 18797. [Google Scholar] [CrossRef] [Scilit] [PubMed]
- Berdieva, M.; Safonov, P.; Palii, O.; Prilutsky, M.; Matantseva, O.; Skarlato, S. Transcriptomic Analysis of Cold-Induced Temporary Cysts in Marine Dinoflagellate Prorocentrum cordatum. Int. J. Mol. Sci. 2025, 26, 5432. [Google Scholar] [CrossRef] [Scilit] [PubMed]
- Palii, O.; Safonov, P.; Berdieva, M. MEI2-like Proteins in Dinoflagellates: Diversity and Possible Functions in Life Cycle Transitions. Protistology 2024, 18, 249–262. [Google Scholar] [CrossRef] [Scilit]
- Dougan, K.E.; Deng, Z.-L.; Wöhlbrand, L.; Reuse, C.; Bunk, B.; Chen, Y.; Hartlich, J.; Hiller, K.; John, U.; Kalvelage, J.; et al. Multi-Omics Analysis Reveals the Molecular Response to Heat Stress in a “Red Tide” Dinoflagellate. Genome Biol. 2023, 24, 265. [Google Scholar] [CrossRef] [Scilit] [PubMed]
- Hellemans, J.; Mortier, G.; De Paepe, A.; Speleman, F.; Vandesompele, J. qBase Relative Quantification Framework and Software for Management and Automated Analysis of Real-Time Quantitative PCR Data. Genome Biol. 2007, 8, R19. [Google Scholar] [CrossRef] [Scilit] [PubMed]
- R Core Team. R: A Language and Environment for Statistical Computing; R Foundation for Statistical Computing: Vienna, Austria, 2024. [Google Scholar]
- Wickham, H.; Averick, M.; Bryan, J.; Chang, W.; McGowan, L.; François, R.; Grolemund, G.; Hayes, A.; Henry, L.; Hester, J.; et al. Welcome to the Tidyverse. J. Open Source Softw. 2019, 4, 1686. [Google Scholar] [CrossRef] [Scilit]
- Zhong, S. ctrlGene: Assess the Stability of Candidate Housekeeping Genes; R Package Version 1.0.1; CRAN: Vienna, Austria, 2019. [Google Scholar]
- Bowen, J.; Ireland, H.S.; Crowhurst, R.; Luo, Z.; Watson, A.E.; Foster, T.; Gapper, N.; Giovanonni, J.J.; Mattheis, J.P.; Watkins, C.; et al. Selection of Low-Variance Expressed Malus x domestica (Apple) Genes for Use as Quantitative PCR Reference Genes (Housekeepers). Tree Genet. Genomes 2014, 10, 751–759. [Google Scholar] [CrossRef] [Scilit]
- Zalewski, D.; Bogucka-Kocka, A. RQdeltaCT: An Open-Source R Package for Relative Quantification of Gene Expression Using Delta Ct Methods. Sci. Rep. 2025, 15, 29762. [Google Scholar] [CrossRef] [Scilit] [PubMed]
- Pihur, V.; Datta, S.; Datta, S. RankAggreg, an R Package for Weighted Rank Aggregation. BMC Bioinform. 2009, 10, 62. [Google Scholar] [CrossRef] [Scilit] [PubMed]
- Lenth, R.V.; Piaskowski, J. Emmeans: Estimated Marginal Means, Aka Least-Squares Means; R Package Version 2.0.5; CRAN: Vienna, Austria, 2026. [Google Scholar]
- Kianianmomeni, A.; Hallmann, A. Validation of Reference Genes for Quantitative Gene Expression Studies in Volvox carteri Using Real-Time RT-PCR. Mol. Biol. Rep. 2013, 40, 6691–6699. [Google Scholar] [CrossRef] [Scilit] [PubMed]
- Adelfi, M.G.; Borra, M.; Sanges, R.; Montresor, M.; Fontana, A.; Ferrante, M.I. Selection and Validation of Reference Genes for qPCR Analysis in the Pennate Diatoms Pseudo-Nitzschia multistriata and P. arenysensis. J. Exp. Mar. Biol. Ecol. 2014, 451, 74–81. [Google Scholar] [CrossRef] [Scilit]
- Ji, N.; Li, L.; Lin, L.; Lin, S. Screening for Suitable Reference Genes for Quantitative Real-Time PCR in Heterosigma akashiwo (Raphidophyceae). PLoS ONE 2015, 10, e0132183. [Google Scholar] [CrossRef] [Scilit] [PubMed]
- Torres, S.; Lama, C.; Mantecón, L.; Flemetakis, E.; Infante, C. Selection and Validation of Reference Genes for Quantitative Real-Time PCR in the Green Microalgae Tetraselmis chui. PLoS ONE 2021, 16, e0245495. [Google Scholar] [CrossRef] [Scilit] [PubMed]
- Uetrecht, A.C.; Bear, J.E. Coronins: The Return of the Crown. Trends Cell Biol. 2006, 16, 421–426. [Google Scholar] [CrossRef] [Scilit] [PubMed]
- Berdieva, M.; Kalinina, V.; Fel, A.; Skarlato, S. Heterotrophy in Dinoflagellates: Components of Endocytosis Molecular Machinery in Prorocentrum cordatum and Amphidinium carterae Transcriptomes. Protistology 2021, 15, 284–293. [Google Scholar] [CrossRef] [Scilit]
- Li, H.; Li, L.; Yu, L.; Yang, X.; Shi, X.; Wang, J.; Li, J.; Lin, S. Transcriptome Profiling Reveals Versatile Dissolved Organic Nitrogen Utilization, Mixotrophy, and N Conservation in the Dinoflagellate Prorocentrum shikokuense under N Deficiency. Sci. Total Environ. 2021, 763, 143013. [Google Scholar] [CrossRef] [Scilit] [PubMed]
- Roy, S.; Jagus, R.; Morse, D. Translation and Translational Control in Dinoflagellates. Microorganisms 2018, 6, 30. [Google Scholar] [CrossRef] [Scilit] [PubMed]
- Linardić, M.; Braybrook, S.A. Identification and Selection of Optimal Reference Genes for qPCR-Based Gene Expression Analysis in Fucus distichus under Various Abiotic Stresses. PLoS ONE 2021, 16, e0233249. [Google Scholar] [CrossRef] [Scilit] [PubMed]
- Dheda, K.; Huggett, J.F.; Chang, J.S.; Kim, L.U.; Bustin, S.A.; Johnson, M.A.; Rook, G.A.W.; Zumla, A. The Implications of Using an Inappropriate Reference Gene for Real-Time Reverse Transcription PCR Data Normalization. Anal. Biochem. 2005, 344, 141–143. [Google Scholar] [CrossRef] [Scilit] [PubMed]
- Lin, S.; Yu, L.; Wu, X.; Li, M.; Zhang, Y.; Luo, H.; Li, H.; Li, T.; Li, L. Active Meiosis during Dinoflagellate Blooms: A ‘Sex for Proliferation’ Hypothesis. Harmful Algae 2022, 118, 102307. [Google Scholar] [CrossRef] [Scilit] [PubMed]

Disclaimer/Publisher’s Note: The statements, opinions and data contained in all publications are solely those of the individual author(s) and contributor(s) and not of MDPI and/or the editor(s). MDPI and/or the editor(s) disclaim responsibility for any injury to people or property resulting from any ideas, methods, instructions or products referred to in the content. |
© 2026 by the authors. Licensee MDPI, Basel, Switzerland. This article is an open access article distributed under the terms and conditions of the Creative Commons Attribution (CC BY) license.