


Abstract
Coastal sediment bacteria mediate essential biogeochemical cycles, yet their functional gene potential to anthropogenic stress gradients remains insufficiently understood. This study presents a comparative analysis of sediment bacterial communities and carbon, nitrogen, phosphorus, and sulfur (C/N/P/S) cycling genes between the west and east coasts of Shenzhen, China, a region exemplifying sharp contrasts between intensive urbanization and relatively pristine marine environments. We integrated 16S rRNA gene high-throughput sequencing with QMEC (Quantitative Microbial Element Cycling), a high-throughput quantitative PCR chip to profile both bacterial taxonomic composition and quantitatively measured gene abundances across C/N/P/S biogeochemical pathways. Western sediments, under strong terrestrial input, exhibited higher ammonium and organic carbon, while eastern sediments had higher salinity. Bacterial alpha diversity was significantly higher in the west, and community structure differed markedly between regions (ANOSIM R = 0.334, p = 0.001). Although dominant phyla (Pseudomonadota, Bacteroidota, and Planctomycetota) were shared, genus-level taxa diverged: Sulfurovum (sulfur cycling) was enriched in the west, while organic-degrading Burkholderia-Caballeronia-Paraburkholderia and Phaeodactylibacter prevailed in the east. Notably, functional gene abundance for all four biogeochemical cycles was an order of magnitude higher in western sediments, with denitrification genes dominating there and nitrification genes in the east. Redundancy analysis (RDA) and the Mantel test identified nitrate as the primary environmental driver of bacterial variation (r = 0.574, p = 0.001), alongside salinity, temperature, ammonium, and total organic carbon. These findings reveal distinct bacterial adaptations to contrasting anthropogenic pressures and demonstrate that sediment bacterial functional gene profiles can serve as sensitive indicators of ecosystem health, providing a quantitative microbiological basis for targeted pollution management in urbanized coastal zones.
1. Introduction
The coastal zone is a key ecotone connecting land and sea. It features extremely high productivity and biodiversity, but it also bears tremendous pressure from land-based inputs and human activities [1,2,3]. Sediment bacteria are the primary drivers of biogeochemical cycles in the coastal zone, controlling essential processes such as the decomposition of organic matter, the transformation of nutrients, and the degradation of pollutants. They also drive biogeochemical cycles of elements such as carbon (C), nitrogen (N), phosphorus (P), and sulfur (S) [4,5,6]. The composition and function of bacterial communities are sensitive indicators of environmental changes [7]. While 16S rRNA gene high-throughput sequencing effectively reveals bacterial community structure and diversity under different stressors [8], taxonomic profiling alone cannot directly infer functional potential [8,9]. Integrating 16S rRNA sequencing with QMEC (Quantitative Microbial Element Cycling) technology offers a robust approach to assess bacterial functional gene potential.
QMEC, a high-throughput qPCR-based functional gene chip, simultaneously quantifies dozens of key genes involved in C, N, P, and S cycling, thus directly evaluating bacterial genetic potential and element turnover capabilities [10,11,12]. It has been successfully applied in agricultural soils [10,13,14], freshwater wetlands [15,16], and sewage treatment systems, effectively capturing bacterial functional gene potential to disturbances such as fertilization, flooding, and pollutant loading. However, systematic QMEC-based investigations remain scarce in coastal sediments, as coastal areas are complex ecosystems affected by land–sea interactions and intense anthropogenic pressure. Previous coastal studies have largely relied on single-gene or single-cycle approaches. For example, qPCR detection of the amoA gene [17,18,19,20,21] or nirS/nosZ genes [22] to assess nitrification or denitrification potential, and the dsrB gene for sulfate reduction processes [23,24]. These studies have provided valuable insights into individual biogeochemical processes; however, the joint distribution of C, N, P, and S cycling-gene abundances, considered together with bacterial community structure, has received comparatively less attention under contrasting eutrophication and salinity conditions. In this study, we combined 16S rRNA gene sequencing with QMEC profiling to address this question in Shenzhen coastal sediments, focusing on co-variation patterns among elemental cycles (e.g., denitrification- and sulfate-reduction-related genes) [25,26] rather than direct functional interactions.
Moreover, QMEC enables a more comprehensive view of the nitrogen cycle—a key process in coastal zones. Beyond conventional markers like amoA of ammonia-oxidizing bacteria (AOB) and ammonia-oxidizing archaea (AOA) [18,21], emerging evidence highlights the importance of genes associated with complete ammonia oxidizers (Comammox, e.g., comammox amoA) [19,27,28,29] and anaerobic ammonia oxidizers (Anammox, e.g., hzsB) [30] in marine sediment nitrogen loss. The QMEC chip includes targets for these novel pathways, allowing us to simultaneously profile both traditional and newly recognized nitrogen transformation potentials in sediments, thereby providing a more complete assessment of nitrogen removal capacity. Understanding how sediment bacteria respond to contrasting anthropogenic pressures has direct implications for coastal management. Functional gene profiles can indicate the self-purification capacity and pollution transformation potential of sediments, helping to identify vulnerable zones and support targeted management. In urbanized coastal regions that experienced different levels of eutrophication and anthropogenic input, such data provide a quantitative microbiological basis for nutrient reduction, sewage control, and ecological health assessment.
Shenzhen, a highly urbanized coastal metropolis situated on China’s southern coast, exhibits marked west–east differences in environmental quality. These disparities are attributable to variations in geographical location, developmental trajectory, and the intensity of human interference [31,32]. The west coast, adjacent to the urban core, receives substantial riverine input, industrial effluents, and domestic sewage, leading to significant nutrient accumulation and organic pollution [33,34]. The east coast, dominated by port operations, tourism, and aquaculture, maintains relatively better water quality but is still impacted by seasonal tourism and coastal development [32,35]. These environmental gradients not only affect aquatic organisms but also profoundly shape sediment bacterial ecosystems [36,37].
In this study, we collected sediments from four representative bays in Shenzhen. By combining environmental parameter measurements, 16S rRNA gene sequencing, and QMEC technology, we aimed to: (i) compare bacterial community diversity and composition between east and west coasts; (ii) elucidate differences in functional gene potentials for C, N, P, and S cycling; and (iii) identify key environmental factors driving shifts in bacterial community structure and function.
2. Materials and Methods
2.1. Research Area and Sample Collection
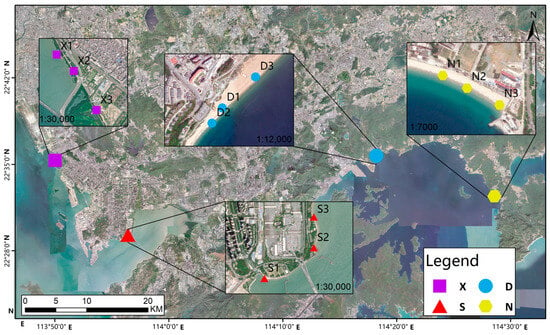
The sea area of Shenzhen is divided into east and west sea areas based on its geographical location, with a total coastline of 257 km and a sea area of 1400 km2. The west coast, including Shenzhen Bay and Xi Bay, is adjacent to the urban core and receives substantial riverine input from the Pearl River, industrial effluents, and domestic sewage, resulting in lower salinity and higher nutrient and organic matter loads [33,34]. The east coast, including Dameisha and Nan’ao, is mainly influenced by port operations, tourism, and aquaculture, and maintains relatively higher salinity and better water quality, although it is still affected by seasonal tourism and coastal development [32,35]. These contrasting environmental conditions make the two regions suitable for examining bacterial community and functional gene responses to different anthropogenic pressures. Four representative coastal zones were selected: Shenzhen Bay (S) and Xi Bay (X) in the west, and Dameisha (D) and Nan’ao (N) in the east [35]. Three repeated sampling sites (S1–S3, X1–X3, D1–D3, N1–N3) were selected in each coastal zone (Figure 1). Surface sediment samples (0–5 cm) were collected using a grab-type sediment sampler and placed in sterile sealed bags. Water depth was within the range of 20–30 cm when sampling. Water samples were collected using a water sampler and placed in sampling bottles [1,32]. All samples were kept on ice and immediately transported to the laboratory. The sediment and water samples were stored at 4 °C, and a subset of each sediment sample was preserved at −80 °C for subsequent molecular analyses.
Figure 1.
Location of the sampling stations in Shenzhen, China (S, Shenzhen Bay (west); X, Xi Bay (west); D, Dameisha (east); N, Nan’ao (east). Purple, blue, red, and yellow symbols represent X, D, S, and N sites, respectively. Three replicate sampling sites (S1–S3, X1–X3, D1–D3, N1–N3) were collected in each coastal zone.
2.2. Determination of Physiological Parameters and Environmental Factors
The physical properties of the water samples were determined using the multi-parameter water quality analyzer (Orion Star A329, Thermo Scientific, Waltham, MA, USA). The concentrations of ammonia nitrogen (NH4+-N), nitrate nitrogen (NO3−-N), nitrite nitrogen (NO2−-N), and available phosphorus (PO43−-P) were measured using a fully automated discrete chemical analyzer (CleverChem 380Plus, DeChem-Tech. GmbH, Hamburg, Germany). The analyses were performed following the standard operating procedures and pre-programmed methods provided by the manufacturer.
2.3. 16S rRNA Sequencing
Total DNA was extracted from sediment samples using the PowerFecalTM DNA Isolation Kit, and the purity and concentration of DNA were measured using a Nanodrop One (Thermo Fisher Scientific, Waltham, MA, USA). PCR amplification of the V3–V4 region of the bacterial 16S rDNA gene was performed using the universal primers 338F (5′-ACTCCTACGGGAGCAGCA-3′) and 806R (5′-GGACTACHVGGGTWTCTCATAT-3′) [38,39]. The amplification products were purified and then subjected to paired-end sequencing on the Illumina NovaSeq 6000 platform. After the raw sequences were quality-filtered using fastp (v0.14.1) and concatenated using FLASH (1.2.11), the sequences were clustered into operational taxonomic units (OTUs) at a 97% similarity level using UPARSE (v8.1). Taxonomic annotation was performed against the SILVA database version 138.1 (released in 2020), and chloroplast and mitochondrial sequences were removed [40,41,42,43].
2.4. QMEC
QMEC (Quantitative Microbial Element Cycling) is a high-throughput qPCR-based technology for quantifying bacterial functional genes, commonly used in environmental bacterial ecology research to evaluate the genetic potential of C, N, P, S, and methane metabolism [11]. The functional genes of the C, N, P, and S cycles in sediments were analyzed by QMEC. The chip contained 71 pairs of validated functional gene primers and one pair of 16S rRNA gene internal reference primers (72 primer pairs in total), covering 35 C-cycling genes, 22 N-cycling genes, 9 P-cycling genes, and 5 S-cycling genes [10]. Amplification was performed using the WaferGen SmartChip real-time PCR system. PCR amplification conditions were as follows: 98 °C for 1 min, 30 cycles of 98 °C for 10 s, 50 °C for 30 s, and 72 °C for 30 s, followed by 5 min extension at 72 °C with three replicates per sample set. The amplification specificity was verified through melting curve analysis. The absolute abundance of each functional gene was calculated based on the absolute copy number of the 16S rRNA gene [11], and the Z-score standardization method was used to compare the differences in the abundance of functional genes among different samples. For 16S rRNA gene sequencing, 36 sediment samples were analyzed, with three field replicates per site. For QMEC, each sample was run in three technical replicates, and only genes detected in all three replicates were considered positive. The mean value of the three technical replicates was used as the gene abundance in each sample.
2.5. Statistical Analysis
Data processing and statistical analysis were conducted using R software (v3.5.2). Alpha diversity indices (Shannon, Chao1, Richness, and PD whole tree) were calculated based on OTU tables. Differences among groups were tested using Student’s t-test for two-group comparisons and the Kruskal–Wallis test for multi-group comparisons. Beta diversity analysis was conducted under the ‘vegan’ package based on the Bray–Curtis distance matrix for non-metric multidimensional scaling analysis (NMDS), principal coordinate analysis (PCoA), and cluster analysis, and the significance of differences between groups was tested through similarity analysis (ANOSIM). The abundance data of functional genes were normalized by 16S rRNA gene copy number and then Z-score standardized to compare the expression differences between regions. The correlation between environmental factors and the structure of bacterial communities was analyzed by Mantel test, and the influence of environmental factors on community distribution was visualized by using redundancy analysis (RDA). The correlation between the abundance of functional genes and environmental factors was analyzed by Spearman rank correlation analysis, and a heatmap was generated.
3. Results
3.1. Environmental Factors and Sediment Physicochemical Properties
The characteristics of the sampling sites are summarized in Table 1. The four representative coastal zones in the east and west revealed significant regional differences. The east coast (sites D, N) demonstrated significantly higher salinity (32.67 ± 0.61 psu) than the west coast (sites S, X) (19.6 ± 3.88 psu; p < 0.001). Water temperature ranged from 23.5 °C to 31.2 °C, with the west site S showing the highest value (30.4 ± 0.8 °C). The pH was generally weakly acidic to neutral, but eastern sediments (7.28 ± 0.23) were significantly more alkaline than those from the west (6.68 ± 0.14; p < 0.001). Nutrient concentrations also exhibited distinct spatial patterns. Ammonium concentrations were highly heterogeneous among sites. Site X exhibited exceptionally high ammonium levels (19.47–25.90 mg/kg), approximately 10–20 times higher than those at the other sites (0.86–2.24 mg/kg). This site-level enrichment drove the higher mean ammonium concentration in the west, rather than a consistent west–east difference. The differences among sites S, D, and N were relatively small compared with site X. Nitrite concentration in the west (0.16 ± 0.13 mg/kg) was significantly higher than that in the east (0.03 ± 0.03 mg/kg; p = 0.039). Nitrate was highest at site D (143.08 ± 7.05 mg/kg). Phosphate showed a patchy distribution, with the highest concentration at site S (336.03 mg/kg) and intermediate concentrations at site N (104.15–108.75 mg/kg), while sites X and D had much lower levels. Organic matter and total nitrogen also differed between regions. Total nitrogen (TN) was significantly higher in the west (750 ± 351 mg/kg) than in the east (344 ± 118 mg/kg; p = 0.004), showing marked spatial differentiation. Total organic carbon (TOC) reached extremely high values at site N (41,189 ± 2886 mg/kg) but was relatively low at site S (2822 ± 1147 mg/kg).
Table 1.
Environmental Factors and Physicochemical Properties.
3.2. Alpha Diversity of Sediment Bacterial Community
Sequencing of 36 sediment samples generated 12,899 to 32,655 valid sequences, which were clustered into 1965 to 4298 OTUs at a 97% similarity level. The rarefaction curves tended to flatten, indicating that the sequencing depth was sufficient to cover the vast majority of bacterial groups and that the sample size met the requirements for subsequent analysis.
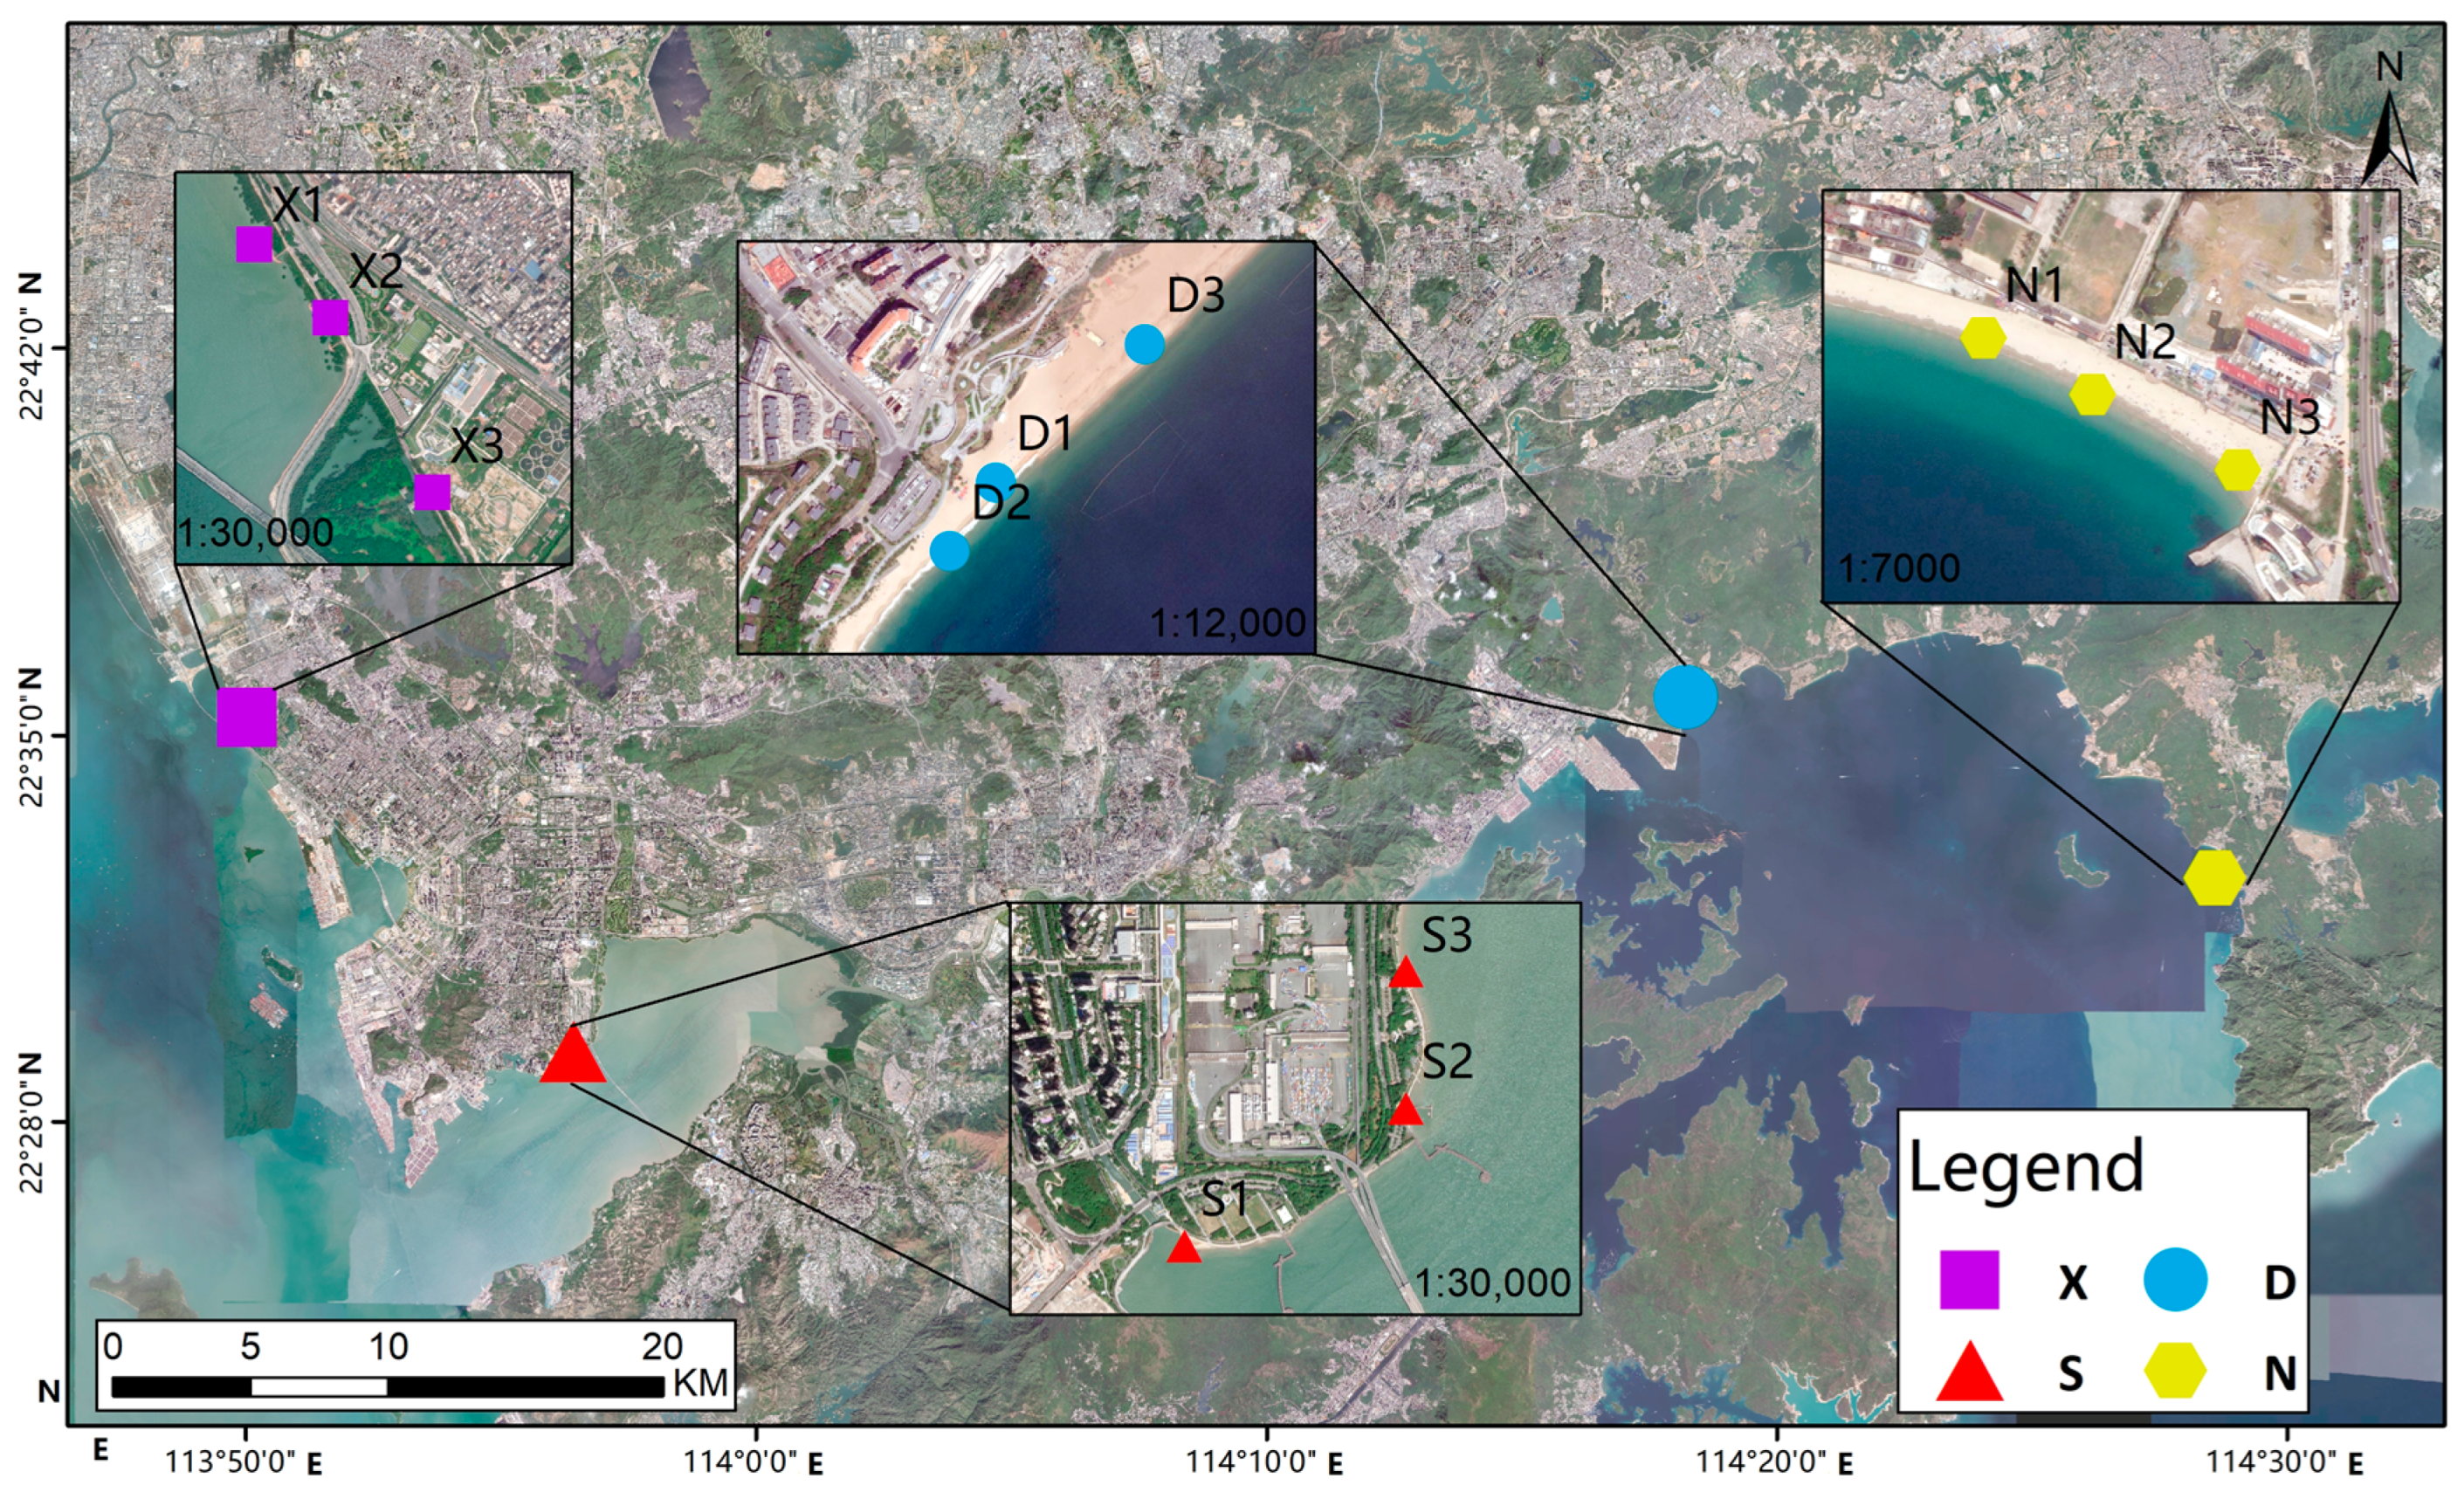
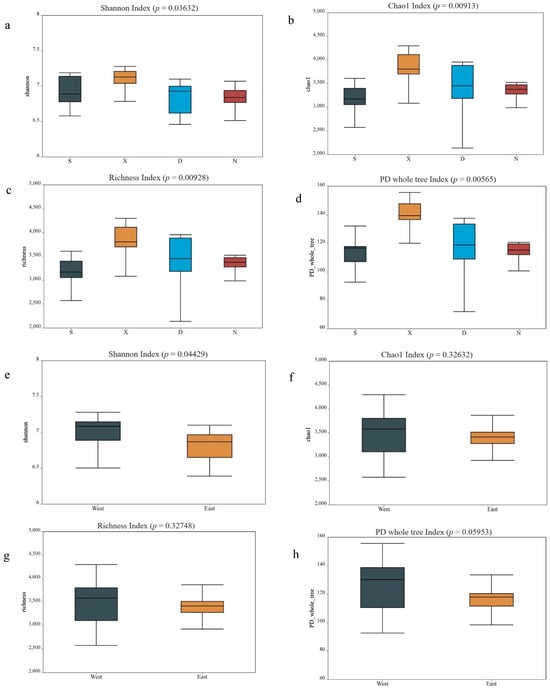
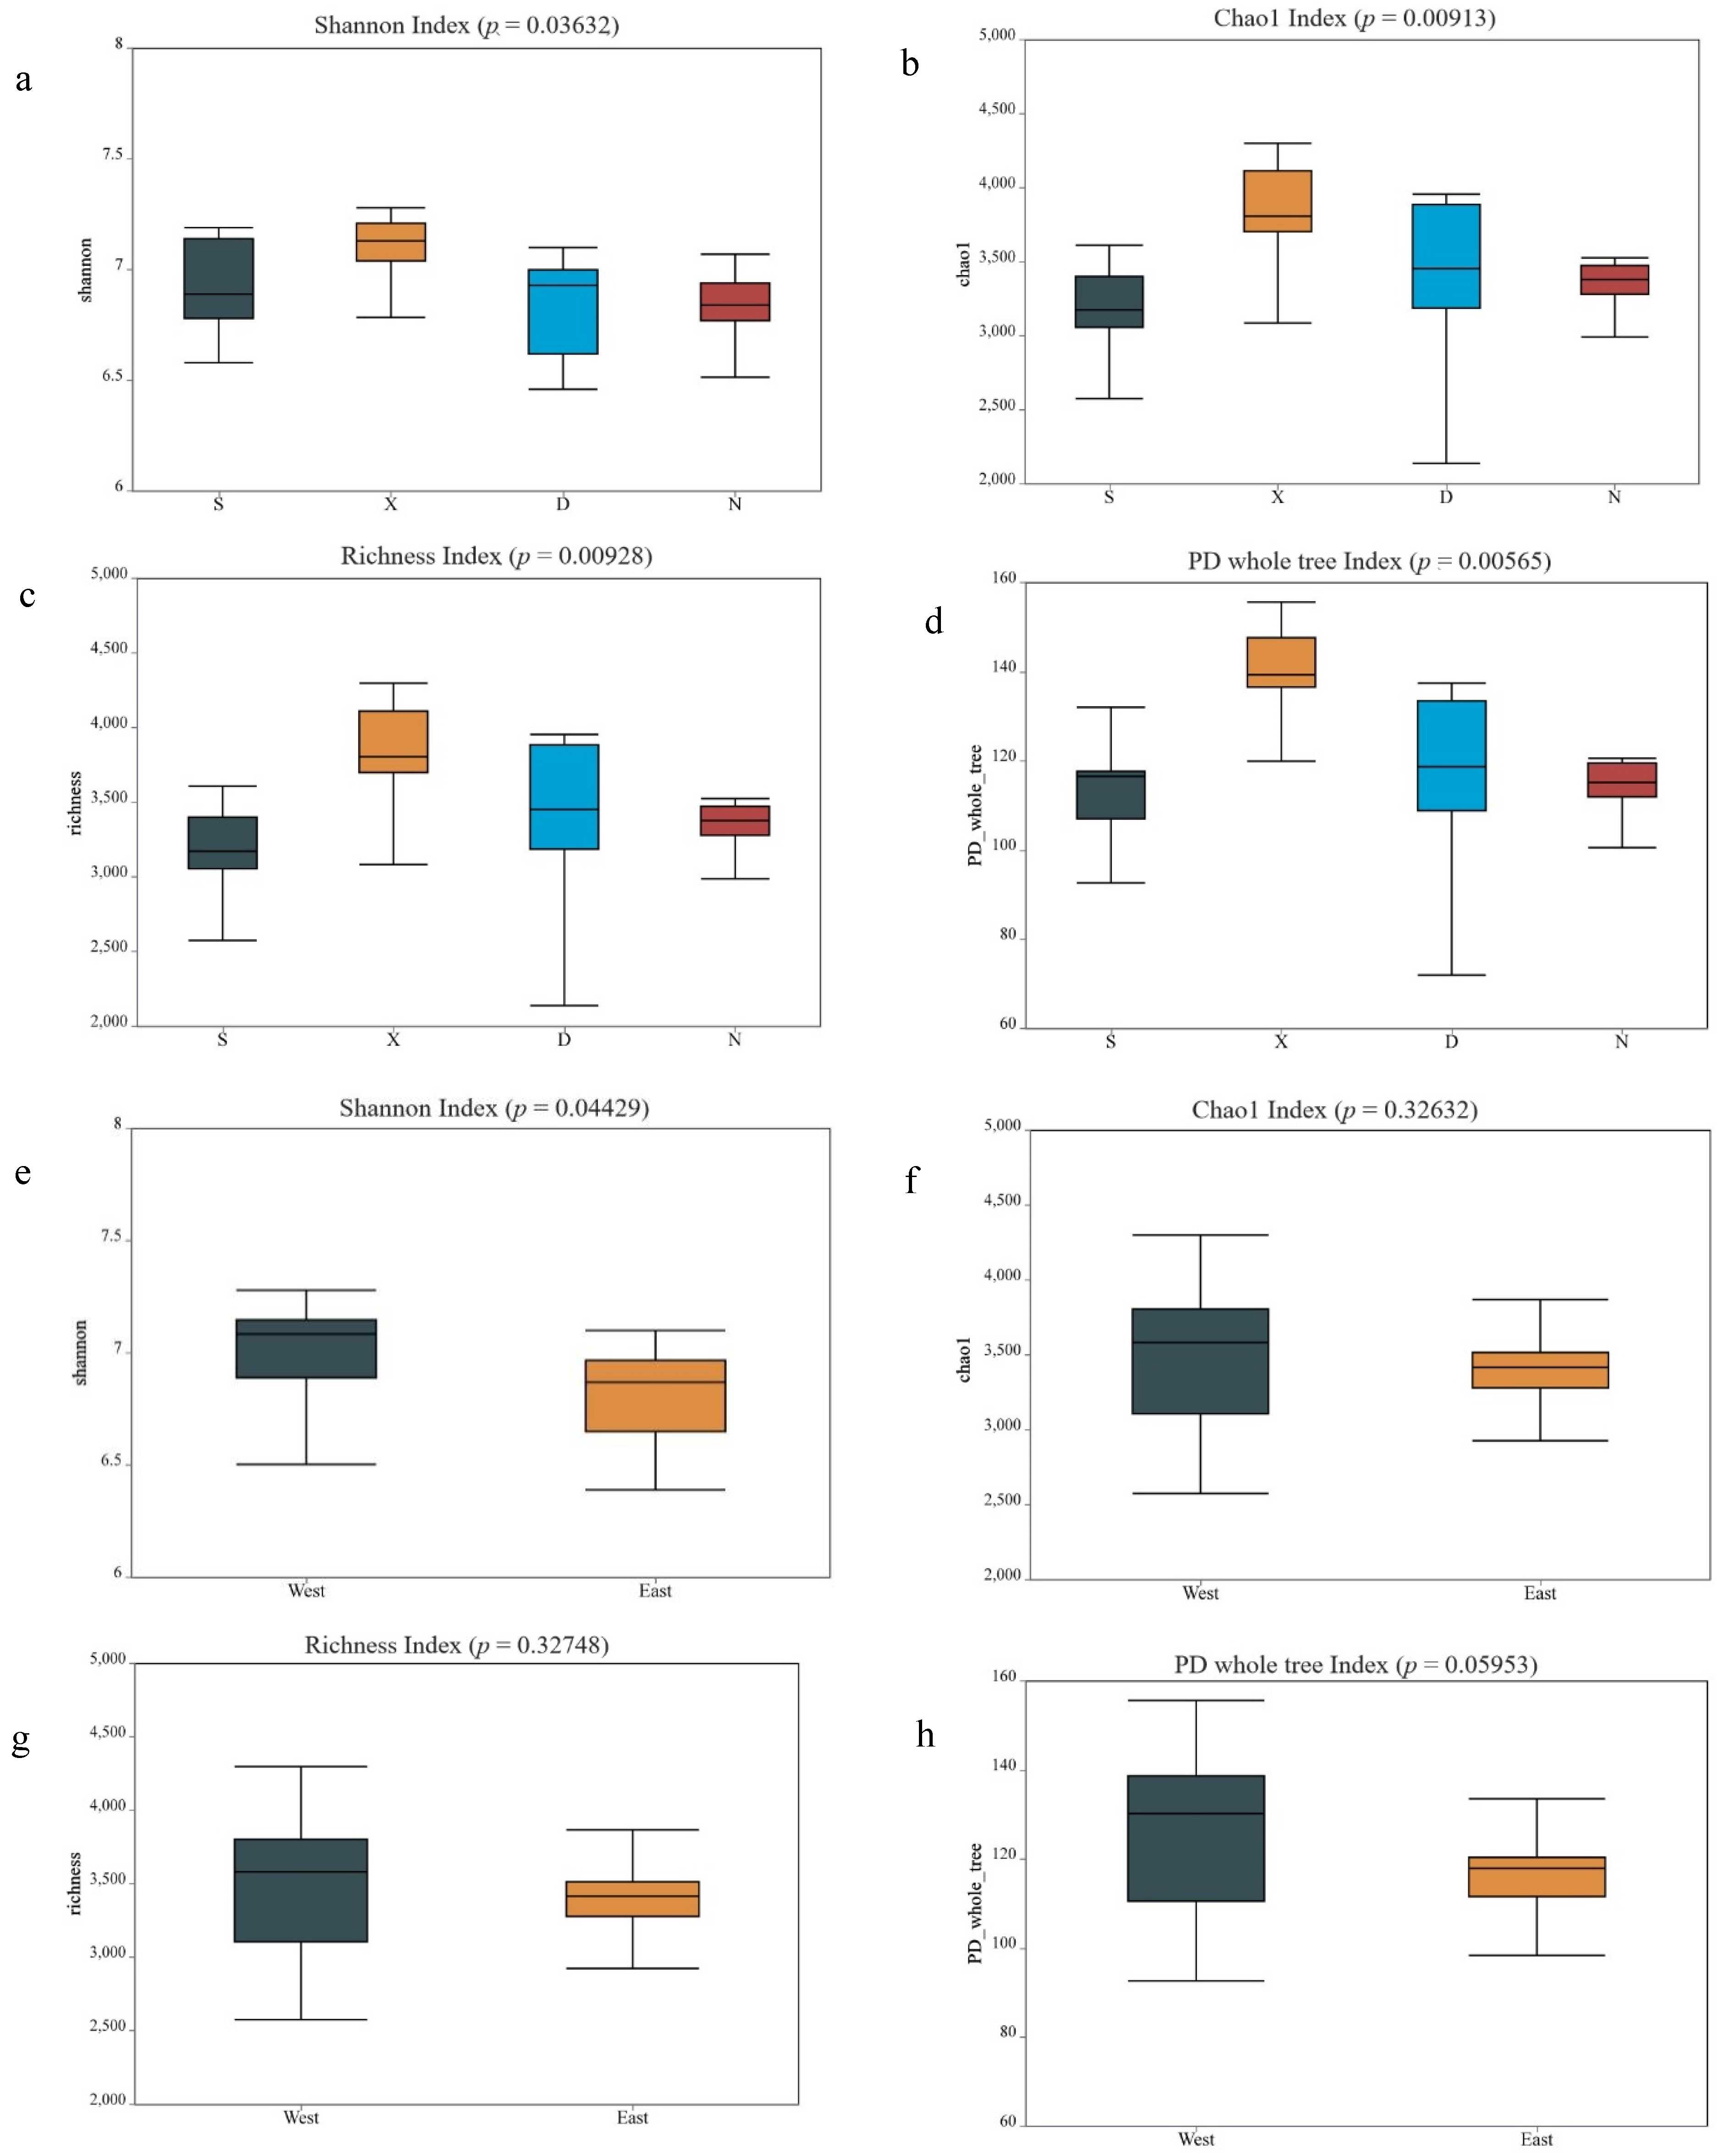
Four alpha diversity indices (Shannon, Chao1, Richness, and PD whole tree) were calculated to comprehensively characterize community diversity across sites (Figure 2). All these indices varied significantly among the sampling sites (p < 0.05), with ranges of 6.81–7.05 (Shannon), 3185–3811 (Chao1), 3182–3807 (Richness), and 111.42–139.28 (PD whole tree). Site X consistently exhibited the highest values across all indices, indicating the greatest species richness and phylogenetic diversity among the sediments. Pairwise comparisons showed that Richness and Chao1 were significantly higher at site X than at sites S and N (p < 0.05), while no significant differences were found among sites S, D, and N. PD whole tree was significantly higher at site X than at all other sites (p < 0.05). In contrast, Shannon diversity did not differ significantly between any pair of sites (p > 0.05).
Figure 2.
Alpha diversity boxplots of sediment bacterial communities. (a–d): Sampling sites (S, X, D, N); (e–h): west (S + X) and east (D + N). Boxes represent the interquartile range (IQR), horizontal lines indicate medians, and whiskers extend to 1.5 × IQR. Differences among the four sites were tested using the Kruskal–Wallis test, and pairwise comparisons were performed using Student’s t-test. Significance was set at p < 0.05.
When comparing the west and east as a whole, all four alpha diversity indices were higher in the west, though the difference reached statistical significance only for the Shannon index (p = 0.044) (Figure 2). These results indicate that sediment bacterial communities in the west, particularly at site X, had higher richness, evenness, and phylogenetic diversity than those in the east. However, the relationship between this elevated diversity and environmental factors was not statistically tested in this study.
3.3. Differences in Bacterial Community Composition Analysis
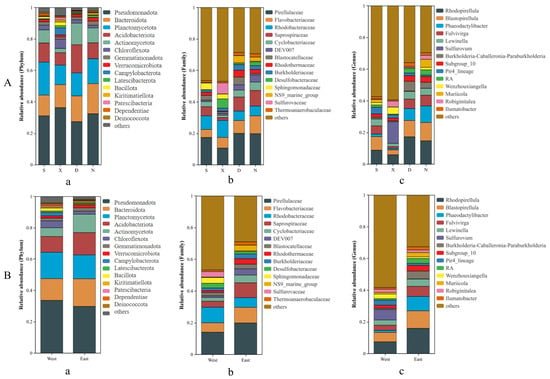
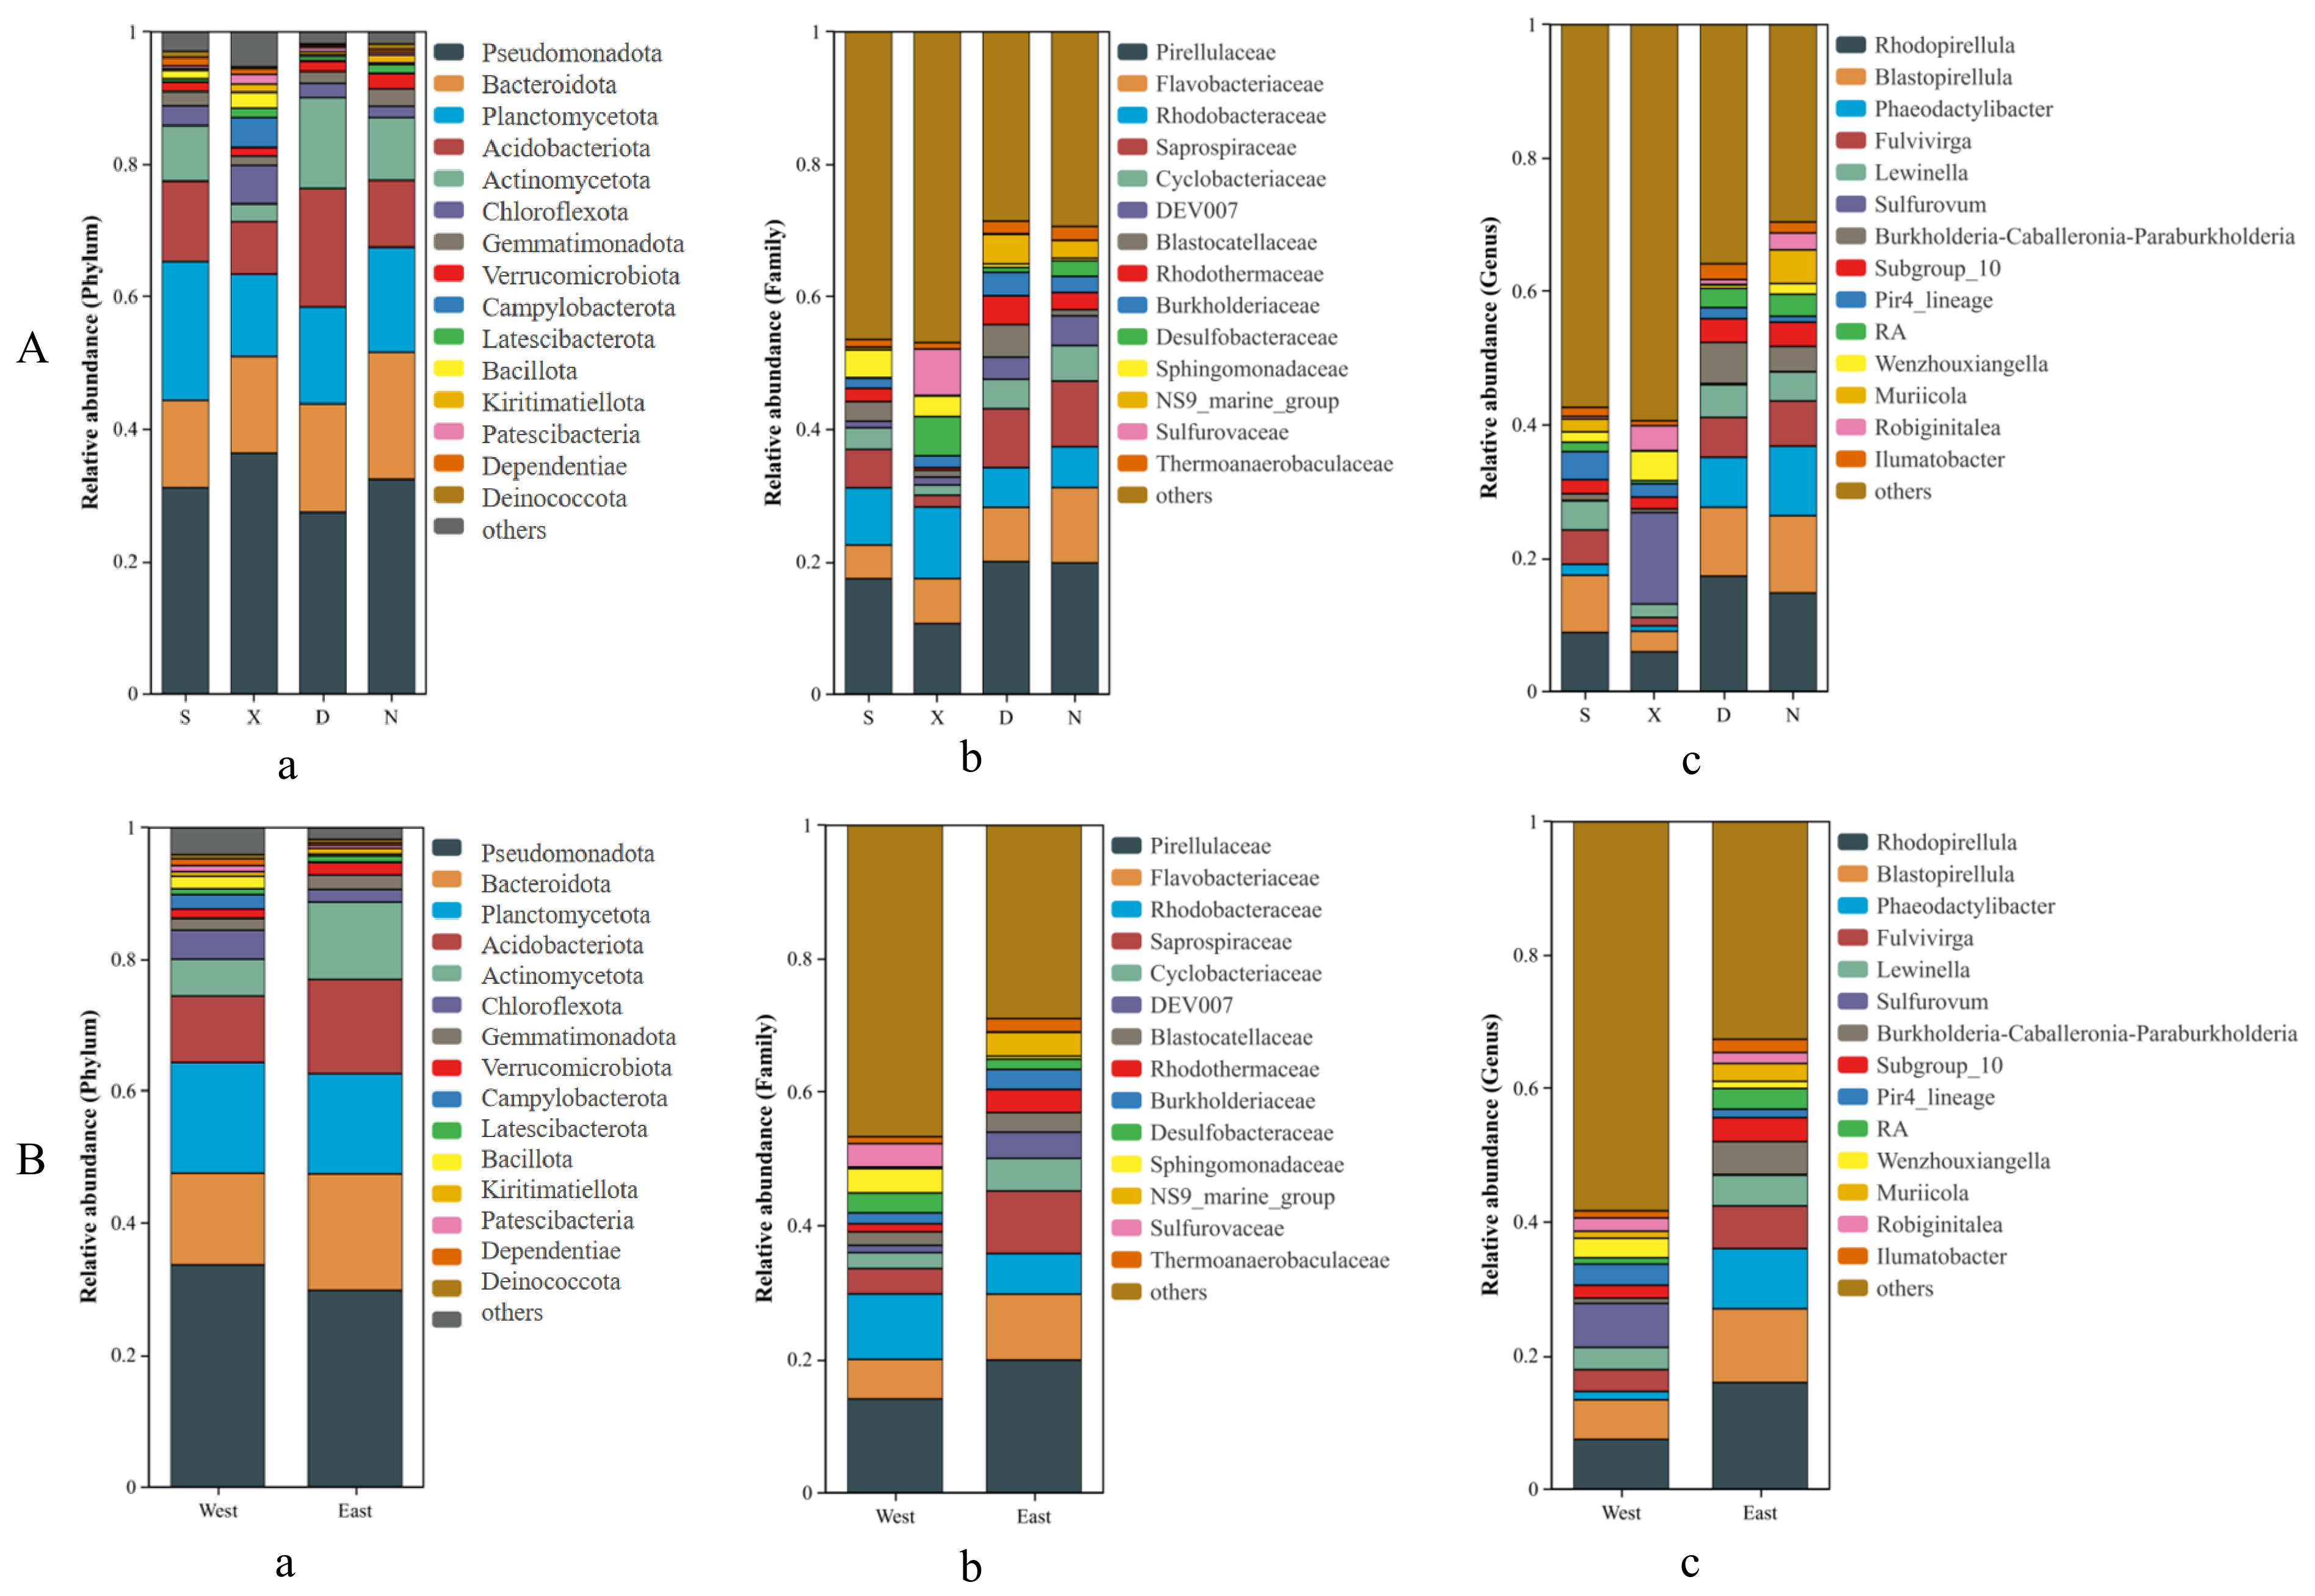
Bacterial community composition was compared among the four sampling sites (sites S, X, D, and N) and between the west and east at phylum, family, and genus levels. At the phylum level, the top four dominant phyla were identical across all sites: Pseudomonadota, Bacteroidota, Planctomycetota, and Acidobacteriota (Figure 3A(a)). The fifth dominant phylum was Actinomycetota at all sites except site X, where Chloroflexota replaced it. Pseudomonadota predominated in all sampling sites, with the highest relative abundance of 36.3% at site X and the lowest abundance of 27.4% at site D. Bacteroidota was the second dominant phylum and ranged from 13.2% (site S) to 19.2% (site N). The highest relative abundance of Planctomycetota was 21.0% at site S, and the lowest was 12.5% at site X. Acidobacteriota ranged from 7.9% (site X) to 17.9% (site D). Chloroflexota was the top five phylum at site X, with a relative abundance of 5.8%. Notably, Campylobacterota—a phylum linked to sulfur cycling—was most abundant at site X (4.5%). When comparing the overall phylum-level composition between the east and west regions (Figure 3B(a)), the relative abundances of Bacteroidota, Acidobacteriota, and Actinomycetota in the east (17.7%, 14.3%, and 11.8%) were higher than in the west (13.9%, 10.1%, and 5.6%). However, the relative abundances of Pseudomonadota and Planctomycetota were slightly higher in the west (33.7% and 16.8%) than in the east (29.7% and 15.2%).
Figure 3.
Bacterial community composition of the four sampling points (A) and the east and west (B) at the phylum (a), family (b), genus (c) levels.
At the family level, marked spatial differentiation was evident (Figure 3A(b)). Pirellulaceae was the most abundant family across all sites, ranging from 10.6% (site X) to 20.0% (site D). Flavobacteriaceae and Saprospiraceae peaked at site N (11.4% and 9.9%, respectively) and were lowest at site X (12.5% and 1.8%, respectively). Rhodobacteraceae was highest at site X (10.8%) and lowest at site D (6.0%). The highest relative abundance of DEV007 was at site N (4.5%), and the lowest was at site S (1.0%). Desulfobacteraceae and Sulfurovaceae were highly enriched at site X (5.9% and 7.0%), which was consistent with the distribution characteristics of Campylobacterota at the phylum level. The relative abundances of dominant bacterial families showed significant differences (Figure 3B(b)). The relative abundance of Rhodobacteraceae in the west (9.7%) was higher than in the east (6.1%). while the relative abundances of Pirellulaceae, Flavobacteriaceae, Saprospiraceae, and Cyclobacteriaceae in the east (19.9%, 9.8%, 9.4% and 4.9%) were higher than in the west (14.1%, 5.9%, 3.8% and 2.4%). Sphingomonadaceae was higher in the west (3.6% vs. 0.5%), but Burkholderiaceae was higher in the east (3.0%) than in the west (1.6%).
At the genus level, Rhodopirellula and Blastopirellula were among the top five genera at all four sampling sites (Figure 3A(c)). Rhodopirellula, Blastopirellula, Phaeodactylibacter, and Fulvivirga all reached the highest relative abundance at site N (14.7%, 11.6%, 10.4% and 6.8%), and the lowest abundances at site X (5.9%, 3.1%, 0.8% and 1.3%). Lewinella peaked at site D (4.9%) and was lowest at site X (2.0%). West–east comparisons revealed that all five dominant bacterial genera (Rhodopirellula, Blastopirellula, Phaeodactylibacter, Fulvivirga, and Lewinella) in the east (16.0%, 11.0%, 9.0%, 6.4% and 4.6%) were higher than in the west (7.4%, 5.9%, 1.2%, 3.3% and 3.2%) (Figure 3B(c)). The most striking difference was Sulfurovum, which was nearly absent in the east (0.1%) but reached 6.6% in the west, reinforcing the inference of a more active sulfur cycle in western sediments. Conversely, Burkholderia-Caballeronia-Paraburkholderia was more prevalent in the east (4.9% vs. 0.8%).
3.4. Differences in Bacterial Beta Diversity
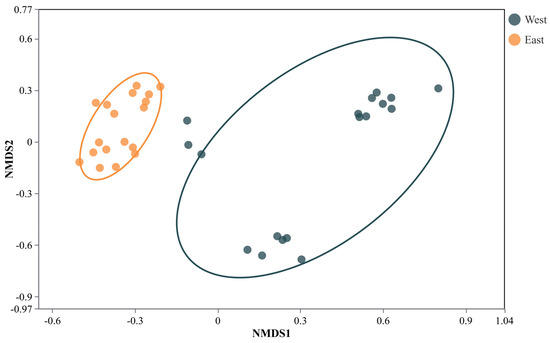
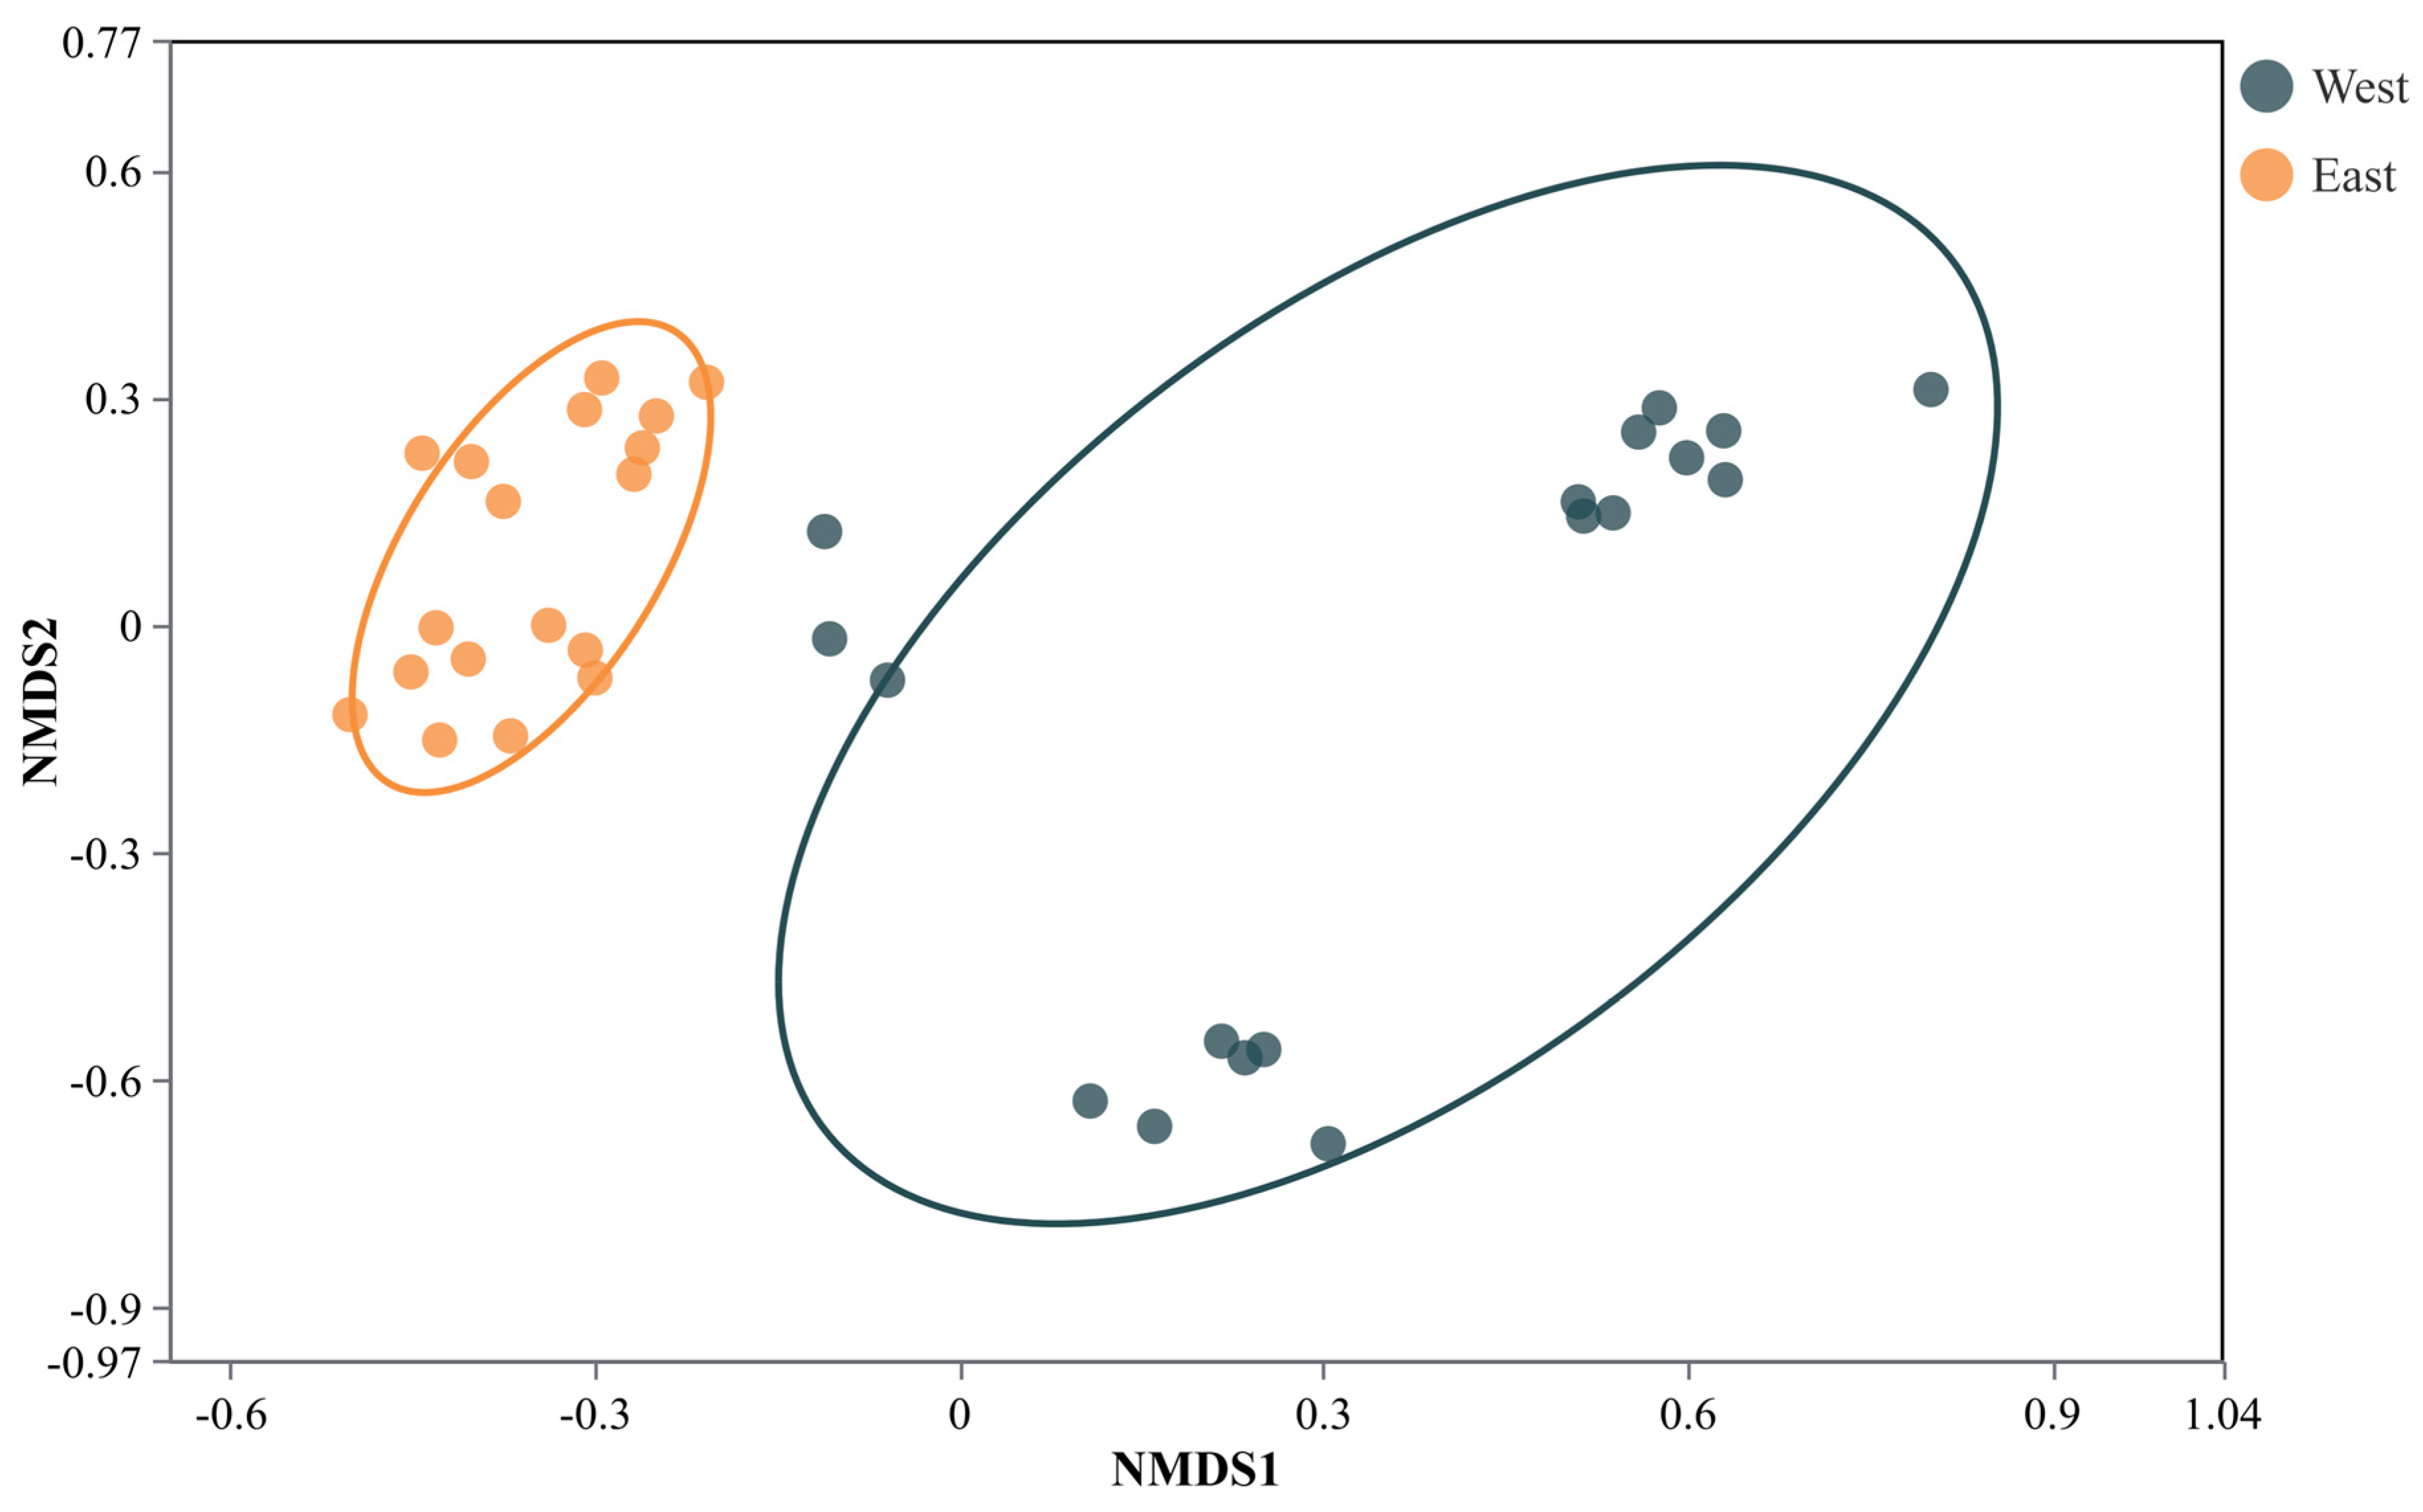
To assess spatial variations in bacterial community structure, we performed non-metric multidimensional scaling (NMDS), cluster analysis, and analysis of similarity (ANOSIM) based on Bray–Curtis distance matrices. All three approaches consistently revealed significant west–east differentiation. The NMDS ordination (Figure 4) clearly separated east (site D, N) and west (site S, X) samples into two distinct, nearly non-overlapping clusters. The stress value of 0.084, well below the accepted threshold of 0.2, confirmed that the two-dimensional plot reliably represents the original high-dimensional distance relationships.
Figure 4.
NMDS diagram (Each point represents one individual sediment sample (n = 36). West and east samples are shown in different colors).
ANOSIM analysis further confirmed that the bacterial communities of sediments in the east and west were significantly different (R = 0.334, p = 0.001) (Table 2). Within the west, community structures at sites S and X also differed markedly (R = 0.4472, p = 0.001). Within the east, sites D and N showed even stronger separation (R = 0.9959, p = 0.001). The Cluster Analysis Diagram was also produced (Figure S2); the clear grouping based on west and east confirms that intra-regional community similarity far exceeds inter-regional similarity, consistent with the high ANOSIM R values obtained.
Table 2.
ANOSIM analysis based on Bray–Curtis distance.
3.5. Diversity of Bacterial Functional Genes
To assess the functional potential of sediment bacterial communities, we applied QMEC technology to quantitatively profile key functional genes involved in carbon (C), nitrogen (N), phosphorus (P), sulfur (S), and methane metabolism cycles. Most target genes were successfully detected, with only a few exceptions (exo-chi, cdaR in C cycle; hzsA in N cycle; cphy in P cycle) remaining below detection limits.
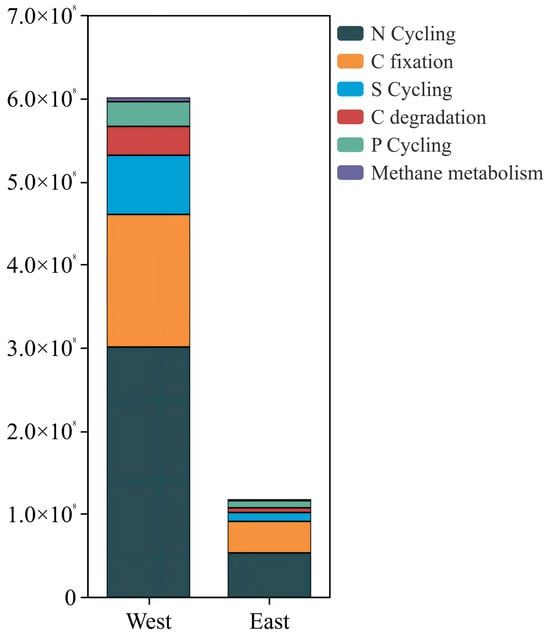
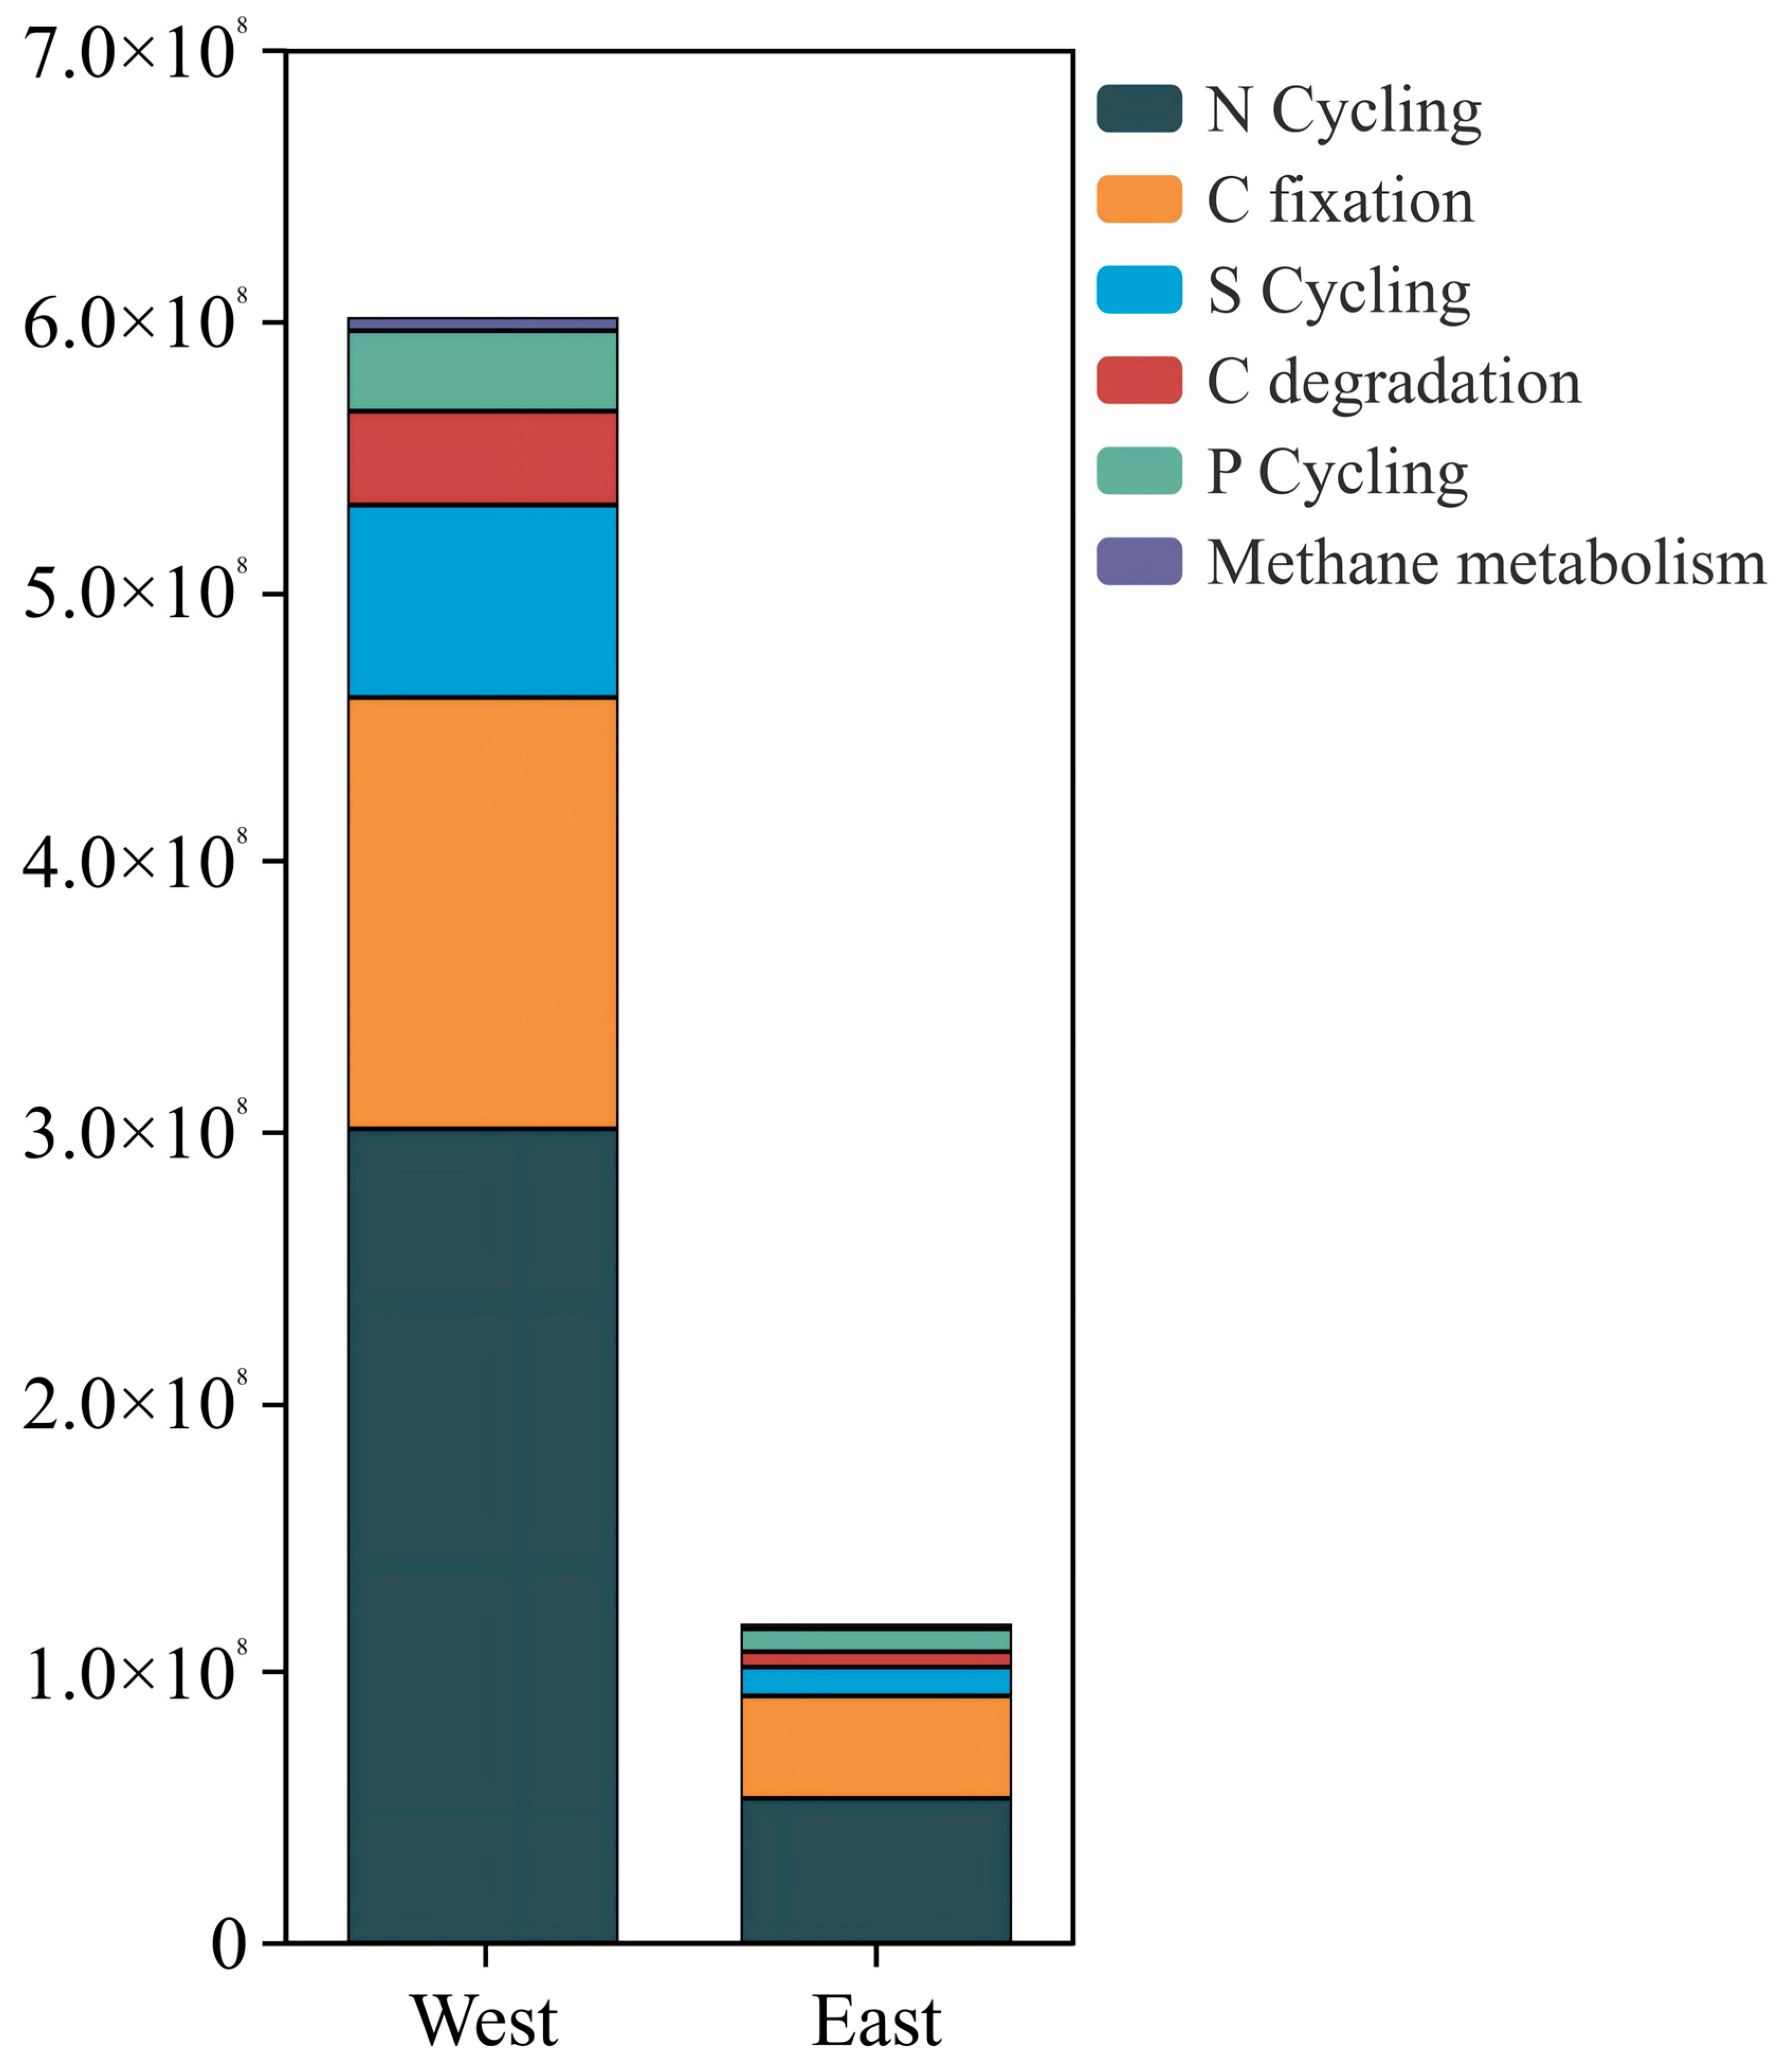
The functional gene stacking diagram (Figure 5) illustrates the compositional structure of the six major functional categories in eastern and western sediments. In both regions, N-cycling genes dominated, accounting for the largest proportion, followed by C-fixation and S-cycling genes, while C-degradation, P-cycling, and methane metabolism genes contributed relatively minor fractions. Although the overall composition was broadly similar between the two regions, the absolute abundances of all six gene categories were substantially higher in the west than in the east, often by nearly an order of magnitude (Table 3). Specifically, N-cycling genes were most abundant in both regions, with 3.01 × 10⁸ copies/g in the west and 5.36 × 10⁷ copies/g in the east. The C fixation genes ranked second, with 1.60 × 10⁸ copies/g in the west and 3.79 × 10⁷ copies/g in the east. The abundances of the S cycling, C degradation, and P cycling genes were 7.12 × 10⁷ copies/g, 3.47 × 10⁷ copies/g, 2.98 × 10⁷ copies/g in the west, and 1.07 × 10⁷ copies/g, 5.69 × 10⁶ copies/g, and 8.44 × 10⁶ copies/g in the east. Methane metabolism genes showed the lowest abundance in both regions, with 5.09 × 10⁶ copies/g in the west and 1.97 × 10⁶ copies/g in the east.
Figure 5.
Functional gene stacking diagram (each bar represents the mean value of 18 samples from each region (2 sites × 3 field replicates × 3 technical replicates). Values are expressed as copies per gram of sediment (copies/g)).
Table 3.
Absolute Abundance of Bacterial Functional Genes in Eastern and Western Sediments (copies/g).
Z-score analysis further showed that the vast majority of genes were enriched in the west. Except for a few genes such as pox, amyA, nxrA, and amoA2 showing positive Z-values in the east, the other genes showed positive values in the west. On the contrary, only a few genes showed relatively high expression in the east, such as pox, amyA, nxrA and amoA2.
3.6. Correlation Between Bacterial Communities and Environmental Factors
Mantel tests revealed that most measured environmental factors significantly influenced community composition (Table 4). Nitrate exhibited the strongest correlation (r = 0.574, p = 0.001), identifying it as the primary chemical driver of beta diversity differentiation. Salinity and temperature also showed a significant positive correlation (r = 0.285, p = 0.001; r = 0.261, p = 0.002). In addition, TN, phosphate, TOC, and ammonium were all significantly positively correlated with community structure (p < 0.05).
Table 4.
Mantel Experiment on the Influence of Environmental Factors on the composition of Bacterial communities.
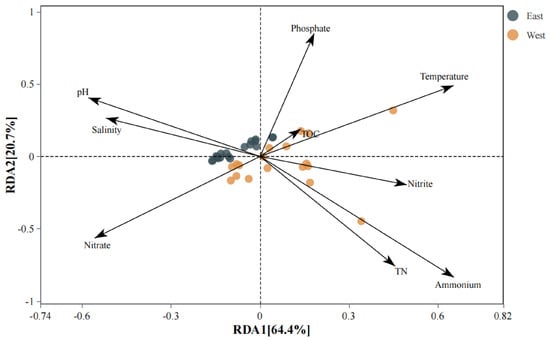
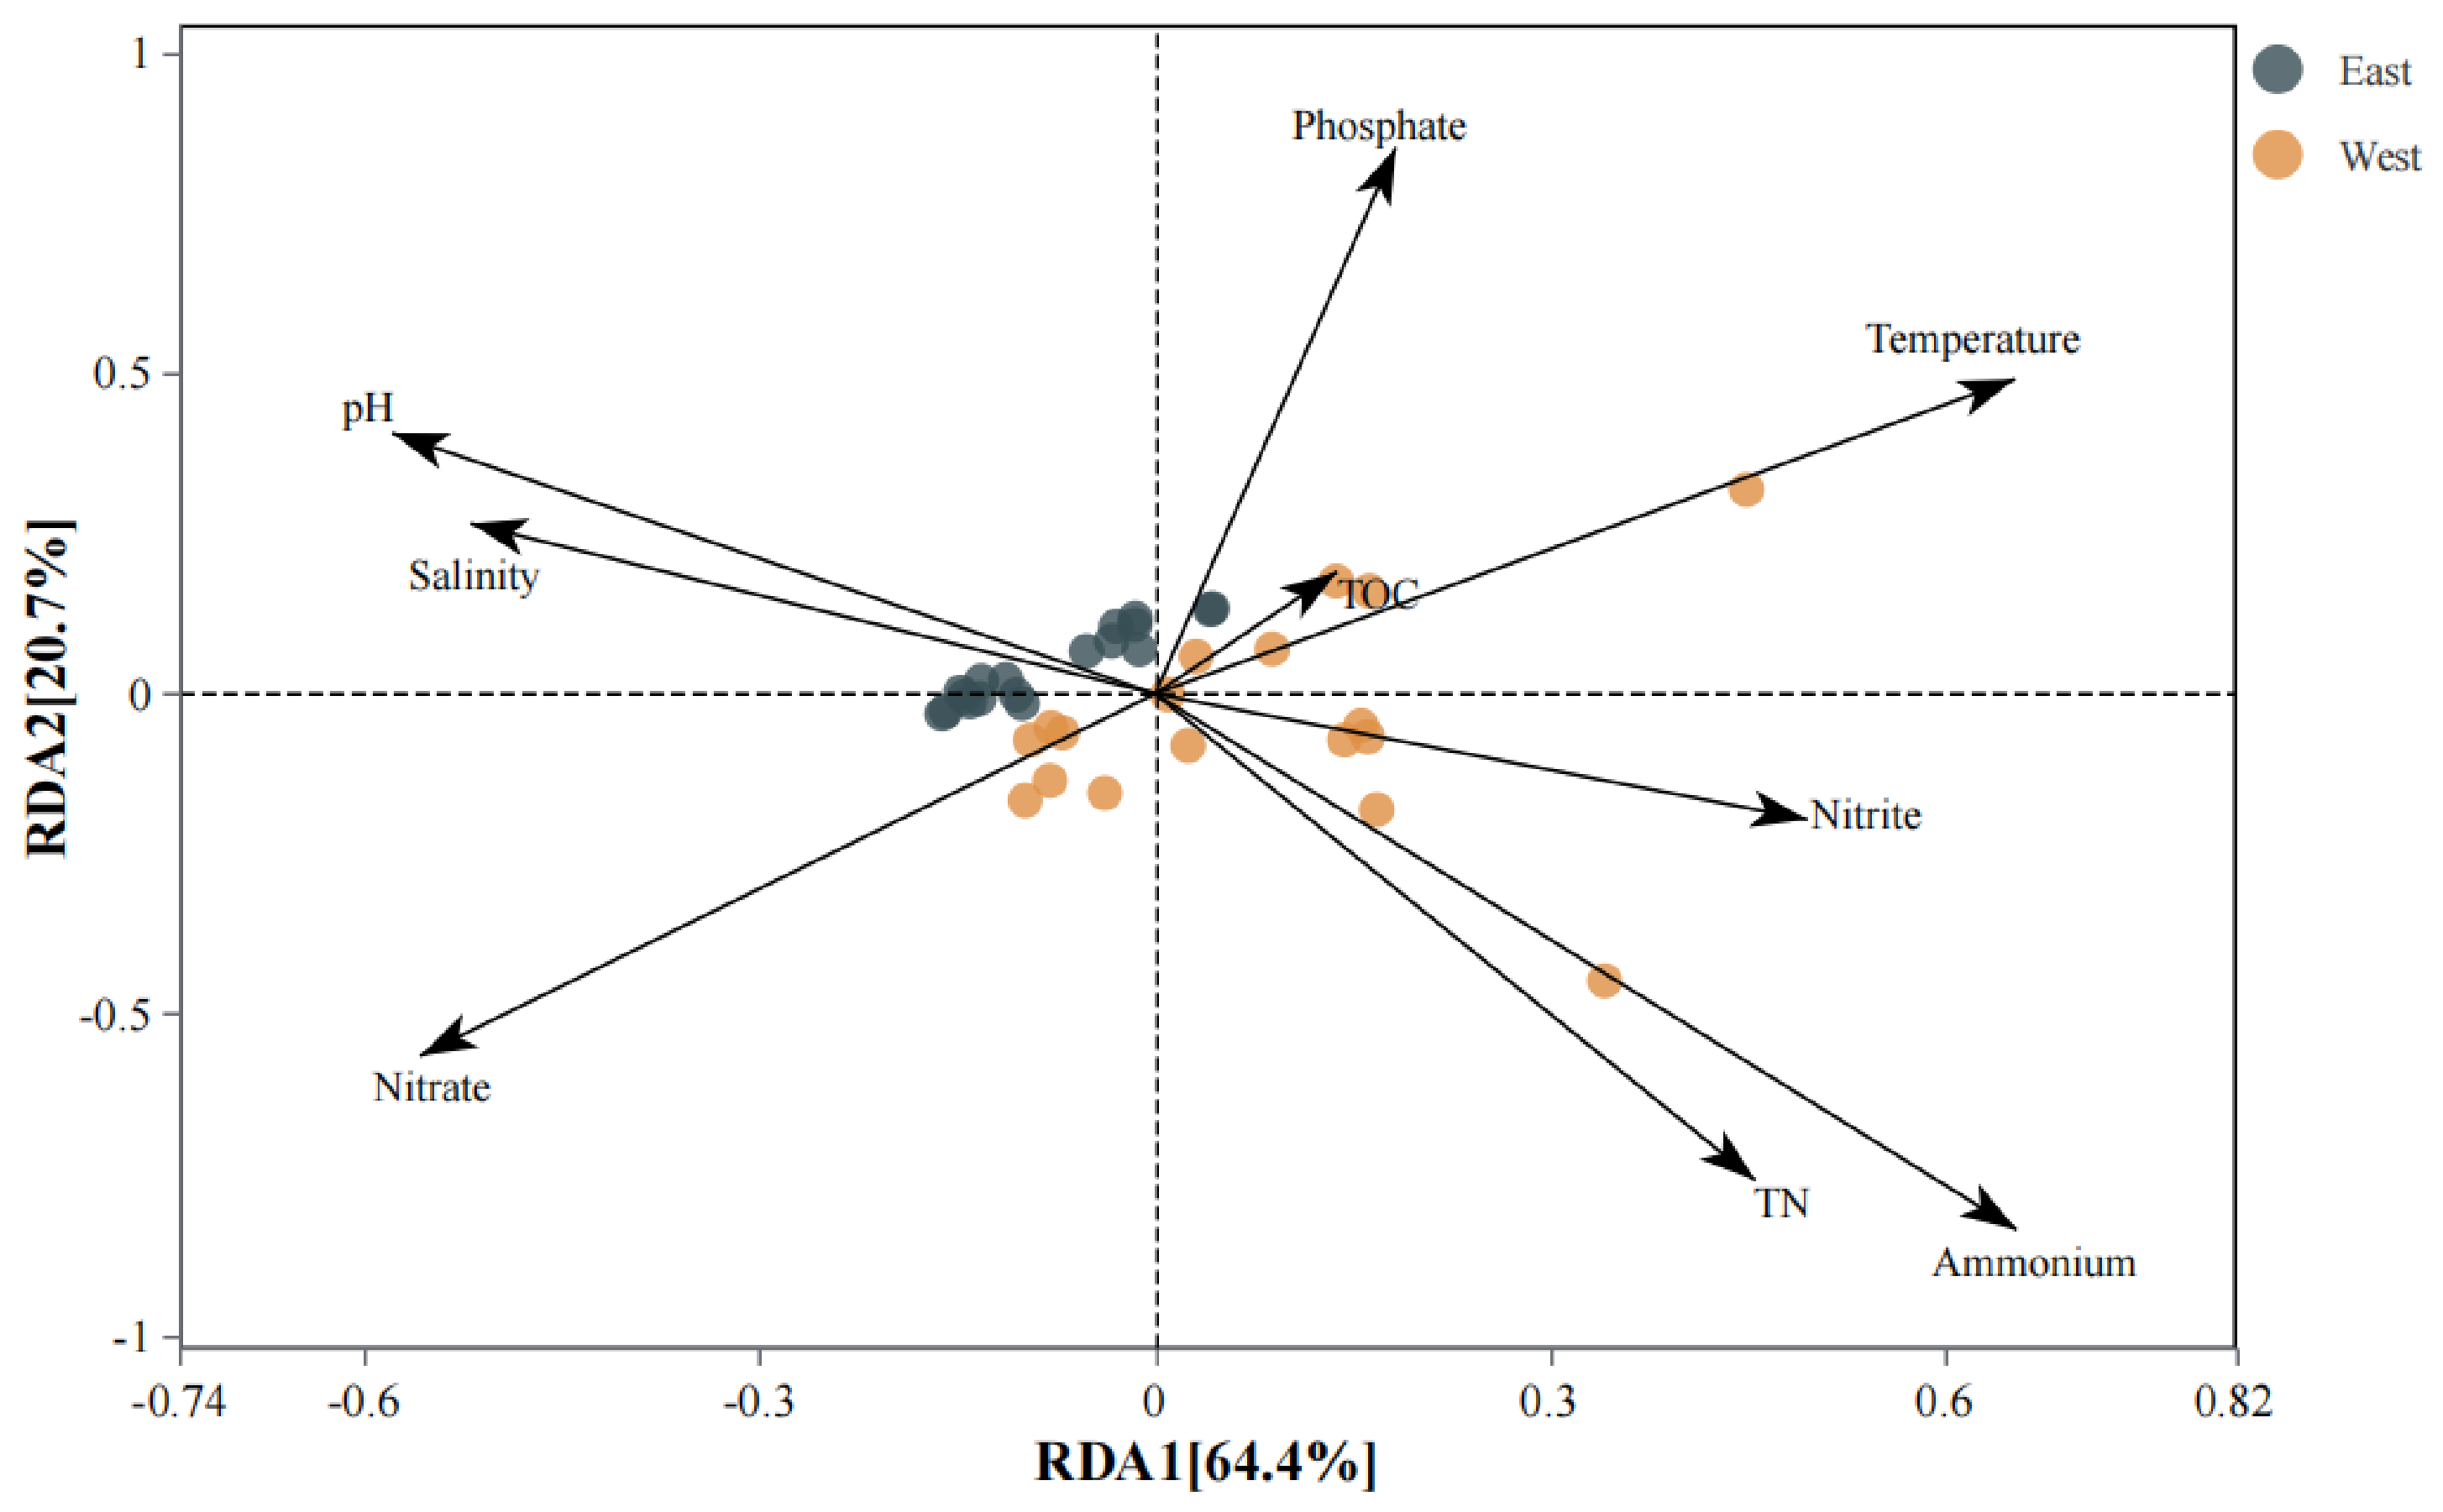
RDA visually demonstrated the influence of key environmental factors on species distribution and corroborated the results of the Mantel test. The first two axes explained 64.4% (RDA1) and 20.7% (RDA2) of the community variation, respectively (Figure 6). Nitrate and ammonium were the most significant gradients shaping species distribution, followed by temperature and phosphate as secondary drivers.
Figure 6.
RDA/CCA diagram.
Spearman correlation heatmaps revealed highly specific responses of key genes to environmental factors (Figure S3). For N-cycle genes, multiple denitrification genes (such as nirS1, nirS2, nosZ2) were highly significantly positively correlated with nitrate and TN. The amoB was positively correlated with ammonium. For C-cycle genes, C fixation genes (rbcL, acsA) were positively correlated with salinity and temperature. Certain C degradation genes (xylA, abfA) were positively correlated with TOC. For S-cycle genes, sulfate reduction genes (dsrA, dsrB) were significantly positively correlated with phosphate and salinity. For P-cycle genes, phoD was positively correlated with multiple nutrients.
4. Discussion
4.1. Responses of Bacterial Diversity to Environmental Pollution
The alpha diversity of sediment bacteria in the west was higher than that in the east. In particular, site X exhibited significantly higher values of the Shannon index (7.05), Chao1 index (3811.68), Richness index (3807.56), and PD whole tree index (139.28) than the other sampling sites. This result seemed to contradict the common assumption that pollution leads to a decline in diversity. In this study, the west coast (sites S and X) is mainly affected by domestic sewage, industrial effluents, and riverine input from the Pearl River, leading to high nutrient and organic matter loads [33,34], whereas the east coast (sites D and N) is mainly influenced by port operations, tourism, and aquaculture. Similar phenomena have also been observed in other eutrophic coastal zones [32,35]. For instance, Rubin-Blum et al. reported peak bacterial abundance and production in organic-rich, eutrophic Mediterranean sediments, attributing this to a resource-supply effect whereby nutrient enrichment creates more niches and supports diverse taxa, including pollution-tolerant and degradative groups [44]. This explains our west results: despite high ammonium (20.3 ± 2.63 mg/kg) and organic matter loads (TOC 20,656 ± 3250 mg/kg) at site X, the abundant carbon and energy sources sustain high diversity, consistent with the view that moderate disturbance can alleviate competitive exclusion and promote coexistence [44,45]. The exceptionally high ammonium at site X may reflect intense land-derived nitrogen input.
In contrast, although the east is generally less polluted, it exhibits strong internal heterogeneity. Site D was characterized by high nitrate (143.08 ± 7.05 mg/kg), while site N was characterized by high TOC (41,189 ± 2886 mg/kg). These two contrasting conditions favored specific functional groups, such as the enrichment of nitrification-related groups at site D (Pir4-lineage, Burkholderia-Caballeronia-Paraburkholderia) and the enrichment of refractory organic matter-utilizing groups at site N (Lewinella, Fulvivirga, Sulfurovum), resulting in decreased overall evenness. Meanwhile, the east was frequently disturbed by tourism and aquaculture activities, which may lead to a simpler community structure. Although there was no significant difference in the Chao1 and Richness indices between the east and the west (p > 0.05), the difference in the Shannon index between them was significant (p = 0.044), indicating that the difference in species evenness was a more sensitive indicator for distinguishing bacterial diversity between the east and the west. This finding was consistent with the research of Galand et al., who argued that evenness often better reflects community responses to environmental disturbance than richness, as it captures shifts in the balance between dominant and rare taxa [45].
4.2. Environmental Drivers of Community Structure Differentiation
Beta diversity analysis confirmed that the community structure of the east and west was significantly separated. NMDS analyses showed that samples from the east and west form two clearly separated clusters (Figure 4). ANOSIM analysis further confirmed that the differences between groups are significant (R = 0.334, p = 0.001). ANOSIM analyses in the west and the east both showed extremely significant inter-group differences (R = 0.4472, R = 0.9959 and p = 0.001), indicating that the inter-sampling site differences within the region were even greater than the overall differences between the east and west. Within the west, site X was characterized by exceptionally high ammonium (20.3 ± 2.63 mg/kg) and organic matter loads (TOC 20,656 ± 3250 mg/kg), whereas site S had much lower levels. This internal heterogeneity suggests that the west should not be treated as a homogeneous unit, and that site-level environmental gradients play a key role in shaping bacterial community structure. Similar spatial heterogeneity has also been reported in the sediments of the Yangtze River Estuary where within-estuary variation can exceed between-estuary differences [46]. The uneven distribution of TOC suggests that its spatial pattern does not simply mirror overlying water nutrient concentrations but reflects complex heterogeneity in organic matter sources, accumulation, and degradation. The marked separation between site S and site X within the west aligns with the observed gradients in nutrients and organic matter between these two sites.
The Mantel test and RDA further indicated that nitrate was the strongest environmental factor driving community structure differentiation (r = 0.574, p = 0.001), followed by salinity (r = 0.285, p = 0.001), temperature (r = 0.261, p = 0.002), ammonium (r = 0.139, p = 0.04) and TOC (r = 0.148, p = 0.02). The ecological significance of nitrate as a key driving factor has been confirmed in multiple coastal zones, including the sediments of Jiaozhou Bay [18]. Nitrate typically originates from anthropogenic inputs (agricultural runoff, wastewater), serving as an indicator of human disturbance [2]. Overall, community differentiation reflects combined effects of natural gradients (salinity, temperature) and anthropogenic nutrient loading, with nitrate as the central link between terrestrial inputs and bacterial shifts. The significant correlations between environmental factors and community structure suggest that freshwater input and spatial temperature gradients both play important roles in community assembly.
4.3. Environmental Adaptation Mechanisms of Indicator Bacterial Groups
Bacterial community composition revealed clear west–east differentiation at phylum to genus levels (Figure 3), with indicator taxa distributions closely matching local environmental conditions. The highest relative abundance of Sulfurovum was 13.7% at site X, significantly higher than in other sites. Sulfurovum was a representative sulfur-oxidizing chemolithoautotroph, initially discovered in extreme habitats such as deep-sea hydrothermal vents [47], and later detected in various marine reductive environments [48,49]. In this study, the enrichment of Sulfurovum at site X was highly consistent with the high organic matter load (TOC 20,656 ± 3250 mg/kg) and reducing environment. Similar observations in tsunami sediments showed Sulfurovum involvement in sulfur oxidation under aerobic exposure [50], likely reflecting periodic redox fluctuations at site X. Meanwhile, the abundance of S-cycle genes in the west (7.12 × 10⁷ copies/g) was much higher than that in the east (1.07 × 10⁷ copies/g), further confirming the activity of the S cycling in the sediments of the west [4]. Wenzhouxiangella and Robiginitalea were also enriched at site X (4.4% and 3.7%), together shaping its unique bacterial signature. The higher relative abundance of Campylobacterota at site X implies a more reduced sediment environment there.
Burkholderia-Caballeronia-Paraburkholderia, known for aromatic compound degradation [51], was more abundant in the east (4.9%, especially at site D with 6.2%) than in the west (0.8%), likely reflecting terrestrial organic pollution inputs. The relative abundance of Phaeodactylibacter in the east (9.0%) was significantly higher than in the west (1.2%). This genus was closely related to algal degradation [52], which may be related to the extremely high TOC (41,189 ± 2886 mg/kg) at site N.
Rhodopirellula and Blastopirellula were among the top genera across all sites, indicating their core status in these coastal sediments. Planctomycetota played an important role in the marine N cycle, and some groups had anaerobic ammonium oxidation capacity [53]. The genome of Rhodopirellula contained a large number of sulfatase genes, which were involved in the degradation of complex polysaccharides [54], indicating its potential function in organic matter degradation. In this study, Rhodopirellula was more abundant in the east (16.0%) than in the west (7.4%), which may be related to its response to specific organic matter.
The ANOSIM analysis indicated that the bacterial communities of the two sites are almost completely separated. This difference was highly correlated with the environmental characteristics of the two regions. Site D was characterized by high nitrate (143.08 ± 7.05 mg/kg), and relevant nitrate-oxidizing groups were selected. While site N had extremely high TOC (41,189 ± 2886 mg/kg), enriching organic matter-degrading groups such as Phaeodactylibacter. This environment-driven selection aligns with findings from Australian coastal sediments, where local conditions predominantly determine community composition [55].
4.4. Functional Gene Potential and Environmental Adaptation
QMEC revealed that absolute abundances of all six functional gene categories were orders of magnitude higher in western sediments than in eastern ones. Specifically, N-cycle genes in the west (3.01 × 10⁸ copies/g) were approximately 5.6 times higher than that in the east (5.36 × 10⁷ copies/g), and S-cycle genes in the west (7.12 × 10⁷ copies/g) were approximately 6.7 times higher than those in the east (1.07 × 10⁷ copies/g). C-degrading genes in the west (3.47 × 10⁷ copies/g) were approximately 6.1 times higher than that in the east (5.69 × 10⁶ copies/g) (Table 3). Despite these abundance differences, gene compositional structure remained largely similar between the east and west (Figure 5), suggesting that environmental stress primarily modulates gene abundance rather than diversity. Western sediments thus exhibit greater elemental cycling potential, particularly for nitrogen removal and sulfur transformation, consistent with Zheng et al. [11], who found that abundance changes often outweigh compositional shifts under environmental gradients. The larger reservoir of functional gene resources in the west suggests substantially higher bacterial genetic potential in this region.
The high nutrient content (ammonium 20.3 ± 2.63 mg/kg) and high organic matter load (TOC 20,656 ± 3250 mg/kg) in the west likely support higher bacterial biomass and gene abundance, while complex pollutant mixtures further induce gene abundance [10]. Similar substrate-driven regulation has been observed in agricultural soils, where denitrification gene (nirK, nirS, nosZ) abundances correlated positively with organic carbon and nitrogen content [56].
Communities in the west were enriched in denitrification genes (nirS, nosZ), adapted to high nitrogen and reducing conditions; the east communities showed relative enrichment in ammonia oxidation (amoA2) and nitrification (nxrA) genes, adapted to higher nitrate and oxidized conditions. This pattern aligns with community compositional shifts and reflects overall bacterial adaptation to environmental stress [57]. Z-score analysis further supported this: genes such as pox (C degradation), amyA (C degradation), nxrA (nitrification), and amoA2 (ammonia oxidation) had positive Z-score values in the east, indicating more active aerobic nitrification and specific C-degradation pathways there.
At the genus level, the high abundance of Sulfurovum at site X (13.7%) closely paralleled the high abundance of S-cycle genes in the west (7.12 × 10⁷ copies/g), implicating Sulfurovum as a major contributor to sulfur oxidation, as its genome contains complete sox gene clusters for sulfide/thiosulfate oxidation [58]. This distribution pattern aligns with a recent study in the Beibu Gulf, which also found that sulfur oxidation genes dominated in nearshore sediments, underscoring the critical role of geographical location in shaping sulfur cycling potential [59]. The high abundance (4.9%) of Burkholderia-Caballeronia-Paraburkholderia in the east may be linked to the organic pollutant degradation capabilities carried by this group [51].
4.5. Distribution Characteristics of Nitrogen-Cycle Genes and Their Environmental Regulation
QMEC analysis revealed that N-cycle genes dominated the gene pool in both eastern and western sediments, confirming coastal zones as hotspots for nitrogen transformation [60]. Their total abundance in the west (3.01 × 10⁸ copies/g) was markedly higher than that in the east (5.36 × 10⁷ copies/g). This result was consistent with the high ammonium (20.3 ± 2.63 mg/kg) and high TN (1289 ± 209 mg/kg) in the west, indicating that the terrestrial nitrogen input directly promoted the functional potential of N-cycling bacteria [61]. Denitrification genes (nirS1, nirS2, nosZ2) were positively correlated with nitrate and TN, aligning with previous findings that denitrification potential increases with nitrogen availability [62]. The high nitrogen load in the west thus provides favorable conditions for denitrification. Conversely, the ammonia oxidation gene (amoB) correlated positively with ammonium, suggesting ammonium concentration influences ammonia-oxidizer distribution and activity [63]. Genes amoA2 and nxrA in the east were relatively enriched (with positive Z-scores), which was consistent with the high nitrate (71.8 ± 42.62 mg/kg) and relatively oxidized environment in the east. However, under extremely high organic matter and nitrogen loading, bacterial interaction may shift from cooperative to competitive, potentially suppressing certain nitrogen-cycling genes such as amoA [64], suggesting that the relationship between nutrient enrichment and gene abundance is not always monotonic. The positive correlations between denitrification genes and nitrate and TN suggest that a high nitrogen load may enhance denitrification potential. The positive correlations between C fixation genes and salinity and temperature may reflect the distribution of photosynthetic or chemoautotrophic bacteria. The positive correlations between sulfate reduction genes and phosphate and salinity suggest possible coupling between sulfur and phosphorus cycling and salinity regimes. The positive correlation between phoD and multiple nutrients reflects its responsiveness in nutrient-rich environments.
Overall, the west was dominated by denitrification (nitrogen removal), while the east was dominated by nitrification (nitrogen transformation)—a strategy differentiation that aligns with regional environmental traits: high ammonium and reducing conditions in the west favor denitrifiers, whereas high nitrate and oxidizing conditions in the east support nitrifiers. This trade-off reflects community-level functional adaptation to environmental stress [65]. The enrichment of denitrification genes in the west coincided with the high abundance of facultative anaerobic groups like Sulfurovum, some strains of which (e.g., Sulfurovum denitrificans) possess complete nitrate reduction capacity, suggesting potential sulfur-oxidation-denitrification coupling [66]. In the east, the relative dominance of ammonia oxidation/nitrification genes may relate to nitrifying taxa such as Nitrospira and Nitrosomonas [67], providing a basis for predicting functional potential from community composition. In summary, nitrate was the strongest physicochemical driver of bacterial spatial differentiation in Shenzhen’s coastal sediments, acting in concert with salinity and temperature.
Notably, Comammox Nitrospira—capable of completing full nitrification independently [67,68]—was detected in our sediments. Given the contrasting nitrate-rich (east) and ammonium-rich (west) environments, different Comammox lineages may be selected for in each region, warranting further investigation.
5. Conclusions
This study reveals clear environmental gradients and distinct bacterial characteristics between the eastern and western sediments of Shenzhen. Western sediments—particularly site X—exhibited higher bacterial diversity, enhanced C, N, P, and S cycling potential, and were dominated by sulfur-oxidizing bacteria and denitrification processes. In contrast, eastern sediments showed higher salinity, enrichment of organic-degrading and nitrification-related functional groups, and a nitrification-dominated nitrogen cycle. Nitrate emerged as the key driver shaping both community structure and functional gene distribution, acting in concert with salinity, temperature, ammonium, and TOC. These findings advance our understanding of bacterial responses to anthropogenic pressure in urbanized coastal zones and provide a scientific basis for ecological health assessment and targeted pollution management strategies.
Supplementary Materials
The following supporting information can be downloaded at: https://www.mdpi.com/article/10.3390/microorganisms14102350/s1, Figure S1. Rarefaction curve of the samples; Figure S2. Relative Abundance of the samples in Genus Level; Figure S3. Spearman correlation heatmap between C/N/P/S cycling gene abundances and environmental factors; Table S1. Sequencing statistics for all sediment samples; Table S2. Number of OTUs and valid sequences for each sediment sample; Table S3. Z-score of individual functional genes involved in carbon (C), nitrogen (N), phosphorus (P), sulfur (S), and methane metabolism in east and west sediments.
Author Contributions
S.L. (Shuangfei Li): Conceptualization, Funding acquisition, and Supervision. H.H.: Methodology, Formal analysis, and Writing—original draft. W.Z.: Investigation and Methodology. L.O.: Conceptualization, Formal analysis, Writing—review and editing, and Funding acquisition. S.L. (Shuhua Liu): Writing—review and editing. All authors have read and agreed to the published version of the manuscript.
Funding
This work was supported by the National Natural Science Foundation of China (42507170), Guangdong Basic and Applied Basic Research Foundation (2025A1515011110), Hubei Key Laboratory of Water System Science for Sponge City Construction (Wuhan University) (2024-04), and the Shenzhen Science and Technology Program (ZDCYKCX20250901092703004 and KCXST20221021111206015).
Institutional Review Board Statement
Not applicable.
Informed Consent Statement
Not applicable.
Data Availability Statement
The original contributions presented in this study are included in the article/Supplementary Materials. Further inquiries can be directed to the corresponding author.
Conflicts of Interest
The authors declare no conflicts of interest.
References
- Alyazichi, Y.M.; Jones, B.G.; McLean, E. Spatial and Temporal Distribution and Pollution Assessment of Trace Metals in Marine Sediments in Oyster Bay, NSW, Australia. Bull. Environ. Contam. Toxicol. 2014, 94, 52–57. [Google Scholar] [CrossRef] [Scilit]
- Howarth, R.; Chan, F.; Conley, D.J.; Garnier, J.; Doney, S.C.; Marino, R.; Billen, G. Coupled biogeochemical cycles: Eutrophication and hypoxia in temperate estuaries and coastal marine ecosystems. Front. Ecol. Environ. 2011, 9, 18–26. [Google Scholar] [CrossRef] [Scilit]
- Genitsaris, S.; Stefanidou, N.; Sommer, U.; Moustaka-Gouni, M. Phytoplankton Blooms, Red Tides and Mucilaginous Aggregates in the Urban Thessaloniki Bay, Eastern Mediterranean. Diversity 2019, 11, 136. [Google Scholar] [CrossRef] [Scilit]
- Wasmund, K.; Mußmann, M.; Loy, A. The life sulfuric: Microbial ecology of sulfur cycling in marine sediments. Environ. Microbiol. Rep. 2017, 9, 323–344. [Google Scholar] [CrossRef] [Scilit]
- Li, Y.; Xiong, L.; Yu, H.; Zeng, K.; Wei, Y.; Li, H.; Zeng, W.; Ji, X. Function and distribution of nitrogen-cycling microbial communities in the Napahai plateau wetland. Arch. Microbiol. 2023, 205, 357. [Google Scholar] [CrossRef] [Scilit]
- Orsi, W.D. Ecology and evolution of seafloor and subseafloor microbial communities. Nat. Rev. Microbiol. 2018, 16, 671–683. [Google Scholar] [CrossRef] [Scilit]
- Fuhrman, J.A.; Cram, J.A.; Needham, D.M. Marine microbial community dynamics and their ecological interpretation. Nat. Rev. Microbiol. 2015, 13, 133–146. [Google Scholar] [CrossRef] [Scilit]
- Gregory Caporaso, J.; Kuczynski, J.; Stombaugh, J.; Bittinger, K.; Bushman, F.D.; Costello, E.K.; Fierer, N.; Gonzalez Peña, A.; Goodrich, J.K.; Gordon, J.I.; et al. QIIME allows analysis of high-throughput community sequencing data. Nat. Methods 2010, 7, 335–336. [Google Scholar] [CrossRef] [Scilit]
- Langille, M.G.I.; Zaneveld, J.; Caporaso, J.G.; McDonald, D.; Knights, D.; Reyes, J.A.; Clemente, J.C.; Burkepile, D.E.; Vega Thurber, R.L.; Knight, R.; et al. Predictive functional profiling of microbial communities using 16S rRNA marker gene sequences. Nat. Biotechnol. 2013, 31, 814–821. [Google Scholar] [CrossRef] [Scilit]
- Xiang, Q.; Chen, Q.-L.; Zhu, D.; Yang, X.-R.; Qiao, M.; Hu, H.-W.; Zhu, Y.-G. Microbial functional traits in phyllosphere are more sensitive to anthropogenic disturbance than in soil. Environ. Pollut. 2020, 265, 114954. [Google Scholar] [CrossRef] [Scilit]
- Zheng, B.; Zhu, Y.; Sardans, J.; Peñuelas, J.; Su, J. QMEC: A tool for high-throughput quantitative assessment of microbial functional potential in C, N, P, and S biogeochemical cycling. Sci. China-Life Sci. 2018, 61, 1451–1462. [Google Scholar] [CrossRef] [Scilit]
- Liu, S.; Huang, X.; Mu, H.; Zheng, M.; Kuang, S.; Chen, H.; Xu, Y.; Wang, D.; Liu, H.; Li, X. Biogeography and diversity patterns of functional genes associated with C, N, P, S cycling processes across China classical sea sediments. Sci. Total Environ. 2024, 906, 167678. [Google Scholar] [CrossRef] [Scilit]
- Fan, J.; Wang, Y.; Gao, Q.; Zhong, J.; Huang, F.; Li, S.; Nie, S. Impacts of quinone addition on the functional potential of C, N, P, and S cycling and microbial community in paddy soil. Appl. Soil Ecol. 2025, 214, 106398. [Google Scholar] [CrossRef] [Scilit]
- Li, H.; Bi, Q.; Yang, K.; Bo Lasson, S.; Zheng, B.; Cui, L.; Zhu, Y.; Ding, K. High starter phosphorus fertilization facilitates soil phosphorus turnover by promoting microbial functional interaction in an arable soil. J. Environ. Sci. 2020, 94, 179–185. [Google Scholar] [CrossRef] [Scilit]
- Gao, Y.; Zhu, B.; Lin, L.; Xue, Q.; Zhang, W.; Pan, X.; Dong, L. Distinct vertical profiles of microbial communities and functional genes between different lake sediment layers mediated by nutrients in the sediments and pore waters. Sci. Total Environ. 2025, 981, 179575. [Google Scholar] [CrossRef] [Scilit]
- Xie, Z.; Xiong, S.; Liu, H.; Feng, J.; Chen, X.; Yang, K.; Zhang, L.; Wang, X.; Zhang, X. Phosphorus Regulated Coordination of Carbon, Nitrogen, Sulfur and Phosphorus Cycling Genes in Sediments of a Plateau Mesotrophic Lake Erhai in Yunnan, China. Water 2025, 17, 3399. [Google Scholar] [CrossRef] [Scilit]
- Smith, J.M.; Damashek, J.; Chavez, F.P.; Francis, C.A. Factors influencing nitrification rates and the abundance and transcriptional activity of ammonia-oxidizing microorganisms in the dark northeast Pacific Ocean. Limnol. Oceanogr. 2015, 61, 596–609. [Google Scholar] [CrossRef] [Scilit]
- Dang, H.; Li, J.; Chen, R.; Wang, L.; Guo, L.; Zhang, Z.; Klotz, M.G. Diversity, Abundance, and Spatial Distribution of Sediment Ammonia-OxidizingBetaproteobacteriain Response to Environmental Gradients and Coastal Eutrophication in Jiaozhou Bay, China. Appl. Environ. Microbiol. 2010, 76, 4691–4702. [Google Scholar] [CrossRef] [Scilit]
- Jiang, Y.; Lou, X.; Wang, M.; Zheng, M.; Wang, Z.; Chen, H. Genetic and transcriptional profiles of ammonia oxidizing communities in Bohai sediments: Abundance, activity, and environmental correlations. Front. Microbiol. 2025, 16, 1611213. [Google Scholar] [CrossRef] [Scilit]
- Luo, Z.; Xu, W.; Li, M.; Gu, J.; Zhong, T. Spatial distribution and abundance of ammonia-oxidizing microorganisms in deep-sea sediments of the Pacific Ocean. Antonie Leeuwenhoek 2015, 108, 329–342. [Google Scholar] [CrossRef] [Scilit]
- He, H.; Zhen, Y.; Mi, T.; Lu, X.; Yu, Z. Seasonal and spatial distribution of ammonia-oxidizing microorganism communities in surface sediments from the East China Sea. Acta Oceanol. Sin. 2015, 34, 83–92. [Google Scholar] [CrossRef] [Scilit]
- Arfken, A.; Song, B.; Bowman, J.S.; Piehler, M. Denitrification potential of the eastern oyster microbiome using a 16S rRNA gene based metabolic inference approach. PLoS ONE 2017, 12, e0185071. [Google Scholar] [CrossRef] [Scilit]
- Müller, A.L.; Pelikan, C.; de Rezende, J.R.; Wasmund, K.; Putz, M.; Glombitza, C.; Kjeldsen, K.U.; Jorgensen, B.B.; Loy, A. Bacterial interactions during sequential degradation of cyanobacterial necromass in a sulfidic arctic marine sediment. Environ. Microbiol. 2018, 20, 2927–2940. [Google Scholar] [CrossRef] [Scilit]
- Quillet, L.; Besaury, L.; Popova, M.; Paissé, S.; Deloffre, J.; Ouddane, B. Abundance, Diversity and Activity of Sulfate-Reducing Prokaryotes in Heavy Metal-Contaminated Sediment from a Salt Marsh in the Medway Estuary (UK). Mar. Biotechnol. 2011, 14, 363–381. [Google Scholar] [CrossRef] [Scilit]
- Burgin, A.J.; Hamilton, S.K. NO3−-Driven SO42− Production in Freshwater Ecosystems: Implications for N and S Cycling. Ecosystems 2008, 11, 908–922. [Google Scholar] [CrossRef] [Scilit]
- Nie, S.; Mo, S.; Gao, T.; Yan, B.; Shen, P.; Kashif, M.; Zhang, Z.; Li, J.; Jiang, C. Coupling effects of nitrate reduction and sulfur oxidation in a subtropical marine mangrove ecosystem with Spartina alterniflora invasion. Sci. Total Environ. 2023, 862, 160930. [Google Scholar] [CrossRef] [Scilit]
- Koch, H.; van Kessel, M.A.H.J.; Lücker, S. Complete nitrification: Insights into the ecophysiology of comammox Nitrospira. Appl. Microbiol. Biotechnol. 2018, 103, 177–189. [Google Scholar] [CrossRef] [Scilit]
- Yang, X.; Yu, X.; Ming, Y.; Liu, H.; Zhu, W.; Yan, B.; Huang, H.; Ding, L.; Qian, X.; Wang, Y.; et al. The vertical distribution and metabolic versatility of complete ammonia oxidizing communities in mangrove sediments. Environ. Res. 2025, 277, 121602. [Google Scholar] [CrossRef] [Scilit]
- Yu, B.; Zeng, Q.; Zhou, Q.; Wu, S. DNA-SIP unveiled niche differentiation of active ammonia oxidizers in stratified sediments of the Three Gorges Reservoir. Environ. Technol. Innov. 2025, 40, 104381. [Google Scholar] [CrossRef] [Scilit]
- Zhu, G.; Wang, S.; Li, Y.; Zhuang, L.; Zhao, S.; Wang, C.; Kuypers, M.M.M.; Jetten, M.S.M.; Zhu, Y. Microbial pathways for nitrogen loss in an upland soil. Environ. Microbiol. 2018, 20, 1723–1738. [Google Scholar] [CrossRef] [Scilit]
- Heery, E.C.; Hoeksema, B.W.; Brown, N.K.; Reimer, J.D.; Ang, P.O.; Huang, D.; Friess, D.A.; Chou, L.M.; Loke, L.H.L.; Saksena-Taylor, P.; et al. Urban coral reefs: Degradation and resilience of hard coral assemblages in coastal cities of East and Southeast Asia. Mar. Pollut. Bull. 2018, 135, 654–681. [Google Scholar] [CrossRef] [Scilit]
- Ouyang, L.; Chen, X.; Zhang, W.; Li, S.; Huang, Q.; Zhang, Y.; Yan, C. High Throughput Sequencing Reveals Distinct Bacterial Communities and Functional Diversity in Two Typical Coastal Bays. J. Mar. Sci. Eng. 2022, 10, 1878. [Google Scholar] [CrossRef] [Scilit]
- Zhang, M.; Chen, G.; Luo, Z.; Sun, X.; Xu, J. Spatial distribution, source identification, and risk assessment of heavy metals in seawater and sediments from Meishan Bay, Zhejiang coast, China. Mar. Pollut. Bull. 2020, 156, 111217. [Google Scholar] [CrossRef] [Scilit]
- Zhang, Q.; Ren, F.; Xiong, X.; Gao, H.; Wang, Y.; Sun, W.; Leng, P.; Li, Z.; Bai, Y. Spatial distribution and contamination assessment of heavy metal pollution of sediments in coastal reclamation areas: A case study in Shenzhen Bay, China. Environ. Sci. Eur. 2021, 33, 90. [Google Scholar] [CrossRef] [Scilit]
- Li, W.; Su, H.; Cao, Y.; Wang, L.; Hub, X.; Xu, W.; Xu, Y.; Li, Z.; Wen, G. Antibiotic resistance genes and bacterial community dynamics in the seawater environment of Dapeng Cove, South China. Sci. Total Environ. 2020, 723, 138027. [Google Scholar] [CrossRef] [Scilit]
- Zhu, W.; Liu, X.; Zhang, J.; Zhao, H.; Li, Z.; Wang, H.; Chen, R.; Wang, A.; Li, X. Response of coral bacterial composition and function to water quality variations under anthropogenic influence. Sci. Total Environ. 2023, 884, 163837. [Google Scholar] [CrossRef] [Scilit]
- Vanwonterghem, I.; Webster, N.S. Coral Reef Microorganisms in a Changing Climate. iScience 2020, 23, 100972. [Google Scholar] [CrossRef] [Scilit]
- Thompson, L.R.; Sanders, J.G.; McDonald, D.; Amir, A.; Ladau, J.; Locey, K.J.; Prill, R.J.; Tripathi, A.; Gibbons, S.M.; Ackermann, G.; et al. A communal catalogue reveals Earth’s multiscale microbial diversity. Nature 2017, 551, 457–463. [Google Scholar] [CrossRef] [Scilit]
- Caporaso, J.G.; Lauber, C.L.; Walters, W.A.; Berg-Lyons, D.; Lozupone, C.A.; Turnbaugh, P.J.; Fierer, N.; Knight, R. Global patterns of 16S rRNA diversity at a depth of millions of sequences per sample. Proc. Natl. Acad. Sci. USA 2010, 108, 4516–4522. [Google Scholar] [CrossRef] [Scilit]
- Chen, S.; Zhou, Y.; Chen, Y.; Gu, J. fastp: An ultra-fast all-in-one FASTQ preprocessor. Bioinformatics 2018, 34, i884–i890. [Google Scholar] [CrossRef] [Scilit]
- Magoč, S.T.; Steven, L. FLASH: Fast length adjustment of short reads to improve genome assemblies. Bioinformatics 2011, 27, 2957–2963. [Google Scholar] [CrossRef] [Scilit]
- Edgar, R.C. UPARSE: Highly accurate OTU sequences from microbial amplicon reads. Nat. Methods 2013, 10, 996–998. [Google Scholar] [CrossRef] [Scilit]
- Quast, C.; Pruesse, E.; Yilmaz, P.; Gerken, J.; Schweer, T.; Yarza, P.; Peplies, J.; Glöckner, F.O. The SILVA ribosomal RNA gene database project: Improved data processing and web-based tools. Nucleic Acids Res. 2012, 41, D590–D596. [Google Scholar] [CrossRef] [Scilit]
- Chase, J.M.; Leibold, M.A. Spatial scale dictates the productivity–biodiversity relationship. Nature 2002, 416, 427–430. [Google Scholar] [CrossRef] [Scilit]
- Galand, P.E.; Pereira, O.; Hochart, C.; Auguet, J.C.; Debroas, D. A strong link between marine microbial community composition and function challenges the idea of functional redundancy. ISME J. 2018, 12, 2470–2478. [Google Scholar] [CrossRef] [Scilit]
- Feng, B.; Li, X.; Wang, J.; Hu, Z.; Meng, H.; Xiang, L.; Quan, Z. Bacterial diversity of water and sediment in the Changjiang estuary and coastal area of the East China Sea. FEMS Microbiol. Ecol. 2009, 70, 236–248. [Google Scholar] [CrossRef] [Scilit]
- Inagaki, F.; Takai, K.; Nealson, K.H.; Horikoshi, K. Sulfurovum lithotrophicum gen. nov., sp. nov., a novel sulfur-oxidizing chemolithoautotroph within the ε-Proteobacteria isolated from Okinawa Trough hydrothermal sediments. Int. J. Syst. Evol. Microbiol. 2004, 54, 1477–1482. [Google Scholar] [CrossRef] [Scilit]
- Mino, S.; Kudo, H.; Arai, T.; Sawabe, T.; Takai, K.; Nakagawa, S. Sulfurovum aggregans sp. nov., a hydrogen-oxidizing, thiosulfate-reducing chemolithoautotroph within the Epsilonproteobacteria isolated from a deep-sea hydrothermal vent chimney, and an emended description of the genus Sulfurovum. Int. J. Syst. Evol. Microbiol. 2014, 64, 3195–3201. [Google Scholar] [CrossRef] [Scilit]
- Wang, J.; Zheng, Q.; Wang, S.; Zeng, J.; Yuan, Q.; Zhong, Y.; Jiang, L.; Shao, Z. Characterization of two novel chemolithoautotrophic bacteria of Sulfurovum from marine coastal environments and further comparative genomic analyses revealed species differentiation among deep-sea hydrothermal vent and non-vent origins. Front. Mar. Sci. 2023, 10, 1222526. [Google Scholar] [CrossRef] [Scilit]
- Guo, Y.; Ihara, H.; Aoyagi, T.; Hori, T.; Katayama, Y. Draft Genome Sequences of Sulfurovum spp. TSL1 and TSL6, Two Sulfur-Oxidizing Bacteria Isolated from Marine Sediment. Microbiol. Resour. Announc. 2022, 11, e00922-21. [Google Scholar] [CrossRef] [Scilit]
- Pérez-Pantoja, D.; De la Iglesia, R.; Pieper Dietmar, H.; González, B. Metabolic reconstruction of aromatic compounds degradation from the genome of the amazing pollutant-degrading bacterium Cupriavidus necator JMP134. FEMS Microbiol. Rev. 2008, 32, 736–794. [Google Scholar] [CrossRef] [Scilit]
- Chen, Z.; Lei, X.; Lai, Q.; Li, Y.; Zhang, B.; Zhang, J.; Zhang, H.; Yang, L.; Zheng, W.; Tian, Y.; et al. Phaeodactylibacter xiamenensis gen. nov., sp. nov., a member of the family Saprospiraceae isolated from the marine alga Phaeodactylum tricornutum. Int. J. Syst. Evol. Microbiol. 2014, 64, 3496–3502. [Google Scholar] [CrossRef] [Scilit]
- Strous, M.; Fuerst, J.A.; Kramer, E.H.; Logemann, S.; Muyzer, G.; van de Pas-Schoonen, K.T.; Webb, R.; Kuenen, J.G.; Jetten, M.S. Missing lithotroph identified as new planctomycete. Nature 1999, 400, 446–449. [Google Scholar] [CrossRef] [Scilit]
- Wegner, C.-E.; Richter-Heitmann, T.; Klindworth, A.; Klockow, C.; Richter, M.; Achstetter, T.; Glöckner, F.O.; Harder, J. Expression of sulfatases in Rhodopirellula baltica and the diversity of sulfatases in the genus Rhodopirellula. Mar. Genom. 2013, 9, 51–61. [Google Scholar] [CrossRef] [Scilit]
- Bissett, A.; Brown, M.V.; Siciliano, S.D.; Thrall, P.H. Microbial community responses to anthropogenically induced environmental change: Towards a systems approach. Ecol. Lett. 2013, 16, 128–139. [Google Scholar] [CrossRef] [Scilit]
- Henry, S.; Bru, D.; Stres, B.; Hallet, S.; Philippot, L. Quantitative detection of the nosZ gene, encoding nitrous oxide reductase, and comparison of the abundances of 16S rRNA, narG, nirK, and nosZ genes in soils. Appl. Environ. Microbiol. 2006, 72, 5181–5189. [Google Scholar] [CrossRef] [Scilit]
- Fierer, N.; Leff, J.W.; Adams, B.J.; Nielsen, U.N.; Bates, S.T.L.C.L.; Owens, S.; Gilbert, J.A.; Wall, D.H.; Caporaso, J.G. Cross-biome metagenomic analyses of soil microbial communities and their functional attributes. Proc. Natl. Acad. Sci. USA 2012, 109, 21390–21395. [Google Scholar] [CrossRef] [Scilit]
- Yamamoto, M.; Nakagawa, S.; Shimamura, S.; Takai, K.; Horikoshi, K. Molecular characterization of inorganic sulfur-compound metabolism in the deep-sea epsilonproteobacterium Sulfurovum sp. NBC37-1. Environ. Microbiol. 2010, 12, 1144–1153. [Google Scholar] [CrossRef] [Scilit]
- Che, W.; Zhao, H.; Man, Y.; Tan, X. Spatial characteristics of microbial communities and their functions in sediments of subtropical Beibu Gulf, China. Mar. Environ. Res. 2025, 207, 107077. [Google Scholar] [CrossRef] [Scilit]
- Kuypers, M.M.M.; Marchant, H.K.; Kartal, B. The microbial nitrogen-cycling network. Nat. Rev. Microbiol. 2018, 16, 263–276. [Google Scholar] [CrossRef] [Scilit]
- Fortune, J.; van de Kamp, J.; Holmes, B.; Bodrossy, L.; Gibb, K.; Kaestli, M. Dynamics of nitrogen genes in intertidal sediments of Darwin Harbour and their connection to N-biogeochemistry. Mar. Environ. Res. 2024, 198, 106500. [Google Scholar] [CrossRef] [Scilit]
- Hua, F.; Olson, B.H.; Pitiporn, A.; Wang, T.; Tsai, R.; Rosso, D. Molecular Biomarkers and Influential Factors of Denitrification in a Full-Scale Biological Nitrogen Removal Plant. Microorganisms 2019, 8, 11. [Google Scholar] [CrossRef] [Scilit]
- Prosser, J.I.; Nicol, G.W. Archaeal and bacterial ammonia-oxidisers in soil: The quest for niche specialisation and differentiation. Trends Microbiol. 2012, 20, 523–531. [Google Scholar] [CrossRef] [Scilit]
- Tao, Y.; Zhang, L.; Su, Z.; Dai, T.; Zhang, Y.; Huang, B.; Wen, D. Nitrogen-cycling gene pool shrunk by species interactions among denser bacterial and archaeal community stimulated by excess organic matter and total nitrogen in a eutrophic bay. Mar. Environ. Res. 2021, 169, 105397. [Google Scholar] [CrossRef] [Scilit]
- Fierer, N.; Lauber, C.L.; Ramirez, K.S.; Zaneveld, J.; Bradford, M.A.; Knight, R. Comparative metagenomic, phylogenetic and physiological analyses of soil microbial communities across nitrogen gradients. ISME J. 2012, 6, 1007–1017. [Google Scholar] [CrossRef] [Scilit]
- Li, W.; Zhen, Y.; Li, N.; Wang, H.; Lin, M.; Sui, X.; Zhao, W.; Guo, P.; Lin, J. Sulfur transformation and bacterial community dynamics in both desulfurization-denitrification biofilm and suspended activated sludge. Bioresour. Technol. 2022, 343, 126108. [Google Scholar] [CrossRef] [Scilit]
- Daims, H.; Lebedeva, E.V.; Pjevac, P.; Han, P.; Herbold, C.; Albertsen, M.; Jehmlich, N.; Palatinszky, M.; Vierheilig, J.; Bulaev, A.; et al. Complete nitrification by Nitrospira bacteria. Nature 2015, 528, 504–509. [Google Scholar] [CrossRef] [Scilit]
- van Kessel Maartje, A.H.J.; Speth, D.R.; Albertsen, M.; Nielsen, P.H.; Op den Camp Huub, J.M.; Kartal, B.; Jetten, M.S.M.; Lücker, S. Complete nitrification by a single microorganism. Nature 2015, 528, 555–559. [Google Scholar] [CrossRef] [Scilit]

Disclaimer/Publisher’s Note: The statements, opinions and data contained in all publications are solely those of the individual author(s) and contributor(s) and not of MDPI and/or the editor(s). MDPI and/or the editor(s) disclaim responsibility for any injury to people or property resulting from any ideas, methods, instructions or products referred to in the content. |
© 2026 by the authors. Licensee MDPI, Basel, Switzerland. This article is an open access article distributed under the terms and conditions of the Creative Commons Attribution (CC BY) license.