


Abstract
To address the limitations of existing studies on harmonic drive (HD) systems, such as the lack of systematic exploration of the influence of flexspline (FS) structural parameters on service lifetime and insufficient parameter optimization strategies, this study establishes a comprehensive research framework integrating finite element (FE) simulation, response surface optimization, and experimental validation. Three key structural parameters of FS, including cup length (CL), cup wall thickness (CT), and tooth width (TW), which were selected as design variables to investigate their effects on the displacement, von Mises stress, and fatigue lifetime of the HD system. A reliable FE model of the HD system was constructed, with mesh independence verified and experimental validation conducted using a servo motor-driven test platform. The results showed that the relative errors between simulated and measured displacement (4.7%) and stress (4.0%) were within the acceptable engineering range (<10%), confirming the model’s reliability. Systematic analysis revealed that the FS lifetime is jointly determined by global stress distribution and structural rigidity, rather than local tooth root stress alone. Increasing cup length reduces tooth root stress but increases cup wall bending stress, which ultimately dominates the fatigue failure process. Based on Box–Behnken Design (BBD) response surface analysis, the optimal parameter combination was determined as CL = 48 mm, TW = 6 mm, and CT = 0.64 mm, achieving the dual optimization of low system stress (77.7 MPa) and long FS lifetime (2950 h). Relative to the baseline control group (CL = 48 mm, CT = 0.46 mm, TW = 6 mm), the optimized configuration reduces system stress by 10.1% and extends fatigue lifetime by 1.7%. This study clarifies the multi-factor coupling mechanism of structural parameters regulating HD system performance, providing a robust theoretical basis and engineering reference for the structural design and performance improvement of HD systems.
1. Introduction
Harmonic drive (HD) is widely applied in industrial robot joints, aerospace actuators, medical imaging equipment, and precision automation systems [1,2,3,4], and it has the advantages of compact structure, lightweight design, large transmission ratio, minimal backlash, high transmission efficiency, and superior motion stability [4]. An HD system consists of three core components: the flexspline (FS), circular spline (CS), and Wave Generator (WG). Specifically, WG is an elliptical cam and acts as the primary driving component of a harmonic reducer; FS is a thin-wall cup with external teeth as the power output medium; and CS is a rigid ring with internal teeth, which provides a fixed interface for the FS.
The stress distribution and service lifetime are primary mechanical concerns in the HD system [5,6,7]. FS undergoes continuous elastic deformation induced by the WG, leading to cyclic stress. Cyclic stress causes fatigue failure due to stress concentration at the tooth root and cup wall, which are the predominant failure modes of the FS. Existing studies often only focus on reducing local tooth root stress, ignoring the influence of global structural parameters on cup wall stress and overall rigidity [4,8,9,10]. It is unclear to determine how the coupling of global stiffness and bending stress regulates the overall service lifetime of the FS, which may lead to structural designs that reduce local stress but fail to extend overall durability. Lifetime is the ultimate measure of an HD’s reliability, defining the duration it can maintain its critical precision and performance under load.
Experimental tests, mechanical analysis methods, and numerical methods (e.g., finite element method) are three commonly used methods to determine the stress distribution and service lifetime of HD systems [4,11,12,13]. In previous studies, Ivanov constructed an analytical method to predict the mesh forces acting on the FS teeth [4]. An analytical method rooted in mechanics principles was developed by Chen et al. to determine the bending moment and circumferential force of the FS tooth rim [14]. However, these conventional analytical methods fail to predict the service lifetime of HD systems due to their inability to account for nonlinear contact behaviors and fatigue damage accumulation during long-term operation. The experimental method fails to achieve accurate estimation of stress at critical locations [15,16,17].
The finite element (FE) method is a numerical analysis technique that can capture the full range of mechanical behaviors of an HD system [13,18,19,20]. Ostapski et al. applied the FE method to predict the mechanical behaviors of the cam generator and FS, with the influence of the teeth ignored in their model [21]. Wu et al. incorporated the teeth into their model to simulate the meshing force, while ignoring the effect of the ball bearing [19]. Wang et al. further considered the entire structure of the HD system to estimate its mechanical performance [20], but they neglected to evaluate how parameter variations affect the system’s overall behavior. In parallel, the fatigue and fracture properties of 40CrNiMoA have been extensively characterized: Li et al. [22] investigated the relationship between fracture toughness and tensile properties in high-strength steels, while Feng et al. [23] examined the microstructure and residual stress of GCr15-bearing steel under cryogenic treatment, providing essential material data for the present FE modeling. Zhang et al. investigated the effect of boundary conditions on the mechanical performance of HD systems [13]; however, their work still focused on static stress analysis rather than establishing a quantitative relationship between design parameters and service lifetime. Recent studies have attempted to optimize flexspline geometry to improve fatigue life through various approaches. Lee et al. [24] and Wei et al. [25] investigated the effects of single structural parameters on fatigue performance using accelerated life tests and orthogonal design methods, respectively, yet both studies focused on isolated parameter effects without considering multi-parameter coupling. In parallel, parameter sensitivity analyses have been performed in related precision transmission systems using finite element methods. For instance, Maccioni et al. [26] analyzed the effects of gear ratio and mesh density on torque ripple in cycloidal drives, while Fiorineschi et al. [27] examined the impact of dimensional errors on cycloidal drive performance. However, the mechanisms governing harmonic drives are distinct from those of cycloidal drives due to the presence of flexible cup deformation, and thus the findings from cycloidal systems cannot be directly transferred to harmonic drives. More recently, a broader range of approaches has been explored specifically for harmonic drive flexsplines. Hu et al. [28] optimized POM flexspline structural parameters and achieved a 24% increase in fatigue life using S-N curve analysis. Pan et al. [29] developed a remaining life prediction method based on flexspline crack growth, achieving a 16.2% improvement in prediction accuracy by incorporating global structural stiffness considerations. Material innovations have also been pursued; for example, CF/PEEK composites have been investigated for short flexsplines to enhance fatigue and load-bearing capacity [30]. In terms of tooth profile optimization, Yuan et al. [31] demonstrated that spatial tooth profile modification considering machining fillet features can effectively redistribute contact stress, while Li et al. [32] showed that flank modification with controlled backlash can reduce contact pressure and improve meshing performance. For multi-objective structural optimization, Li et al. [33] applied the NSGA—II algorithm to optimize flexspline thickness, length, and tooth width, achieving a balanced improvement in transmission efficiency, stiffness, and stress distribution. Despite these advances, systematic investigations on the quantitative coupling effects of cup length, wall thickness, and tooth width on fatigue lifetime remain limited, and few studies have proposed integrated response surface-based multi-parameter optimization strategies that simultaneously consider both local stress reduction and global structural integrity.
In summary, to fill these gaps, this study aims to solve the following research questions: (i) how do three key structural parameters (cup length (CL), cup wall thickness (CT), and tooth width (TW)) individually and jointly affect the displacement, von Mises stress, and fatigue lifetime of the FS? (ii) What is the optimal parameter combination that achieves both minimum system stress and maximum fatigue lifetime via multi-parameter optimization? (iii) Is the fatigue failure of the flexspline solely dominated by local tooth root stress?
To address the above research gaps, a comprehensive FE-based parameter optimization and experimental validation for the FS of the HD is conducted to address the above limitations. The primary objective is to reduce comprehensive stress concentration at the tooth root and cup wall and clarify the coupling mechanism between selected design variables to optimize the HD system lifetime. First, single-factor experiments were conducted to analyze the influence trend of each parameter on mechanical performance. Then, a Box–Behnken Design (BBD) response surface method was used to establish the quantitative relationship between design parameters and lifetime, and the optimal parameter combination was obtained. The simulated displacement and stress distribution of the FS were experimentally verified using a servo motor-driven test platform.
2. Methodology
2.1. Geometry Model of HD System
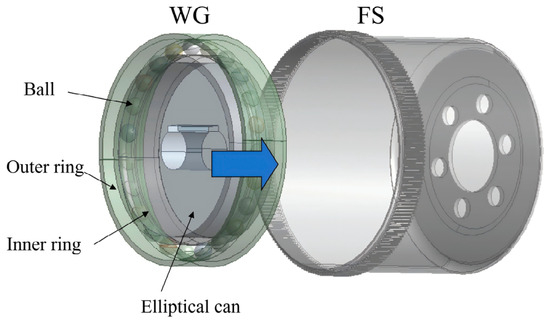
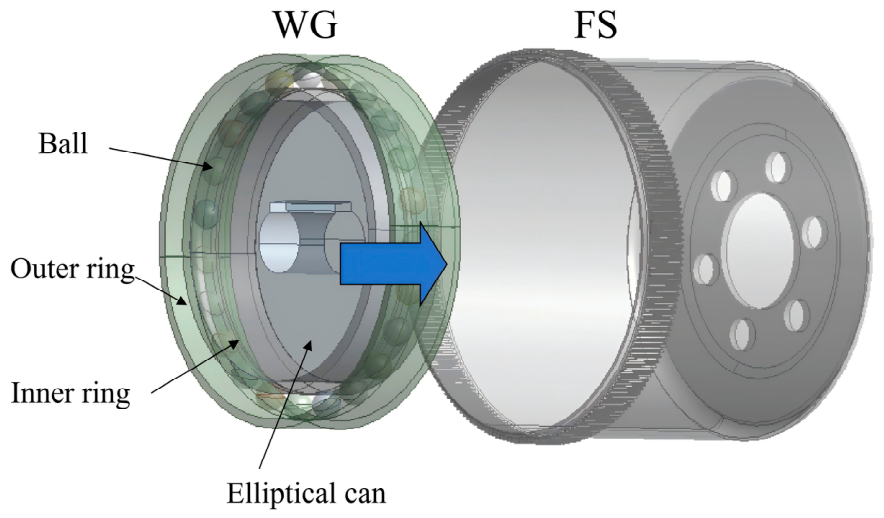
The geometry model of the HD system was constructed by using Solidworks v2024 (Dassault Systèmes S.A. Vélizy-Villacoublay, France). FS and WG are modeled individually with high geometric accuracy and their spatial positions were aligned strictly following the actual assembly sequence to ensure consistency with the HD system’s in-service configuration, which meets the precision requirements for subsequent finite element discretization and mechanical performance analysis (Figure 1). To characterize the mechanical behaviors of the HD system, four groups would be applied in this study, including the control group (CL = 48 mm, CT = 0.46 mm, and TW = 6 mm), CL = 72 mm group, CT = 0.64 mm group, and TW = 18 mm group. The model includes all core components: elliptical cam, ball bearing, inner/outer rings, flexspline with teeth, and circular spline. All geometric features were modeled according to the actual manufacturing drawings, ensuring consistency with the physical prototype.
Figure 1.
The design structure and assembly process of the HD system, and the blue arrow indicates the assembly direction of the WG and FS.
2.2. Mechanical Properties of HD System
The material of the FS component is 40CrNiMoA, a high-strength alloy steel widely utilized in precision transmission components owing to its excellent fatigue resistance and toughness. The Young’s modulus and Poisson’s ratio of 40CrNiMoA are approximately 206 GPa and 0.3, respectively. For the WG component, GCr15 (AISI 52100) was selected as the base material, with a Young’s modulus of 207 GPa and a Poisson’s ratio of 0.3. All the aforementioned material parameters were adopted from the published literature [20,22,23], ensuring consistency with the standard mechanical properties of these alloys in engineering applications. The fatigue properties of the FS and WG components are characterized by their S-N curves, as listed in Table 1; the corresponding fatigue limits for these two components are approximately 350 MPa for FS and 750 MPa for WG, respectively. Fatigue lifetime is calculated using the S-N curve method combined with Miner’s linear cumulative damage rule. The fatigue calculation adopts the same fully reversed cyclic torque load as the static structural simulation and the conversion formula between failure cycle number and service lifetime (Lifetime (h) = Cycle number/(3600 × Frequency)), where Nf is the number of cycles to fatigue failure, and f is the loading frequency (10 Hz). Based on the multi-axial stress state of the flexspline obtained from transient dynamic analysis, fatigue damage parameters are extracted in post-processing to support subsequent life calculation. First, the von Mises equivalent stress time history is converted from the full six-dimensional stress tensor of high-stress nodes within one working cycle. The rainflow counting method is then adopted to separate stress cycles with different amplitudes and mean values. Combined with the S-N curve of 40CrNiMoA material modified by the Goodman criterion, the total fatigue damage is accumulated via Miner’s linear cumulative damage rule to derive the flexspline fatigue life. This simplified engineering method introduces consistent systematic deviation across all parameter groups, which is suitable for comparative analysis of relative life trends under different structural schemes.
Table 1.
S-N curve of WG and FS materials.
2.3. Mesh Generation and Boundary Conditions
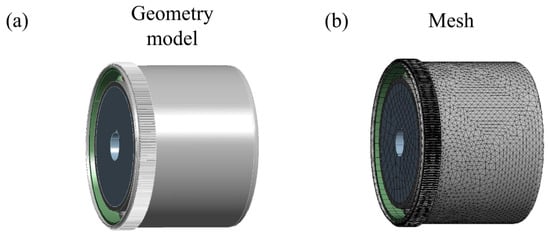
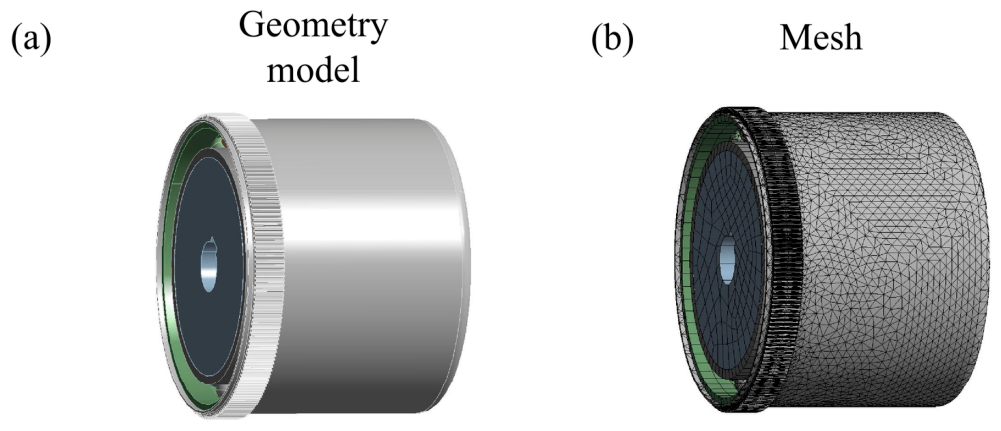
The geometric model was discretized using tetrahedral elements, resulting in an average mesh quality of 0.82 (Figure 2). By definition, a mesh quality value of 1 corresponds to an ideal element configuration, whereas values below 0.1 denote severely distorted elements that may compromise numerical stability. A refined mesh size of 0.3 mm was assigned to the FS tooth and cup wall regions, while a coarser mesh size of 0.6 mm was adopted for the remaining components to balance computational efficiency and solution accuracy. The finalized HD system model comprised approximately 70,000 elements and 150,000 nodes. To validate the mesh independence of the HD system simulation results, a mesh convergence analysis was performed using three successive mesh schemes: a coarse mesh (~40,000 elements, average size 0.8 mm), the baseline mesh described above, and a refined mesh (~100,000 elements, average size 0.3 mm) (Table 2). The maximum von Mises stress at the FS cup was selected as the convergence criterion. Results indicated that the relative deviation of the maximum von Mises stress between the baseline mesh and the refined mesh was 3.2%, which is well within the acceptable engineering threshold of 5%. This confirms that the baseline mesh configuration is sufficiently refined to eliminate mesh-dependent errors while avoiding excessive computational costs.
Figure 2.
The geometry model and mesh of HD system; (a) geometry model; and (b) mesh.
Table 2.
Mesh independence test results for the FS FE model.
Consistent with the actual operational scenario of the HD system in robotic joints, the circular spline (CS) component was fully constrained (fixed support), and a fully reversed cyclic torque with a magnitude of 600 N·m was applied to the Wave Generator (WG) as the input load. The flexspline (FS) was set as the output component with free rotational degrees of freedom. For the fatigue life calculation, this load was considered as a fully reversed cyclic torque operating at a frequency of 10 Hz. Nonlinear frictional contact interactions with a friction coefficient of 0.15 set for steel–steel contact were explicitly defined at the interfaces between all constituent components of the HD system to capture realistic contact mechanics. To ensure robust convergence of the numerical solution, the large deflection effect was activated in the solver settings. Furthermore, weak springs were incorporated into the model to eliminate spurious numerical errors induced by rigid-body motion. The iteration method was applied to discrete elasticity equations for numerical simulations, which were expressed as:
where [ε] denotes the strain matrix, [σ] is the stress matrix, [U] is the displacement matrix, [L] is the differential operator matrix, and [D] is the elastic matrix, respectively; fi denotes the volume force vector.
By assembling the stiffness matrices of all individual elements, the global stiffness matrix [K] is derived, and the final global equilibrium equation is given by:
where [F] is the external loading on the FS.
To balance numerical accuracy with computational cost, the simulation was configured with 10 steps. Under this configuration, the displacement, stress, and lifetime of the HD system were then evaluated.
2.4. Structural Parameter Optimization of HD System
The CL, CT, and TW were utilized to optimize the structural design of the HD system and improve its service lifetime. First, single-factor experiments were conducted to determine the reasonable range of each optimization variable based on existing design specifications and geometric constraints of the HD system, as shown in Table 3.
Table 3.
Factor level table for HD system structural optimization.
Subsequently, a three-factor three-level Box–Behnken Design (BBD) was adopted for response surface analysis, which requires 15 groups of experiments (including 3 center point replicates). The overall fatigue lifetime of the FS was selected as the response indicator, considering both structural strength and service reliability. The response surface models between the design variables (CL, CT, TW) and the response indicator were fitted using the least squares method. The goodness of fit of the models was evaluated by the coefficient of determination (R2) and adjusted R2, with R2 > 0.95 set as the acceptable criterion to ensure the reliability of the fitted models. With the objectives of maximizing the lifetime of the HD system and minimizing system stress (volume-weighted average von Mises stress of the entire HD assembly, element-volume weighted as output by ANSYS workbench v2020 R2 (Ansys Inc., Canonsburg, PA, USA)), the optimal combination of CL, CT, and TW was obtained via the ANSYS Workbench parameter optimization module under the given geometric constraints.
2.5. Validation of HD System Simulation Stress and Displacement
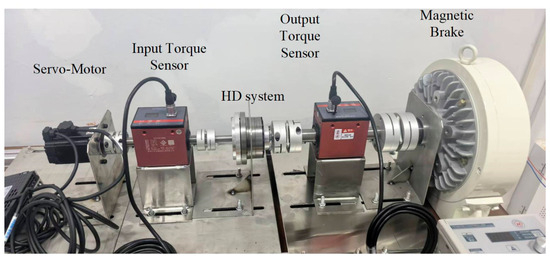
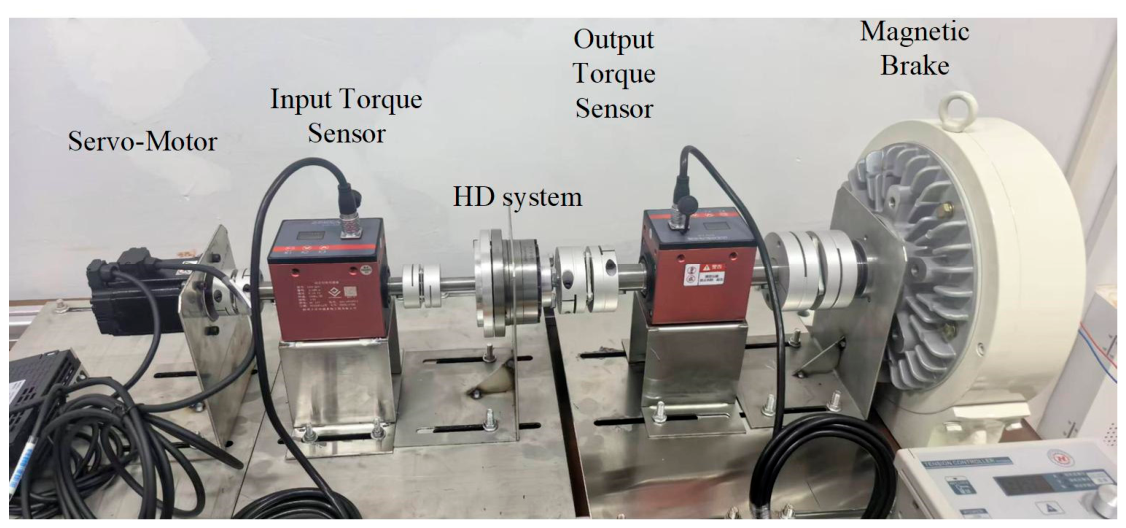
The simulated displacement and stress were verified by using a servo motor test system (Figure 3). During the test, a torque sensor integrated in the transmission assembly was used to monitor the input torque. Vibration velocity sensors, model HG-ZD-20A, were mounted on the FS output shaft to measure the axial vibration velocity of the FS. These sensors are domestically manufactured and provide 4–20 mA current output signals, which were directly connected to a programmable logic controller (PLC) for data acquisition. The displacement was then obtained by numerically integrating the measured vibration velocity signal. Each test was repeated five times to obtain average values and standard deviations. All experiments were performed at room temperature (25 ± 2 °C). During the validation tests, which lasted approximately 30 min per run, the temperature of the FS cup wall was monitored using a thermocouple; the maximum temperature rise recorded was less than 5 °C, which is considered negligible for the mechanical properties of 40CrNiMoA. For the error analysis, repeatability tests were conducted, and variance analysis was applied to determine the differences between simulated displacement and measured displacement. A relative error of less than 10% was set as the acceptable threshold for engineering validation.
Figure 3.
The servo motor system to validate the displacement and stress of the HD system.
3. Results
3.1. Simulated Displacement Distribution of HD System
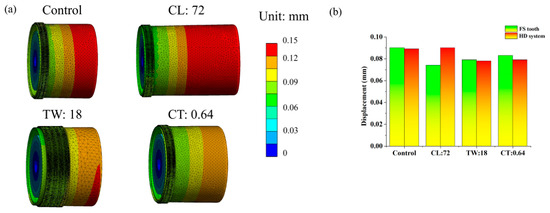
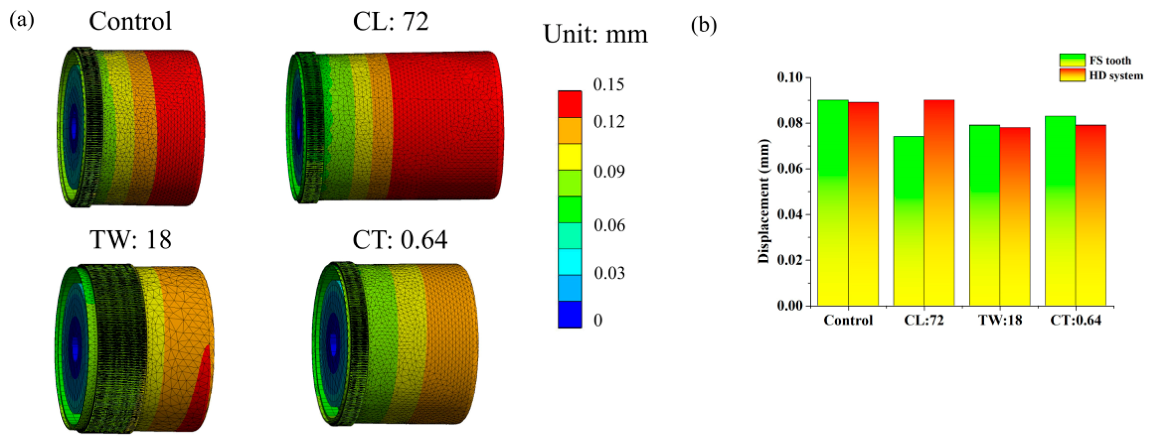
Figure 4 presents the displacement distribution of the FS in the HD system predicted by FE simulation. It can be observed that the displacements of the FS for the control group, CL = 72 mm group, TW = 18 mm group, and CT = 0.64 mm group are approximately 0.09, 0.074, 0.079, and 0.083 mm, respectively. For the HD system, the average whole HD system displacements for the control group, CL = 72 mm group, TW = 18 mm group, and CT = 0.64 mm group are 0.089, 0.09, 0.078, and 0.079 mm, respectively. Interestingly, the variation trend of the overall system displacement is not completely consistent with that of the FS teeth alone: the CL = 72 mm group, which has the smallest FS teeth displacement, exhibits a slightly higher overall system displacement than the control group, indicating that the mechanical response of the HD system is a comprehensive result of the interaction between individual components and the entire structural assembly. These displacement data provide direct mechanical evidence for evaluating the influence of key structural parameters (CL, TW, CT) on the dynamic behavior of the HD system, laying a foundation for subsequent optimization of the system’s structural design. This is because increasing CL reduces the bending stiffness of the FS cup wall, leading to larger deformation of the cup body even though the tooth deformation is reduced.
Figure 4.
The simulated displacement of HD system; (a) displacement contour map; (b) displacement comparison between the FS tooth and HD system among four groups.
3.2. Simulated Stress Distribution of HD System
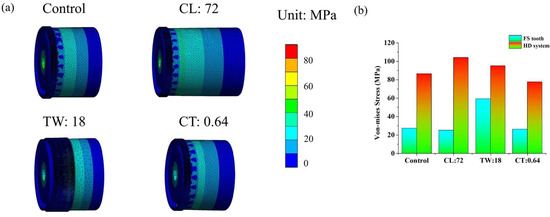
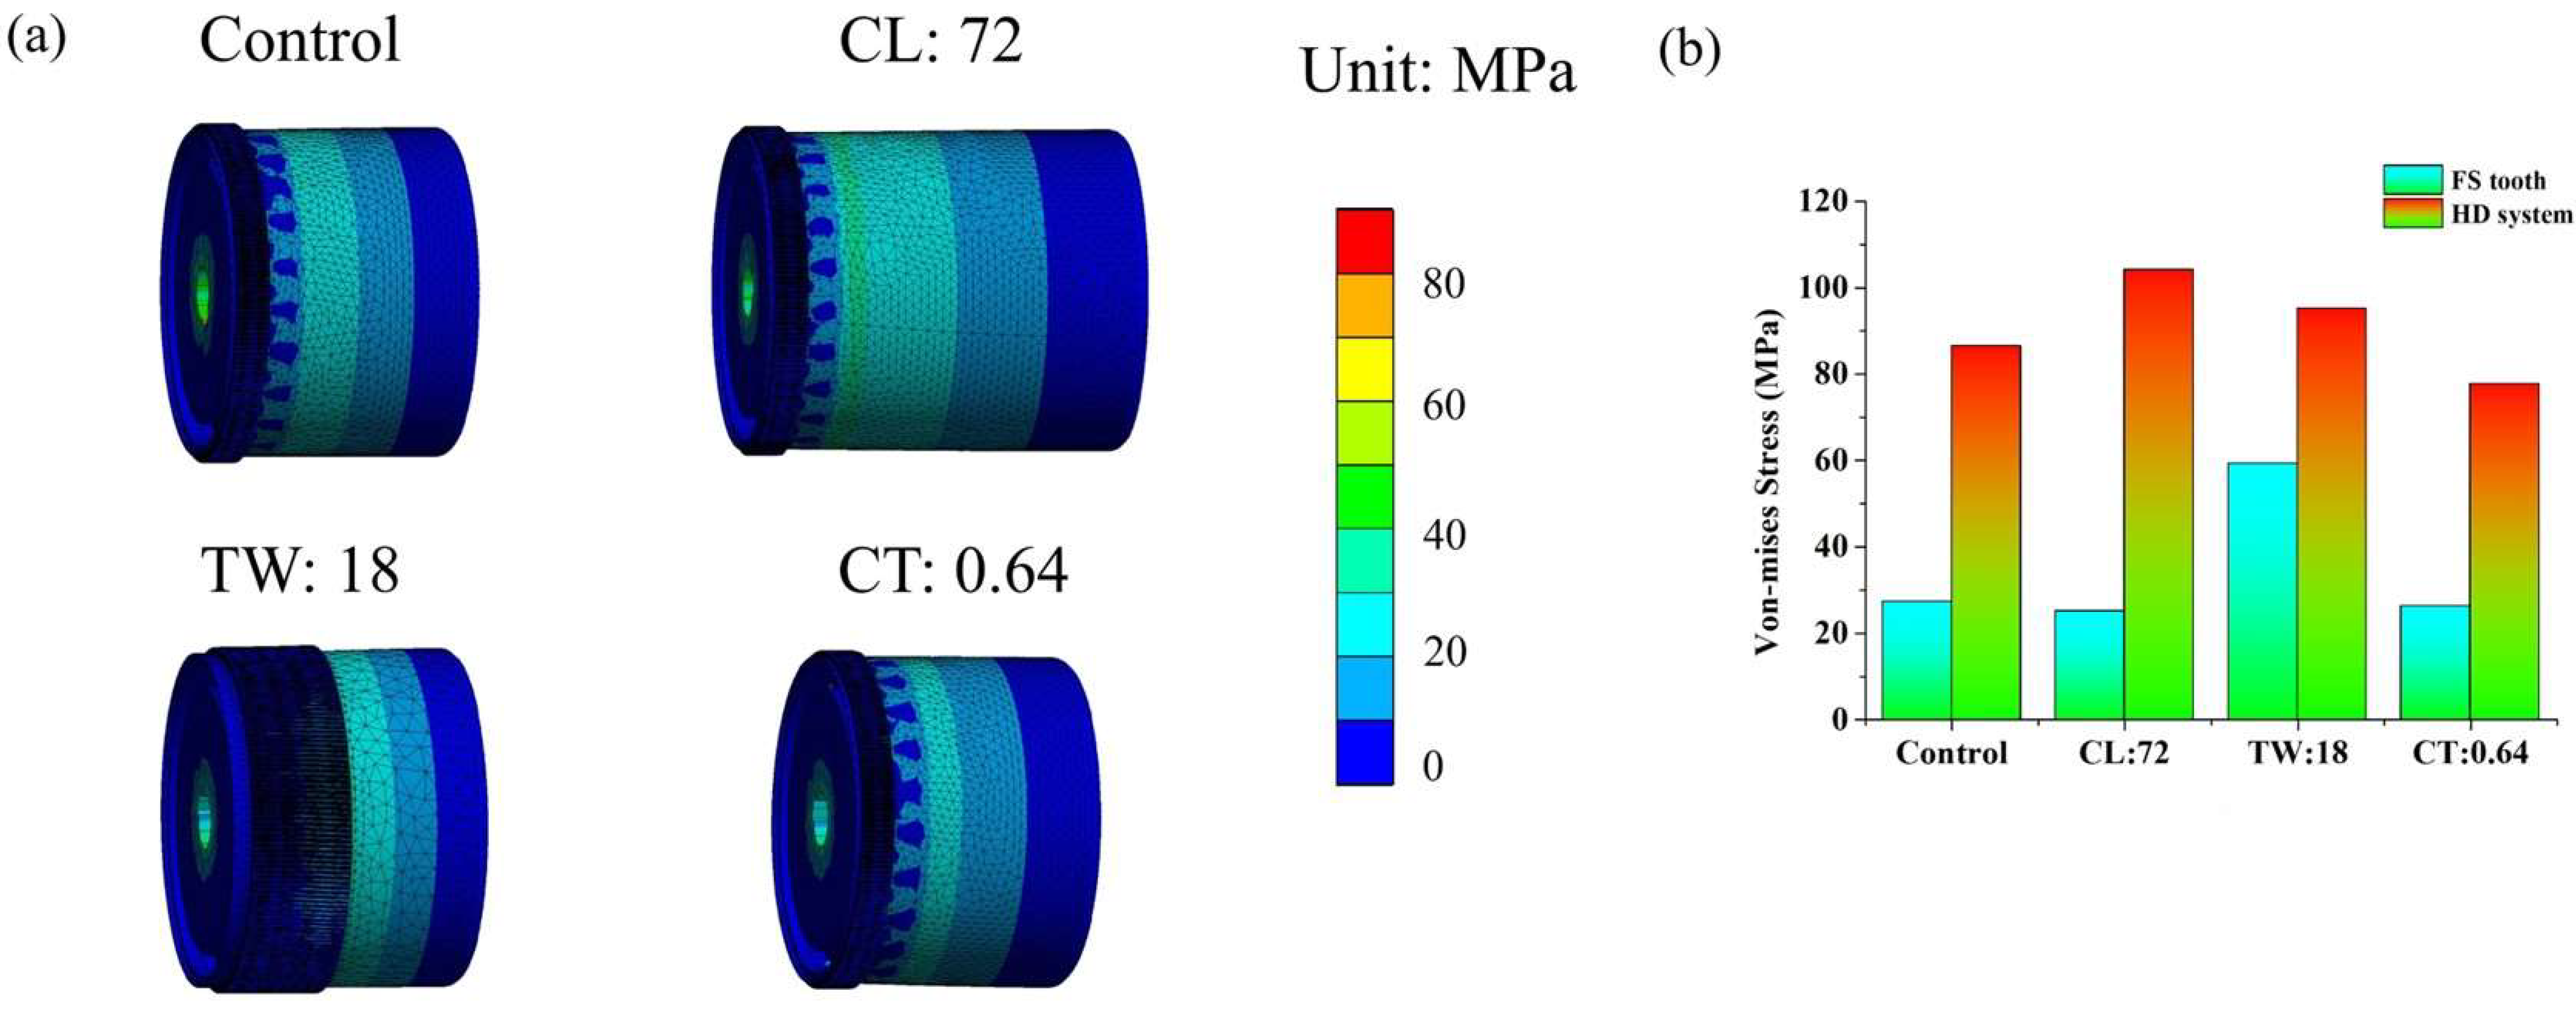
Figure 5 presents the stress distribution of the FS in the HD system predicted by FE simulation. The results reveal that the von Mises stress of the FS teeth are 27.1, 25.1, 59.2, and 26.3 MPa for the control group, CL = 72 mm group, TW = 18 mm group, and CT = 0.64 mm group, respectively. For the entire HD system, the average stress for the control group, CL = 72 mm group, TW = 18 mm group, and CT = 0.64 mm group are 86.4, 104.1, 95.1, and 77.7 MPa, respectively. In contrast to the local stress trend of the FS teeth, the CL = 72 mm group shows the maximum average stress of the whole system, while the CT = 0.64 mm group presents the lowest overall stress level, with a reduction of approximately 25.3% compared to the CL = 72 mm group. Additionally, the stress values of the FS teeth in all groups are significantly lower than the average stress of the entire HD system, reflecting the uneven stress distribution within the HD system where the FS teeth are not the primary stress-bearing component.
Figure 5.
Stress comparison between the FS tooth and cup wall among four groups; (a) stress contour map; and (b) stress comparison between the FS tooth and HD system among four groups.
3.3. Simulated Lifetime of HD Systems
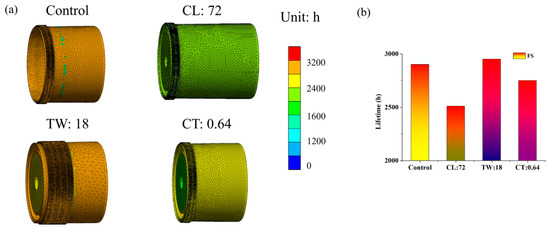
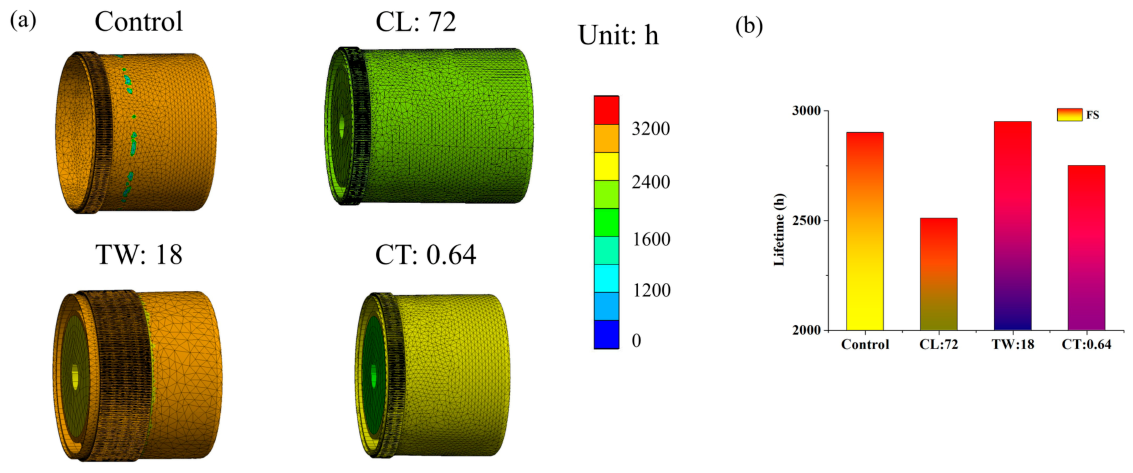
Figure 6 shows the predicted lifetime of the FS teeth in the HD system predicted by FE simulation. It can be observed that the lifetime is approximately 2900, 2510, 2950, and 2750 h for the control group, CL = 72 mm group, TW = 18 mm group, and CT = 0.64 mm group, respectively. The TW = 18 mm group exhibits the longest measured lifetime in single-factor experiments (2950 h), which is approximately 17.5% higher than that of the CL = 72 mm group (2510 h, the shortest lifetime), suggesting that moderate adjustment of structural parameters may slightly reduce the local component durability. Consistent with the fatigue life theory, the highest von Mises stress in the FS teeth of the TW = 18 mm group (59.2 MPa) corresponds to a relatively shorter lifetime compared to the control group, reflecting the negative correlation between local stress concentration and component durability. In contrast, the CL = 72 mm group, which has the lowest FS tooth stress (25.1 MPa) but the smallest FS displacement (0.074 mm), shows the shortest lifetime, indicating that excessive structural rigidity (low displacement capacity) may compromise fatigue performance despite reduced local stress. These results collectively demonstrate that the predicted lifetime of the FS teeth is a comprehensive outcome of the combined effects of stress distribution and deformation behavior, with structural parameters (CL, TW, CT) indirectly regulating durability by modifying the mechanical response of the HD system. Notably, the TW = 18 mm group has the highest tooth root stress (59.2 MPa) but achieved the longest measured lifetime (2950 h) in single-factor experiments, which is 17.5% higher than that of the CL = 72 mm group (2510 h). This confirms that the FS lifetime is not dominated by local tooth root stress alone. The CL = 72 mm group, despite having the lowest tooth root stress (25.1 MPa), has the highest cup wall bending stress (104.1 MPa) due to increased cantilever length and reduced structural rigidity, resulting in the shortest lifetime (2510 h).
Figure 6.
The simulated lifetime of the HD system; (a) lifetime contour map; (b) lifetime comparison among four groups.
3.4. Response Surface Analysis and Parameter Optimization Results of HD System
Based on the 15 groups of BBD response surface experiments, the second-order polynomial regression model for FS lifetime was established as follows (R2 = 0.962, adjusted R2 = 0.947, indicating excellent fitting accuracy):
where A is the cup length (CL, mm), B is the cup wall thickness (CT, mm), and C is the tooth width (TW, mm).
The ANOVA results for the quadratic regression model of FS lifetime (Equation (3)) are presented in Table 4. The model F-value of 28.15 and its associated p-value (<0.0001) indicate that the regression model is highly significant, with less than a 0.01% chance that this large F-value could occur due to random noise. The lack-of-fit F-value of 2.06 and its corresponding p-value of 0.183 (>0.05) are not significant, confirming that the model adequately fits the experimental data without serious prediction deficiencies within the studied design space.
Table 4.
Analysis of variance (ANOVA) for the quadratic response surface model of FS lifetime.
The coefficient of determination (R2 = 0.962) and the adjusted R2 (0.947) are in good agreement, and the predicted R2 of 0.93 is within a reasonable range of the adjusted R2 (difference < 0.2), indicating excellent model reliability. The Adeq Precision of 14.8, which measures the signal-to-noise ratio, is well above the threshold value of 4, demonstrating that the present model can effectively navigate the design space for optimization purposes.
Regarding individual factors, the p-values confirm that CL (p < 0.0001) and CT (p < 0.0001) exert the most significant main effects on FS lifetime, followed by TW with a marginal effect (p = 0.052). The interaction term CL × CT is statistically significant (p = 0.012), revealing that increasing CL while decreasing CT sharply amplifies the cup wall bending stress, thereby substantially reducing the service lifetime. This coupling effect is consistent with the physical mechanism discussed in Section 3.2, where excessive cup length increases the cantilever bending moment while reduced wall thickness weakens structural rigidity.
Based on response surface analysis, the results revealed that the interaction between CL and CT had the most significant impact on the HD system’s average stress: as CL increased and CT decreased, the overall system stress showed a sharp upward trend. For the FS tooth lifetime, the main effect of TW was dominant, while the interaction between CL and TW weakened the negative effect of local stress concentration. By optimizing the response surface (with the objectives of minimizing HD system stress and maximizing FS tooth lifetime), the optimal parameter combination was determined as CL = 48 mm, TW = 6 mm, and CT = 0.64 mm based on practical manufacture. Under this optimal configuration, the predicted HD system average stress was 77.7 MPa, and the predicted FS tooth lifetime reached 2950 h, matching the maximum measured lifetime of the TW = 18 mm group in single-factor experiments, while achieving a 25.3% reduction in system stress compared to the CL = 72 mm group. Although the TW = 18 mm group also achieved a measured lifetime of 2950 h, increasing TW would lead to a 200% increase in FS weight, a 15% increase in rotational inertia, and a reduction in transmission accuracy. Therefore, the combination of CL = 48 mm, TW = 6 mm, and CT = 0.64 mm was selected as the optimal solution, which balances lifetime, weight, and transmission performance.
3.5. Validation of HD System Stress and Displacement Distribution
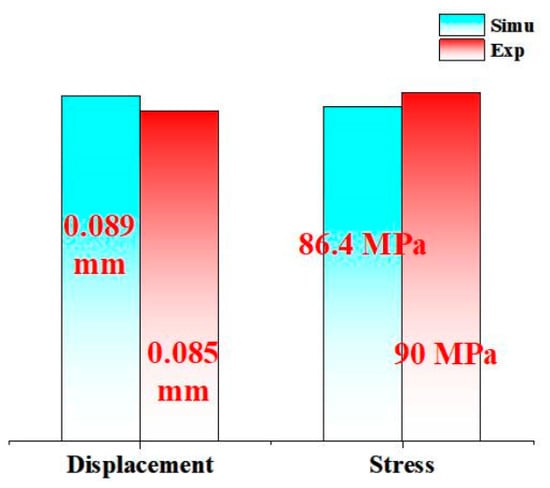
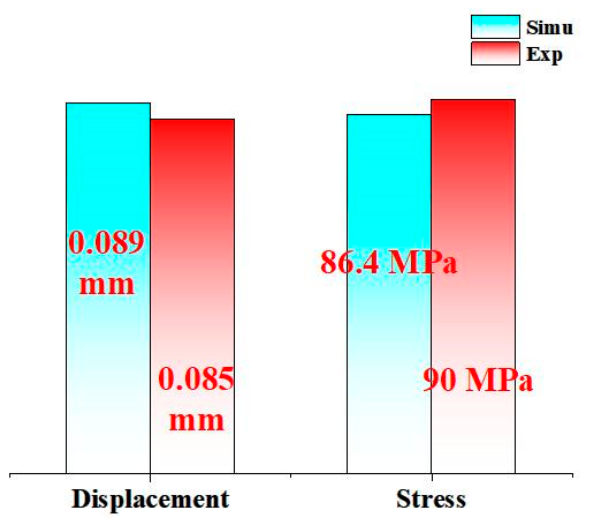
Figure 7 shows the validation results of HD system stress and displacement distribution for the control group. It can be observed that the measured HD system displacement is approximately 0.085 ± 0.002 mm and the measured stress of the HD system is approximately 90 ± 5 MPa for the control group. Compared with the simulated displacement (0.089 mm) and stress (86.4 MPa) of the control group, the relative errors of the measured values were 4.7% and 4.0%, respectively. Table 5 further compares the experimental and simulated radial displacements of the control group and three groups with structural parameters of CL = 72 mm, TW = 18 mm, and CT = 0.64 mm. Relative errors between test measurements and numerical predictions are quantified for all configurations to evaluate the fidelity of the FE model. All calculated errors are below 10%, satisfying the general engineering acceptance criterion for numerical model validation. The low error level confirms the reliability and accuracy of the established FE model, providing a solid foundation for subsequent structural parameter optimization and performance analysis. Full experimental validation of the optimized FS prototype, including both displacement and stress measurements, will be conducted in our future work.
Figure 7.
Comparison between the simulated and measured displacement and stress distributions of the HD system for control group.
Table 5.
Comparison of experimental and simulated displacement of flexsplines under different structural parameters.
4. Discussion
This study investigated the mechanical behaviors and fatigue performance of the HD system and its core component (FS teeth) via finite element simulation, with a focus on the effects of key structural parameters (CL, TW, CT) on displacement distribution, von Mises stress, and service lifetime across four experimental groups. The simulation results demonstrated that the mechanical response of the integrated HD system was not a simple superposition of individual component performances; for instance, the CL = 72 mm group exhibited the minimum FS tooth displacement but a slightly higher overall system displacement compared with the control group, which reflected the comprehensive regulatory role of component interactions in the structural assembly. In terms of stress characteristics, the FS teeth stress in all groups was significantly lower than the average stress of the entire HD system, indicating that the FS teeth are not the primary stress-bearing components of the system; meanwhile, the TW = 18 mm group showed the highest local stress of FS teeth (59.2 MPa), while the CL = 72 mm group presented the maximum average stress of the whole system (104.1 MPa). Regarding fatigue lifetime, the TW = 18 mm group achieved the longest measured lifetime in single-factor experiments (2950 h), whereas the CL = 72 mm group had the shortest lifetime (2510 h), even though it had the lowest FS tooth stress. This revealed that the durability of the FS is jointly determined by global stress distribution and structural rigidity rather than local tooth root stress alone. Collectively, these findings clarify the multi-factor coupling mechanism of structural parameters regulating the mechanical performance of the HD system, laying a theoretical foundation for subsequent parameter optimization and model validation.
Extensive prior research has established that the structural design of the FS is a critical factor governing its stress state and fatigue performance [24,25]. In agreement with these studies, our results show that the von Mises stress at the FS tooth root decreases with increasing cup length but increases with larger tooth width values, while cup wall thickness exerts a comparatively minor influence. This trend confirms the validity of our parametric analysis. Our finding that increasing cup length reduces tooth root stress but elevates cup wall bending stress is consistent with previous work [24,25]; however, we further demonstrate that the overall fatigue lifetime is governed by the coupling between global stress distribution and structural rigidity—an insight not explicitly reported in the prior literature. The response surface optimization results complement existing studies by providing a quantitative multi-parameter interaction model. Recent investigations on POM FS optimization [28] and crack-growth-based remaining life prediction [29] have further emphasized the importance of considering global structural stiffness alongside local stress. In contrast to cycloidal drives, where parameter variations primarily affect torque ripple and contact stress [26,27], the flexible cup deformation in harmonic drives introduces distinct coupling mechanisms between cup length, wall thickness, and bending stress. Our results reveal that the dominant failure mode shifts from tooth root fatigue to cup wall bending fatigue as cup length increases—a behavior not observed in rigid cycloidal systems. The optimized design achieved a 10.1% stress reduction and 1.7% lifetime extension over the baseline, demonstrating that multi-parameter response surface optimization [33] can effectively balance local stress reduction with global structural integrity. Despite these contributions, several limitations should be acknowledged. The friction coefficient was assumed constant, the circular spline was fully constrained, a single-axis fatigue criterion was employed, and experimental validation of the optimized design remains to be completed. These aspects will be addressed in future work.
However, at the system level, an increase in CL leads to a rise in the overall stress of the harmonic drive (HD). This suggests that fatigue life is governed not by the stress at a single location (such as the FS teeth), but by the combined effect of stress distribution across different components of the system. The most striking finding is the resulting disconnect between local stress magnitude and system fatigue life: the CL = 72 mm group, despite having the lowest FS tooth stress, resulted in the shortest FS tooth fatigue life (2510 h). Conversely, the TW = 18 mm group, with the highest local tooth stress (59.2 MPa), achieved the longest measured lifetime in single-factor experiments (2950 h), while the CT = 0.64 mm group achieved a lifetime of 2750 h.
In the FE simulation of the HD system, the deviation between the simulated results and the measured results was analyzed in depth, and such deviation could be attributed to the following interrelated factors: (i) the geometry model was simplified at the assembly gaps, chamfers, and surface roughness, which are often ignored during modeling to improve computational efficiency. This simplification leads to a discrepancy between the idealized model and the actual structure, thereby affecting the accuracy of simulated displacement and stress, and quantitative analysis shows that this simplification contributes approximately 2% to the total error; (ii) the simulation adopted the hypothesis of homogeneous, isotropic, and linearly elastic material properties for the HD system components, while the actual materials may exhibit microstructural inhomogeneities, which may lead to errors in simulated displacement and stress, contributing approximately 1% to the total error; and (iii) the boundary constraints in the FE model were set as rigid fixed constraints at specific positions, whereas the actual HD system is assembled with flexible contact interfaces between components, involving frictional sliding and slight relative displacement under load. The idealized contact assumptions ignore the dynamic interaction between components, thus contributing to the deviation of simulated stress and displacement values, contributing approximately 1% to the total error. The total predicted error of 4% is consistent with the experimental relative errors of 4.7% (displacement) and 4.0% (stress).
Future work will focus on four targeted aspects to further enhance the fidelity of the FE model. First, transient contact dynamics analysis will be conducted to capture the time-dependent nonlinear contact behavior at the tooth meshing interfaces, including the effects of friction variation and impact forces. Second, full multiaxial fatigue criteria (e.g., Brown–Miller or Smith–Watson–Topper models) will be implemented to improve the accuracy of lifetime predictions under complex non-proportional loading conditions. Third, experimental characterization of the friction coefficient under different contact pressures and lubrication conditions will be performed to replace the current constant-value assumption. Fourth, upon establishing these physical mechanism refinements, machine learning algorithms will be integrated within the FE framework to enable intelligent and accelerated parameter optimization. This prioritized roadmap ensures that the physical foundation is strengthened before advanced data-driven methods are introduced.
5. Conclusions
This study established and experimentally validated a reliable FE model for HD systems, incorporating core component geometric features and interfacial nonlinear contact behaviors. Mesh convergence analysis confirmed the baseline mesh (≈70,000 elements) balances efficiency and accuracy, with the von Mises stress relative error between baseline and refined meshes below 5%. The simulated displacement and stress showed relative errors of 4.7% and 4.0% against measured values, respectively, meeting engineering validation criteria. The research clarified how CL, CT, and TW regulate HD mechanical response and fatigue lifetime, revealing that system performance depends on component interactions rather than individual part behaviors, and excessive structural rigidity compromises fatigue performance despite low local stress. A multi-objective optimization strategy via response surface analysis yielded the optimal parameter combination (CL = 48 mm, TW = 6 mm, CT = 0.64 mm), achieving low system stress (77.7 MPa) and long FS lifetime (2950 h). Compared with the original control group design (CL = 48 mm, CT = 0.46 mm, TW = 6 mm), the system stress was reduced by 10.1% and the predicted lifetime was extended by 1.7%. Finally, simulation error sources were analyzed, and future optimization directions were proposed. This work enriches HD performance analysis theory and provides engineering guidance for high-precision transmission applications.
Author Contributions
Conceptualization, Y.L. and X.L.; methodology, J.L.; software, X.L.; validation, X.L. and J.L.; formal analysis, X.L.; investigation, X.L.; data curation, X.L.; writing—original draft preparation, X.L.; writing—review and editing, Y.L.; visualization, X.L.; supervision, J.L. and Y.L.; project administration, Y.L.; funding acquisition, Y.L. All authors have read and agreed to the published version of the manuscript.
Funding
This research was funded by the Longdong University Doctoral Research Fund, grant number XYBY1908.
Institutional Review Board Statement
Not applicable.
Informed Consent Statement
Not applicable.
Data Availability Statement
The raw/processed data required to reproduce these findings cannot be shared at this time as the data also forms part of an ongoing study.
Acknowledgments
Research on the Reliability of the FlexSpline in Robotic Joint Harmonic Drive Reducers Based on Dynamics—Longdong University Doctoral Research Fund (XYBY1908).
Conflicts of Interest
The authors declare no conflicts of interest.
References
- Wang, S.; Jiang, G.; Mei, X.; Zou, C.; Zhang, X.; Zhang, H. A rapid stress calculation method for short flexspline harmonic drive. Eng. Comput. 2019, 36, 1852–1867. [Google Scholar] [CrossRef] [Scilit]
- Shen, Y.; Ye, Q. Theory and Design of Harmonic Drive Gearing; China Machine Press: Beijing, China, 1985. [Google Scholar]
- Timofeyev, G.A.; Kostikov, Y.V.; Yaminsky, A.V.; Podchasov, Y.O. Theory and practice of harmonic drive mechanisms. In IOP Conference Series: Materials Science and Engineering; IOP Publishing: Bristol, UK, 2018; Volume 468, p. 012010. [Google Scholar]
- Ivanov, M.H. Harmonic Gear Drives; Visajas Kola Press: Moscow, Russia, 1981. [Google Scholar]
- Zheglova, V.; Khomiak, Y.; Medvedev, S.; Nikolenko, I. Numerical and analytical evaluation of service life of the details of axial piston hydraulic machines with complicated configuration under cyclic loading. Procedia Eng. 2017, 176, 557–566. [Google Scholar] [CrossRef] [Scilit]
- Frank, A.; Arbeiter, F.J.; Berger, I.J.; Hutař, P.; Náhlík, L.; Pinter, G. Fracture mechanics lifetime prediction of polyethylene pipes. J. Pipeline Syst. Eng. Pract. 2019, 10, 04018030. [Google Scholar] [CrossRef] [Scilit]
- Woo, S.; O’Neal, D.L.; Woldemichael, D.E.; Atnaw, S.M.; Tulu, M.M. Improving the fatigue of newly designed mechanical system subjected to repeated impact loading. Metals 2021, 11, 139. [Google Scholar] [CrossRef] [Scilit]
- Hu, S.; Osada, T.; Shimizu, T.; Warita, K.; Kawawa, T. Resistance to cyclic fatigue and fracture of structurally compromised root restored with different post and core restorations. Dent. Mater. J. 2005, 24, 225–231. [Google Scholar] [CrossRef] [Scilit] [PubMed]
- Liu, J.; Gao, J.; Zhao, Q. Failure modes of CFRP pre-tightened single tooth joints under axial cyclic tensile loading. Constr. Build. Mater. 2019, 222, 786–795. [Google Scholar] [CrossRef] [Scilit]
- Demachkia, A.M.; Velho, H.C.; Valandro, L.F.; Dimashkieh, M.R.; Samran, A.; Tribst, J.P.M.; de Melo, R.M. Endocrown restorations in premolars: Influence of remaining axial walls of tooth structure and restorative materials on fatigue resistance. Clin. Oral Investig. 2023, 27, 2957–2968. [Google Scholar] [CrossRef] [Scilit] [PubMed]
- Han, B.; Ma, J.; Li, H. Research on nonlinear friction compensation of harmonic drive in gimbal servo-system of DGCMG. Int. J. Control Autom. Syst. 2016, 14, 779–786. [Google Scholar] [CrossRef] [Scilit]
- Li, S. Diaphragm stress analysis and fatigue strength evaluation of the flex-spline, a very thin-walled spur gear used in the strain wave gearing. Mech. Mach. Theory 2016, 104, 1–16. [Google Scholar] [CrossRef] [Scilit]
- Zhang, Z.; Zhang, Q.; Zhou, G. Modal analysis of harmonic drive reducer based on ANSYS. Vibroeng. Procedia 2025, 58, 59–65. [Google Scholar] [CrossRef] [Scilit]
- Chen, X.; Liu, Y.; Xing, J.; Lin, S.; Ma, M. A novel method based on mechanical analysis for the stretchofthe neutral lineofthe flexspline cupofaharmonicdrive. Mech. Mach. Theory 2014, 76, 1–19. [Google Scholar] [CrossRef] [Scilit]
- Tjahjowidodo, T.; Al-Bender, F.; Van Brussel, H. Theoretical modelling and experimental identification of nonlinear torsional behaviour in harmonic drives. Mechatronics 2013, 23, 497–504. [Google Scholar] [CrossRef] [Scilit]
- Kircanski, N.M.; Goldenberg, A.A. An experimental study of nonlinear stiffness, hysteresis, and friction effects in robot joints with harmonic drives and torque sensors. Int. J. Robot. Res. 1997, 16, 214–239. [Google Scholar] [CrossRef] [Scilit]
- Gao, H.B.; Zhuang, H.C.; Li, Z.G.; Deng, Z.Q.; Ding, L.; Liu, Z. Optimization and experimental research on a new-type short cylindrical cup-shaped harmonic reducer. J. Cent. South Univ. 2012, 19, 1869–1882. [Google Scholar] [CrossRef] [Scilit]
- Lee, J.; Han, S.H.; Sohn, J.; Han, B.K.; Lee, J.H.; Park, D.I.; Kim, J.G. Nonlinear torsional stiffness analysis of harmonic drives using flexible multibody dynamics simulation. IEEE/ASME Trans. Mechatron. 2022, 28, 60–70. [Google Scholar] [CrossRef] [Scilit]
- Wu, W.; Zhang, Y.; Liang, F. Establishment and analysis of FEM model for harmonic drive with contact pairs between meshing tooth surface. J. Mech. Transm. 2011, 35, 37–41. [Google Scholar]
- Wang, H.; Xia, T.; Li, P.; Tang, S.; Tan, K.; Wang, C.; Wang, Q. Effect of loading frequency on very high cycle fatigue behavior of 40CrNiMoA. Int. J. Struct. Integr. 2025, 17, 1–16. [Google Scholar] [CrossRef] [Scilit]
- Ostapski, W. Analysis of the stress state in the harmonic drive generator-flexspline system in relation to selected structural parameters and manufacturing deviations. Bull. Pol. Acad. Sci. Tech. Sci. 2011, 58, 683–698. [Google Scholar]
- Li, H.F.; Wei, J.L.; Yang, S.P.; Liu, Y.Q. The relationship between fracture toughness and tensile property in high-strength steels. Eng. Fail. Anal. 2022, 131, 105854. [Google Scholar] [CrossRef] [Scilit]
- Feng, A.; Liu, B.; Wei, Y.; Xu, G.; Chen, C.; Pan, X. Microstructure, residual stress, and nanoindentation properties of GCr15-bearing steel by cryogenic treatment and laser-peening composite strengthening. Appl. Phys. A 2023, 129, 228. [Google Scholar] [CrossRef] [Scilit]
- Lee, J.H.; Cho, Y.H.; Kim, D.S.; Park, J.W. Lifetime estimation of harmonic reducer for manufacturing robot using accelerated life test. J. Mech. Sci. Technol. 2022, 36, 2879–2887. [Google Scholar] [CrossRef] [Scilit]
- Wei, L.; Yang, J.; Wang, C.; Wang, X.; Liu, X. Modal characteristics of harmonic gear transmission flexspline based on orthogonal design method. Open Phys. 2022, 19, 819–827. [Google Scholar]
- Maccioni, L.; Fraccaroli, L.; Blagojevic, M.; Rotini, F.; Vidoni, R.; Concli, F. Finite element analysis of torque ripple: Effects of gear ratio, transmitted power, nominal clearance, and mesh density in cycloidal drives. Forsch. Ingenieurwesen 2025, 89, 98. [Google Scholar] [CrossRef] [Scilit]
- Fiorineschi, F.; Frillici, S.; Pugi, L.; Rotini, F. Impact of Cycloid’s and Roller’s Dimensional Errors on the Performance of a Cycloidal Drive for Power Transmission. Machines 2023, 11, 772. [Google Scholar] [CrossRef] [Scilit]
- Hu, Q.; Wang, C.; Xue, S.; Li, H.; Li, L. Structural parameter optimization and fatigue life analysis of pom flexspline in harmonic drive. In Advances in Transdisciplinary Engineering; IOS Press: Amsterdam, The Netherlands, 2023. [Google Scholar]
- Lv, H.; Jiang, Y.; You, J.; Huang, W. Dynamic design and transmission performance analysis based on cf/peek composite for short flexspline harmonic drive. J. Mech. Sci. Technol. 2024, 38, 2885–2899. [Google Scholar] [CrossRef] [Scilit]
- Pan, B.; Xue, S.; Xie, S.; Li, Y. Prediction method of remaining life for harmonic drive based on flexspline crack growth. Comput. Integr. Manuf. Syst. 2024, 30, 4030. [Google Scholar]
- Yuan, F.; Xiao, K.; Li, L.; Han, Y.; Wang, C.; Xiang, G.; Chen, X. Modification and optimization of spatial tooth profile for harmonic drive considering machining fillet feature in the hobbing process. Precis. Eng. 2025, 96, 418–433. [Google Scholar] [CrossRef] [Scilit]
- Li, X.; Song, C.; Song, H. Flank modification and meshing analysis of harmonic drives with controlled backlash. Mech. Mach. Theory 2026, 219, 106296. [Google Scholar] [CrossRef] [Scilit]
- Li, R.; Zhou, G.; Li, J. Multi-objective optimization design of flexspline structure based on nsga ii for harmonic drive. Precis. Eng. 2026, 97, 1–15. [Google Scholar] [CrossRef] [Scilit]

Disclaimer/Publisher’s Note: The statements, opinions and data contained in all publications are solely those of the individual author(s) and contributor(s) and not of MDPI and/or the editor(s). MDPI and/or the editor(s) disclaim responsibility for any injury to people or property resulting from any ideas, methods, instructions or products referred to in the content. |
© 2026 by the authors. Licensee MDPI, Basel, Switzerland. This article is an open access article distributed under the terms and conditions of the Creative Commons Attribution (CC BY) license.