


Abstract
This study presents a planar particle image velocimetry (PIV) investigation of near-wall velocity deficit mitigation in a compact curved channel using sweeping jet actuation. A compact sweeping jet oscillator was developed based on a simplified fluidic oscillator configuration and integrated into the curved wall region of the channel. The effects of jet incidence angle, actuator placement, array layout, and jet-to-freestream velocity ratio were examined within a fixed streamwise measurement window near the curved wall. The analysis focuses on time-averaged in-plane velocity fields and representative streamwise velocity profiles, with emphasis on changes in the near-wall low-speed region and local streamwise velocity recovery. The results show that sweeping jet actuation can weaken the measured near-wall low-speed region and promote local streamwise velocity recovery within the planar PIV window. Among the tested cases, a jet incidence angle of 60° and actuator placement at the beginning of the bend produced a more balanced local recovery response. The comparison between different array layouts indicates that the observed recovery is affected by the combined influence of actuator spacing, actuator number, and total actuation input; therefore, it should not be interpreted as an isolated spacing effect. The present results provide a systematic low-speed experimental basis for selecting sweeping jet incidence angle, actuator placement, array configuration, and equivalent actuation input in compact curved channel flow control applications. The findings clarify how different actuation parameters affect local near-wall velocity deficit mitigation and streamwise velocity recovery within a controlled optical access configuration.
1. Introduction
With the increasing demand for compact configurations, high aerodynamic efficiency, and broad operating adaptability in modern aerospace vehicles, flow control technologies for complex internal and external flows have attracted sustained attention [1]. In such flows, flow separation can lead to the expansion of low-momentum regions, intensified energy loss, and increased flow non-uniformity, thereby significantly degrading system performance. Therefore, the development of effective control strategies for separated flows is of great scientific and engineering importance.
For air-breathing propulsion systems, inlet performance is of critical importance because the inlet must deliver conditioned airflow to the engine, directly affecting overall system efficiency and stability [2]. Compact aircraft configurations widely employ curved inlets to achieve installation and stealth advantages; however, the strong curvature and diffusion in such inlets can generate adverse pressure gradients, flow separation, and internal flow non-uniformity, thereby reducing total pressure recovery and increasing outlet distortion. Such compact curved passages typically consist of two successive bends, in which centrifugal effects couple with adverse pressure gradients to induce separation and complex secondary flows, which are generally regarded as the main sources of performance loss [3]. Under compact layout constraints, low-momentum fluid accumulated near the wall may continue to convect far downstream and significantly affect the outlet velocity distribution.
Flow separation in this type of compact curved internal passage results from the coupling of curvature-induced secondary flow, bend-induced pressure gradients, and diffusion effects. The separation location, intensity, and downstream transport of the low-momentum region are highly sensitive to inflow conditions and geometric configuration; accordingly, the control effectiveness also strongly depends on actuator type, placement, and input parameters. In such flows, actuator location and jet incidence angle not only determine the local suppression effect on separation, but also influence the evolution of secondary structures and outlet distortion. Similar relationships between location/injection angle and control authority have also been reported in other separation-dominated flows. Gao et al. showed through resolvent analysis that jet control authority depends strongly on actuator placement and jet incidence angle, and further proposed an adaptive reduced-order control framework for varying operating conditions [4,5]. These findings provide useful guidance for separation control in curved internal passages, because the separation topology may shift with mass flow rate and inflow conditions. At the same time, many actuation schemes increase integration complexity or air supply cost; therefore, there is a pressing need to develop control methods that can mitigate flow separation in internal passages while maintaining robustness and mechanical simplicity.
Strategies for mitigating flow separation can generally be classified into geometric optimization and flow control. Although shape optimization can alleviate unfavorable flow features near the design condition, its adaptability under off-design conditions is limited. In contrast, flow control can provide momentum addition and enhanced mixing in separation-prone regions on demand, thereby offering tunable control capability over a wider operating range. Flow control methods are commonly divided into passive and active approaches. Passive devices are structurally simple but less adaptable, whereas active flow control (AFC) modulates separation, secondary flow, and mixing through momentum injection or unsteady excitation. Previous studies have shown that AFC can effectively alter separation and wake organization [6,7]. The studies of Zhou et al. [8,9], Li et al. [10], and Huang et al. [11] further demonstrate the diversity of AFC approaches and the importance of near-wall control mechanisms.
Over the past three decades, active flow control methods applied to separation control in curved internal passages have included steady blowing, pulsed blowing, synthetic jets, and related techniques, all aimed at weakening separation and reducing distortion. Garnier [12,13] showed that pulsed blowing can significantly reduce separation, although distortion metrics may still remain sensitive to excitation frequency. Vaccaro [14] pointed out that two-dimensional steady jets have limited authority over inherently three-dimensional secondary flows, whereas spanwise non-uniform jets can redistribute these structures. Gissen [15] demonstrated that, under relevant operating conditions, synthetic jets can reduce inlet distortion. Overall, their effectiveness depends on whether they can replenish near-wall low-momentum fluid, excite the separated shear layer, and modulate three-dimensional vortical structures.
From a broader perspective on separated flows, blowing and suction control have been shown to alter wake structures in canonical bluff body flows and suppress unsteadiness, thus supporting the generality of jet actuation at the mechanism level. Gao et al. experimentally demonstrated that steady and symmetric jet actuation can reorganize wake vortical structures, modify shear-layer development, and affect vortex evolution in separated flows [16,17]. Xu et al. further showed that even without active actuation, structured wall boundary modulation can reshape the separated wake, thereby further supporting the concept of “near-wall regulation–vortex evolution” [18]. These studies suggest that targeted near-wall regulation around low-momentum regions and separated shear layers may likewise improve separation control and outlet flow redistribution in curved internal passages.
Jet structure characteristics also affect control effectiveness. Nozzle geometry determines vortex formation and its interaction with the wall, and experimental studies on non-circular synthetic jets have shown that nozzle shape can alter vortex evolution and near-wall response, as reported by Xu et al. [19] and Wang et al. [20]. Therefore, the effect of jet actuation depends not only on the injected momentum but also on its spatiotemporal distribution and structural characteristics.
Therefore, for compact inlet applications, achieving a balance between control authority and mechanical simplicity is particularly important. Fluidic oscillators (FOs) are attractive in this regard because they contain no moving parts and can generate self-sustained oscillatory jets [21,22]. They have shown promising performance in separation control [23], heat transfer enhancement [24], combustion stabilization [25], vertical tail performance improvement [26], and airfoil separation delay [27]. Arrays of fluidic oscillatory jets have also been used to reduce engine face distortion in offset diffusers [28] and to enhance aerodynamic loading through Coandă-effect-based circulation control [29].
Recent studies have further clarified both the flow physics and parameter sensitivity of sweeping jet actuators. Spatially oscillating jets have been shown to exhibit enhanced entrainment and momentum transfer compared with steady jets, providing a physical basis for their effectiveness in separation control [30]. Their control performance is also sensitive to blowing strength, jet spreading, actuator orientation, streamwise placement, and actuator scale [31,32]. Meanwhile, the internal geometry of the fluidic oscillator, including the feedback channel and mixing chamber, can substantially alter its oscillation and external jet characteristics [33]. More recently, sweeping jet actuation has been applied to S-shaped internal flow configurations, where jet intensity and actuator layout were found to significantly influence separation control and outlet flow quality [34].
Despite these advances, systematic experimental information remains limited regarding the local near-wall response of low-momentum fluid to sweeping jet actuation in compact curved rectangular passages. In particular, the effects of jet incidence angle, streamwise actuator placement, array configuration, and equivalent actuation input have rarely been compared within the same geometry and under a consistent measurement framework. Although recent studies have examined sweeping jet intensity and actuator layout in S-shaped intakes, the local near-wall velocity deficit response and streamwise velocity recovery characteristics under systematic parameter variation remain insufficiently documented. To address this gap, the present study develops and integrates a compact sweeping jet oscillator into a curved channel model and conducts a systematic planar PIV investigation under controlled low-speed conditions. The main contribution is to establish experimentally supported parameter selection trends for local near-wall velocity deficit mitigation and streamwise velocity recovery. By comparing the effects of incidence angle, streamwise actuator location, array configuration, and velocity ratio within the same measurement window, this work provides practical evidence for applying sweeping jet actuation to compact curved channel flow control configurations.
2. Experimental Methodology
2.1. Wind Tunnel Facility and Inlet Passage Geometry
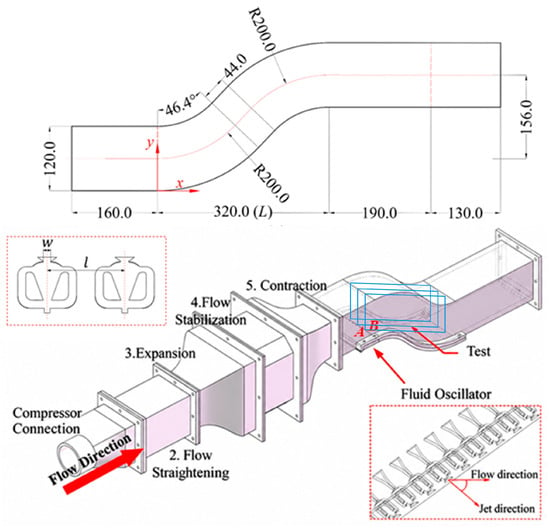
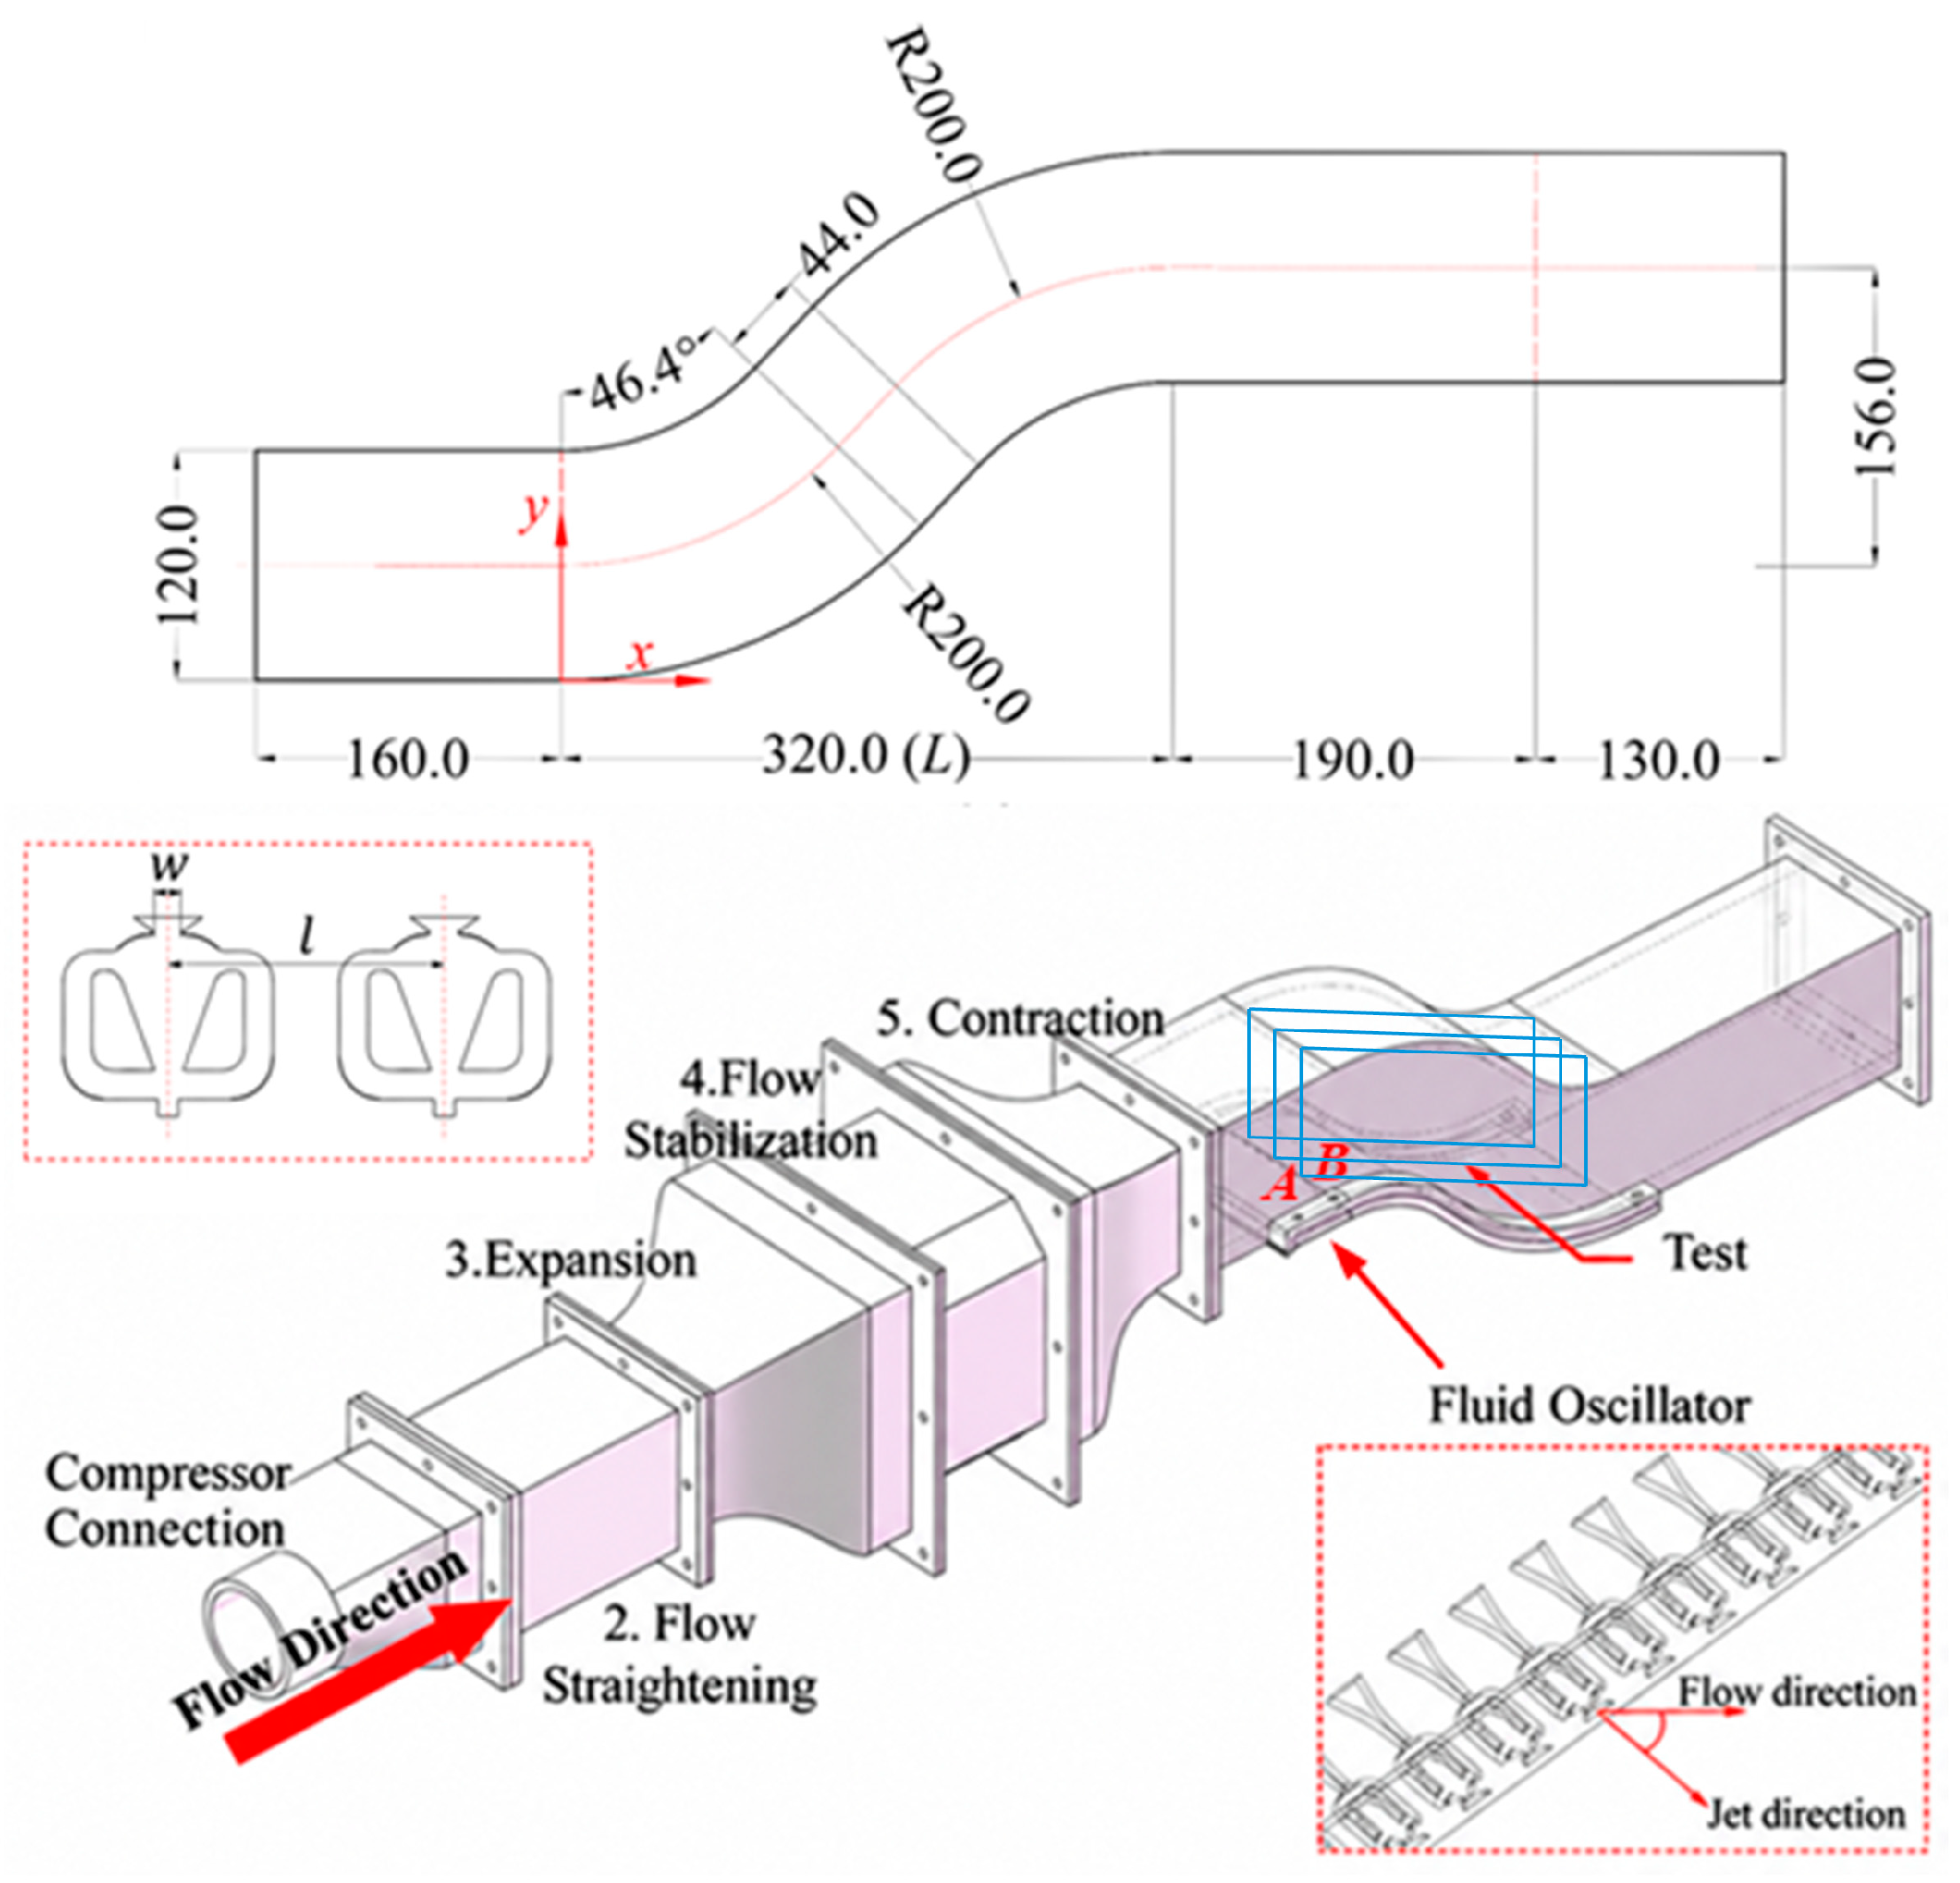
All experiments were carried out in the low-speed, open-circuit wind tunnel facility of Shanghai Jiao Tong University. As schematically illustrated in Figure 1, the rig comprises a 25 kW vortex-type air compressor, a flexible supply hose, a compressor plenum, a primary settling chamber, an expansion section, a secondary settling chamber, a contraction nozzle, the test section containing the inlet passage model, and a downstream diffuser. Honeycomb panels and fine-mesh screens are installed in both settling chambers to ensure a uniform, low-turbulence inflow.
Figure 1.
Wind tunnel facility, inlet passage geometry, and sweeping jet fluidic oscillator array used for the active-flow control experiments. A and B indicate the two actuator stations, corresponding to x/L = −0.15 and x/L = 0, respectively. The blue-framed region in the test section denotes the PIV measurement region.
The test section is fabricated from optically clear acrylic to provide full optical access for PIV measurements. The passage itself (geometry also shown in Figure 1) consists of an upstream straight segment 160 mm in length, an S-shaped bend 320 mm long, and a downstream straight segment 320 mm long. The bend is formed by two circular arcs of radius 200 mm joined by a 44 mm straight link; each arc turns the flow through θ = 46.4°. The centerlines of the inlet and outlet are offset by H0 = 156 mm, yielding an offset-to-length ratio H0/L = 0.49. The duct cross-section is a 120 mm × 120 mm rectangle.
For subsequent discussion, a right-hand Cartesian coordinate system is adopted with its origin at the spanwise mid-plane where the curved surface begins: x is the streamwise direction (positive downstream), y is the vertical direction with y = 0 at the lower wall and positive upward, and z is the spanwise direction. Here, W denotes the spanwise width of the channel, and z = 0 corresponds to the channel mid-span plane; therefore, the three PIV measurement planes are located at z/W = −1/4, 0, and 1/4.
The present geometry serves as a simplified low-speed curved channel platform that retains the near-wall velocity deficit behavior associated with curvature-induced flow redistribution. Owing to its optical accessibility and repeatable operating conditions, this configuration enables controlled comparisons of how sweeping jet actuation parameters modify the near-wall flow response. The results are therefore interpreted as experimentally supported parametric trends for the present compact curved channel configuration.
2.2. Sweeping Jet Oscillator and Operating Conditions
For the active flow control experiments in the present study, a compact sweeping jet oscillator was selected as the actuation device. The oscillator was obtained through a preliminary configuration-screening process rather than through a formal global optimization procedure. The primary objective of this screening was to simplify the internal structure while maintaining stable self-excited oscillation, so that the actuator could be integrated into the curved wall region of the passage model. In the preliminary design stage, a commonly used dual feedback loop fluidic oscillator configuration was adopted as the reference layout, and several geometric features, including the main-cavity splitter, feedback passages, and cavity inlet, were successively adjusted to obtain a compact configuration suitable for the present experiments.
The screening was primarily conducted through experiments, using the conventional dual feedback loop configuration reported in the literature as the reference design. The geometric parameters considered during the screening included the cavity inlet width, splitter shape, feedback passage inlet width, splitter spacing, and local corner/turning point position.
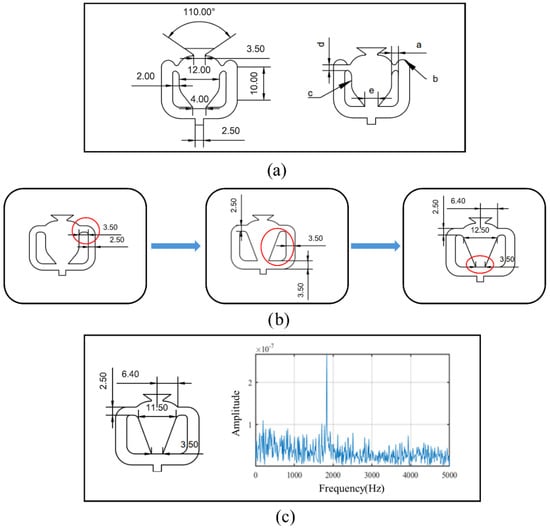
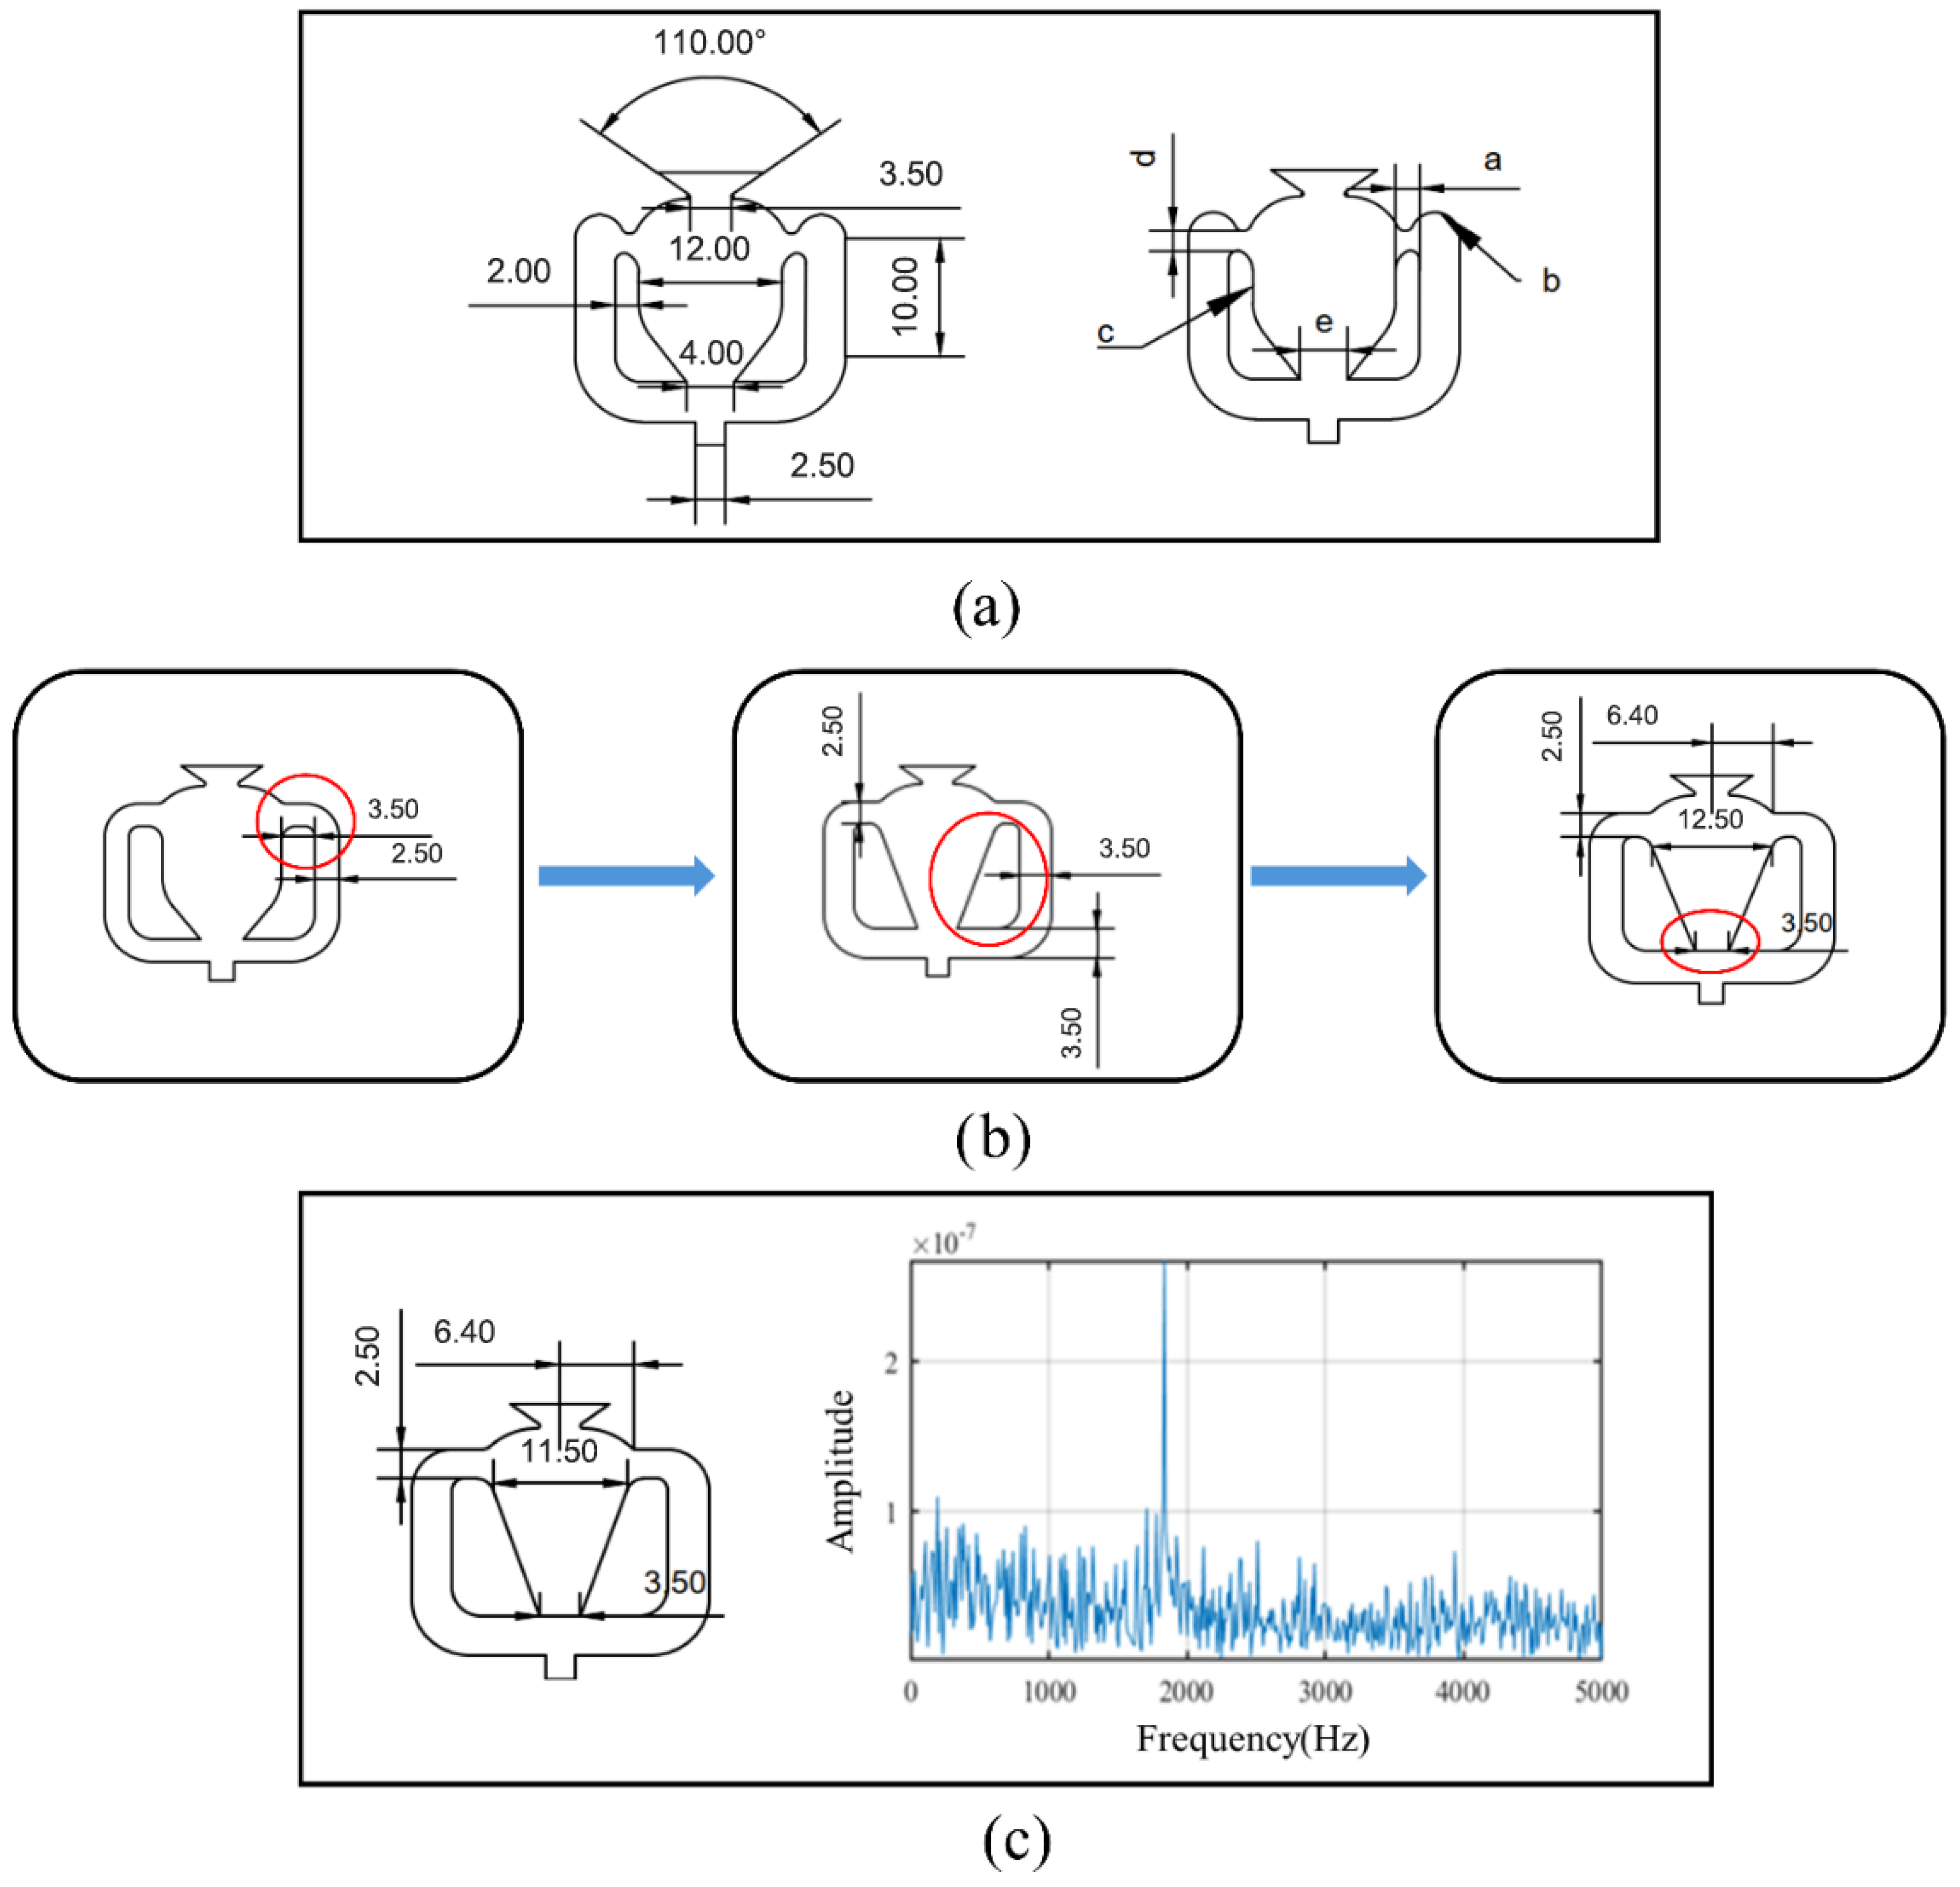
As shown in Figure 2a, the conventional oscillator contains several geometric factors closely associated with the oscillation process, mainly including the splitter shape, cavity inlet width, feedback passage dimensions, splitter spacing, and local corner/turning positions. For the application considered in the present study, these geometric details not only affect the jet attachment, switching, and feedback processes within the main cavity but also directly determine the feasibility of integrating and fabricating the oscillator on the passage wall. Therefore, multiple rounds of simplified configuration screening were conducted during the preliminary design stage around these key geometric features. Figure 2b presents several representative evolutionary stages from this preliminary screening process, with the optimization sequence primarily proceeding through adjustments to the feedback passage shape, refinement of the splitter shape, and optimization of the cavity inlet width.
Figure 2.
Configuration evolution and final selected layout of the sweeping-jet oscillator: (a) conventional dual-feedback-loop oscillator configuration; (b) representative stages of the preliminary configuration screening; (c) final selected oscillator configuration and its oscillation-frequency spectrum.
The preliminary screening showed that overly aggressive simplification of the splitter or the feedback passages, although capable of reducing structural complexity, could also weaken or even disrupt the effective internal feedback mechanism of the oscillator, thereby making it difficult to establish stable periodic oscillation. This indicates that, for compact oscillators, structural simplification cannot be pursued at the expense of the internal feedback path. Based on this understanding, the subsequent optimization focused on moderate simplification and adjustment of the internal geometry while preserving an effective feedback route.
Further screening results indicated that the oscillator performance was particularly sensitive to the splitter shape, the cavity inlet width, and the dimensions of the feedback passages, whereas some downstream local geometric details had a comparatively weaker influence on the onset characteristics. In particular, the cavity inlet width did not exert a monotonic effect, but instead exhibited an optimal range; the splitter shape also had a pronounced effect on oscillation onset and stability, and in the preliminary comparison, a V-shaped splitter showed better onset behavior than a U-shaped splitter. Figure 2b illustrates the representative evolutionary path of the preliminary configuration screening, while Table 1 summarizes the relative effects of the key geometric factors on the onset and frequency characteristics. The final configuration was selected according to four main criteria: (1) reliable onset of self-sustained oscillation, (2) a clear and stable dominant oscillation frequency, (3) sufficient structural compactness for integration into the curved wall model, and (4) manufacturability. Configurations requiring excessively high supply flow rates, exhibiting weak or unstable oscillation, or disrupting the internal feedback mechanism were excluded from further consideration. Detailed comparisons of the candidate configurations, including the tested geometric variations, onset-flow-rate characteristics, oscillation frequency responses, and the basis for selecting the final design, are provided in Appendix A.
Table 1.
Effects of major geometric factors on oscillation onset and frequency characteristics.
Figure 2c presents the selected sweeping jet oscillator configuration and its representative oscillation frequency spectrum. The oscillation characteristics were experimentally characterized using hot wire anemometry. A Dantec Dynamics 55P01 hot wire probe was positioned approximately four throat widths downstream of the oscillator exit to measure the temporal velocity fluctuations. The signals were acquired using a National Instruments NI 9233 data acquisition module at a sampling frequency of 10 kHz and subsequently analyzed in MATLAB R2022b using a fast Fourier transform (FFT) to identify the dominant oscillation frequencies.
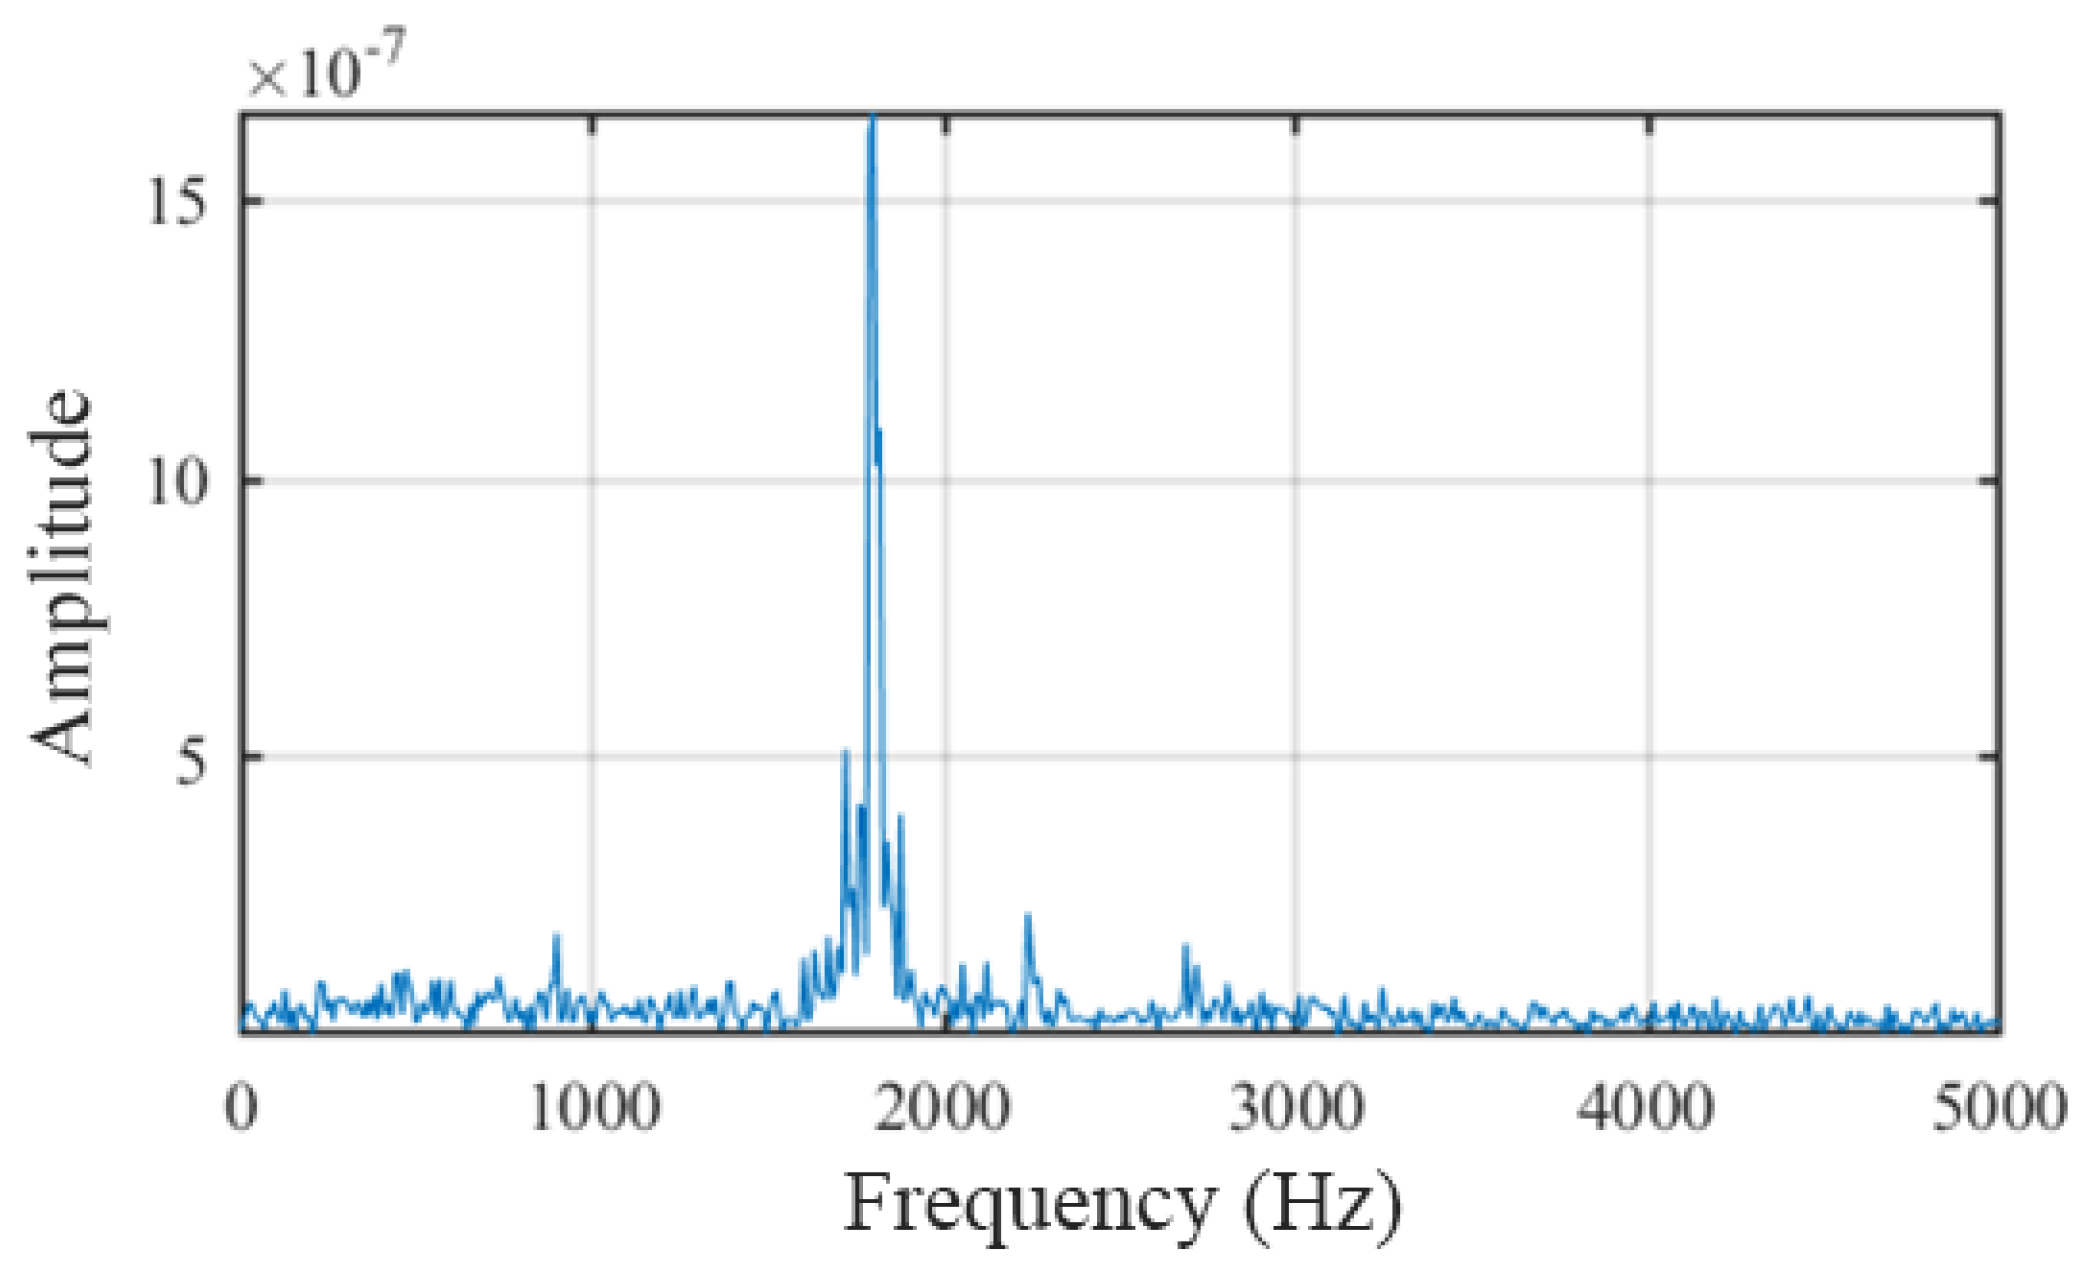
The hot wire measurements were performed on the selected oscillator configuration shown in Figure 2c, which had an outlet throat width of 2 mm, consistent with that used in the curved channel experiments. At a supply flow rate of 25.4 SLPM and an inlet total pressure of 3.89 kPa, the frequency spectrum exhibited a distinct dominant peak at approximately 1.85 kHz, indicating periodic jet oscillation. At a higher supply flow rate of 40.3 SLPM and an inlet total pressure of 9.56 kPa, a similarly pronounced dominant peak was observed at approximately 1.80 kHz, as shown in Figure A4. The presence of distinct dominant frequency peaks under both supply conditions provides experimental evidence of periodic oscillation of the selected configuration at the tested operating points. The detailed configuration-screening process and the effects of key geometric parameters on the oscillation characteristics are presented in Appendix A. The actuator outlet used in the curved channel experiments had a throat width of 2 mm and a throat height of 1.6 mm, corresponding to an aspect ratio of 1.25.
Two actuator stations, denoted as A and B in Figure 1, were arranged near the entrance of the curved section. Station A was positioned 0.15 L upstream of the curved section entrance, corresponding to x/L = −0.15, while Station B was located at the beginning of the curved section, corresponding to x/L = 0, where L denotes the projected streamwise length of the curved section. At each station, the array layout was characterized by the ratio of the center-to-center pitch l to the throat width w, namely l/w. Two array configurations, l/w = 10 and l/w = 15, were examined. The jet incidence angle was defined relative to the local incoming streamwise direction at the corresponding actuator station. Three nominal jet incidence angles, 30°, 60°, and 90°, were considered to evaluate the influence of injection direction on the measured near-wall flow response.
Except for the oscillators, the entire test section block was machined from clear acrylic to satisfy optical access requirements for PIV. Experiments were run at free-stream velocities of 2.6 m/s and 10.8 m/s; the tunnel turbulence intensity was kept below 1%, and the blower frequency was held constant at 5 Hz. Based on the duct hydraulic diameter, the Reynolds number ranged from approximately 2.2 × 10⁴ to 1.0 × 10⁵. The reference velocity was measured at the inlet center (x = 0, y = 60 mm, z = 0).
Active flow control authority was varied by adjusting the mass-flow-rate ratio from 0.5% to 2%, where
where and denote the jet and inlet mass flow rates, respectively.
The velocity ratio (VR) was adjusted from approximately 1.4 to 19.6. In the present study, the jet velocity used in the definition of VR denotes an equivalent mean exit velocity estimated from the calibrated supplied mass flow rate and the total throat area of the actuators. It should therefore be understood as a global actuation input parameter rather than the instantaneous local velocity of the sweeping jet during its oscillatory motion. Because the sweeping jet is intrinsically unsteady and spatially distributed, VR alone does not fully represent the instantaneous forcing characteristics. Accordingly, comparisons involving different numbers of actuators are interpreted cautiously as combined effects of array layout and total actuation input.
Table 2 lists the complete test matrix: in each column heading, the first term denotes the number and type of actuators—for example, “6SJA” refers to six sweeping jet actuators—followed by the array pitch ratio l/w (“10” means l/w = 10), the jet incidence angle relative to the horizontal free stream (e.g., “60 deg” for 60°), and, when present, the tag “Loc” which signifies that the actuator row is mounted 0.15 L upstream of the nominal station; if “Loc” is absent, the row sits at the start of the bend (x/L = 0). An asterisk after the header shows that measurements were taken on the z/W = −1/4, 0, and 1/4 spanwise planes, whereas no symbol indicates data only on the mid-span plane. Within the body of the table, the three numerical entries in each cell give, in order, the free-stream velocity (m/s), the jet mass flow rate (SLPM), and the resulting velocity ratio; blank cells correspond to operating conditions that were not investigated.
Table 2.
Experimental conditions selected for PIV measurements in the passage. * Indicates that PIV measurements were performed at three spanwise planes (z/W = −1/4, 0, and 1/4). All other configurations were measured only at the mid-span plane (z/W = 0).
2.3. PIV Measurement System
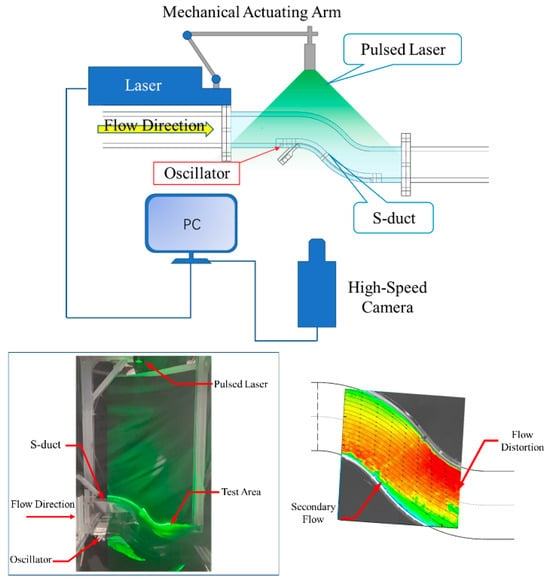
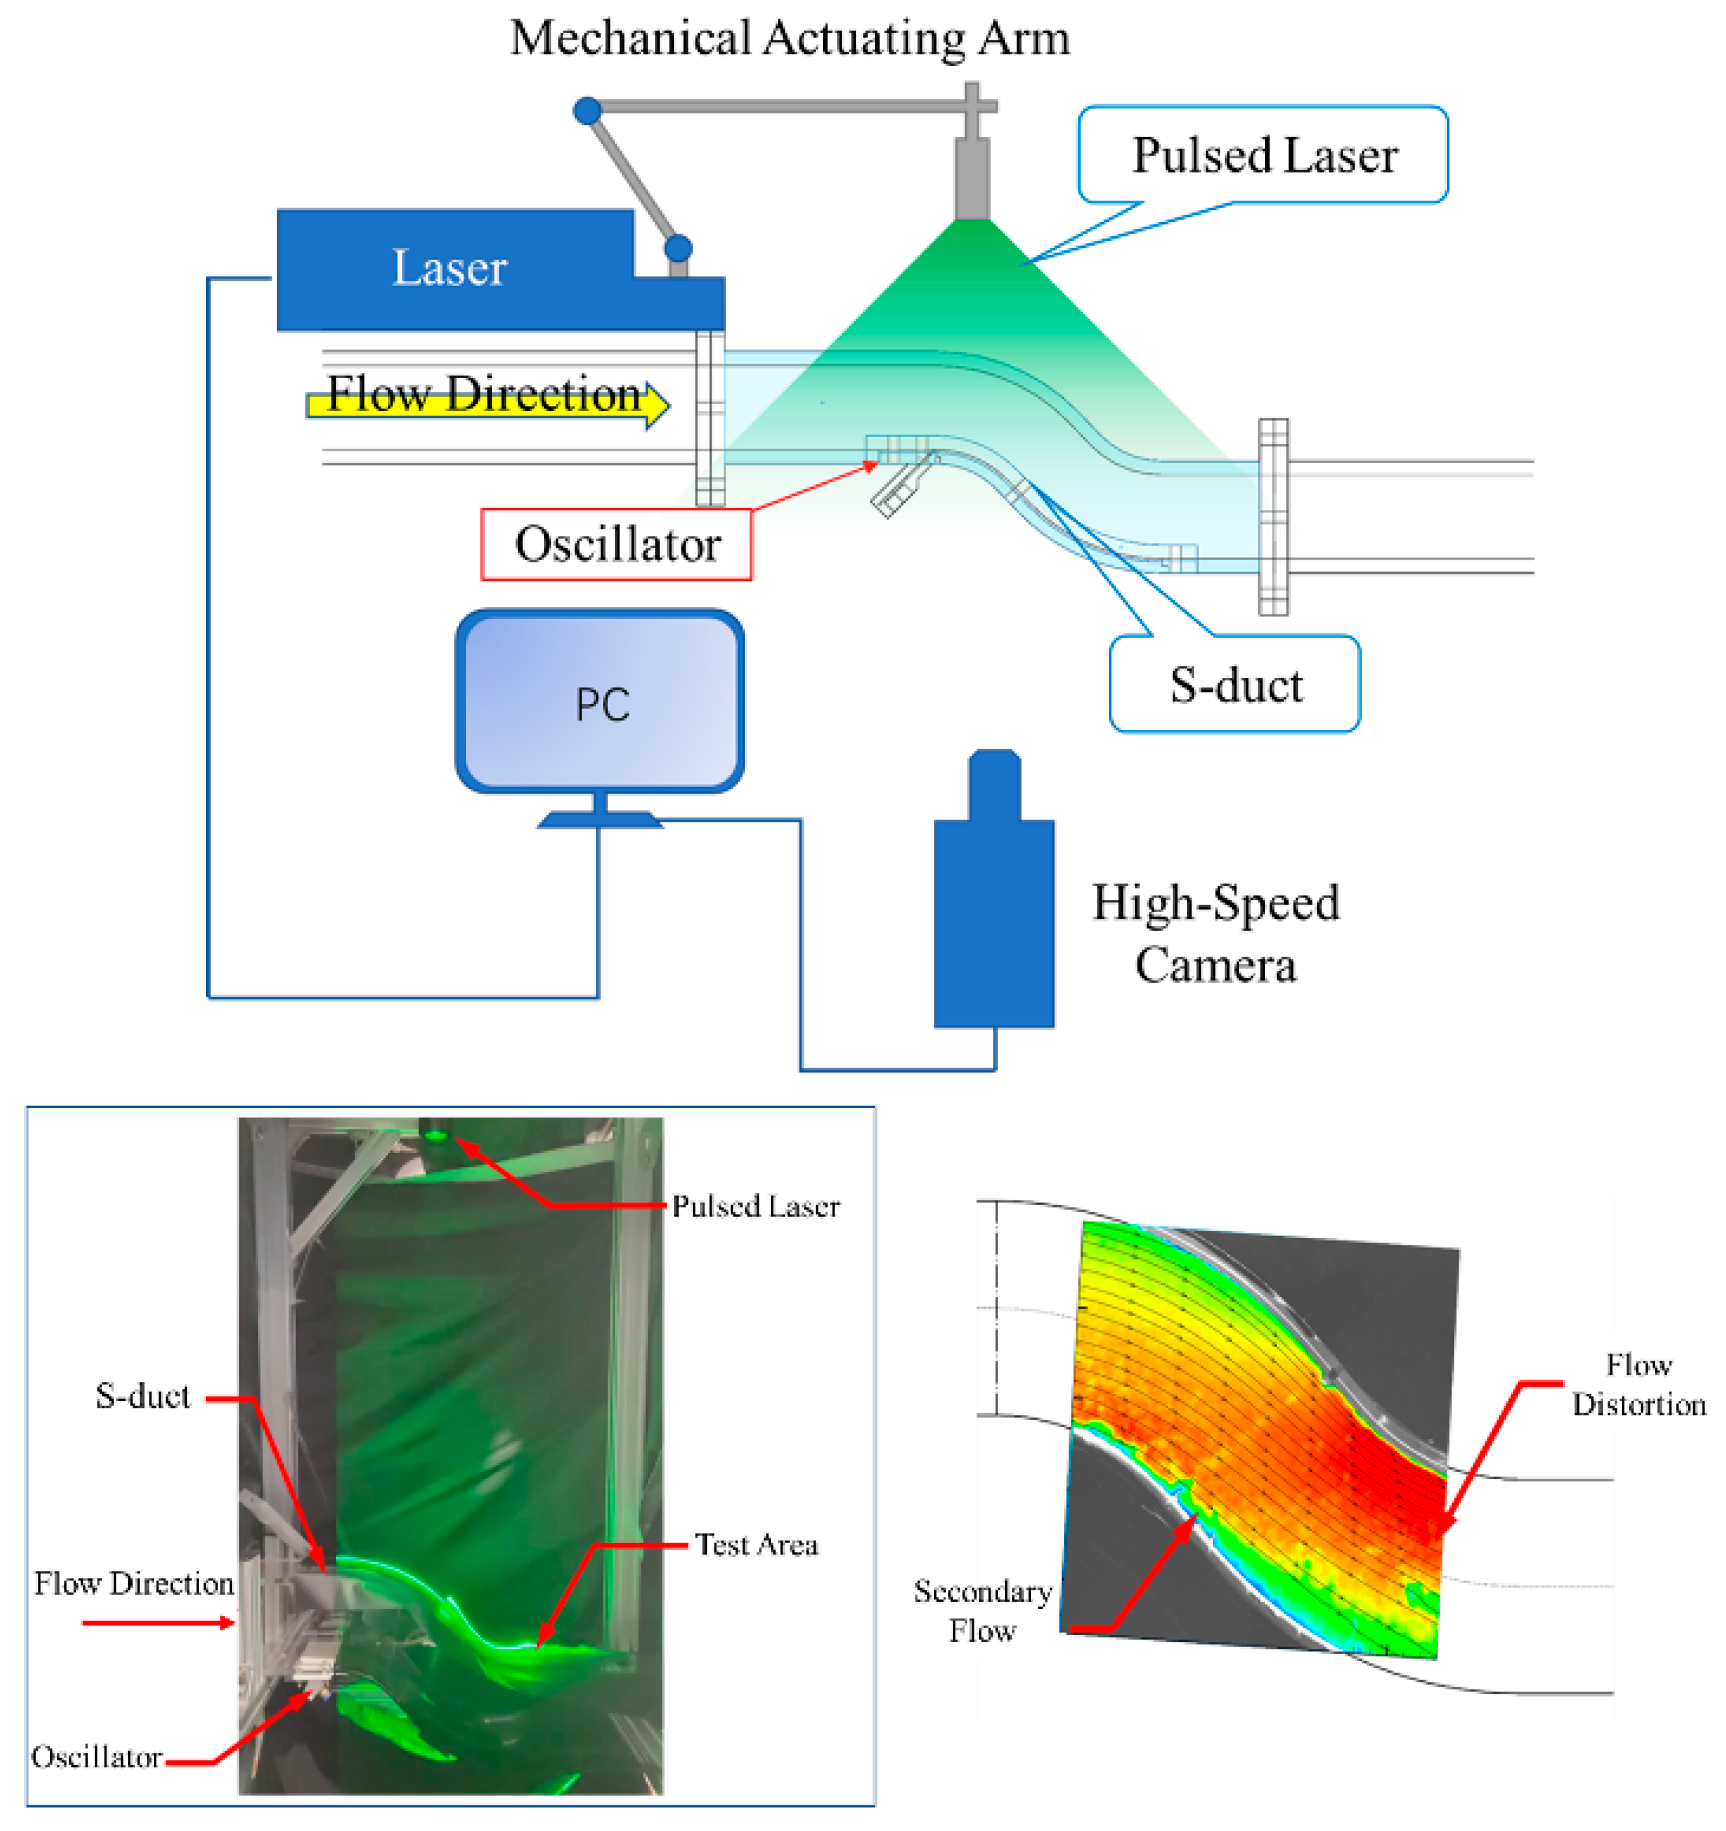
A planar particle image velocimetry (PIV) system was employed to measure the velocity field inside the curved passage, and a schematic of the experimental setup is shown in Figure 3. Di-ethylhexyl sebacate (DEHS) particles with a mean diameter of approximately 1 μm were used as tracer particles. The particles were generated by an aerosol atomizer (PIVPart14, PIVTEC GmbH, Germany) and introduced into the wind tunnel flow by a vortex air pump to maintain a stable seeding condition during the measurements.
Figure 3.
PIV experimental setup and measurement window for flow control in the inlet passage using fluidic oscillators.
Illumination was provided by a double-pulsed Nd: YAG laser (λ = 532 nm, 35 mJ/pulse, Dentec). A cylindrical lens formed a laser sheet approximately 1 mm thick. Planar PIV measurements were performed at three spanwise locations, z/W = −1/4, 0, and 1/4, where z = 0 denotes the channel mid-span plane and W is the spanwise channel width. A 2000 × 2000-pixel CCD camera (Dentec) was synchronized with the laser pulses through a pulse delay generator; the inter-pulse separation was set to 50 µs. For each operating condition, 350 image pairs were captured at 7 Hz. An interrogation window of 32 × 32 pixels yielded a spatial vector spacing of 1.76 mm × 1.76 mm.
Image post-processing was performed in MATLAB R2022b using the PIVLab toolbox. A multi-pass cross-correlation algorithm was adopted, together with outlier removal, window deformation, Gaussian sub-pixel refinement, and local distortion correction. These procedures were applied consistently to all cases to improve the stability of vector identification and to provide a uniform basis for inter-case comparison.
Since the physical size of the test model exceeded the camera field of view, the local window shown in Figure 3 was selected as the primary measurement region. Its location within the curved test section is also indicated by the blue-framed region in Figure 1. This window is located near the curved wall and covers the region where the baseline near-wall low-speed zone and the associated separation-related flow features can be observed. Therefore, it provides a consistent field of view for comparing the local response of the near-wall velocity deficit region under different actuation conditions. A representative streamwise station at x/l0 = 0.6 was selected within this window for extracting streamwise velocity profiles, where l0 denotes the streamwise extent of the PIV measurement window. The extracted profiles are vertical profiles in the measurement plane at a fixed streamwise location and are used only as a consistent reference for comparing the local velocity recovery tendency among different actuation cases.
The present diagnostics are based on local planar two-dimensional, two-component PIV measurements. Accordingly, they are used to evaluate relative variations in the time-averaged in-plane velocity field within the same measurement window, rather than to reconstruct the complete three-dimensional duct-flow topology. This distinction is relevant because curved channel flows and their interaction with discrete sweeping jets are inherently three-dimensional. The main sources of measurement uncertainty include tracer-particle response, laser sheet thickness, illumination non-uniformity, camera calibration and image distortion errors, pulse-timing uncertainty, image signal-to-noise ratio, cross-correlation bias in regions with strong velocity gradients, and out-of-plane motion. To ensure a consistent basis for inter-case comparison, all cases were measured and processed using the same optical arrangement, pulse-timing parameters, field of view, tracer-seeding procedure, and image-processing settings. For each operating condition, 350 image pairs were used to construct the ensemble-averaged velocity field. The statistical adequacy of this sample size was further examined through the convergence analysis described in Section 2.4. Therefore, the following analysis focuses on the relative changes in the near-wall low-speed region and streamwise velocity recovery within the measurement plane.
2.4. Sampling Convergence of the Ensemble-Averaged Velocity Field
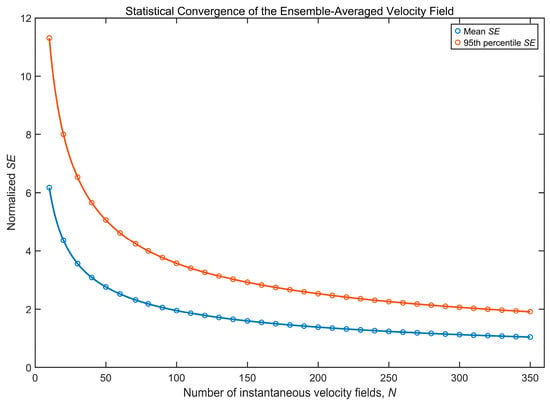
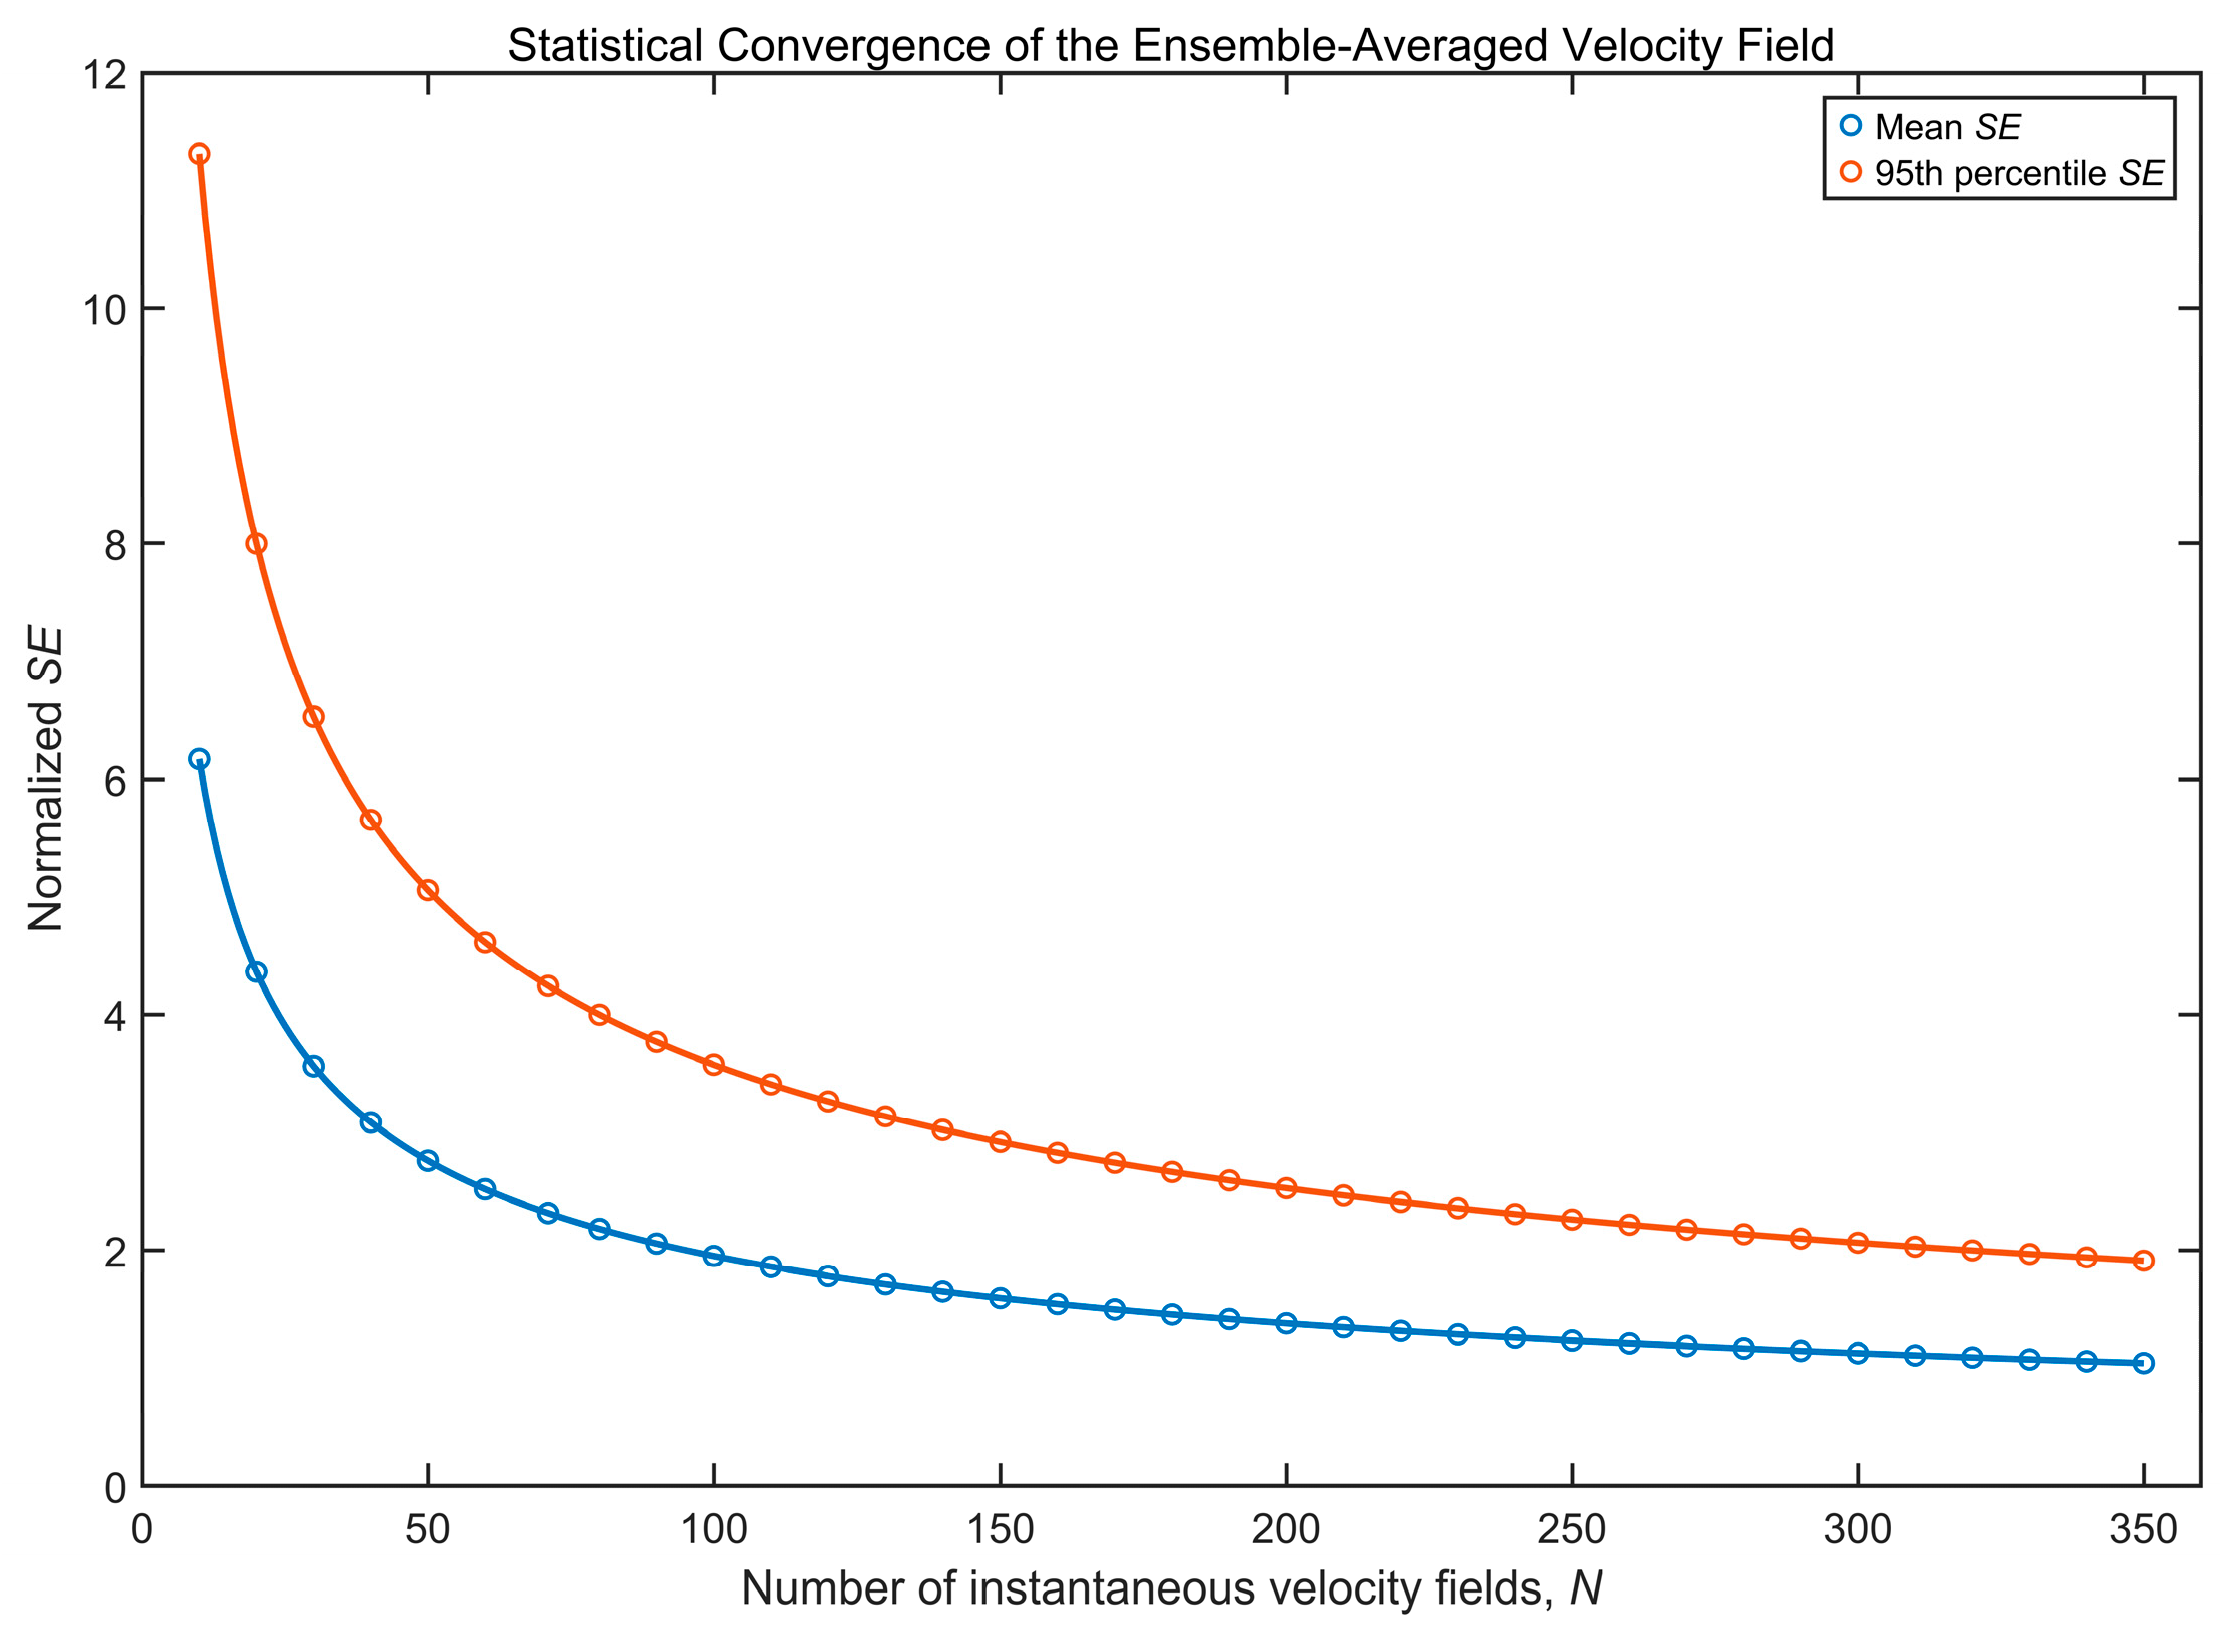
To assess the influence of finite sample size on the statistical stability of the time-averaged PIV velocity field, a convergence analysis was performed using the 350 instantaneous velocity fields acquired for each operating condition. For each valid PIV grid point, the standard errors of the ensemble-averaged streamwise and wall-normal velocity components were calculated as
where su and sv denote the sample standard deviations of the instantaneous streamwise and wall-normal velocity components, respectively, and N is the number of instantaneous velocity fields included in the ensemble average. A normalized two-component standard error was then defined as
To characterize the sampling convergence over the PIV measurement domain, both the spatial mean and the 95th percentile of were evaluated. The spatial mean provides a domain-averaged measure of the normalized sampling standard error, whereas the 95th-percentile value indicates that approximately 95% of the valid PIV grid points have normalized standard errors below this level. These quantities characterize the finite-sample variability of the ensemble-averaged velocity field rather than the total PIV measurement uncertainty.
As shown in Figure 4, both the spatially averaged and 95th-percentile normalized standard errors decrease continuously with increasing sample size, indicating progressive convergence of the ensemble-averaged velocity field. The reduction is relatively rapid at small N and becomes progressively weaker as the number of samples increases, which is consistent with the expected N−1/2 dependence of the standard error.
Figure 4.
Sampling convergence of the ensemble-averaged velocity field with increasing sample size.
At the sample size used in the present experiments (N = 350), the spatially averaged normalized standard error is approximately 1.04%, while the 95th-percentile value is approximately 1.91%. These results indicate relatively small normalized sampling standard errors for the ensemble-averaged velocity field, providing a basis for comparing the time-averaged flow characteristics among the investigated operating conditions. It should be emphasized that these values characterize sampling convergence rather than the total PIV measurement uncertainty. Other uncertainty sources, including spatial calibration errors, particle image displacement estimation errors, cross-correlation-related uncertainties, and out-of-plane particle motion, are not quantified in the present analysis.
2.5. Quantitative Characterization of the Low-Speed Region
To complement the qualitative comparison of the time-averaged velocity fields and the streamwise velocity profiles, a low-speed-area metric was introduced to quantitatively characterize the spatial extent of the measured near-wall velocity deficit region. The metric was evaluated over the same valid PIV measurement window for all operating conditions, thereby providing a consistent basis for inter-case comparison.
For each operating condition, a local reference velocity, , was defined as the spatially averaged time-mean streamwise velocity along the upstream boundary of the PIV measurement window:
where Ny denotes the number of valid PIV grid points along the upstream boundary and is the time-averaged streamwise velocity. The threshold velocity for identifying the local low-speed region was defined as .
The threshold was used as an operational criterion for consistently identifying the pronounced velocity deficit region among the different operating conditions, rather than as a universal criterion for flow separation. The low-speed region within the valid PIV measurement domain, Ω, was identified as . The corresponding normalized low-speed-area ratio was defined as , where ALV denotes the area satisfying the above low-speed criterion and AΩ is the total valid area of the PIV measurement window. To quantify the actuation-induced reduction relative to the corresponding uncontrolled condition, the relative reduction was further defined as
where denotes the low-speed-area ratio under the corresponding uncontrolled condition. It should be emphasized that is used here only as a planar quantitative indicator of the spatial extent of the measured velocity deficit region. Because the present measurements are based on planar 2D–2C PIV, this metric should not be interpreted as a direct measure of the complete three-dimensional separated flow region.
3. Results and Discussion
3.1. Natural Flow Analysis
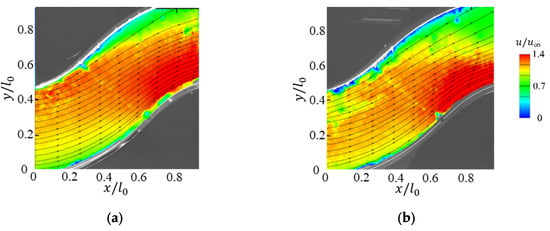
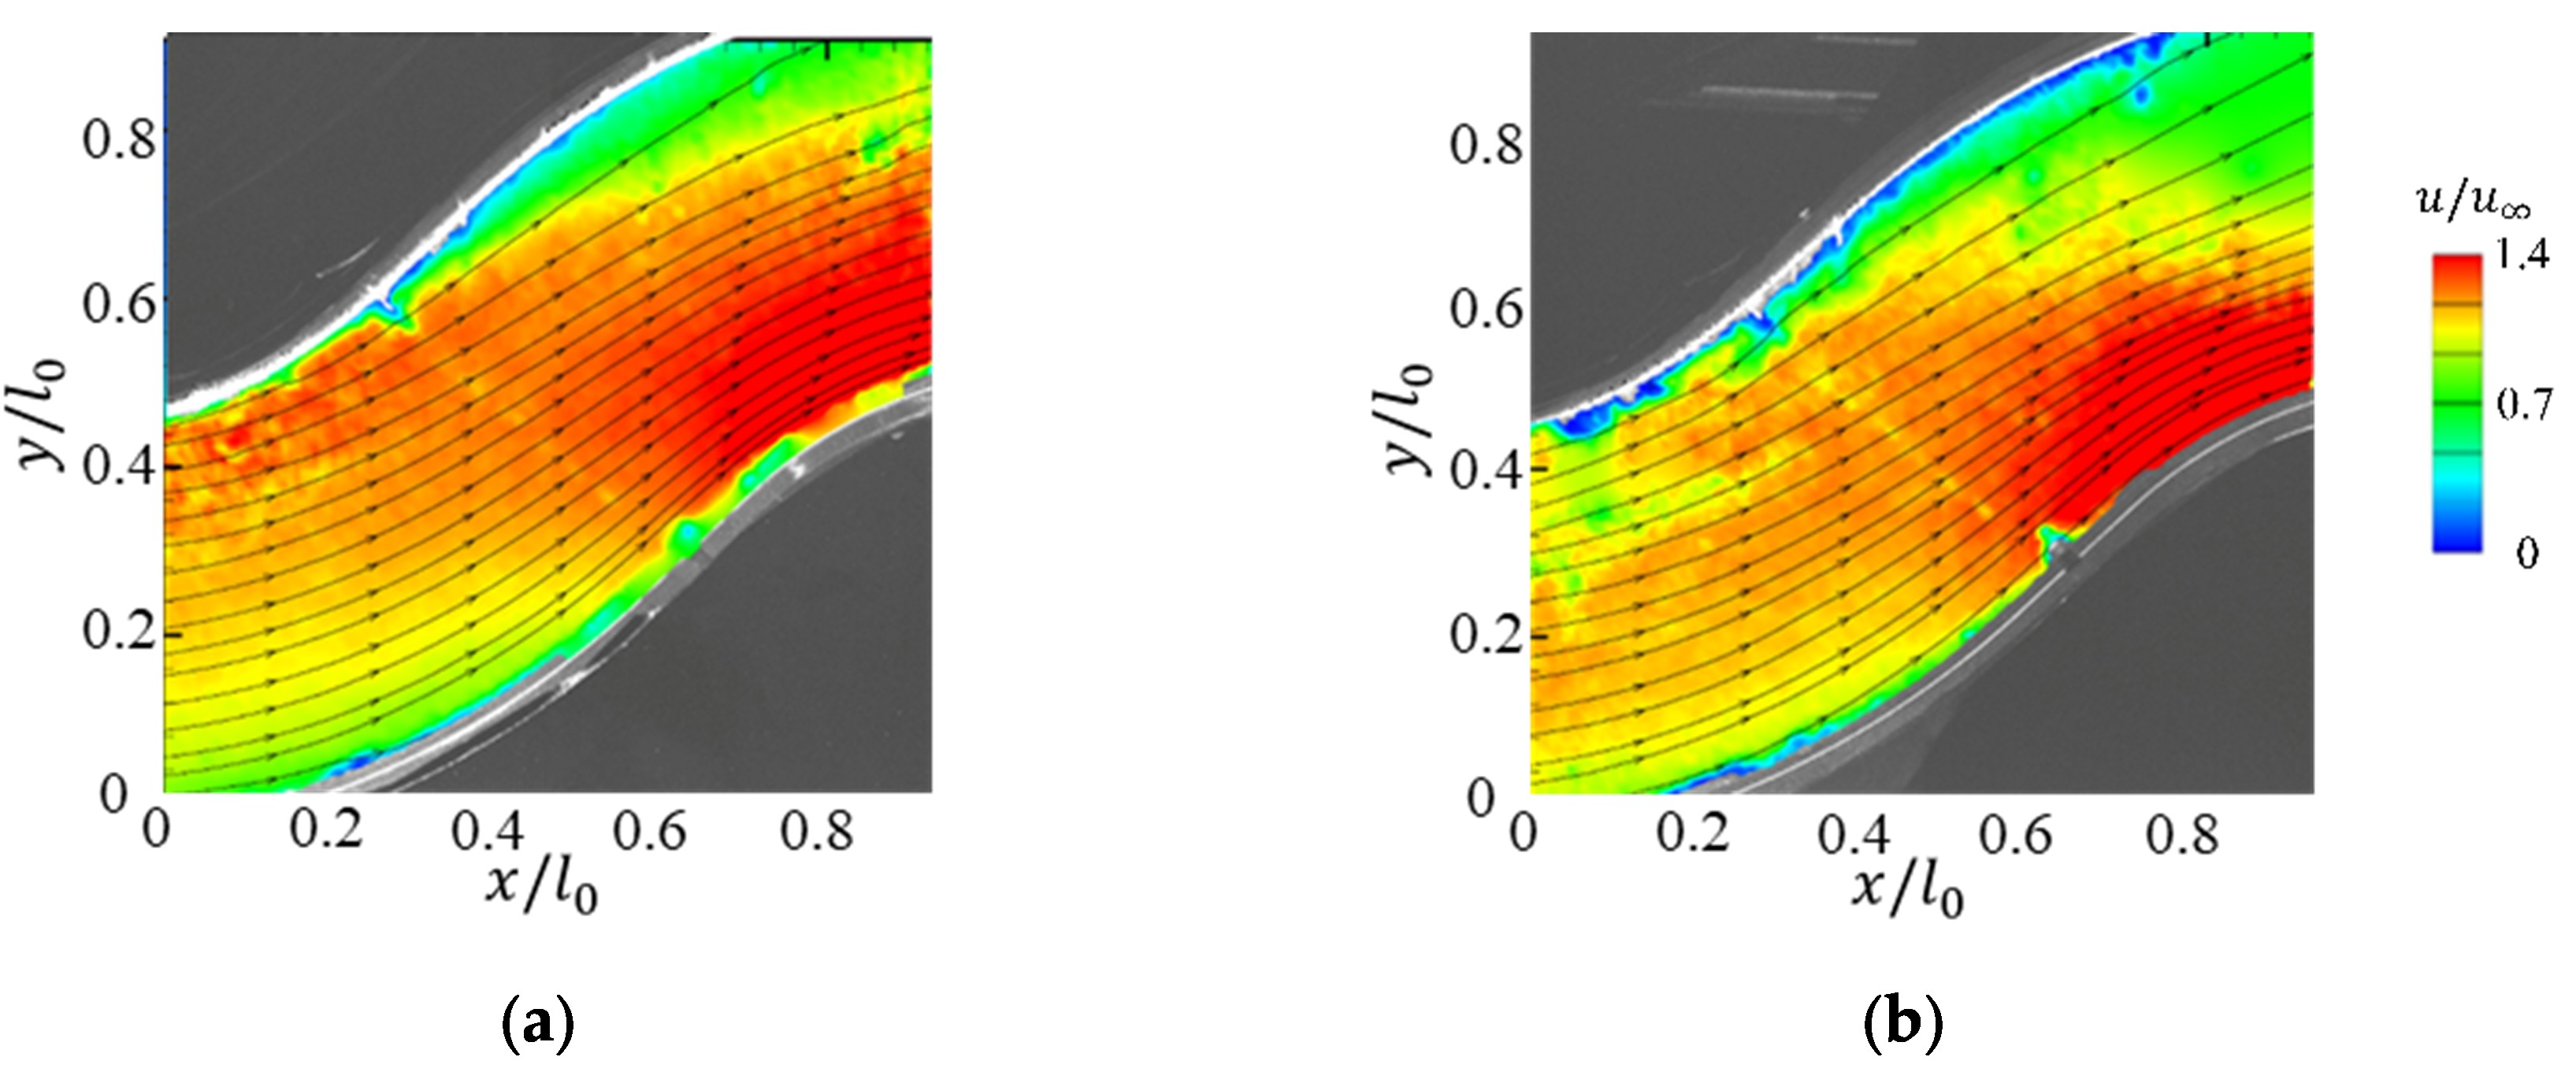
First, the baseline uncontrolled flow in the curved channel is examined to identify the near-wall velocity deficit region and the associated separation-related in-plane flow features within the present planar PIV measurement window. Figure 5 shows the time-averaged in-plane streamwise velocity fields and streamlines at two inflow speeds, u∞ = 2.6 m/s and u∞ = 10.8 m/s. The velocity contours are normalized by the freestream velocity u∞ measured at the inlet center, i.e., u/u∞, where u denotes the streamwise velocity component. The same normalization is used for all subsequent time-averaged flow fields. In addition, both the x and y coordinates are normalized by a reference length l0, defined as the streamwise extent of the PIV measurement window (l0 = 0.25 m). The same coordinate normalization is also adopted in all subsequent figures.
Figure 5.
Time-averaged in-plane velocity fields and streamlines in the inlet passage at inflow speeds of (a) 2.6 m/s and (b) 10.8 m/s.
As shown in Figure 5, a pronounced near-wall low-speed region is observed in the measured plane for both inflow speeds, together with local streamline deflection associated with the separated flow development. This indicates that the selected measurement window captures separation-related local flow features under the baseline condition. As the inflow speed increases from 2.6 m/s to 10.8 m/s, the normalized velocity distribution changes to some extent; however, the near-wall low-speed region remains concentrated near the curved wall of the bend, with similar local streamline deflection observed in the same region of the field of view. These observations indicate that the local near-wall velocity deficit feature is not limited to a single inflow speed condition.
Since the subsequent parametric study compares the effects of different actuation parameters on the near-wall low-speed region and streamwise velocity recovery within the same PIV measurement window, most of the following results are presented for a freestream velocity of 2.6 m/s. This inflow condition provides a clear baseline near-wall velocity deficit region within the present field of view and allows the actuation cases to be compared under the same optical arrangement, inter-pulse separation, field of view, and image-processing procedure. In this way, the influence of additional experimental variables on the inter-case comparison can be reduced. The case of u∞ = 10.8 m/s is retained as a reference to show that the baseline near-wall velocity deficit feature observed in the measured plane is not unique to the lower-speed condition. Therefore, the following parametric conclusions should be understood as local trends obtained under the present low-speed experimental conditions and within the selected planar PIV window.
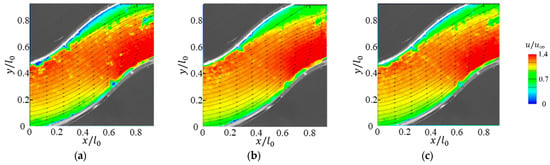
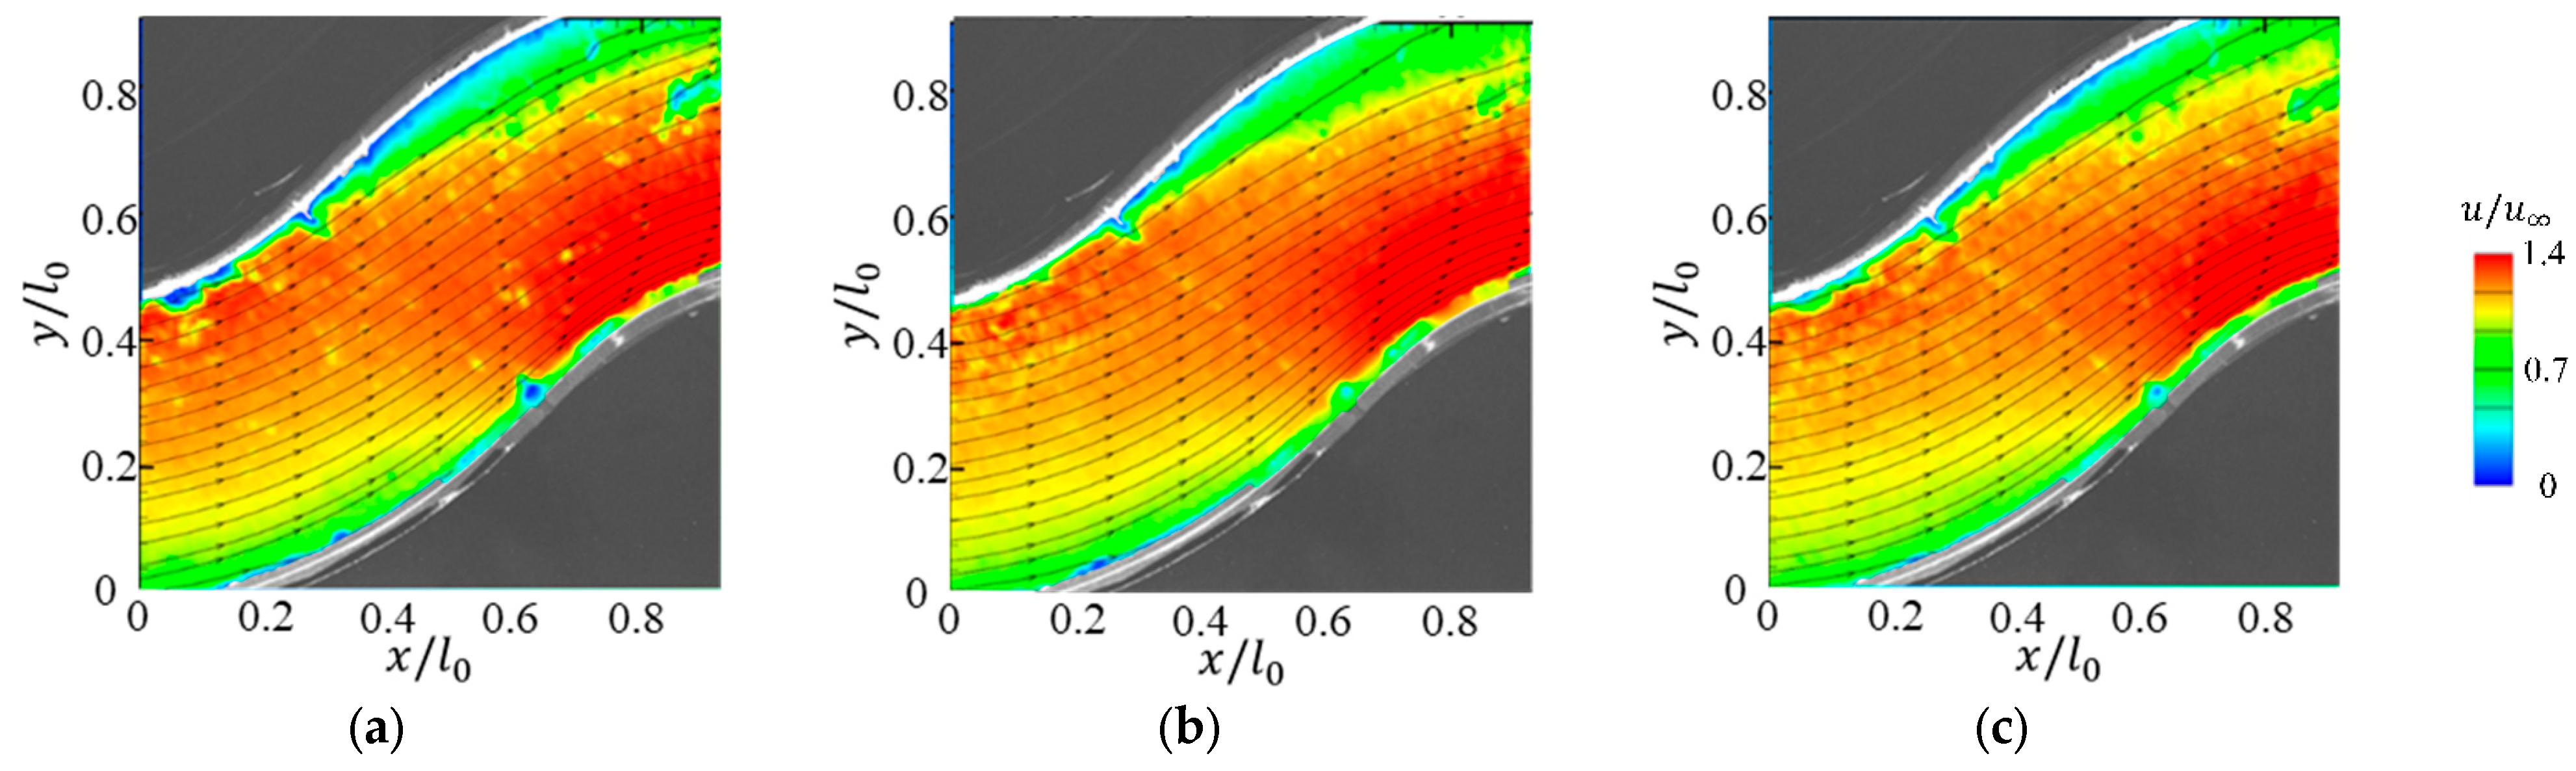
To examine the sensitivity of the measured local flow response to the spanwise measurement location, Figure 6 presents the time-averaged velocity fields obtained in three streamwise-oriented planes, namely (z/W = 0) and (z/W = ± 1/4), for a representative actuation case (“6SJA-10-60°”). Within the present field of view, the near-wall low-speed region and the associated separation-related in-plane features exhibit similar qualitative trends in the three selected planes, although local differences can still be observed, especially near the sidewall-influenced regions. Therefore, the mid-span plane (z/W = 0) is used as the primary measurement plane for the following inter-case comparisons. It should be noted that these selected planes provide only a limited check of spanwise sensitivity and should not be interpreted as a full spanwise characterization of the duct flow. In view of the persistent near-wall low-speed region and its downstream development within the selected measurement window, the streamwise velocity profile at x/l0 = 0.6 is adopted in the following sections as a fixed reference location for comparing the local velocity recovery tendency under different actuation conditions.
Figure 6.
Time-averaged in-plane velocity fields measured in three streamwise-oriented planes: (a) z/W = 1/4 plane, (b) mid-span plane, and (c) z/W = −1/4 plane.
3.2. Parametric Effects of the Sweeping Jet Actuator
This section compares the effects of the main sweeping jet actuation parameters on the measured near-wall flow response. The comparison is based on two complementary indicators obtained from the planar PIV dataset: the redistribution of the time-averaged in-plane velocity field and the streamwise velocity profiles extracted at x/l0 = 0.6. These results are used to identify how incidence angle, actuator placement, array configuration, and velocity ratio affect local near-wall velocity deficit mitigation.
3.2.1. Effect of Jet Incidence Angle
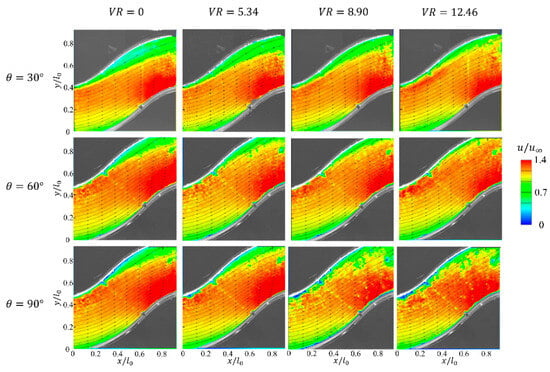
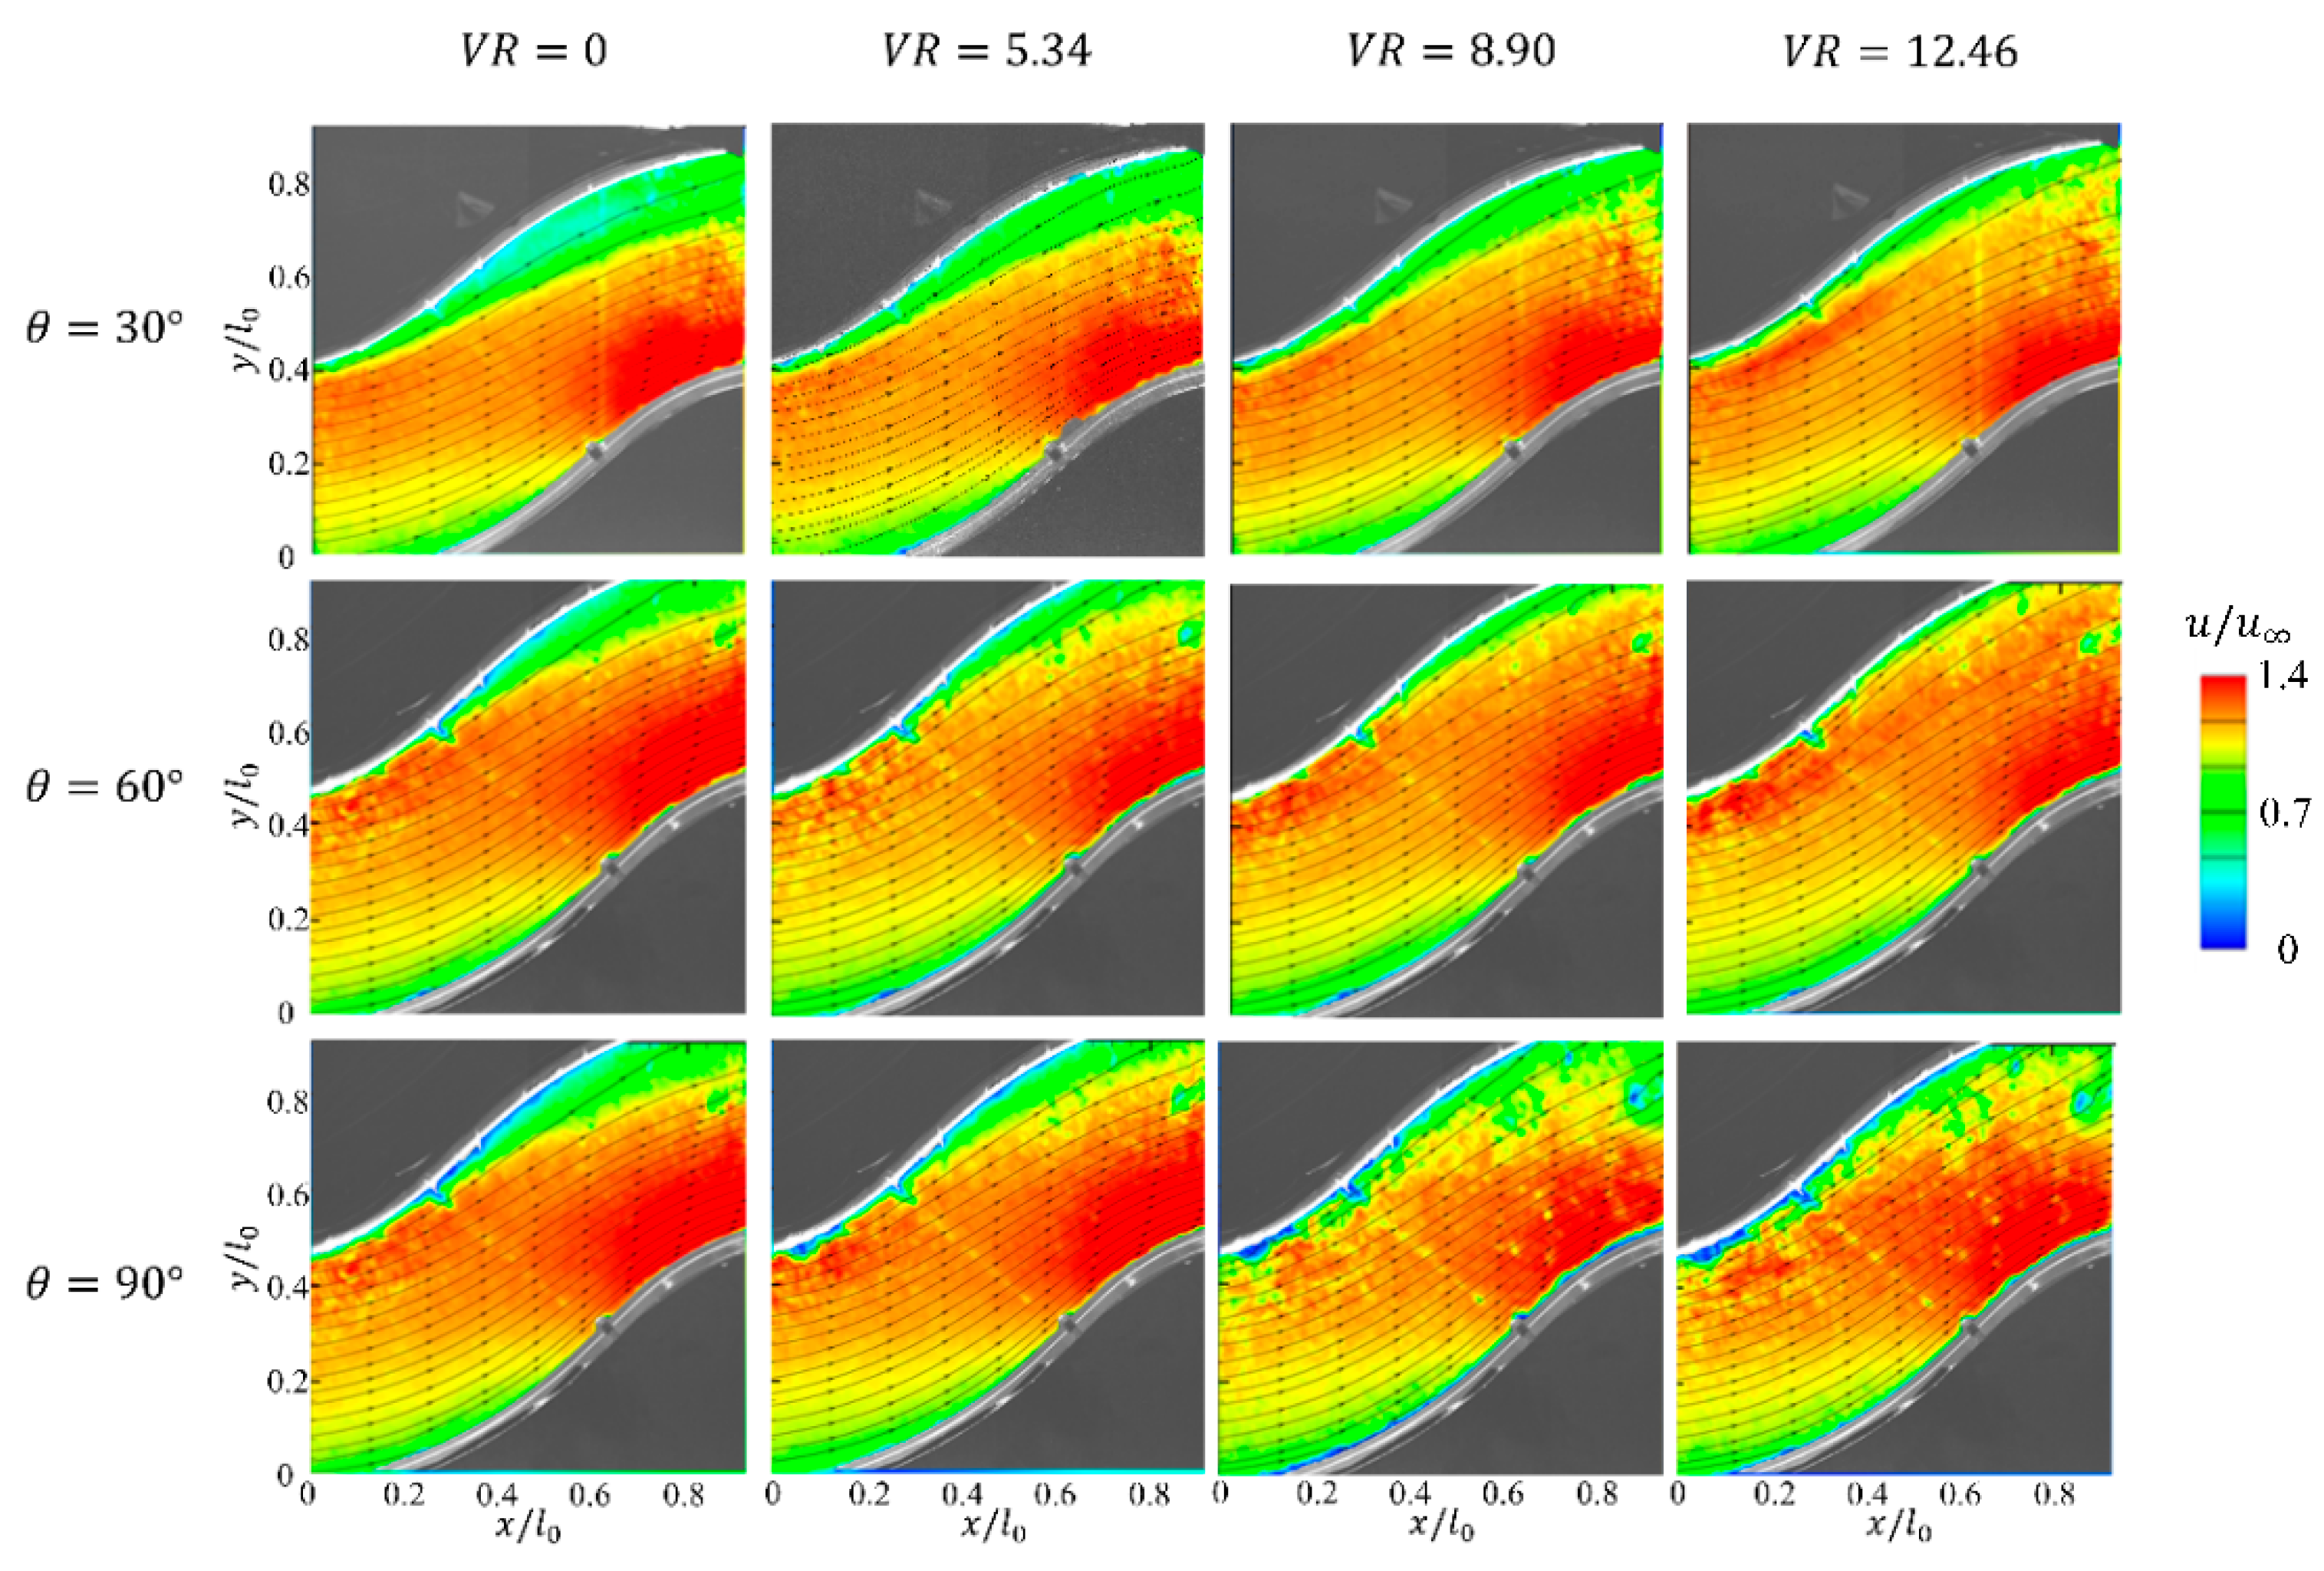
As shown in Figure 7, the measured near-wall flow response varies with jet incidence angle. At 30°, the reduction in the low-speed region is relatively limited. At 60°, a more pronounced contraction of the low-speed region and a more uniform time-averaged streamwise velocity distribution are observed. At 90°, local velocity enhancement is evident, but greater spatial non-uniformity remains within the measurement plane.
Figure 7.
Time-averaged velocity fields under different jet incidence angles.
These differences may be associated with the balance between streamwise momentum addition and wall-normal transport. At 30°, the jet momentum is directed predominantly along the mainstream, with a relatively limited wall-normal component. Increasing the angle to 60° provides a more balanced combination of streamwise momentum addition and wall-normal disturbance, whereas the stronger transverse penetration at 90° may lead to a less uniform redistribution of momentum. This interpretation is consistent with the observed differences in the measured velocity fields.
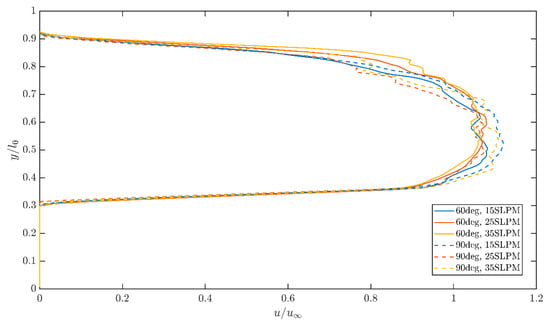
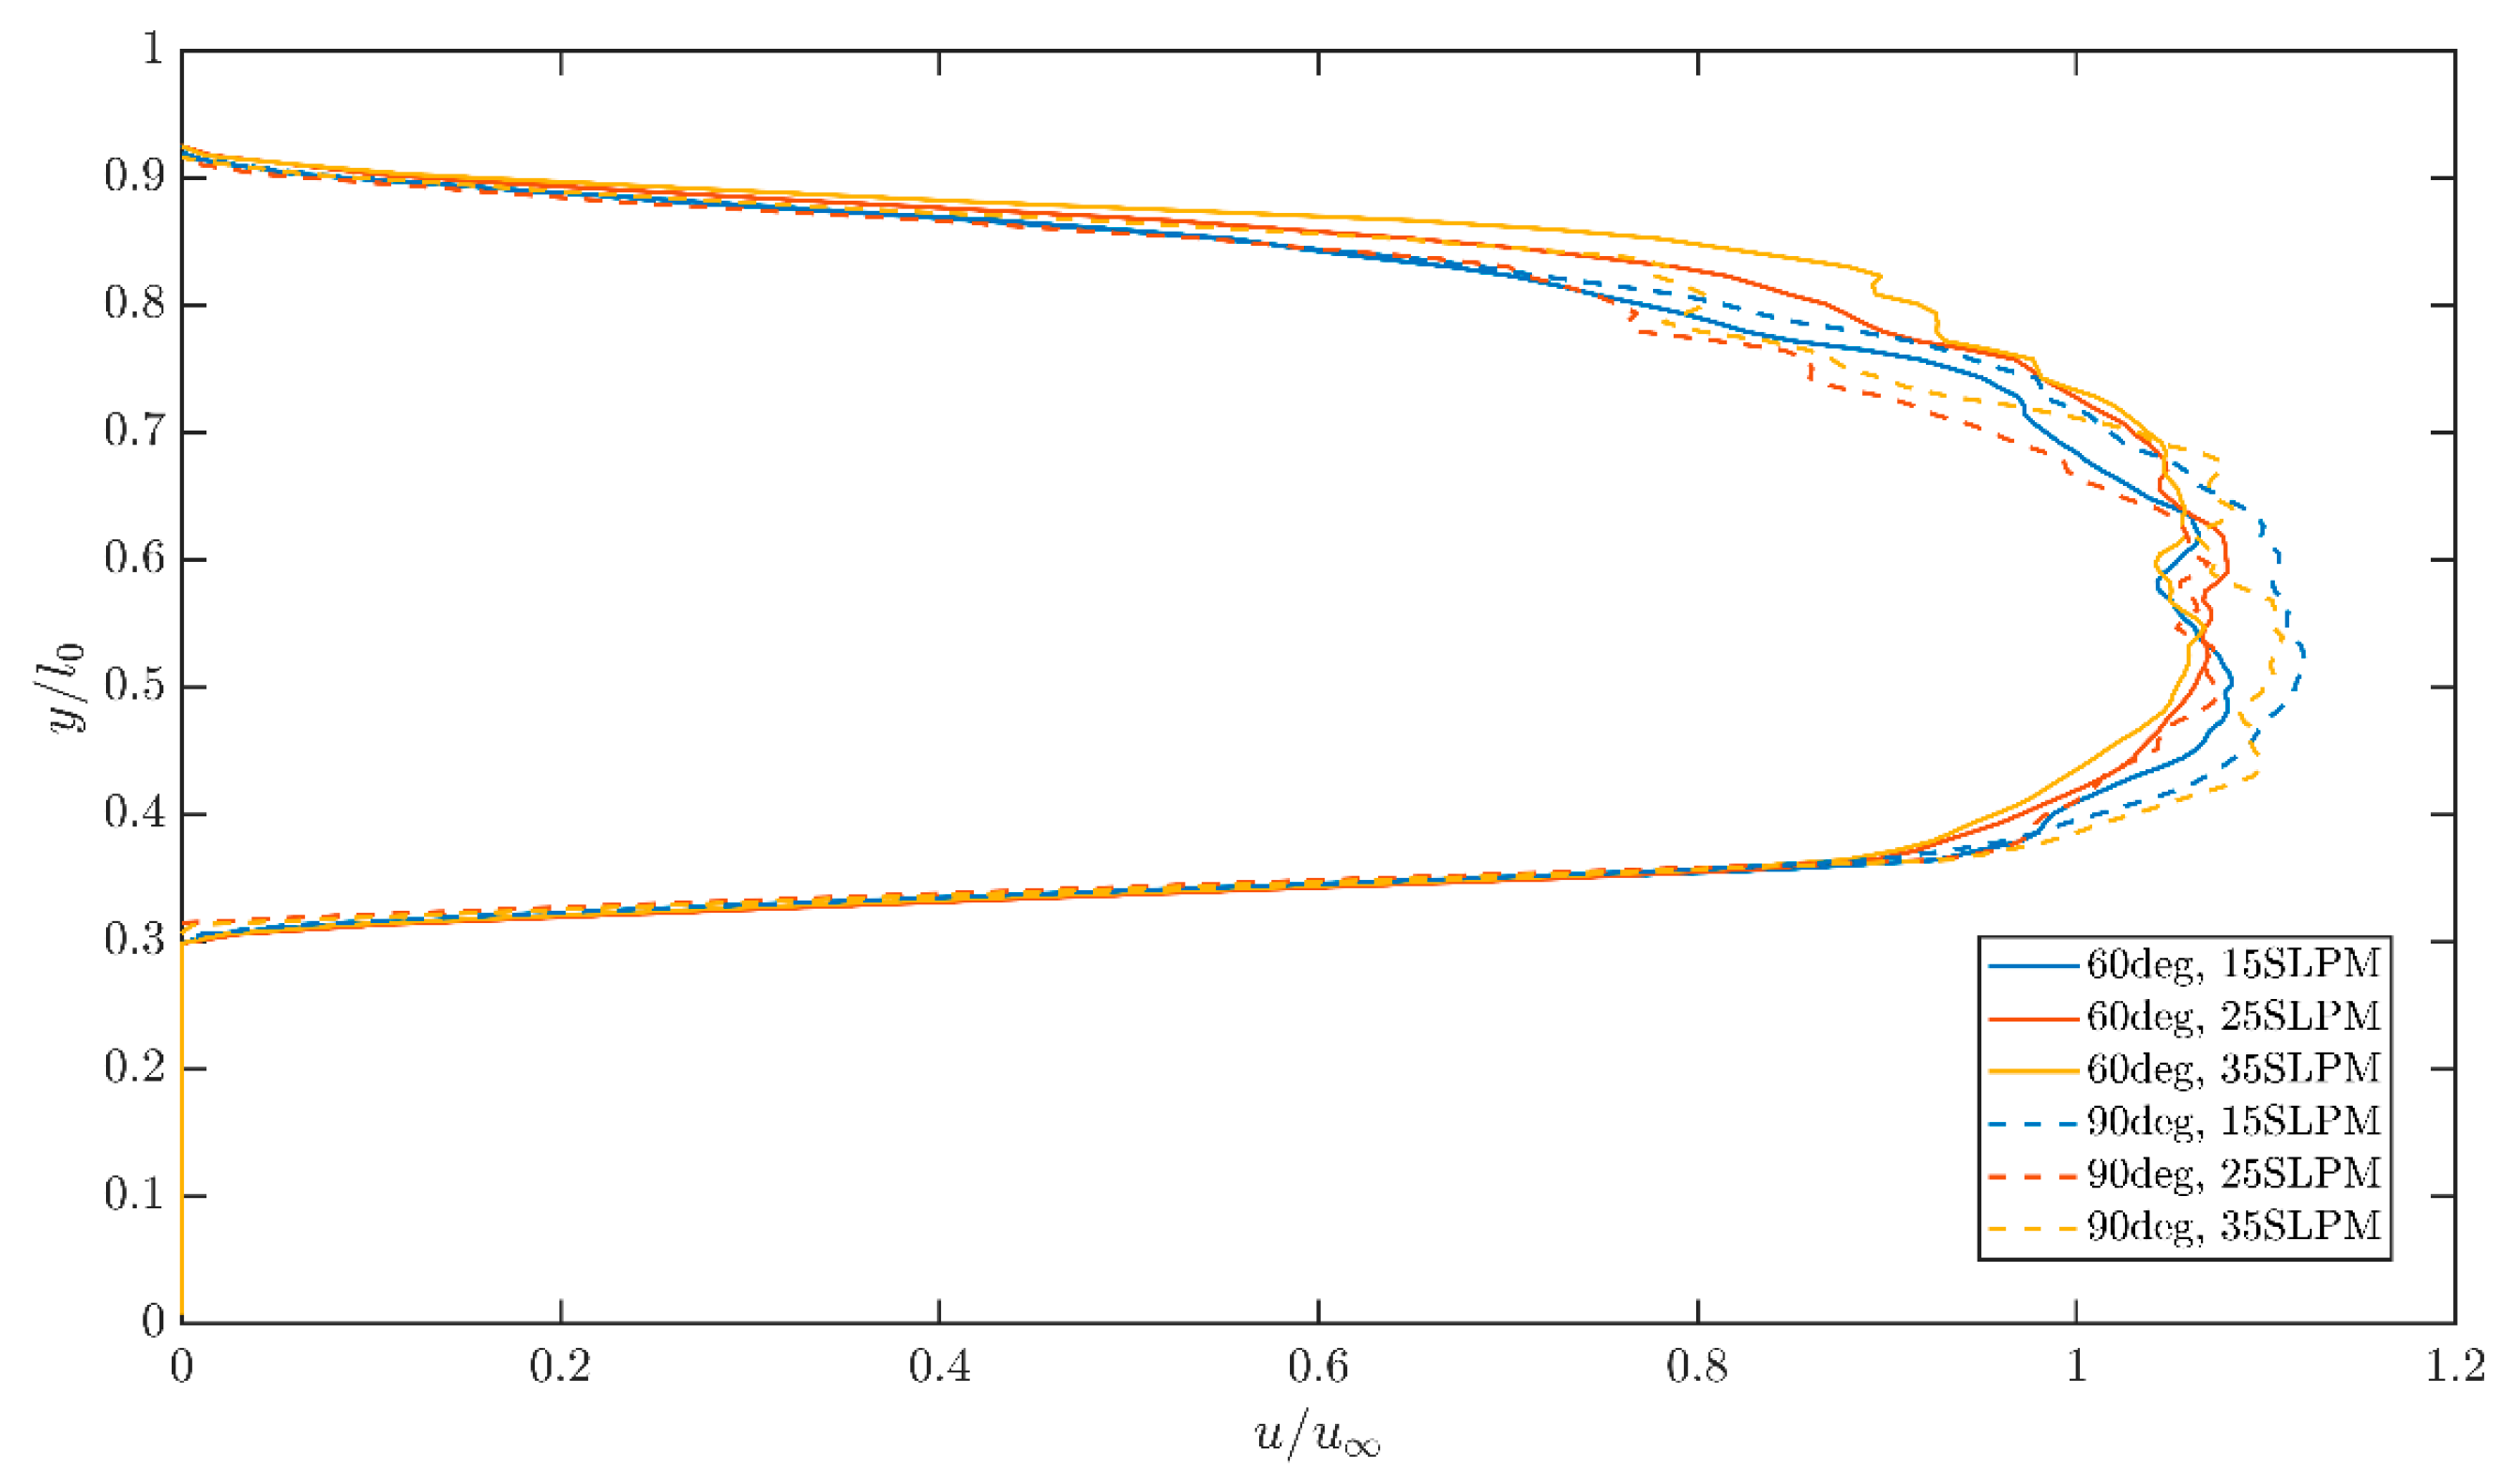
Figure 8 further compares the streamwise velocity profiles at x/l0 = 0.6 for the 60° and 90° configurations. The 60° case generally exhibits a fuller and smoother velocity distribution, whereas the 90° case shows more pronounced local variations, particularly near the upper shear-layer region. These differences are consistent with the time-averaged velocity fields shown in Figure 7. Similar sensitivity to jet orientation has been reported in previous sweeping jet separation control studies [31], and the present results demonstrate this behavior in a compact curved channel configuration.
Figure 8.
Streamwise velocity profiles at x/l0 = 0.6 for different jet incidence angles.
Among the tested jet incidence angles, the 60° configuration produced a greater reduction in the near-wall low-speed region and a smoother velocity distribution than the 90° configuration over most of the common VR range.
3.2.2. Effect of Actuator Placement
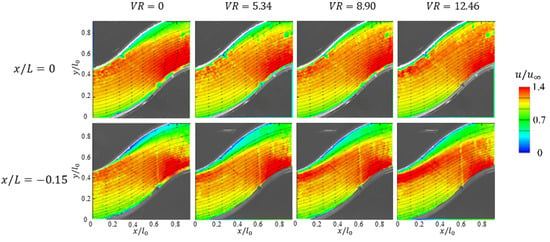
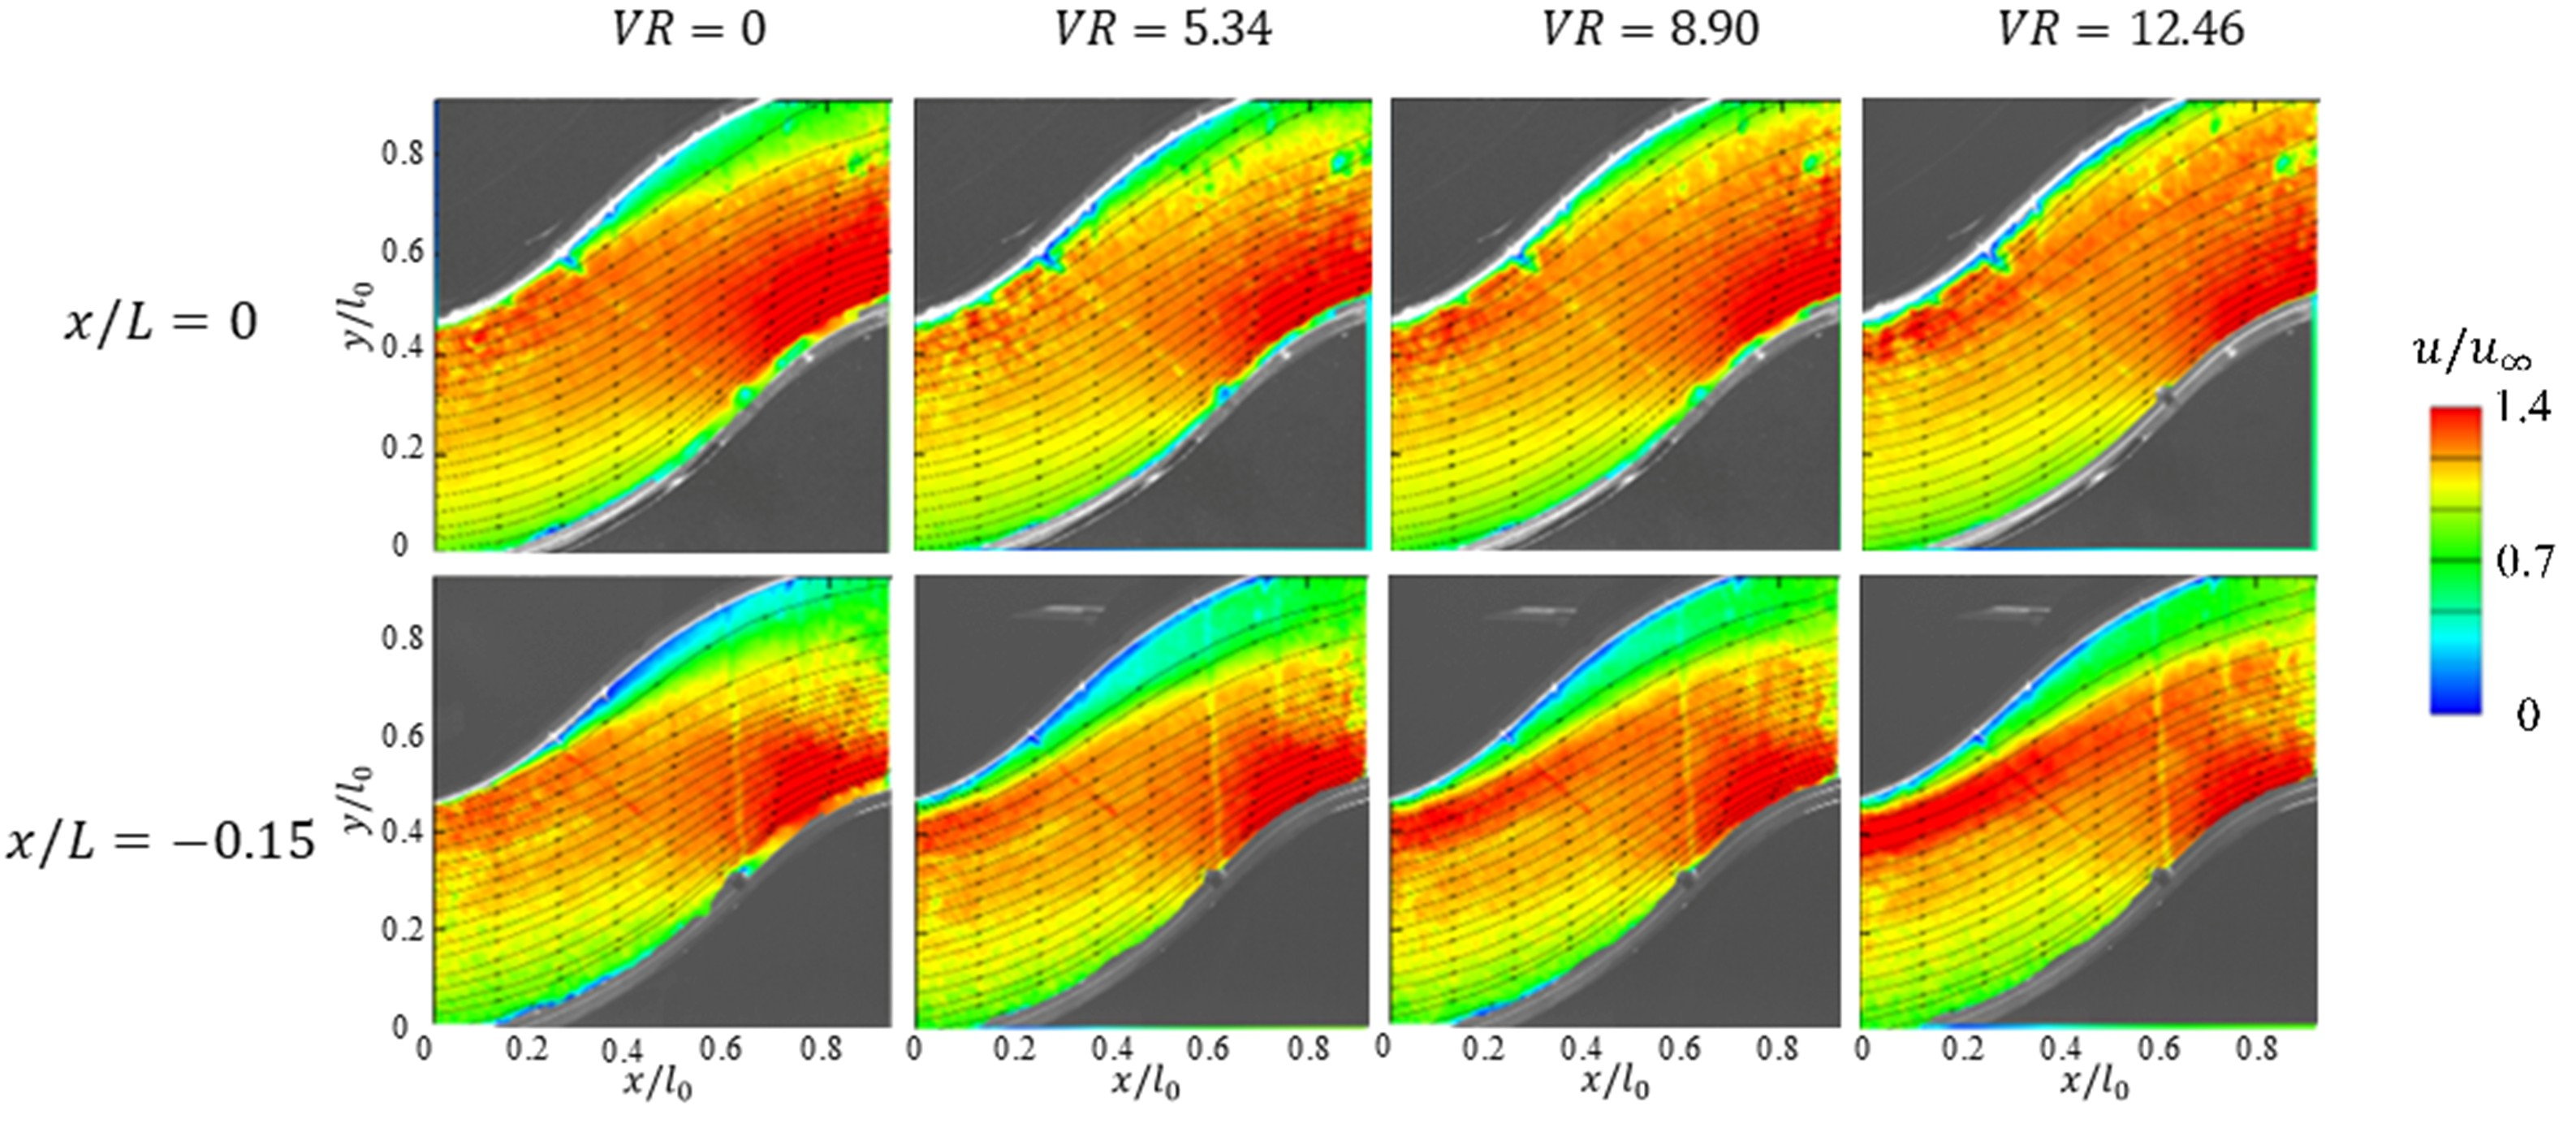
As shown in Figure 9, the two actuator locations produce different near-wall flow responses under the investigated velocity ratio conditions. The configuration at x/L = 0 generally exhibits a more pronounced reduction in the measured low-speed region, particularly at intermediate and high velocity ratios. In contrast, a larger residual low-speed region remains when the actuators are shifted upstream to x/L = −0.15, indicating a weaker local recovery response within the present measurement window.
Figure 9.
Time-averaged velocity fields at two excitation positions.
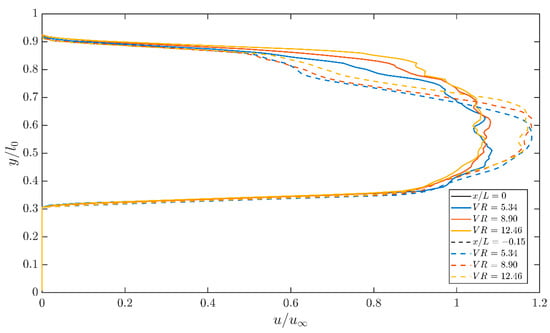
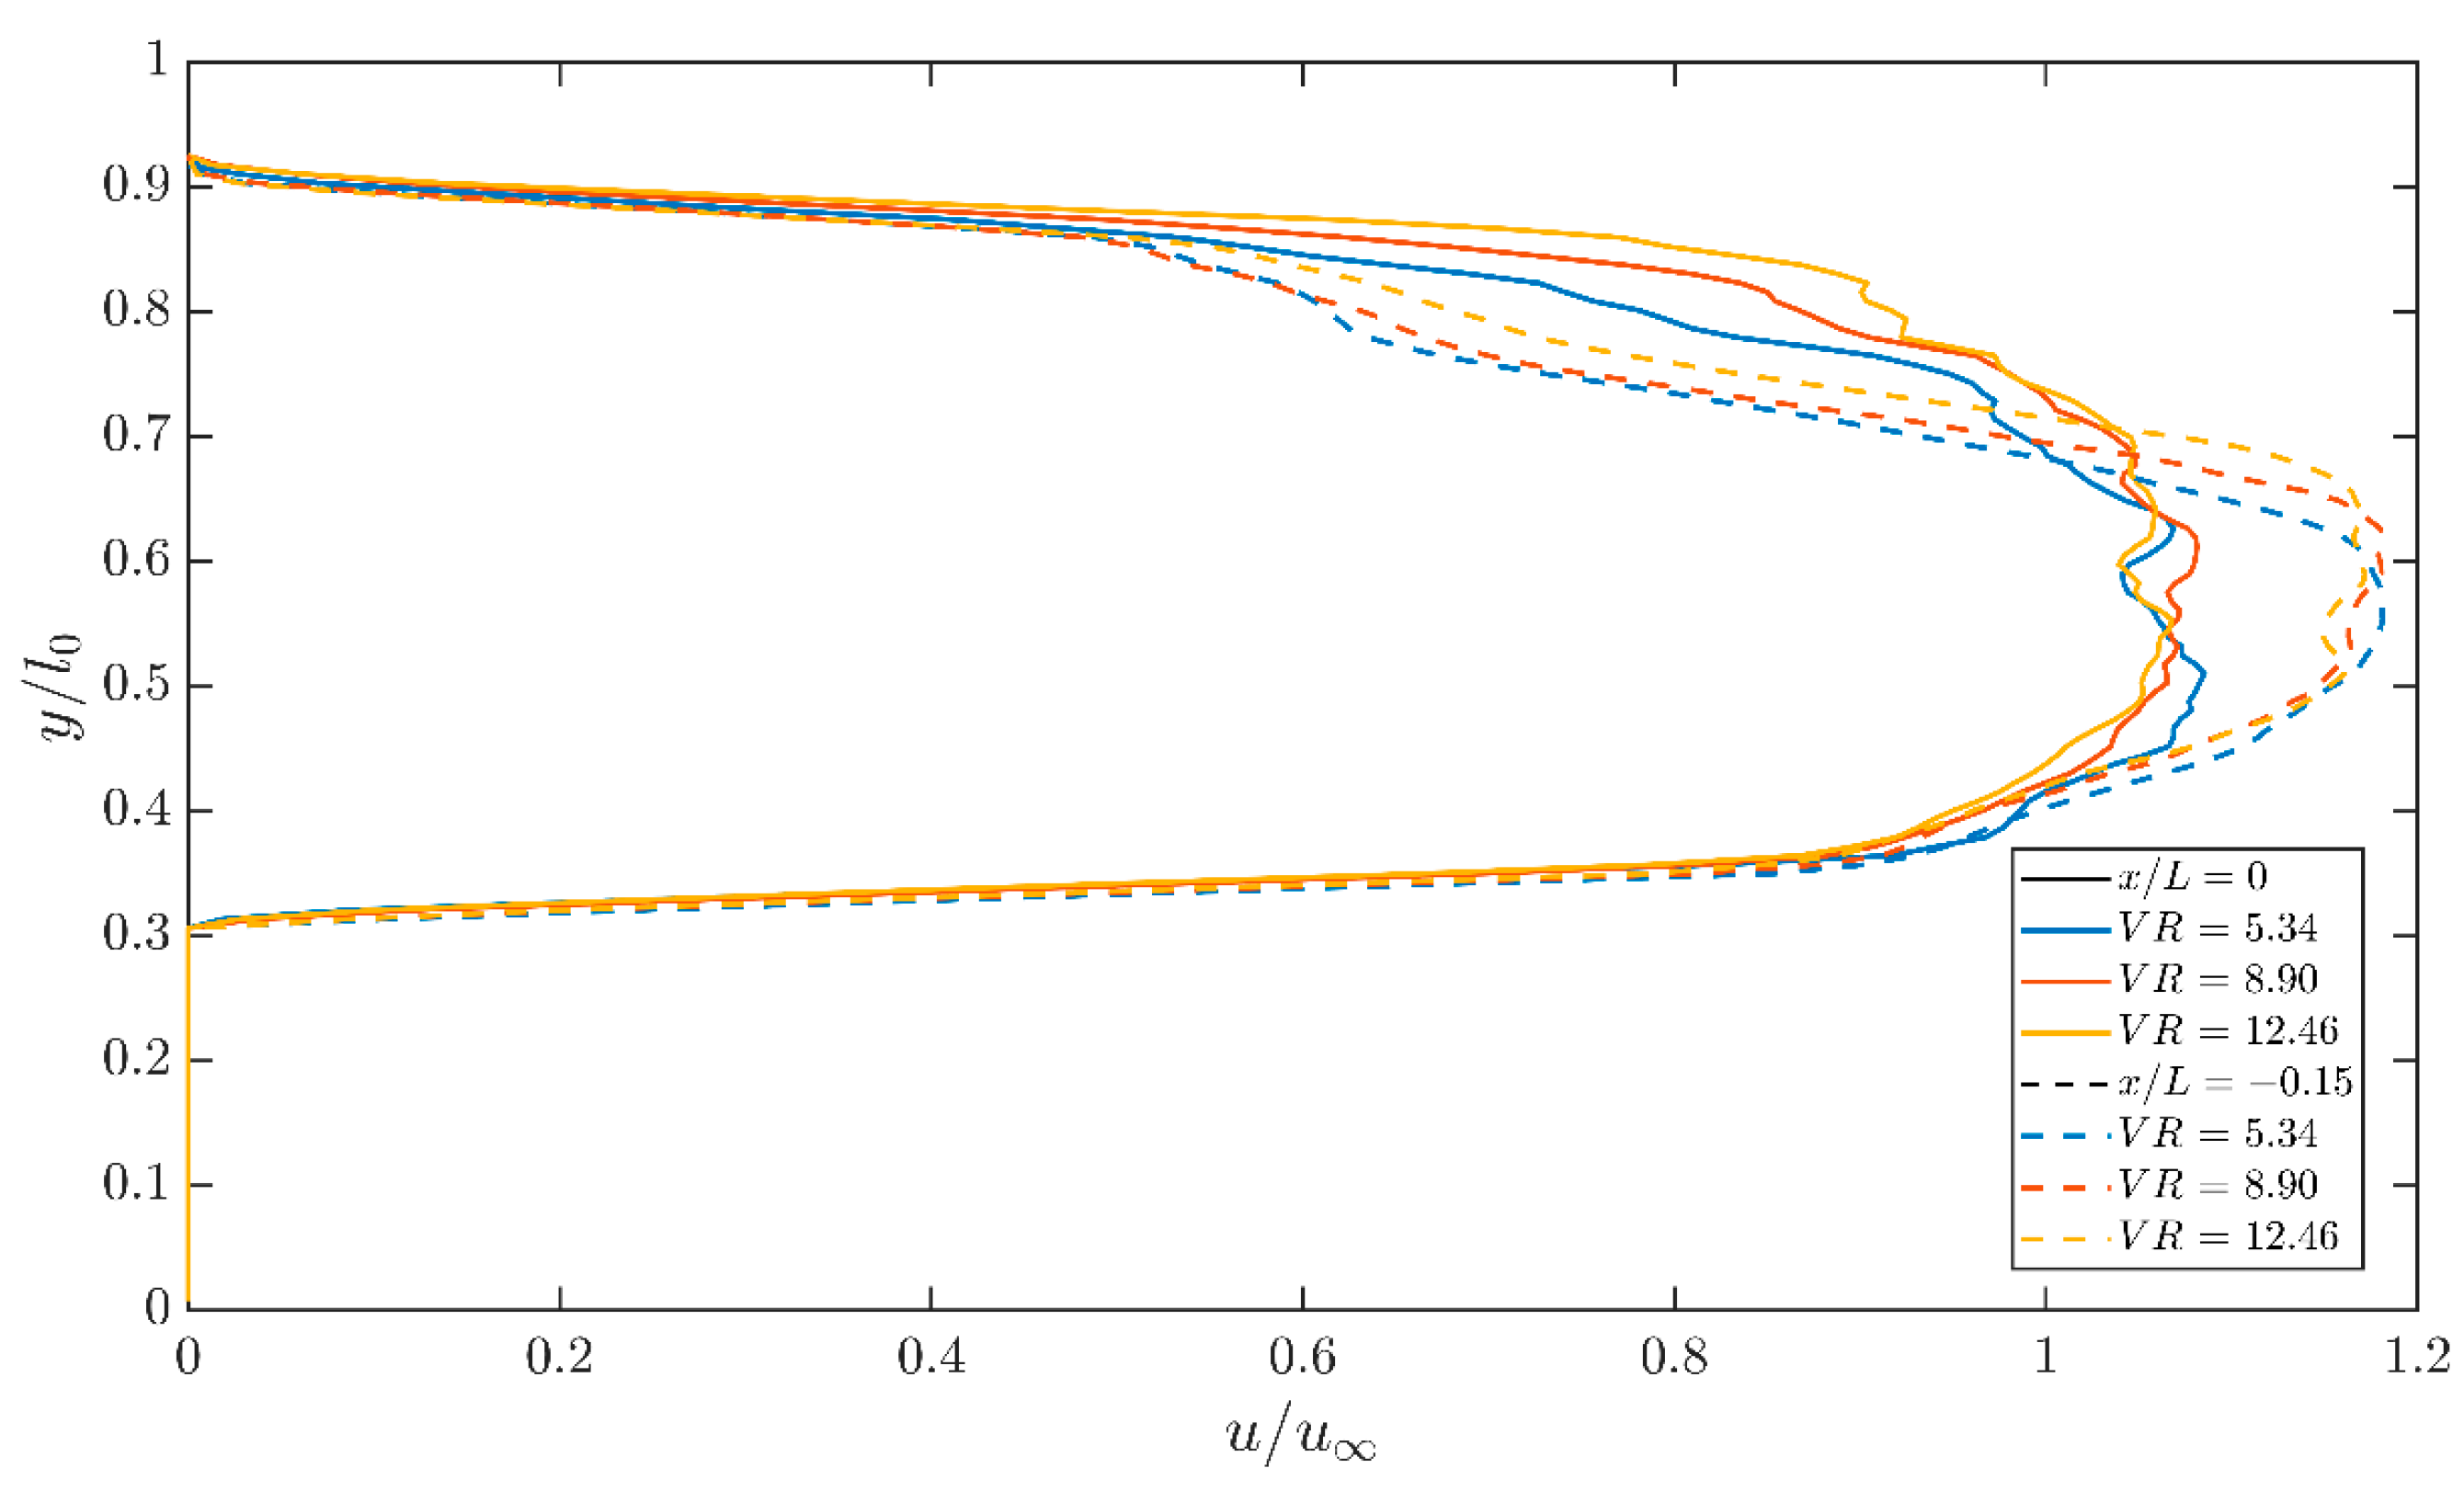
The velocity profiles in Figure 10 further illustrate this difference. At x/l0 = 0.6, the x/L = 0 configuration generally exhibits higher streamwise velocities, particularly in the upper near-wall and shear-layer regions. In contrast, the x/L = −0.15 configuration retains a more pronounced velocity deficit in these regions, indicating weaker local recovery.
Figure 10.
Streamwise velocity profiles at x/l0 = 0.6 at two excitation positions.
The observed difference may be associated with the relative position of the actuator and the developing near-wall velocity deficit region. At x/L = 0, the sweeping jet interacts with the flow near the beginning of the curved section. When the actuator is shifted upstream to x/L = −0.15, the introduced disturbance undergoes additional downstream convection before reaching the measurement window, potentially weakening its local influence. Thus, the x/L = 0 configuration exhibits a more favorable local response within the investigated measurement region, although this finding should not be interpreted as a general optimization of actuator position.
3.2.3. Coupled Effects of Array Layout and Actuation Input
It should be emphasized that the comparison between the 4SJA-15 and 6SJA-10 configurations does not isolate the effect of array spacing alone. When the configuration changes from 4SJA-15 to 6SJA-10, the actuator number, spanwise pitch, and total supplied actuation input are changed simultaneously. Therefore, the following discussion is treated as a configuration-level comparison involving coupled effects of array layout and actuation input.
As shown in Figure 11, both the 6SJA-10 and 4SJA-15 configurations reduce the measured near-wall low-speed region. Under the investigated unmatched actuation input conditions, the 6SJA-10 configuration generally exhibits a more continuous local recovery pattern and a smoother time-averaged streamwise velocity distribution. However, the observed difference reflects the coupled influence of actuator number, spanwise pitch, and total supplied actuation input rather than the isolated effect of actuator spacing.
Figure 11.
Time-averaged in-plane streamwise velocity fields for the 6SJA-10 and 4SJA-15 array configurations under the present unmatched actuation input conditions.
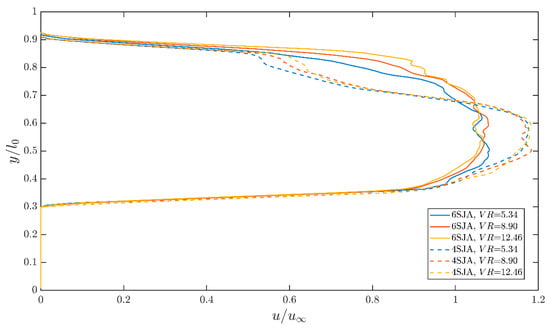
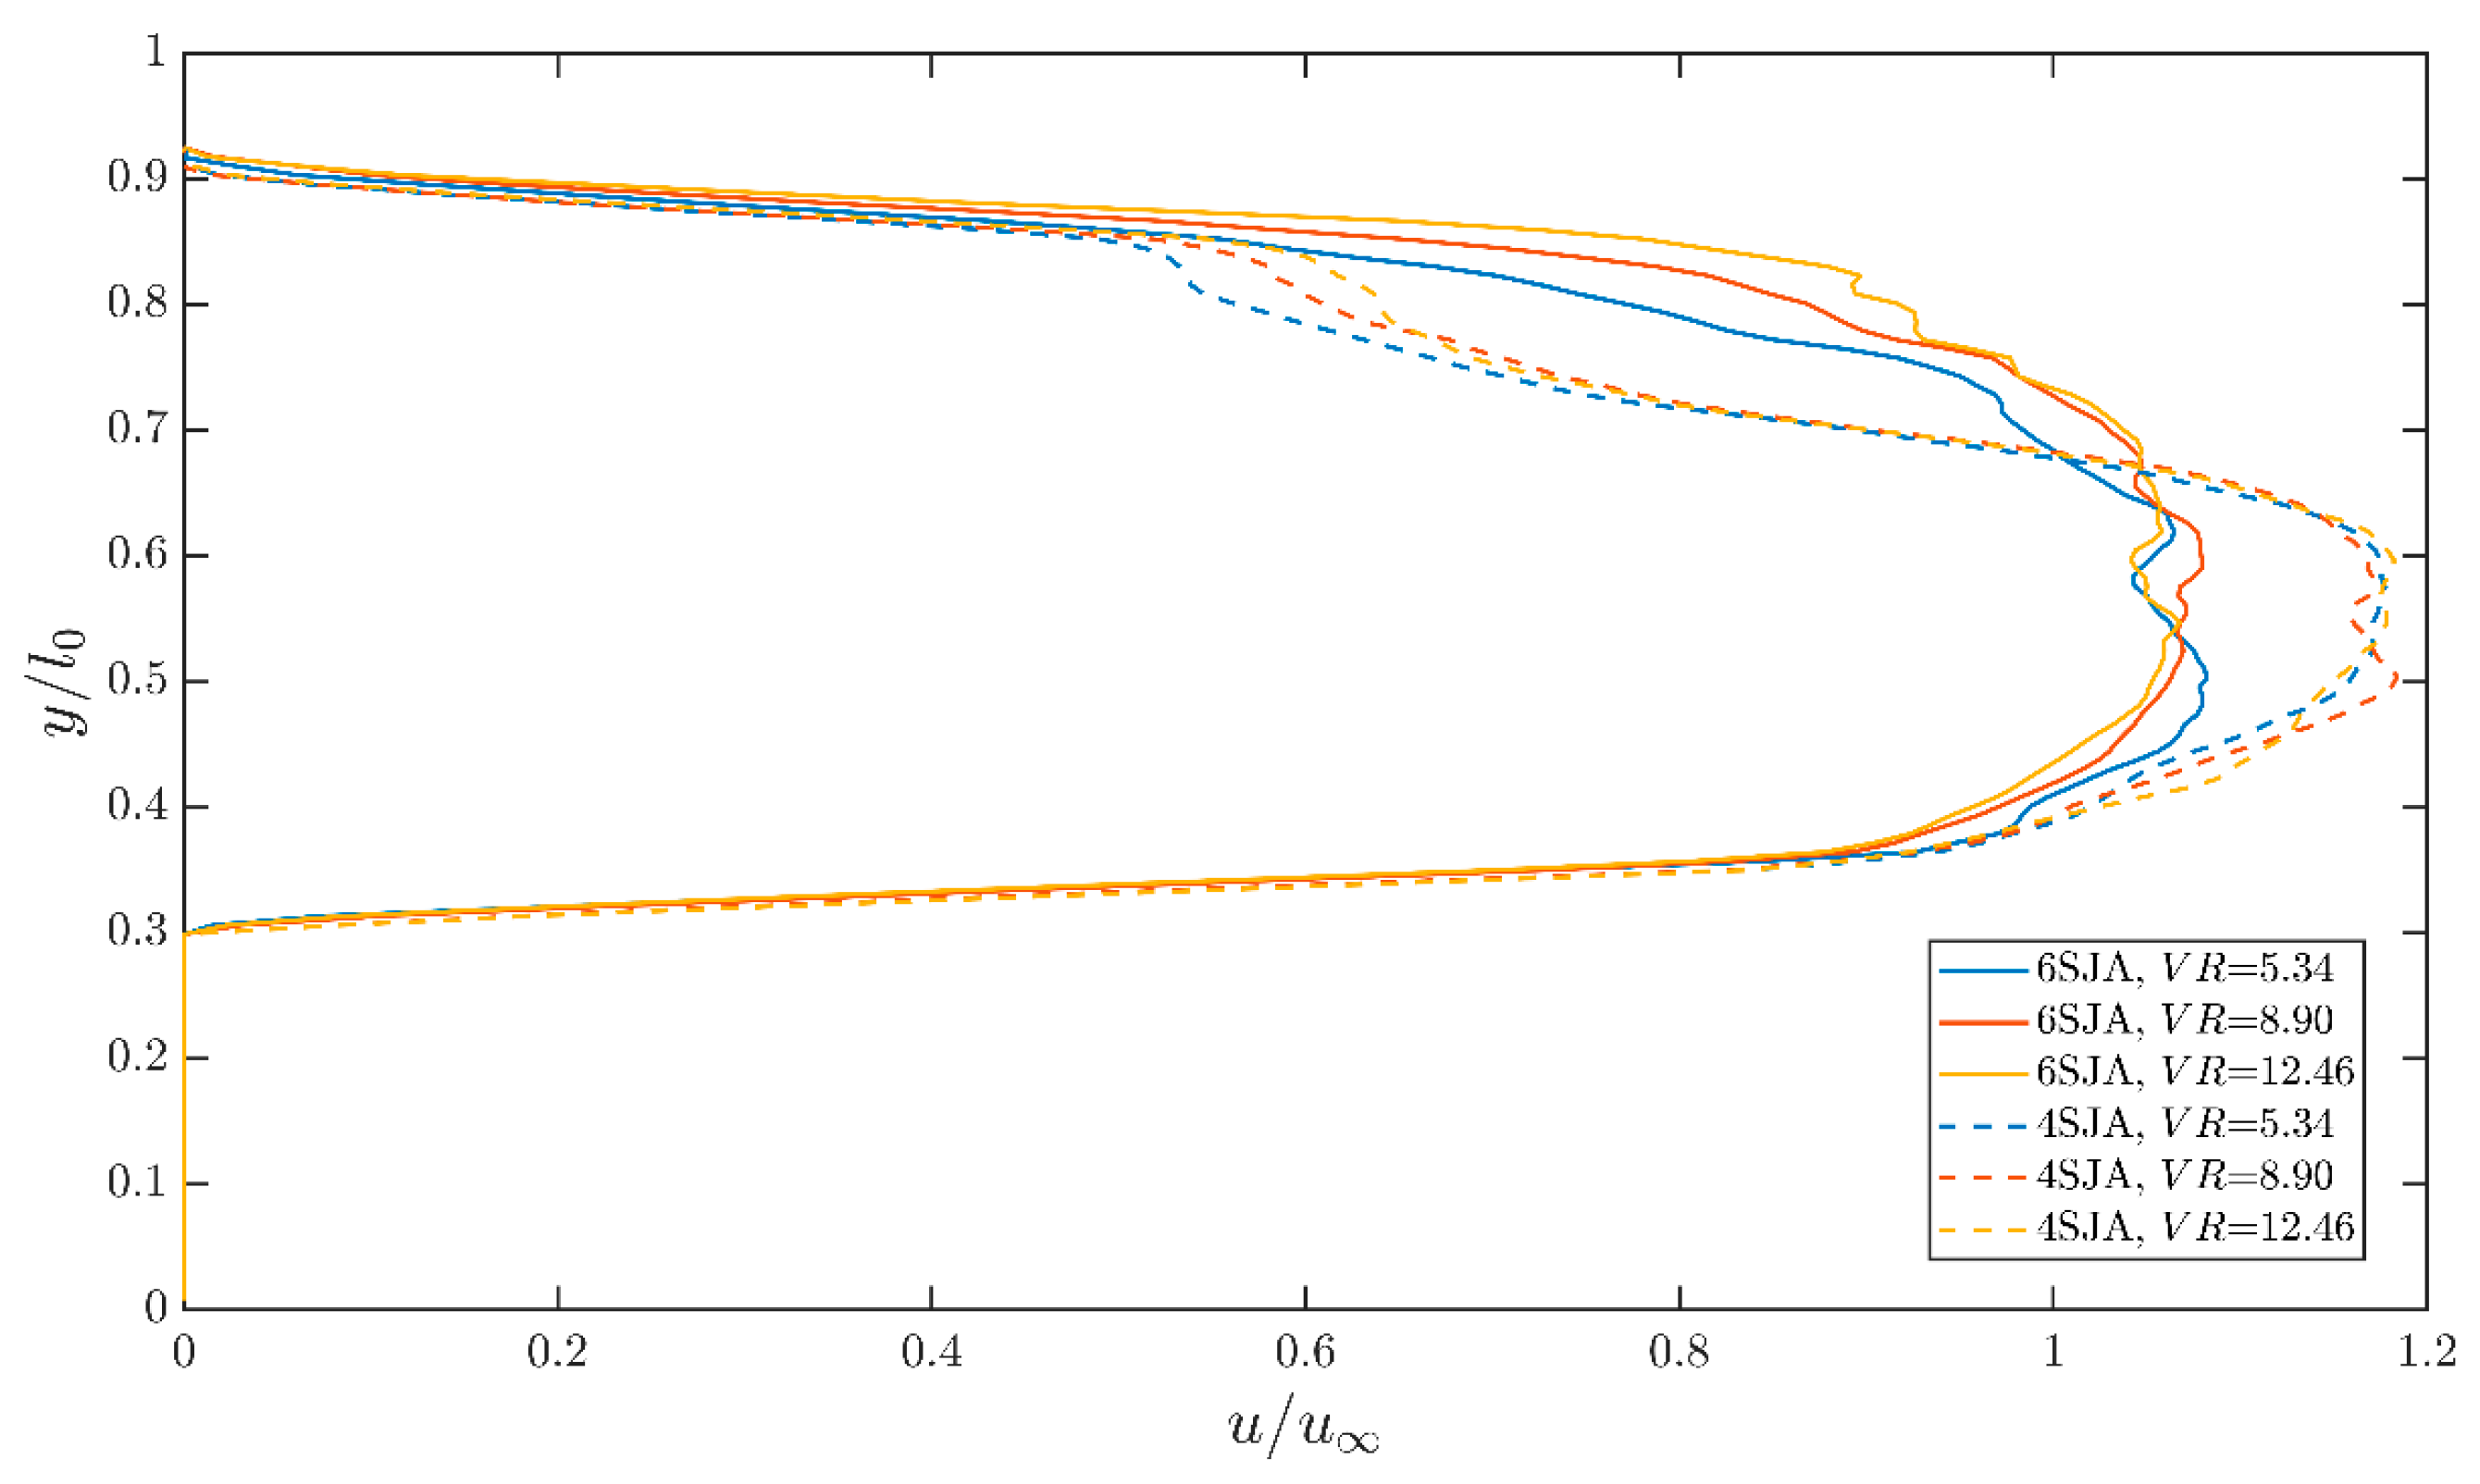
Figure 12 further compares the streamwise velocity profiles at x/l0 = 0.6. The 6SJA-10 configuration generally exhibits higher near-wall streamwise velocities, whereas the 4SJA-15 configuration shows greater local variations near the upper shear-layer region. These observations indicate greater local streamwise velocity recovery for the 6SJA-10 configuration under the tested conditions.
Figure 12.
Streamwise velocity profiles at x/l0 = 0.6 for the 6SJA-10 and 4SJA-15 configurations.
The differences observed in Figure 11 and Figure 12 may be associated with the combined effects of actuator number, spanwise pitch, and total actuation input. The denser 6SJA-10 arrangement provides a more continuous spanwise distribution of actuation, while the greater number of oscillators also changes the total supplied input. Similar sensitivity to actuator layout has been reported in previous sweeping jet studies of S-shaped internal flows [34]. Therefore, the present results should be interpreted as a coupled configuration-level response. Isolating the independent contribution of actuator spacing would require further experiments under matched actuation input conditions.
3.2.4. Effect of Velocity Ratio (VR)
In the present study, VR is used as an equivalent global actuation input parameter based on the supplied mass flow rate and actuator throat area. Because the sweeping jet is intrinsically unsteady and spatially distributed, VR does not fully characterize the instantaneous forcing of the oscillator. Therefore, the following discussion should be interpreted as the response of the measured local near-wall flow to increasing equivalent actuation input.
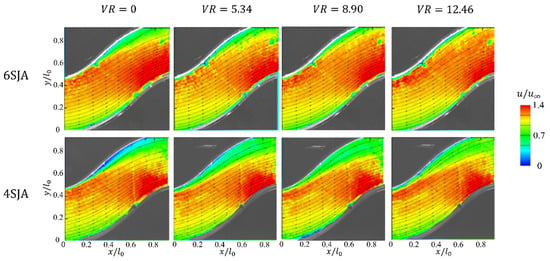
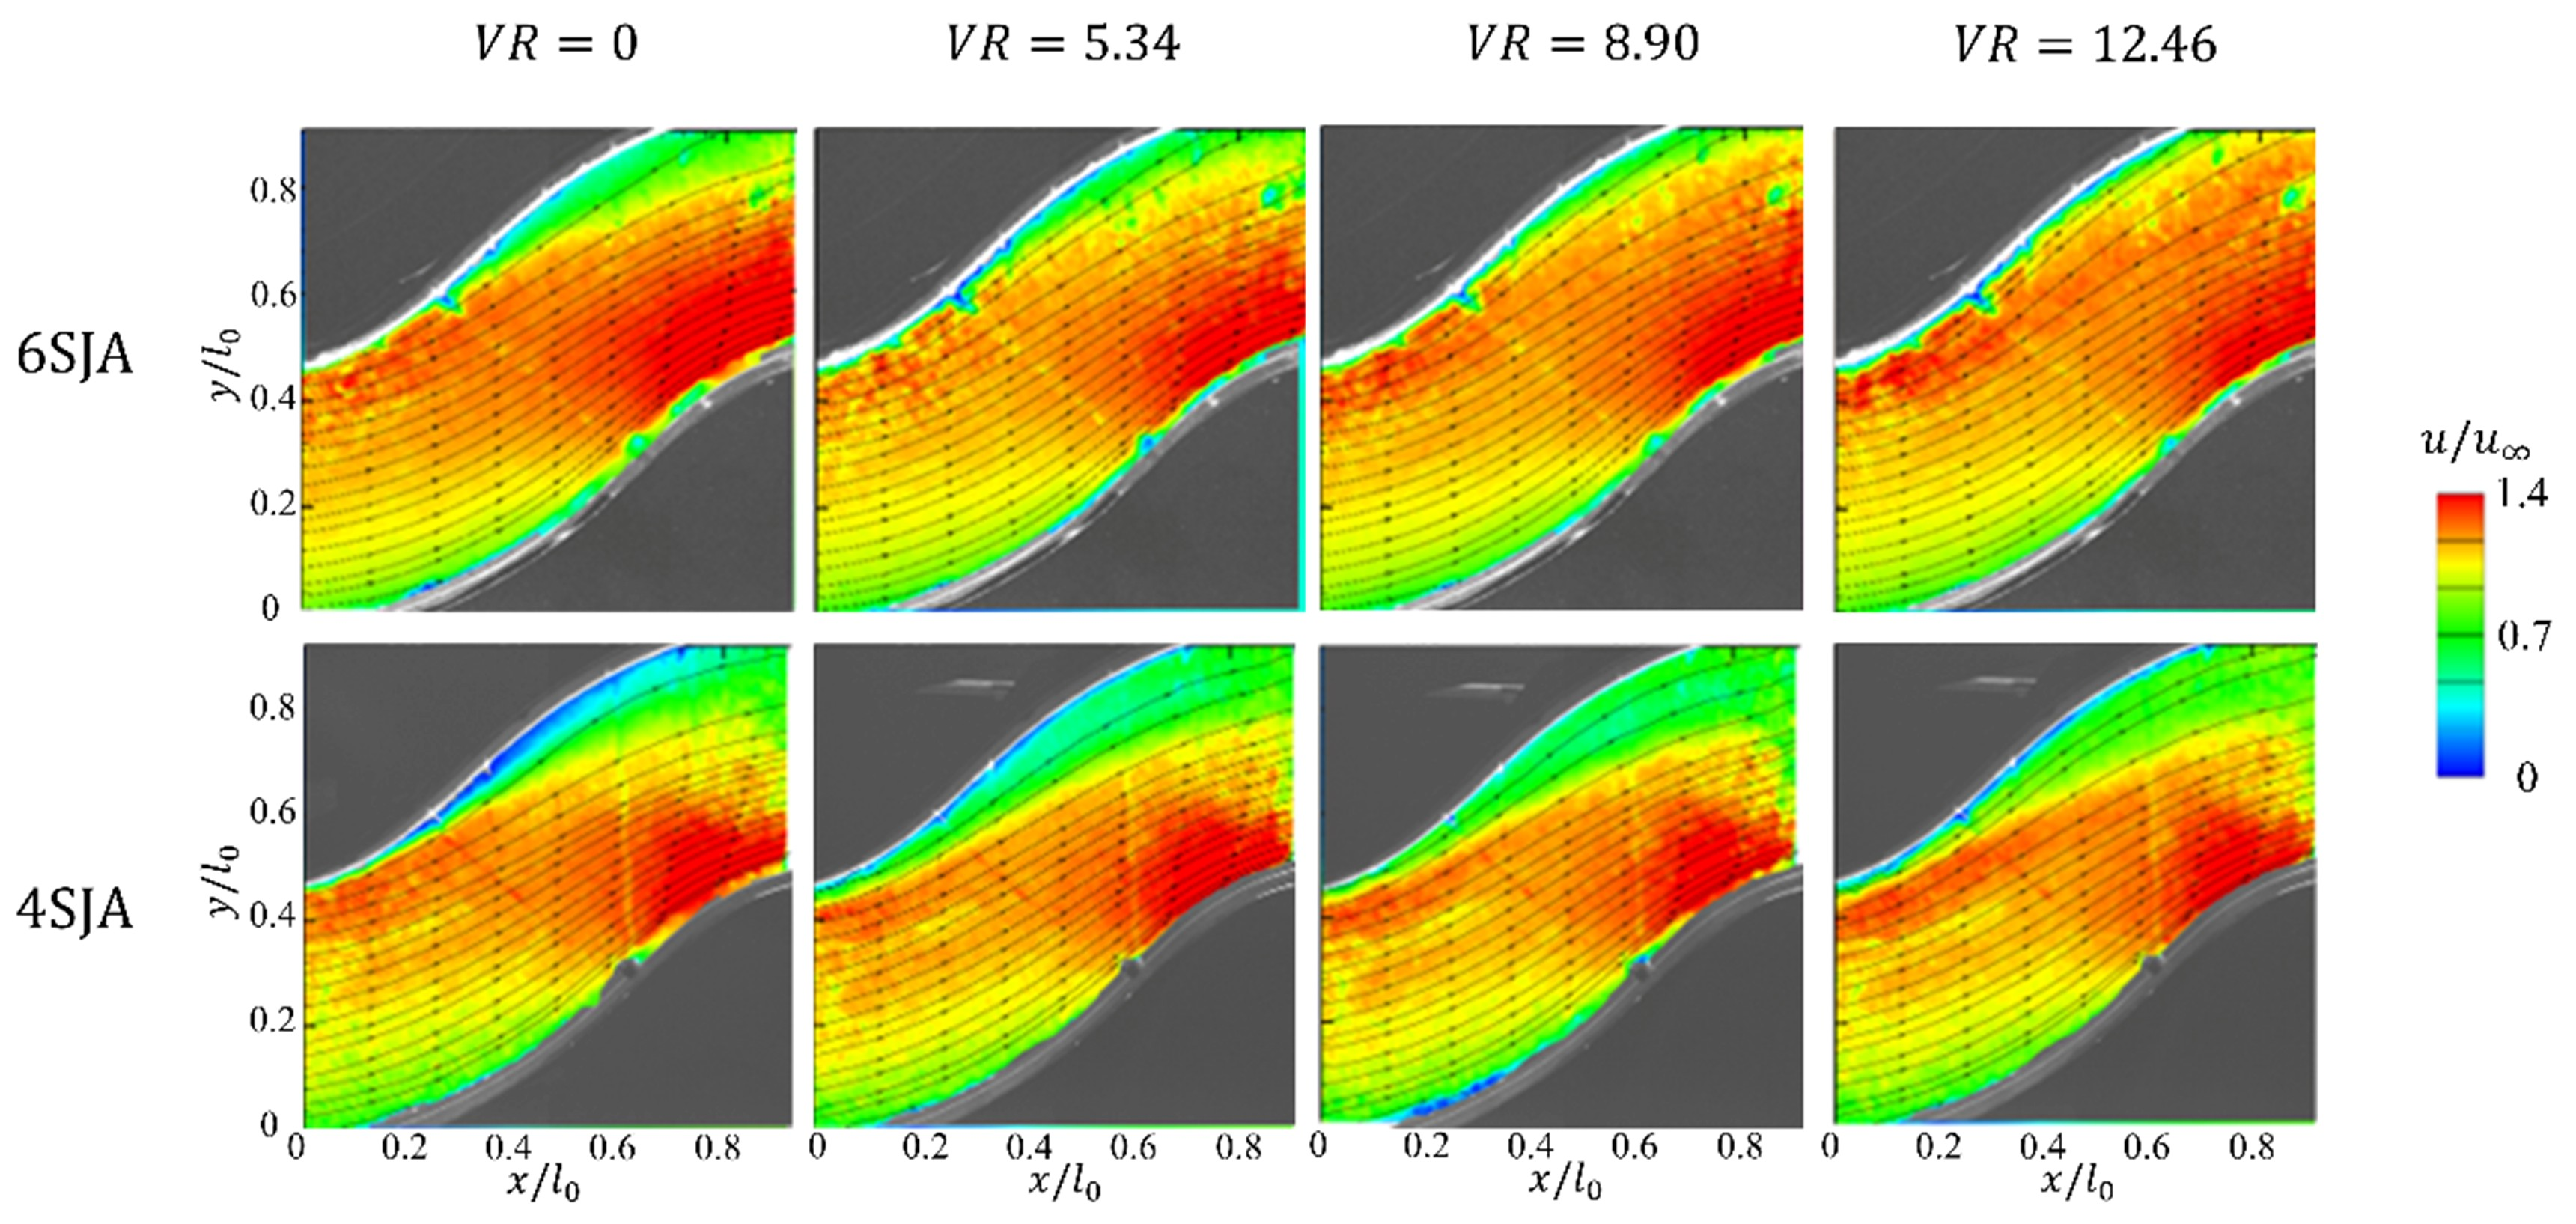
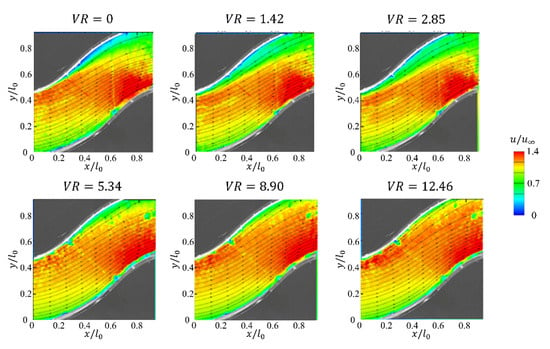
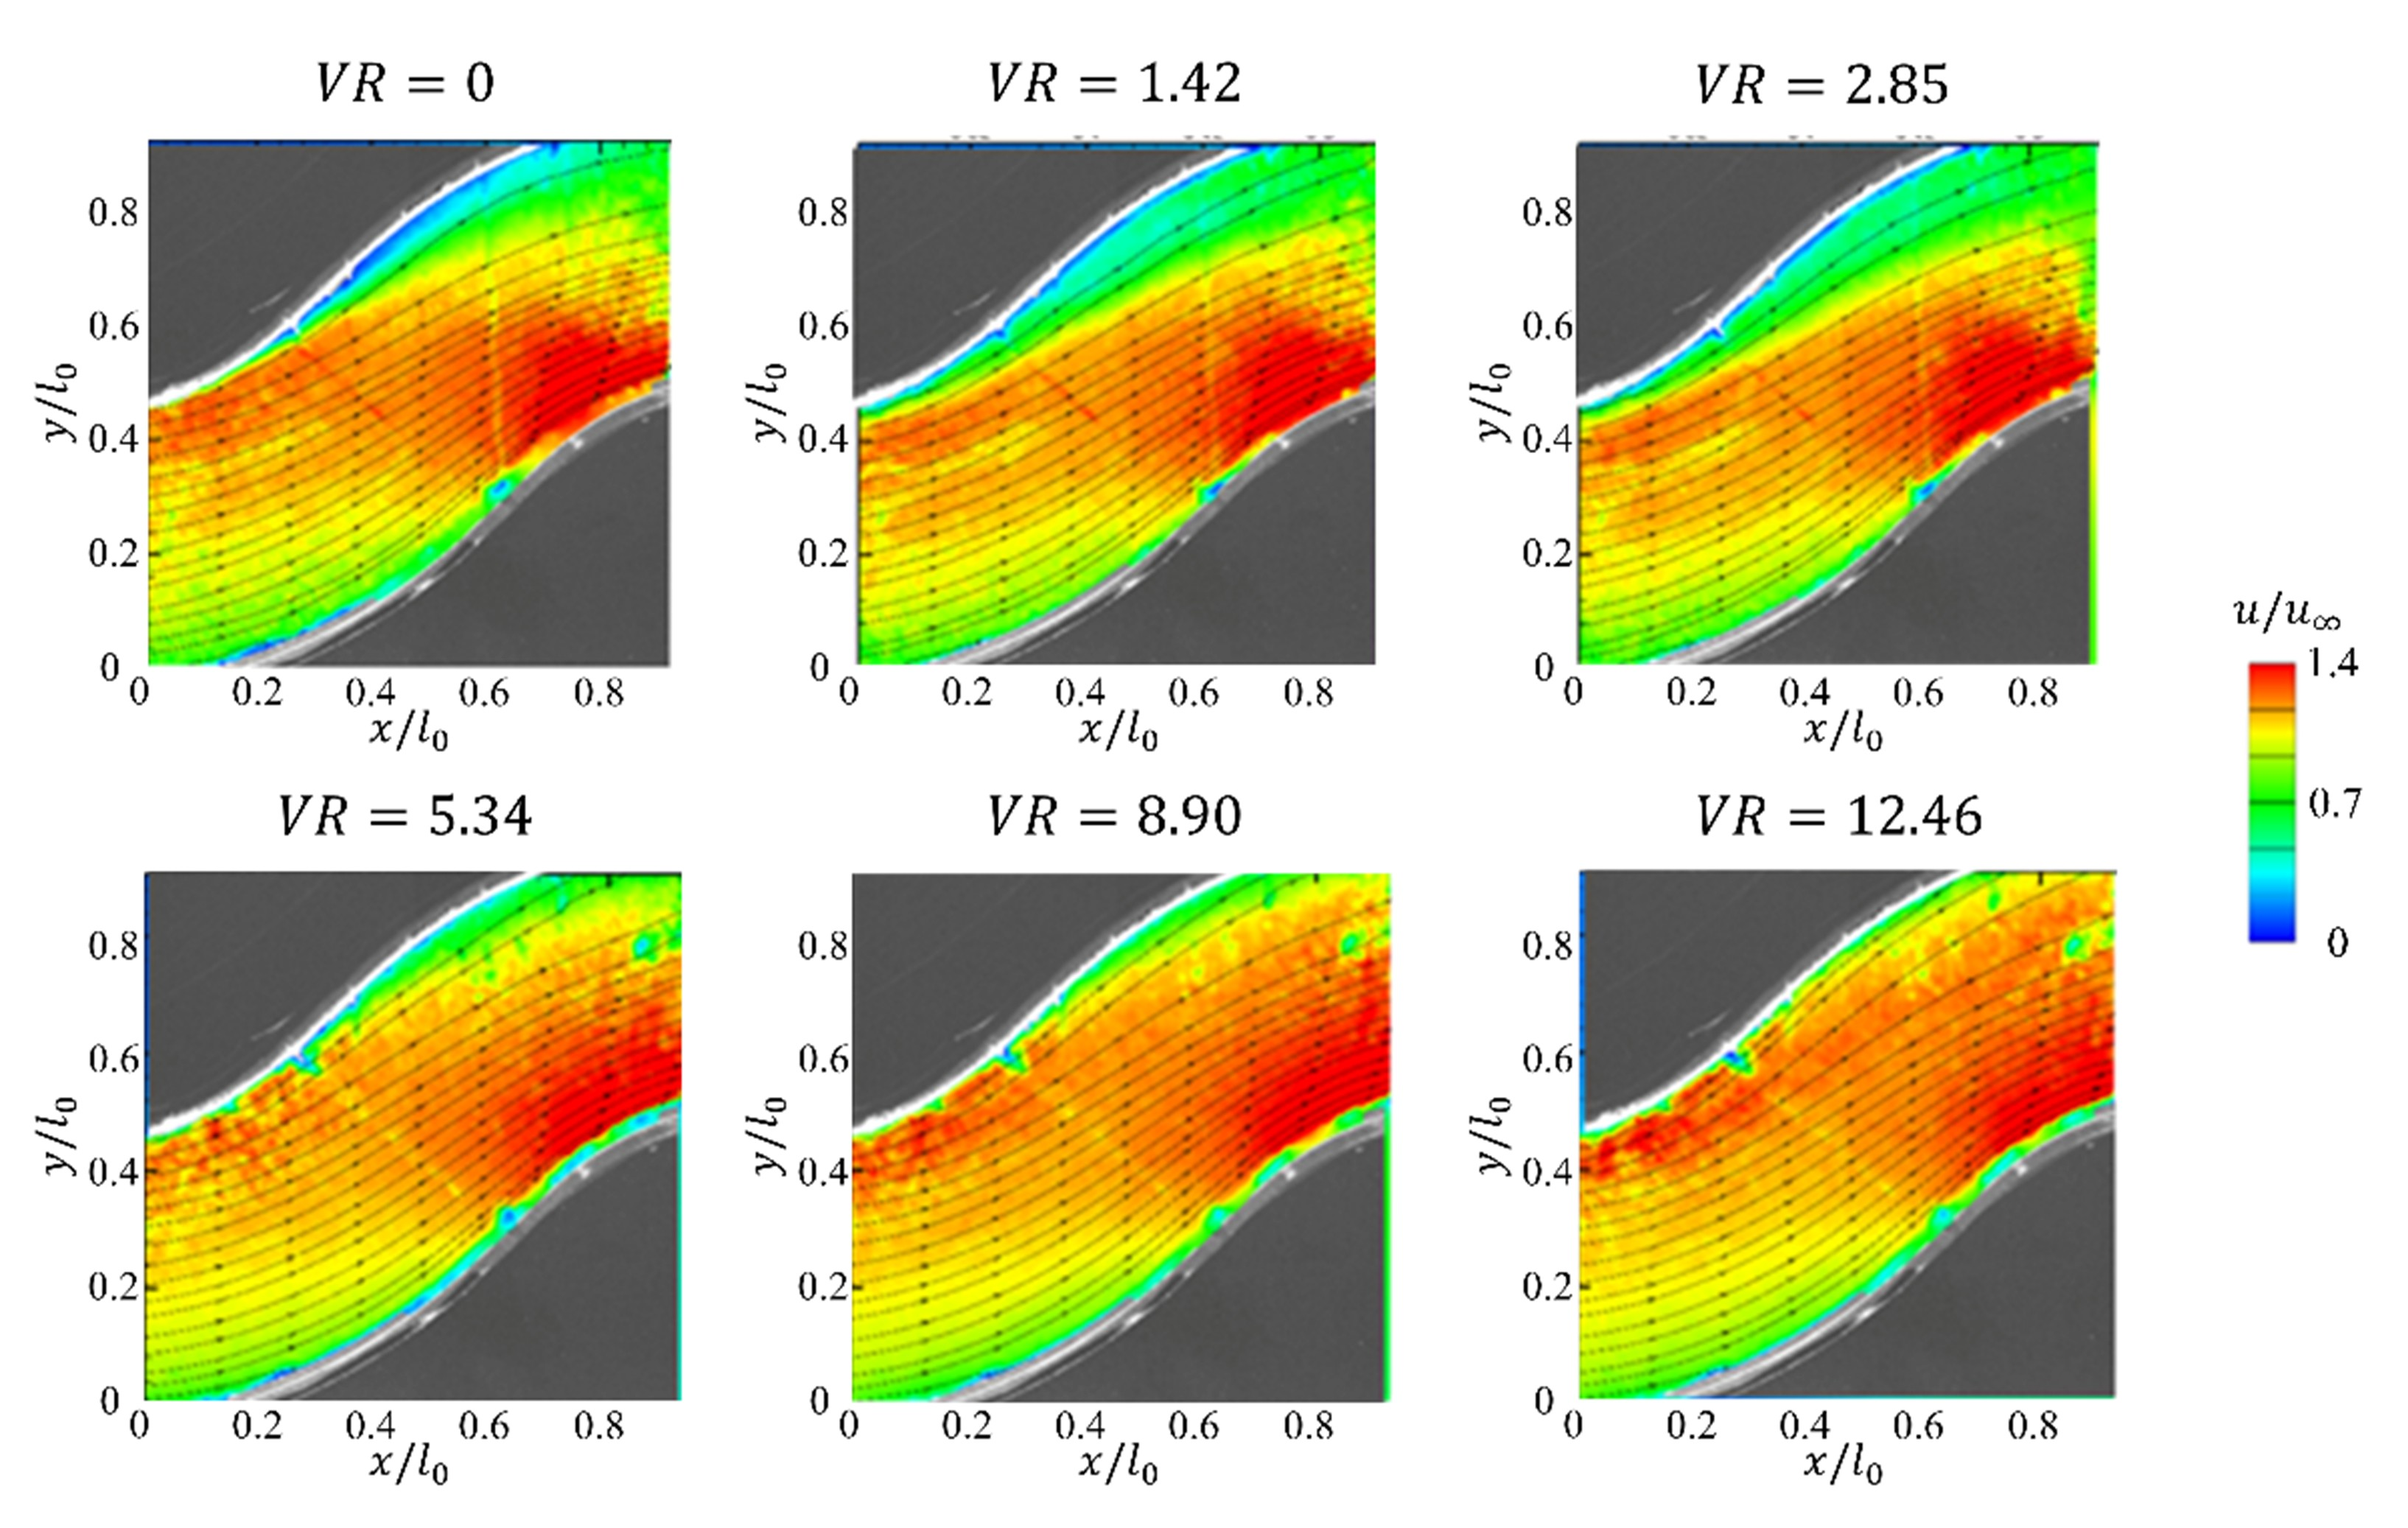
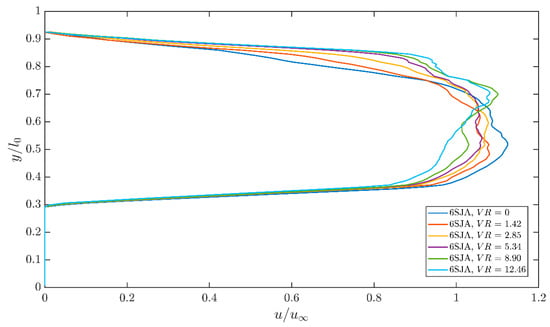
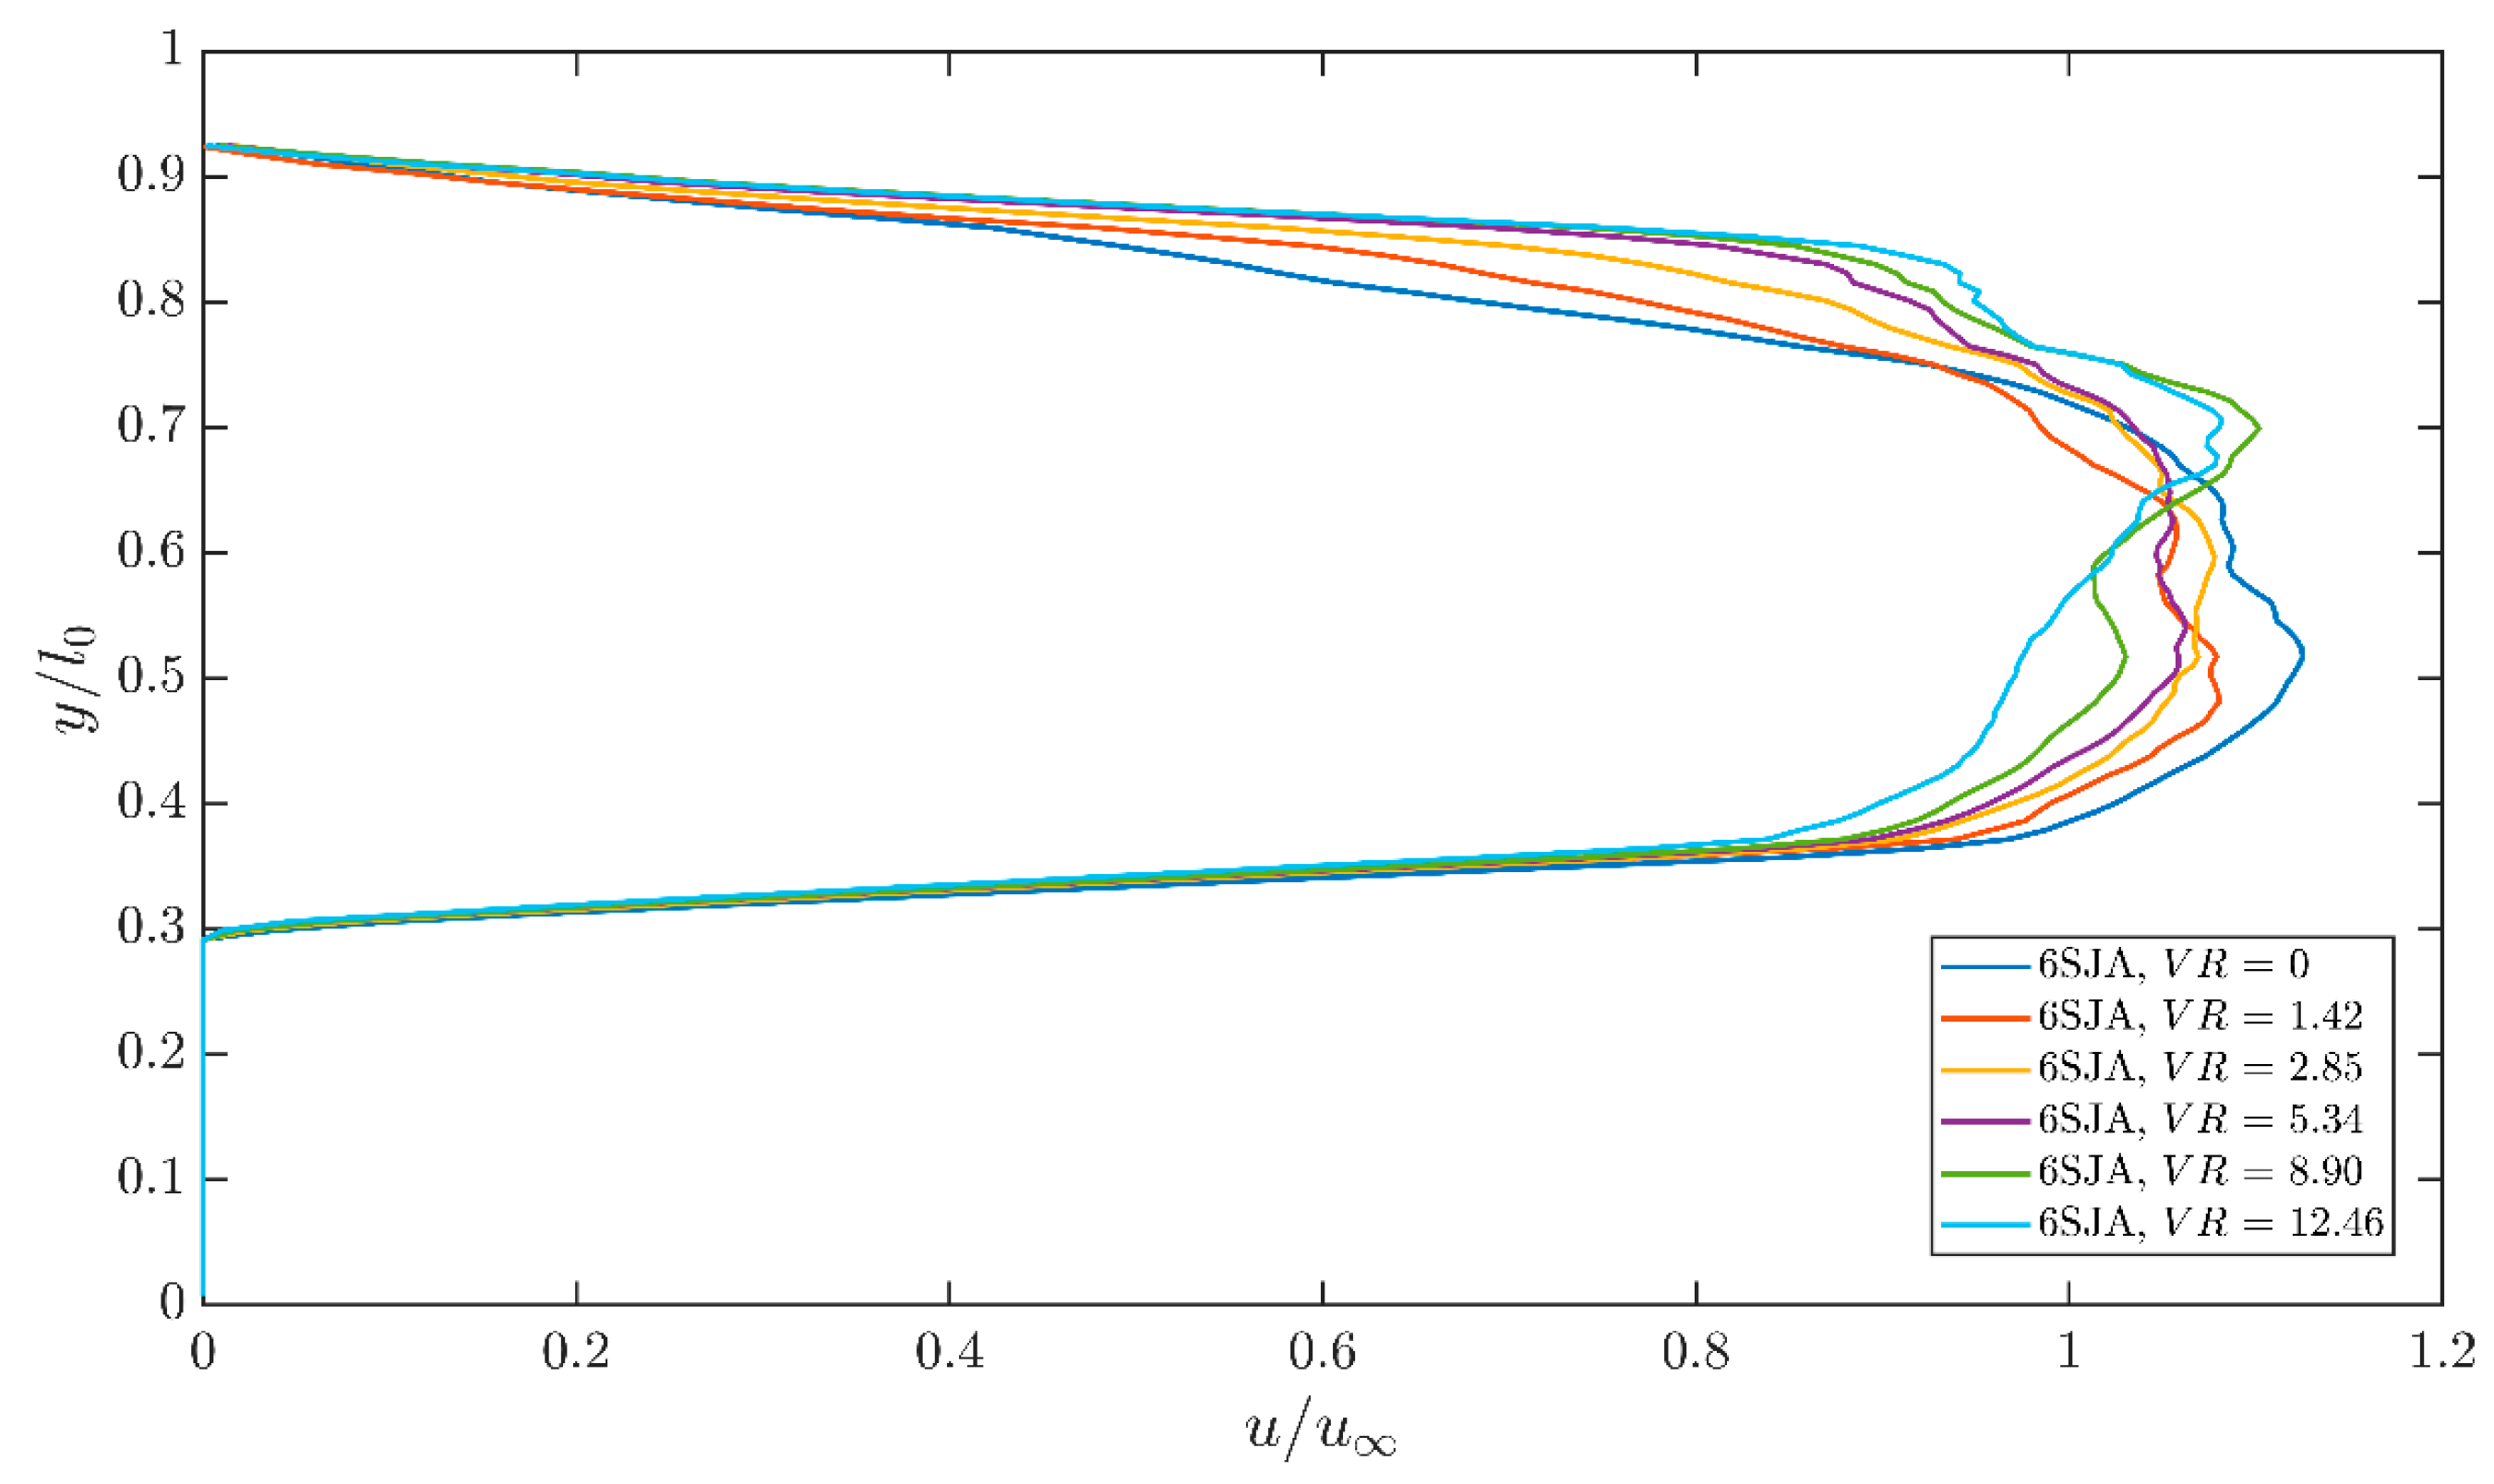
Figure 13 and Figure 14 show the effect of VR under the 6SJA-10-60° configuration. In the uncontrolled case, the time-averaged flow field exhibits a pronounced near-wall low-speed region within the measurement window, accompanied by an in-plane recirculation signature, indicating a separated flow state. After sweeping jet actuation is introduced, the flow field evolves progressively with increasing VR. As shown in Figure 13, the near-wall low-speed region gradually contracts and the associated velocity deficit becomes less pronounced, indicating an overall enhancement of local streamwise velocity recovery within the measured plane.
Figure 13.
Time-averaged velocity fields at different velocity ratios (VR).
Figure 14.
Streamwise velocity profiles at x/l0 = 0.6 at different velocity ratios (VR).
As shown in Figure 14, increasing VR from 1.42 to 8.90 progressively reduces the velocity deficit at x/l0 = 0.6. The profile at VR = 8.90 exhibits a comparatively fuller velocity distribution, indicating a favorable local recovery response. However, further increasing VR to 12.46 does not produce a uniform improvement across the measured wall-normal extent, and more pronounced local deviations remain at several positions.
This non-monotonic response may reflect the competing effects of increased actuation input and stronger jet penetration. At moderate VR, additional actuation is associated with improved local streamwise velocity recovery, whereas stronger penetration at higher VR may lead to a less uniform redistribution of momentum within the measurement plane. Therefore, VR = 8.90 provides a comparatively favorable response at the selected measurement section, although the local recovery does not increase monotonically with VR.
3.2.5. Quantitative Assessment of the Low-Speed-Area Reduction
To provide a unified quantitative assessment of the local near-wall velocity deficit mitigation, Table 3 summarizes the normalized low-speed-area ratio, , and the corresponding relative reduction, RLV, for the investigated actuator configurations. These quantities were evaluated using the criterion defined in Section 2.5 and are used to complement the qualitative observations obtained from the time-averaged velocity fields and the representative streamwise velocity profiles.
Table 3.
Quantitative comparison of the normalized low-speed-area ratio and relative reduction for different sweeping jet configurations.
It should be noted that the uncontrolled baseline measurements reported in Table 3 were conducted separately for each actuator configuration, with the actuators installed in the channel wall but without air supply. The normalized low-speed-area ratios under these conditions ranged from 0.122 to 0.181. Although no active jet forcing was applied, differences in the number, orientation, and placement of the actuator outlets may have influenced the local near-wall flow through variations in the wall geometry. In addition, variations between experimental runs may also have contributed to the observed differences in the uncontrolled baseline values. Therefore, the relative low-speed-area reduction was calculated using the corresponding uncontrolled baseline for each configuration to evaluate the actuation-induced changes relative to its initial flow condition. On this basis, the time-averaged velocity field distributions and representative streamwise velocity profiles were also considered to provide a comprehensive assessment of the local near-wall flow response under different actuator configurations.
For the 6SJA-10-60° configuration, the low-speed-area ratio decreases markedly with increasing VR. decreases from 0.122 under the uncontrolled condition to 0.109, 0.085, 0.063, and 0.057 as VR increases from 1.42 to 8.90, corresponding to relative reductions of 11.2%, 30.8%, 48.4%, and 53.7%, respectively. When VR is further increased to 12.46, increases slightly to 0.058, with a relative reduction of 52.9%. This trend indicates that the reduction in the measured low-speed region approaches a plateau at relatively high actuation input rather than increasing monotonically with VR.
The effect of jet incidence angle can be quantified by comparing the 6SJA-10-60° and 6SJA-10-90° configurations. At VR = 8.90, the relative reduction reaches 53.7% for the 60° case, compared with 26.1% for the 90° case. The 90° configuration also exhibits a non-monotonic response, with the relative reduction increasing from 14.6% at VR = 1.42 to approximately 26% at VR = 5.34–8.90, before decreasing to 13.6% at VR = 12.46. These quantitative results further confirm the more favorable local response of the 60° configuration over most of the common VR range.
The influence of actuator placement is evident from the comparison between the 6SJA-10-60° and 6SJA-10-60°Loc configurations. For the upstream location, the normalized low-speed-area ratio decreases from 0.174 under the uncontrolled condition to 0.105 at VR = 12.46, corresponding to a relative reduction of 39.5%. At VR = 8.90, the relative reduction is 27.6% for the upstream location, compared with 53.7% for the x/L = 0 configuration. These results quantitatively support the stronger local recovery response observed for the x/L = 0 configuration in Figure 9 and Figure 10.
The comparison between the 6SJA-10-60° and 4SJA-15-60° configurations shows that both arrangements can substantially reduce the low-speed area at sufficiently high VR, although their response trends differ. For the 4SJA-15-60° configuration, decreases from 0.181 in the uncontrolled case to 0.084 at VR = 12.46, corresponding to a relative reduction of 53.7%. The reduction is smaller than that of the 6SJA-10-60° configuration at low-to-intermediate VR but becomes comparable at the highest tested VR. Because the actuator number, spanwise pitch, and total supplied actuation input vary simultaneously between these two configurations, this result should be interpreted as a coupled configuration effect rather than as an isolated effect of actuator spacing.
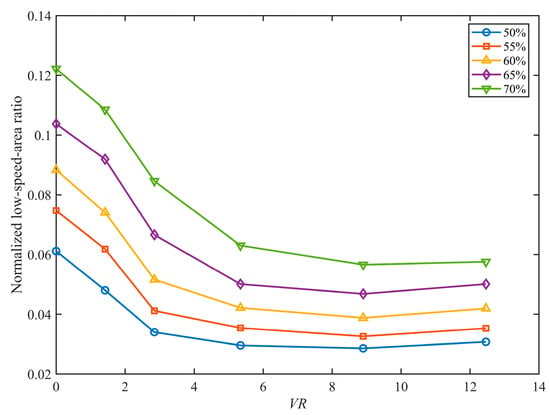
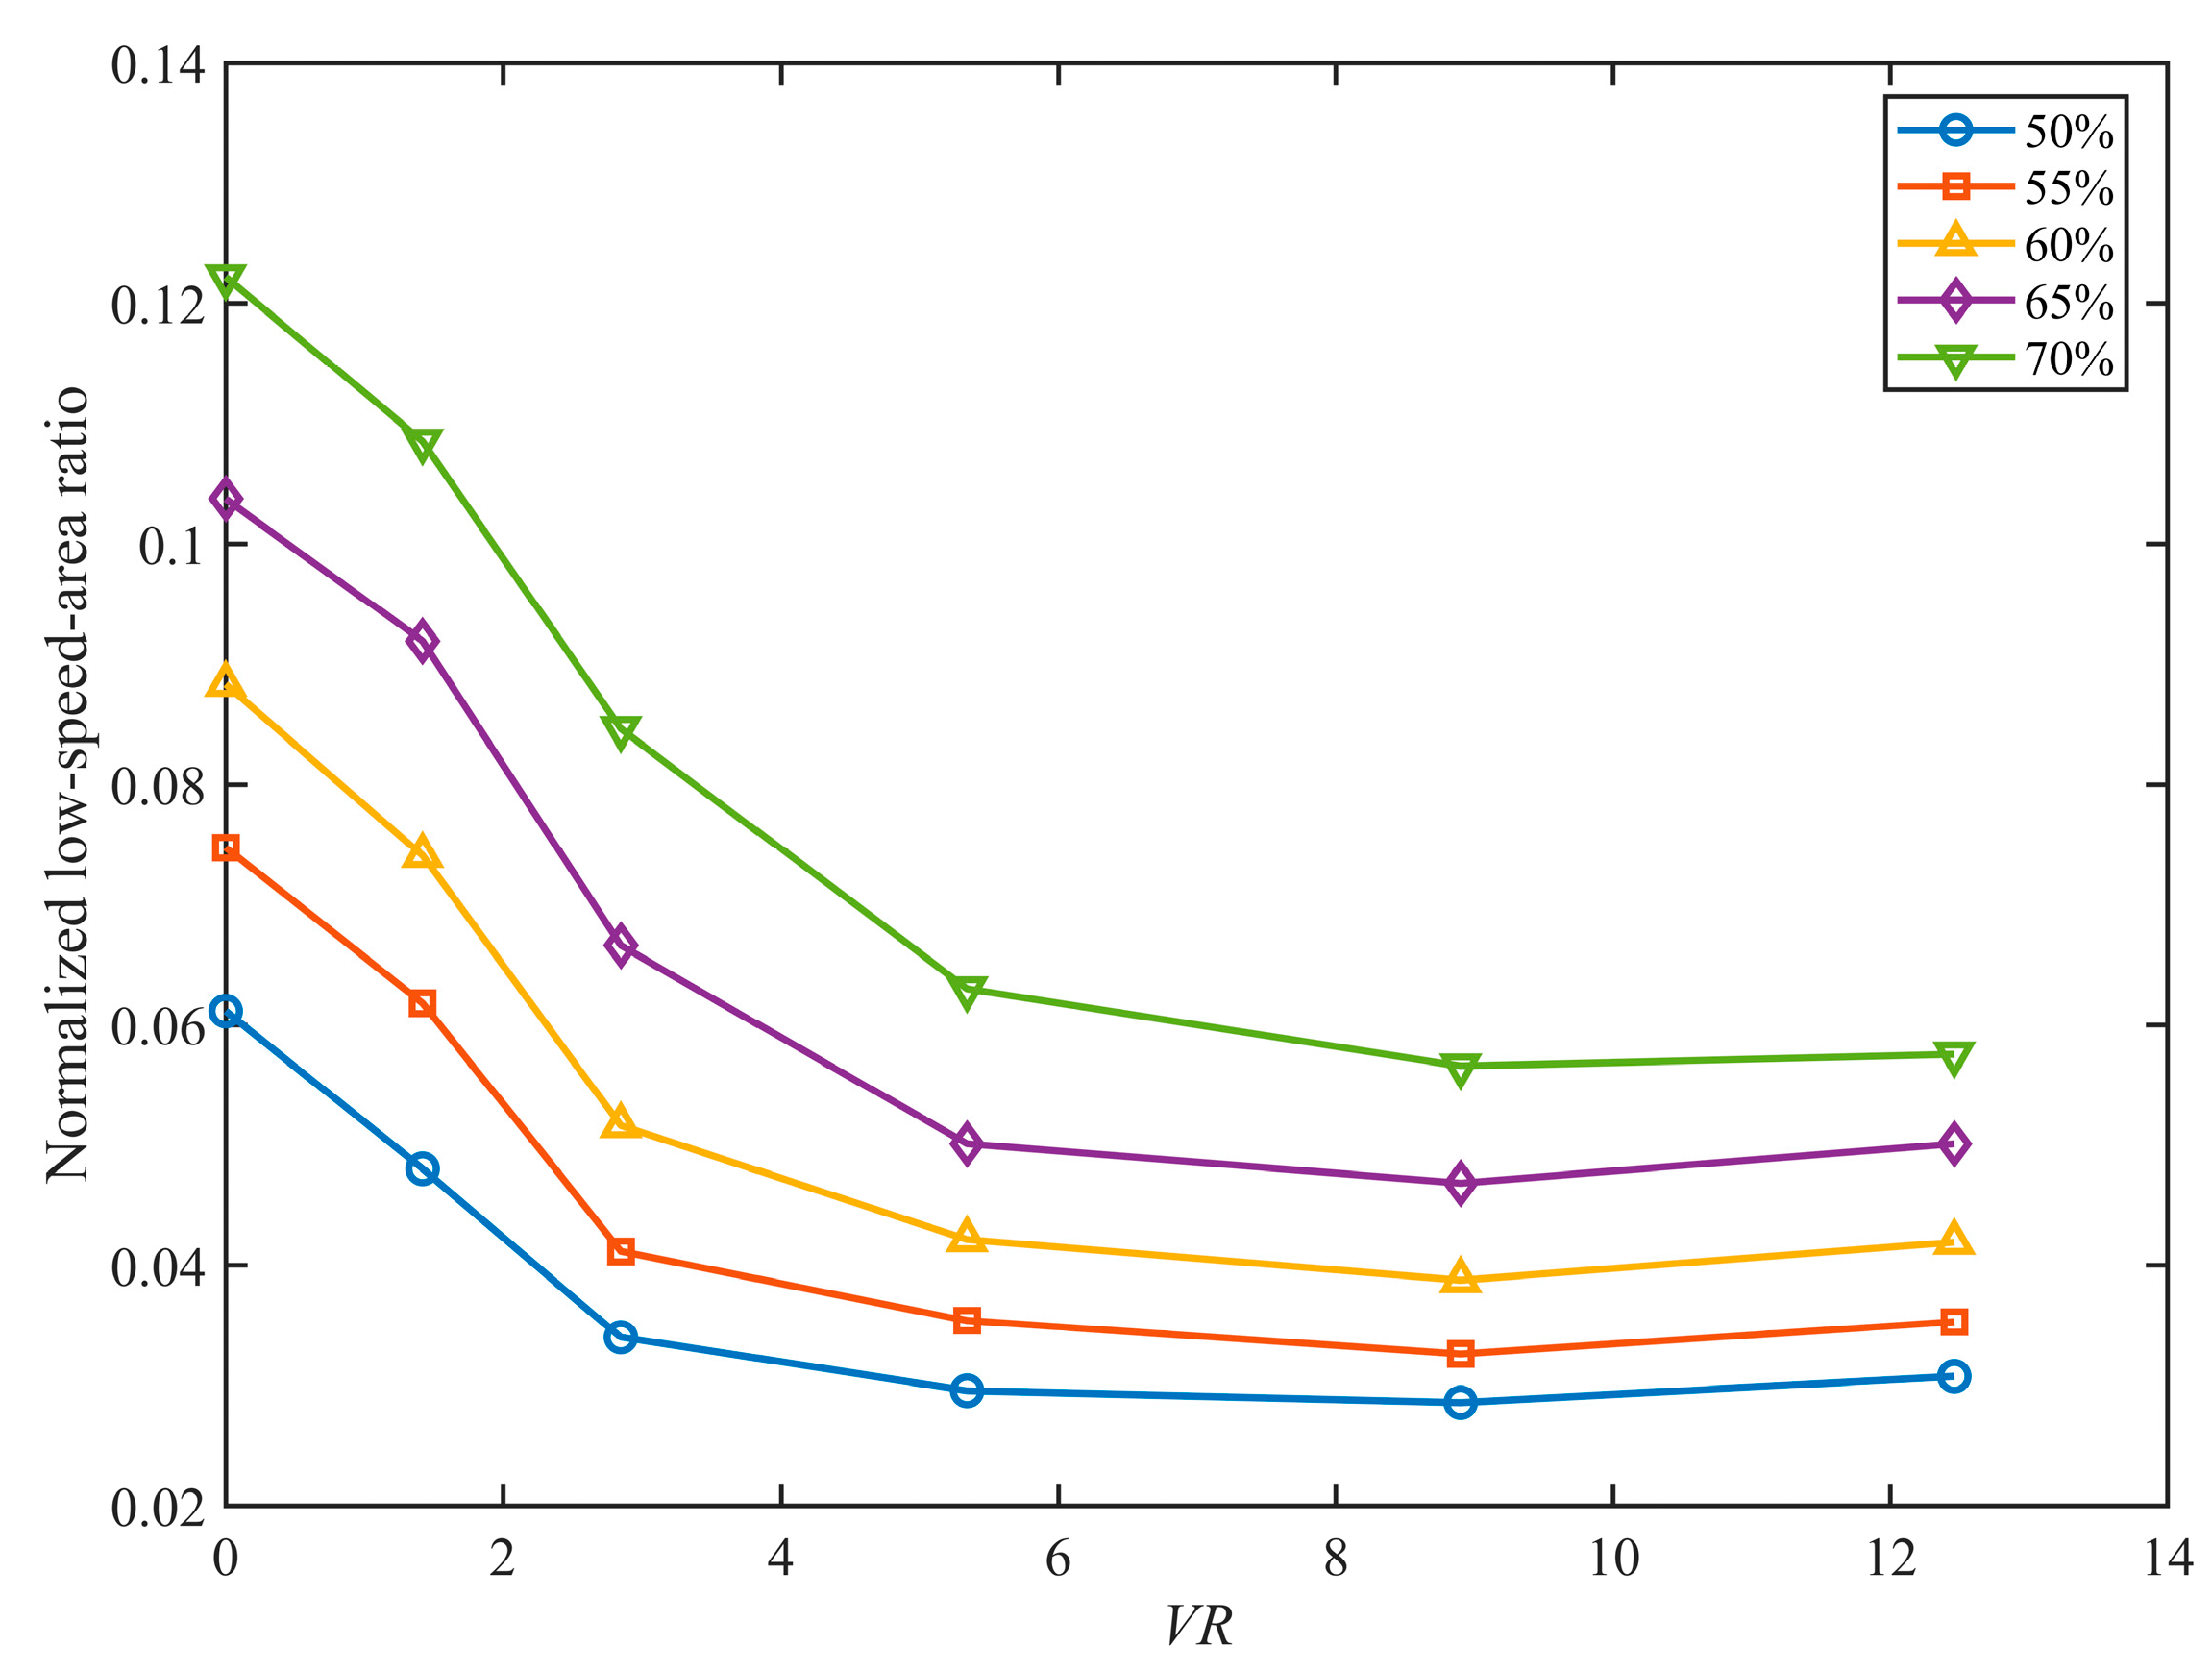
To further evaluate the sensitivity of the low-speed-area metric to the threshold selection, an additional analysis was conducted for the representative 6SJA-10-60° configuration. Five threshold coefficients ranging from 0.50 to 0.70, with an increment of 0.05, were considered. For each threshold coefficient, the normalized low-speed-area ratio was recalculated using the same time-averaged velocity fields and valid PIV measurement domain, while retaining the condition-dependent reference velocity defined in Section 2.5.
As shown in Figure 15, the absolute low-speed-area ratio increases with the threshold coefficient, whereas the overall variation with VR remains consistent across all five threshold levels. The low-speed-area ratio decreases markedly as VR increases from 0 to 5.34, followed by a more gradual reduction up to VR = 8.90. The minimum value is consistently observed at VR = 8.90, after which a slight increase occurs at VR = 12.46. Although the absolute values depend on the selected threshold, the consistent trends indicate that the principal observations are relatively insensitive to the threshold coefficient within the investigated range. These results further support the quantitative trends reported in Table 3 and strengthen the reliability of the low-speed-area metric for evaluating local near-wall velocity deficit mitigation.
Figure 15.
Threshold sensitivity of the normalized low-speed-area ratio for the 6SJA-10-60° configuration.
Overall, the area-based metric quantitatively supports the principal trends inferred from the preceding velocity field and velocity profile analyses. The 60° incidence angle and the actuator location at x/L = 0 provide stronger reductions in the measured low-speed region over most of the tested VR range, while the response at high actuation input is not strictly monotonic. These results indicate that the effectiveness of sweeping jet actuation depends not only on the equivalent actuation input but also on the incidence angle, actuator placement, and array configuration.
4. Conclusions
This study experimentally investigated the near-wall flow response to sweeping jet actuation in a compact curved channel using planar 2D–2C PIV measurements. A compact sweeping jet oscillator was selected through a preliminary configuration-screening process and integrated into the curved wall region of the passage. The effects of jet incidence angle, actuator location, array configuration, and equivalent velocity ratio were systematically compared primarily at the lower inflow velocity of u∞ = 2.6 m/s within a fixed measurement window near the curved wall. Accordingly, the parametric trends discussed below are restricted to the present low-speed operating condition and the selected planar PIV measurement window.
The baseline flow exhibited a pronounced near-wall low-speed region and associated separation-related in-plane flow features within the selected measurement window, indicating that the present field of view captured the local flow characteristics required for comparing different actuation conditions.
Among the tested incidence angle cases, the 60° configuration produced a stronger reduction in the measured near-wall low-speed region than the 90° configuration over most of the common VR range. At VR = 8.90, the relative low-speed-area reduction reached 53.7% for the 60° case, compared with 26.1% for the 90° case. The 30° case mainly provided streamwise momentum addition with relatively limited wall-normal disturbance, whereas the 90° case introduced stronger local disturbance and a less uniform velocity recovery pattern within the measured plane. These results indicate that the 60° configuration provided a stronger local mitigation of the near-wall velocity deficit under the present tested conditions.
Within the selected PIV measurement window, the actuator row located at x/L = 0 produced a stronger local recovery response than the upstream row at x/L = −0.15. At VR = 8.90, the corresponding relative reductions in the low-speed area were 53.7% and 27.6%, respectively. This difference suggests that, under the present conditions, the actuator located near the beginning of the bend interacted more directly with the developing near-wall velocity deficit region captured by the planar PIV field of view. This comparison should therefore be interpreted as a local response trend within the present measurement window rather than as a general optimization of actuator position.
The comparison between the 6SJA-10 and 4SJA-15 configurations indicates that array layout and total actuation input jointly affected the measured local recovery response. Because the actuator number, spanwise pitch, and total supplied input were changed simultaneously, the observed difference should be interpreted as a coupled configuration effect rather than as an isolated actuator-spacing effect.
Increasing the equivalent velocity ratio generally weakened the measured near-wall low-speed region and promoted local streamwise velocity recovery within the present PIV window. However, the response was not strictly monotonic at all wall-normal positions, indicating that stronger actuation did not necessarily produce uniformly stronger recovery throughout the measured plane.
Overall, the present results establish quantitative local trends in the effects of sweeping jet incidence angle, actuator placement, array configuration, and equivalent actuation input on near-wall velocity deficit mitigation under the present low-speed operating condition. These trends are specific to the tested configurations and the selected planar PIV measurement window and should not be interpreted as Reynolds-number-independent optimization criteria for compact curved channel flows. Future work will extend the present measurements to higher inflow velocities, outlet plane distortion, total pressure recovery, and three-dimensional flow topology diagnostics to assess the broader applicability and global aerodynamic performance of sweeping jet actuation in compact curved passages.
Author Contributions
Conceptualization, X.W. and S.W.; methodology, J.L., J.S. and Z.Q.; validation, J.L.; formal analysis, J.L.; investigation, J.L., J.S. and Z.Q.; resources, X.W. and S.W.; data curation, J.L.; writing—original draft preparation, J.L.; writing—review and editing, J.L. and X.W.; visualization, J.L.; supervision, X.W.; project administration, X.W. and S.W.; funding acquisition, X.W. All authors have read and agreed to the published version of the manuscript.
Funding
This research was funded by the Science and Technology Commission of Shanghai Municipality (Grant No. 25ZR1401194) and the National Natural Science Foundation of China (Grant Nos. U25B2088, 12572382, and 12521002).
Institutional Review Board Statement
Not applicable.
Informed Consent Statement
Not applicable.
Data Availability Statement
The data supporting the findings of this study are available from the corresponding author upon reasonable request.
Conflicts of Interest
Author Jinsheng Song was employed by the company Beijing Co Wheels Technology Co., Ltd., Beijing, 101300, China. Author Shiqi Wang was employed by the company Aero-Engine Academy of China, Aero-Engine Corporation of China, Beijing, 101304, China. The remaining authors declare that the research was conducted in the absence of any commercial or financial relationships that could be construed as a potential conflict of interest.
Appendix A
To supplement the conclusions summarized in Table 1 of the main text regarding the effects of the key geometric factors, this appendix presents the representative stages in the evolution of the oscillator configuration and, together with the parameter comparison results, explains the basis for the assessment of each conclusion. The overall configuration evolution process mainly consists of three stages: key geometric configuration analysis, key parameter optimization, and comprehensive fine-tuning with final configuration determination.
Appendix A.1. Key Geometric Configuration Analysis
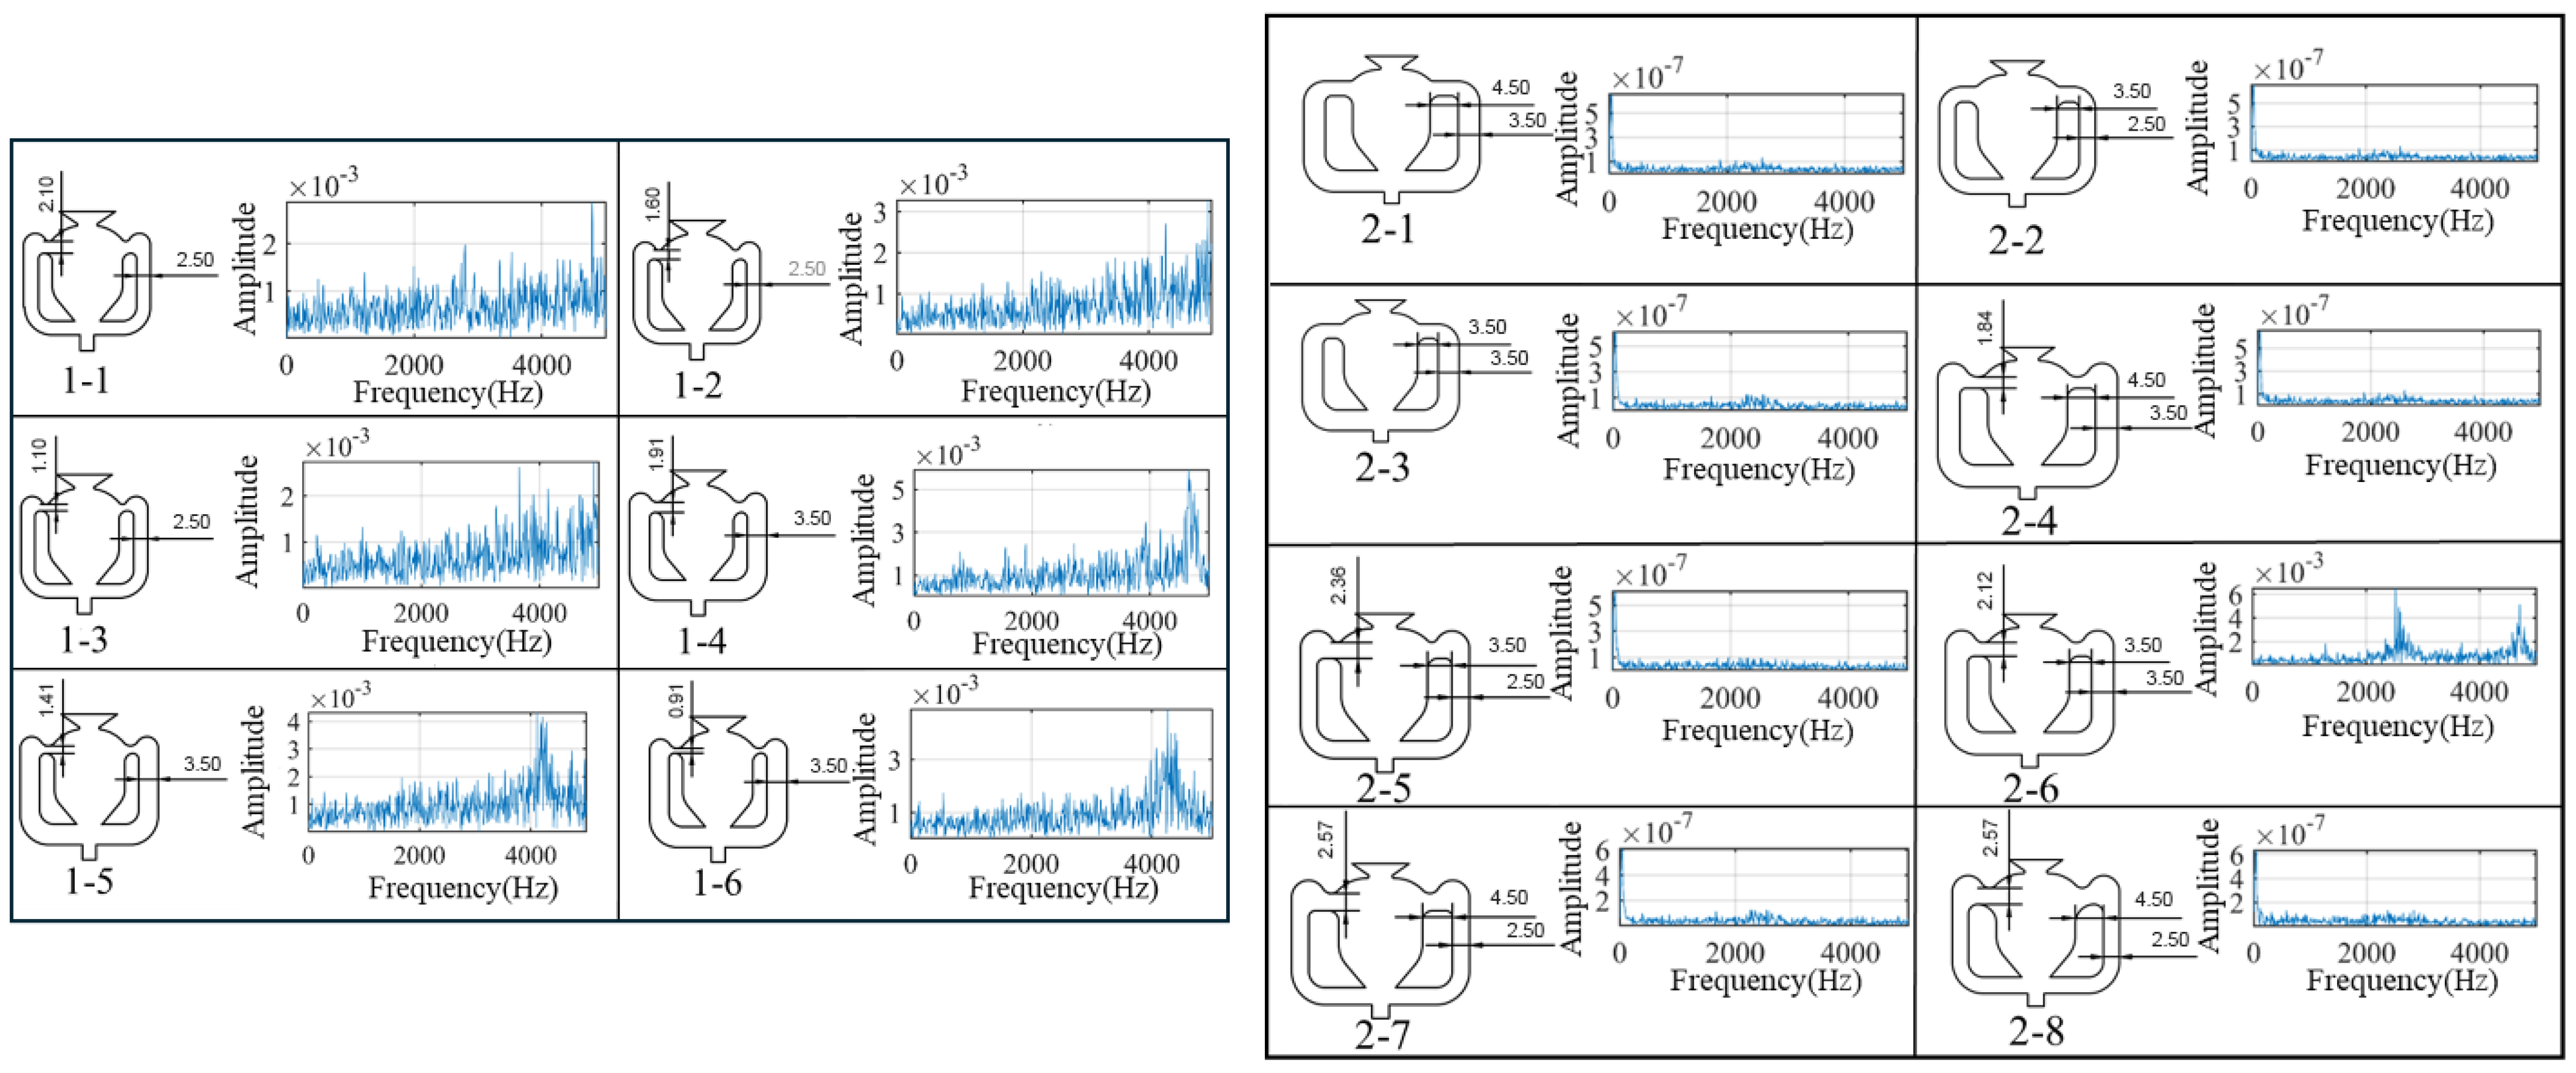
Figure A1 shows the representative evolution of the oscillator during the key geometric configuration analysis stage. The preliminary analysis was mainly based on Configurations Mod 1 and Mod 2, and focused on two key components: the splitter in the main cavity and the feedback passages. Since there is strong coupling among the internal structural features of the oscillator, the influence of any single geometric parameter on the oscillation performance is difficult to isolate directly. Therefore, in the preliminary design stage, targeted adjustments and analyses of the main-cavity splitter and feedback passages were first carried out in combination with the requirement for structural simplification, so as to identify the key geometric factors that have a strong influence on oscillation onset.
The configuration comparisons indicate that the feedback passage inlet slit, the fillet of the feedback passage, and the splitter-related geometric details all have a pronounced influence on the oscillation performance. Among them, the feedback passage inlet slit and the feedback passage fillet directly affect the establishment of the internal feedback mechanism, while the splitter shape not only affects the jet attachment and switching processes within the main cavity but also exhibits strong coupling with other local structural features, making it a key subject of the subsequent optimization.
The preliminary analysis showed that overly aggressive simplification of either the splitter or the feedback passages, although capable of reducing structural complexity, could also weaken or even disrupt the effective feedback path, thereby hindering the establishment of stable periodic oscillation. Therefore, in the subsequent configuration optimization process, preserving an effective internal feedback route was taken as a prerequisite, on the basis of which further analysis and optimization of the key structural parameters were carried out.
Figure A1.
Representative evolution of the oscillator during the key geometric configuration analysis stage.
Appendix A.2. Key Structural Parameter Analysis
After it had been established that the main-cavity splitter and the feedback passages were the primary influencing components, a step-by-step optimization was carried out around the key structural parameters. The representative configurations are presented in Figure A2 and Figure A3.
Figure A2 shows Configuration 3, which was used to examine the combined effects of splitter thickness, splitter shape, and feedback passage width. The results showed that a V-shaped splitter was more favorable for oscillation onset, and the corresponding configurations exhibited clearer oscillation spectral characteristics. Therefore, the subsequent optimization was continued with Configuration 3-6 as the baseline.
Figure A2.
Representative evolution of Configuration 3 in the key structural parameter analysis stage.
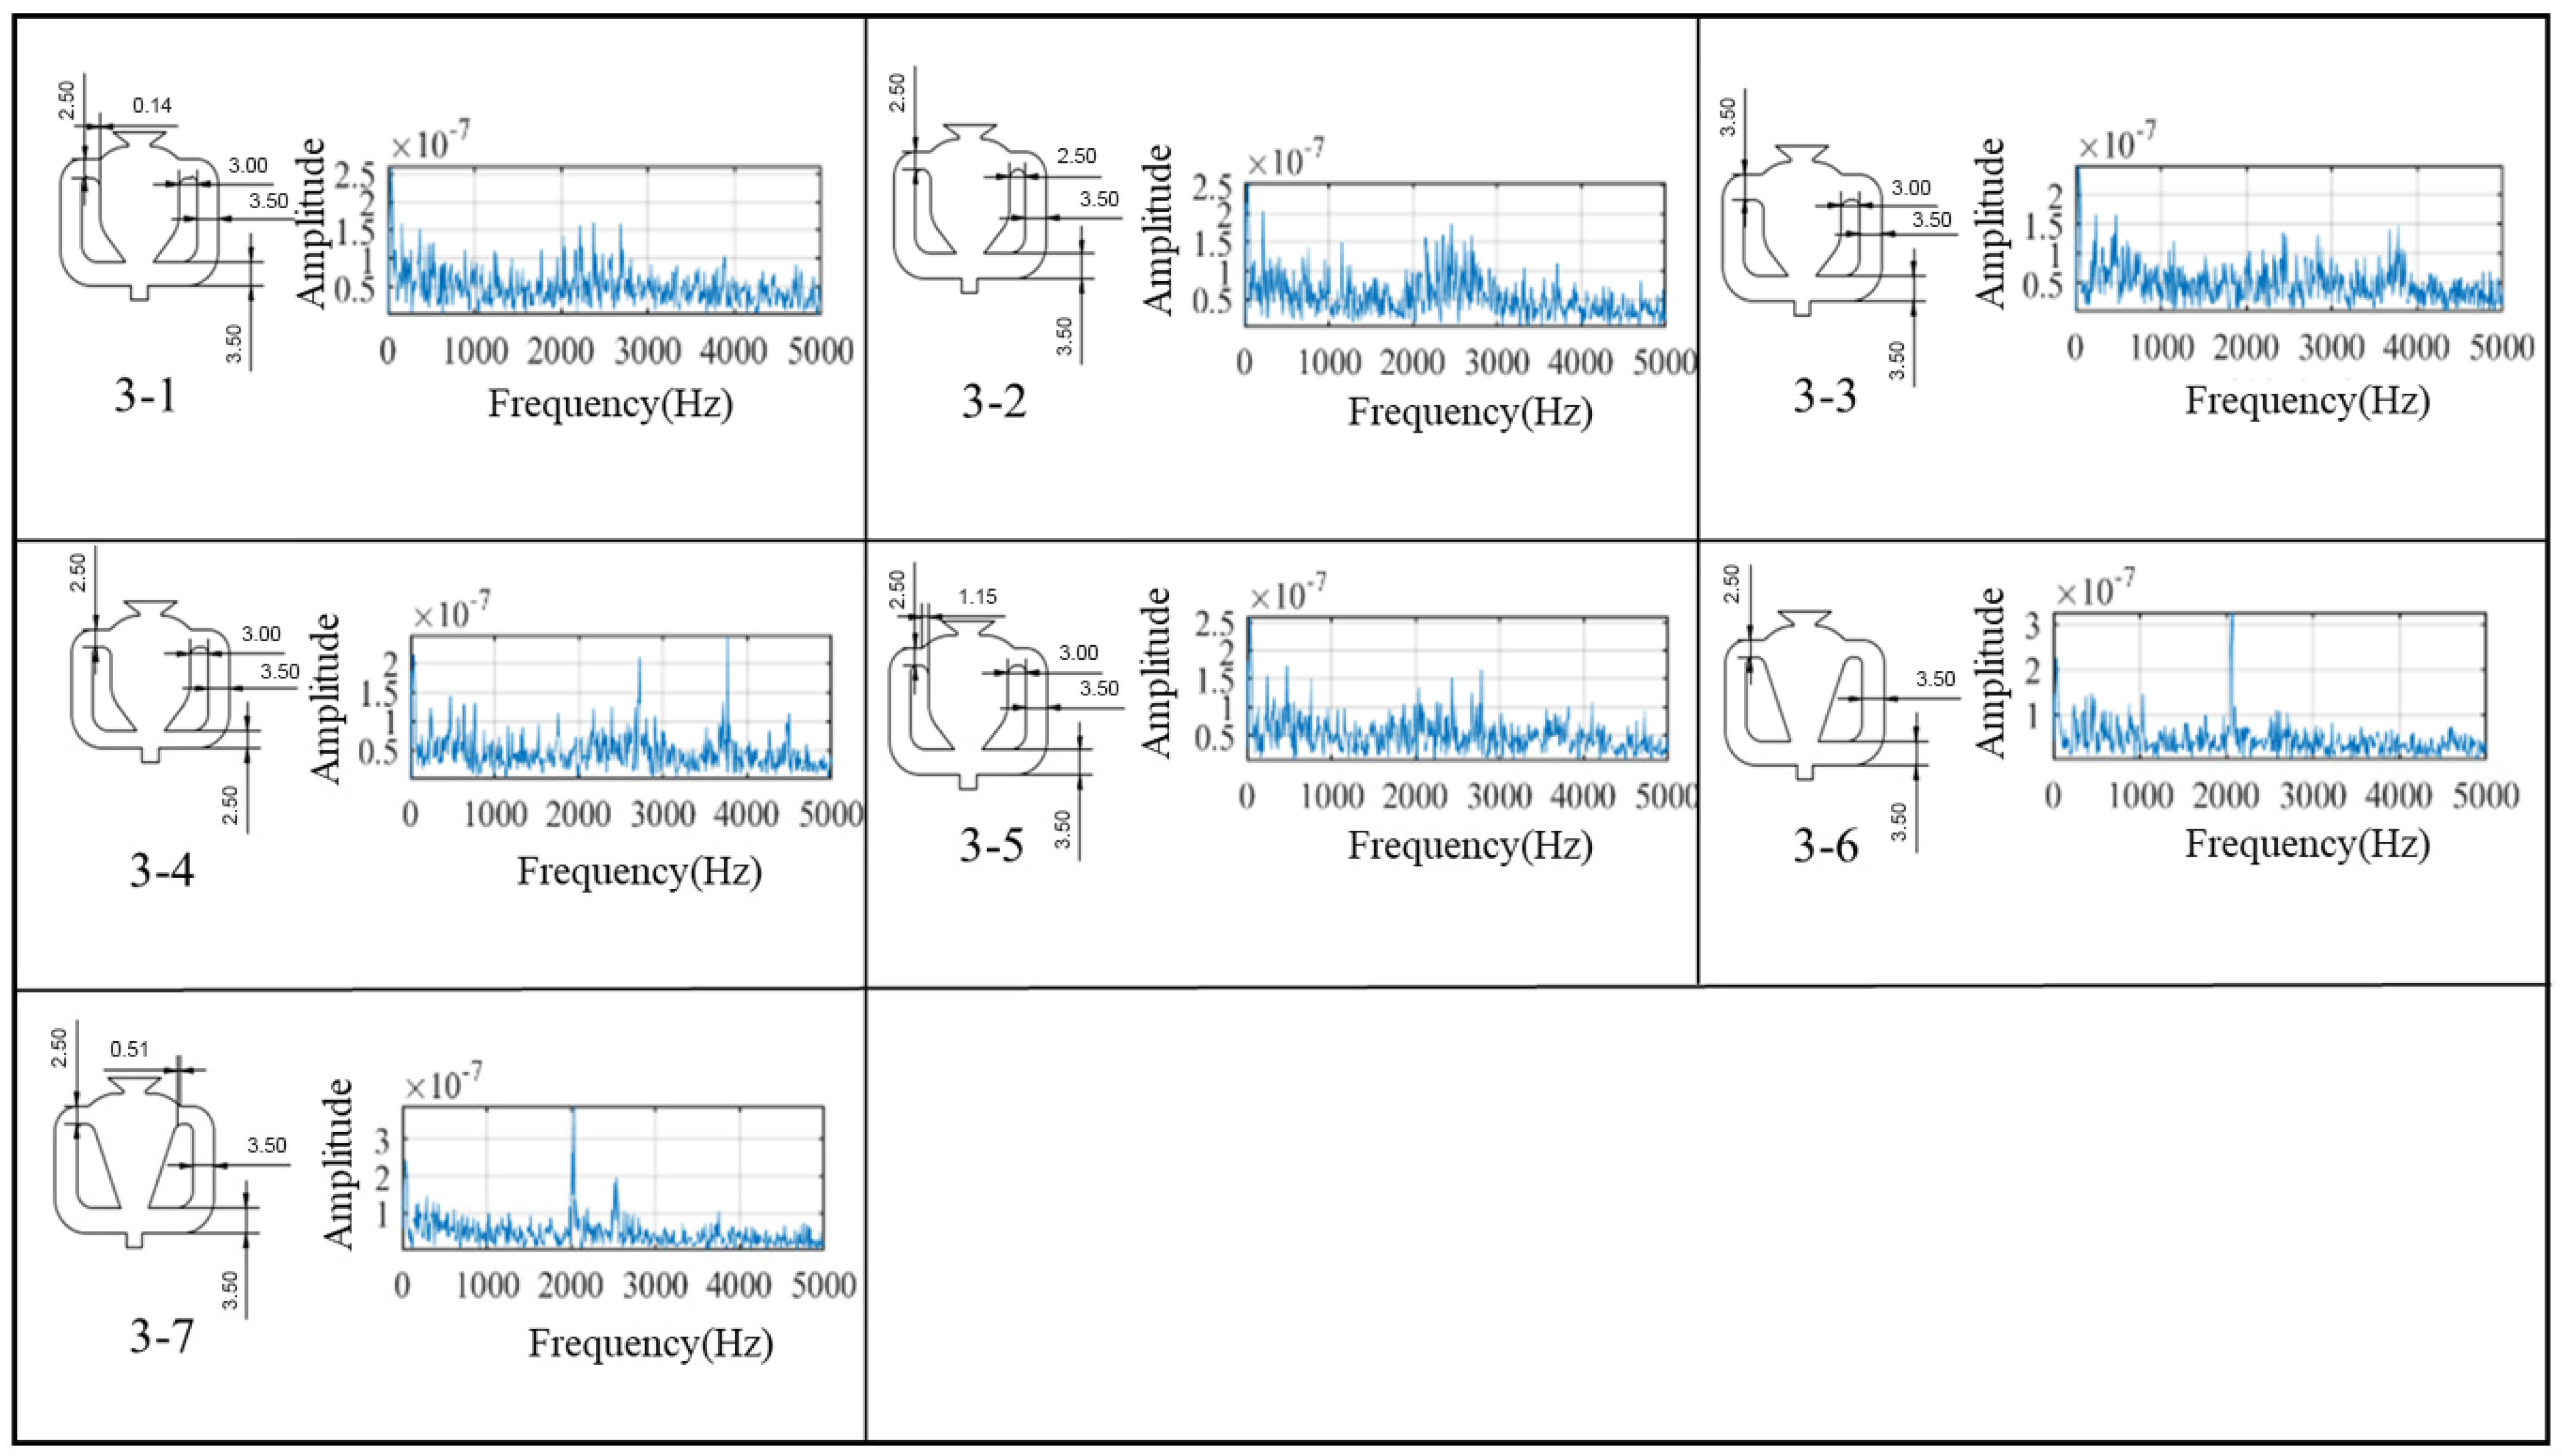
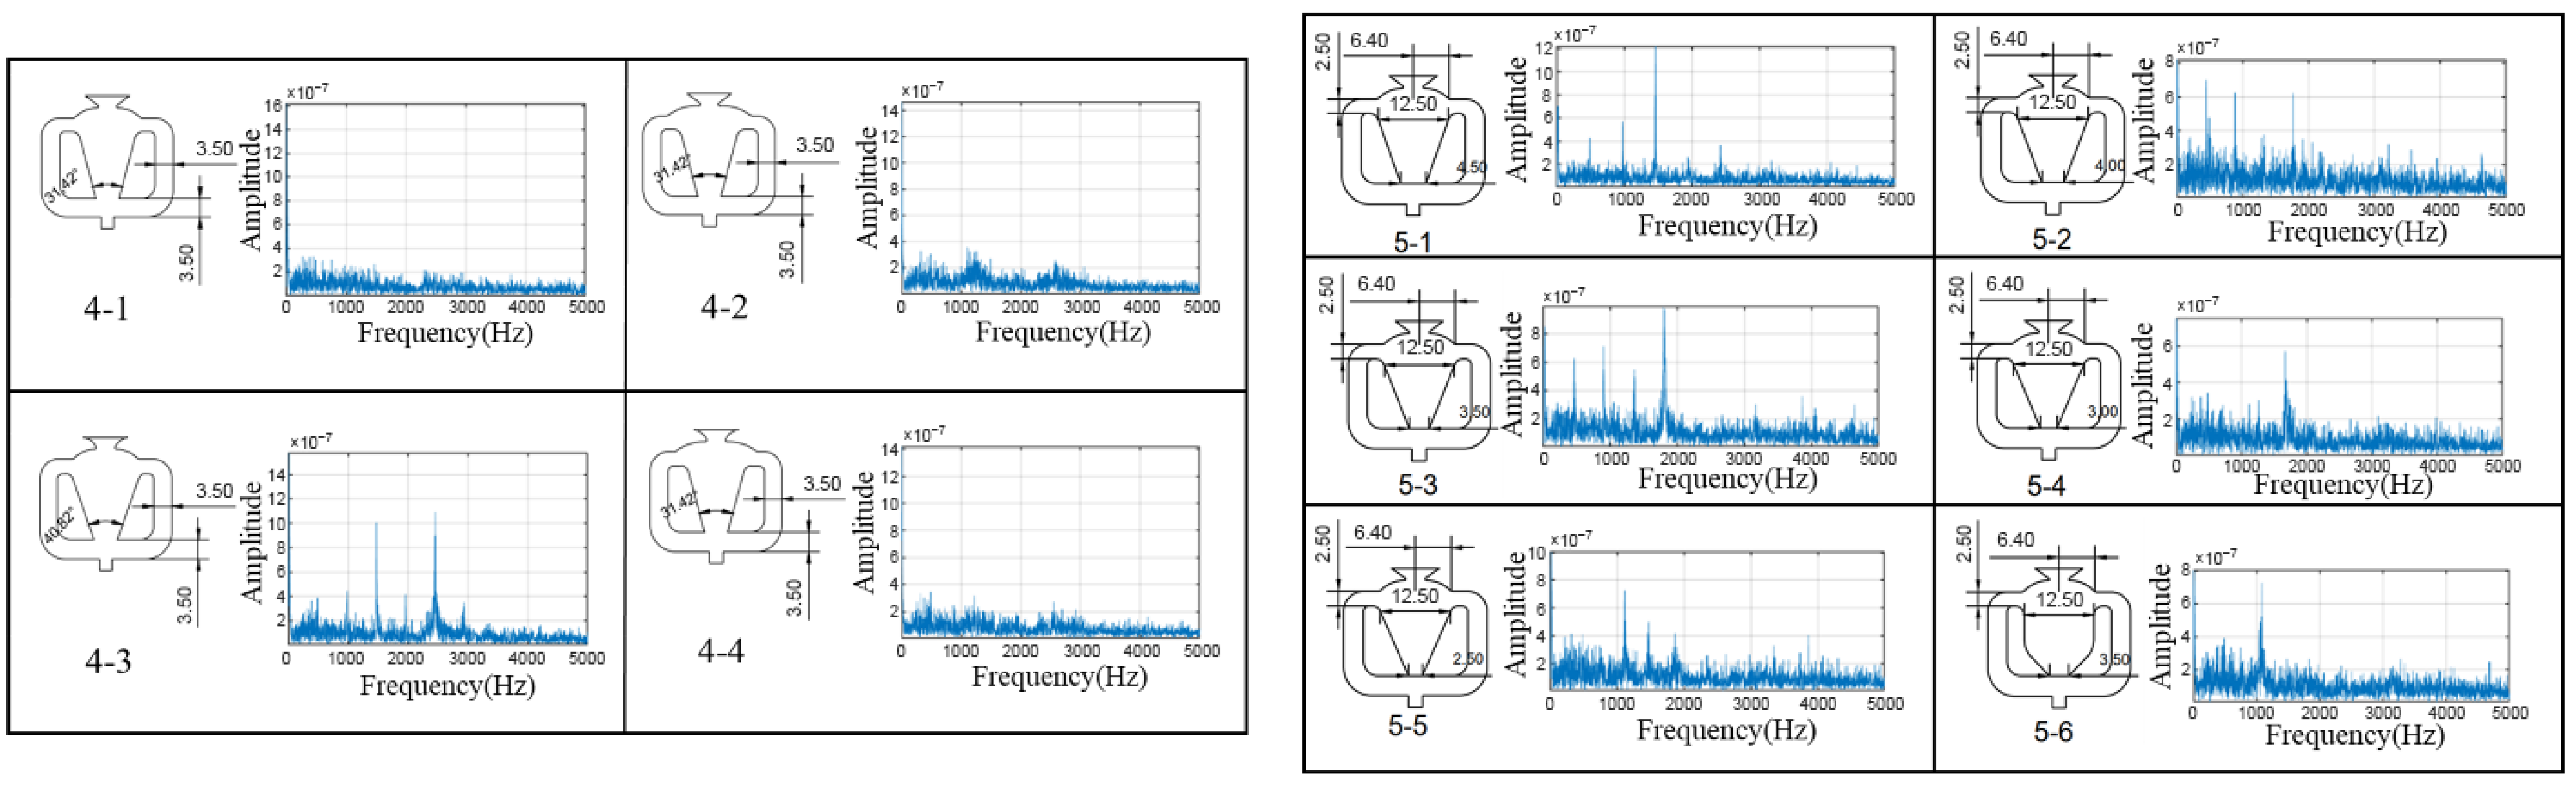
Figure A3 presents Configurations 4 and 5. Configuration 4 was used to further examine the effects of the inner splitter angle and the outlet structure. The analysis showed that, although these two types of local parameters exerted some influence on the outlet flow pattern, their effects on oscillation onset and the overall frequency characteristics were not significant. Therefore, they were not treated as dominant optimization parameters in the subsequent design, which proceeded on the basis of Configuration 4-3.
In Configuration 5, emphasis was placed on analyzing the effects of splitter shape and cavity inlet width. The results showed that the cavity inlet width was a key factor affecting oscillation onset, and that its influence was not monotonic, but instead exhibited an optimal range. Comparison of Configurations 5-1 to 5-5 indicates that all five configurations could achieve oscillation onset, while the onset flow rate varied markedly with cavity inlet width. Among them, Configuration 5-3 exhibited the lowest onset flow rate, 24.9 SLPM, indicating the best onset performance within this group. In addition, as the cavity inlet width decreased, the dominant oscillation frequency and spectral-peak amplitude first increased and then decreased, with Configuration 5-3 showing the best overall oscillation performance. Meanwhile, comparison between Configurations 5-3 and 5-6 shows that the V-shaped splitter had a lower onset flow rate than the U-shaped splitter, indicating that it was more favorable for the establishment of oscillation. Based on these results, the oscillator configuration adopted in the present study was determined through the integrated design process.
Figure A3.
Representative evolution of Configurations 4 and 5 in the key structural parameter analysis stage.
Appendix A.3. Additional Spectral Characterization of the Selected Oscillator Configuration
To further examine the stability of the selected oscillator at a higher supplied flow condition, an additional hot wire measurement was conducted at 40.3 SLPM and 9.56 kPa. A clear dominant-frequency peak is observed, indicating that the selected configuration maintains self-sustained oscillatory behavior at the higher actuation level.
Figure A4.
Frequency spectrum of the selected oscillator configuration at 40.3 SLPM and 9.56 kPa.
Appendix A.4. Summary
Based on the configuration evolution processes shown in Figure A1, Figure A2 and Figure A3, it can be seen that the optimization of the oscillator configuration followed an overall strategy of first identifying the key components, then optimizing the dominant parameters, and finally performing local fine-tuning. The results indicate that the cavity inlet width, splitter shape, and feedback passage inlet slit are the primary geometric factors affecting the onset and frequency characteristics of the oscillator. Among them, both the cavity inlet width and the feedback passage inlet slit exhibit pronounced nonlinear effects and have optimal ranges, while the V-shaped splitter is more favorable for oscillation onset. In contrast, within the range considered in this study, the splitter spacing and turning point position have relatively weak effects on the onset and frequency characteristics, and are more suitable as fine-tuning parameters in engineering design.
Based on the above configuration analysis and parameter comparison results, a baseline configuration with a relatively simple structure and a robust oscillation mechanism was finally obtained, and six optimized configurations were developed for adjustment and selection according to practical engineering requirements. The summary in Table 1 of the main text regarding the relative effects of the key geometric factors is supported by the configuration evolution process and the corresponding analysis results presented in this appendix.
References
- Zhuang, F.; Huang, Z. Demands for Innovation and Development of Aerodynamics in Future High-Technology Warfare. In Aerodynamics Frontier Research Papers Collection; Zhuang, F., Ed.; China Astronautics Publishing House: Beijing, China, 2003; pp. 73–80. [Google Scholar]
- Huang, H.; Sun, S.; Yu, H.; Tan, H.; Lin, Z.; Li, Z.; Wang, K. New Progress in Subsonic S-Bend Inlet Research. Propuls. Technol. 2020, 41, 2641–2658. [Google Scholar] [CrossRef]
- Luo, Z.; Li, J.; Liu, C.; Zhang, B. Numerical Simulation of Total-Pressure Distortion in an S-Inlet. Microcomput. Inf. 2010, 16, 150–152. [Google Scholar]
- Gao, C.; Ma, R.; Ren, K.; Yuan, H.; Zhang, W. Optimal Position and Angle of Jet Control for Transonic Shock Buffet with Resolvent Analysis. AIAA J. 2025, 63, 3415–3433. [Google Scholar] [CrossRef] [Scilit]
- Gao, C.; Yang, X.; Ren, K.; Zhang, W. Transonic buffet flow adaptive control with time-variant reduced-order model. J. Fluid Mech. 2025, 1022, A32. [Google Scholar] [CrossRef] [Scilit]
- Zhou, Y.; Zhang, B. Recent advances in wake dynamics and active drag reduction of simple automotive bodies. Appl. Mech. Rev. 2021, 73, 060801. [Google Scholar] [CrossRef] [Scilit]
- Deng, G.; Fan, D.; Zhang, B.; Zhou, Y. Active control for a low-drag Ahmed vehicle model based on steady blowing. Phys. Fluids 2024, 36, 015104. [Google Scholar] [CrossRef] [Scilit]
- Zhou, Y.; Xia, Z.; Luo, Z.; Wang, L.; Deng, X. A novel ram-air plasma synthetic jet actuator for near space high-speed flow control. Acta Astronaut. 2017, 133, 95–102. [Google Scholar] [CrossRef] [Scilit]
- Zhou, Y.; Xia, Z.; Luo, Z.; Wang, L.; Deng, X.; Zhang, Q.; Yang, S. Characterization of three-electrode SparkJet actuator for hypersonic flow control. AIAA J. 2019, 57, 879–885. [Google Scholar] [CrossRef] [Scilit]
- Li, Z.; Wei, M.; Huang, R.; Liu, W.; Wu, J. Effect of Micro-Blowing on Turbulence Characteristics in Hypersonic Boundary Layers. AIAA J. 2026, 64, 2470–2479. [Google Scholar] [CrossRef] [Scilit]
- Huang, R.; Liu, W.; Xue, T.; Wu, J. Noise Radiation Mitigation of Hypersonic Turbulent Boundary Layer Using Porous Wall Suction. AIAA J. 2025, 63, 3017–3023. [Google Scholar] [CrossRef] [Scilit]
- Garnier, E.; Leplat, M.; Monnier, J.C.; Delva, J. Flow Control by Pulsed Jet in a Highly Bended S-Duct. In Proceedings of the 6th AIAA Flow Control Conference, AIAA Paper 2012-3250, New Orleans, LA, USA, 25–28 June 2012. [Google Scholar] [CrossRef] [Scilit]
- Garnier, E.; Leplat, M.; Monnier, J.C.; Delva, J. Flow Control by Pulsed Jet in a Curved S-Duct: A Spectral Analysis. AIAA J. 2015, 53, 2813–2827. [Google Scholar] [CrossRef] [Scilit]
- Vaccaro, J.C.; Elimelech, Y.; Amitay, M. Experimental Investigation of Actuators for Flow Control in Short Inlet Ducts. In Proceedings of the 48th AIAA Aerospace Sciences Meeting, AIAA Paper 2010-862, Orlando, FL, USA, 4–7 January 2010. [Google Scholar] [CrossRef] [Scilit]
- Gissen, A.N.; Vukasinovic, B.; McMillan, M.L.; Glezer, A. Distortion Management in a Boundary Layer Ingestion Inlet Diffuser Using Hybrid Flow Control. J. Propuls. Power 2014, 30, 834–844. [Google Scholar] [CrossRef] [Scilit]
- Gao, D.; Chen, G.; Chen, W.; Huang, Y.; Li, H. Effects of steady wake-jets on subcritical cylinder flow. Exp. Therm. Fluid Sci. 2019, 102, 575–588. [Google Scholar] [CrossRef] [Scilit]
- Gao, D.; Chen, G.; Min, X.; Chen, W. Wake-vortex evolution behind a fixed circular cylinder with symmetric jets. Exp. Therm. Fluid Sci. 2022, 135, 110629. [Google Scholar] [CrossRef] [Scilit]
- Xu, Z.; Chang, X.; Yu, H.; Chen, W.-L.; Gao, D. Structured porous surface for drag reduction and wake attenuation of cylinder flow. Ocean Eng. 2022, 247, 110444. [Google Scholar] [CrossRef] [Scilit]
- Xu, Y.; Fan, D.; Wang, L. Vortex–wall interactions in elliptic impinging synthetic jets. Phys. Fluids 2024, 36, 067139. [Google Scholar] [CrossRef] [Scilit]
- Wang, L.; Feng, L.-H.; Xu, Y.; Xu, Y.; Wang, J.-J. Experimental investigation on flow characteristics and unsteady heat transfer of noncircular impinging synthetic jets. Int. J. Heat Mass Transf. 2022, 190, 122760. [Google Scholar] [CrossRef] [Scilit]
- Gregory, J.W.; Sullivan, J.P.; Raman, G.; Raghu, S. Characterization of the Microfluidic Oscillator. AIAA J. 2007, 45, 568–576. [Google Scholar] [CrossRef] [Scilit]
- Bobusch, B.C.; Woszidlo, R.; Bergada, J.M.; Nayeri, C.N.; Paschereit, C.O. Experimental Study of the Internal Flow Structures inside a Fluidic Oscillator. Exp. Fluids 2013, 54, 1559. [Google Scholar] [CrossRef] [Scilit]
- Löffler, S.; Ebert, C.; Weiss, J. Fluidic-Oscillator-Based Pulsed Jet Actuators for Flow Separation Control. Fluids 2021, 6, 166. [Google Scholar] [CrossRef] [Scilit]
- Hossain, M.A.; Ameri, A.; Gregory, J.W.; Agricola, L.; Bons, J.P. Sweeping Jet Impingement Heat Transfer on a Simulated Turbine Vane Leading Edge. J. Glob. Power Propuls. Soc. 2018, 2, 402–414. [Google Scholar] [CrossRef] [Scilit]
- Guyot, D.; Bobusch, B.; Paschereit, C.O.; Raghu, S. Active Combustion Control Using a Fluidic Oscillator for Asymmetric Fuel Flow Modulation. In Proceedings of the 44th AIAA/ASME/SAE/ASEE Joint Propulsion Conference & Exhibit, AIAA Paper 2008-4956, Hartford, CT, USA, 21–23 July 2008. [Google Scholar] [CrossRef] [Scilit]
- Andino, M.Y.; Lin, J.C.; Roman, S.; Graff, E.C.; Gharib, M.; Whalen, E.A.; Wygnanski, I.J. Active Flow Control on Vertical Tail Models. AIAA J. 2019, 57, 3322–3338. [Google Scholar] [CrossRef] [Scilit]
- Choephel, T.; Coder, J.; Maughmer, M.D. Airfoil Boundary-Layer Flow Control Using Fluidic Oscillators. In Proceedings of the 30th AIAA Applied Aerodynamics Conference, AIAA Paper 2012-2655, New Orleans, LA, USA, 25–28 June 2012. [Google Scholar] [CrossRef] [Scilit]
- Li, S.; Fletcher, J.W.; Vukasinovic, B.; Mace, J.; Glezer, A.; Mani, M.; Stratton, Z.T.; Spyropoulos, J.T. Control of Flow Circulations in a Programmable Offset Diffuser. In Proceedings of the AIAA Aviation Forum and Ascend 2025, AIAA Paper 2025-3392, Las Vegas, NV, USA, 21–25 July 2025. [Google Scholar] [CrossRef] [Scilit]
- Vukasinovic, B.; Funk, R.B.; Glezer, A. Circulation Control Using Arrays of Fluidically Oscillating Jets. AIAA J. 2025, 63, 4023–4034. [Google Scholar] [CrossRef] [Scilit]
- Ostermann, F.; Woszidlo, R.; Nayeri, C.N.; Paschereit, C.O. Properties of a Sweeping Jet Emitted from a Fluidic Oscillator. J. Fluid Mech. 2018, 857, 216–238. [Google Scholar] [CrossRef] [Scilit]
- Köklü, M. Effects of Sweeping Jet Actuator Parameters on Flow Separation Control. AIAA J. 2018, 56, 100–110. [Google Scholar] [CrossRef] [Scilit]
- Kara, K.; Kim, D.; Morris, P.J. Flow-Separation Control Using Sweeping Jet Actuator. AIAA J. 2018, 56, 4604–4613. [Google Scholar] [CrossRef] [Scilit]
- Tajik, A.R.; Kara, K.; Parezanović, V. Sensitivity of a Fluidic Oscillator to Modifications of Feedback Channel and Mixing Chamber Geometry. Exp. Fluids 2021, 62, 250. [Google Scholar] [CrossRef] [Scilit]
- Wang, C.; Lu, H.; Liu, J.; Guo, S.; Peng, B.; Tian, Z.; Wang, L. Experimental Study on Flow Separation in a S-Shaped Intake with Variable Cross-Section Controlled by Sweeping Jets Based on Fluidic Oscillators. Aerosp. Sci. Technol. 2026, 170, 111512. [Google Scholar] [CrossRef] [Scilit]

Disclaimer/Publisher’s Note: The statements, opinions and data contained in all publications are solely those of the individual author(s) and contributor(s) and not of MDPI and/or the editor(s). MDPI and/or the editor(s) disclaim responsibility for any injury to people or property resulting from any ideas, methods, instructions or products referred to in the content. |
© 2026 by the authors. Licensee MDPI, Basel, Switzerland. This article is an open access article distributed under the terms and conditions of the Creative Commons Attribution (CC BY) license.