


Abstract
Social networks are widely expected to ease immigrants’ incorporation, yet the value of a tie depends on the labor market in which it operates. Drawing on 8183 first-generation immigrants aged 16–65 who arrived in Spain between 1996 and 2004, taken from the 2007 National Immigrant Survey, this article examines how strong, weak and linking ties are associated with the socioeconomic position that young immigrants (16–35) had reached by 2007, compared with older immigrants (36–65). Position is measured with an index of income, occupational prestige, labor mobility and housing and, in the multivariate models, with a latent factor resting mainly on occupation and income. Larger kin networks and more family support are associated with lower positions in both age groups, although the associations are modest; weak ties show small and inconsistent associations, while linking ties—above all, a prior job offer—coincide with higher positions. Average positions are similar across age groups, the strong tie association does not differ between them, and the youth disadvantage is confined to the low-qualified. Because the data are cross-sectional, reliance on kin may reflect constrained alternatives as well as limit advancement. Kin solidarity sustained newcomers without translating into better positions in a segmented pre-crisis labor market.
1. Introduction
Social capital is now a standard ingredient in explanations of immigrant incorporation. Following Lin (2001), the resources embedded in a person’s social network shape the social positions that they can reach, much as economic or cultural capital does; following Portes (1998), these resources can be positive, promoting incorporation, or negative, delaying or blocking it. For newly arrived immigrants, the network is frequently the first and most reliable form of support: relatives and friends provide housing, cultural translation, information, access to work, the loan of money or a vehicle and moral encouragement, and traveling with kin measurably raises the odds of a successful migration (Gurak and Caces 1998; Singer and Massey 1998). It is therefore tempting to conclude that the denser an immigrant’s family network, the better the socioeconomic position he or she will reach.
This article examines whether this expectation held for first-generation immigrants who arrived in Spain during the expansion of 1996–2004. Using the largest immigration survey conducted in Spain, it shows that a larger number of relatives in the country and more intensive family support are associated with lower socioeconomic positions and that the association runs mainly through strong ties. The argument draws on Granovetter’s (1973) distinction between strong ties, on the one hand, and weak and linking ties on the other, as well as on the insight of segmented assimilation theory (Portes and Zhou 1993), which posits that the value of a tie depends on the context of incorporation. We do not treat ties as carrying fixed value: following Portes (1998) and the literature on differential inclusion (Mezzadra and Neilson 2013), their convertibility into jobs, wages and housing depends on the hierarchies of the labor market in which they operate. Because the data are cross-sectional, we read the results as evidence of how tie composition and socioeconomic position are connected, not as proof that kin ties cause a disadvantage.
The focus is on young first-generation immigrants, aged 16 to 35 at the time of the survey, compared with those aged 36 to 65. Young immigrants deserve attention as the group with the least settled position within an already vulnerable population. The first generation makes the greatest adaptive effort yet experiences the least mobility (Borjas [1999] 2001), so it reveals, with particular clarity, the place that the receiving society reserves for newcomers; moreover, young people of any origin in Spain were then concentrated in temporary and unstable jobs (Polavieja 2003). Comparing the two age groups allows us to ask whether ties are associated with socioeconomic position in the same way at different stages of the life course. Because the comparison is performed at a single point in time, differences between the groups may reflect life stages as well as migration; we therefore speak of age groups rather than cohorts and interpret differences only where they are statistically supported (Ryder 1965).
This article builds on, and departs from, a book-length analysis of the same survey by one of the authors (Campdepadrós Cullell 2023), which used a similar index and structural models but analyzed the immigrant population as a whole. It advances this work in four ways. First, it compares younger and older immigrants and formally tests whether coefficients differ between the two groups, rather than assuming that the aggregate pattern holds for both. It also estimates the path model separately for low- and high-qualified young immigrants. Second, it reconceptualizes the outcome. The index, previously labeled an integration index, is treated here as a measure of socioeconomic position, and we state which dimensions of incorporation it does not capture (Section 2.1). Third, it corrects an error in the dwelling space component of the index used in the book and recomputes all statistics that depend on it (Section 3.2). Fourth, it reads the results historically, as evidence for the pre-crisis phase of Spanish immigration, and interprets them in light of the segmentation of the receiving labor market and the literature on differential inclusion. The age comparison qualifies rather than overturns the aggregate picture. Younger and older immigrants do not differ in their average position or in the association between strong ties and position. What is specific to the young is a penalty among the less educated and less qualified and a stronger association with legal status and family reunification.
The remainder of the article is organized as follows. Section 2 distinguishes between social integration, socioeconomic position and mobility and explains which of them is measured here; sets out how social capital and the diversity of ties are conceptualized; and situates segmented assimilation theory in Spain’s pre-crisis context of reception; it closes with five hypotheses. Section 3 describes the data, the construction of the samples, the measures and the analytic strategy. Section 4 tests the hypotheses in turn, moving from bivariate associations to multivariate models and finally to structural path models that separate direct from indirect associations. Section 5 and Section 6 discuss the findings and their limits and conclude.
2. Social Capital and Immigrant Incorporation: Theory and Hypotheses
2.1. Social Integration, Socioeconomic Position and Mobility
“Integration” is among the most widely used and least agreed-upon terms in migration research and policy. A broad definition treats it as immigrants’ participation in every sphere of society—economy, work, politics, culture, education, housing—free from ethnic, cultural or religious discrimination (Touraine 1997; European Commission 2003). In the sociological tradition, however, integration refers to the order of a society as a whole (Parsons 1971), and native populations are neither fully integrated nor asked to demonstrate their integration through their income or housing (Schinkel 2018). The concept has also been criticized for presupposing a cohesive receiving society and for casting immigrants as the sole object of the problem, while the receiving state places them in a structurally provisional position (Sayad [1999] 2004; Schinkel 2018). Penninx and Garcés-Mascareñas (2016) propose instead to study integration analytically, as the process of becoming an accepted part of society, unfolding in distinct legal–political, socioeconomic and cultural–religious dimensions and involving both immigrants and the institutions of the receiving society.
Against this background, we distinguish three notions that the literature—including earlier versions of our own work—often conflates. Social integration, in the broad sense, concerns participation, recognition and freedom from discrimination. Socioeconomic position is the place that an immigrant occupies, at a given moment, in the distributions of income, occupational prestige and housing. Mobility is a change in this position over time. This article studies the second. Our index (Section 3.2) measures socioeconomic position at the time of the survey, together with one retrospective element of mobility: the change in occupational prestige between the first and the last job in Spain. These indicators were chosen because a long tradition treats them as reliable markers of social position (Lipset and Bendix 1963; Galtung 1964; Requena 2005; Portes and Rumbaut [1996] 2006). They do not capture recognition, political or civic participation, freedom from discrimination or how immigrants themselves assess their situation and whether they consider themselves integrated; immigrants may be well placed on material dimensions while facing exclusion on others, or the reverse may be true (Ager and Strang 2008). We therefore call the outcome “socioeconomic position” and the process that it reflects “socioeconomic incorporation”, and we restrict our conclusions to this dimension. The index was labeled an “integration index” in earlier work (Campdepadrós Cullell 2023); the construct is unchanged, but we no longer claim that it measures integration in the broad sense. A deliberate consequence of separating outcome and explanatory variables is that measures that are often used to define integration—such as the number of ties with natives or of relatives in the host country—can be kept on the explanatory side, as measures of social capital whose association with position we estimate.
Measuring socioeconomic position raises a further problem, stressed by the literature on differential inclusion: occupational hierarchies are not a neutral yardstick of belonging. Labor markets incorporate migrants selectively—through lower-ranked positions, low wages, precariousness and unequal access to opportunities—and legal status is one of the mechanisms that produces this inclusion on unequal terms (De Genova 2002; Mezzadra and Neilson 2013). Read in this light, a low score on our index does not indicate that an immigrant is “less integrated” but that he or she has been incorporated into a lower position in the receiving society’s stratification. Our question is therefore not how far immigrants are integrated but in which socioeconomic positions they are incorporated and how the composition of their networks is associated with these positions. A higher score means a better-paid, more prestigious, more upwardly mobile and better-housed position and carries no further normative meaning.
A conceptual clarification is needed, because the boundaries of socioeconomic incorporation are easily blurred with acculturation and assimilation. Following the empirical rather than the normative tradition (Gans 1999), acculturation is the acquisition of a local culture and language, regardless of whether one’s own is retained, and assimilation is entry into local social circles, regardless of whether ties to one’s own group are retained (Park 1928; Gordon 1964). Upward mobility is frequently conflated with both, but it is neither identical to them nor an automatic consequence of them. Immigrants may acquire the local language and yet remain outside local circles, because inclusion ultimately depends on the receiving society; where an immigrant does assimilate, the direction of mobility depends on which segment of the host society they join. Assimilation into a low-income group produces downward mobility; assimilation into a middle- or high-income group produces upward mobility (Portes and Zhou 1993). Measuring socioeconomic position separately from acculturation and assimilation allows us to retain these distinctions throughout the article and examine how assimilation, measured as entry into native circles, is associated with position. Likewise, an immigrant can be strongly embedded in family, associative or community networks without experiencing upward mobility, and the reverse can be true; embeddedness, position and mobility are distinct, and we treat them as such.
2.2. Social Capital and the Diversity of Ties
Social capital consists of the resources embedded in an actor’s social network that the actor can mobilize to pursue goals (Bourdieu 1986; Coleman 1988). Several properties raise it: the network size, the economic capital circulating within it, the norms that govern the collectivity, the network density, trust and solidarity, the diversity of ties and a high position in the social structure. Research has established two findings of particular relevance here: that, above a minimum of human and economic capital, social capital contributes to status attainment over and above human capital, and that the same human capital can yield either rapid upward mobility or stagnation depending on the social capital available and the context in which the immigrant is settled (Lin 2001; Portes and Rumbaut 2001).
Crucially, different kinds of ties perform different functions (Wellman and Berkowitz [1988] 1997; Putnam 2002), and they therefore differ in the support that they carry and the resources that they reach. Strong ties, typically to relatives and close friends, involve frequent contact and provide the main day-to-day support—housing, work, information on how to regularize one’s situation, small loans, introductions and moral support (Gurak and Caces 1998). They are reinforced by time, emotional intensity, intimacy, mutual trust and reciprocal services and by the multiplexity and density characteristic of tight ethnic communities, which raise bounded solidarity and enforceable trust (Portes 1998). Density raises the odds of people contacting each other, exchanging and having projects in common; it makes it more challenging to break a commitment or a norm, which gives security to certain economic exchanges, and it makes the reciprocity and solidarity norm difficult to break (Coleman 1990). Yet, precisely because they circulate among people in similar positions, strong ties are not the most effective route to upward mobility. Granovetter (1973, 1982) argued that weak ties are, and a strand of migration research finds that strong ties provide support without providing mobility (Stack 1974; Sullivan 1989; Martínez Veiga 1997). Weak ties, formed among people who know one another occasionally at work, at school, in the neighborhood or during the migration itself, carry information and resources that strong ties lack, and they demand little reciprocity in return. Linking ties connect positions of different status and power; through contact with a superior position—an employer or firm owner but also a public or private organization that serves immigrants—an immigrant can mobilize more resources at once than either a strong or a weak tie affords. Because each kind of tie reaches different resources, a more diverse portfolio of ties should, other aspects being equal, be associated with better socioeconomic positions (Korinek et al. 2005). The value of a tie, however, is not a property of the tie itself. Its convertibility into a job, a wage or a dwelling depends on the positions that its members occupy and on the hierarchies of the labor market in which it operates (Portes 1998; Lin 2001): ties among people concentrated in the lowest occupational strata circulate mainly the resources available there.
The international debate about how ethnic community attachment bears on incorporation offers two broad positions. Ethnic resilience (Portes and Bach 1985) holds that leaning on one’s own group allows immigrants, over the second generation, to reach better positions and treats in-group and out-group relations as complementary rather than opposed. New assimilationism (Alba and Nee 2003) holds that integration and higher status are reached by blending into an evolving mainstream, in which the immigrant is treated on merit, without ethnic, cultural or religious discrimination. Both converge on the idea that integration can occur without the loss of one’s ethnic and cultural background, and both, when read through network composition, describe complementary bundles of ties—dense within-group ties in the first case and cross-group ties in the second. Which bundle pays off, however, depends on the receiving context: in a strongly acculturationist environment, leaning on the ethnic group can become fruitless or even counterproductive, generating stagnation or downward mobility (Portes and Rumbaut 2001; Alba and Nee 2003).
A third approach clarifies a mechanism that the first two leave implicit. The new economics of migration and the migration networks tradition (Stark and Bloom 1985; Massey 1990; Fussell and Massey 2004) treat migration as a collective decision, typically taken by a family unit seeking to diversify its income sources and spread risk by dispersing its members across places. This requires a strong, if unwritten, commitment to pool resources, flowing first from those at the origin to those at the destination and later in the opposite direction (Grim-Feinberg 2007). It explains how an immigrant with no relatives at a destination can still migrate successfully. We call this a dispersion strategy: it allows the immigrant to travel alone with support from the family abroad and may limit the local reciprocity obligations that accompany dense kin networks at the destination. Such strategies, however, are adopted under conditions—poverty at origin, restricted legal routes, segmented labor markets at destination—that are not themselves family choices, and the two must be kept analytically distinct (Section 3.2). We examine below whether the dispersion strategy and family support at the destination are associated with socioeconomic position directly and through one another.
2.3. Segmented Assimilation and the Spanish Context of Reception, 1996–2007
Segmented assimilation theory (Portes and Zhou 1993; Zhou 1999) holds that, in a discriminatory environment, strong ethnic ties are essential for the second generation to survive exclusion, whereas immigrants who remain alone or assimilate into low-income native groups experience downward mobility; at the same time, those stuck in the lowest positions risk remaining there unless they develop weak ties reaching higher positions. Whether dense ethnic attachment helps therefore depends on the context of reception. Spain’s has often been characterized by a long legacy of nation-building around cultural and religious homogeneity, from the expulsions of Jews and Muslims to the suppression of minority languages under the dictatorship. We use this legacy only as background, not as a fixed national trait. The context relevant to our data is narrower and recent: the decade of rapid immigration that preceded the 2008 recession, in which a comparatively open and pragmatic admission regime, centered on labor market needs and repeated regularizations (Arango 2013), coexisted with a labor market that channeled most newcomers to its lowest rungs (Cachón Rodríguez 2009; Bernardi et al. 2011). This context also varied across regions, which differ in their labor markets and immigrant populations and, in several cases, in their own languages and integration plans; our national-level analysis cannot capture this variation.
Spain shifted from a sending to a receiving country in the 1990s, during its longest continuous period of economic growth. As rising education, supported by the expansion of the welfare state, moved natives up the occupational ladder, the lowest rungs of the labor market came to depend on immigrant labor, and admission and regularization policies largely followed these labor needs (Cachón Rodríguez 2009; Arango 2013); some 70–80% of economic immigrants worked in the lowest occupational positions (Bernardi et al. 2011). In this configuration, strong ties and ethnic community support, indispensable as they were to migration itself, connected newcomers mainly to the low-wage jobs in which their networks were already concentrated. Immigrant groups, moreover, met unequal societal acceptance according to their origin—running, in Díez Nicolás’s (2005) survey of native attitudes, from the European Union, Latin America and sub-Saharan Africa through Asia, Eastern Europe and North Africa. We use this ordering as a measure of how the receiving society made origin socially consequential, not as a measure of cultural distance: it records natives’ evaluations of groups, not differences between cultures. Finally, in a Southern European welfare regime in which the family has long substituted for limited public support (Ferrera 1996; Reher 1998), reliance on kin may itself be a response to restricted access to other resources. Apart from origin group acceptance and ethnic niche employment, these features of the context are not measured in our models: we use them to interpret the associations that we find, not as explanations that our data can establish.
2.4. Hypotheses
The above considerations yield five hypotheses about the socioeconomic positions reached by immigrants who arrived in 1996–2004.
H1.
Two competing expectations follow for family networks. Kin may ease incorporation by providing housing, information and jobs (H1a; Gurak and Caces 1998); alternatively, where kin networks are concentrated in low positions, a larger family network and more intensive family support may be associated with lower socioeconomic positions (H1b; Portes 1998).
H2.
Following segmented assimilation theory, the association of ethnic community and family attachment with socioeconomic position differs by social position: ethnic niche employment and a larger family network are expected to coincide with better positions among low-educated and low-qualified immigrants but not among the higher-educated and higher-qualified.
H3.
The three kinds of tie are differently associated with socioeconomic position: strong ties are associated negatively, while weak ties—and, especially, linking ties—are associated positively; combinations of ties that include strong ties are associated with lower positions than combinations built on weak or linking ties.
H4.
In a structural model, part of the association of the dispersion strategy and of strong ties with socioeconomic position runs indirectly—through assimilation and through weak and linking ties—so that total associations differ from direct ones.
H5.
Ties are associated with socioeconomic position differently in the two age groups: because younger immigrants are at a less settled stage of the life course, we expect them to occupy lower positions than older immigrants and the negative association with strong ties to be stronger among them.
3. Materials and Methods
3.1. Data and Sample
The analysis draws on the Spanish National Immigrant Survey (Encuesta Nacional de Inmigrantes, ENI-2007), conducted by the National Statistics Institute (INE) with the Complutense University of Madrid between November 2006 and February 2007, before the 2008 recession. With 15,465 respondents selected through a three-stage design from the municipal register, it remains the largest survey of immigrants carried out in Spain; to our knowledge, no comparable national survey has been fielded since (Reher and Requena 2009a, 2009b; Campdepadrós Cullell 2023, pp. 218–20). The survey defines immigrants as persons born abroad, aged 16 or over, who had lived in Spain, or intended to live there, for more than a year (Reher and Requena 2009b). Its value for our purpose lies in the detail that it records on how immigrants arrived—who received them, who housed them, who found them their first job—information that general-population surveys do not collect.
Sample construction. We retained respondents who arrived between 1996—the beginning of the sustained labor migration that accompanied Spain’s long growth cycle (Bernardi et al. 2011)—and 2004, so that at least three years separate the first and the last job used to measure labor mobility. We excluded refugees, asylum seekers and students, whose small numbers and atypical legal and labor situations broke the otherwise monotonic relation between legal status and socioeconomic position (Campdepadrós Cullell 2023, pp. 220–21, 231). These restrictions leave 8428 respondents (weighted N = 8904); restricting the age at interview to 16–65 yields a working sample of 8183 respondents (4860 aged 16–35 and 3323 aged 36–65; weighted N = 8572). Because immigrants from the European Union and other high-income countries differ markedly in migration motives, legal status and labor market position, the descriptive analyses, the models that test segmented assimilation and the structural models exclude them (“non-EU” sample below: 7177 respondents, 4451 aged 16–35 and 2726 aged 36–65). The multivariate models use the cases with valid values on all predictors, which yields analytic samples of 6281 (Section 4.2), 5454 (Section 4.4), 5820 (Section 4.5, first model: the non-EU respondents with valid scores on the social capital factors, 3594 aged 16–35 and 2226 aged 36–65) and 3594 (Section 4.5, second model: the young members of this sample). Missing values for the indicators of the outcome—above all, hourly income, missing for about a third of respondents, most of them not in paid work—are handled by full-information maximum likelihood (Section 3.3) and do not reduce these samples; bivariate correlations use all available cases. Item non-response on the predictors is concentrated in whether the respondent arrived with a job offer or obtained their first job through relatives (about 16%) and in legal status (about 17%) (Campdepadrós Cullell 2023, pp. 245–47). Supplementary Table S6 traces the sample flow. Descriptive statistics are weighted with the survey’s person weight, rescaled to sum to the sample size; Mplus models used the same weight. Age is measured at interview; since arrivals are dated from 1996 to 2004, some respondents in the younger group arrived as minors (the so-called 1.5 generation; Rumbaut 2004).
Historical scope. The data describe a specific historical phase: the arrival and early settlement of the largest immigration wave in Spain’s history, during an exceptional expansion and before the 2008 recession, which affected immigrant workers particularly severely (Aysa-Lastra and Cachón 2015). Spanish and European migration policies, the legal framework governing immigrants’ status and the configuration of the labor market have changed substantially since then. We therefore offer the results as an account of how ties and socioeconomic positions were associated in this phase, not as a description of the present.
3.2. Measures
Socioeconomic position index. The outcome combines five indicators (Campdepadrós Cullell 2023, pp. 241–44, 255–58): hourly income in the last job (monthly wage divided by hours worked, with interval answers replaced by their midpoints); occupational prestige of the last job in Spain, measured with the CIS prestige scale (Carabaña and Gómez Bueno 1996), which, unlike socioeconomic scales, does not incorporate education and can therefore be modeled alongside schooling; labor mobility, the difference in prestige between the last and the first job in Spain; dwelling space in square meters per person; and housing conditions, according to the absence of eight problems (humidity, noise, a cramped space, poor communications, odors, construction defects, dirty streets and crime in the area). Each indicator is dichotomized—hourly income above €6, occupational prestige above 67 on the CIS scale (a qualified occupation), upward mobility, more than 26 m2 per person and no housing problems—and the index is their unweighted sum (0–5). Each component therefore contributes equally, and a score of k means that the respondent is on the advantaged side of k of the five indicators (Supplementary Table S7 gives the cut-off points and the share in each category). Respondents not in employment were assigned the lowest prestige value and scored 0 on the income and occupation items; more generally, a component that cannot be observed is scored 0, so the index records the position actually attained. In re-examining the original microdata for this work, we found that unknown dwelling sizes (code 999) had been divided by the household size and treated as valid values in the version of the index used in an earlier work (Campdepadrós Cullell 2023), which placed 16.6% of the observed cases above the dwelling space threshold; these values are now treated as missing, and all statistics based on the index or on dwelling space have been recomputed. The corrected index has a weighted mean of 1.64 (SD 1.29) in the working sample. Because the index is formative—its components define position rather than reflecting a single underlying trait—internal consistency is not the appropriate reliability criterion (Bollen and Lennox 1991; Diamantopoulos and Winklhofer 2001), and the modest Cronbach’s alpha (0.45 for the index as constructed; 0.28 among respondents observed on all five components) is expected.
Two features of the index matter for interpretation. First, labor mobility and occupational prestige share the prestige of the last job, which therefore weighs twice in the index; the structural models acknowledge this overlap by allowing the residuals of the two indicators to correlate (r = 0.82–0.87; Supplementary Table S5). Second, two of the five indicators concern housing, and several tie measures are themselves housing arrangements (see below), so part of the negative association between strong ties and dwelling space is mechanical: living with relatives reduces the space per person.
Socioeconomic position in the multivariate models. In all multivariate models—the grouped regressions in Section 4.2 and Section 4.4 and the path models in Section 4.5—the outcome is a latent factor measured by occupational prestige, hourly income, labor mobility and housing conditions. The latent factor and the index do not capture exactly the same quantity. The index weights its dichotomized components equally; the latent factor retains only the variance that its continuous indicators share. In practice, it rests on occupational prestige (standardized loadings 0.41–0.61) and income (0.22–0.38), whereas labor mobility (−0.02 to 0.02, not significant) and housing conditions (0.02–0.09) load weakly or not at all (Supplementary Table S5). The structural models therefore refer mainly to occupational and income position, whereas the index also reflects mobility and housing. To show which dimensions drive each result, the bivariate analyses in Section 4.1 and Section 4.3 report associations with each component separately. An earlier model estimated on the full 1996–2004 sample, with the four components as separate outcomes, gives a consistent picture: strong ties are negatively associated with occupational prestige and income, unrelated to labor mobility and slightly positively associated with housing conditions (Campdepadrós Cullell 2023, pp. 341–44).
Family support and tie scales. The family support scale counts three forms of help received from relatives: being taken into a relative’s home on arrival, obtaining the first job through a relative and receiving free housing from a relative (0–3; α = 0.275, again a formative index). Three tie scales follow the theoretical typology, each being a count of dichotomous items. The strong ties scale combines moving to a relative’s home on arrival, free housing offered by a relative or friend and the number of relatives in Spain. The weak ties scale combines moving to an acquaintance’s home or to an intermediary on arrival, having been influenced to migrate by other immigrants or by a friend or neighbor and participation in an association in Spain. The linking ties scale combines being received by an employer on arrival, arriving with a job offer and housing provided by a public institution or a firm. From these, we also built a typology of the eight possible combinations of strong (ST), weak (WT) and linking (LT) ties, from 0, 0, 0 to ST, WT, LT; combinations without strong ties are rare (about one respondent in ten), so contrasts among them are descriptive. Supplementary Table S8 gives the ENI-2007 item behind every indicator and the theoretical category assigned to it.
These are proxies, and their limits should be made explicit. The survey records whom immigrants turned to and the help that they received, not the closeness, frequency or reciprocity of each relationship, so tie strength is inferred from the role relation—namely kin, as against friends, acquaintances and organizations—a common but imperfect proxy (Marsden and Campbell 1984). The number of relatives measures the network size, not density or closeness; friendship may involve strong ties; and a job offer or institutional housing indicates contact with an actor holding greater resources, not necessarily a durable linking relationship. Finally, two items of the strong ties scale and two of the family support scale are housing arrangements, which matters for the housing components of the outcome.
Structural model factors. For the path models, social capital indicators were summarized by a principal components analysis with varimax rotation, yielding six factors (KMO = 0.685; eigenvalues above 1; 51.9% of the variance explained): family attraction, dispersion, assimilation, weak ties (friendship), societal acceptance and linking ties (firms). The full rotated loading matrix is reported in Supplementary Table S4 and in Campdepadrós Cullell (2023, pp. 310–19). Factor scores enter the path models as observed variables, and strong ties are represented by the strong ties scale. The societal acceptance factor combines the origin group acceptance score with Spanish proficiency and the origin country GDP; the assimilation factor combines the share of flatmates of other origins, the number of Spanish-born relatives and flatmates and free housing from relatives. The second factor requires a caveat. It combines indicators of a household dispersion strategy—remittances, plans to bring relatives, having traveled alone and phone contact with the origin country—with the origin country GDP (loading negatively) and ethnic niche employment, which are conditions of origin and destination rather than family choices. We therefore label it the dispersion factor and do not read its coefficients as effects of the family strategy alone: they equally reflect the structural circumstances under which such strategies are adopted.
Controls. Models adjust for years in Spain, years of schooling, sex, a legal status scale (irregular, temporary permit, permanent permit, Spanish nationality), the societal acceptance accorded to each origin group (after Díez Nicolás 2005) and—where relevant—the region of origin and whether the immigrant works in an ethnic niche, defined as the sectors in which the respondent’s origin group is over-represented (Campdepadrós Cullell 2023, pp. 232–38).
3.3. Analytic Strategy
The hypotheses are tested in three steps of increasing complexity. We first examine weighted bivariate correlations between family variables, tie types and the index and its components among non-EU immigrants (H1, H3). We then estimate structural regressions of the latent socioeconomic position factor (Section 3.2) on the predictors, following the analytic template shared by Portes and Rumbaut (2001) and Alba and Nee (2003), who—despite their theoretical differences—both distinguish individual variables (personal characteristics, human capital, social capital) from collective variables (societal reception, ethnic community articulation). Models grouped by educational level and by occupational qualification test the segmented assimilation prediction (H2); a model grouped by age tests age group differences (H5). Finally, following Lin’s (2001) distinction between accessible and mobilized social capital, we estimate structural equation path models with a latent socioeconomic position factor, ordering the constructs from the most exogenous (societal acceptance) through accessible and mobilized social capital and decomposing associations into direct and indirect components (H4). The scales, the original index and the principal-components analysis were computed in SPSS version 15.0 (SPSS Inc., Chicago, IL, USA). The descriptive statistics reported in Tables 1 and 3 and Supplementary Tables S1–S3 and S7 were recomputed from the same microdata in Python version 3.13 (Python Software Foundation, Wilmington, DE, USA), and the tests in Supplementary Table S9 were computed from the published coefficients. All models were estimated by robust maximum likelihood (MLR) in Mplus version 6.1 (Muthén & Muthén, Los Angeles, CA, USA; Muthén and Muthén 2010), with missing values on the indicators of the latent factor handled by full-information maximum likelihood; the grouped regressions were estimated as multiple-group structural regressions of the latent factor on the predictors (MIMIC models), which is why fit indices are reported for them, and their R2 is the share of the variance of the latent factor explained by the predictors (not adjusted). We report standardized (STDYX) coefficients, z-values (estimate divided by its standard error) and, for the structural models, the usual global fit indices (χ2, RMSEA, CFI, TLI, SRMR); with samples of this size, χ2 is almost always significant, so fit is judged on the approximate indices (Hu and Bentler 1999). Throughout, *** denotes p < 0.001, ** p < 0.05 and * p < 0.10 (two-tailed); coefficients that are significant only at p < 0.10 are reported but not interpreted as findings.
Associations, not effects. The ENI-2007 is cross-sectional, and the network composition is itself shaped by selection: immigrants with fewer resources may both rely more on kin and reach lower positions (Mouw 2006). All coefficients are therefore conditional associations. In the structural models, “direct” and “indirect” refer to the decomposition of covariance under an assumed ordering, not to demonstrated causal paths. The models contain no product terms, so what we report as indirect paths are not statistical interactions: they show how much of a construct’s association with the outcome runs through other constructs, not that particular combinations of characteristics yield a joint benefit.
Statistical and substantive significance. With analytic samples of several thousand, correlations as small as |r| = 0.03 are statistically significant while accounting for less than 0.1% of the variance. We therefore interpret the magnitude as well as significance: following Cohen (1988), we treat correlations and standardized coefficients below 0.10 as negligible to small, and we describe the corresponding results as modest (Wasserstein and Lazar 2016).
Group comparisons. Age and qualification groups were estimated separately. To assess whether a coefficient differed between two groups, we computed z = (b1 − b2)/√(SE12 + SE22) (Paternoster et al. 1998), recovering each standard error from the reported coefficient and z-value (Supplementary Table S9). Because the coefficients are standardized within each group, these tests are approximate. We interpret as group differences only those with p < 0.05, and we treat the remaining contrasts as not established, since a significant coefficient in one group and a non-significant one in another is not itself evidence of a difference (Gelman and Stern 2006).
4. Results
4.1. Family Networks, Family Support and Socioeconomic Position (H1)
Table 1 reports the weighted bivariate correlations of the family support scale and the number of relatives in Spain with the index and its components separately for each age group of non-EU immigrants. Family support and the number of relatives are positively correlated (0.268 among the young, 0.216 among adults): more relatives coincide with more support. Both are negatively correlated with the index in both age groups; the correlations are small for family support (−0.050; −0.059) and somewhat larger for the number of relatives (−0.146; −0.166). Across components, the pattern is mixed. The number of relatives is negatively correlated with occupational prestige (−0.114 young; −0.083 adult) and, strongly, with dwelling space (−0.368; −0.333) but unrelated to income and labor mobility; the dwelling space association partly reflects the fact that relatives often share the dwelling. The support scale is negatively correlated with hourly income (−0.103; −0.086) and dwelling space (−0.113; −0.089) in both groups, with labor mobility only among the young (−0.039), and only marginally with occupational prestige among adults (−0.032, p < 0.10). The mean scores point in the same direction (Supplementary Tables S1 and S2): the index and dwelling space decline as the number of relatives rises (among the young, the index first rises from no relatives to one, from 1.74 to 1.97, and declines thereafter), and the index and income are lower among those who received family support, whereas labor mobility shows no consistent gradient. The two age groups follow the same gradients and do not differ in their average position (1.59 and 1.61; difference −0.03, p = 0.53), and none of the correlations differ significantly between them (Supplementary Table S9). H1b is therefore supported for the composite index, occupational prestige and dwelling space, but the associations are modest and not uniform across components; H1a receives no support.
Table 1.
Bivariate correlations of the family support scale and the number of relatives in Spain with the socioeconomic position index and its components by age group (non-EU immigrants, weighted).
4.2. Testing Segmented Assimilation (H2)
To test segmented assimilation, we ask whether, among immigrants in low positions, having more relatives (a family support measure) and working in an ethnic niche (an ethnic community density measure) are associated with higher positions. We estimate the latent socioeconomic position factor separately for immigrants of low versus high educational level and, in parallel, those of low versus high occupational qualification at origin, controlling for years in Spain, societal acceptance, legal status and being young and male; immigrants from the EU and other high-income countries are excluded (N = 6281). Occupational status at the destination is kept as an outcome, not a predictor, both because it is the result that we wish to explain and because a good job later enables an immigrant to bring more relatives—the reverse of the ordering that we assume. Results appear in Table 2.
Table 2.
Structural regression of the latent socioeconomic position factor, grouped by educational level and by occupational qualification at origin (standardized coefficients; z-values in brackets; N = 6281).
Segmented assimilation is confirmed only in part. Contrary to the prediction, the number of relatives is negatively associated with position among low-educated (−0.079) and low-qualified (−0.061) immigrants—precisely the groups for whom family support was expected to help—and the association is of a similar size among the university-educated and highly qualified (−0.105 and −0.083; the group differences are not significant). Ethnic niche employment, by contrast, is strongly associated with higher positions among low-educated (0.365) and low-qualified (0.420) immigrants, as the theory predicts. Among the university-educated, the niche coefficient is null (−0.025), and, among the highly qualified, it is small but positive (0.051, p < 0.05); the differences between groups are large and significant. The niche thus aligns with much better positions at the bottom and only marginally at the top—a pattern closer to Borjas’s ([1999] 2001) “glass floor and glass ceiling” than to Portes and Zhou’s prediction. The two measures of attachment therefore point in opposite directions: more relatives align with lower positions in every group, whereas niche employment aligns with higher positions, especially for the low-qualified. Finally, being young is associated with a lower position among the low-educated (−0.112) and low-qualified (−0.122) but not among the university-educated or highly qualified (0.024 and 0.013), and this difference is significant in both groupings. H2 is supported for the ethnic niche but not for the family network.
4.3. Tie Types and Socioeconomic Position (H3)
Table 3 turns from the family to the full portfolio of ties, again for non-EU immigrants and with weighted data. The three types are differently associated with the index, as expected, but the associations are small and the pattern across components has exceptions. Strong ties are negatively correlated with the index (−0.093), income (−0.053), labor mobility (−0.035) and occupational prestige (−0.066); their correlation with housing conditions (−0.009) is negligible, and their larger negative correlation with dwelling space (−0.237) partly reflects the housing items contained in the strong ties scale. Weak ties are weakly and positively correlated with the index (0.065), income, dwelling space and prestige; unrelated to labor mobility (−0.012); and slightly negatively correlated with housing conditions (−0.031). Linking ties are positively correlated with the index (0.058), income and dwelling space, most clearly with occupational prestige (0.114), and unrelated to labor mobility and housing conditions. The mean scores by tie combination (Supplementary Table S3) point in the same direction, with caveats. In both age groups, every combination that includes strong ties scores below the corresponding combination without them, and strong ties alone give the lowest scores (young 1.49; adults 1.44), whereas the highest are reached without strong ties (young: 0, WT, LT, 1.90; adults: 0, 0, LT, 2.14). Among the young, even respondents with no ties at all (1.83) score above every combination with strong ties; among adults, they obtain similar scores to the best of them (1.77, as ST, WT, 0). The combinations without strong ties are rare, however, so these contrasts are descriptive. H3 is supported in direction, with small magnitudes; in the bivariate correlations, weak and linking ties are similarly associated with the index, but only linking ties retain clear positive associations in the multivariate and structural models (Section 4.4 and Section 4.5).
Table 3.
Bivariate correlations between each type of tie and the socioeconomic position index and its components (non-EU immigrants, weighted; N = 7177).
4.4. A Multivariate Model by Age Group (H5)
Table 4 brings the personal and social capital variables together in a structural regression of the latent socioeconomic position factor estimated separately for the two age groups (N = 5454). Schooling (0.348 young; 0.315 adult) and being male (0.289; 0.320) carry the largest coefficients, and legal status and societal acceptance are also positively associated with position. Net of these, the family support scale is negatively associated with position in both groups (−0.104; −0.125), as are plans to bring relatives (−0.067; −0.092). Frequent phone contact with the origin country, which may indicate both transnational obligations and the means to sustain them, is positively associated (0.084; 0.135). Arriving with a job offer, our main linking tie indicator, is positively associated in both groups (0.092; 0.184), and having been taken in by a friend shows a small positive coefficient among the young (0.069, p < 0.05) and none among adults. Migration for family reunification is negatively associated only among the young (−0.092), and the number of Spanish relatives is not associated with position in either group.
Table 4.
Structural regression of the latent socioeconomic position factor by age group, non-EU immigrants (standardized coefficients; z-values in brackets; N = 5454).
Do the two age groups differ? Formal tests (Supplementary Table S9) show that only two coefficients differ significantly: legal status is more strongly associated with position among the young (0.237 against 0.090; p = 0.02), and family reunification is negatively associated only among them (−0.092 against 0.020; p = 0.03). The other contrasts—including the larger coefficients for a prior job offer and phone contact among adults, the smaller gender gap and the slightly larger schooling coefficient among the young—are not statistically distinguishable, and we do not interpret them as distinct age profiles. The larger role of legal status among the young may reflect their shorter time to regularize and is consistent with legal status operating as a mechanism of differential inclusion (De Genova 2002); the reunification result suggests that young people who migrated as dependents of earlier migrants occupy weaker positions, although the data cannot confirm this. As for levels, the two age groups do not differ in their mean index scores (1.59 and 1.61; Supplementary Tables S1 and S2), and the youth disadvantage appears only among the low-educated and low-qualified once other characteristics are held constant (Table 2). H5 is therefore only partly supported.
The large positive coefficient for men deserves a substantive reading rather than being grouped with human capital. It reflects the gendered segmentation of the immigrant labor market in Spain, where women were concentrated in domestic and care work with low wages and prestige (Parella Rubio 2003; Vidal-Coso and Miret-Gamundi 2014). It also reflects the construction of the index: respondents not in paid work are assigned the lowest occupational prestige, so differences in employment between men and women enter the outcome directly. The coefficient therefore measures gendered opportunities and constraints in access to paid, recognized work, not a male advantage in incorporation as such. Networks are themselves gendered resources and constraints (Hagan 1998)—a dimension that our tie measures, which do not distinguish the sex of the contact, cannot capture.
4.5. Direct and Indirect Paths (H4)
The regressions treat each variable in isolation. To examine how social capital dimensions are associated jointly with socioeconomic position, we estimate two structural path models with a latent socioeconomic position factor, decomposing each construct’s association into direct and indirect components (Table 5; Figure 1 and Figure 2). The first model compares the two age groups among non-EU immigrants (N = 5820); the second compares low- and high-qualified workers among young non-EU immigrants (N = 3594). Comparisons with Table 2 and Table 4 should be performed cautiously, since the path models use factor-based indicators of social capital; like the previous regressions, they take as outcome a latent factor resting mainly on occupation and income (Section 3.2). Both models fit the data well (Table 5, notes), but they account for a modest share of the variance of the latent factor (R2 = 0.11 young and 0.18 adult; 0.05 low- and 0.16 high-qualified).
Table 5.
Direct, indirect and total associations with the latent socioeconomic position factor (standardized coefficients).
Figure 1.
Estimated structural model of social capital associations with the latent socioeconomic position factor, non-EU immigrants by age group (N = 5820). Standardized coefficients are shown as young/adult (Y/A); all structural paths, loadings, the correlated residuals of occupational prestige and labor mobility and residual variances are displayed, as reported in Supplementary Table S5. Dashed arrows: not significant at p < 0.05 in either group.
Figure 2.
Estimated structural model, young non-EU immigrants by job qualification (N = 3594). Standardized coefficients are shown as low/high qualification (L/H). Conventions as in Figure 1.
Three results deserve emphasis. First, in both age groups, strong ties are negatively associated with the latent factor (−0.226 young; −0.147 adult), while linking ties are associated positively (0.154; 0.274), and societal acceptance is positively associated in both (0.208; 0.273). Contrary to H5, the strong tie coefficient does not differ significantly between age groups (z = −1.39, p = 0.16), nor do those for linking ties or acceptance. The only significant age difference concerns the dispersion factor, which is negatively associated with the outcome among adults (−0.197) but not among the young (−0.065, not significant; difference p = 0.04).
Second, the indirect paths qualify the direct associations, although—since the models contain no product terms—they are not interactions. Among the young, the dispersion factor has a positive indirect association (0.061) that offsets its direct one (−0.065), leaving a total close to zero (−0.004); among adults, the indirect component is smaller (0.024) and the total remains negative (−0.173). The decomposition in Supplementary Table S5 shows where the positive indirect component comes from: the dispersion factor is associated with fewer strong ties (−0.203 among the young) and with more linking ties (0.177), and both of these coincide with better positions. In other words, the indirect path does not show that combining dispersion with family support yields a joint benefit, as an earlier reading of these models suggested; it shows that immigrants scoring high on the dispersion factor rely less on kin at the destination and more on employers and institutions. The path from the dispersion factor through assimilation is small and negative (about −0.01), and the indirect components of strong ties are negligible (0.001; −0.010). Strong ties are also negatively associated with weak ties in both groups (−0.137; −0.119) and, among highly qualified young immigrants, with linking ties (−0.090), consistent with a less diverse tie portfolio among those who rely on kin. Because strong ties are measured at arrival, before the last job, this ordering is plausible, but it does not rule out the notion that disadvantage shapes reliance on kin. H4 is supported in the limited sense that the total and direct associations differ for the dispersion factor and for societal acceptance.
Third, the qualification contrast (Panel B, Figure 2) adds an important qualification to the broader pattern. Among low-qualified young immigrants, the dispersion factor is positively associated with the latent factor (direct 0.120; total 0.140), whereas, among the highly qualified, it is strongly negative (−0.290; total −0.250); the difference is significant (p < 0.001). Since the factor combines remittances, plans to bring relatives and having traveled alone with ethnic niche employment and a low origin country GDP, the positive coefficient at the bottom is consistent with the niche result in Table 2: for the low-qualified, the circumstances captured by this factor coincide with relatively better placement within the lower segment of the labor market, while, for the highly qualified, they coincide with positions below those that their qualifications would predict. Linking ties are positively associated with the outcome only among the highly qualified (0.215 against 0.009; difference p = 0.01). Strong ties are negatively associated in both groups (−0.099; −0.209), and the difference is not significant. Among the highly qualified, the positive direct association of societal acceptance (0.106) is offset by negative indirect paths running mainly through the dispersion factor and strong ties (total −0.015). Obligations toward kin, and the conditions that make them necessary, thus coincide with the largest shortfall in position for those with the most qualifications to convert—although, again, the direction of the relationship cannot be established with these data.
5. Discussion
The results converge on a pattern that is consistent in direction but modest in size: among first-generation immigrants who arrived in Spain in 1996–2004, larger and more supportive family networks are associated with lower socioeconomic positions, and the association runs mainly through strong ties. We read this pattern through four threads and then consider what the data cannot establish.
The first is the contrast between family and community. More relatives and more family support coincide with lower positions (Table 1, Table 2 and Table 4), whereas working in an ethnic niche coincides with higher positions for the low-qualified (Table 2). The enclave literature has long been divided between those who find that ethnic economies help immigrants to build careers while sheltering them from labor-market discrimination (Wilson and Portes 1980; Portes and Bach 1985; Raijman and Tienda 1999; Waldinger and Feliciano 2004) and those who find that niches and enclaves mostly supply low-income jobs bounded by a glass floor and a glass ceiling (Borjas [1999] 2001; Chiswick and Miller 1996; Perreira et al. 2006). Our findings sit closer to the second case while refining it: the niche is associated with better positions at the bottom but barely at the top—the asymmetry that a glass ceiling account predicts. The family, dominated by strong ties, shows no such association, even at the bottom. In the terms of the differential inclusion literature, the niche secures relatively better positions within the lower segment, rather than a way out of it.
The second thread is the differential value of ties. Strong ties are negatively and linking ties positively correlated with the index, while weak ties show small associations of mixed sign across components (Table 3); in the multivariate and structural models, weak tie coefficients are small and mostly not significant. This is only partly Granovetter’s (1973) argument observed in a migration context—in our data, the advantage lies with linking ties rather than with weak ties as such—and the causal weight of personal contacts is itself contested (Mouw 2003, 2006). The path models add that strong ties are negatively associated with weak ties and, among the highly qualified, with linking ties, so that reliance on kin coincides with a less diverse portfolio of ties.
The third thread concerns the direction of the relationship, and it is the most open. Why might family support fail to translate into socioeconomic advancement? The negative association admits two readings that our data cannot fully separate. In the first, suggested by segmented assimilation theory, kin networks concentrated in low positions channel newcomers into the jobs and neighborhoods of their network, and obligations of reciprocity absorb resources that could otherwise support advancement (Portes 1998). In the second, support is a response to disadvantage: families concentrate help on members who arrive with fewer resources, weaker legal status or poorer prospects, and, in a Southern European welfare regime, the family substitutes for limited public support (Ferrera 1996; Reher 1998). Prior resources, migration routes, caring responsibilities and barriers to formal employment could shape both reliance on kin and socioeconomic outcomes, and networks operating under scarcity can offer only limited help (Menjívar 2000; Mouw 2006). Measuring support at arrival—before the last job and current housing are observed—and controlling for schooling, legal status and origin partly addresses the second reading, but unobserved selection into support cannot be ruled out. The same holds for linking ties, which may be a consequence as much as a cause of a favorable position: an immigrant who arrives with a job offer has already been selected by an employer. Kin networks may thus mark the constraints that immigrants face rather than produce them.
The fourth thread qualifies, rather than overturns, segmented assimilation theory. Its core claim—that the value of ethnic attachment depends on the context of incorporation—is consistent with our results, but its specific prediction that larger family networks help the low-positioned is not borne out. We interpret this through the context described in Section 2.3: a labor market that placed most newcomers on its lowest rungs, a family-centered welfare regime and unequal acceptance by origin. In this context, kin solidarity sustained migration and settlement but was associated with positions within the lower segment rather than with movement out of it. This reading is consistent with our associations, but our models do not test it: the receiving context is not measured as a variable—our data cover a single country at one point in time—and testing it would require comparisons across contexts and periods, as well as attention to regional variation within Spain.
The age comparison yields a more restrained picture than our hypothesis anticipated. The two age groups occupy similar average positions; the young occupy lower positions only when they have little education or low qualifications, and most coefficients, including that for strong ties, do not differ significantly between age groups. The two differences that are statistically supported—a stronger association with legal status and a negative association with family reunification among the young—point to institutional and family migration channels rather than to differences in outlook, and we refrain from characterizing the young as more “modern” or “flexible”, which the coefficients cannot show. Because age groups are compared at a single point in time, these differences may reflect the life stage—entry into the labor market, household formation, the precarious first jobs that were common to young people in Spain at the time (Polavieja 2003)—as much as anything specific to migration; without data on natives of the same age or on individual trajectories, we cannot separate the two.
Several limitations temper these conclusions. The data are cross-sectional, so the estimates describe associations, and selection into reliance on kin may account for part of them. The outcome measures material position—income, occupation, mobility, housing—not participation, recognition, subjective belonging or freedom from discrimination, and the structural models capture mainly occupation and income. The tie measures are proxies based on role relations and on the help received at arrival, without information on closeness or reciprocity. The receiving context is interpreted, not modeled. Some subgroups, such as tie combinations without strong ties, are small. Moreover, the data describe one historical phase: immigrants who arrived during an exceptional expansion, observed before the 2008 recession, which affected immigrant workers particularly severely (Aysa-Lastra and Cachón 2015). Later research—on the labor trajectories of immigrant women in Spain (Vidal-Coso and Miret-Gamundi 2014), on immigrants’ occupational mobility over time (Simón et al. 2014), on the labor market returns to co-ethnic and bridging ties elsewhere in Europe (Lancee 2010; Kalter and Kogan 2014) and on ethnic and racial discrimination in hiring (Quillian et al. 2019; Fernández-Reino et al. 2023)—shows that the questions raised here remain open, but whether the patterns that we document persisted after the crisis cannot be established with these data.
6. Conclusions
This article asked how the strong, weak and linking ties of young first-generation immigrants were associated with the socioeconomic positions that they had reached in Spain by 2007, compared with older immigrants. H1 is supported in its second version (H1b): larger family networks and more family support coincide with lower positions, although the associations are small and vary across components. H2 is partly supported: ethnic niche employment is associated with better positions for the low-qualified but barely for the qualified, whereas more relatives do not coincide with better positions, even at the bottom. H3 is supported in direction: strong ties are negatively and linking ties are positively associated with position, while weak ties show small and inconsistent associations. H4 is supported in a limited sense: part of the association of the dispersion factor and of societal acceptance runs indirectly, mainly through strong ties, and, among low-qualified young immigrants, the dispersion factor is positively associated with position. H5 is only partly supported: the two age groups occupy similar average positions, the youth disadvantage appears only among the low-educated and low-qualified, and the association with strong ties does not differ significantly between age groups.
The broader implication concerns the nature of solidarity. Kin ties sustained migration and settlement—housing newcomers, finding them their first jobs and sharing resources—but, in the pre-crisis Spanish labor market, they were not associated with better socioeconomic positions, whereas contacts with employers and institutions were. Whether reliance on kin limits advancement or marks the constraints of those with fewer alternatives cannot be settled with cross-sectional data; regardless, solidarity can sustain people substantially even where it cannot carry them past structural barriers. This outcome is better understood as a feature of the positions into which immigrants were incorporated than as a property of solidarity itself. Two lines of inquiry follow. One is longitudinal: to examine with panel or retrospective data whether reliance on kin precedes or follows disadvantage and whether the patterns persisted after the 2008 recession and into the second generation. The other is comparative and institutional: to ask whether receiving contexts with different labor market and welfare arrangements convert the same family networks into better positions.
Supplementary Materials
The following supporting information can be downloaded at https://www.mdpi.com/article/10.3390/socsci15110759/s1. Table S1 (socioeconomic position index by degree of family support), Table S2 (index and components by number of relatives and age group), Table S3 (index by tie combination and age group, with cell sizes), Table S4 (rotated factor loading matrix of the social capital components), Table S5 (full standardized path coefficients, z-values and residual variances of both structural models), Table S6 (sample flow), Table S7 (index components: cut-off points and distribution), Table S8 (ENI-2007 items and theoretical categories of the social capital indicators) and Table S9 (tests of group differences in coefficients).
Author Contributions
Conceptualization, R.C.-C. and M.G.; methodology, R.C.-C. and M.G.; software, R.C.-C.; validation, R.C.-C.; formal analysis, R.C.-C. and M.G.; investigation, R.C.-C. and M.G.; data curation, R.C.-C.; writing—original draft, R.C.-C. and M.G.; writing—review and editing, R.C.-C. and M.G.; supervision, R.C.-C. and M.G. All authors have read and agreed to the published version of the manuscript.
Funding
This research received no external funding.
Institutional Review Board Statement
Not applicable. The study analyzed secondary, anonymized microdata and involved no intervention with human subjects.
Informed Consent Statement
Not applicable.
Data Availability Statement
The analysis uses the Spanish National Immigrant Survey of 2007 (Encuesta Nacional de Inmigrantes), a publicly available, anonymized micro-dataset distributed by the Spanish National Statistics Institute (INE).
Acknowledgments
During the preparation of this manuscript, the authors used Claude (Anthropic; July–October 2026) for the purposes of English-language drafting and editing, recomputing descriptive statistics from the original microdata and computing the tests of group differences in Supplementary Table S9, preparing the figures from the authors’ original diagrams and model output and formatting the reference list and the bibliographic metadata to the journal’s style. The authors have reviewed and edited the output and take full responsibility for the content of this publication.
Conflicts of Interest
R.C.-C. and M.G. are Guest Editors of the Special Issue in which this article is published; they took no part in the editorial handling of the manuscript or in the peer-review decisions concerning it. The authors declare no other conflicts of interest.
References
- Ager, Alastair, and Alison Strang. 2008. Understanding Integration: A Conceptual Framework. Journal of Refugee Studies 21: 166–91. [Google Scholar] [CrossRef] [Scilit]
- Alba, Richard, and Victor Nee. 2003. Remaking the American Mainstream: Assimilation and Contemporary Immigration. Cambridge: Harvard University Press. [Google Scholar] [CrossRef] [Scilit]
- Arango, Joaquín. 2013. Exceptional in Europe? Spain’s Experience with Immigration and Integration. Washington, DC: Migration Policy Institute. [Google Scholar]
- Aysa-Lastra, María, and Lorenzo Cachón, eds. 2015. Immigrant Vulnerability and Resilience: Comparative Perspectives on Latin American Immigrants During the Great Recession. Cham: Springer. [Google Scholar]
- Bernardi, Fabrizio, Luis Garrido, and María Miyar. 2011. The Recent Fast Upsurge of Immigrants in Spain and Their Employment Patterns and Occupational Attainment. International Migration 49: 148–87. [Google Scholar] [CrossRef] [Scilit]
- Bollen, Kenneth, and Richard Lennox. 1991. Conventional Wisdom on Measurement: A Structural Equation Perspective. Psychological Bulletin 110: 305–14. [Google Scholar] [CrossRef]
- Borjas, George J. 2001. Heaven’s Door: Immigration Policy and the American Economy. Princeton: Princeton University Press. First published 1999. [Google Scholar] [CrossRef] [Scilit]
- Bourdieu, Pierre. 1986. The Forms of Capital. In Handbook of Theory and Research for the Sociology of Education. Edited by John G. Richardson. New York: Greenwood, pp. 241–58. [Google Scholar]
- Cachón Rodríguez, Lorenzo. 2009. La “España inmigrante”: Marco discriminatorio, mercado de trabajo y políticas de integración. Barcelona: Anthropos. [Google Scholar]
- Campdepadrós Cullell, Roger. 2023. El papel de las redes sociales en la integración social de los inmigrantes. La construcción de un índice de integración para el caso español. Sevilla: Fundación Centro de Estudios Andaluces. [Google Scholar] [CrossRef] [Scilit]
- Carabaña, Julio, and Carlos Gómez Bueno. 1996. Escalas de prestigio ocupacional. Madrid: Centro de Investigaciones Sociológicas. [Google Scholar]
- Chiswick, Barry R., and Paul W. Miller. 1996. Ethnic Networks and Language Proficiency among Immigrants. Journal of Population Economics 9: 19–35. [Google Scholar] [CrossRef] [Scilit]
- Cohen, Jacob. 1988. Statistical Power Analysis for the Behavioral Sciences, 2nd ed. Hillsdale: Lawrence Erlbaum. [Google Scholar]
- Coleman, James S. 1988. Social Capital in the Creation of Human Capital. American Journal of Sociology 94: S95–S120. [Google Scholar] [CrossRef] [Scilit]
- Coleman, James S. 1990. Foundations of Social Theory. Cambridge: The Belknap Press of Harvard University Press. [Google Scholar]
- De Genova, Nicholas P. 2002. Migrant “Illegality” and Deportability in Everyday Life. Annual Review of Anthropology 31: 419–47. [Google Scholar] [CrossRef] [Scilit]
- Diamantopoulos, Adamantios, and Heidi M. Winklhofer. 2001. Index Construction with Formative Indicators: An Alternative to Scale Development. Journal of Marketing Research 38: 269–77. [Google Scholar] [CrossRef] [Scilit]
- Díez Nicolás, Juan. 2005. Las dos caras de la inmigración. Madrid: Ministerio de Trabajo y Asuntos Sociales. [Google Scholar]
- European Commission. 2003. Communication on Immigration, Integration and Employment. COM (2003) 336. Brussels: European Commission. Available online: https://eur-lex.europa.eu/legal-content/EN/TXT/?uri=celex:52003DC0336 (accessed on 15 February 2026).
- Fernández-Reino, Mariña, Valentina Di Stasio, and Susanne Veit. 2023. A Field Experiment on the Barriers Faced by Muslim Women in Germany, the Netherlands, and Spain. European Sociological Review 39: 479–97. [Google Scholar] [CrossRef] [Scilit]
- Ferrera, Maurizio. 1996. The ‘Southern Model’ of Welfare in Social Europe. Journal of European Social Policy 6: 17–37. [Google Scholar] [CrossRef] [Scilit]
- Fussell, Elizabeth, and Douglas S. Massey. 2004. The Limits to Cumulative Causation: International Migration from Mexican Urban Areas. Demography 41: 151–71. [Google Scholar] [CrossRef] [Scilit]
- Galtung, Johan. 1964. Foreign Policy Opinion as a Function of Social Position. Journal of Peace Research 1: 206–31. [Google Scholar] [CrossRef] [Scilit]
- Gans, Herbert J. 1999. Toward a Reconciliation of “Assimilation” and “Pluralism”: The Interplay of Acculturation and Ethnic Retention. In The Handbook of International Migration: The American Experience. Edited by Charles Hirschman, Philip Kasinitz and Josh DeWind. New York: Russell Sage Foundation, pp. 161–71. [Google Scholar]
- Gelman, Andrew, and Hal Stern. 2006. The Difference between “Significant” and “Not Significant” Is Not Itself Statistically Significant. The American Statistician 60: 328–31. [Google Scholar] [CrossRef] [Scilit]
- Gordon, Milton M. 1964. Assimilation in American Life: The Role of Race, Religion, and National Origins. New York: Oxford University Press. [Google Scholar]
- Granovetter, Mark S. 1973. The Strength of Weak Ties. American Journal of Sociology 78: 1360–80. [Google Scholar] [CrossRef] [Scilit]
- Granovetter, Mark S. 1982. The Strength of Weak Ties: A Network Theory Revisited. In Social Structure and Network Analysis. Edited by Peter V. Marsden and Nan Lin. Beverly Hills: Sage, pp. 105–30. [Google Scholar]
- Grim-Feinberg, Kara. 2007. Strengthening Social Capital through Bilingual Competence in a Transnational Migrant Community: Mexicans in Upstate New York. International Migration 45: 177–208. [Google Scholar] [CrossRef] [Scilit]
- Gurak, Douglas T., and Fe Caces. 1998. Redes migratorias y la formación de sistemas de migración. In Cruzando fronteras: Migraciones en el sistema mundial. Edited by Graciela Malgesini. Barcelona: Icaria, pp. 75–110. [Google Scholar]
- Hagan, Jacqueline Maria. 1998. Social Networks, Gender, and Immigrant Incorporation: Resources and Constraints. American Sociological Review 63: 55–67. [Google Scholar] [CrossRef] [Scilit]
- Hu, Li-tze, and Peter M. Bentler. 1999. Cutoff Criteria for Fit Indexes in Covariance Structure Analysis: Conventional Criteria versus New Alternatives. Structural Equation Modeling 6: 1–55. [Google Scholar] [CrossRef] [Scilit]
- Kalter, Frank, and Irena Kogan. 2014. Migrant Networks and Labor Market Integration of Immigrants from the Former Soviet Union in Germany. Social Forces 92: 1435–56. [Google Scholar] [CrossRef] [Scilit]
- Korinek, Kim, Barbara Entwisle, and Aree Jampaklay. 2005. Through Thick and Thin: Layers of Social Ties and Urban Settlement among Thai Migrants. American Sociological Review 70: 779–800. [Google Scholar] [CrossRef] [Scilit]
- Lancee, Bram. 2010. The Economic Returns of Immigrants’ Bonding and Bridging Social Capital: The Case of the Netherlands. International Migration Review 44: 202–26. [Google Scholar] [CrossRef] [Scilit]
- Lin, Nan. 2001. Social Capital: A Theory of Social Structure and Action. Cambridge: Cambridge University Press. [Google Scholar] [CrossRef] [Scilit]
- Lipset, Seymour Martin, and Reinhard Bendix. 1963. Social Mobility in Industrial Society. Berkeley: University of California Press. [Google Scholar]
- Marsden, Peter V., and Karen E. Campbell. 1984. Measuring Tie Strength. Social Forces 63: 482–501. [Google Scholar] [CrossRef] [Scilit]
- Martínez Veiga, Ubaldo. 1997. La integración social de los inmigrantes extranjeros en España. Madrid: Trotta. [Google Scholar]
- Massey, Douglas S. 1990. Social Structure, Household Strategies, and the Cumulative Causation of Migration. Population Index 56: 3–26. [Google Scholar] [CrossRef] [Scilit]
- Menjívar, Cecilia. 2000. Fragmented Ties: Salvadoran Immigrant Networks in America. Berkeley: University of California Press. [Google Scholar]
- Mezzadra, Sandro, and Brett Neilson. 2013. Border as Method, or, the Multiplication of Labor. Durham: Duke University Press. [Google Scholar]
- Mouw, Ted. 2003. Social Capital and Finding a Job: Do Contacts Matter? American Sociological Review 68: 868–98. [Google Scholar] [CrossRef] [Scilit]
- Mouw, Ted. 2006. Estimating the Causal Effect of Social Capital: A Review of Recent Research. Annual Review of Sociology 32: 79–102. [Google Scholar] [CrossRef] [Scilit]
- Muthén, Linda K., and Bengt O. Muthén. 2010. Mplus User’s Guide, 6th ed. Los Angeles: Muthén & Muthén. [Google Scholar]
- Parella Rubio, Sònia. 2003. Mujer, inmigrante y trabajadora: La triple discriminación. Barcelona: Anthropos. [Google Scholar]
- Park, Robert E. 1928. Human Migration and the Marginal Man. American Journal of Sociology 33: 881–93. [Google Scholar] [CrossRef] [Scilit]
- Parsons, Talcott. 1971. The System of Modern Societies. Englewood Cliffs: Prentice Hall. [Google Scholar]
- Paternoster, Raymond, Robert Brame, Paul Mazerolle, and Alex Piquero. 1998. Using the Correct Statistical Test for the Equality of Regression Coefficients. Criminology 36: 859–66. [Google Scholar] [CrossRef] [Scilit]
- Penninx, Rinus, and Blanca Garcés-Mascareñas. 2016. The Concept of Integration as an Analytical Tool and as a Policy Concept. In Integration Processes and Policies in Europe: Contexts, Levels and Actors. Edited by Blanca Garcés-Mascareñas and Rinus Penninx. Cham: Springer, pp. 11–29. [Google Scholar] [CrossRef] [Scilit]
- Perreira, Krista M., Kathleen Mullan Harris, and Dohoon Lee. 2006. Making It in America: High School Completion by Immigrant and Native Youth. Demography 43: 511–36. [Google Scholar] [CrossRef] [Scilit]
- Polavieja, Javier G. 2003. Temporary Contracts and Labour Market Segmentation in Spain: An Employment-Rent Approach. European Sociological Review 19: 501–17. [Google Scholar] [CrossRef] [Scilit]
- Portes, Alejandro. 1998. Social Capital: Its Origins and Applications in Modern Sociology. Annual Review of Sociology 24: 1–24. [Google Scholar] [CrossRef] [Scilit]
- Portes, Alejandro, and Min Zhou. 1993. The New Second Generation: Segmented Assimilation and Its Variants among Post-1965 Immigrant Youth. The Annals of the American Academy of Political and Social Science 530: 74–96. [Google Scholar] [CrossRef] [Scilit]
- Portes, Alejandro, and Robert L. Bach. 1985. Latin Journey: Cuban and Mexican Immigrants in the United States. Berkeley: University of California Press. [Google Scholar] [CrossRef] [Scilit]
- Portes, Alejandro, and Rubén G. Rumbaut. 2001. Legacies: The Story of the Immigrant Second Generation. Berkeley: University of California Press. [Google Scholar]
- Portes, Alejandro, and Rubén G. Rumbaut. 2006. Immigrant America: A Portrait, 3rd ed. Berkeley: University of California Press. First published 1996. [Google Scholar]
- Putnam, Robert D., ed. 2002. Democracies in Flux: The Evolution of Social Capital in Contemporary Society. New York: Oxford University Press. [Google Scholar] [CrossRef] [Scilit]
- Quillian, Lincoln, Anthony Heath, Devah Pager, Arnfinn H. Midtbøen, Fenella Fleischmann, and Ole Hexel. 2019. Do Some Countries Discriminate More than Others? Evidence from 97 Field Experiments of Racial Discrimination in Hiring. Sociological Science 6: 467–96. [Google Scholar] [CrossRef] [Scilit]
- Raijman, Rebeca, and Marta Tienda. 1999. Immigrants’ Socioeconomic Progress Post-1965: Forging Mobility or Survival? In The Handbook of International Migration: The American Experience. Edited by Charles Hirschman, Philip Kasinitz and Josh DeWind. New York: Russell Sage Foundation, pp. 239–56. [Google Scholar]
- Reher, David S. 1998. Family Ties in Western Europe: Persistent Contrasts. Population and Development Review 24: 203–34. [Google Scholar] [CrossRef] [Scilit]
- Reher, David-Sven, and Miguel Requena, eds. 2009a. Las múltiples caras de la inmigración en España. Madrid: Alianza. [Google Scholar]
- Reher, David-Sven, and Miguel Requena. 2009b. The National Immigrant Survey of Spain: A New Data Source for Migration Studies in Europe. Demographic Research 20: 253–78. [Google Scholar] [CrossRef] [Scilit]
- Requena, Félix. 2005. La estructura ocupacional española: Un análisis de la Encuesta de Calidad de Vida en el Trabajo. Madrid: Ministerio de Trabajo y Asuntos Sociales. [Google Scholar]
- Rumbaut, Rubén G. 2004. Ages, Life Stages, and Generational Cohorts: Decomposing the Immigrant First and Second Generations in the United States. International Migration Review 38: 1160–205. [Google Scholar] [CrossRef] [Scilit]
- Ryder, Norman B. 1965. The Cohort as a Concept in the Study of Social Change. American Sociological Review 30: 843–61. [Google Scholar] [CrossRef] [Scilit]
- Sayad, Abdelmalek. 2004. The Suffering of the Immigrant. Cambridge: Polity. First published 1999. [Google Scholar]
- Schinkel, Willem. 2018. Against ‘Immigrant Integration’: For an End to Neocolonial Knowledge Production. Comparative Migration Studies 6: 31. [Google Scholar] [CrossRef] [Scilit]
- Simón, Hipólito, Raúl Ramos, and Esteban Sanromá. 2014. Immigrant Occupational Mobility: Longitudinal Evidence from Spain. European Journal of Population 30: 223–55. [Google Scholar] [CrossRef] [Scilit]
- Singer, Audrey, and Douglas S. Massey. 1998. The Social Process of Undocumented Border Crossing among Mexican Migrants. International Migration Review 32: 561–92. [Google Scholar] [CrossRef] [Scilit]
- Stack, Carol B. 1974. All Our Kin: Strategies for Survival in a Black Community. New York: Harper and Row. [Google Scholar]
- Stark, Oded, and David E. Bloom. 1985. The New Economics of Labor Migration. American Economic Review 75: 173–78. [Google Scholar]
- Sullivan, Mercer L. 1989. Getting Paid: Youth Crime and Work in the Inner City. Ithaca: Cornell University Press. [Google Scholar]
- Touraine, Alain. 1997. Pourrons-Nous Vivre Ensemble? Égaux et Différents. Paris: Fayard. [Google Scholar]
- Vidal-Coso, Elena, and Pau Miret-Gamundi. 2014. The Labour Trajectories of Immigrant Women in Spain: Are There Signs of Upward Social Mobility? Demographic Research 31: 337–80. [Google Scholar] [CrossRef] [Scilit]
- Waldinger, Roger, and Cynthia Feliciano. 2004. Will the New Second Generation Experience “Downward Assimilation”? Segmented Assimilation Re-assessed. Ethnic and Racial Studies 27: 376–402. [Google Scholar] [CrossRef] [Scilit]
- Wasserstein, Ronald L., and Nicole A. Lazar. 2016. The ASA Statement on p-Values: Context, Process, and Purpose. The American Statistician 70: 129–33. [Google Scholar] [CrossRef] [Scilit]
- Wellman, Barry, and Stephen D. Berkowitz, eds. 1997. Social Structures: A Network Approach. Greenwich: JAI Press. First published 1988. [Google Scholar]
- Wilson, Kenneth L., and Alejandro Portes. 1980. Immigrant Enclaves: An Analysis of the Labor Market Experiences of Cubans in Miami. American Journal of Sociology 86: 295–319. [Google Scholar] [CrossRef] [Scilit]
- Zhou, Min. 1999. Segmented Assimilation: Issues, Controversies, and Recent Research on the New Second Generation. In The Handbook of International Migration: The American Experience. Edited by Charles Hirschman, Philip Kasinitz and Josh DeWind. New York: Russell Sage Foundation, pp. 196–211. [Google Scholar]
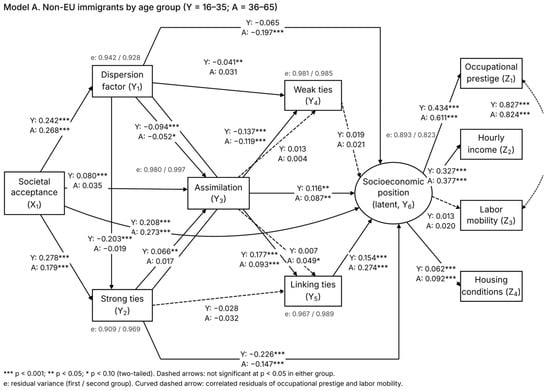
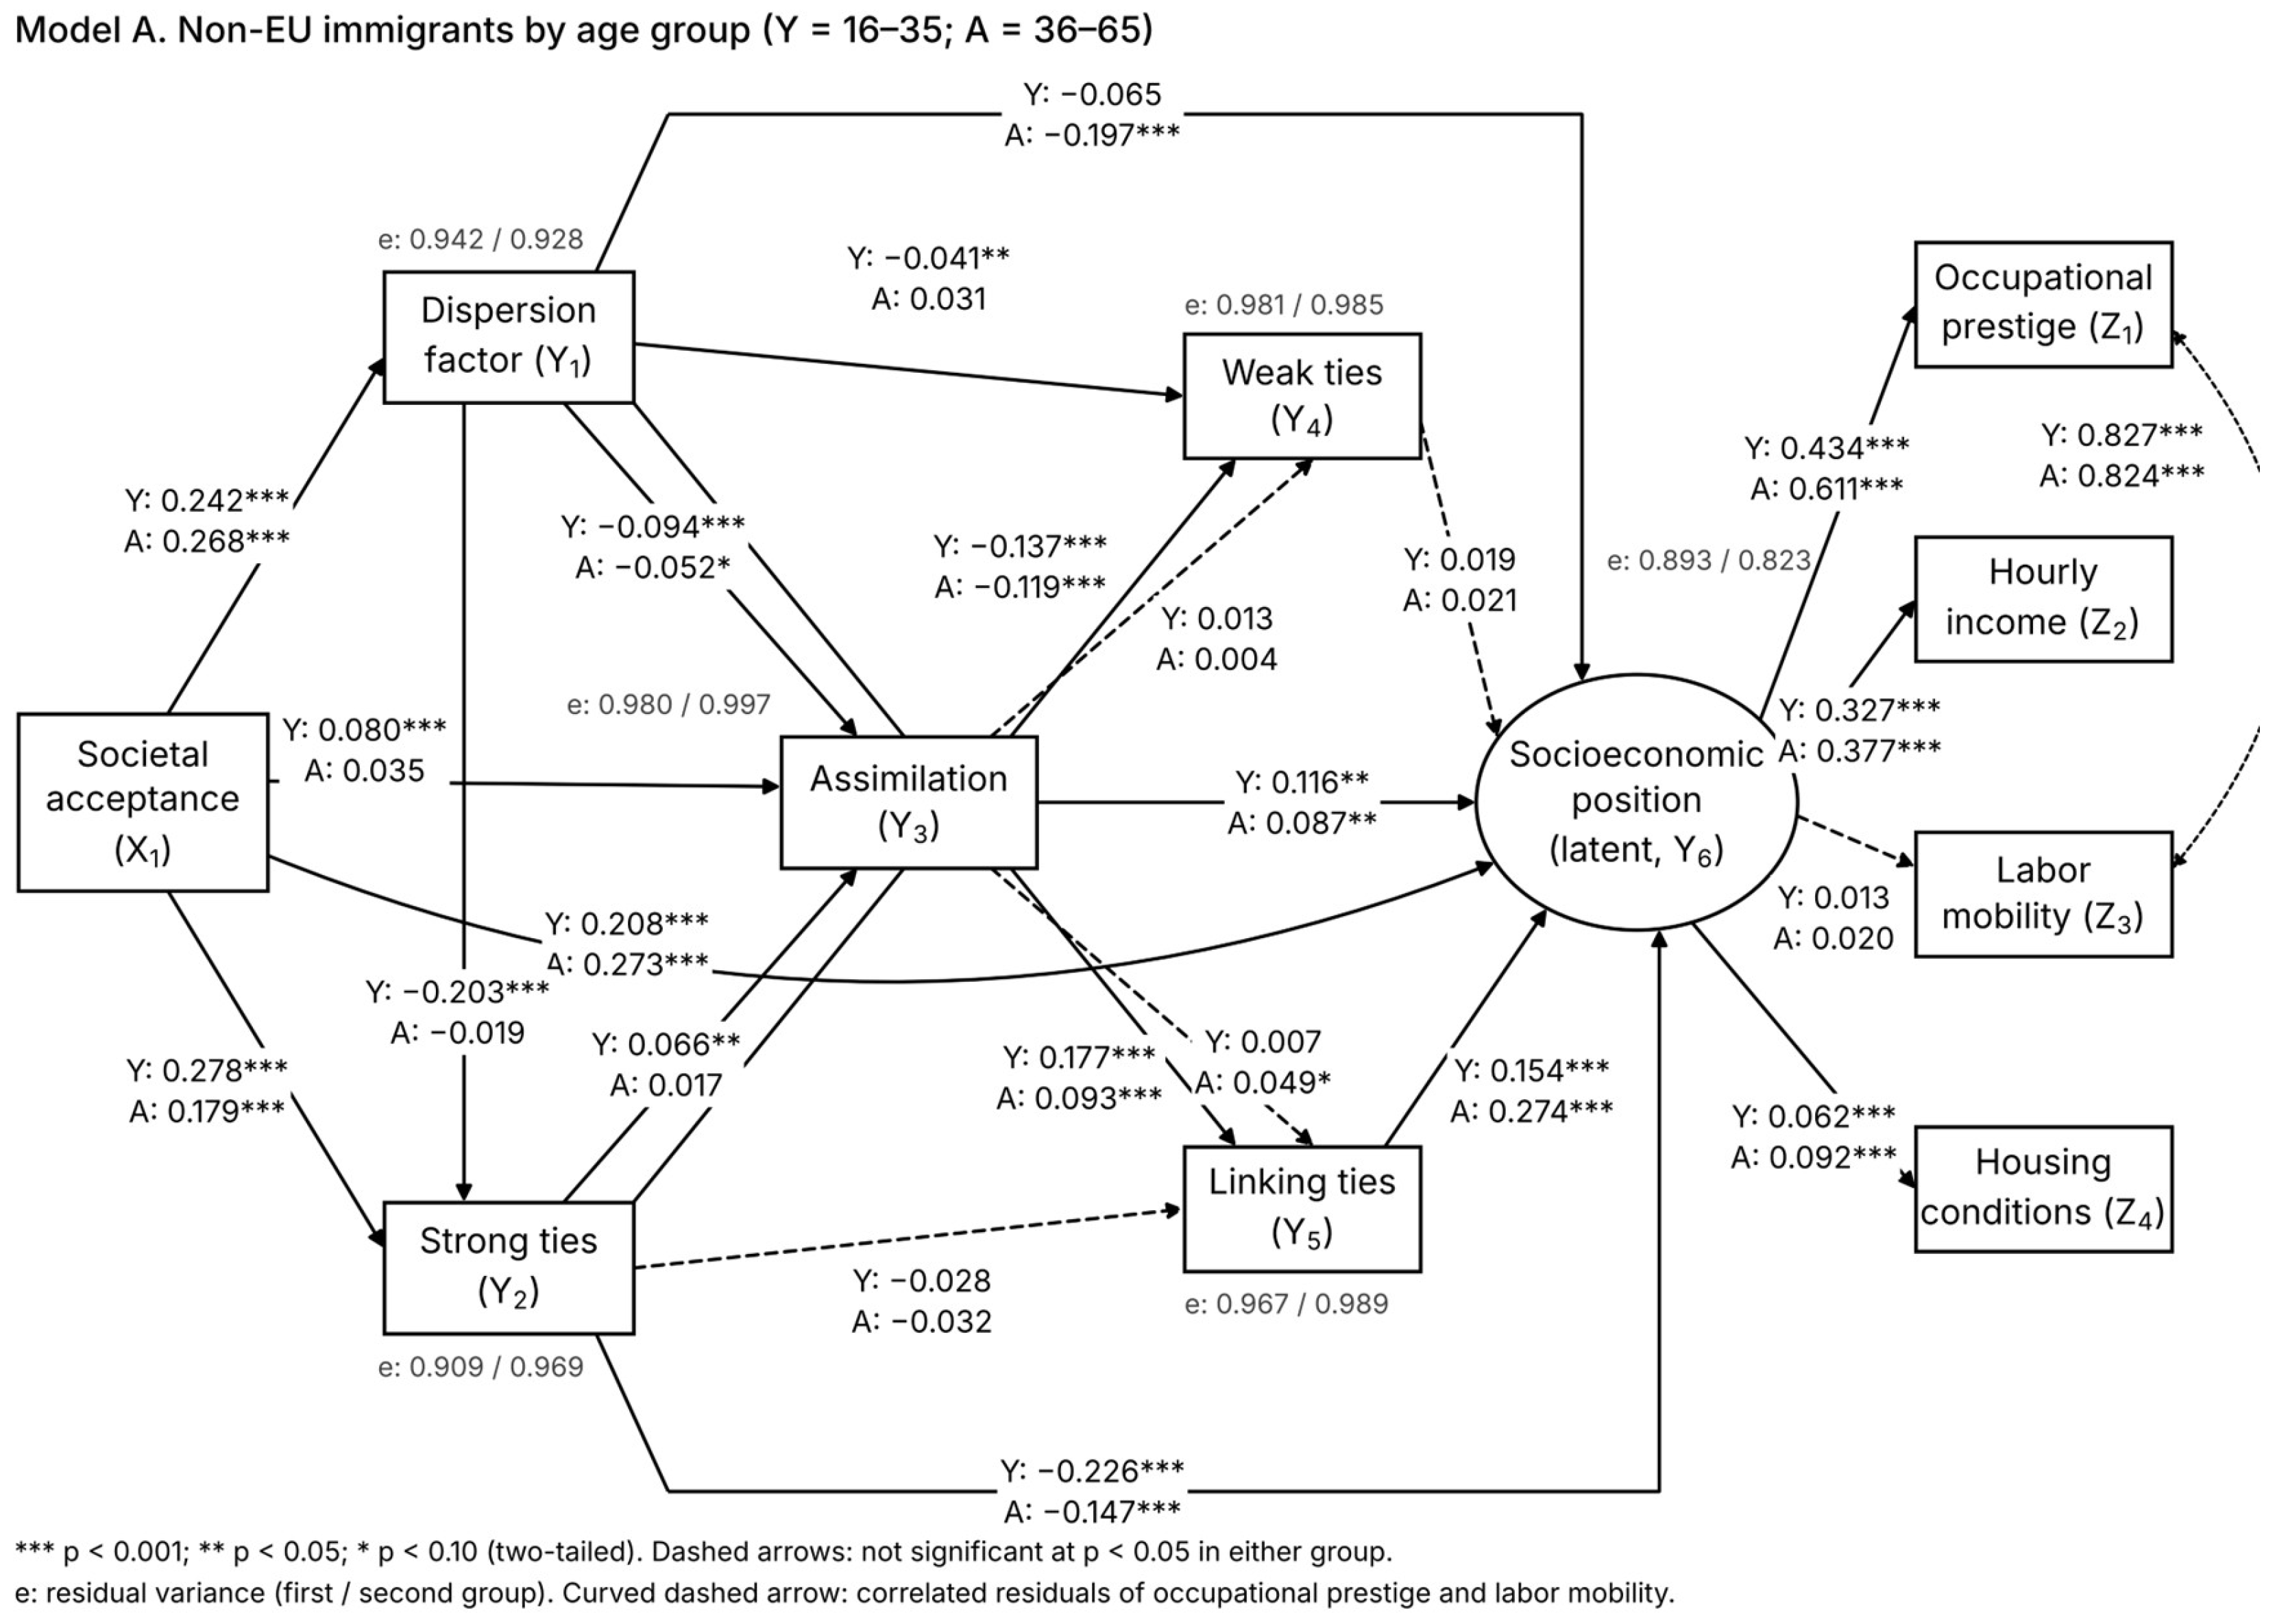
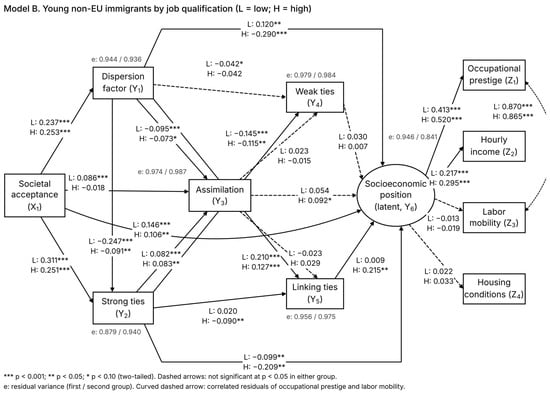
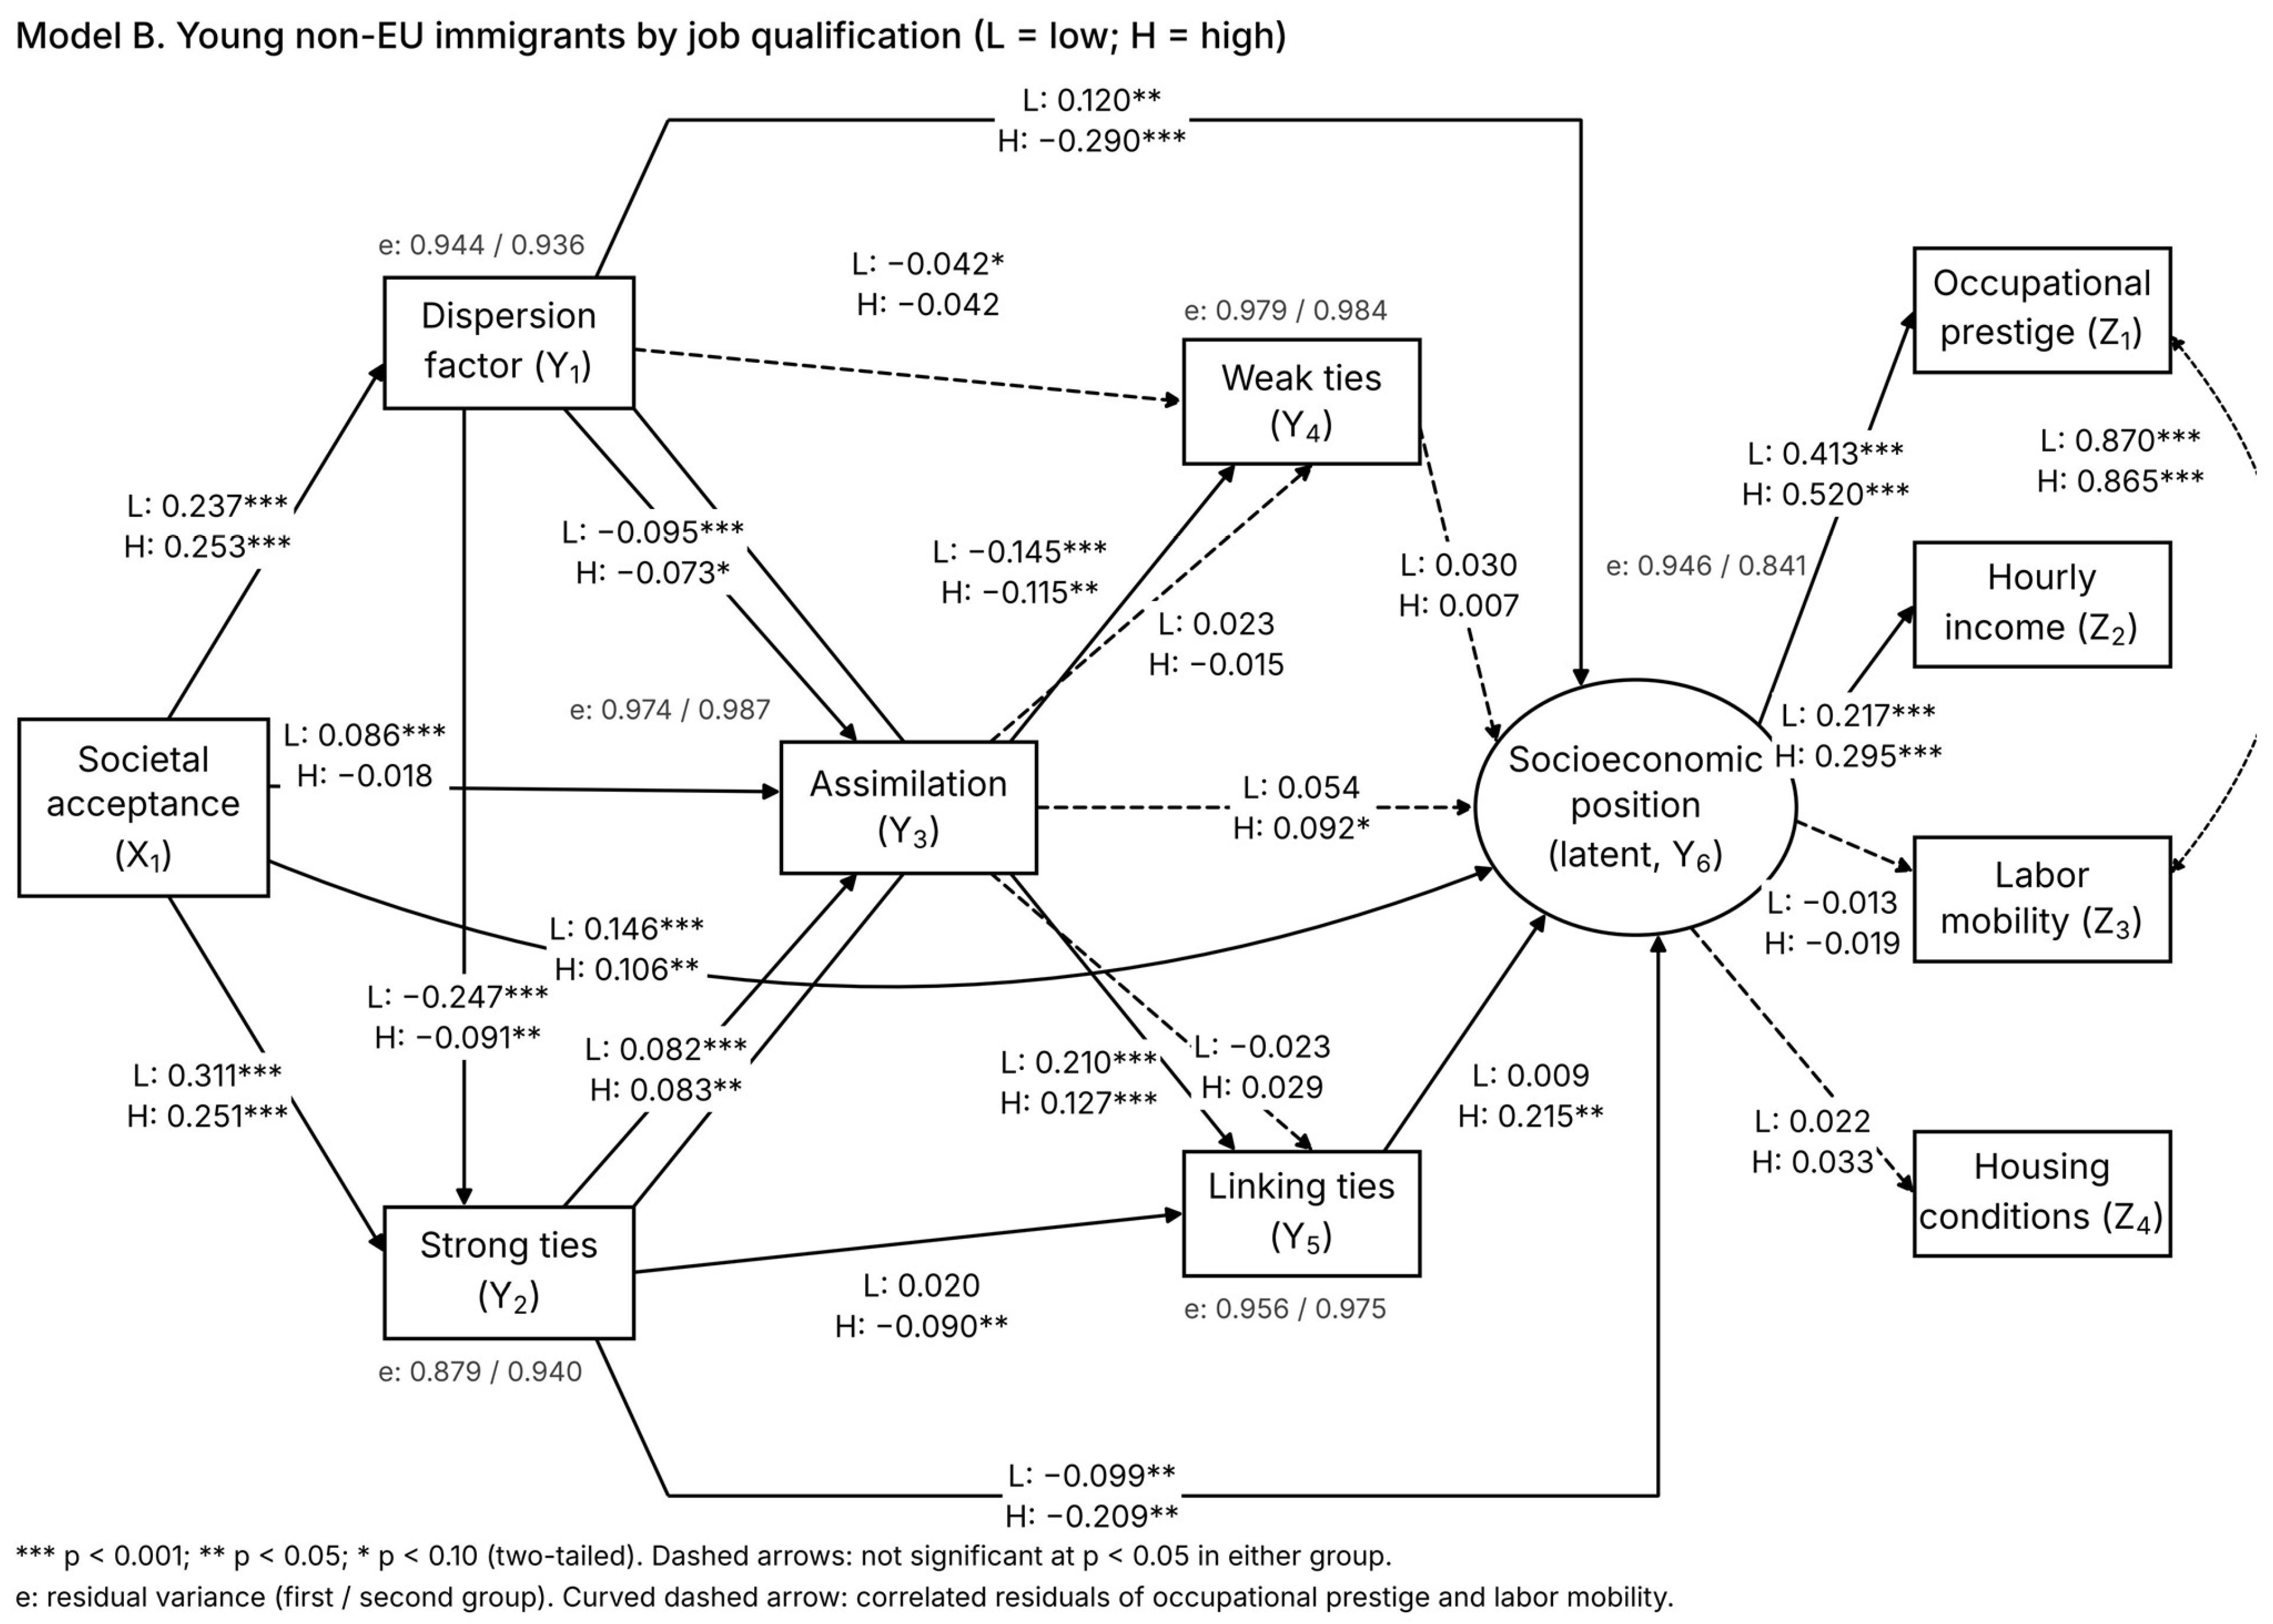

Disclaimer/Publisher’s Note: The statements, opinions and data contained in all publications are solely those of the individual author(s) and contributor(s) and not of MDPI and/or the editor(s). MDPI and/or the editor(s) disclaim responsibility for any injury to people or property resulting from any ideas, methods, instructions or products referred to in the content. |
© 2026 by the authors. Licensee MDPI, Basel, Switzerland. This article is an open access article distributed under the terms and conditions of the Creative Commons Attribution (CC BY) license.