


Abstract
Noise in industrial buildings affects workers’ productivity and can seriously impair their physical and mental health, yet existing studies often overlook workers’ subjective perceptions and rely on a single method. Therefore, this study recruited 263 workers from four industrial buildings in Beijing and adopted a mixed-methods approach. First, 30 semi-structured interviews were analyzed using grounded theory’s three-level coding procedure to construct a conceptual framework of a healthy acoustic environment and its influencing factors. Next, a 30-item subjective questionnaire was developed, and structural equation modeling was conducted on 256 valid responses. Finally, Spearman correlation analysis and multidimensional scaling were used to examine relationships between subjective evaluations and eight physical and psychoacoustic indicators. The results identified nine major dimensions, including Sound Source Localization, Physiological Effects at Work, and Regulatory Control, as well as 15 relational pathways. Compared with existing frameworks, Communication Barrier emerged as a more prominent dimension in industrial building contexts. Structural equation modeling confirmed that 12 pathways were statistically significant. Correlation analysis further showed that only a few objective–subjective associations were significant, indicating that objective acoustic indicators alone cannot explain workers’ multidimensional perceptions. In conclusion, this study developed an evaluation model for healthy acoustic environments in industrial buildings, highlighting the need to emphasize controllability, communication support, and integrated subjective–objective evaluation in acoustic design to better enhance workers’ well-being.
1. Introduction
Noise, as a pervasive environmental stressor, significantly affects human health and overall quality of life. In the fields of architecture and urban studies, the impacts of noise pollution vary across building typologies, primarily manifesting as potential disturbances to occupants’ health, comfort, and work efficiency [1,2,3,4]. For example, Jeon et al. [3] conducted in-home surveys and laboratory-based listening experiments to assess residents’ annoyance responses to various sounds, and found that impact noise from floor slabs had the greatest effect on residential satisfaction. Baloye and Palamuleni [5] measured environmental noise levels across several Nigerian cities using sound level meters and reported that 79% of sampling locations exceeded regulatory limits, with traffic and commercial areas accounting for the highest proportions. Such noise pollution poses substantial threats to residents’ health, sleep quality, and work efficiency.
In addition, an increasing number of studies have focused on the acoustic environment of industrial buildings [6,7,8], where noise generated during production processes adversely affects workers’ physical health. Compared with other built environments, industrial workshops are typically characterized by higher noise intensity and longer exposure durations [9], rendering workers a particularly vulnerable population to noise exposure. Extensive evidence indicates that long-term noise exposure results in cumulative adverse effects [10]. It not only induces pronounced negative emotions, such as irritability and distress [11], but may also lead to a range of physiological disorders, including hearing loss [12], cardiovascular diseases [13], sleep disturbances [14], and depression [15], thereby disrupting normal work performance and overall health [16]. As concerns regarding noise pollution in industrial buildings continue to grow [17,18,19,20,21], related policies have been progressively introduced to promote hearing conservation and prevent noise-induced hearing loss and other adverse health outcomes [22]. However, workers’ subjective evaluations and perceptions of noise within a healthy work environment may not align with the criteria specified in these standards [23]. Even when noise-reduction measures are implemented, they do not necessarily translate into measurable improvements in workers’ health status [24]. Previous studies suggest that research on acoustic environments should move beyond the traditional paradigm of purely physical measurements and adopt a multidimensional and integrative analytical framework [25]. To address this limitation, qualitative approaches have been increasingly adopted in architectural research [26,27]. Moreover, mixed-methods designs and investigations into the relationships between objective acoustic indicators and subjective perceptions have gradually been introduced across various building contexts [28,29].
Grounded theory, as a qualitative research method, is fundamentally focused on inductively generating and constructing theory from empirical data, rather than relying on pre-established theoretical frameworks [30]. In the field of architecture, it offers new perspectives and approaches to address complex design, construction, and management challenges. By generating theory from empirical data, grounded theory bridges grand theories and micro-level narratives. This approach helps to highlight the local characteristics of research phenomena and fosters the development of discipline-independent knowledge systems [31]. In previous studies, grounded theory has been applied to various building types, including residential buildings [29], commercial office buildings [32], and health and wellness architecture [33]. In industrial architecture, there are also studies that apply grounded theory. For example, Monteiro et al. [34] conducted interviews with workers from multiple footwear manufacturing companies in Portugal. After data coding, they developed a three-stage dynamic capability reconstruction model, which offers a roadmap for small and medium-sized enterprises following the loss of cost advantages. Han et al. [35] used grounded theory to conduct in-depth interviews with relevant personnel in the Ningbo region. They identified three conflict scenarios and seven specific types of conflict related to industrial building renovation, developing a theoretical model that provides foundational support for subsequent renovations in industrial architecture.
Conclusions derived from qualitative approaches such as grounded theory can be further examined and validated through quantitative methods. Such a mixed-methods approach strengthens the integration between qualitative insights and quantitative validation. In the quantitative phase, statistical data processing and the construction of a structural equation model can be employed for empirical verification. Structural equation modeling, as a powerful multivariate statistical technique, has been increasingly applied in architectural research. It enables the simultaneous visualization and verification of multiple complex relationships and has demonstrated substantial applications in building management, design processes, user satisfaction, and environmental perception [36,37,38]. Alam et al. [39] employed structural equation modelling to examine the impact of library service quality on user satisfaction in Bangladesh. By decomposing service quality into five dimensions and estimating path coefficients, they found that resources, staff competence, service attitude, and tangible facilities significantly influenced user satisfaction. This study expanded the investigation of structural relationships between service quality and user satisfaction in library buildings. In the context of industrial buildings, the flexibility of structural equation modelling enables the exploration and evaluation of complex interrelationships involving sustainability, energy efficiency, construction management, and safety- and health-related factors [40,41]. For instance, Heravi et al. [42] developed structural equation models for petrochemical industrial plants across three life-cycle stages, reducing the dataset to 19 key indicators. Their results demonstrated that different dominant dimensions should guide decision-making at different life-cycle phases, thereby providing a more comprehensive design framework for such facilities throughout their entire life cycle.
Data used in structural equation modeling are typically derived from subjective questionnaires. Although statistically supported, such data ultimately reflect the individual judgements of different workers. In contrast, parameters such as indoor temperature, humidity, sound level, and illuminance are objectively measurable physical variables. These physical factors are intrinsically linked to workers’ subjective perceptions. In architectural research, the interaction between subjective and objective factors constitutes a critical line of inquiry, addressing the complex relationships between the physical properties of built environments and human perceptual experiences. Although subjective and objective dimensions are inseparable in real-life contexts, they are often treated as opposing approaches in evaluation frameworks [43]. Architects frequently rely on professional analytical methods in architectural design, structural optimization, and green building strategies; however, such approaches may overlook users’ subjective experiences [44]. For example, Li et al. [45] conducted experiments in open-plan offices and examined the effects of informational interventions on occupants’ perceptions of the thermal environment. The results revealed discrepancies between subjective sensations and measured physical parameters, indicating that psychological factors influence individuals’ perception of physical conditions and contribute to divergences between subjective and objective assessments. Similarly, in a study of concert halls, Giménez et al. [28] compared responses from 1284 audience members across 28 questionnaire items with 18 acoustic indicators. Substantial discrepancies were identified between subjective evaluations and objective acoustic measures. Multidimensional scaling analysis further confirmed the divergence, suggesting that the perceived pleasantness of sound is only weakly correlated with its physical acoustic properties.
In summary, noise has a significant impact on industrial buildings and the health-related working environment of employees; however, existing studies have paid insufficient attention to workers’ subjective perceptions in industrial building contexts. Existing qualitative studies on subjective perceptions of acoustic environments have mainly focused on urban building types such as residential buildings, commercial office buildings, healthcare facilities, and schools [32,33,46]. In contrast, research on industrial buildings has predominantly focused on development directions [34] and renovation processes [35], with relatively limited discussion of the acoustic environment itself and workers’ subjective experiences. In quantitative research, structural equation modeling has been applied in fields such as architectural design [47] and building management [39]; however, studies addressing the physical environment of industrial buildings—particularly the mechanisms of acoustic environment influence—remain insufficient. Regarding the relationship between subjective and objective factors, existing studies have explored the associations between subjective evaluations and objective indicators in buildings such as offices [45] and concert halls [28], yet similar analyses for industrial buildings remain scarce. Furthermore, although Chen et al. [29] developed an evaluation model for the acoustic environment of residential buildings based on grounded theory and structural equation modeling, their study did not rely on sufficiently comprehensive face-to-face interviews, nor did it integrate building physical measurements into a combined analysis. Therefore, systematic research on workers’ subjective perceptions in industrial buildings, their influencing pathways, and their relationships with objective acoustic indicators remains to be further developed. Based on the current state of research, although existing studies provide an important foundation for investigating architectural acoustic environments, they are still insufficient to comprehensively reveal workers’ actual experiences of the acoustic environment in industrial buildings and the mechanisms underlying these experiences.
Therefore, in response to the aforementioned issues, this study is grounded in field experiments and employs on-site measurements, semi-structured interviews, scale-based assessments, and statistical data analysis to explore the influencing factors, conceptual framework, and evaluation model of healthy environment assessment in industrial buildings. Furthermore, it analyses the correlations between objectively measured physical parameters and workers’ subjective perceptions within industrial building environments. Specifically, the primary research questions of this study are as follows:
Q1: Based on grounded theory, what are the influencing factors of a healthy acoustic environment in industrial buildings?
Q2: Using structural equation modeling, what are the quantitative relationships among the influencing factors of a healthy acoustic environment in industrial buildings?
Q3: What are the correlations between physical noise indicators, psychological indicators, and workers’ subjective perceptions?
2. Materials and Methods
This study consists of two main components: qualitative and quantitative research. The experimental procedure and data analysis process are described as follows:
1. To explore the constituent elements and theoretical framework of the acoustic environment in industrial workshops, semi-structured interviews were conducted with workers in the workshop. The interview data were coded and interpreted using grounded theory, ultimately resulting in the development of a grounded theoretical model.
2. Based on the key elements identified from the semi-structured interviews, a questionnaire was designed. The collected survey data were analyzed using structural equation modeling to verify the strength of the relationships among variables, leading to the establishment of an evaluation model for a healthy acoustic environment in industrial buildings.
3. During a complete experimental workflow performed by the workers, four physical acoustic indicators and four psychoacoustic indicators were recorded in the workshop. These indicators were matched correspondingly with the questionnaire items, enabling analysis of the strength of correlations between objective measurements and subjective survey responses. The overall research procedure is illustrated in Figure 1.
Figure 1.
Research Flowchart.
2.1. Grounded Theory Analysis (Qualitative Research)
2.1.1. Participants
In grounded theory research, purposive sampling [48] was adopted to ensure the collection of rich and in-depth information from interview participants. The qualitative component of this study was conducted through face-to-face interviews with workers employed in four industrial buildings in Beijing. The interview content was transcribed and documented in written form. A total of 30 participants (18 males and 12 females) were interviewed. Their ages ranged from 23 to 65 years (mean = 45.37 years, standard deviation = 11.26 years), covering various job types, working durations, and years of employment within the workshop. Detailed demographic information of the participants is presented in Table 1. The interviews were conducted between September and October 2025, with each session lasting between 20 and 45 min.
Table 1.
Demographic Information of Semi-Structured Interview Participants (n = 30).
2.1.2. Interview Guide Design
Based on existing interview guidelines, established scales [29,46,49,50], and relevant standards, several items were adapted through translation and contextual modification. An interview guide was then developed covering personal demographic information and six dimensions of the acoustic environment. The detailed structure of the interview guide is presented in Table 2.
Table 2.
Interview Outline.
2.1.3. Interview Procedure
Semi-structured interviews were employed as the primary data collection method for the grounded theory analysis. The interview content was structured in accordance with Table 2. The interviews began with the collection of participants’ personal information, followed by questions addressing six aspects: sound source identification, spatial relationships, emotional responses, perceived control, ideal soundscape assumptions, and the influence on health-related behaviors. Participants’ responses were transcribed and documented in written form. All participants provided oral consent to participate in the experiment.
2.1.4. Interview Data Analysis
During the data collection and organization stage, when no new information could be obtained from additional interviewees, theoretical saturation was considered to have been reached, and the current phase of the study could be concluded. In this study, theoretical saturation was achieved after the 22nd interview. Subsequently, eight additional participants were interviewed, and no new terms or insights emerged, confirming that the interview process could be formally concluded [51].
The interview data were analyzed using NVivo 15 (Developer: Lumivero; Location: Denver, CO, USA) software and processed through the three-stage coding procedure of grounded theory. First, open coding was conducted to conceptualize, categorize, and label the interview content. Second, axial coding was performed to identify relationships among the previously generated codes and to establish connections between primary and secondary categories. Finally, selective coding was undertaken to integrate the core categories relevant to this study, thereby constructing a comprehensive conceptual framework.
The above coding process was independently conducted by two researchers specializing in architecture to minimize the influence of subjective judgment from a single researcher on the coding results [52]. For items with discrepancies in the initial coding, the researchers carried out item-by-item discussions and repeated comparisons until a consensus was reached. Categories that still allowed for interpretative ambiguity were further reviewed in consultation with an expert panel. Finally, triangulation was employed to further enhance the accuracy and reliability of the coding results [53].
2.2. Structural Equation Modeling Analysis (Quantitative Research)
2.2.1. Participants
In this phase, workers from four industrial buildings located in Beijing were recruited as participants. The experiment was conducted from October 2025 to March 2026, during which a questionnaire survey entitled “Evaluation of the Workshop Acoustic Environment” was administered to the participants. Throughout the experiment, the workers remained inside the industrial building and were continuously exposed to an enclosed environment. A total of 263 individuals participated in the survey. Among the returned questionnaires, 256 were valid and 7 were excluded due to incomplete responses or missing physical indicator records. Consequently, 256 valid questionnaires were included in the subsequent data analysis. The sample size met the minimum requirements for structural equation modeling [54]. Detailed demographic information of the participants is presented in Table 3.
Table 3.
Demographic Information of Subjective Questionnaire (n = 256).
2.2.2. Questionnaire Design
The subjective questionnaire comprised ten sections. The first section collected demographic information, whereas the remaining nine sections were structured according to the conceptual framework derived from grounded theory analysis. These nine elements included Sound Source Localization, Physiological Effects at Work, Communication Barrier, Regulatory Control, Negative Emotions, Passively Accept, Active Regulation, Fatigue Accumulation after Work, and Healthy Acoustic Environments. Each section contained three to four items, yielding a total of 30 questions. The number of items per construct met the minimum requirements for structural equation modeling analysis [55]. All items were rated on a five-point Likert scale, ranging from 1 (“strongly disagree”) to 5 (“strongly agree”). The questionnaire items were primarily developed with reference to ISO soundscape indicators [56] and previous studies [50,57,58]. The original items were translated and adapted to ensure their suitability for the experimental participants and setting of the present study. The detailed outline of the questionnaire items is presented in Table 4.
Table 4.
Items of Each Factor in the Subjective Questionnaire.
2.2.3. Experimental Setup
In each experimental session, participants were measured under actual workshop acoustic conditions, with each measurement lasting no less than 5 min to meet the minimum time requirement [56]. In this study, the average duration of a single experimental session was 15–20 min. Since workers are already exposed to continuous noise in their daily work, excessively long experimental sessions may increase fatigue and affect the accuracy of subjective evaluations. Therefore, under the premise of meeting standard requirements, the duration of each session was controlled within 30 min.
2.2.4. Data Analysis
The data were analyzed using Amos 31 (Developer: IBM SPSS; Location: Armonk, NY, USA). Reliability analysis was first conducted, followed by exploratory factor analysis (EFA) and confirmatory factor analysis (CFA). Subsequently, a structural equation modeling framework was constructed. Given that the data were non-normally distributed, the analysis was performed using maximum likelihood estimation with robust standard errors.
2.3. Subjective–Objective Correlation Analysis (Quantitative Research)
2.3.1. Participants
In this phase, workers from four industrial buildings located in Beijing were recruited as participants. Physical measurements were carried out concurrently with the administration of the “Evaluation of the Workshop Acoustic Environment” questionnaire.
2.3.2. Experimental Design
During a single work shift, each participant was equipped with a HEAD SQobold recorder(Developer: HEAD acoustics GmbH; Location: Herzogenrath, Germany) to measure four psychoacoustic parameters: loudness, sharpness, roughness, and fluctuation strength. Simultaneously, an SC260 sound level meter(Developer: CESVA; Location: Barcelona, Spain) was used to record four physical acoustic indicators: LAeq, LAmax, LAmin, and low-frequency noise (LCeq-LAeq). In this study, the SC260 sound level meter was operated under A-weighting and Fast time-weighting conditions. Each sound pressure level reading represents a time-weighted value with a 125 ms time constant, while LAmax and LAmin denote the maximum and minimum values, respectively, of the time-weighted sound level series during the measurement period. LAeq represents the equivalent continuous sound level over the measurement period, while LCeq-LAeq is used to characterize low-frequency noise predominantly generated by machinery operation, structural vibration, or aerodynamic processes in industrial building environments, expressed as the difference between C-weighted and A-weighted sound pressure levels. All measurement devices were activated before the experiment and stopped after its completion, ensuring that all acoustic parameters were synchronously collected within the same time window. The duration of each experimental session was determined based on the work shift and the specific workflow of the workers; however, all measurements exceeded 5 min, satisfying the minimum duration requirement [56]. In this study, the measurement duration for these physical indicators ranged from 15 to 20 min for each trial.
The experiments in this phase were conducted in four selected industrial buildings. By comprehensively considering the workshop spatial layout and personnel distribution characteristics, a total of 90 measurement points were established. Each measurement point corresponds to a group of workers within its surrounding operational area, and the collected acoustic data reflect the actual noise exposure of individuals in that area. A total of 256 valid datasets and questionnaires were ultimately obtained, and a one-to-one correspondence between spatial measurement points and individual samples was established, enabling an effective linkage between subjective evaluations and objective acoustic parameters. The specific locations of the measurement points are shown in Figure 2.
Figure 2.
Distribution of Measurement Points.
2.3.3. Data Analysis
Raw audio files were recorded using the HEAD SQobold device and subsequently analyzed with ArtemiS SUITE 17.0 (Developer: HEAD acoustics GmbH; Location: Herzogenrath, Germany). The mean values of four psychoacoustic parameters—Loudness, Sharpness, Roughness, and Fluctuation Strength—were calculated. An SC260 sound level meter was used to measure four physical acoustic parameters: LAeq, LAmax, LAmin, and LCeq-LAeq. These eight parameters have been demonstrated in previous studies to effectively characterize the relationship between acoustic features and the degree of subjective disturbance [59]. The measurement results for the physical indicators are presented in Figure 3.
Figure 3.
Statistical Analysis of Acoustic Indicators.
The maximum, minimum, and average sound pressure levels directly reflect the intensity of noise and its temporal variations. ISO standards consider occupational noise exposure levels and peak sound pressure as fundamental risk parameters [60]. Workers’ subjective responses to noise depend on various acoustic characteristics, such as exposure duration and sound pressure level [61]. Beat et al. [62] found that variations in sound pressure level can influence individuals’ subjective perceptions. Prashanth et al. [63] reported that low-frequency noise can affect workers’ psychological perceptions. Shehap et al. [64] demonstrated that even when complying with conventional standards, low-frequency noise can still cause significant annoyance, fatigue, headaches, ear pressure, and reduced concentration among employees, thereby severely impairing work performance and health. Moreover, traditional A-weighted assessments are insufficient to capture the hazards of low-frequency noise. Therefore, in addition to sound pressure level, the measurement of LCeq-LAeq is necessary to comprehensively characterize the physical properties of noise in industrial buildings. A systematic review by Engel et al. [65] found that five psychoacoustic indicators—loudness, sharpness, roughness, fluctuation strength, and tonality—were the most frequently used in 46 soundscape studies over the past decade. Therefore, both physical acoustic indicators and psychoacoustic indicators are essential for acoustic evaluation [66]. The eight indicators selected in this study can comprehensively reflect the intensity, frequency spectrum, and sound quality characteristics of noise in industrial buildings. Considering that tonality is more discriminative for noise with prominent tonal components, it was not treated as a primary analysis indicator in this study. Overall, the eight physical indicators selected in this study can effectively represent the fundamental characteristics of the acoustic environment in industrial buildings.
Statistical analyses were conducted using SPSS 31 (Developer: IBM; Location: Armonk, NY, USA). Correlation analyses were performed between the subjective questionnaire items presented in Table 4 and the eight objective acoustic parameters. As some variables did not follow a normal distribution, Spearman’s rank correlation was applied. Furthermore, a heatmap and a multidimensional scaling distance model were constructed to further assess the strength and structure of the associations between subjective and objective measures.
3. Results
3.1. Composition of Healthy Acoustic Environments Elements and Conceptual Framework—In Response to Q1
Through grounded theory coding, this study identified nine core elements influencing a healthy acoustic environment: Sound Source Localization, Physiological Effects at Work, Communication Barrier, Regulatory Control, Negative Emotions, Passively Accept, Active Regulation, Fatigue Accumulation after Work, and Healthy Acoustic Environments. An illustrative example of the coding and construction process is presented in Table 5.
Table 5.
Example of Partial Coding Process.
3.1.1. Element Composition
Based on their classification, the nine core elements can be divided into three major categories: Influencing Factors, Behavioral Measures, and Results. The category of Influencing Factors includes four element types: Sound Source Localization, Physiological Effects at Work, Communication Barrier, and Regulatory Control. The category of Behavioral Measures comprises Negative Emotions, Passively Accept, Active Regulation, and Fatigue Accumulation after Work. The category of Results consists of a single element: Healthy Acoustic Environments.
Specifically, Influencing Factors refer to a set of variables that act on individuals within the current acoustic environment and regulate or drive their emotional, physiological, and behavioral responses. These factors constitute the antecedent conditions that give rise to behavioral measures. Behavioral Measures denote the emotional, cognitive, and behavioral responses exhibited by individuals as they cope with or adapt to acoustic environmental stressors. Results refer to the final manifestations of individuals’ psychological and physiological changes under the prevailing acoustic environment.
The specific definitions of the nine core elements are provided below.
1. Sound Source Localization refers to workers’ perception of sound-related characteristics, such as sound intensity and sensitivity, which subsequently elicit emotional responses to the acoustic environment.
2. Physiological Effects at Work denote the persistent physiological impacts experienced during working hours as a result of noise exposure.
3. Communication Barrier describes situations in which environmental sounds reduce communication efficiency or cause difficulties in interpersonal communication among workers.
4. Regulatory Control refers to workers’ ability or subjective willingness to regulate or control environmental sounds through personal capacity or intentional actions.
5. Negative Emotions encompass adverse emotional responses such as irritability, anxiety, and fright that arise as primary reactions to the acoustic environment.
6. Passively Accept characterizes situations in which workers are unable to alter the sound environment and are therefore compelled to remain exposed to the existing noise conditions.
7. Active Regulation refers to workers’ attempts to modify the current noise environment by adopting shielding measures or using protective devices, thereby reducing the detrimental effects of noise on their hearing.
8. Fatigue Accumulation after Work denotes the residual physiological discomfort caused by noise exposure after working hours, leading to impairments in both physical capacity and mental state.
9. Healthy Acoustic Environments represents an overall evaluation of workers’ job efficiency, task accuracy, and satisfaction with the working environment.
In the interviews, Sound Source Localization, Physiological Effects at Work, and Regulatory Control were primarily associated with Negative Emotions. Representative interview excerpts are presented below.
P01: Prolonged exposure to this kind of noisy machine vibration makes me feel quite irritable.
P16: Sometimes the air pump malfunctions and releases air suddenly, which startles me. It can be quite frightening and makes me feel very uncomfortable.
In the interviews, Sound Source Localization, Physiological Effects at Work, Communication Barrier, and Regulatory Control were associated with Passively Accept. Selected interview excerpts are as follows.
P28: Communication is not very convenient, but there is nothing we can do. Once the equipment is turned on, it cannot be stopped. The environment is quite noisy, and it is not something we can change just because we want to.
P06: Sometimes I cannot hear clearly because the noise is too loud. In addition, I am relatively old, so younger coworkers have to speak close to my ear for me to hear them. There is really no other option.
In the interviews, Sound Source Localization and Regulatory Control were associated with Active Regulation. A representative excerpt is provided below.
P12: When the noise becomes relatively loud, I can open the window, and it feels like the sound around me becomes somewhat quieter.
In the interviews, Physiological Effects at Work and Regulatory Control were associated with Fatigue Accumulation after Work. Representative excerpts include.
P26: After leaving the workshop, there is still a buzzing sound in my ears, and sometimes I even feel ear pain. This mainly occurs shortly after finishing work.
P14: At night, my mind is filled with the sounds of the workshop, and as a result, I do not sleep very well.
3.1.2. Construction of the Conceptual Framework
Through an analysis of the relationships among the identified elements, a conceptual framework model was developed, as illustrated in Figure 4. According to the model, Sound Source Localization, Physiological Effects at Work, Communication Barrier, and Regulatory Control constitute the fundamental factors influencing the Healthy Acoustic Environments. In contrast, Negative Emotions, Passively Accept, Active Regulation, and Fatigue Accumulation after Work represent the behavioral measures through which this result is shaped. The specific influence pathways are described as follows.
Figure 4.
Conceptual Framework Model of Healthy Acoustic Environments.
1. Sound Source Localization—Negative Emotions—Healthy Acoustic Environments: Loud or sudden noises cause discomfort, leading workers to experience irritability and other negative emotions, which ultimately affect their work performance.
2. Sound Source Localization—Passively Accept—Healthy Acoustic Environments: Workers continue to operate in the existing noisy environment without any shielding measures and are forced to remain exposed, which intensifies auditory fatigue and irritability, thereby reducing environmental comfort.
3. Sound Source Localization—Active Regulation—Healthy Acoustic Environments: While working in a noisy environment, workers adopt certain measures to regulate noise, thereby reducing the harmful effects of noise exposure.
4. Physiological Effects at Work—Negative Emotions—Healthy Acoustic Environments: Symptoms such as tinnitus and a sensation of ear pressure during working hours lead to decreased concentration and emotional discomfort, ultimately impairing work efficiency.
5. Physiological Effects at Work—Passively Accept—Healthy Acoustic Environments: Continuous exposure to noise during work without available mitigation or adjustment options forces workers to endure the conditions, resulting in a decline in the overall quality of the work environment.
6. Physiological Effects at Work—Fatigue Accumulation after Work—Healthy Acoustic Environments: Prolonged exposure to noise during working hours continues to affect workers’ physical condition even during non-working time, leading to a decline in overall health status.
7. Communication Barrier—Negative Emotions—Healthy Acoustic Environments: Noise-induced communication difficulties require workers to speak loudly or repeatedly, which leads to irritability or anxiety and may cause work errors or reduced efficiency.
8. Communication Barrier—Passively Accept—Healthy Acoustic Environments: Although noise causes communication difficulties, the lack of effective solutions forces workers to speak loudly, which, over prolonged periods, adversely affects physical health.
9. Communication Barrier—Fatigue Accumulation after Work—Healthy Acoustic Environments: Frequent shouting and repeated verbal communication result in fatigue, accelerate physical exhaustion, and hinder full recovery after work, thereby reducing sustained work capacity.
10. Regulatory Control—Passively Accept—Healthy Acoustic Environments: When workers are unable to control their work environment, they are compelled to endure the conditions, leading to physical fatigue.
11. Regulatory Control—Active Regulation—Healthy Acoustic Environments: Workers attempt to shield or modify noise by using measures such as wearing headphones, opening windows, or adjusting equipment, thereby reducing noise levels and alleviating physical strain.
3.2. Evaluation of the Structural Equation Model—In Response to Q2
The qualitative relationships identified through the grounded theory analysis were further examined and validated using quantitative methods. Specifically, a structural equation model was employed to investigate the relationships among the key elements.
3.2.1. Data Validation
The questionnaire was divided into nine dimensions and subjected to the Kaiser–Meyer–Olkin (KMO) measure and Bartlett’s test of sphericity. The KMO value was 0.853 (KMO > 0.8), and Bartlett’s test of sphericity was significant (p = 0.000, p < 0.005), indicating that the data were suitable for factor analysis.
In structural equation model analysis, EFA and CFA are required [67]. EFA is used to identify the underlying structural characteristics of the measurement data, whereas CFA is employed to test the hypothesized relationships between observed variables and latent variables.
The EFA results indicated that the communalities of all factors exceeded 0.4, suggesting strong associations between the measurement items and their corresponding factors. The cumulative variance explained after rotation reached 71.044%, indicating satisfactory explanatory power. CFA was subsequently conducted. The Cronbach’s α coefficients for all nine dimensions were above 0.7, indicating good reliability. All standardized factor loadings exceeded 0.6, demonstrating adequate measurement relationships between the observed and latent variables. The composite reliability (CR) values were greater than 0.7 and the average variance extracted (AVE) values exceeded 0.5, confirming good convergent validity. The maximum shared variance (MSV) and average shared variance (ASV) were both lower than the corresponding AVE values, indicating satisfactory discriminant validity. Detailed results are presented in Table 6 and Table 7.
Table 6.
Exploratory Factor Analysis.
Table 7.
Confirmatory Factor Analysis.
3.2.2. Structural Equation Model Testing
After confirming that the above data met the required criteria, the structural equation model was tested. All model fit indices satisfied the recommended evaluation criteria, indicating a good level of model fit. Following linear regression analysis, the variance inflation factor (VIF) values for all variables were below 5, indicating no significant multicollinearity. The R2 value for Healthy Acoustic Environments was 0.421. Table 8 presents the model fit indices and their recommended thresholds, all of which fall within the acceptable ranges.
Table 8.
Model Fit Indices.
Based on the data analysis, the structural equation model was established, as illustrated in Figure 5, and the regression coefficients of each path in the model are reported in Table 9. According to the results of the structural equation model and the corresponding tables, 12 out of the 15 hypothesized paths were statistically significant (p < 0.05), indicating that most of the qualitative relationships derived from grounded theory were supported by quantitative evidence. Specifically, Sound Source Localization showed a significant positive relationship with Active Regulation (β = 0.374, p < 0.01), whereas its relationships with Negative Emotions and Passively Accept were not statistically significant (p > 0.05). This may be attributed to the fact that workers are more sensitive to controllable sound sources, while tending to ignore those whose intensity cannot be regulated. Physiological Effects at Work exhibited significant positive relationships with Negative Emotions (β = 0.317, p < 0.001) and Fatigue Accumulation after Work (β = 0.244, p = 0.003), while its effect on Passively Accept was not significant (p > 0.05). This may be attributed to the accumulation of negative emotions during the work process, which may persist beyond the end of the work shift. Communication Barrier showed significant positive relationships with Negative Emotions (β = 0.227, p = 0.008), Passively Accept (β = 0.278, p = 0.003), and Fatigue Accumulation after Work (β = 0.401, p < 0.001). This may be attributed to the fact that impaired communication tends to induce negative emotions, which are difficult to resolve and may persist beyond working hours. Regulatory Control was significantly and positively associated with Passively Accept (β = 0.301, p = 0.002) and Active Regulation (β = 0.356, p < 0.001). Negative Emotions, Passively Accept, Active Regulation, and Fatigue Accumulation after Work all showed significant positive effects on Healthy Acoustic Environments (p < 0.05).
Figure 5.
Structural Equation Model.
Table 9.
Quantitative Relationships between Elements in Structural Equation Modeling Paths.
The effects of different elements on the Healthy Acoustic Environments were evaluated, and the corresponding effect sizes are shown in Figure 6. Among these factors, Sound Source Localization exhibited the smallest effect size (0.116), whereas Communication Barrier showed the largest effect size (0.208). Physiological Effects at Work and Regulatory Control yielded effect sizes of 0.137 and 0.159, respectively. These results suggest that although the influencing factors demonstrated statistically significant relationships to varying extents, their effect sizes were not entirely equivalent. Specifically, Communication Barrier showed a relatively stronger overall effect than the other factors, whereas Sound Source Localization, Physiological Effects at Work, and Regulatory Control exhibited comparatively weaker overall effects.
Figure 6.
Comprehensive Effects of Various Elements on Healthy Acoustic Environments.
3.3. Analysis of Subjective–Objective Correlations—In Response to Q3
3.3.1. Spearman Correlation Heatmap Analysis
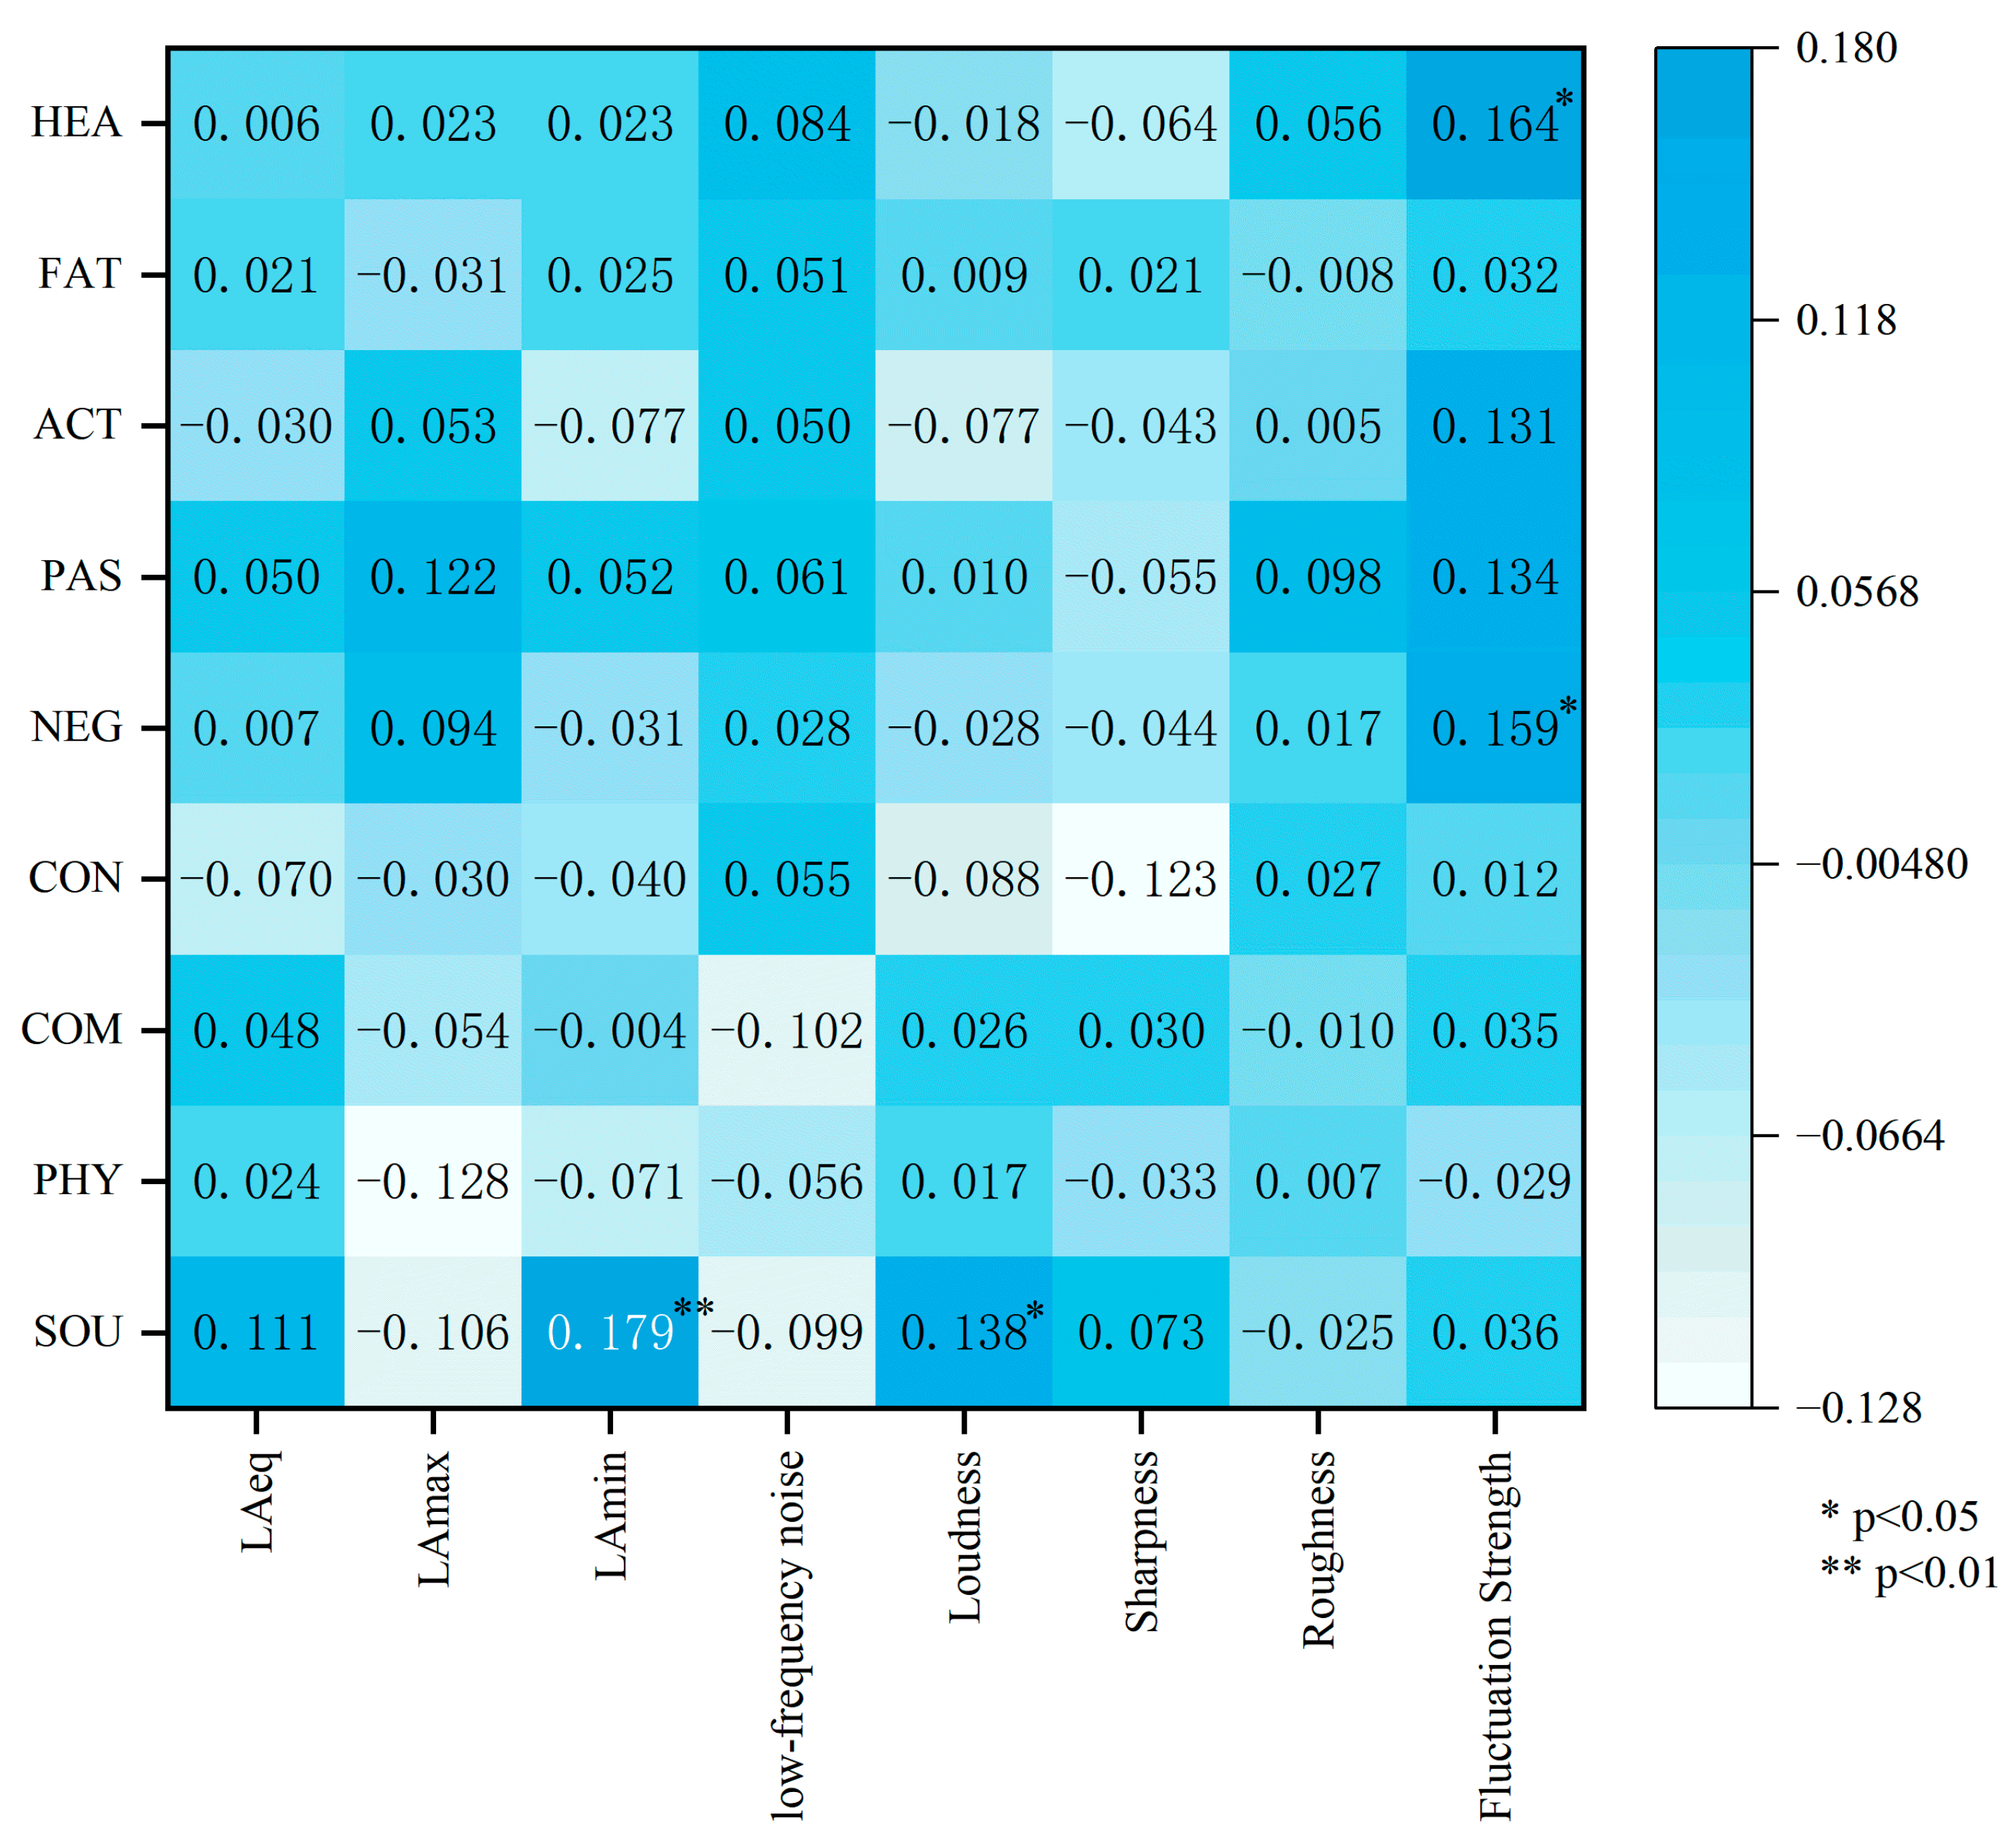
Based on Spearman correlation analysis, this study found that among the 72 relationships formed between nine subjective dimensions and eight objective acoustic indicators, 10 pairs were statistically significant, accounting for 13.9%. This result indicates that although there is a certain degree of association between objective acoustic indicators and workers’ subjective perceptions, the overall correlations remain relatively weak and are insufficient to independently explain workers’ multidimensional subjective experiences of the acoustic environment in industrial buildings. As shown in Figure 7 and Table 10, specifically:
(1) Roughness shows no significant correlation with any of the nine subjective indicators, indicating that it is not associated with workers’ subjective perceptions.
(2) SOU is significantly correlated with LAeq, LAmin, LCeq-LAeq, Loudness, and Sharpness, suggesting that the physical characteristics of sound directly influence workers’ recognition and evaluation of it.
(3) Fluctuation Strength shows significant correlations with NEG, ACT, and HEA, indicating that more pronounced Fluctuation Strength is associated with stronger negative emotions toward noise, a greater tendency for workers to actively seek ways to regulate it, and a more noticeable perceived impact on health.
(4) COM is significantly negatively correlated with LCeq-LAeq, indicating that more severe low-frequency noise pollution leads to greater difficulty in communication among workers.
(5) PAS shows a significant positive correlation with LAmax, suggesting that as noise becomes louder, workers are less able to control or change it and are more likely to passively accept it.
Table 10.
Spearman Correlation Analysis.
Figure 7.
Spearman Correlation Heatmap.
3.3.2. Multidimensional Scaling Analysis
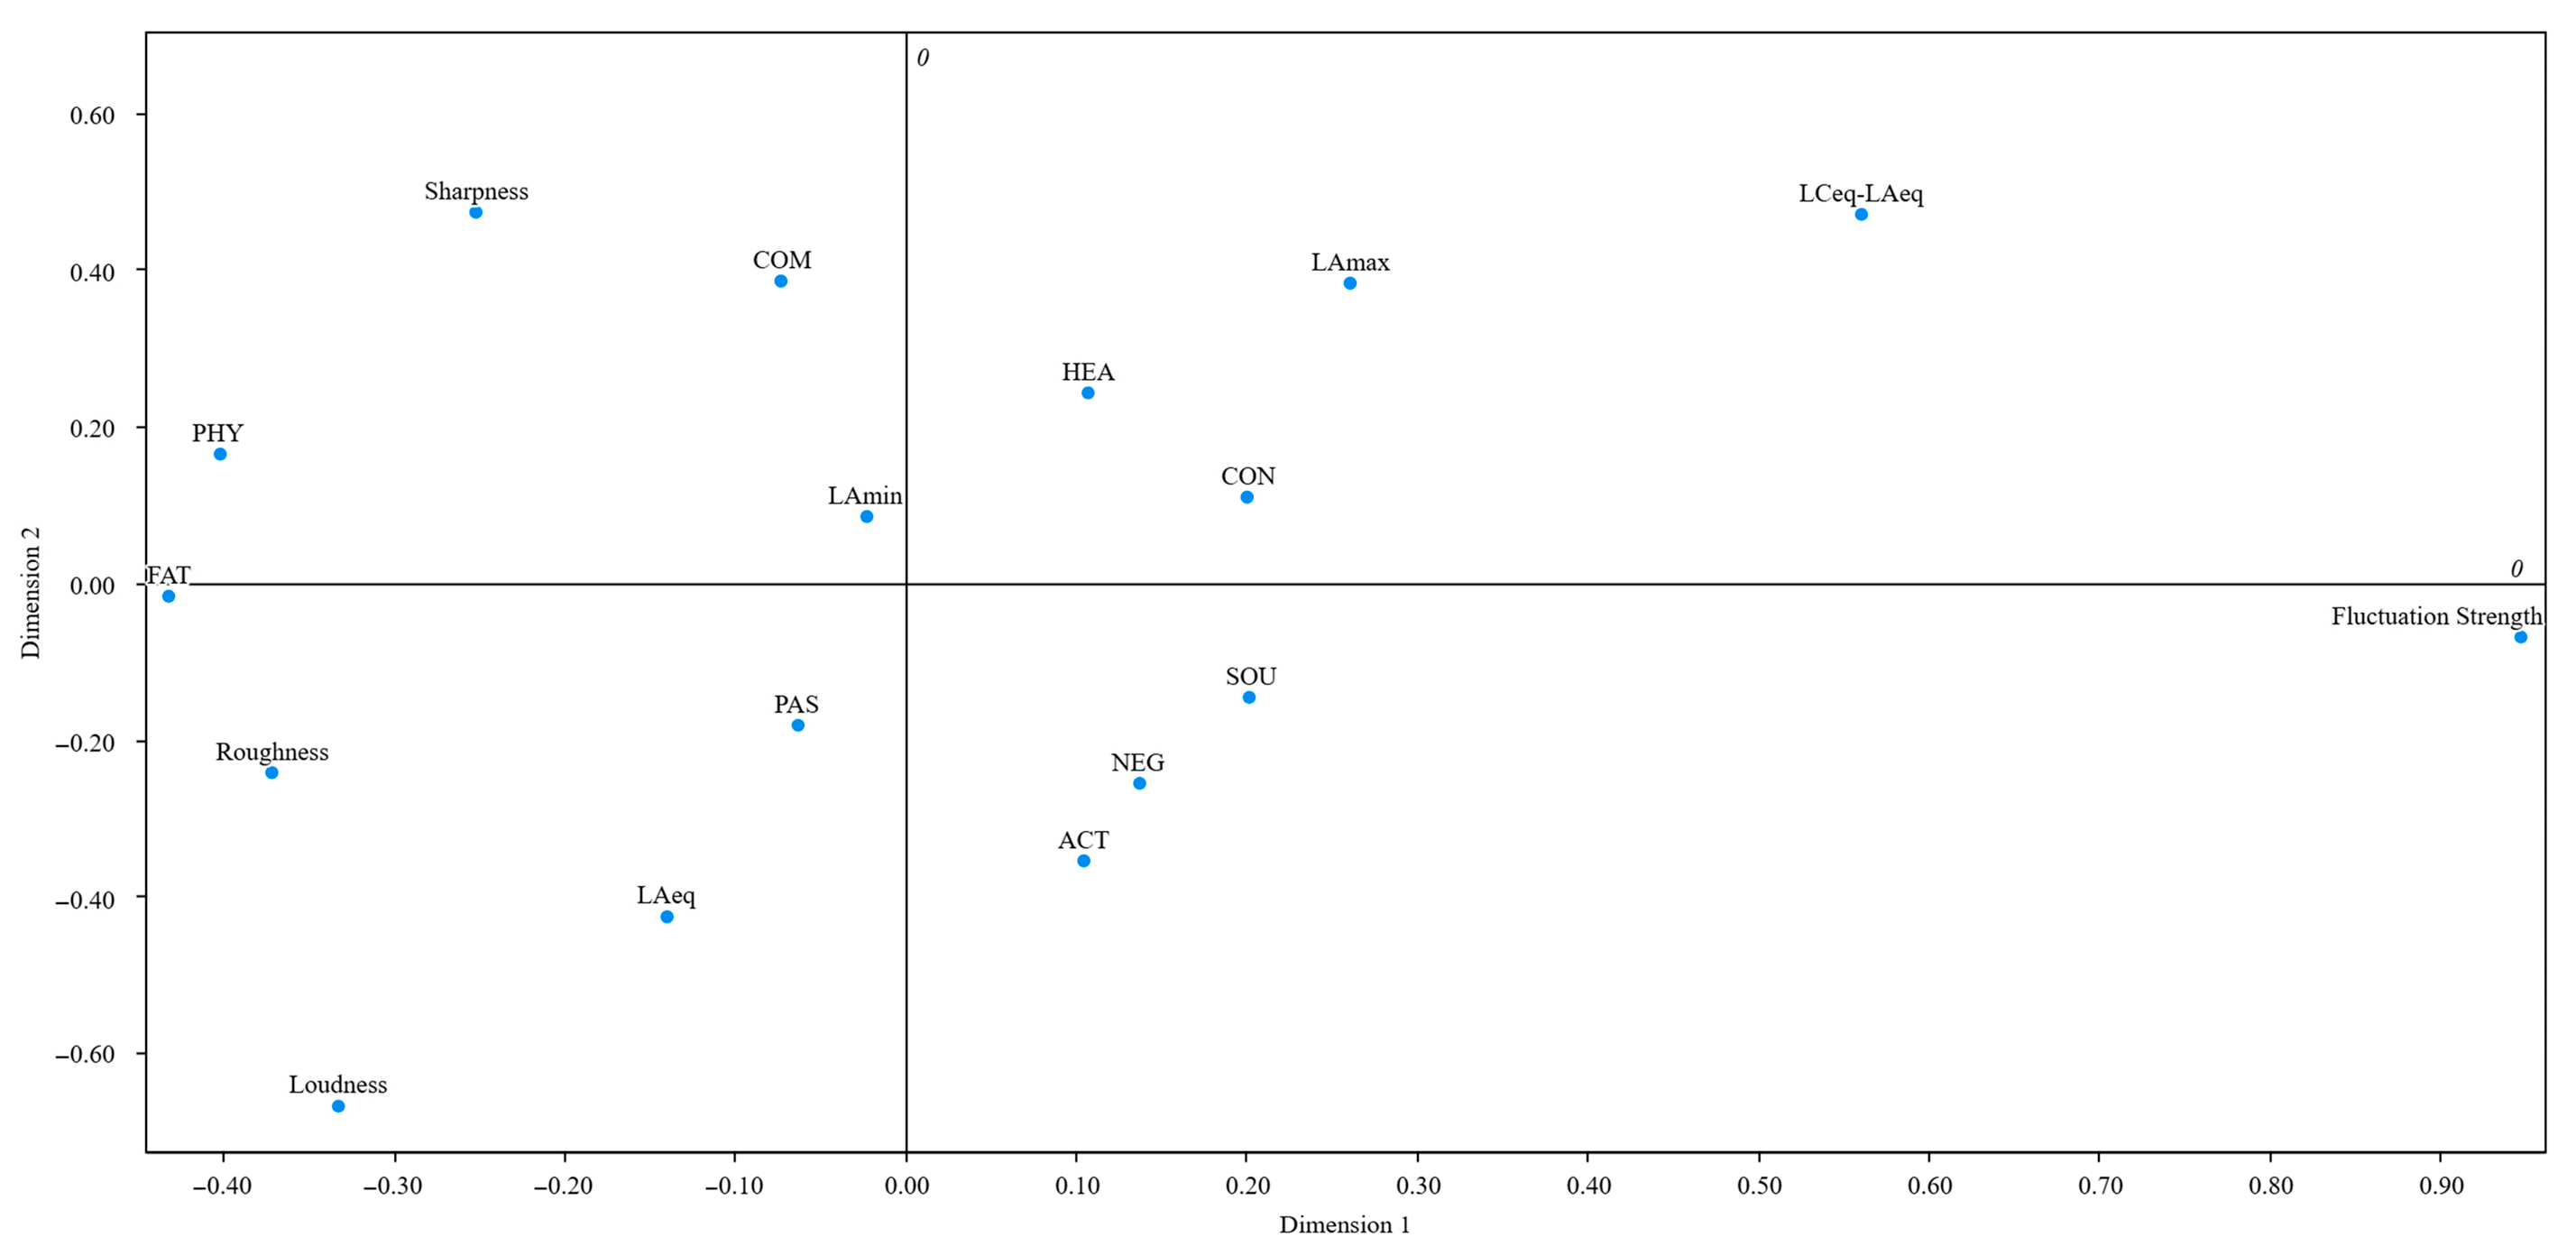
Multidimensional scaling analysis was conducted on the nine subjective dimensions and eight physical indicators using SPSS 31. The resulting Stress I value was 0.021, which is below the threshold of 0.05, indicating a good fit between the model and the observed data. Accordingly, a multidimensional scaling model was established, as shown in Figure 8, from which the following observations can be derived:
(1) The physical indicators of sound were primarily distributed in the first quadrant, whereas the psychological indicators of sound were mainly located in the third quadrant.
(2) LAmin and LAeq were positioned relatively close to the subjective indicators, suggesting that the minimum and equivalent sound pressure levels have relatively stronger associations with subjective perceptions.
(3) Fluctuation Strength exhibited a pronounced dimensional separation from other subjective indicators, indicating a substantial discrepancy between its perceived characteristics and subjective perceptions.
(4) No significant clustering was observed between objective physical indicators and any subjective perception dimensions, indicating generally weak associations between them.
(5) The objective physical indicators were distributed across extreme values on both dimensions, showing substantial dispersion and indicating large discrepancies between objective indicators and subjective perceptions.
Overall, although two physical indicators were located relatively close to certain psychological indicators, no clear clustering pattern was observed. The remaining objective physical indicators were more widely dispersed, suggesting that objective physical indicators do not form stable correlations with subjective indicators across the two dimensions.
Figure 8.
Multidimensional Scaling Model.
4. Discussion
4.1. Influencing Factors of the Acoustic Environment and the Conceptual Framework
Regarding Q1:
Through the three-stage coding process of grounded theory, this study developed a conceptual framework for a healthy acoustic environment in industrial buildings. The framework consists of nine core elements, which can be organized into three hierarchical levels: Influencing Factors, Behavioral Measures, and Result. Within this framework, four Influencing Factors activate four distinct Behavioral Measures, which collectively shape workers’ overall evaluation of the Healthy Acoustic Environments.
Regarding the influencing factors, four dimensions were identified: Sound Source Localization, Physiological Effects at Work, Communication Barrier, and Regulatory Control. This classification differs from the characteristics proposed by Chen et al. [29] for residential buildings. Further comparison with the characteristics of healthy indoor acoustic environments and the indoor emotional response model [68] revealed that the Regulatory Control dimension is conceptually similar to the sense of control in that model, whereas the other dimensions are not represented. Previous studies have proposed an overall conceptual framework for healthy acoustic environments applicable across multiple contexts [69]. However, this framework does not include dimensions such as Communication Barrier or Physiological Effects at Work. This further suggests that the assessment of healthy acoustic environments in industrial buildings should not simply rely on acoustic environment frameworks derived from residential or general indoor settings, but should instead be interpreted in the context of specific workplace conditions, including continuous mechanical noise, task-related collaboration, and operational constraints.
Although most dimensions showed inconsistencies across studies, the dimension of “control” has been consistently identified in multiple studies [29,68]. Controllability has been defined as a key mechanism explaining the negative health effects of noise exposure [70,71]. In the present study, Regulatory Control was associated with Active Regulation and Passively Accept, and subsequent analyses revealed significant paths, indicating that the Regulatory Control dimension is present in industrial buildings. In contrast to Chen et al. [29], who suggested that “controllability is a distinctive attribute of indoor acoustic environments in residential buildings,” control in industrial settings is primarily reflected in workers’ ability to make limited adjustments to noise within existing production constraints, rather than in the pursuit of quietness or comfort alone.
4.2. Effects of Sound Source Localization and Communication Barrier
Regarding Q2:
The qualitative findings indicated that Sound Source Localization was associated with Negative Emotions, Active Regulation, and Passive Acceptance. However, the quantitative analysis showed that its relationships with Negative Emotions and Passive Acceptance were not statistically significant. By contrast, more statistically significant pathways were observed for the dimension corresponding to Communication Barrier, which also exhibited the highest overall effect size.
From a general cognitive perspective, perception of sound sources would be expected to be a core factor influencing evaluations of the acoustic environment. However, in this study, two of the three paths associated with Sound Source Localization were not significant, and the corresponding effect sizes were the smallest. This discrepancy may be attributed to several factors. First, prolonged noise exposure may reduce workers’ ability to perceive sound sources. Wang et al. [72] reported that long-term noise exposure impairs the ability to discriminate sound frequencies, thereby affecting the recognition of sound source characteristics. In the present study, approximately 70% of participants were exposed to noisy environments for more than six hours, suggesting that extended noise exposure may be one of the contributing factors. Second, the perceived controllability of sound sources may also influence sound source perception. In the structural equation model, the path between Sound Source Localization and Passively Accept was not significant, whereas the path between Sound Source Localization and Active Regulation was significant. This indicates that workers exhibit weaker perception of uncontrollable sounds but stronger perception of controllable sounds, which in turn further influences evaluations of the acoustic environment. Schreckenberg et al. [73] found that evaluations of control ability may outweigh the influence of noise level itself. In this study, both prolonged noise exposure and perceived control jointly affect sound source perception, and their combined effects may explain the non-significant role of Sound Source Localization observed in the quantitative analysis.
The Communication Barrier dimension exhibited the largest number of significant paths and the highest effect sizes, indicating that communication Barrier plays a crucial role in the evaluation of acoustic environments in industrial buildings. In industrial workshops, noise exposure reduces the efficiency of workers’ communication, which in turn leads to negative emotional responses. As workers often lack the ability to modify such conditions, they are forced to passively accept the situation. Moreover, these effects may persist beyond working hours, exerting a prolonged impact on workers and ultimately resulting in lower evaluations of the acoustic environment. Yang et al. [74] found that higher occupational noise levels were associated with increased perceived noisiness, greater hearing impairment, and increased communication difficulty. In a survey of 133 workers, 34.6% reported that noise severely interfered with on-site communication. The findings of the present study are consistent with these results. Therefore, in noise-affected industrial working environments, communication barrier may represent the most critical factor influencing evaluations of the acoustic environment.
4.3. Effects of the Relationship Between Subjective Perception and Objective Indicators
Regarding Q3:
This study found that there are some significant associations between workers’ subjective perceptions of the acoustic environment and objective acoustic indicators in industrial buildings; however, the overall strength of these correlations remains limited. This result indicates that objective acoustic indicators can, to some extent, reflect workers’ subjective responses to certain characteristics of the acoustic environment, but they are still insufficient on their own to fully explain workers’ overall evaluation of a healthy acoustic environment in industrial buildings.
This finding is broadly consistent with previous studies showing that the relationship between subjective perception and objective measures is not a simple one-to-one correspondence. Giménez et al. [28], in their study of concert halls, pointed out that a mismatch may exist between objective acoustic parameters and subjective perceptual evaluations, indicating that although physical indicators can describe acoustic characteristics, they do not necessarily correspond directly to users’ actual experiences. Studies by Masullo et al. [61] and Chen et al. [75] also showed that different acoustic characteristics, particularly fluctuation, spectral features, and low-frequency noise, may exert different effects on individuals’ physiological responses and subjective annoyance.
The results of this study indicate that SOU is significantly correlated with most physical indicators, suggesting that these objective measures can reflect workers’ overall perception of the acoustic environment. Fluctuation Strength shows significant correlations with certain dimensions, indicating that sound fluctuation characteristics are more likely to trigger workers’ emotional responses and influence their overall evaluations. However, most objective indicators do not exhibit stable and significant relationships with most subjective dimensions, suggesting that workers’ subjective perceptions are influenced not only by sound intensity itself, but also by long-term exposure, the surrounding environment, and individual psychological adaptation.
In addition, noise in industrial buildings mainly originates from the continuous operation of equipment, and workers who are exposed to such environments over long periods tend to perceive it as an integral part of the workplace context. Axelsson et al. [76] and Qin et al. [77] both pointed out that when sounds are consistent with the environmental context, individuals are more likely to accept them rather than perceive them as disturbances. Schreckenberg et al. [73] further demonstrated that perceived control may have a greater influence on individuals’ annoyance evaluations than the noise level itself. Moreover, during a single experimental session, factors such as the occurrence of sudden noises or interpersonal communication may also influence workers’ evaluations of the acoustic environment.
Therefore, this study does not negate the role of traditional physical indicators in acoustic environment research; rather, it further demonstrates that the relatively weak correspondence between subjective and objective measures has important implications for the evaluation of acoustic environments in industrial buildings. If assessments rely solely on objective acoustic parameters such as LAeq and Loudness to determine whether the acoustic environment meets requirements, they may fail to fully capture workers’ actual conditions in terms of communication, emotional responses, and health status. In other words, objective indicators can reflect certain physical attributes of the acoustic environment, but they are insufficient on their own to support a comprehensive evaluation of a healthy acoustic environment in industrial buildings. Furthermore, this weak correspondence between subjective and objective measures may also be related to differences in temporal scale and levels of measurement between the two approaches: objective indicators primarily reflect acoustic characteristics within a single measurement period, whereas subjective evaluations represent workers’ overall assessment of their entire work shift and include more complex perceptual components such as accumulated fatigue; therefore, a simple one-to-one correspondence between the two is difficult to establish. Therefore, in evaluating healthy acoustic environments in industrial buildings, subjective assessments should be integrated with traditional objective measurements to establish a more explanatory comprehensive evaluation framework and to provide more targeted support for subsequent acoustic optimization and design decisions. Future research could also incorporate physiological indicators and related methods to further enhance the correspondence between subjective and objective data.
4.4. Implications for Industrial Building Design
The nine key evaluation factors identified in this study constitute a multidimensional framework for interpreting workers’ perceptions of healthy acoustic environments in industrial buildings. This framework enables designers and managers to move beyond conventional assessments based solely on sound pressure levels by incorporating acoustic characteristics, communication factors, and workers’ psychological responses to the noise environment. In practice, these dimensions provide a valuable basis for the optimization of acoustic environments in industrial buildings.
The findings suggest that, in the optimization of acoustic environments in industrial buildings, greater attention should be given to workers’ perceptions of controllable and identifiable sound sources. Compared with fully enclosed and fixed control approaches, more flexible acoustic regulation strategies may better enhance workers’ sense of environmental control. For instance, more adaptable acoustic interventions could be explored, such as providing highly sound-insulated rest areas, thereby further improving workers’ capacity to manage noise.
Furthermore, Communication Barrier represents a critical dimension that should not be neglected in the acoustic design of industrial buildings. In high-noise workshop environments, limited communication can not only reduce collaborative efficiency but also increase workers’ psychological burden. Therefore, spatial organization should prioritize placing communication-intensive tasks in relatively low-noise areas or providing designated quiet spaces to facilitate more efficient and clearer workplace communication.
Finally, the evaluation of acoustic environments in industrial buildings should not rely solely on single physical acoustic indicators. Given the potential discrepancies between objective measurements and workers’ subjective perceptions, integrating subjective assessment methods—such as questionnaires and interviews—with traditional physical indicators enables a more comprehensive understanding of the actual impacts of the acoustic environment on workers and provides a stronger basis for developing more targeted optimization strategies.
5. Limitations
However, this study still has certain limitations. First, the selected industrial buildings are all coil material workshops, and the research sample is mainly concentrated in the Beijing area. The relatively uniform building type and regional distribution limit the generalizability of the study’s conclusions. Additionally, the environments in which the samples are located are generally constrained by occupational health regulations, with sound pressure levels mainly concentrated in the 70–80 dBA range, lacking data support for higher noise levels (>80 dBA). This somewhat limits the extrapolation of the study’s conclusions to high-intensity industrial sound environments. Second, this study mainly focuses on subjective perceptions on-site, and there is still insufficient exploration of the fatigue accumulation and sustained negative effects caused by long-term exposure to noisy environments. Third, although this study introduces objective physical acoustic indicators, it has not yet integrated physiological indicators for a comprehensive analysis. Therefore, research on the physiological aspects of workers remains inadequate. Fourth, the mechanisms of sound environment perception may vary at different noise levels. This study primarily focuses on “sub-threshold” environments, and there is a lack of systematic exploration regarding changes in perceptual mechanisms under higher noise conditions.
Based on the limitations mentioned above, future research can be conducted in the following areas. First, expand the sample range and scenario types by including more types of industrial buildings and samples from different regions, and covering a broader range of sound pressure levels, in order to further test the applicability and robustness of the conclusions of this study. Second, combine long-term follow-up studies to systematically assess the cumulative effects of noise exposure and its sustained impact on workers’ health-related evaluations of the working environment. Third, introduce physiological indicators in future studies and combine subjective perceptions with objective acoustic measures to construct a more comprehensive industrial building acoustic environment evaluation model from multiple dimensions.
6. Conclusions
This study adopted a mixed-methods approach to investigate workers’ evaluations of healthy acoustic environments in industrial buildings. Based on the three research questions proposed in the Introduction, the following conclusions were drawn:
1. In response to Q1, this study identified nine key evaluation factors for healthy acoustic environments in industrial buildings and, based on these, developed a multidimensional perceptual evaluation framework. This framework does not replace traditional physical noise evaluation; rather, by incorporating workers’ subjective experiences, it complements existing approaches and provides a more comprehensive basis for acoustic environment assessment, architectural design optimization, and workplace environment improvement in industrial buildings. In addition, this framework can provide theoretical support for the future development of simplified evaluation tools for practical applications.
2. In response to Q2, both Communication Barrier and Regulatory Control exert significant effects on workers’ evaluation of the Healthy Acoustic Environments. Among these, Communication Barrier demonstrates the largest effect size, significantly reducing acoustic environment evaluations through Fatigue Accumulation after Work and Negative Emotions. In contrast, Regulatory Control alters evaluations of the acoustic environment through Passively Accept and Active Regulation. Although the structural paths of Sound Source Localization and Physiological Effects at Work are statistically significant, their effect sizes are relatively small, and several pathways within Sound Source Localization are not significant.
3. In response to Q3, Spearman correlation analysis revealed that only 13.9% of the indicators showed statistically significant correlations. This result indicates that although there is a certain degree of association between objective acoustic indicators and workers’ subjective perceptions, the overall correlation remains weak and is insufficient to independently explain workers’ multidimensional subjective experiences of the acoustic environment in industrial buildings. Therefore, in the evaluation and design of acoustic environments in industrial buildings, workers’ subjective perceptions should be further integrated with physical indicators to establish a comprehensive evaluation approach that combines both objective and subjective perspectives.
Overall, this study identified key evaluation factors for healthy acoustic environments in industrial buildings and incorporated workers’ subjective experiences into the evaluation framework based on real workplace contexts. The findings highlight the importance of communication support, environmental control, emotional responses, and the interaction between subjective and objective factors in evaluating healthy acoustic environments. Accordingly, future evaluation and optimization should not rely solely on single physical indicators but should adopt an integrated approach combining objective and subjective perspectives in evaluation, design, and management practices, with particular attention to communication support, environmental control, and workers’ experiences within specific work contexts.
Author Contributions
Conceptualization, Y.Z.; methodology, Y.Z.; formal analysis, Y.Z.; investigation, G.H. and Y.W.; data curation, J.Q.; writing—original draft preparation, Y.Z.; writing—review and editing, Y.M. and J.Q.; supervision, Y.M.; project administration, Y.M.; funding acquisition, Y.M. All authors have read and agreed to the published version of the manuscript.
Funding
This study received no external funding.
Institutional Review Board Statement
The study was conducted in accordance with the Declaration of Helsinki and approved by the Academic Committee of the School of Architecture and Urban Planning, Beijing University of Civil Engineering and Architecture on 10 September 2025. No formal approval number was assigned.
Informed Consent Statement
Verbal informed consent was obtained from all subjects involved in the study prior to participation in the field experiment.
Data Availability Statement
The original contributions generated in this study are included in the article. Further inquiries may be directed to the corresponding author.
Acknowledgments
The authors declare that this research received no specific funding from any funding agency in the public, commercial, or not-for-profit sectors. The authors gratefully acknowledge all individuals who contributed to this study and extend special thanks to Ying Ma for his invaluable guidance. The authors also sincerely thank Jinhui Qin for his assistance with manuscript proofreading and data processing.
Conflicts of Interest
The authors declare no conflict of interest.
References
- Singh, B.B.; Jain, V. A comparative study of noise levels in some residential, industrial and commercial areas of Delhi. Environ. Monit. Assess. 1995, 35, 1–11. [Google Scholar] [CrossRef] [Scilit]
- Wang, C.; Si, Y.; Abdul-Rahman, H.; Wood, L.C. Noise annoyance and loudness: Acoustic performance of residential buildings in tropics. Build. Serv. Eng. Res. Technol. 2015, 36, 680–700. [Google Scholar] [CrossRef] [Scilit]
- Jeon, J.Y.; Ryu, J.K.; Lee, P.J. A quantification model of overall dissatisfaction with indoor noise environment in residential buildings. Appl. Acoust. 2010, 71, 914–921. [Google Scholar] [CrossRef] [Scilit]
- Balmashnova, M.; Sorokoumova, T. Environmental management in the field of noise impact on recreational, public and agricultural areas. E3S Web Conf. 2020, 175, 14001. [Google Scholar] [CrossRef] [Scilit]
- Baloye, D.O.; Palamuleni, L.G. A comparative land use-based analysis of noise pollution levels in selected urban centers of Nigeria. Int. J. Environ. Res. Public Health 2015, 12, 12225–12246. [Google Scholar] [CrossRef] [Scilit] [PubMed]
- Tarrazó-Serrano, D.; Castiñeira-Ibáñez, S.; Bautista, A.S.; Rubio, C.; Uris, A. Optimization of acoustic subwavelength slit barrier to control low-frequency noise in industrial buildings. J. Build. Eng. 2025, 103, 111926. [Google Scholar] [CrossRef] [Scilit]
- Jo, H.; Baek, E.-M. Impacts of noise-induced hearing loss on sleep, health, and workplace: Multi-group analysis. Heliyon 2024, 10, e30861. [Google Scholar] [CrossRef] [Scilit]
- Wang, N.; Zhang, S.; Zhang, H.; Li, Z.; Wang, G.; Zheng, Z.; Wu, J. The impact of occupational noise exposure and daily headphone use on hearing loss among petroleum workers. Prev. Med. 2025, 196, 108311. [Google Scholar] [CrossRef] [Scilit]
- Buksh, N.; Nargis, Y.; Yun, C.; He, D.; Ghufran, M. Occupational noise exposure and its impact on worker’s health and activities. Int. J. Public Health Clin. Sci. 2018, 5, 180–195. [Google Scholar]
- Raja, R.V.; Rajasekaran, V.; Sriraman, G. Non-auditory effects of noise pollution on health: A perspective. Indian J. Otolaryngol. Head Neck Surg. 2019, 71, 1500–1501. [Google Scholar] [CrossRef] [Scilit]
- Miedema, H.M.; Oudshoorn, C.G. Annoyance from transportation noise: Relationships with exposure metrics DNL and DENL and their confidence intervals. Environ. Health Perspect. 2001, 109, 409. [Google Scholar] [CrossRef]
- Singh, L.P.; Bhardwaj, A.; Kumar, D.K. Prevalence of permanent hearing threshold shift among workers of Indian iron and steel small and medium enterprises: A study. Noise Health 2012, 14, 119–128. [Google Scholar]
- Van Kempen, E.; Babisch, W. The quantitative relationship between road traffic noise and hypertension: A meta-analysis. J. Hypertens. 2012, 30, 1075–1086. [Google Scholar] [CrossRef] [Scilit]
- Muzet, A. Environmental noise, sleep and health. Sleep Med. Rev. 2007, 11, 135–142. [Google Scholar] [CrossRef] [Scilit]
- Beutel, M.E.; Jünger, C.; Klein, E.M.; Wild, P.; Lackner, K.; Blettner, M.; Binder, H.; Michal, M.; Wiltink, J.; Brähler, E. Noise annoyance is associated with depression and anxiety in the general population-the contribution of aircraft noise. PLoS ONE 2016, 11, e0155357. [Google Scholar] [CrossRef] [Scilit] [PubMed]
- Shrestha, A.; Shiqi, M. Occupational noise exposure in relation to hypertension: A cross-sectional study in the steel factory. Occup. Med. Health Aff. 2017, 5, 2. [Google Scholar] [CrossRef]
- Shabani, F.; Alimohammadi, I.; Abolghasemi, J.; Dehdari, T.; Ghasemi, R. The study of effect of educational intervention on noise annoyance among workers in a textile industry. Appl. Acoust. 2020, 170, 107515. [Google Scholar] [CrossRef] [Scilit]
- Reinhold, K.; Kalle, S.; Paju, J. Exposure to high or low frequency noise at workplaces: Differences between assessment, health complaints and implementation of adequate personal protective equipment. Agron. Res. 2014, 12, 895–906. [Google Scholar]
- Jo, H.; Baek, E.-M. The sound of safety: Exploring the determinants of prevention intention in noisy industrial workplaces. BMC Public Health 2024, 24, 90. [Google Scholar] [CrossRef] [Scilit]
- Al Rafi, J.; Msbah, L.K.; Sayem, M.A.B.S.; Hossain, S.T.; Alam, S.U.; Hasan, M.J. Monitoring harmful sound density, light intensity state in industrial workplace. In Proceedings of the 2019 International Conference on Signal Processing and Communication (ICSC), Noida, India, 7–9 March 2019; pp. 3–8. [Google Scholar]
- Monazzam, M.R.; Zakerian, S.A.; Kazemi, Z.; Ebrahimi, M.H.; Ghaljahi, M.; Mehri, A.; Afkhaminia, F.; Abbasi, M. Investigation of occupational noise annoyance in a wind turbine power plant. J. Low Freq. Noise Vib. Act. Control 2019, 38, 798–807. [Google Scholar] [CrossRef] [Scilit]
- Zeng, A.; Huang, Y.; Xin, J.; Li, J.; Qiu, W.; Zhang, M. Progress and recommendations of developing occupational exposure limits for noise–A systematic review. Heliyon 2024, 10, e37878. [Google Scholar] [CrossRef] [Scilit]
- Rikhotso, O.; Morodi, T.J.; Masekameni, D.M. Occupational health hazards: Employer, employee, and labour union concerns. Int. J. Environ. Res. Public Health 2021, 18, 5423. [Google Scholar] [CrossRef] [Scilit]
- Pääkkönen, R.; Otonkorpi-Lehtoranta, K.; Nousiainen, E.; Järvensivu, A. Solution-oriented development of the sound environment in industrial workplaces. Int. J. Occup. Saf. Ergon. 2024, 30, 1318–1325. [Google Scholar] [CrossRef] [Scilit]
- Robin, O.; Simard, M.; Potel, C.; Bruneau, M. History and variations of Lindsay’s wheel of acoustics: From a nested pie chart including words to a drawn acoustics world. J. Acoust. Soc. Am. 2024, 156, 1–11. [Google Scholar] [CrossRef] [Scilit]
- Cruz, L.C.I.; Sarmiento, L.M.Z. Qualitative Research as a Tool to Carry out Architectural and Industrial Design Projects: A Vision from the Academic Perspective. Eur. J. Form. Sci. Eng. 2022, 5, 13–23. [Google Scholar] [CrossRef] [Scilit]
- Fross, K.; Winnicka-Jasłowska, D.; Gumińska, A.; Masły, D.; Sitek, M. Use of qualitative research in architectural design and evaluation of the built environment. Procedia Manuf. 2015, 3, 1625–1632. [Google Scholar] [CrossRef] [Scilit]
- Giménez, A.; Cibrián, R.M.; Cerdá, S.; Girón, S.; Zamarreño, T. Mismatches between objective parameters and measured perception assessment in room acoustics: A holistic approach. Build. Environ. 2014, 74, 119–131. [Google Scholar] [CrossRef] [Scilit]
- Chen, K.; Kang, J.; Ma, H. Evaluation of healthy indoor acoustic environments in residential buildings by the occupants: A mixed-method approach. Build. Environ. 2023, 246, 110950. [Google Scholar] [CrossRef] [Scilit]
- Niasse, N. Dealing with literature review and epistemological underpinnings in grounded theory methodology. Int. J. Qual. Res. 2022, 2, 159–164. [Google Scholar] [CrossRef] [Scilit]
- Hallberg, L.R. The “core category” of grounded theory: Making constant comparisons. Int. J. Qual. Stud. Health Well-Being 2006, 1, 141–148. [Google Scholar] [CrossRef] [Scilit]
- Unuigbe, M.; Zulu, S.L.; Johnston, D. Renewable energy sources and technologies in commercial buildings: Understanding the Nigerian experience. Built Environ. Proj. Asset Manag. 2020, 10, 231–245. [Google Scholar] [CrossRef] [Scilit]
- Burke, R.L.; Veliz-Reyes, A. Socio-spatial relationships in design of residential care homes for people living with dementia diagnoses: A grounded theory approach. Archit. Sci. Rev. 2023, 66, 391–405. [Google Scholar] [CrossRef] [Scilit]
- Monteiro, M.; Rosa, Á.; Martins, A.; Jayantilal, S. Grounded theory—An illustrative application in the Portuguese footwear industry. Adm. Sci. 2023, 13, 59. [Google Scholar] [CrossRef] [Scilit]
- Han, L.; Fang, B.; Feng, W.; Zhou, W. Analysis of the Conflicts in the Process of Industrial Building Renovation Based on Grounded Theory: A China Study. Buildings 2023, 13, 676. [Google Scholar] [CrossRef] [Scilit]
- Madushika, U.; Lu, W. Review of structural equation modelling (SEM) application in construction management. Eng. Constr. Archit. Manag. 2025. [Google Scholar] [CrossRef] [Scilit]
- Martínez-Loya, V.; Díaz-Reza, J.R.; García-Alcaraz, J.L.; Tapia-Coronado, J.Y. SEM: A global technique—Case applied to TPM. In New Perspectives on Applied Industrial Tools and Techniques; Springer: Berlin/Heidelberg, Germany, 2017; pp. 3–22. [Google Scholar]
- Wasilah, S.; Fahmyddin, T. The advancement of the built environment research through employment of structural equation modeling (SEM). IOP Conf. Ser. Earth Environ. Sci. 2018, 126, 012001. [Google Scholar] [CrossRef] [Scilit]
- Alam, M.J.; Mezbah-ul-Islam, M. Impact of service quality on user satisfaction in public university libraries of Bangladesh using structural equation modeling. Perform. Meas. Metr. 2023, 24, 12–30. [Google Scholar] [CrossRef] [Scilit]
- Çakıt, E.; Olak, A.J.; Karwowski, W.; Marek, T.; Hejduk, I.; Taiar, R. Assessing safety at work using an adaptive neuro-fuzzy inference system (ANFIS) approach aided by partial least squares structural equation modeling (PLS-SEM). Int. J. Ind. Ergon. 2020, 76, 102925. [Google Scholar] [CrossRef] [Scilit]
- Šrekl, J.; Golob, J. New approach to calculate the probability of ignition. J. Loss Prev. Process Ind. 2011, 24, 288–291. [Google Scholar] [CrossRef] [Scilit]
- Heravi, G.; Fathi, M.; Faeghi, S. Evaluation of sustainability indicators of industrial buildings focused on petrochemical projects. J. Clean. Prod. 2015, 109, 92–107. [Google Scholar] [CrossRef] [Scilit]
- Shin, Y. Between Objective and Subjective Architectural Experiences: Conceptualizing Refractive Neuroarchitecture Phenomenology. Enq. ARCC J. Archit. Res. 2024, 21, 1–16. [Google Scholar] [CrossRef] [Scilit]
- Tatlić, I. Arhitektonska potraga za stvarnim. Sophos-časopis Mlad. Istraživača 2023, 165–192. [Google Scholar] [CrossRef] [Scilit]
- Li, Z.; Loveday, D.; Demian, P. Feedback messaging, thermal comfort and usage of office-based personal comfort systems. Energy Build. 2019, 205, 109514. [Google Scholar] [CrossRef] [Scilit]
- Çankaya Topak, S.; Yılmazer, S. A comparative study on indoor soundscape assessment via a mixed method: A case of the high school environment. Appl. Acoust. 2022, 189, 108554. [Google Scholar] [CrossRef] [Scilit]
- Irani, M.; Banihashemi, S. Impact of knowledge, tendency and perceived threats of climate change on adaptation strategies: The case of tehran architects. Energy Environ. Res. 2020, 10, 22–29. [Google Scholar] [CrossRef] [Scilit]
- Corbin, J.; Strauss, A. Basics of Qualitative Research: Techniques and Procedures for Developing Grounded Theory; Sage publications: Thousand Oaks, CA, USA, 2014. [Google Scholar]
- Cao, J.; Kang, J. A perceptual structure of soundscapes in urban public spaces using semantic coding based on the grounded theory. Int. J. Environ. Res. Public Health 2023, 20, 2932. [Google Scholar] [CrossRef] [Scilit] [PubMed]
- Qin, J.; Zhao, X.; He, J.; Jia, X.; Zhang, B. Development and validation of the perceived restorative soundscape scale for children. Front. Psychol. 2024, 15, 1362096. [Google Scholar] [CrossRef] [Scilit]
- Bowen, G.A. Naturalistic inquiry and the saturation concept: A research note. Qual. Res. 2008, 8, 137–152. [Google Scholar] [CrossRef] [Scilit]
- Hu, Y.; Meng, Q.; Li, M.; Yang, D. Enhancing authenticity in historic districts via soundscape design. Herit. Sci. 2024, 12, 396. [Google Scholar] [CrossRef] [Scilit]
- Noble, H.; Heale, R. Triangulation in research, with examples. Herit. Sci. 2019, 22, 67–68. [Google Scholar] [CrossRef] [Scilit]
- Tinsley, D.J. Uses of factor analysis in counseling psychology research. J. Couns. Psychol. 1987, 34, 414–424. [Google Scholar] [CrossRef]
- Bian, R.; Che, H.; Yang, H. The application of project portfolio in structural equation modeling. Adv. Psychol. Sci. 2007, 15, 567–576. [Google Scholar]
- ISO/TS 12913-2:2018; Acoustics—Soundscape—Part 2: Data Collection and Reporting Requirements. International Organization for Standardization: Geneva, Switzerland, 2018.
- Acun, V.; Yilmazer, S. Combining Grounded Theory (GT) and Structural Equation Modelling (SEM) to analyze indoor soundscape in historical spaces. Appl. Acoust. 2019, 155, 515–524. [Google Scholar] [CrossRef] [Scilit]
- Davies, W.J.; Adams, M.D.; Bruce, N.S.; Cain, R.; Carlyle, A.; Cusack, P.; Hall, D.A.; Hume, K.I.; Irwin, A.; Jennings, P.; et al. Perception of soundscapes: An interdisciplinary approach. Appl. Acoust. 2013, 74, 224–231. [Google Scholar] [CrossRef] [Scilit]
- Yadav, M.; Cabrera, D.; Kim, J.; Fels, J.; de Dear, R. Sound in occupied open-plan offices: Objective metrics with a review of historical perspectives. Appl. Acoust. 2021, 177, 107943. [Google Scholar] [CrossRef] [Scilit]
- ISO 9612:2025; Acoustics—Determination of Occupational Noise Exposure—Methodology. International Organization for Standardization: Geneva, Switzerland, 2025.
- Masullo, M.; Toma, R.A.; Maffei, L. Effects of industrial noise on physiological responses. Acoustics 2022, 4, 733–745. [Google Scholar] [CrossRef] [Scilit]
- Schäffer, B.; Pieren, R.; Schlittmeier, S.J.; Brink, M. Effects of different spectral shapes and amplitude modulation of broadband noise on annoyance reactions in a controlled listening experiment. Int. J. Environ. Res. Public Health 2018, 15, 1029. [Google Scholar] [CrossRef] [Scilit]
- Mahendra Prashanth, K.V.; Sridhar, V. The relationship between noise frequency components and physical, physiological and psychological effects of industrial workers. Noise Health 2008, 10, 90–98. [Google Scholar] [CrossRef] [Scilit]
- Shehap, A.M.; Shawky, H.A.; El-Basheer, T.M. Study and assessment of low frequency noise in occupational settings. Arch. Acoust. 2016, 41, 151–160. [Google Scholar] [CrossRef] [Scilit]
- Engel, M.S.; Fiebig, A.; Pfaffenbach, C.; Fels, J. A Review of the Use of Psychoacoustic Indicators on Soundscape Studies. Curr. Pollut. Rep. 2021, 7, 359–378. [Google Scholar] [CrossRef] [Scilit]
- Rimskaya-Korsakova, L.; Pyatakov, P.; Shulyapov, S. Evaluations of the annoyance effects of noise. Acoust. Phys. 2022, 68, 502–512. [Google Scholar] [CrossRef] [Scilit]
- Hong, J.Y.; Jeon, J.Y. Influence of urban contexts on soundscape perceptions: A structural equation modeling approach. Landsc. Urban Plan. 2015, 141, 78–87. [Google Scholar] [CrossRef] [Scilit]
- Torresin, S.; Albatici, R.; Aletta, F.; Babich, F.; Oberman, T.; Siboni, S.; Kang, J. Indoor soundscape assessment: A principal components model of acoustic perception in residential buildings. Build. Environ. 2020, 182, 107152. [Google Scholar] [CrossRef] [Scilit]
- Chen, J.; Ma, H. A conceptual model of the healthy acoustic environment: Elements, framework, and definition. Front. Psychol. 2020, 11, 554285. [Google Scholar] [CrossRef] [Scilit]
- Riedel, N.; Köckler, H.; Scheiner, J.; Van Kamp, I.; Erbel, R.; Loerbroks, A.; Claßen, T.; Bolte, G. Home as a place of noise control for the elderly? A cross-sectional study on potential mediating effects and associations between road traffic noise exposure, access to a quiet side, dwelling-related green and noise annoyance. Int. J. Environ. Res. Public Health 2018, 15, 1036. [Google Scholar] [CrossRef] [Scilit] [PubMed]
- Riedel, N.; Loerbroks, A.; Bolte, G.; Li, J. Do perceived job insecurity and annoyance due to air and noise pollution predict incident self-rated poor health? A prospective analysis of independent and joint associations using a German national representative cohort study. BMJ Open 2017, 7, e012815. [Google Scholar] [CrossRef] [Scilit]
- Wang, Y.; Huang, X.; Zhang, J.; Huang, S.; Wang, J.; Feng, Y.; Jiang, Z.; Wang, H.; Yin, S. Bottom-up and top-down attention impairment induced by long-term exposure to noise in the absence of threshold shifts. Front. Neurol. 2022, 13, 836683. [Google Scholar] [CrossRef] [Scilit]
- Schreckenberg, D.; Belke, C.; Spilski, J. The development of a multiple-item annoyance scale (MIAS) for transportation noise annoyance. Int. J. Environ. Res. Public Health 2018, 15, 971. [Google Scholar] [CrossRef] [Scilit]
- Yang, X.; Wang, Y.; Zhang, R.; Zhang, Y. Physical and psychoacoustic characteristics of typical noise on construction site: “How does noise impact construction workers’ experience?”. Front. Psychol. 2021, 12, 707868. [Google Scholar] [CrossRef] [Scilit]
- Chen, W.; Hu, S.; Wen, W.; Wu, X.; Cao, H.; Lu, L.; Peng, J. Research progress on human feel test method of Substation low frequency noise. IOP Conf. Ser. Mater. Sci. Eng. 2020, 782, 032116. [Google Scholar] [CrossRef] [Scilit]
- Axelsson, Ö.; Nilsson, M.E.; Berglund, B. A principal components model of soundscape perception. J. Acoust. Soc. Am. 2010, 128, 2836–2846. [Google Scholar] [CrossRef] [Scilit] [PubMed]
- Qin, J.; Zhang, Q.; Wang, Y.; Wang, L.; Ma, Y. Impact of acoustic indicators on soundscape perception and physiological indicators in the transit-oriented developments (TODs). Sustain. Cities Soc. 2025, 130, 106653. [Google Scholar] [CrossRef] [Scilit]
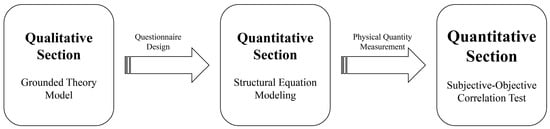
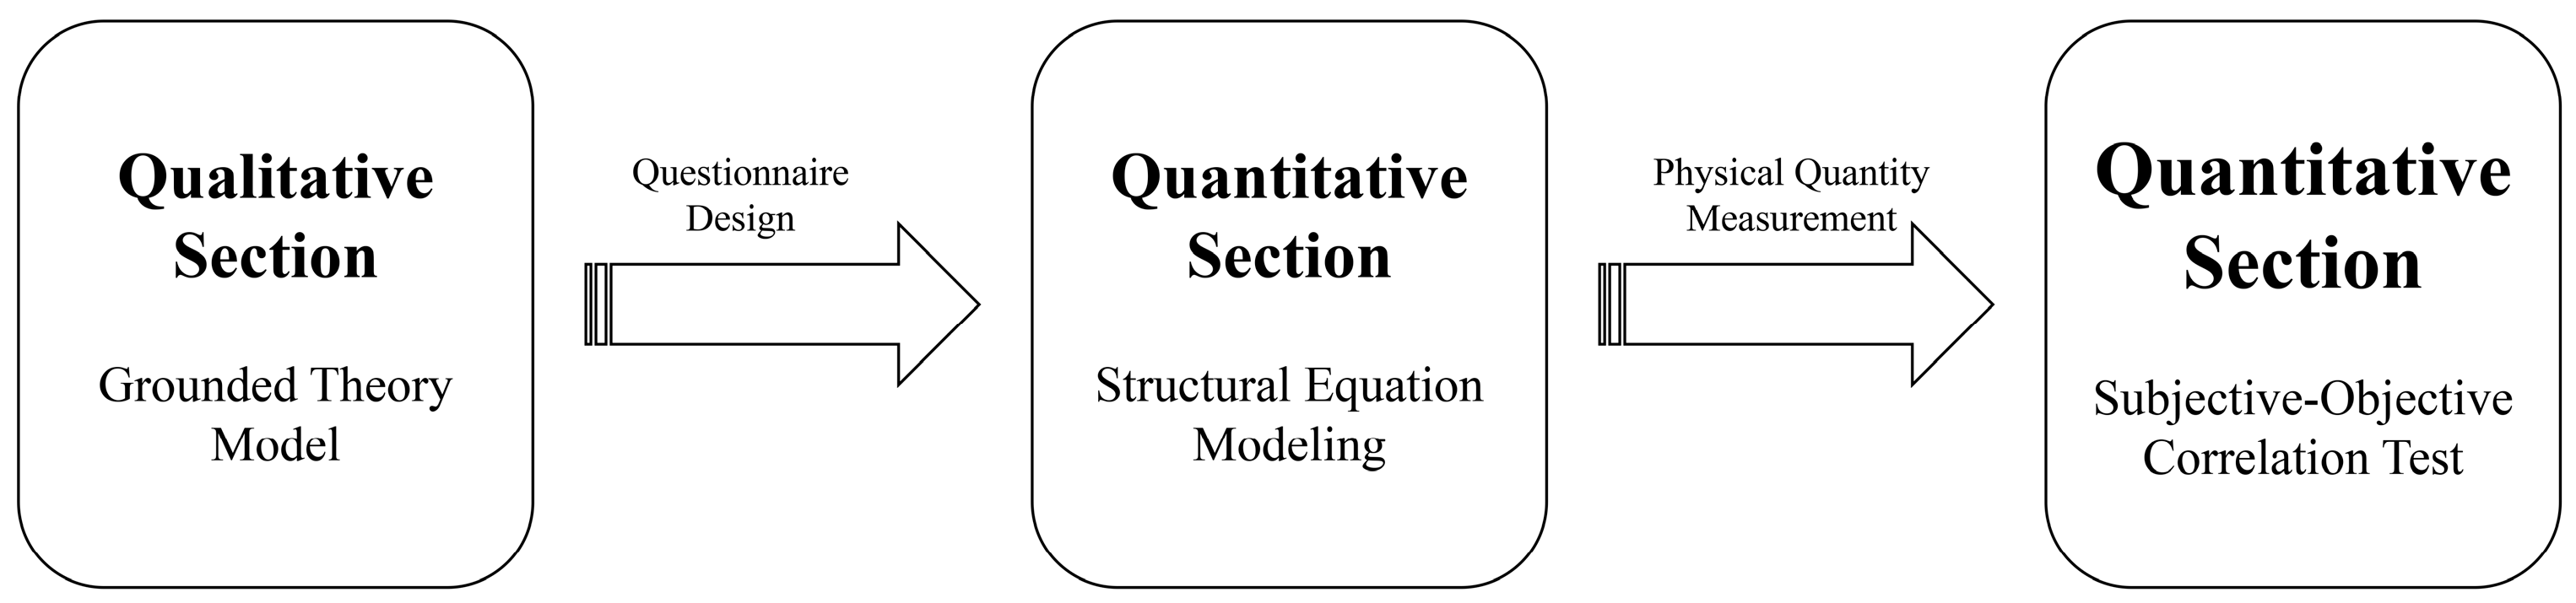
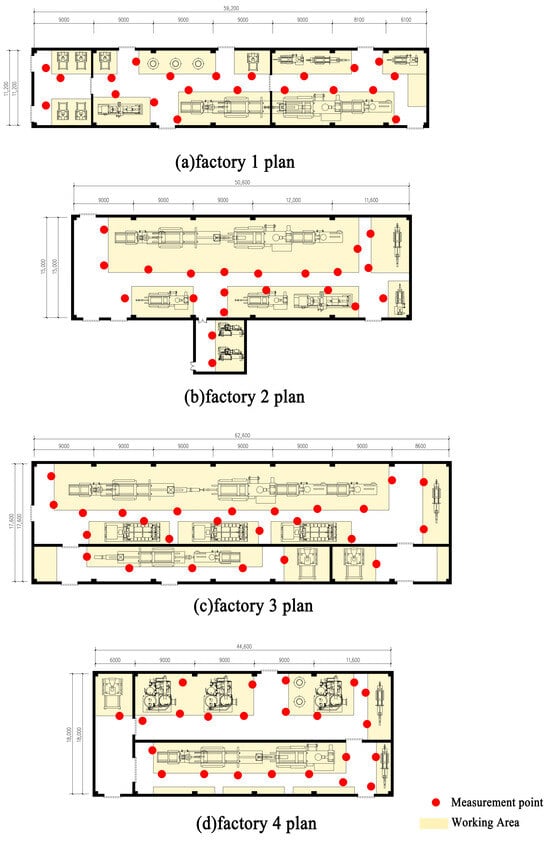
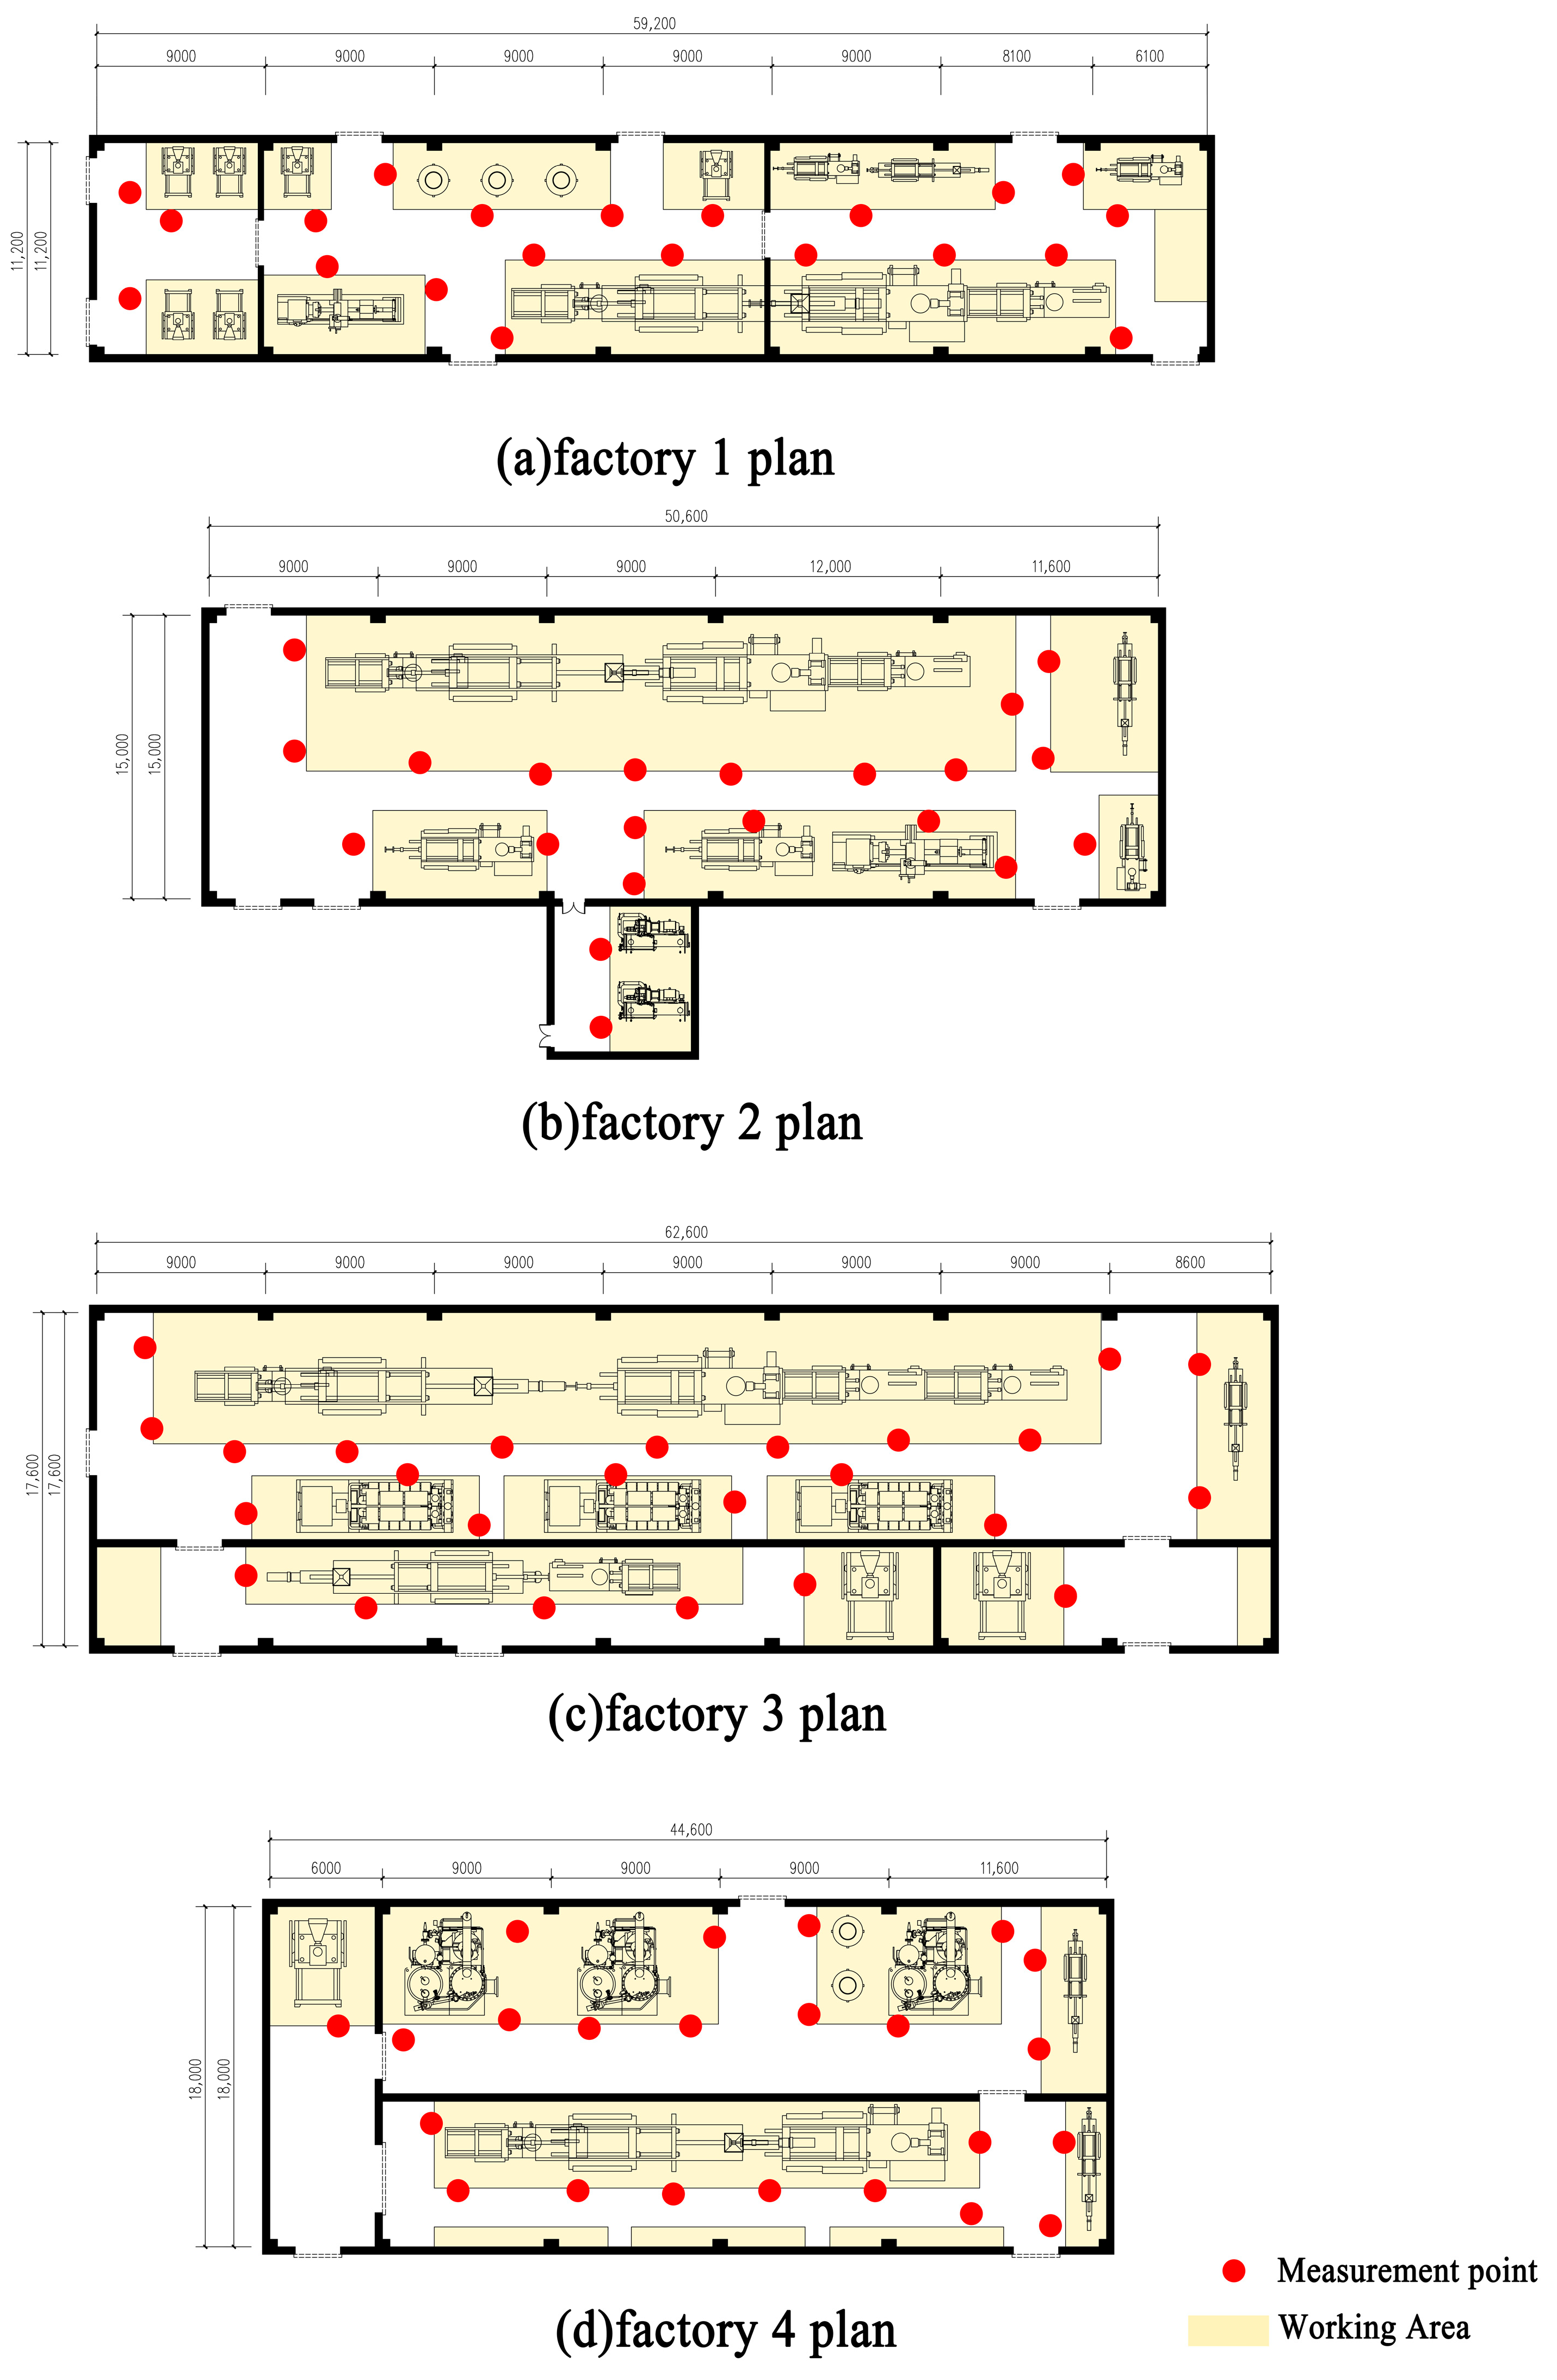
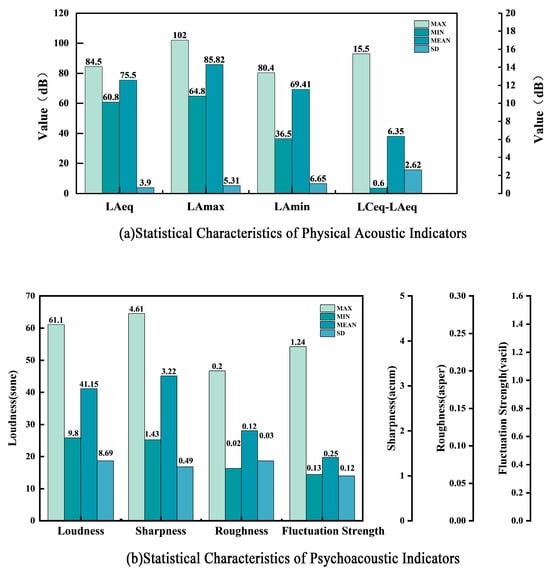
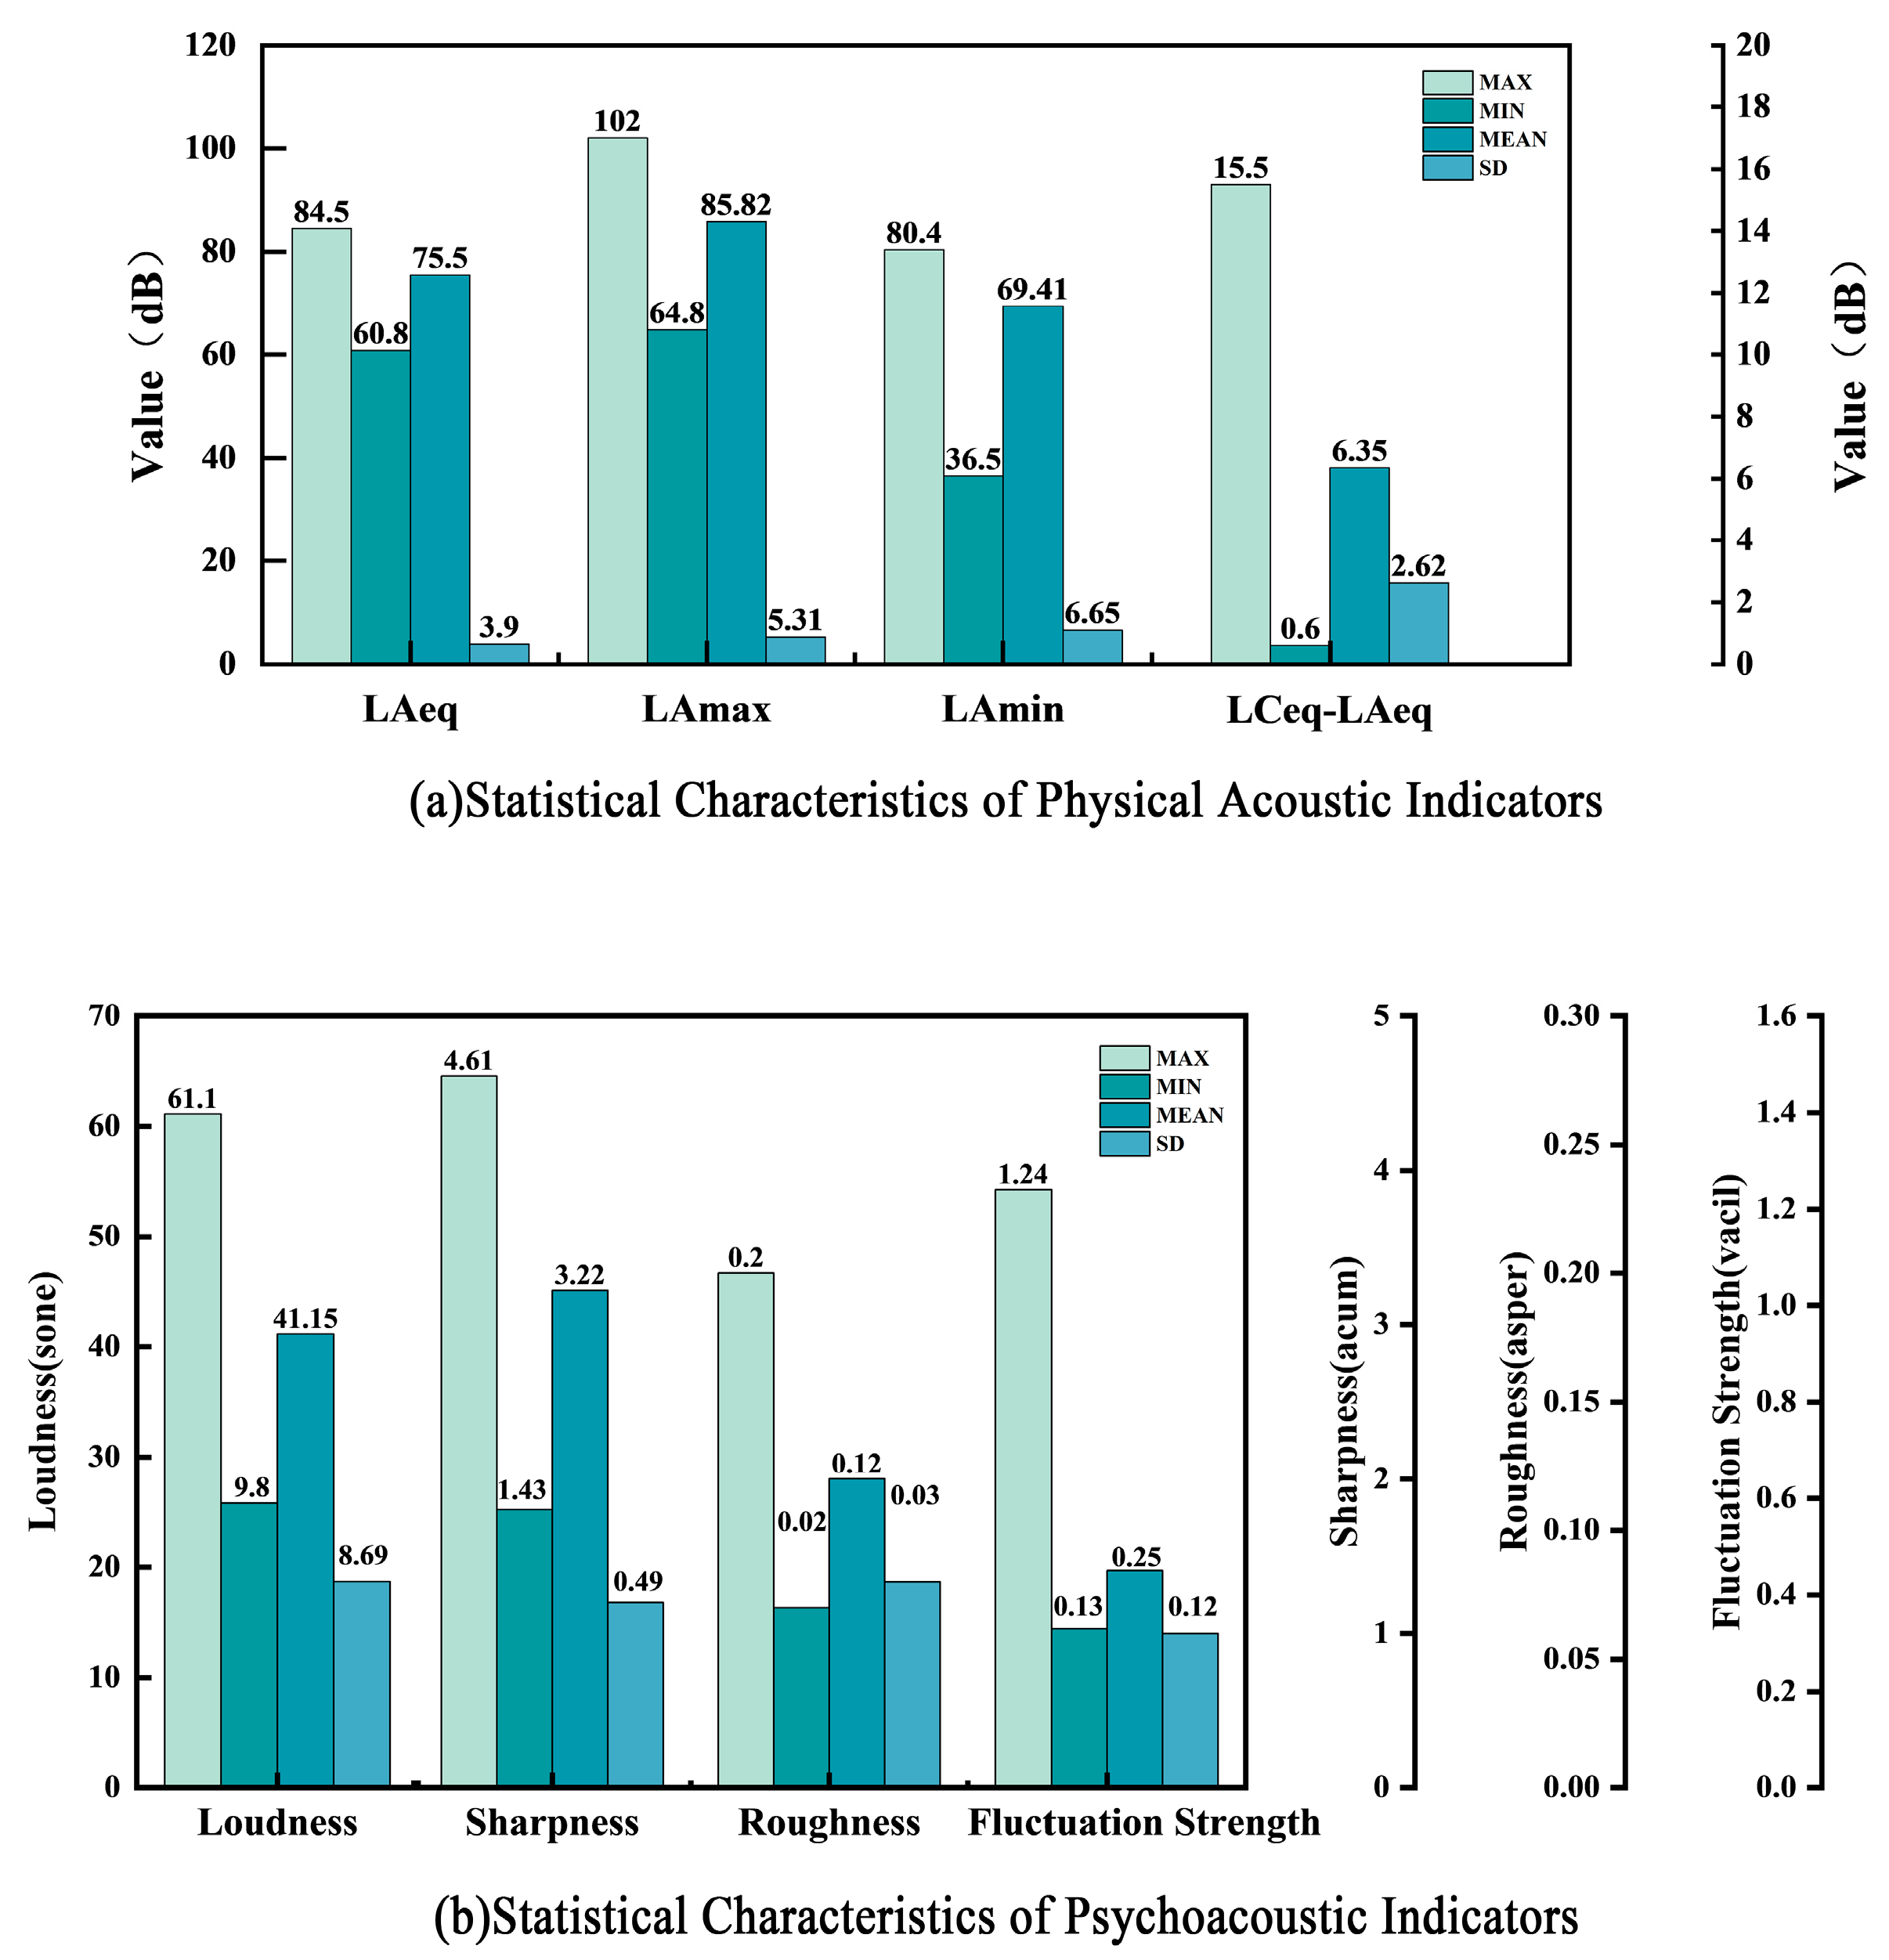
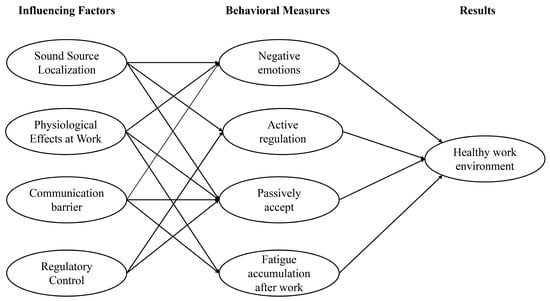
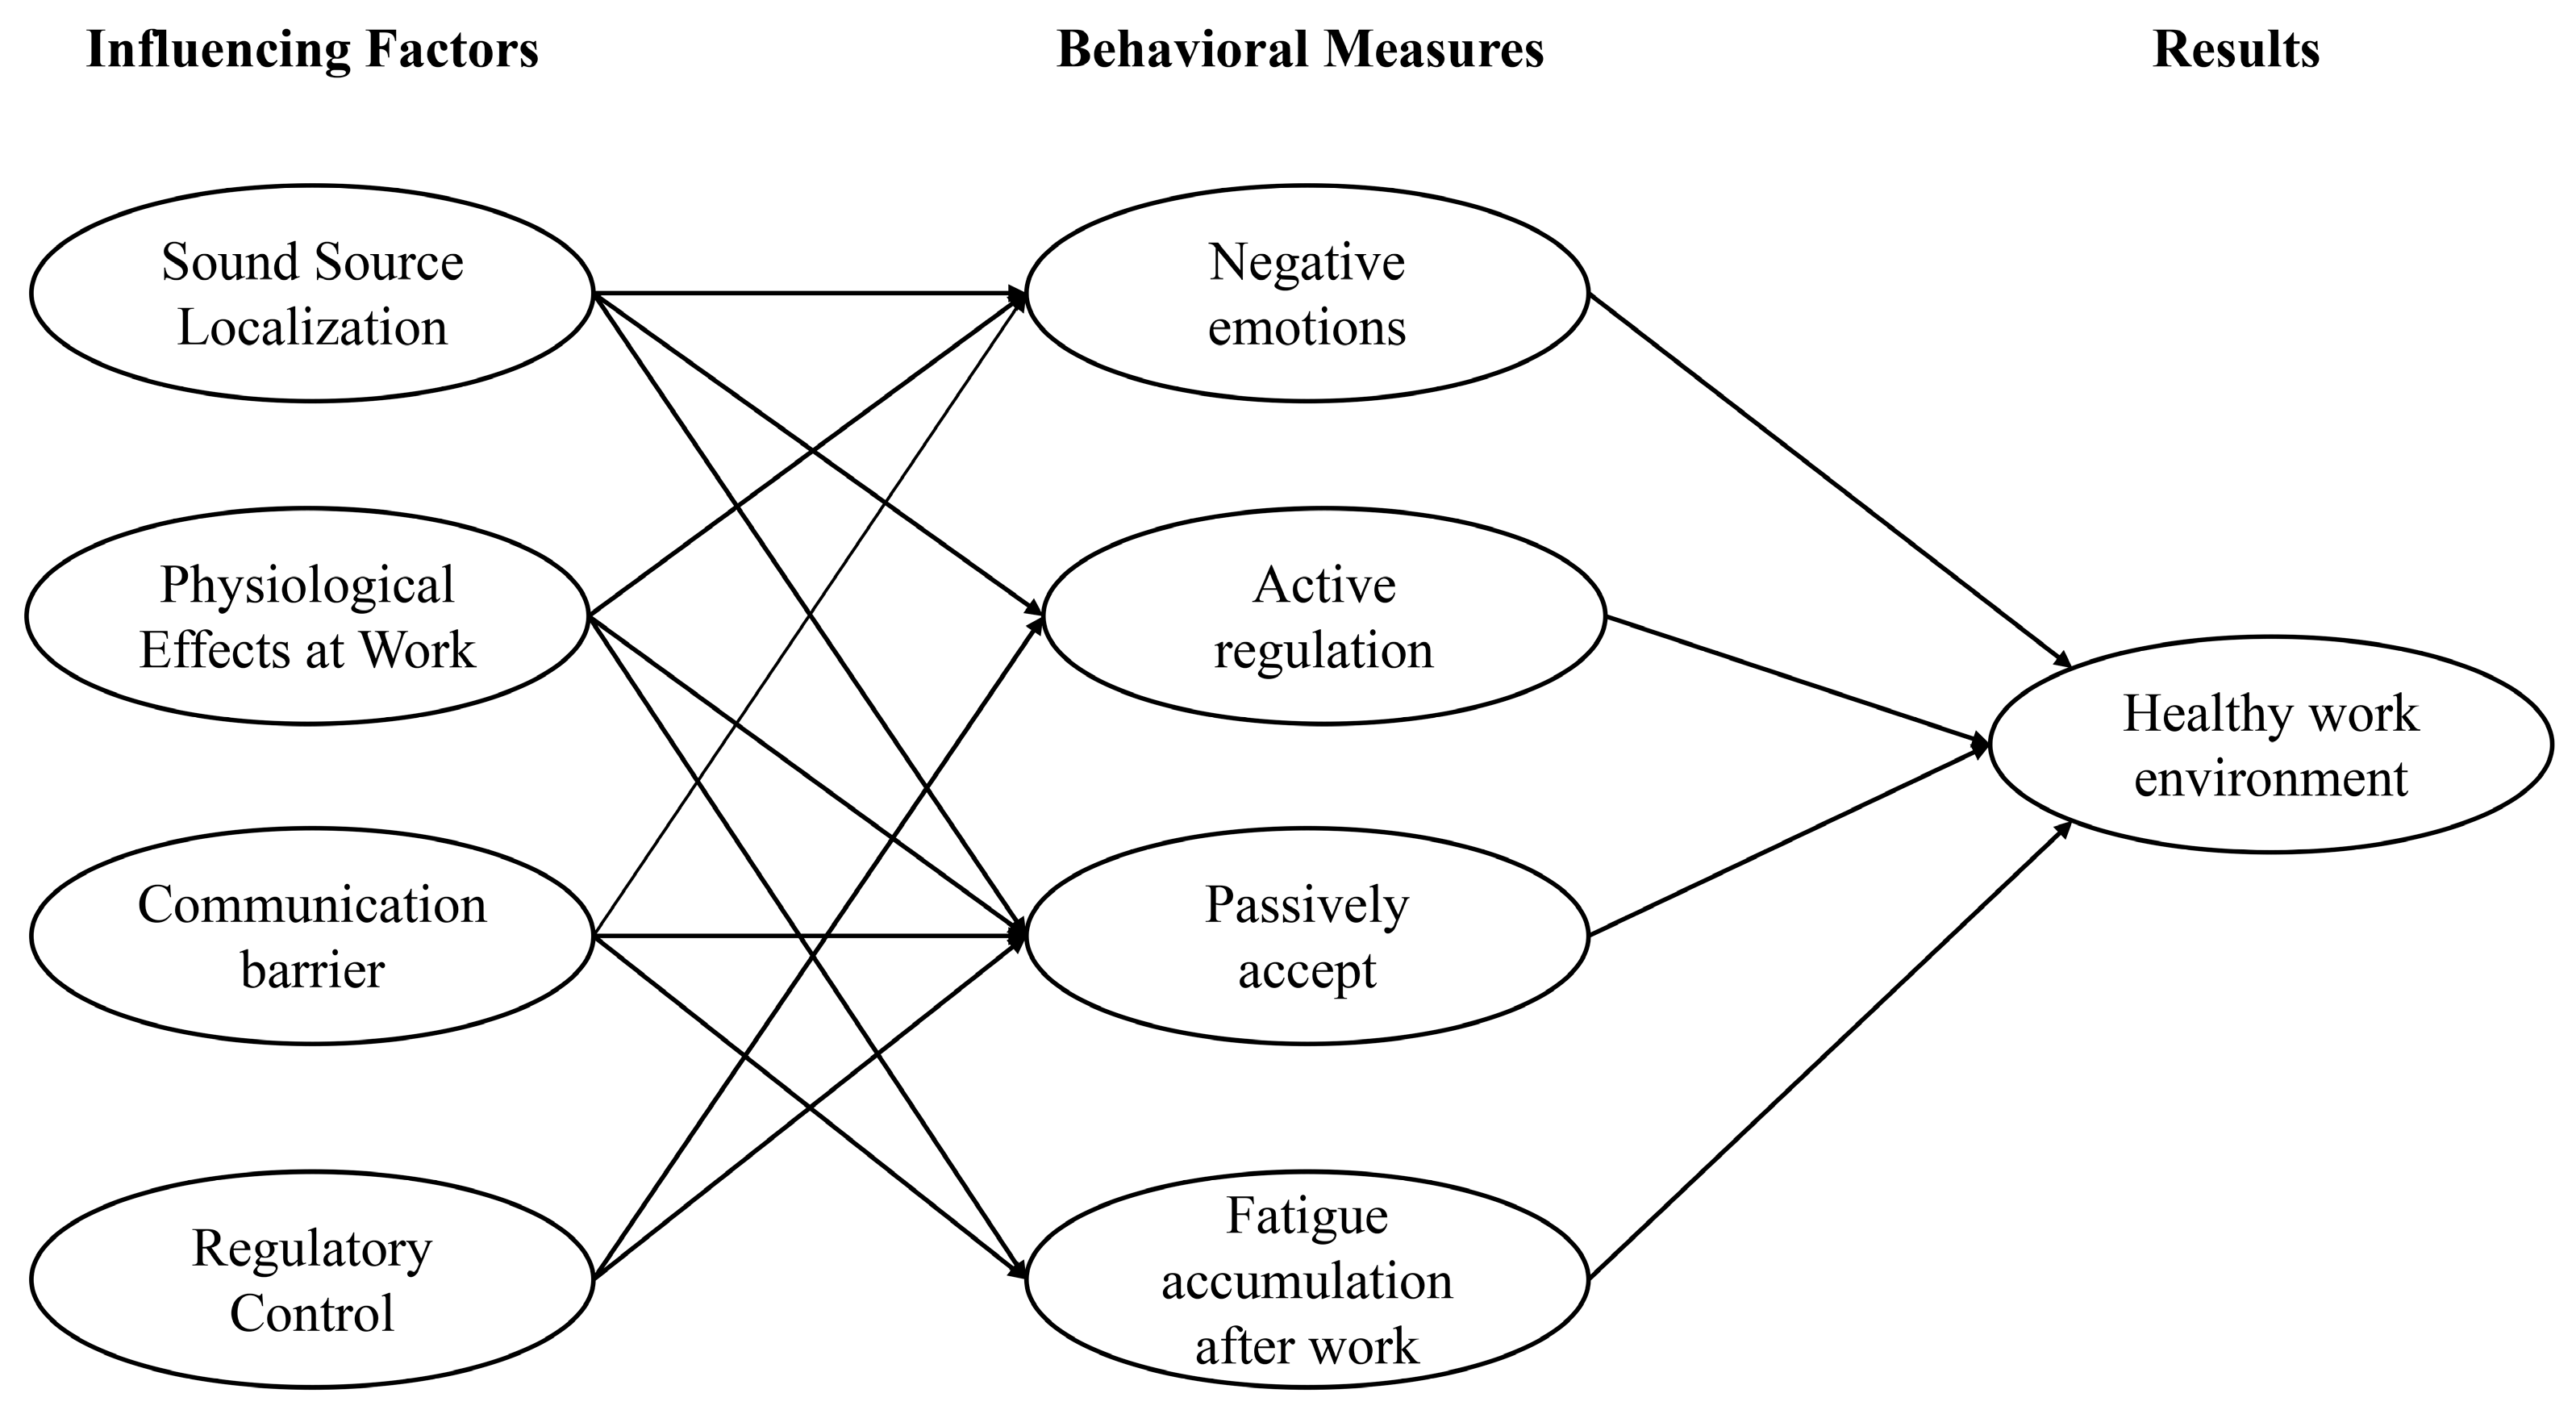
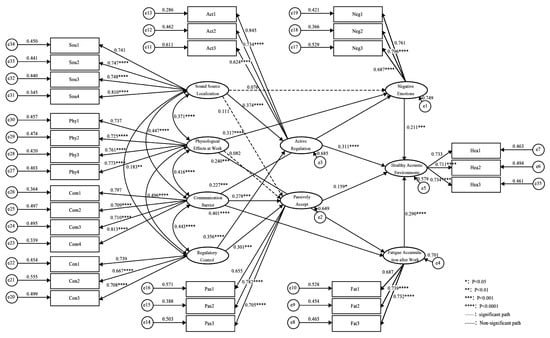
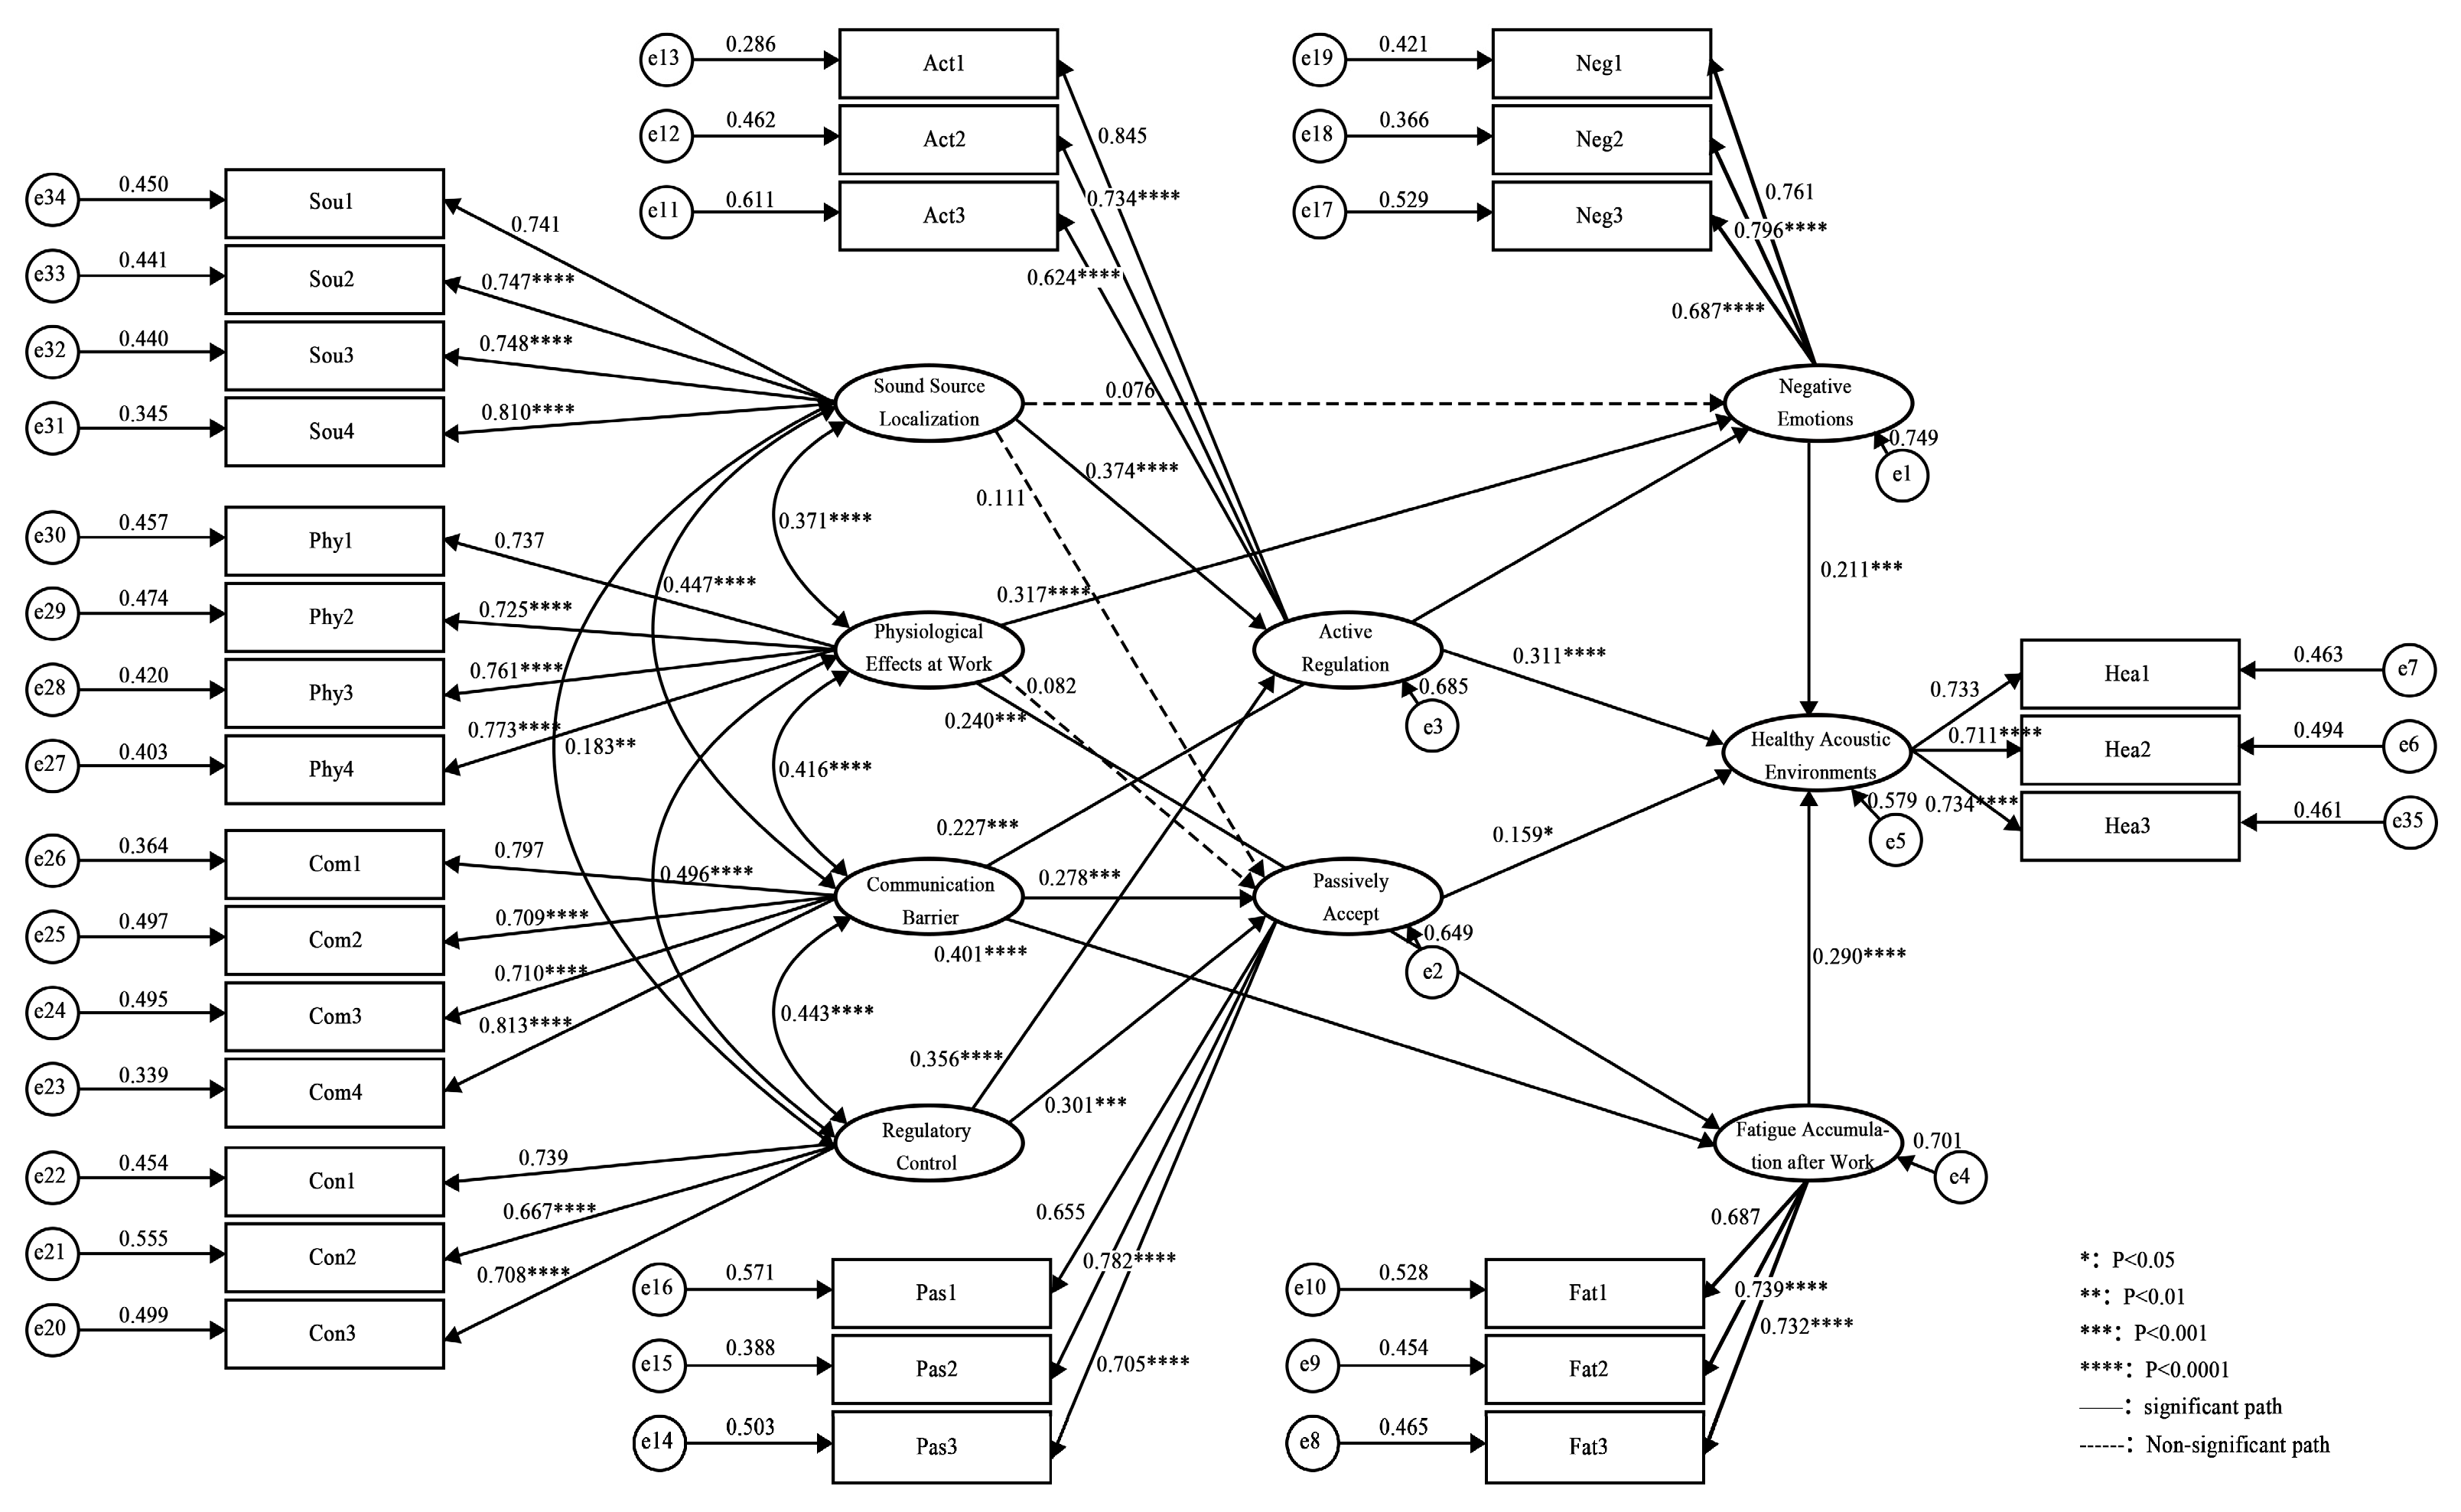
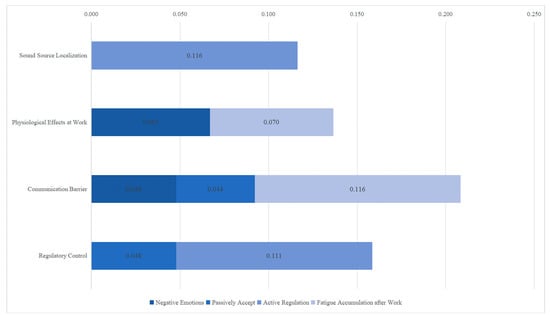
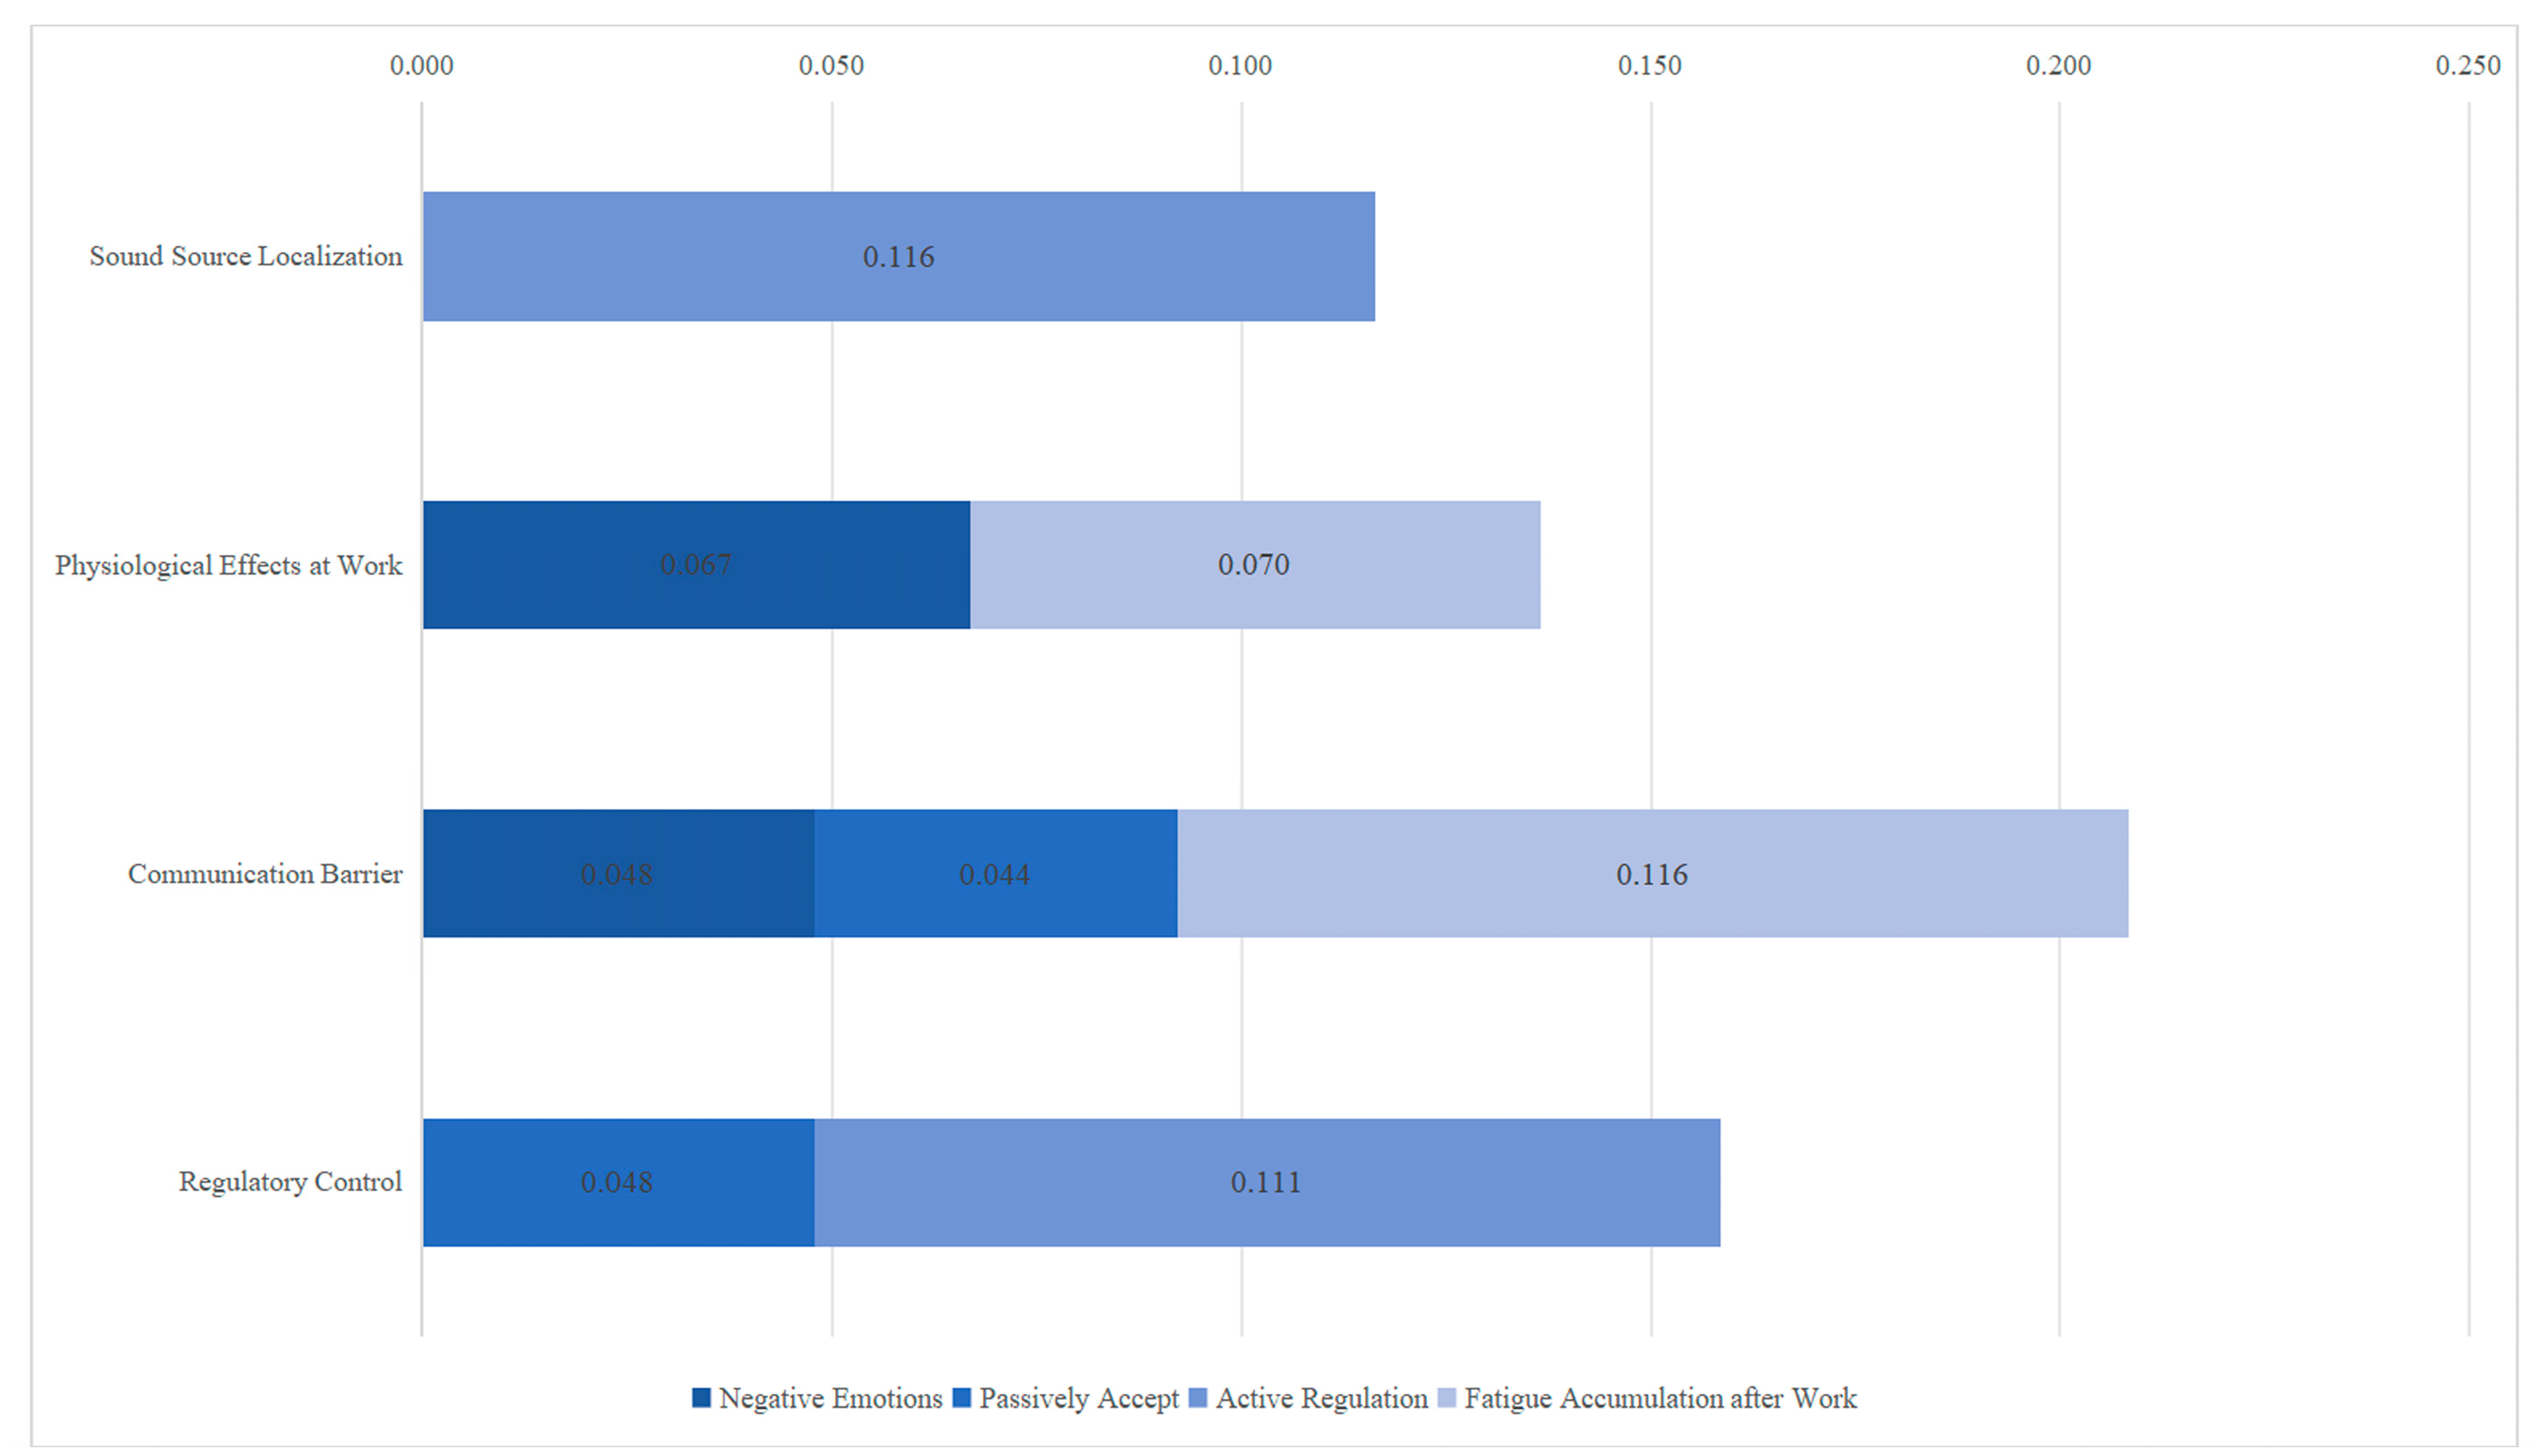

Disclaimer/Publisher’s Note: The statements, opinions and data contained in all publications are solely those of the individual author(s) and contributor(s) and not of MDPI and/or the editor(s). MDPI and/or the editor(s) disclaim responsibility for any injury to people or property resulting from any ideas, methods, instructions or products referred to in the content. |
© 2026 by the authors. Licensee MDPI, Basel, Switzerland. This article is an open access article distributed under the terms and conditions of the Creative Commons Attribution (CC BY) license.