


Abstract
This study examines the street spaces of Shamian Island in Guangzhou and addresses the long-standing urban design challenge of quantifying subjective perception. Drawing on environmental psychology, it introduces “behavioral representation” as a proxy variable for perception. By synthesizing international street design guidelines, the study establishes a street-characteristic indicator system covering spatial scale, interface, facilities, and landscape. Multiple linear regression (MLR) models are then applied to analyze in depth how spatial elements influence five types of behavior, including lingering, passing through, and consumption. The results show that walkway width is the core driving factor across all behavior types, while artistic landscape installations exert the most significant effect on long-duration stays. In addition, different spatial elements exhibit distinct mechanisms in shaping various behaviors. The study constructs a “space–perception–behavior” cognitive framework, providing an evidence-based tool and a methodological reference for evaluating subjective perception in urban design.
1. Introduction
Urban streets are defined as thoroughfares that facilitate daily social interactions among residents, encompassing the roadway itself as well as adjacent buildings, roadside shrubs, and associated vegetation that collectively shape residents’ daily experiences [1]. As such, street environments exert a profound influence on human cognition, behaviors, and perceived quality of life [2]. As the most pervasive and dynamic components of the urban public realm, streets possess spatial qualities that are intrinsically linked to residents’ daily experiences and urban vitality. Consequently, the assessment and optimization of street space quality constitute a central theme in urban research.
Amid rapid urbanization in high-density contexts, enhancing street quality has become a core focus of human-centric governance. High-quality streetscapes are essential for promoting active behaviors, reducing psychological stress, and supporting urban vitality. Objective morphological indicators, such as the street aspect ratio (D/H) and width ratio (W/D), significantly influence environmental perception [3], and micro-scale spatial factors intricately shape human activity and spatial occupancy [4,5]. However, a critical problem persists: objectively evaluating human interaction with complex street environments. Because traditional self-reported methods are prone to bias and existing behavioral studies often lack granular activity classification, addressing this gap is of profound significance for evidence-based urban design. Therefore, by introducing fine-grained “behavioral representation” as an objective proxy, this study uncovers the exact mechanisms through which spatial characteristics shape actual space-use patterns, providing a transparent, quantifiable tool for street optimization.
The remainder of this paper is structured as follows: Section 2 reviews the relevant literature. Section 3 details the methodological framework, including data collection and behavioral classification. Section 4 presents the empirical case study. Finally, Section 5 discusses the analytical results and their implications for urban design.
2. Literature Review
2.1. Evaluation of Street Space Quality
Research on street space quality evaluation aims to operationalize abstract quality concepts into quantifiable, comparable, and actionable indicators, thereby providing a scientific foundation for urban design. A central challenge lies in the quantification of subjective perception. Measurement paradigms have evolved from traditional expert evaluations and psychological assessments toward multidimensional metrics that integrate environmental data and behavioral feedback [6,7]. Early studies predominantly relied on expert rating methods, such as the Analytic Hierarchy Process (AHP), to establish these evaluation frameworks [8]. Advances in street-view imagery (SVI) and artificial intelligence (AI)—including machine learning and deep learning—have enabled large-scale characterization of physical street environments and their perceptual attributes. For instance, SVI data and AI algorithms have been employed to evaluate spatial quality and accessibility [9], measure human perception indicators, and analyze the nuanced relationships between street spaces and perceptual dimensions [10]. Meanwhile, current research integrates multi-source data by combining SVI with field surveys, employing Fully Convolutional Networks (FCN) for semantic segmentation [11,12,13]. Concurrently, research grounded in humanistic theories has emphasized the importance of integrating subjective human perception and objective environmental features. This shift reflects a heightened focus on the cognition, emotions, and preferences of street users. Recent studies have measured these subjective dimensions through diverse methods, including audio–visual satisfaction analysis [14], 3D stated preference surveys [15], questionnaires on urban imageability [16], and human–machine adversarial scoring frameworks [17].
2.2. Research on Behavioral Representation
Drawing from environmental psychology, “behavioral representation”—often conceptually related to “behavioral mapping” or “observational proxies” in prior Environment-Behavior Studies (EBS)—denotes the observable actions reflecting how users interact with spatial environments. Human behavior is not random; it is the behavioral outcome of cognitive evaluation. Driven by psychological needs, inner states unconsciously manifest through overt actions like lingering, gazing, path selection, and social interaction. Thus, behavioral representation provides an intuitive, objective proxy to bridge physical space and subjective perception.
Behavioral representation serves as an intuitive proxy to bridge physical space and subjective perception. Mainstream methodologies fall into three primary categories: (i) location-based tracking; (ii) self-reporting methods; and (iii) field observation [18]. Propelled by advancements in technology, quantitative research on human behavior has exhibited an evolutionary trend towards multi-scale integration. For instance, Location-Based Service (LBS) and mobile phone signaling data have been used to compare behavioral characteristics in spatial networks, characterize crowd aggregation, and investigate the purposes of residents’ non-employment behaviors [19,20,21]. Furthermore, self-reporting methods use questionnaires, interviews, and behavioral diaries to report users’ patterns and motivations, such as exploring visual landscape preferences or analyzing the impact of commercial spaces [22,23,24]. However, self-reporting methods rely heavily on participants’ memory and are highly subjective. Administering questionnaires can inadvertently influence pedestrians’ psychological states and judgments, leading to discrepancies from their actual spontaneous behaviors. In contrast, overt behaviors are unconscious expressions of psychological states. Therefore, field observation remains the most classic paradigm in EBS. By employing statistical observation, cross-sectional counting, and video recording, field observation captures crowd dynamics and spatial environmental elements authentically [25,26,27]. This study adopts field observation to capture behavioral representation, repositioning the evaluation as a more objective, behavior-based analysis of space use rather than relying on direct psychological self-reports.
Traditional field observation methods often oversimplify behaviors into rudimentary categories such as stationary and movement. This classification fails to distinguish composite activities (e.g., sightseeing, socializing, and consumption), which possess differentiated spatial demands, thereby limiting the precise elucidation of the correlation mechanisms underlying street space quality. Fine-grained field observation predominantly focuses on spatially discrete nodes with distinct boundaries and singular functions, such as parks and plazas. Despite the substantial body of research on street space quality, perception, and human behavior, several critical gaps remain:
- fragmentation between spatial analysis and behavioral research, as systematic frameworks explicitly linking spatial configuration and observable behavior remain insufficiently developed;
- over-simplification of behavioral classification, which fails to uncover the multifaceted nature of street vitality;
- a focus on spatially discrete environments rather than continuous streets;
- a methodological imbalance where big data lacks behavioral depth, while micro-scale observations are rarely integrated with quantitative spatial indicators;
- the absence of consensus on behavioral metrics for measuring street vitality.
2.3. Synthesis and Research Question
Addressing these limitations requires a more integrative analytical framework capable of linking objective spatial features and multidimensional behavioral outcomes. To bridge these gaps, this study adopts behavioral representation as an objective proxy. Instead of attempting to capture direct perception data, which is prone to subjective bias, this study conducts a function-oriented classification of crowd activities (e.g., sightseeing, leisure, consumption, and movement) to translate implicit spatial quality into visible, objective behavioral combinations. Consequently, this study focuses on the following core research question: How do specific micro-scale spatial characteristics drive and shape diverse crowd behaviors in historic urban streets? By exploring the interaction pathways between space and users, this research provides an evidence-based tool for the design of high-quality streets and offers guidance for human-centric urban renewal.
3. Materials and Methods
The workflow is structured into three steps:
- Construction of the street space quality measurement model (Section 3.1).
- Research proposal for street space quality (Section 3.2).
- Multiple linear regression analysis (Section 3.3).
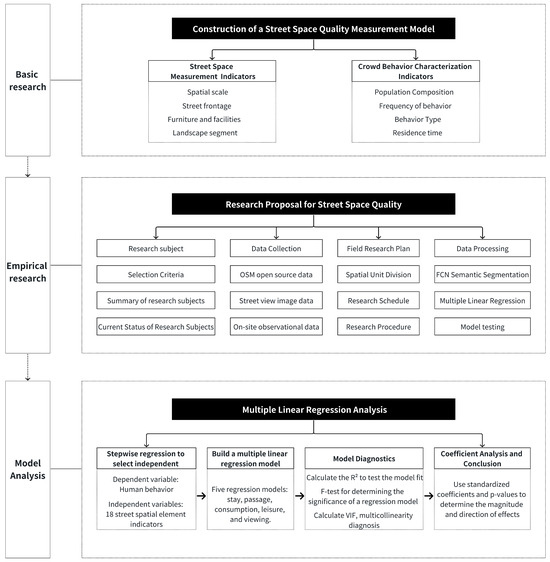
This three-step design strictly aligns with the core research question by directly linking objective micro-spatial metrics with observable human behavioral responses. While alternative methodologies provide valuable insights—such as Space Syntax for analyzing macro-level topological accessibility, or machine learning algorithms for high-accuracy behavior prediction—the proposed framework utilizes Multiple Linear Regression (MLR) to prioritize explanatory transparency. MLR is specifically selected because it allows for the precise quantification of the magnitude and direction of individual physical spatial factors, thereby providing actionable, evidence-based guidelines for street-level urban design. These phases are comprehensively illustrated in Figure 1.
Figure 1.
The research framework. (Solid arrows and boxes indicate the primary sequential workflow, while dotted arrows and boxes represent grouped sub-components).
3.1. Construction of the Street Space Quality Measurement Model
Traditional methods often oversimplify human behavior and struggle to link spatial configuration with subjective perception objectively. To address this gap, this study posits observable behavior as the optimal proxy for perception, synthesizing environmental psychology with Maslow’s Hierarchy of Needs. By leveraging classic quantitative behavioral paradigms [28], we construct a systematic behavioral representation framework designed to capture fine-grained, composite street activities.
This framework encompasses three dimensions, each selected for a specific analytical purpose: (1) ‘Behavioral subjects,’ corresponding to the diversity of crowd composition, aiming to identify who is attracted to the space; (2) ‘Behavioral quantity,’ corresponding to the intensity of spatial vitality, aiming to measure how actively the space is utilized; and (3) ‘Behavioral quality,’ corresponding to the depth of spatial attractiveness, aiming to distinguish high-quality, sustained engagements from simple movement.
To operationalize these dimensions, the framework integrates four key metrics: crowd composition, behavioral frequency, behavioral type, and dwell time. These specific metrics are adopted as the most effective techniques to translate invisible, subjective quality perceptions into visible, multidimensional behavioral data, thereby fulfilling the study’s purpose of revealing space–behavior interaction mechanisms. A comparative analysis of the relevant research methods for behavioral representation is presented in Table 1.
Table 1.
Comparative analysis of three research methods for behavioral representation.
3.2. Research Proposal for Street Space Quality
Focusing on micro-scale spatial attributes intimately correlated with human activity, this step screened and refined existing street quality indicators by synthesizing design principles and regulatory control elements from six representative urban street design guidelines (i.e., London, New York, Abu Dhabi, Shanghai, Guangzhou, and Beijing) [29,30,31,32,33,34]. These specific guidelines were selected because they provide a comprehensive global perspective, effectively balancing the universal human-centric demands for street life with the preservation of diverse regional characteristics. The screening process involved a systematic comparative analysis of their core design goals, street classification frameworks, and physical control elements to extract the most universally applicable and quantifiable spatial variables. The resulting system comprises four dimensions:
- Spatial scale.
- Street interface.
- Street furniture.
- Landscape environment.
The selection of variables followed three guiding principles: (i) theoretical relevance to human perception and behavior, (ii) measurability and reproducibility across street segments, and (iii) compatibility with both traditional field surveys and emerging computer-vision methods.
Regarding the spatial scale dimension, it includes geometric characteristics (carriageway, sidewalk, and total street width; street length; and average building height) and the height-to-width ratio (H/W). These variables were selected for their documented influence on enclosure perception, walkability, thermal comfort, and perceived safety. Accessibility was incorporated through the Shortest Distance to Public Transport, recognizing that connectivity significantly affects pedestrian intensity [35]. Specifically, this indicator is calculated as the sum of the walking distances to the nearest metro station and bus stop. Summing these two values provides a comprehensive measure of overall multimodal accessibility, accurately penalizing streets that lack proximity to both transit options.
The street interface dimension captures the interaction between buildings and the public realm. Indicators like interface continuity and building interface visibility quantify spatial permeability and visual engagement, reflecting theories that continuous, accessible interfaces enhance pedestrian interest and surveillance [36,37].
The street furniture dimension focuses on service capacity and activity support. Indicators including the densities of functional, commercial, safety, and art landscape facilities were normalized per unit street length to ensure comparability. These metrics directly relate to opportunities for social activities, consistent with design theories emphasizing the role of amenities in sustaining street life [38,39].
Finally, the landscape environment dimension integrates ecological and perceptual factors, including Green View Index (GVI), vegetation types, and Sky View Factor (SVF). Unlike conventional field surveys, these indicators were quantified using street-view imagery processed through a Fully Convolutional Network (FCN). This semantic segmentation provides an objective measurement of perceptual exposure to greenery and openness, reflecting evidence that visual quality significantly affects cognitive restoration and behavioral preferences [40].
In total, eighteen measurable indicators were ultimately identified across these four dimensions by filtering the extensive pool of guideline elements through the three aforementioned selection principles. This approach effectively combines traditional morphometric parameters with perceptual proxies derived from image-based analysis. Specific measurement metrics and quantification methods are detailed in Table 2.
Table 2.
Measurement indicators and methods for street spaces.
3.3. Multiple Linear Regression Analysis
This study employs multiple linear regression (MLR) models to quantitatively investigate the influence of street spatial characteristics on crowd behaviors. MLR was selected for its robust interpretability; unlike black-box algorithms, it precisely quantifies the magnitude and direction of spatial factors, providing actionable evidence for urban design [41]. Street spatial indicators serve as explanatory variables, while five categories of crowd behavior—effective stationary, movement, consumption, leisure, and sightseeing—constitute the response variables. This modeling strategy elucidates the differentiated influence pathways of spatial factors across behavior types. All statistical analyses were performed using SPSS Statistics 27.0 (IBM Corp., Armonk, NY, USA).
In this model, the quantity of crowd behavior was designated as the dependent variable. Eighteen spatial variables—encompassing spatial scale, interface, furniture, and landscape—were included as independent variables to assess their potential impact. To ensure statistical robustness and interpretability, the data analysis process followed a five-step protocol:
- Data preprocessing and normalization (Section 3.3.1).
- Variable selection (Section 3.3.2).
- Model construction (Section 3.3.3)
- Model validation (Section 3.3.4).
- Regression interpretation (Section 3.3.5).
3.3.1. Data Preprocessing and Normalization
Prior to model construction, data normalization was required because the 18 spatial metrics involve disparate measurement units (e.g., meters, percentages, and density counts). To eliminate dimensional discrepancies and ensure the direct comparability of regression coefficients, all independent variables were transformed.
Specifically, the Min–Max normalization method was selected to linearly map all variable values into a unified [0, 1] interval. This approach was chosen over Z-score standardization because spatial and behavioral metrics frequently deviate from a normal distribution; Min–Max scaling preserves the original data distribution shape without assuming normality, making it highly appropriate for physically bounded indicators (such as ratios and spatial densities). The transformation is defined in Equation (1):
where Xnorm represents the scaled value, X is the original observation, and Xmin and Xmax denote the minimum and maximum values of the original dataset, respectively.
3.3.2. Variable Selection
Due to the high quantity of candidate predictors, potential multicollinearity and redundancy among variables were anticipated. Including all predictors simultaneously could lead to model overfitting and unstable parameter estimation. To address this issue, a stepwise regression method was adopted to automatically screen the variables. This iterative approach integrates forward selection and backward elimination: variables are sequentially introduced into the model based on statistical significance criteria, typically using a threshold of p < 0.05. After each inclusion step, all previously entered variables are re-assessed, and any predictor that no longer satisfies the significance criterion is eliminated. This iterative process continues until no additional variables meet the statistical entry or removal conditions.
3.3.3. Model Construction
A MLR model was constructed using the subset of predictors retained from the stepwise screening process. In cases where only a single predictor remained significant, the analysis was reduced to a simple linear regression formulation. The calculation formula is shown in Equation (2):
where Y denotes the dependent variable representing crowd behavior intensity; β0 is the intercept term representing the expected value of the dependent variable when all predictors are equal to zero; βi are the regression coefficients quantifying the marginal effects of predictors; Xi represents the independent spatial variables; ε is the stochastic error term capturing unexplained variability; and k denotes the number of retained independent variables included in the final model.
The regression coefficients were estimated using the Ordinary Least Squares (OLS) method, which determines parameter values by minimizing the sum of squared residuals (Σε2) between observed and predicted dependent variable values across the n observations. Formally, this estimation procedure ensures unbiased and efficient parameter estimates under the Gauss–Markov assumptions.
The validity of statistical inference derived from the linear regression framework relies on several fundamental assumptions, including linearity between predictors and outcome, independence of residuals, homoscedasticity of error variance, and approximate normality of residual distributions. Therefore, after model estimation, diagnostic analyses were performed to evaluate whether these assumptions were reasonably satisfied. Residual normality was examined through Q–Q plots, while homoscedasticity and independence were assessed by inspecting residuals versus fitted value distributions. These diagnostic procedures ensured that the estimated coefficients and hypothesis tests remained statistically reliable and unbiased.
3.3.4. Model Validation
Model adequacy was evaluated through multiple diagnostic procedures. Given the fixed spatial boundaries of the study area, the exact sample size for all models was defined by the 31 natural street segments (N = 31). To mitigate the risk of overfitting associated with high R2 values, stepwise regression limited the final models to a maximum of 6 predictors. This maintained a predictor-to-sample ratio of approximately 1:5, satisfying fundamental statistical thresholds. Furthermore, Adjusted R2 was consistently reported to penalize the inclusion of non-essential variables. First, the F-test was employed to determine whether the overall regression model is statistically significant. A p-value below the significance threshold (typically 0.05) indicates that the model provides explanatory power beyond random variation. Second, model goodness-of-fit was examined using the coefficient of determination (R2). R2 values exceeding 0.3 are commonly considered acceptable for behavioral and social science studies characterized by inherently high variability. Finally, the Variance Inflation Factor (VIF) was calculated to detect potential multicollinearity among independent variables. It is generally accepted that a VIF value below 5 indicates the absence of significant multicollinearity, whereas higher values would necessitate model refinement through variable removal or transformation.
To ensure residual independence and rule out spatial autocorrelation, Durbin–Watson (DW) statistics and Global Moran’s I (based on street network topology) were calculated for all models.
3.3.5. Regression Interpretation
The final regression model was employed to elucidate the influence of significant independent variables on the representation of crowd behavior. The direction and relative magnitude of each predictor’s influence were evaluated by analyzing the standardized regression coefficients (β) together with their associated significance levels (p-values). Additionally, to provide a comprehensive view of estimation uncertainty, the unstandardized coefficients and their 95% confidence intervals for all models are detailed in Appendix A.
4. Case Study Application
This section presents the empirical application of the proposed research framework. It details the study area selection of Shamian Island, the systematic acquisition of multi-source environmental data, and the quantitative observation of crowd behaviors to provide a robust dataset for the subsequent regression analysis.
4.1. Study Area
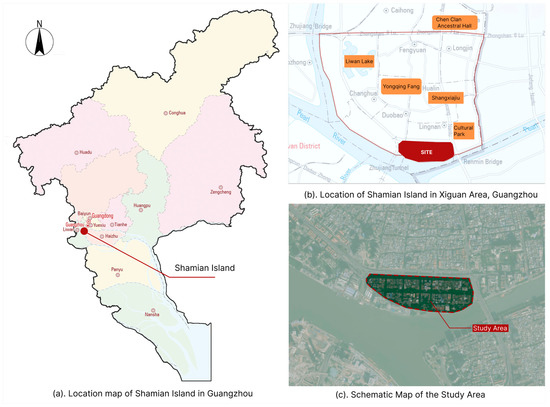
This study focuses on the street spaces of Shamian Island in Guangzhou. Located southwest of the Xiguan historical core in Liwan District, it is a 0.3-km2 alluvial sandbar on the north bank of the Pearl River.
The rationale for selecting this site is threefold (Figure 2). First, as a historical landmark of Sino-Western cultural fusion, it possesses high public recognition. Second, the island’s street spaces exhibit significant diversity, presenting distinct variations in spatial scale, street interfaces, and environments. This crucial heterogeneity facilitates an in-depth exploration of how varying spatial patterns influence human perception and behavior. Third, the streets support diverse activity types, accommodating the behavioral needs of both tourists and local residents. In summary, its unique historical value, spatial heterogeneity, and rich behavioral typology provide an ideal empirical foundation to yield actionable insights for future urban street optimization.
Figure 2.
Location map of Shamian Island.
4.2. Data Collection
4.2.1. Environmental Data
Street spatial data characterizes the physical environment across four dimensions: spatial scale, interface, furniture, and landscape. These data were acquired through the following sources:
- Road Network Data: Extracted from OpenStreetMap (OSM) and processed via ArcGIS 10.8 (Esri, Redlands, CA, USA). Raw datasets underwent cleaning, simplification, and topological inspection to eliminate errors such as dangles, pseudo-nodes, and overlapping segments.
- Building Vector Data: Footprints and story counts were extracted from Baidu Maps, with discrepancies corrected through street-view imagery and on-site measurements.
- Street Morphology Data: Field surveys used tape measures and infrared rangefinders to measure street, sidewalk, and roadway widths, building heights, and frontage lengths.
- Street Functional Data: On-site surveys recorded functional types and quantified the distribution of street furniture, safety facilities, service amenities, and art landscape features to assess functional density and diversity.
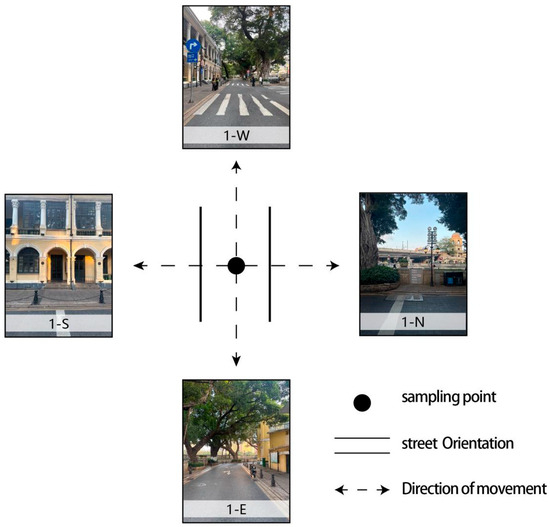
- Street View Imagery (SVI) Data: A total of 124 images were collected in May 2024 from 31 sampling points under optimal conditions. Guided by human-scale theory [38], points were spaced at 100–180 m intervals along the centerline. Images were captured at a 1.72-m eye-level height using an iPhone 15 Pro Max (Apple Inc., Cupertino, CA, USA) on a 3-axis stabilizer (resolution 1279 × 1706 pixels) in four cardinal directions to achieve 360° coverage (Figure 3).
Figure 3.
Schematic diagram of street-view image acquisition orientations.
The processing workflow for SVI data is as follows:
- Data Coding: Each sampling point and its corresponding orientation were systematically coded (e.g., 1-N) to ensure traceability.
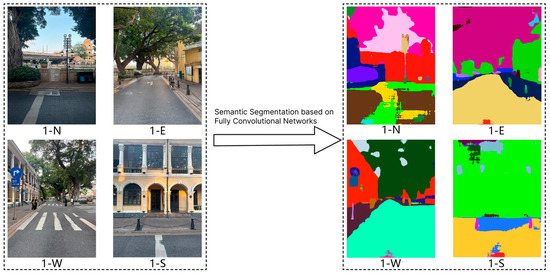
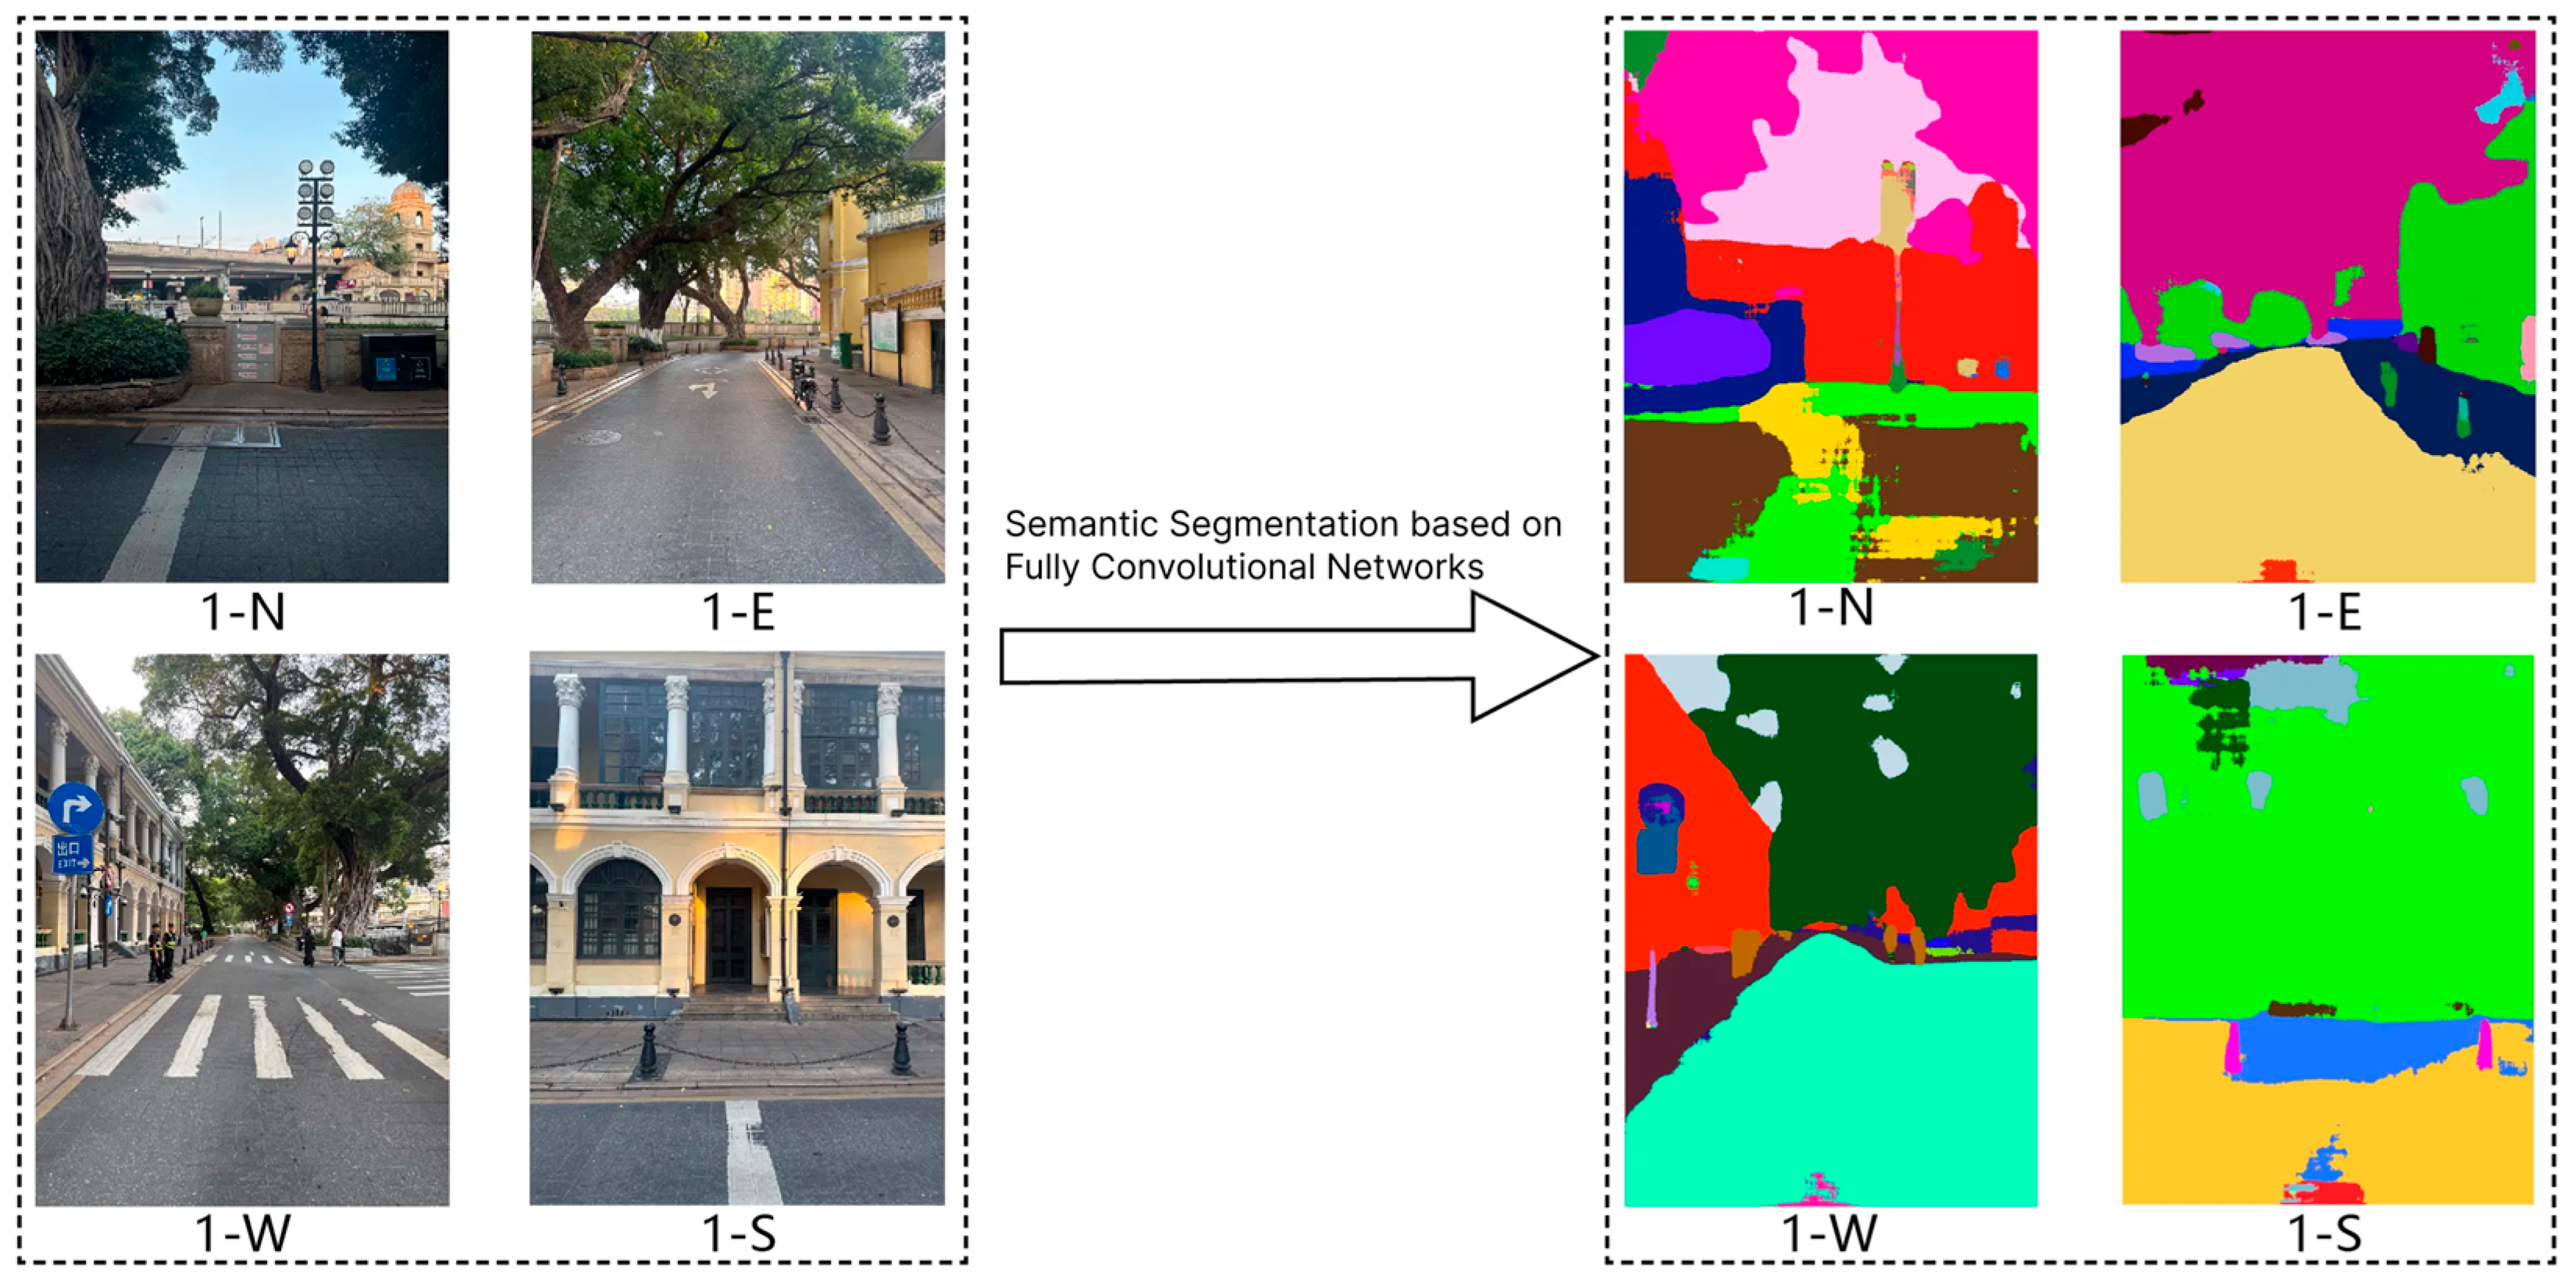
- Semantic Segmentation: A pre-trained Fully Convolutional Network (FCN) model was directly applied for semantic segmentation (Figure 4). Trained on the ADE20K dataset, to quantitatively validate the model’s local reliability on the Shamian Island dataset, a limited test set of 6 representative street-view images was manually annotated to establish ground truth. The segmentation outputs were compared against the manual annotations to calculate the pixel accuracy. The results demonstrated a high level of precision for the main target classes, achieving an average accuracy of 94.5% for vegetation, 91.2% for sky, and 93.8% for buildings. This local validation strongly confirms the reliability of the FCN model in accurately recognizing and quantifying these key visual elements [42,43].
- Parameter Calculation: Derived indicators, such as “building interface visibility” and “Green View Index (GVI),” were quantified using pixel proportions from the segmentation outputs. Based on the segmentation results, the average visual parameters for each category were calculated using Equation (3):
Figure 4.
Schematic diagram of FCN semantic segmentation for street-view imagery.
4.2.2. Behavioral Data
Data acquisition was conducted through two methods: on-site observation and video recording. To ensure the scientific validity and representativeness of the sample size, the study area was divided into 31 natural street segments using road intersections as spatial division benchmarks. This division is based on the principle of continuous spatial perception. Intersections create visual breaks that alter pedestrian environmental cognition. Furthermore, segment lengths were controlled within a 100 to 200 m range to align with the continuous walking experience, ensuring that the internal built environment elements remained consistent within each unit.
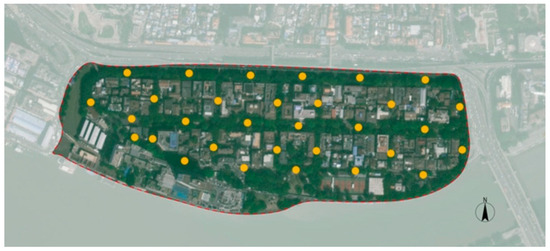
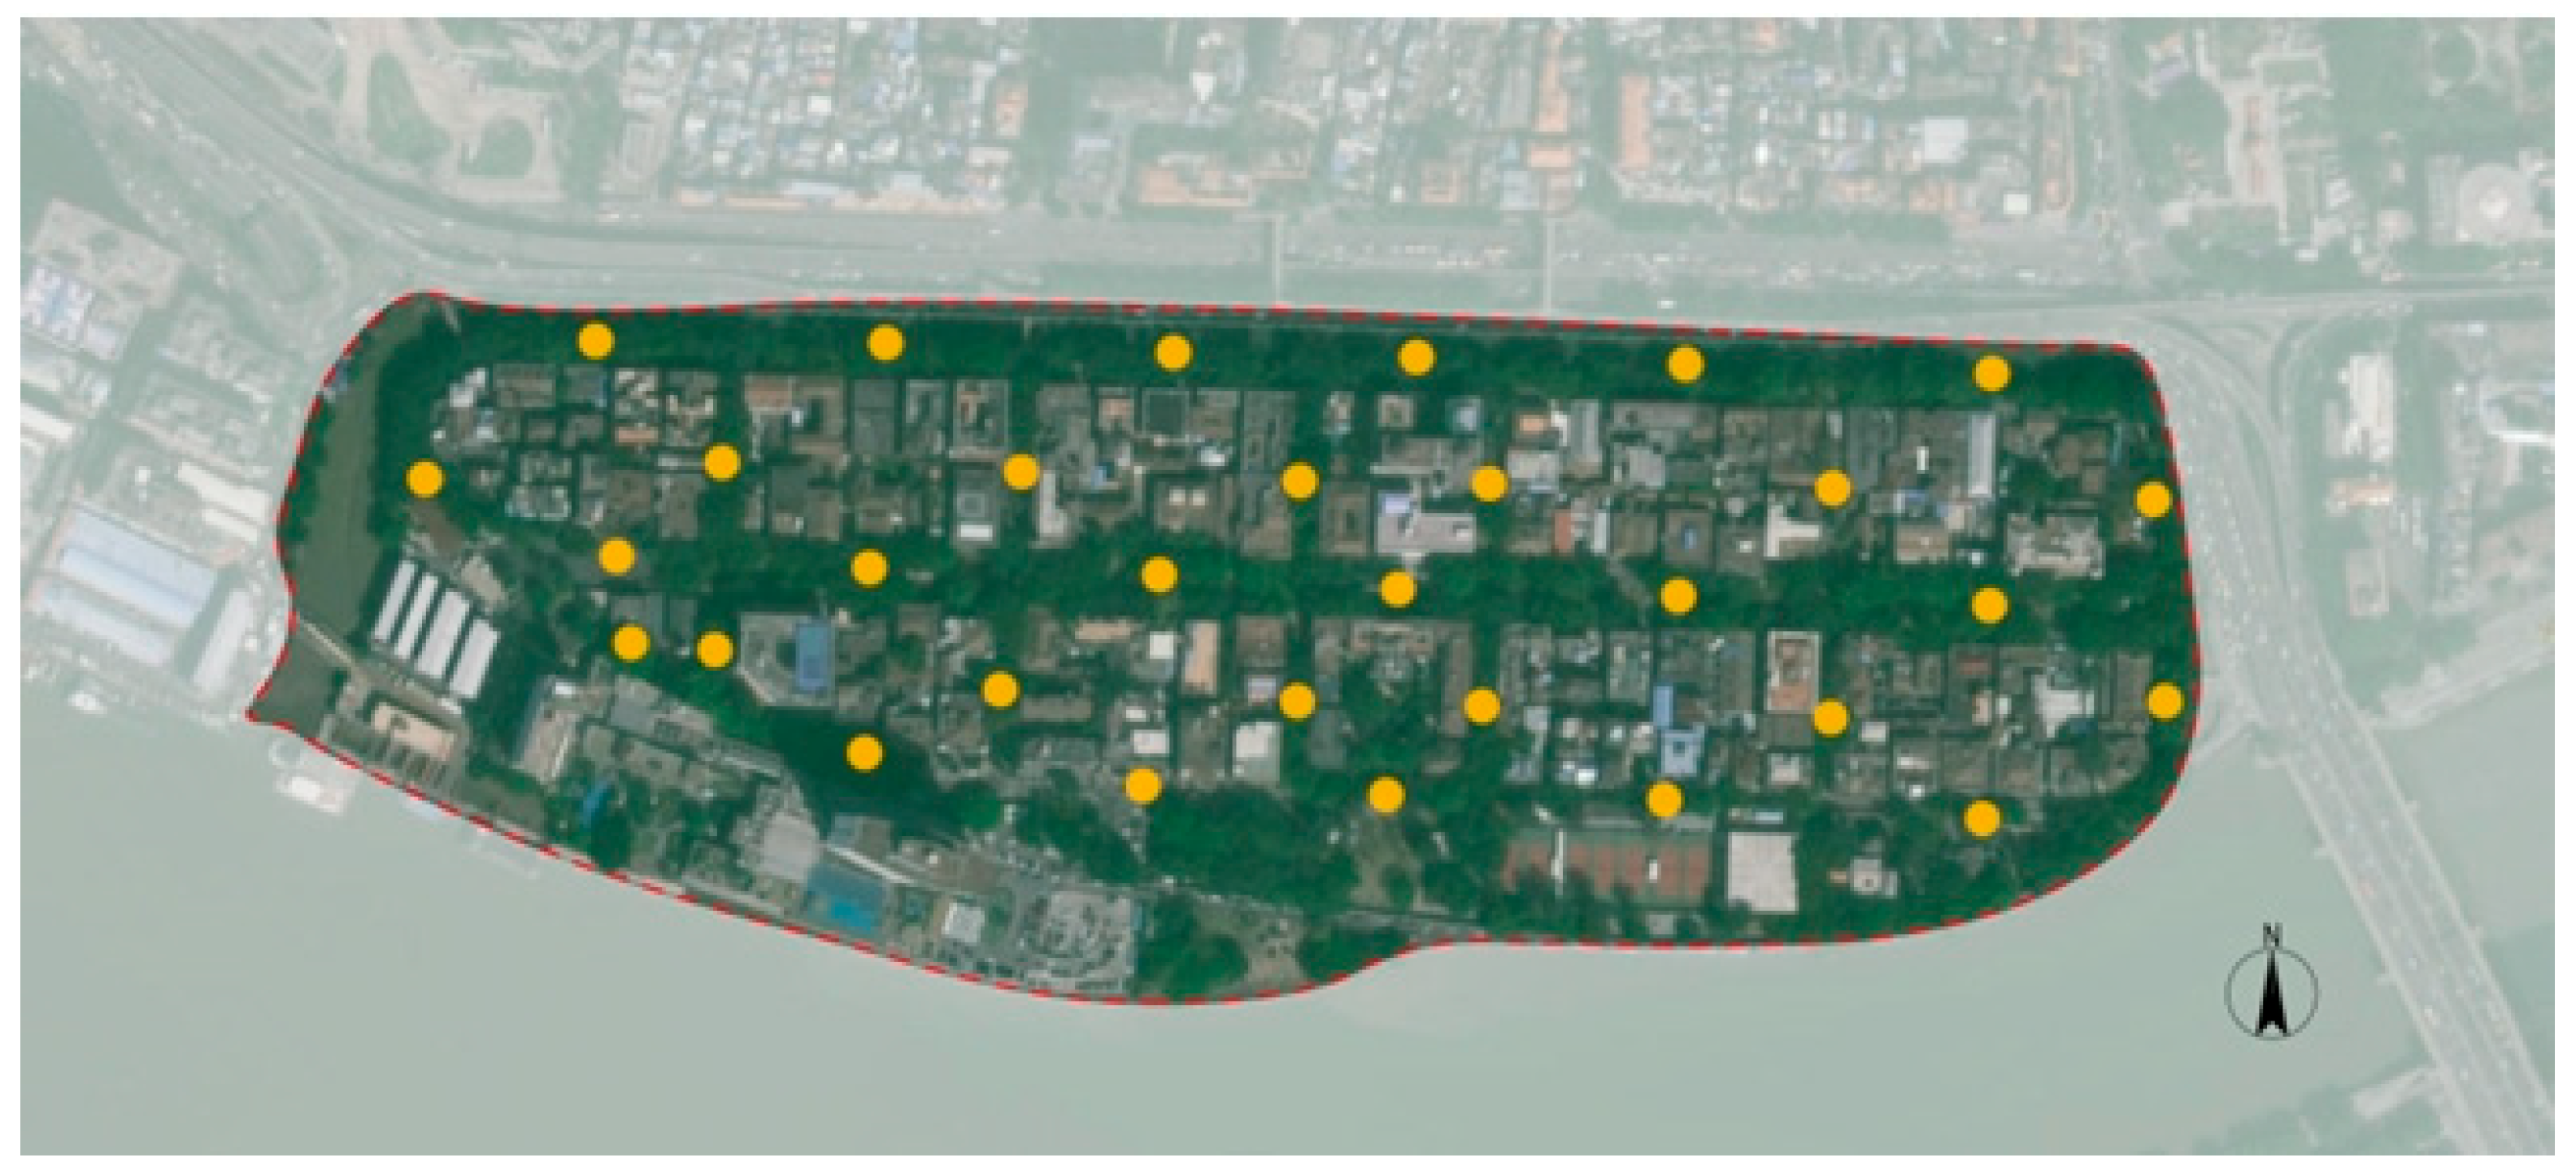
On-site observation employed the cross-sectional pedestrian counting method across the designated points (Figure 5). To comprehensively capture the behaviors of both tourists and local residents while mitigating the impact of seasonal and diurnal variations, the observation schedule was meticulously designed. Surveys were conducted on four representative days: one sunny weekday and one sunny weekend day in both winter and summer. The daily observation period spanned from 08:30 to 20:30, divided into four distinct time phases (morning, noon, afternoon, and evening). Within each three-hour phase, a 15-min time window was randomly selected to record pedestrian counts, behavioral types, frequencies, dwell times, and basic respondent profile data (e.g., estimated age groups and identifying tourists versus local residents based on visual cues). This rigorous temporal sampling strategy ensures that the collected data accurately reflect the multifaceted vitality and functional usage of the street space across different times and conditions. For the subsequent multiple linear regression analyses, the sample size is strictly defined by these 31 spatial segments (N = 31). To consolidate the repeated temporal observations into a single response variable for each segment, the behavioral data were aggregated by calculating the sum of the average counts from the weekday and weekend observations. This aggregation method effectively balances the varying activity rhythms between different days, yielding a robust representation of overall street vitality.
Figure 5.
Distribution of behavioral observation points on Shamian Island.
5. Results
Following the methodological framework established in Section 3.3, this section presents the results of the multiple linear regression (MLR) analyses. Five distinct models were developed to evaluate the differentiated influence pathways of micro-scale street spatial characteristics on various categories of crowd behavior. Notably, all models exhibited acceptable DW statistics and Global Moran’s I p-values > 0.05, confirming the absence of significant spatial autocorrelation and validating the OLS estimations. The results are structured sequentially as follows:
- Model 1: Effective stationary behavior (Section 5.1).
- Model 2: Movement behavior (Section 5.2).
- Model 3: Consumption behavior (Section 5.3).
- Model 4: Leisure behavior (Section 5.4).
- Model 5: Viewing behavior (Section 5.5).
5.1. Model 1: Effective Stationary Behavior
The regression analysis demonstrates a statistically robust relationship between street spatial characteristics and effective stationary behavior. The overall model exhibits strong explanatory capacity (R = 0.922), with the predictors jointly accounting for 84.9% of the variance in the dependent variable (R2 = 0.849; Adjusted R2 = 0.812). The high statistical significance (F = 22.55, p < 0.001) indicates that the selected spatial variables provide substantial predictive power for explaining variations in users’ stationary activity intensity (Table 3).
Table 3.
Multiple Linear Regression Model 1 (Effective Stationary Behavior).
At the individual predictor level, several spatial variables exhibited statistically significant positive associations. Art landscape facility density emerged as the strongest positive predictor (β = 0.359, p = 0.002), followed by building interface visibility (β = 0.266, p = 0.006), commercial density (β = 0.262, p = 0.019) and walkway width (β = 0.253, p = 0.02).
Conversely, street length exhibited a significant negative impact (β = −0.306, p = 0.004). Functional diversity was positively associated but did not reach statistical significance (β = 0.186, p = 0.154). These findings provide direct empirical validation for the ‘interface permeability’ and ‘amenity enrichment’ principles synthesized from the international design guidelines, confirming their critical role in sustaining street life. Multicollinearity diagnostics confirmed the independence of predictors and the stability of coefficient estimates, with acceptable tolerance values (0.392–0.811) and low variance inflation factors (VIF = 1.233–2.548) (Table 4).
Table 4.
Results of Multiple Linear Regression.
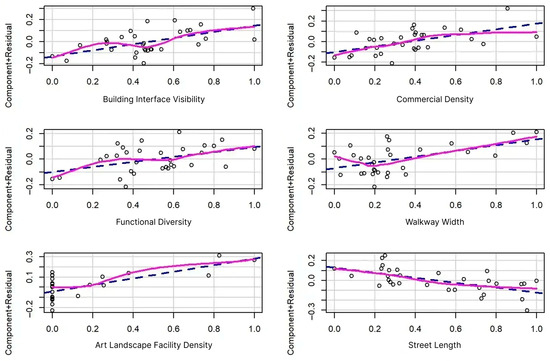
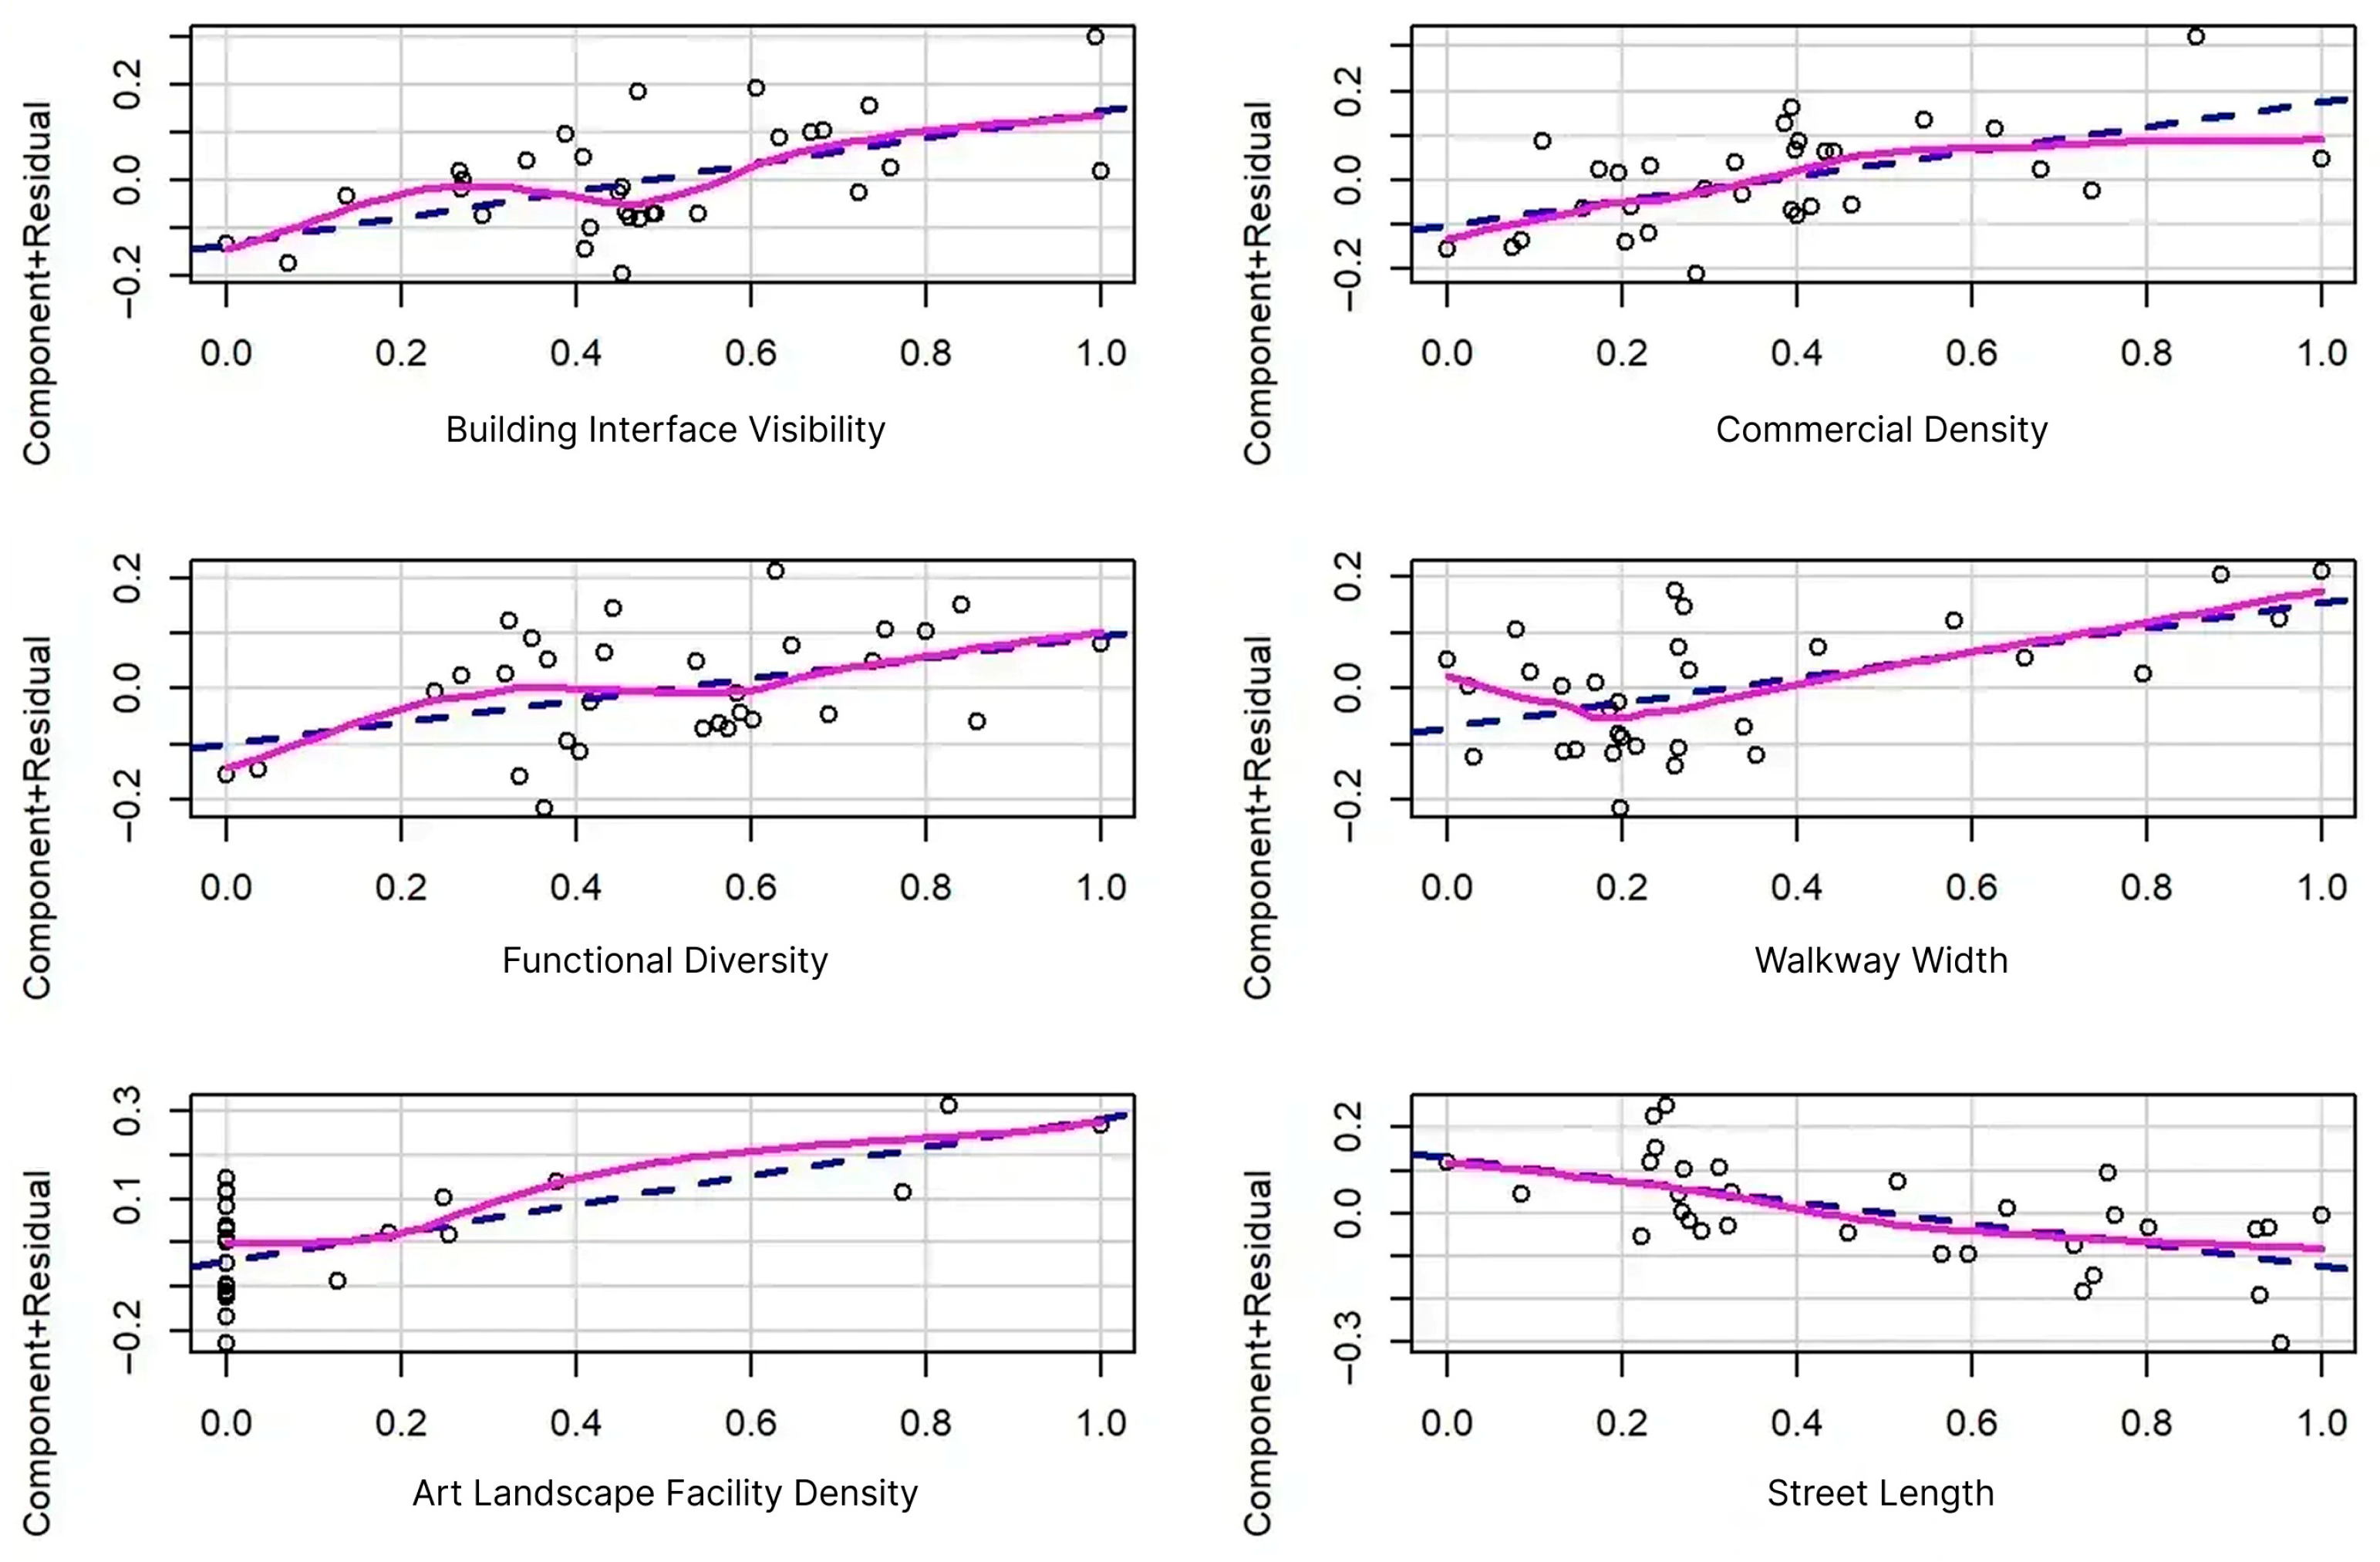
The partial regression plots illustrate the adjusted relationships between each significant spatial predictor and effective stationary behavior. Building interface visibility, commercial density, functional diversity, walkway width, and art landscape facility density display positive slopes, indicating their positive association with stationary behavior. Notably, the curve corresponding to art landscape facility density exhibits the most pronounced upward trend, visually reinforcing its role as the strongest positive contributor. Conversely, street length displays a clear negative slope, confirming its inverse relationship with stationary behavior. Furthermore, the dispersion of residual points around the fitted trends appears relatively homogeneous, providing visual support for the assumption of homoscedasticity and indicating no severe violations of regression assumptions (Figure 6).
Figure 6.
Partial Regression Plots of Independent Variables against Effective Stationary Behavior.
The estimated regression equation describing the relationship between spatial predictors and effective stationary behavior is formulated as Equation (4):
where Ystationary represents the intensity of effective stationary behavior; and the independent variables denote building interface visibility (Xvis), commercial density (Xcom), functional diversity (Xdiv), walkway width (Xwalk), art landscape facility density (Xart), and street length (Xlen).
Ystationary = 0.125 + 0.280 Xvis + 0.276 Xcom + 0.195 Xdiv + 0.224 Xwalk + 0.325 Xart − 0.253 Xlen
5.2. Model 2: Movement Behavior
Model 2 examines the influence of street spatial characteristics on pedestrian movement behavior, defined as the aggregated mean movement intensity across weekdays and weekends. The overall model exhibits strong explanatory capacity, with the independent variables collectively accounting for 82.0% of the variance in the dependent variable (R2 = 0.820, Adjusted R2 = 0.775). The high statistical significance (F = 18.204, p < 0.001) indicates that the selected spatial variables provide substantial predictive power for explaining variations in pedestrian mobility (Table 5).
Table 5.
Multiple Linear Regression Model 2 (Movement Behavior).
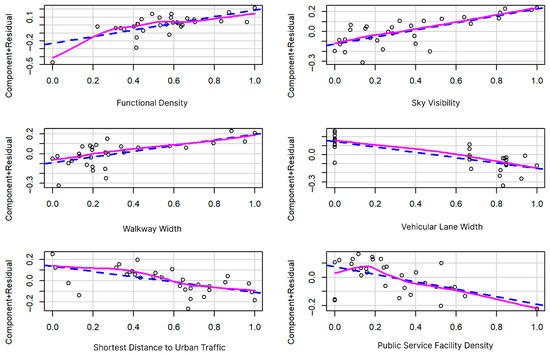
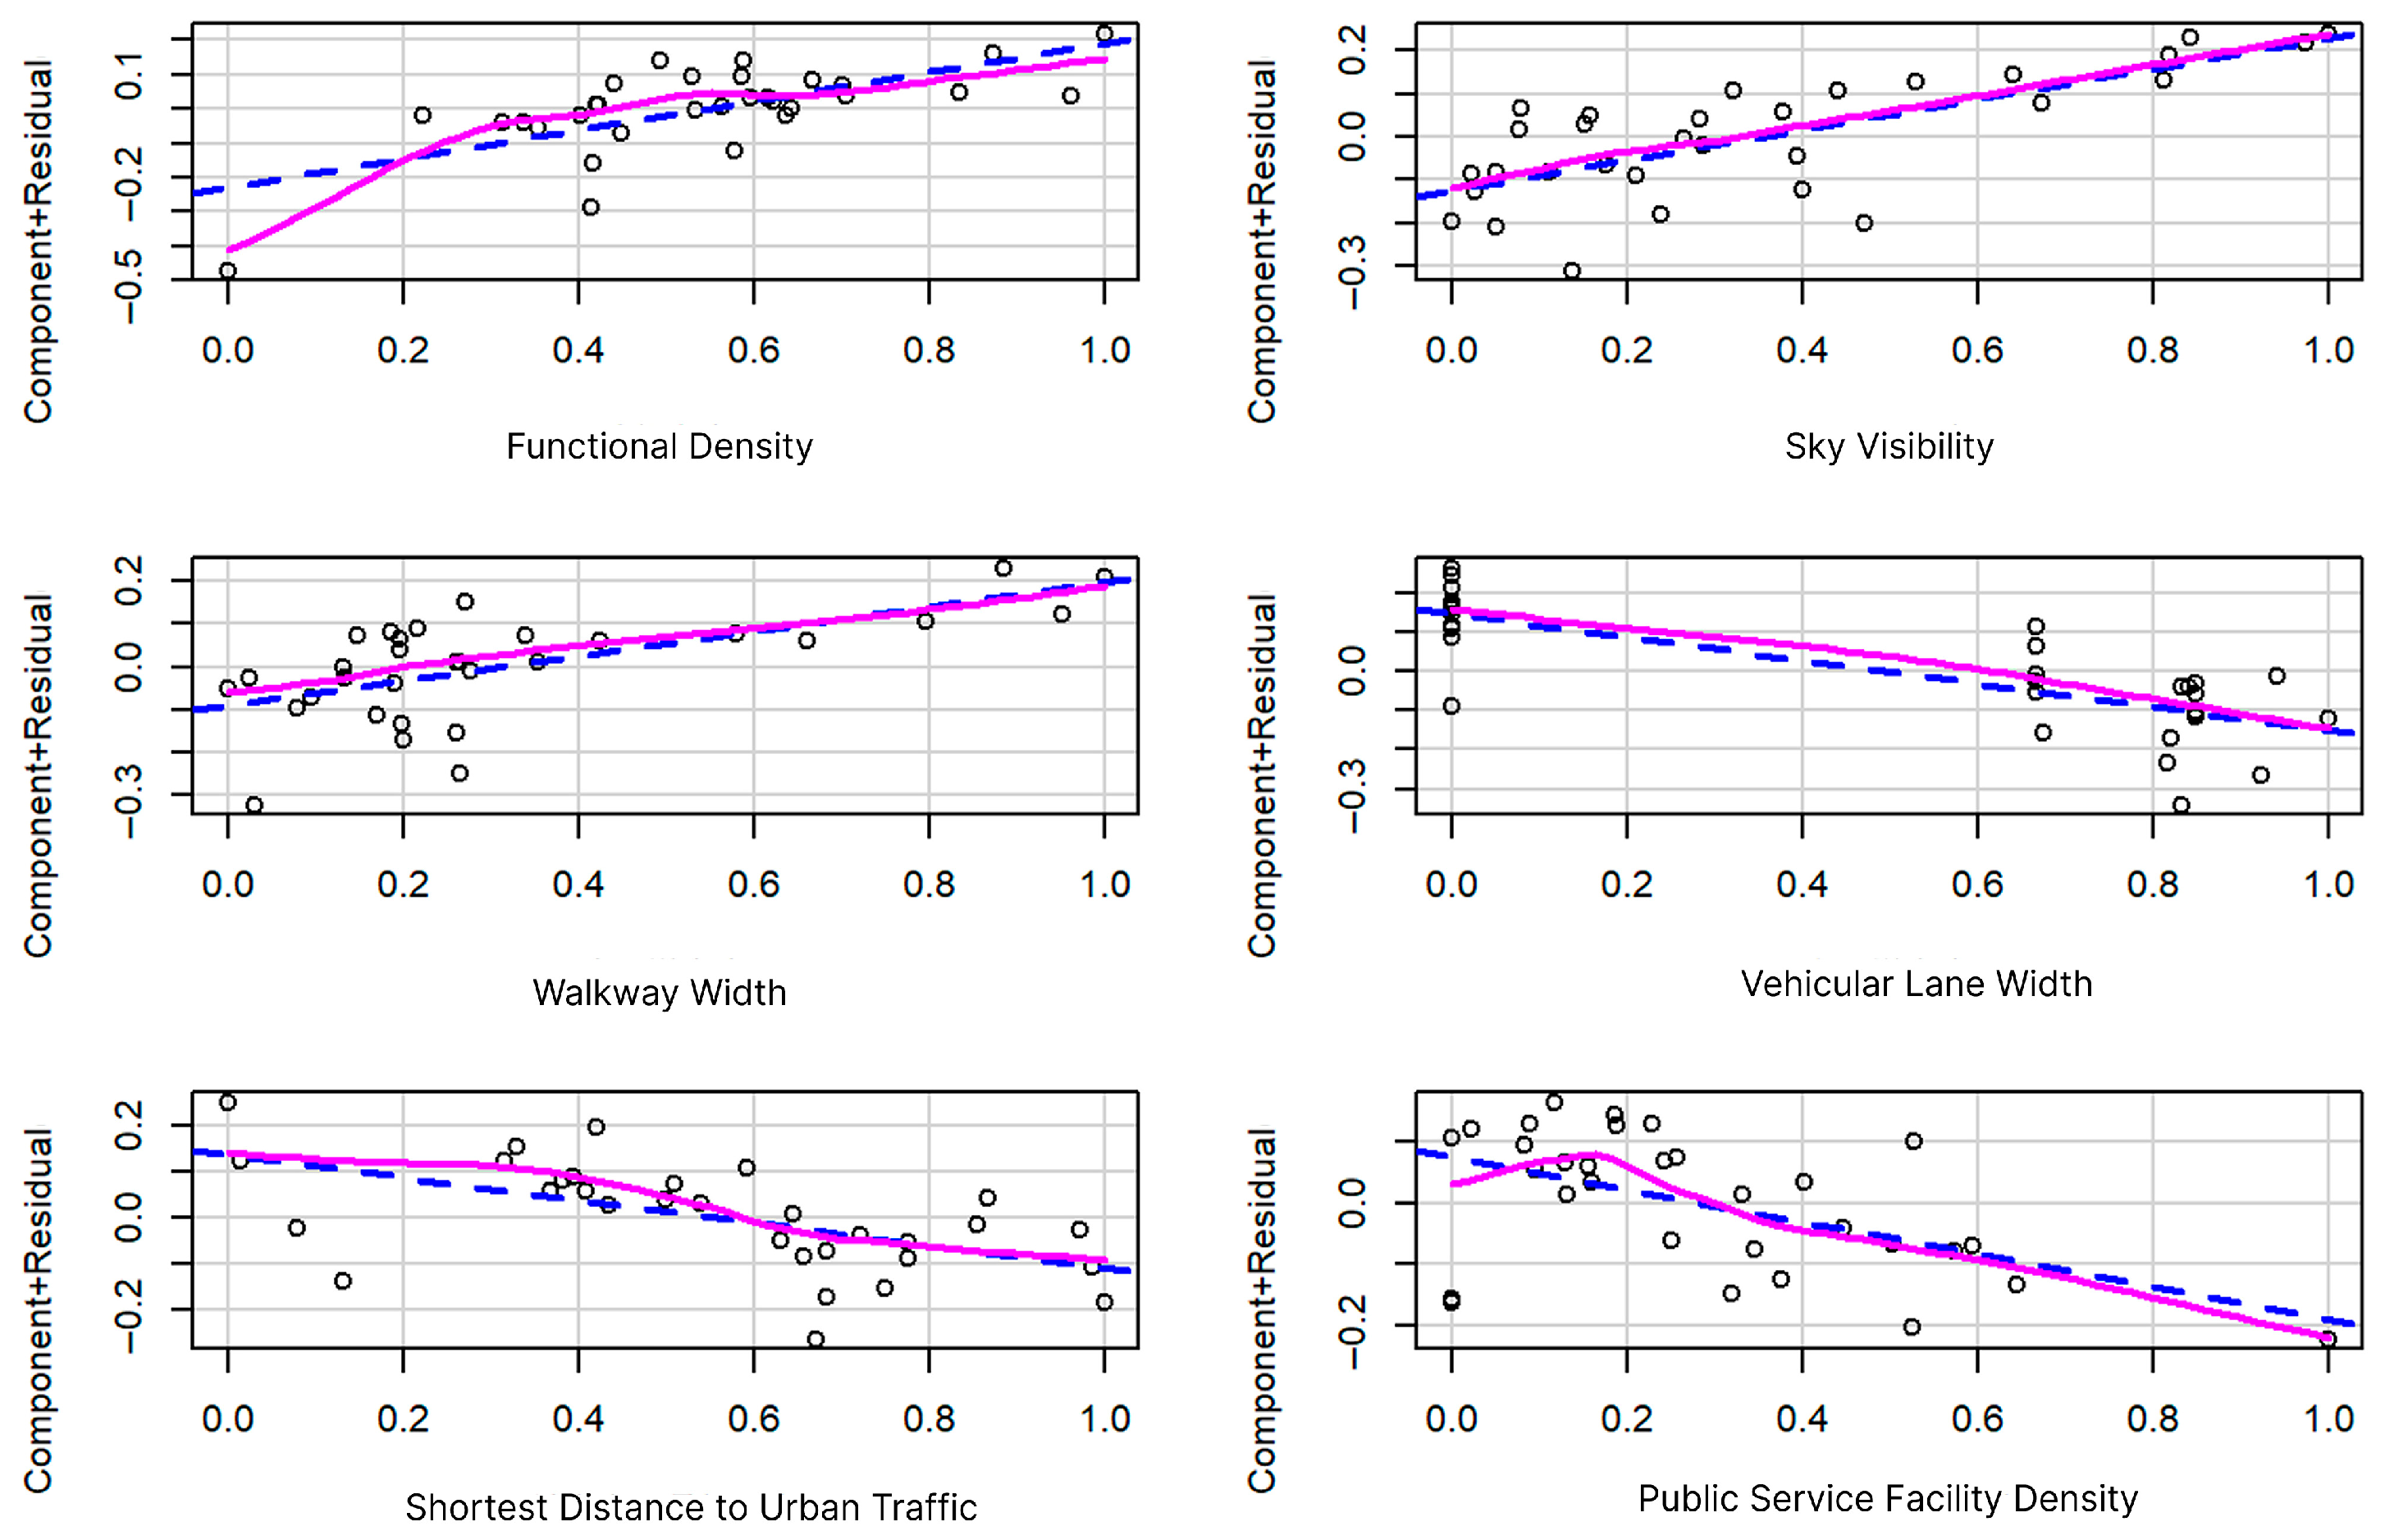
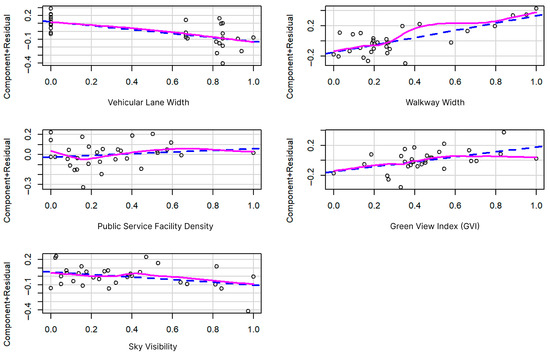
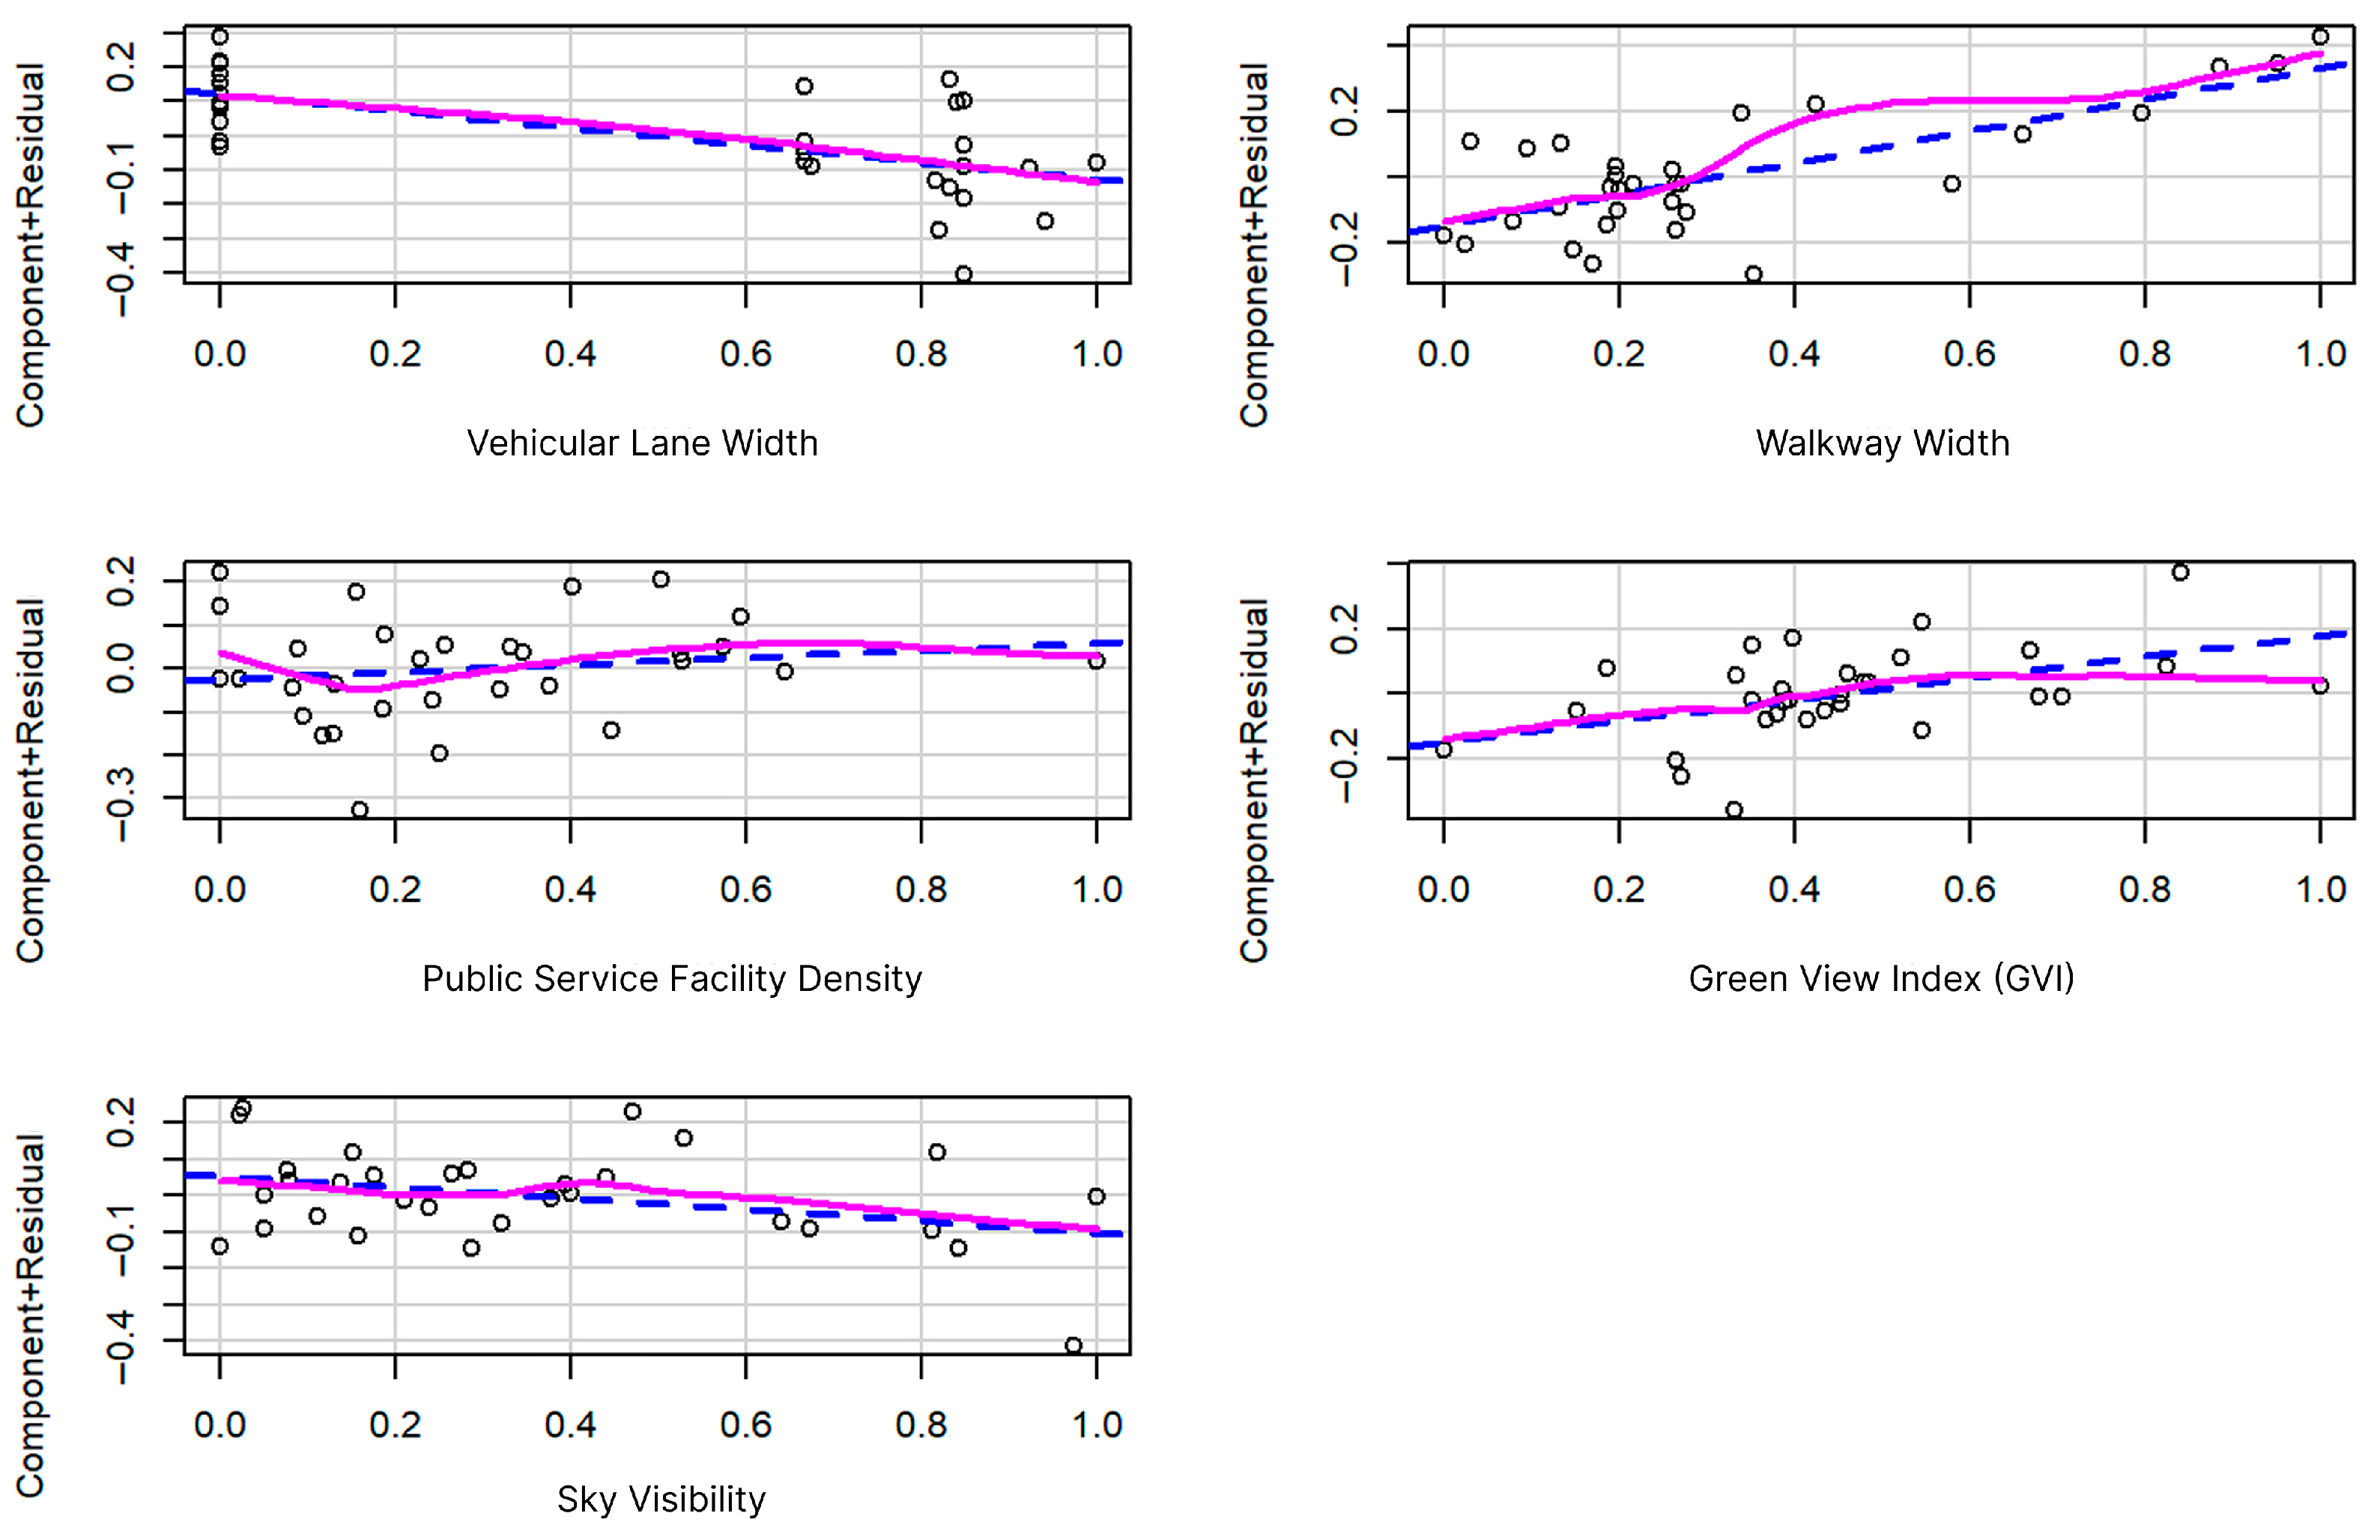
Among the predictors, Sky View Factor (SVF) emerged as the strongest positive determinant (β = 0.460, p < 0.001), followed by functional density (β = 0.390, p = 0.001) and walkway width (β = 0.346, p = 0.016). Conversely, vehicular lane width demonstrated the strongest negative impact on pedestrian mobility (β = −0.527, p < 0.001). The shortest distance to public transport also exhibited a significant negative coefficient (β = −0.295, p = 0.005), as did public service facility density (β = −0.273, p = 0.018). The strong negative impact of vehicular lane width, contrasted with the positive effect of walkway width, offers quantitative support for the ‘pedestrian priority’ principle widely advocated in contemporary street design manuals. The VIF values for all independent variables were below the threshold (VIF < 5), indicating the absence of multicollinearity issues (Table 6).
Table 6.
Results of Multiple Linear Regression (Movement Behavior).
The partial regression plots corroborated these relationships. Positive predictors display approximately linear upward trends with limited dispersion, while negative predictors, particularly vehicular lane width, show clear downward trajectories. Furthermore, all variance inflation factors remained well below critical thresholds, confirming that multicollinearity does not compromise coefficient stability or interpretability (Figure 7).
Figure 7.
Partial Regression Plots of Independent Variables against Movement Behavior.
The regression equation for the model is expressed as Equation (5):
Ymovement = 0.345 + 0.423 Xfunc_den + 0.351 Xsky + 0.288 Xwalk − 0.295 Xlane − 0.245 Xtransit − 0.268 Xpub
5.3. Model 3: Consumption Behavior
Model 3 examines the relationship between street spatial characteristics and consumption behavior, defined as the aggregated mean level of consumption-related activities observed across weekdays and weekends. The regression results indicate that the model achieved strong explanatory performance (R = 0.891, R2 = 0.794, Adjusted R2 = 0.743), with the overall equation reaching high statistical significance (F = 15.462, p < 0.001) (Table 7).
Table 7.
Multiple Linear Regression Model 3 (Consumption Behavior).
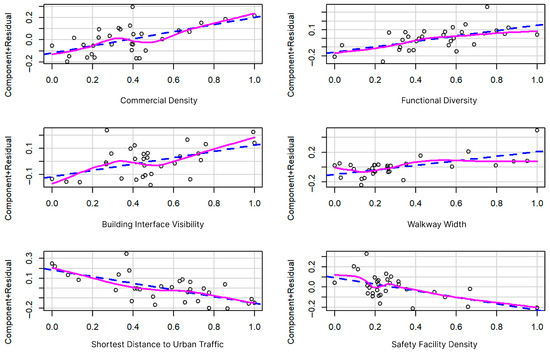
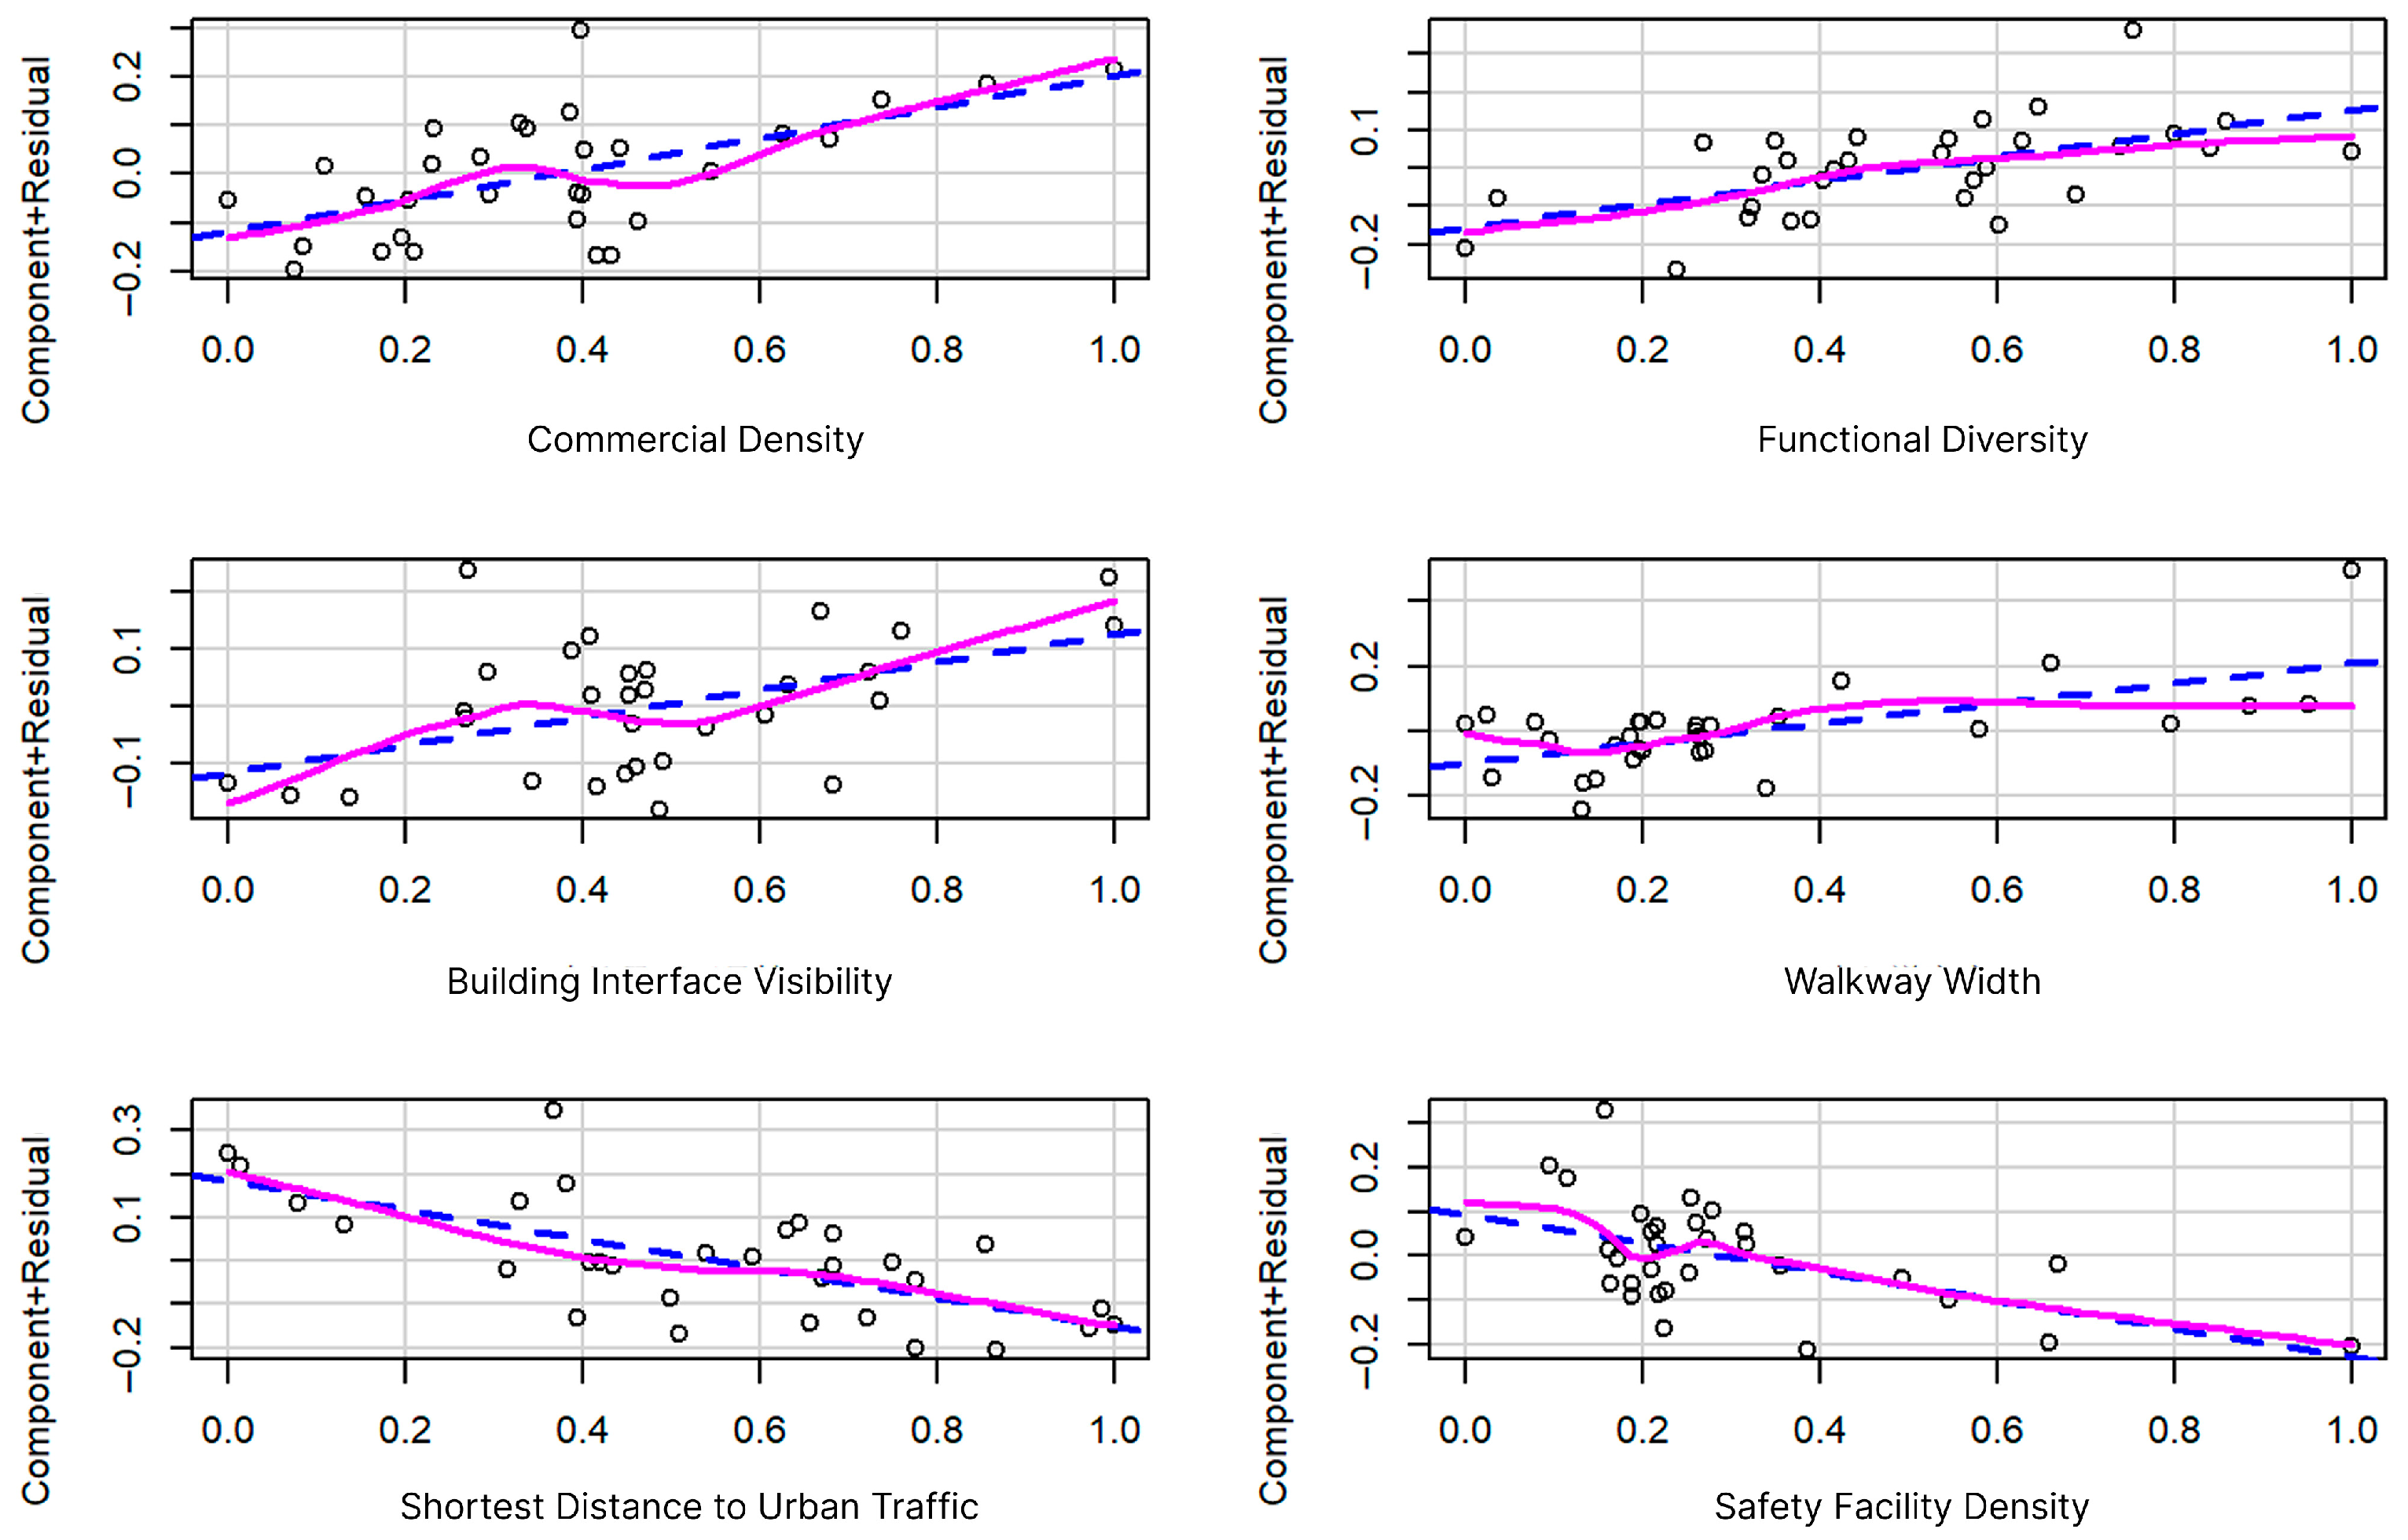
Among the predictors, the shortest distance to public transport emerged as the most influential factor, displaying a negative relationship with consumption behavior (β = −0.408, p < 0.001). Similarly, safety facility density exerted an inhibitory effect (β = −0.286, p = 0.007). On the other hand, walkway width had the strongest positive influence (β = 0.372, p = 0.003), followed by commercial density (β = 0.326, p = 0.008), functional diversity (β = 0.316, p = 0.02), and building interface visibility (β = 0.247, p = 0.020). Statistically, these positive influences corroborate the guideline principle of ‘micro-functional diversity,’ demonstrating that active, mixed-use edges effectively stimulate spontaneous consumption. The VIF values below conventional thresholds confirmed the absence of multicollinearity issues (Table 8).
Table 8.
Results of Multiple Linear Regression (Consumption Behavior).
The partial regression plots further corroborate these findings by visually demonstrating the direction and magnitude of the adjusted spatial–consumption relationships (Figure 8).
Figure 8.
Partial Regression Plots of Independent Variables against Consumption Behavior.
The regression equation for Model 3 is expressed as Equation (6):
Yconsumption = 0.158 + 0.318 Xcom + 0.308 Xdiv + 0.241 Xvis + 0.306 Xwalk − 0.334 Xtransit − 0.322 Xsafety
5.4. Model 4: Leisure Behavior
Model 4 examines the relationship between street spatial characteristics and leisure behavior, defined as the aggregated mean level of leisure-related activities observed across weekdays and weekends. The regression analysis revealed that the overall model exhibited high statistical significance (F = 17.791, p < 0.001). Furthermore, the model achieved strong explanatory capacity, accounting for 78.1% of the variance in the dependent variable (R2 = 0.781; Adjusted R2 = 0.737), indicating an excellent goodness of fit (Table 9).
Table 9.
Multiple Linear Regression Model 4 (Leisure Behavior).
Among the independent variables, walkway width emerged as the strongest positive predictor promoting leisure behavior (β = 0.503, p = 0.001). The Green View Index (GVI) also exhibited a significant positive influence (β = 0.258, p = 0.013). Conversely, vehicular lane width exerted a significant inhibitory effect on leisure behavior (β = −0.384, p = 0.004). In this specific model, public service facility density (p = 0.529) and Sky View Factor (p = 0.084) did not demonstrate statistically significant effects. This aligns perfectly with the ‘biophilic design and environmental comfort’ principles found in the guidelines, highlighting the necessity of generous, green pedestrian spaces for optional recreational activities. As observed in previous models, the VIF values remained well below the critical threshold (VIF < 5), indicating the absence of multicollinearity issues (Table 10).
Table 10.
Results of Multiple Linear Regression (Leisure Behavior).
The regression results were visualized as partial regression plots to illustrate the adjusted relationships between each independent variable and leisure behavior (Figure 9).
Figure 9.
Partial Regression Plots of Independent Variables against Leisure Behavior.
Based on the unstandardized coefficients, the regression equation for Model 4 is formulated as Equation (7):
Yleisure = 0.386 + 0.484 Xwalk − 0.248 Xlane + 0.327 Xgvi + 0.081 Xpub − 0.154 Xsky
5.5. Model 5: Viewing Behavior
Model 5 examines the influence of street spatial characteristics on viewing (sightseeing) behavior, representing the aggregated mean intensity of visual exploration and observation activities. The regression analysis revealed that the overall model exhibited high statistical significance (F = 13.300, p < 0.001). The model accounted for 72.7% of the variance in the dependent variable (R2 = 0.727; Adjusted R2 = 0.672), indicating a favorable goodness of fit (Table 11).
Table 11.
Multiple Linear Regression Model 5 (Viewing Behavior).
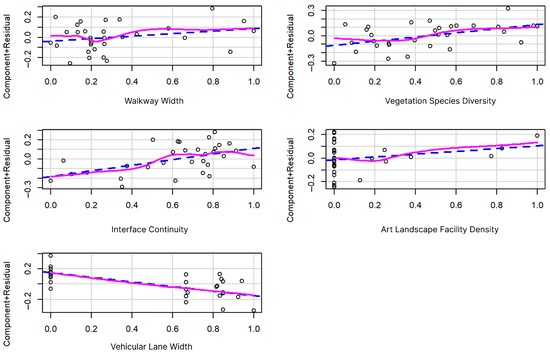
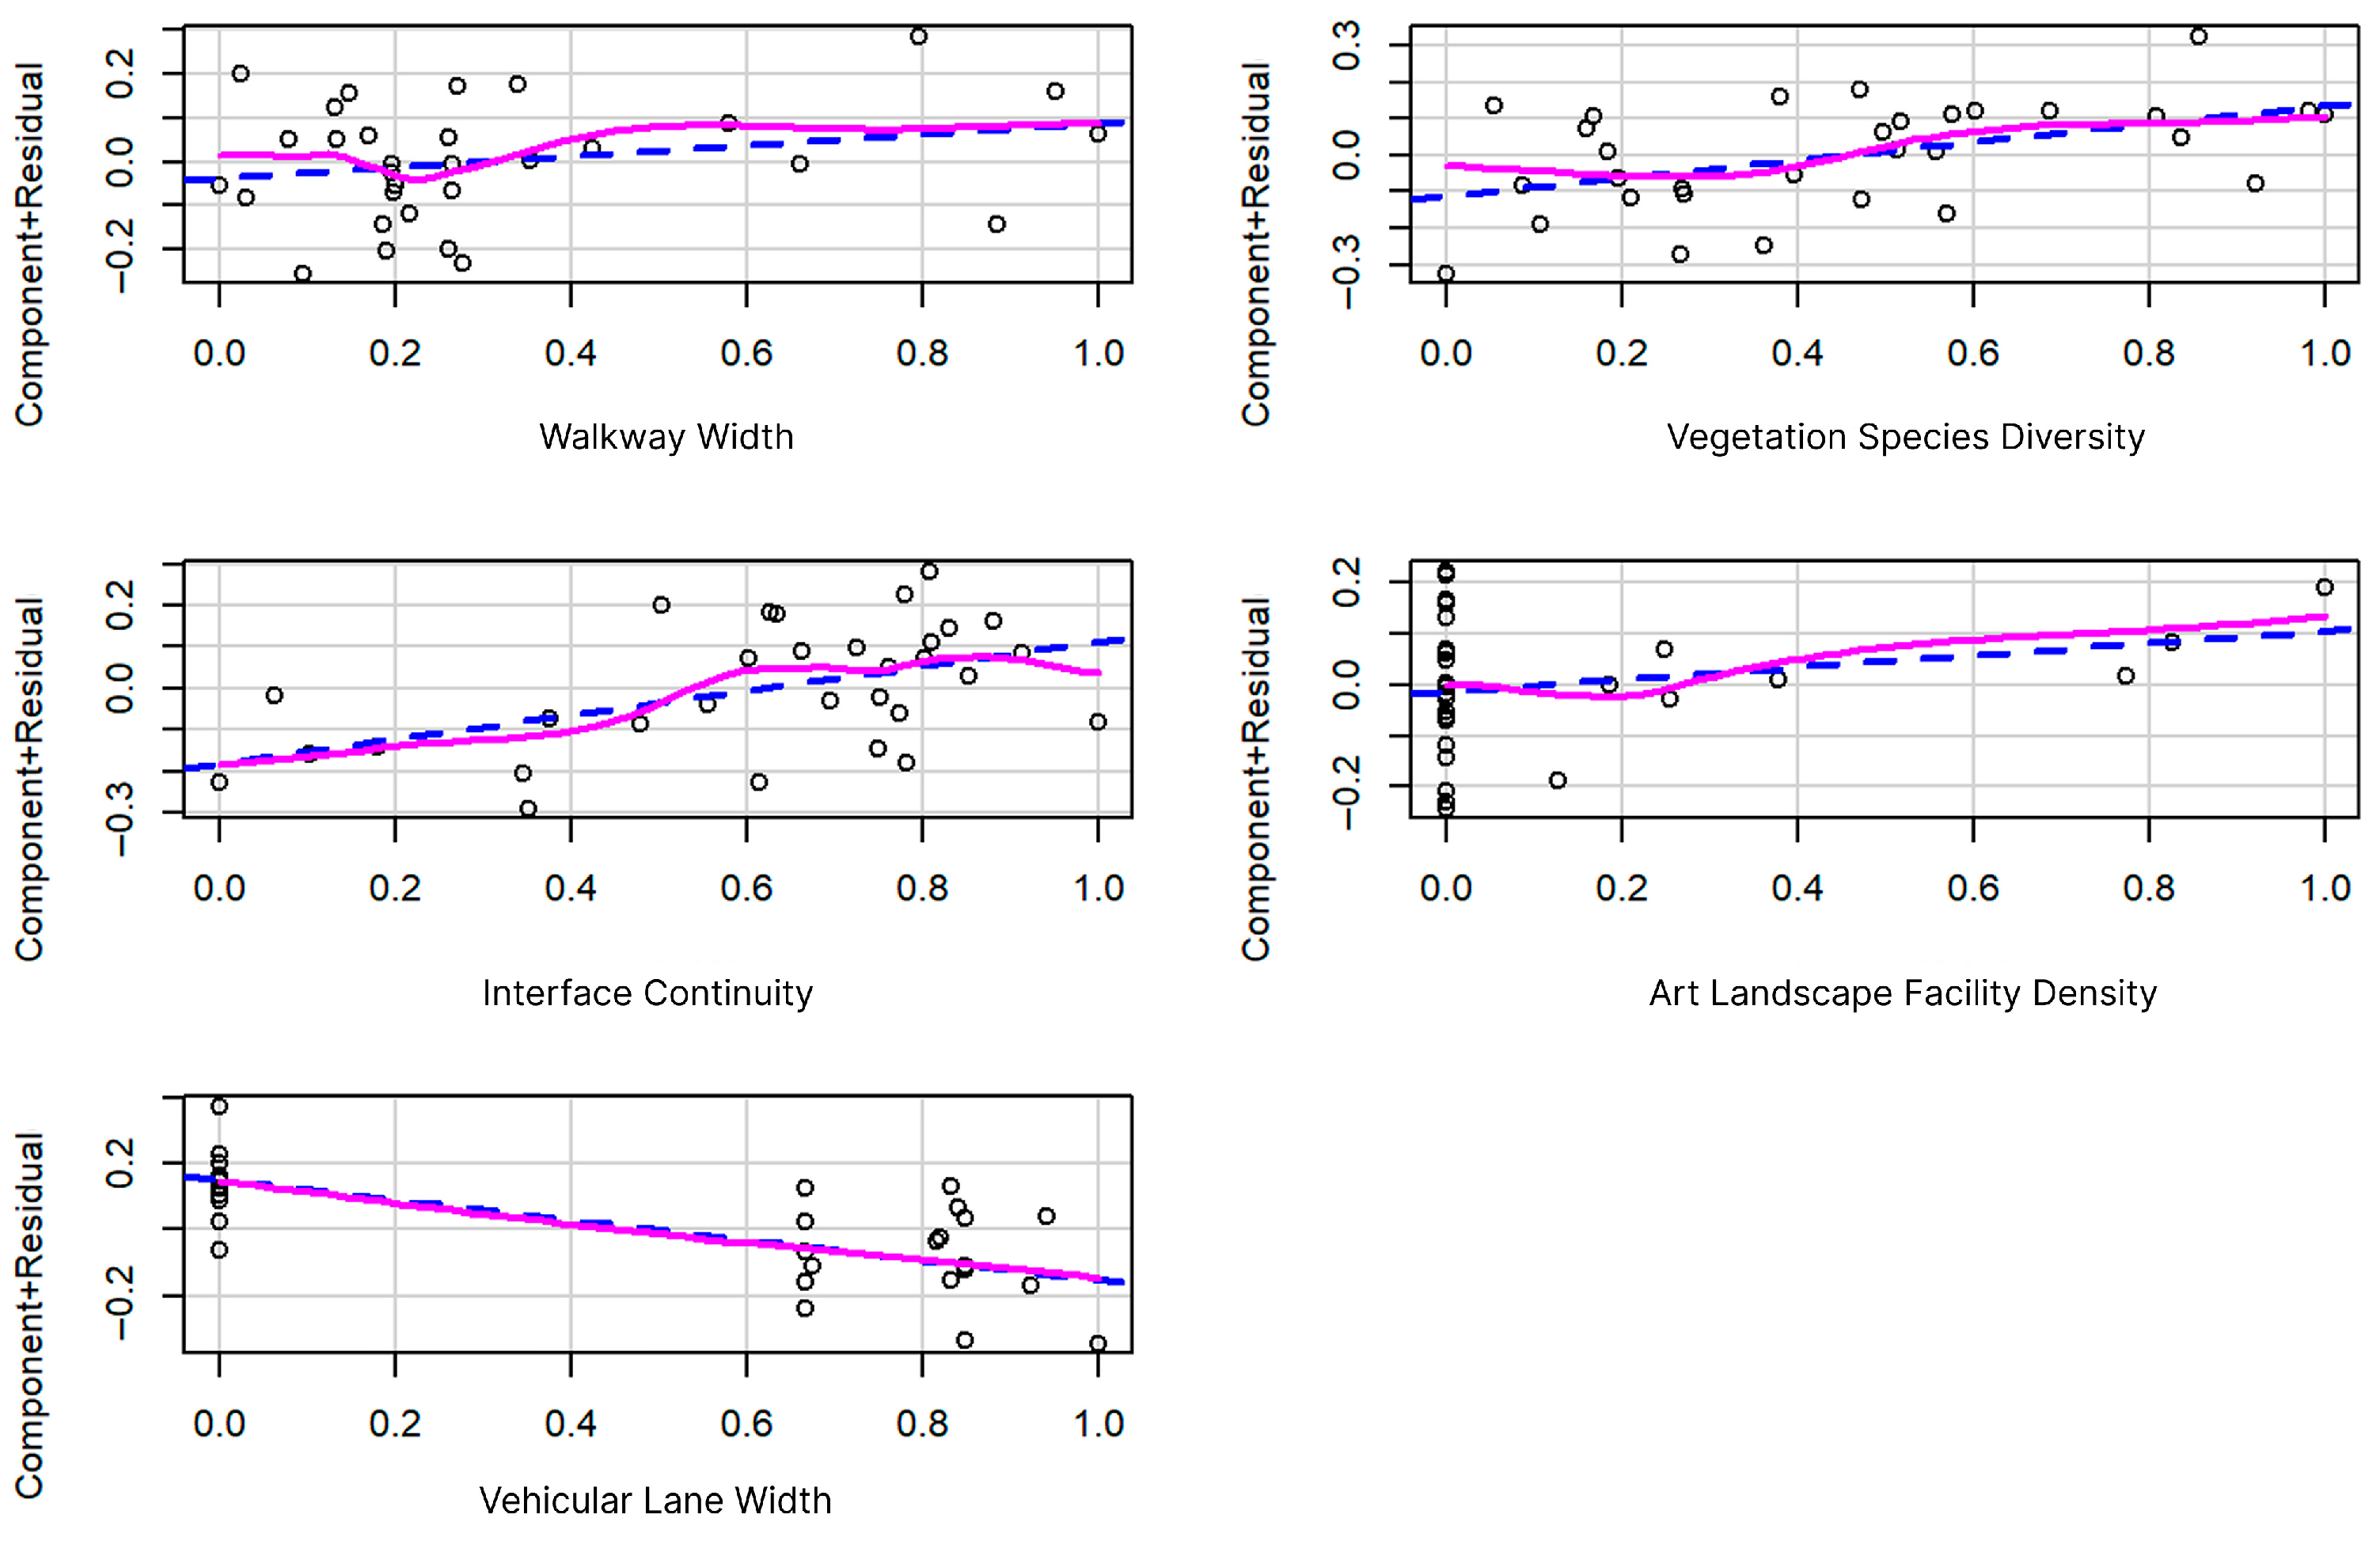
Among the independent variables, vehicular lane width emerged as the strongest predictor of viewing behavior, exerting a significant inhibitory effect (β = −0.491, p = 0.002). On the other hand, interface continuity (β = 0.305, p = 0.010) and vegetation species diversity (β = 0.282, p = 0.015) both exhibited significant promoting effects on viewing behavior. Walkway width (p = 0.335) and art landscape facility density (p = 0.315) did not demonstrate statistically significant independent effects in this specific model. These results statistically confirm the guideline principles of maintaining ‘interface continuity’ and visual interaction, indicating that an uninterrupted, visually diverse environment is essential for encouraging visual exploration. The VIF values were all well below 5, confirming the reliability of the coefficient estimates (Table 12).
Table 12.
Results of Multiple Linear Regression (Viewing Behavior).
The partial regression plots further corroborate these findings, visually demonstrating the direction and magnitude of the adjusted spatial–viewing relationships (Figure 10).
Figure 10.
Partial Regression Plots of Independent Variables against Viewing Behavior.
The regression equation for Model 5 is expressed as Equation (8):
Yviewing = 0.228 + 0.292 Xinter + 0.247 Xveg − 0.303 Xlane + 0.124 Xwalk + 0.120 Xart
6. Discussion
6.1. Summary of Findings
Regarding basic spatial elements, walkway width consistently promotes all types of behaviors, demonstrating particularly strong support for leisure and consumption. For effective stay, which reflects the depth of spatial engagement, art landscape facilities serve as a core driving factor for prolonging duration. When synergistically combined with highly transparent building interfaces and dense commercial functions, these elements create high-quality behavioral nodes. Furthermore, the influence of spatial elements varies significantly across specific behavior types: functional density emerges as the most prominent factor enhancing movement frequency; commercial density most directly encourages consumption behavior; and generous walkway width, coupled with a high Green View Index (GVI), exhibits the most significant inducing effect on leisure activities. Conversely, vehicular lane width consistently inhibits almost all optional and social behaviors, underscoring the negative impact of traffic-dominated spaces on street vitality.
Although based on a single case study of Shamian Island, the consistency of these regression results suggests they reflect underlying human–environment interaction mechanisms rather than being entirely unique to Guangzhou. Shamian Island represents a typical high-density, mixed-use historic district characterized by diverse spatial scales, rich architectural interfaces, and composite crowd activities. Therefore, these evidence-based spatial optimization strategies demonstrate the potential to be applied to similar comprehensive street environments, historic conservation areas, and tourism-oriented commercial districts in other cities. However, further empirical validation across diverse urban contexts is recommended to confirm their broader generalizability.
6.2. Urban Design Guidelines
To translate these empirical findings into actionable spatial optimization strategies, a set of urban design guidelines was formulated (Table 13). This summary highlights how specific spatial interventions correspond to target behaviors and assesses their context generalizability—distinguishing between universally applicable principles and those tailored to historical or tourism-oriented districts like Shamian Island.
Table 13.
Evidence-based Urban Design Guidelines and Context Generalizability.
6.3. Research Implications
This study constructs a tripartite cognitive framework of ‘Space-Perception-Behavior,’ proposing the quantification of subjective perception through objective behavioral representations. This approach provides a reference path for resolving the long-standing challenge of subjective evaluation in urban design. Furthermore, while the traditional “streetscape” literature often relies heavily on static visual assessments or subjective self-reports [37,39], this study demonstrates methodological innovation by systematically linking physical streetscape elements to dynamic, fine-grained behavioral proxies.
Through the case study of Shamian Island in Guangzhou, the research defines specific measurement indicators for both objective street characteristics and subjective perceptions, revealing the internal correlation logic among these elements. The established comprehensive measurement model, which links subjective and objective factors, offers an operable and scalable quantitative tool for assessing street space quality and formulating design proposals. This facilitates a paradigm shift in design decision-making—from a traditional experience-driven approach to an evidence-based, data-driven methodology—thereby mitigating design errors caused by subjective speculation and significantly enhancing the precision and efficiency of spatial design.
6.4. Limitations and Future Research
While this study offers valuable empirical insights, several limitations warrant future exploration. First, although the predictor-to-sample ratio (approximately 1:5) meets basic requirements, the high R2 values indicate a potential risk of overfitting. Because the sample size is strictly limited by the island’s natural boundaries (N = 31), conducting meaningful out-of-sample validation (e.g., data splitting) was unfeasible in this study. Therefore, replication studies across broader urban contexts and larger sample sizes are needed to facilitate rigorous out-of-sample cross-validation and ensure the generalizability of the theoretical model. Second, to eliminate dynamic interferences (e.g., weather, crowding) inherent in in situ photography, future research could leverage Virtual Reality (VR) and eye-tracking for precise spatial manipulation and objective perceptual quantification. In this regard, recent pioneering research by Belaroussi et al. has already demonstrated the immense potential of such approaches [44,45]. Their work reveals how Multimodal Large Language Models (MLLMs) and immersive VR environments can objectively simulate human cognition and predict the quality and walkability of public spaces. Integrating these AI-driven quantitative tools into our behavioral proxy framework will be a crucial next step for developing adaptive urban design strategies.
Third, although our tests confirmed no significant spatial autocorrelation within the current models, future large-scale studies should further explore spatial econometrics. Additionally, slight curvatures in several partial regression plots indicate potential non-linear threshold effects (e.g., optimal walkway capacity), suggesting that future research should integrate non-linear modeling frameworks.
7. Conclusions
This study validates using behavioral representations as a proxy for subjective perception, effectively transforming abstract street quality assessment into a measurable ‘Space-Behavior’ analysis.
Regression models revealed that spatial elements drive behaviors differently: art landscapes significantly induce stationary behavior, while walkway width and commercial density enhance movement and leisure. Consequently, street elements should be configured systematically based on anticipated behaviors. However, a critical evaluation indicates that while features like walkway width act as universal drivers, the effectiveness of elements like art installations remains highly dependent on local cultural contexts.
Future research will expand to diverse historic districts to verify the model’s generalizability and integrate Virtual Reality (VR) with physiological monitoring (e.g., EDA) to enrich perceptual data. Additionally, a key knowledge gap has emerged regarding how these space-behavior interactions fluctuate across different seasons or micro-climates, which must be addressed to develop truly adaptive urban design strategies.
Author Contributions
Conceptualization, K.X.; methodology, K.X., S.X. and E.L.; software, Y.O.; validation, K.X., Z.L. and Y.O.; formal analysis, Y.O.; investigation, Y.O.; resources, Z.L.; data curation, Y.O.; writing—original draft preparation, Z.L.; writing—review and editing, K.X., Z.L., S.X. and E.L.; visualization, Y.O.; supervision, Z.L. and E.L.; project administration, Z.L. All authors have read and agreed to the published version of the manuscript.
Funding
This research was funded by the Guangdong Planning Office of Philosophy and Social Science, grant number GD24CYS39; and the Guangdong Basic and Applied Basic Research Foundation, grant number 2024A1515012576.
Data Availability Statement
The data presented in this study are available on request from the corresponding author.
Conflicts of Interest
The authors declare no conflicts of interest.
Glossary
| Behavioral Proxy | An observable action used as a quantifiable metric to represent and evaluate underlying subjective human perceptions. |
| Behavioral Representation | The overt actions (e.g., lingering, moving, consuming) reflecting how users interact with spatial environments. |
| Effective Stationary | Long-duration stays or lingering activities that indicate a higher depth of spatial attractiveness and user engagement. |
| FCN | Fully Convolutional Network: A deep learning architecture used in this study for the semantic segmentation of street-view imagery |
| GVI | Green View Index: The proportion of vegetation elements visible in a street-view image, reflecting perceptual exposure to greenery. |
| SVF | Sky View Factor: The proportion of sky elements visible in a street-view image, indicating spatial openness and daylight availability. |
| SVI | Street View Imagery: 360-degree panoramic images captured at eye level to objectively assess the physical and visual street environment. |
| Interface Continuity | The proportion of the building frontage that is continuously aligned with the street building line, indicating spatial enclosure. |
| MLR | Multiple Linear Regression: A statistical technique utilized to model the quantitative relationship between spatial characteristics |
| VIF | Variance Inflation Factor: A diagnostic metric used to detect multicollinearity among independent variables. |
Appendix A
This appendix details the 95% confidence intervals (CIs) for the unstandardized regression coefficients across all five models. These supplementary data are presented here to illustrate estimation uncertainty without disrupting the narrative flow and conciseness of the main text.
Table A1.
95% Confidence Intervals for Model 1 (Effective Stationary Behavior).
Table A2.
95% Confidence Intervals for Model 2 (Movement Behavior).
Table A3.
95% Confidence Intervals for Model 3 (Consumption Behavior).
Table A4.
95% Confidence Intervals for Model 4 (Leisure Behavior).
Table A5.
95% Confidence Intervals for Model 5 (Viewing Behavior).
References
- Abusaada, H.; Elshater, A. Effect of people on placemaking and affective atmospheres in city streets. Ain Shams Eng. J. 2021, 12, 3389–3403. [Google Scholar] [CrossRef] [Scilit]
- Miranda, A.S.; Fan, Z.; Duarte, F.; Ratti, C. Desirable streets: Using deviations in pedestrian trajectories to measure the value of the built environment. Comput. Environ. Urban Syst. 2021, 86, 101563. [Google Scholar] [CrossRef] [Scilit]
- Ashihara, Y. The Aesthetic of the Street; Baihua Literature and Art Publishing House: Tianjin, China, 2006. [Google Scholar]
- Xie, W.; Yao, L.; Xia, D.; Zou, Y.; Lou, S.; Yang, L. Occupant Behavior and Building Type Jointly Shape Indoor Heat Stress in Guangzhou Urban Villages. Build. Environ. 2026, 296, 114505. [Google Scholar] [CrossRef] [Scilit]
- Zou, Y.; Xie, W.; Lou, S.; Huang, Y.; Xia, D.; Yang, X.; Feng, C. Prediction Model Establishment for Residential Community Occupancy Considering Urban Environment. J. Build. Eng. 2024, 96, 110463. [Google Scholar] [CrossRef] [Scilit]
- Juan, Y.-K.; Chen, Y. The Influence of Indoor Environmental Factors on Learning: An Experiment Combining Physiological and Psychological Measurements. Build. Environ. 2022, 221, 109299. [Google Scholar] [CrossRef] [Scilit]
- Asim, F.; Chani, P.S.; Shree, V.; Rai, S. Restoring the mind: A neuropsychological investigation of university campus built environment aspects for student well-being. Build. Environ. 2023, 244, 110810. [Google Scholar] [CrossRef] [Scilit]
- Ye, Y.; Zhang, Z.; Zhang, X.; Zeng, W. Human-scale quality on streets: A large-scale and efficient analytical approach based on street view images and new urban analytical tools. Urban Plan. Int. 2019, 34, 18–27. [Google Scholar] [CrossRef] [Scilit]
- Xu, L.; Shi, J. Walking activity quality and built environment: Take three commercial streets in Shanghai as examples. Shanghai Urban Plan. Rev. 2017, 1, 17–24. [Google Scholar]
- Sun, H.; Xu, H.; He, H.; Wei, Q.; Yan, Y.; Chen, Z.; Li, X.; Zheng, J.; Li, T. A spatial analysis of urban streets under deep learning based on street view imagery: Quantifying perceptual and elemental perceptual relationships. Sustainability 2023, 15, 14798. [Google Scholar] [CrossRef] [Scilit]
- Guo, X.; Lai, J.; Ma, Z. Consistency analysis of virtual evaluation and field survey methods for street quality: A case study of rail transit core areas in Shenzhen. Planners 2022, 6, 70–78. [Google Scholar]
- Huang, J.X.; Liang, J.Q.; Yang, M.S.; Li, Y. Street space visual quality evaluating method of tourism sites based on street view images. J. Geo-Inf. Sci. 2024, 26, 352–366. [Google Scholar]
- Xiao, Y.; Song, M. How are urban design qualities associated with perceived walkability? An AI approach using street view images and deep learning. Int. J. Urban Sci. 2025, 29, 66–91. [Google Scholar] [CrossRef] [Scilit]
- Jeon, J.Y.; Jo, H.I. Effects of audio-visual interactions on soundscape and landscape perception and their influence on satisfaction with the urban environment. Build. Environ. 2020, 169, 106544. [Google Scholar] [CrossRef] [Scilit]
- Kasraian, D.; Adhikari, S.; Kossowsky, D.; Luubert, M.; Hall, B.G.; Hawkins, J.; Nurul Habib, K.; Roorda, M.J. Evaluating pedestrian perceptions of street design with a 3D stated preference survey. Environ. Plan. B Urban Anal. City Sci. 2021, 48, 1787–1805. [Google Scholar] [CrossRef] [Scilit]
- Lan, W.; Duan, J.; Yang, B. A public perception-oriented evaluation model of urban spatial identity and its empirical research: Taking the main urban area of Wuhan as an example. City Plan. Rev. 2021, 45, 67–76. [Google Scholar]
- Shi, J.; Yan, Y.; Li, M.; Zhou, L. Measuring the convergence and divergence in urban street perception among residents and tourists through deep learning: A case study of Macau. Land 2024, 13, 345. [Google Scholar] [CrossRef] [Scilit]
- Zhao, X.; Qiu, X.; Xu, J.; Hou, Y. Review of research methods for green spatial behavioral activities and environmental cognition. Landsc. Archit. 2020, 27, 56–62. [Google Scholar]
- Hu, G.; Huang, J.; Li, F. Spatial network structure analysis of Xia-Zhang-Quan metropolitan area: LBS big data analysis based on crowds’ activities characteristics. Mod. Urban Res. 2019, 11, 13–19. [Google Scholar]
- Fu, Y.; Yang, F.; Bao, Z. Research on accessibility of Hangzhou comprehensive parks based on spatial syntax and LBS big data. Landsc. Archit. 2021, 28, 69–75. [Google Scholar]
- Yin, Z.; Wang, D.; Zhai, B.; Zhang, T.; Yan, L. Inferring non-work activity purposes from mobile phone signaling data: Insights from Shanghai. Prog. Geogr. 2025, 44, 583–593. [Google Scholar]
- Komossa, F.; van der Zanden, E.H.; Verburg, P.H. Characterizing outdoor recreation user groups: A typology of peri-urban recreationists in the Kromme Rijn area, the Netherlands. Land Use Policy 2019, 80, 246–258. [Google Scholar] [CrossRef] [Scilit]
- Chen, J.; Jin, X.; Shi, X. Research on commercial space design strategies for metro stations based on passenger behavioral preferences. Mod. Urban Res. 2025, 72–77. [Google Scholar]
- Fu, X.; Qin, T.; Sun, H.; Ye, R.; Yang, Q.; Zhou, T. Inclusive design strategy research of urban green space based on behavior preference. J. Southwest China Norm. Univ. (Nat. Sci. Ed.) 2022, 47, 86–96. [Google Scholar] [CrossRef]
- Whyte, W.H. The Social Life of Small Urban Spaces; Project for Public Spaces: New York, NY, USA, 1980. [Google Scholar]
- Mao, Z.-R.; Chen, X.-K.; Xiang, Z.-H.; Chen, Y. Research on the measurement and influencing factors of street vigour in historic districts: A case study of Wenming Street historic district in Kunming. S. Archit. 2021, 4, 48–55. [Google Scholar]
- Xuan, X.; Yan, M.; Zou, J.; Zheng, Y.; Zhang, Z. Exploring the influences of the tourist path space quality on visitor behaviors under a physical environment intervention: A case study based on Sanhe ancient town in Hefei city. S. Archit. 2024, 5, 14–28. [Google Scholar]
- Katzmarzyk, P.T.; Tremblay, M.S. Limitations of Canada’s physical activity data: Implications for monitoring trends. Appl. Physiol. Nutr. Metab. 2007, 32, S185–S194. [Google Scholar] [CrossRef] [Scilit]
- Mayor of London. Streetscape Guidance 2017 Revision; Transport for London: London, UK, 2019. [Google Scholar]
- New York City Department of Transportation. Street Design Manual; NYC DOT: New York, NY, USA, 2015. [Google Scholar]
- Abu Dhabi Urban Planning Council. Abu Dhabi Urban Street Design Manual; Abu Dhabi UPC: Abu Dhabi, United Arab Emirates, 2015. [Google Scholar]
- Shanghai Municipal Planning and Land Resource Administration Bureau; Shanghai Municipal Transportation Commission; Shanghai Urban Planning and Design Research Institute. Shanghai Street Design Guidelines; Tongji University Press: Shanghai, China, 2016. [Google Scholar]
- Guangzhou Municipal Housing and Urban-Rural Development Bureau; Guangzhou Urban Planning and Design Survey Research Institute. Guangzhou Urban Road All-Elements Design Manual; China Architecture & Building Press: Beijing, China, 2018. [Google Scholar]
- Beijing Municipal Commission of Planning and Natural Resources; Beijing Municipal Institute of City Planning and Design. Urban Design Guidelines for Beijing Street Renewal and Governance; Beijing Municipal Commission of Planning and Natural Resources: Beijing, China, 2018. [Google Scholar]
- Aboulnaga, M.; Ashour, F.; Elsharkawy, M.; Lucchi, E.; Gamal, S.; Elmarakby, A.; Haggagy, S.; Karar, N.; Khashaba, N.H.; Abouaiana, A. Urbanization and drivers for dual capital city: Assessment of urban planning principles and indicators for a ‘15-Minute City’. Land 2025, 14, 382. [Google Scholar] [CrossRef] [Scilit]
- Gehl, J. Cities for People; Island Press: Washington, DC, USA, 2010. [Google Scholar]
- Ewing, R.; Handy, S. Measuring the unmeasurable: Urban design qualities related to walkability. J. Urban Des. 2009, 14, 65–84. [Google Scholar] [CrossRef] [Scilit]
- Gehl, J. Life Between Buildings: Using Public Space; Van Nostrand Reinhold: New York, NY, USA, 1987. [Google Scholar]
- Mehta, V. Lively streets: Determining environmental characteristics to support social behavior. J. Plan. Educ. Res. 2007, 27, 165–187. [Google Scholar] [CrossRef] [Scilit]
- Lucchi, E.; Romano, G.; Altamura, P.; Baiani, S. Criticity mapping and integration quantity evaluation of solar installations in Mediterranean heritage territories. In Sustainability in Energy and Buildings 2023; Littlewood, J.R., Jain, L., Howlett, R.J., Eds.; Springer: Singapore, 2024; pp. 367–378. [Google Scholar] [CrossRef] [Scilit]
- Hair, J.F.; Black, W.C.; Babin, B.J.; Anderson, R.E. Multivariate Data Analysis, 8th ed.; Cengage Learning: Boston, MA, USA, 2019. [Google Scholar]
- Long, J.; Shelhamer, E.; Darrell, T. Fully convolutional networks for semantic segmentation. IEEE Trans. Pattern Anal. Mach. Intell. 2015, 39, 640–651. [Google Scholar]
- Yao, Y.; Liang, Z.; Yuan, Z.; Liu, P.; Bie, Y.; Zhang, J.; Wang, R.; Wang, J.; Guan, Q. A human-machine adversarial scoring framework for urban perception assessment using street-view images. Int. J. Geogr. Inf. Sci. 2019, 33, 2363–2384. [Google Scholar] [CrossRef] [Scilit]
- Belaroussi, R.; Issa, E.; Cameli, L.; Lantieri, C.; Adelé, S. Exploring Virtual Environments to Assess the Quality of Public Spaces. Algorithms 2024, 17, 124. [Google Scholar] [CrossRef] [Scilit]
- Belaroussi, R. Subjective Assessment of a Built Environment by ChatGPT, Gemini and Grok: Comparison with Architecture, Engineering and Construction Expert Perception. Big Data Cogn. Comput. 2025, 9, 100. [Google Scholar] [CrossRef] [Scilit]

Disclaimer/Publisher’s Note: The statements, opinions and data contained in all publications are solely those of the individual author(s) and contributor(s) and not of MDPI and/or the editor(s). MDPI and/or the editor(s) disclaim responsibility for any injury to people or property resulting from any ideas, methods, instructions or products referred to in the content. |
© 2026 by the authors. Licensee MDPI, Basel, Switzerland. This article is an open access article distributed under the terms and conditions of the Creative Commons Attribution (CC BY) license.