


Abstract
Wastewater heat recovery has emerged as a vital strategy for building energy conservation, due to its significant potential and the inherent thermal stability of sewage as a heat source. Enhancing synergy between such waste heat and other clean energy sources is a key research focus. This study developed a solar-assisted sewage-source coupled heating system for a Chinese university dormitory and established a multiobjective optimization framework integrating economic, environmental, and energy efficiency indicators via a combined weighting approach of the Analytic Hierarchy Process and Entropy Weight Method. Optimization was conducted using the Hooke–Jeeves algorithm, Particle Swarm Optimization algorithm, and the Hooke–Jeeves–Particle Swarm Optimization hybrid algorithm (shorten as HJ–PSO), with subsequent comparative performance analysis. The HJ–PSO hybrid performed best: 24% lower operating costs, a 4.8-year shorter dynamic payback period, 26.35% fewer carbon dioxide emissions, 38.65% lower overall energy consumption, and an 11.18% higher system coefficient of performance. Supported by relevant policies, the system is low-carbon and economically viable, enabling grid peak shaving. This research provides theoretical and engineering references for renewable energy heating systems.
1. Introduction
Building energy consumption has risen significantly as a share of total global energy use, driven by factors including climate change, accounting for 46% of total energy use in developed countries [1,2]. As a sustainable water-energy resource, wastewater offers great potential to alleviate water scarcity through efficient recovery and reuse. However, only about 20% of global wastewater receives systematic treatment and recovery; the rest is directly discharged or underutilized, causing substantial resource waste and environmental risks. In the context of advancing clean energy utilization, integrating wastewater into regional energy system optimization and combining technologies like heat pumps and waste heat recovery for its cascaded utilization with solar, geothermal, and other clean energies have become a key focus in building energy systems research [3,4,5]. Additionally, the EU Directive 2018/2001 classifies wastewater as a renewable heat source with high recovery potential [6], further promoting the standardization and application of wastewater heat recovery technologies. Against this backdrop, building-based wastewater heat recovery systems have developed rapidly in recent years.
The sewage-source heat pump (SSHP) system is a key technology for recovering waste heat from sewage. Its application started in the 1980s, with Norway implementing the first demonstration projects. Over the next three decades, as heat pump technology advanced, SSHP systems were gradually adopted in countries including Sweden, Japan, the UK, the USA, China, and Turkey [7], proving adaptable to diverse climatic and energy policy contexts. Zhang et al. [8] classified the waste heat recovery potential of bathing wastewater in Beijing by scale, finding that commercial bathhouses can use recovered heat for pool heating. This saves approximately 4924.7 tons of standard coal annually, with a payback period of 3.2 years, delivering economic and environmental benefits. Ma et al. [9] proposed a series SSHP system with dual circulation loops, experimentally verifying that increasing wastewater and tap water flow rates enhances heating performance, with wastewater flow exerting a more significant effect. Through a multi-criteria assessment encompassing energy, economic, and environmental dimensions, Madah et al. [10] showed that SSHP systems outperform both air-source and ground-source heat pumps, achieving an energy utilization rate of 32.5% and a COP of 5.1. Durdevic et al. [11] assessed the waste heat potential in Rijeka, Croatia, at 75.24 MWt, which covers roughly 72.3% of the local district heating demand; the system COP ranged from 2.87 to 4.70, yet the impacts of temperature and flow fluctuations require further investigation. Zhang et al. [12] developed a compact horizontal domestic wastewater heat recovery unit for high-rise buildings, which attained a heat recovery efficiency of 90–95% and contributed to energy savings of approximately 15%, offering a viable solution for energy-efficient and low-carbon domestic hot water systems. Zhuang et al. [13] analyzed a sewage-source heat pump system in a Qingdao office building using year-round measured data. The system achieved COPs of 3.95 (heating) and 4.45 (cooling), with heating energy consumption at 50.81% of a coal-fired boiler and cooling energy at 79.39% of a conventional chiller. Brands et al. [14] compared sewage-source, ground-source, and hybrid heat pump systems against conventional HVAC in cold-climate multi-story buildings. Sewage source heat pumps showed significant energy and carbon benefits, though economic feasibility depends on local energy prices. Ground-source heat pumps consistently reduced energy use across all studied climates. Ordóñez et al. [15] validated wastewater heat recovery through sludge drying and building heating case studies. The technology achieves payback within 2–3 years while delivering substantial carbon reductions and operational savings. Murr et al. [16] evaluated nine configurations coupling exhaust gas and wastewater heat recovery with air-to-air heat pumps. The multi-source system achieved COP of 32.5–37 at −5 to 5 °C ambient temperatures, with monthly electricity savings of 337–527 kWh. Atmaca et al. [17] demonstrated through energy–exergy and life cycle assessments that sewage-source heat pumps using R290 refrigerant outperform gas boilers in energy efficiency, economics, and environmental performance, reducing life cycle costs by 20% and carbon emissions by 1.6–2.2 times.
Comprehensive evaluation frameworks integrating energy, economic, and environmental benefits have become a critical method for the multiobjective optimization of multi-energy complementary heating systems, effectively coordinating the relationships between technical performance, investment costs, and environmental impact. The performance of integrated multi-energy systems depends not only on individual equipment but also critically on synergistic operational strategies among subsystems. Thus, systematic optimization of system architecture and equipment parameters via multiobjective optimization methods is essential for improving overall energy efficiency [18,19,20]. Substantial research has been conducted in this field. Sun et al. [21] proposed a multi-energy complementary system integrating seasonal solar thermal storage, biomass, and an air-source heat pump for rural residences in severely cold regions. Operating at a switching temperature of −3 °C, the system cut operating costs by 21%, with biomass supplying 17% of the energy. Yuan et al. [2] employed an integrated EnergyPLAN-MOPSO-TOPSIS approach to analyze a 100% renewable heating system in Aalborg, Denmark, identifying the synergistic use of industrial waste heat and heat pumps as a core strategy for fourth-generation district heating systems. Wang et al. [22] developed a solar-assisted multi-source heating system and optimized its operational parameters with TRNSYS and the Hooke–Jeeves (HJ) algorithm, enhancing system performance and stability. In another study, Wang et al. [23] optimized the multi-parameter coupling of a solar–air-source heat pump system using a PSO–CSM algorithm, achieving a 15% COP increase and 27.75% lower annual energy consumption. Zhang et al. [24] optimized collector and storage tank parameters using the HJ algorithm for a high-altitude cold region, reducing the unit heating cost by 20.6% and proposing a cost-adaptive optimization scheme based on solar fraction. Li et al. [25] introduced a HJ–PSO hybrid algorithm for integrated energy system capacity configuration, reducing iteration steps by 31% and 48% compared with PSO and HJ, respectively. Gao et al. [26] optimized a multi-energy heating system for aquaculture using the HJ algorithm, achieving a system COP of 5.39, reducing annual operating costs by USD 1151.86, and obtaining a payback period of 9.43 years. Shi et al. [27] implemented a solar–groundwater-source heat pump coupled system in Tibet, achieving a system COP of 3.79 under combined operation and identifying an optimal tank volume of 30 m3. Ding et al. [28] established a multi-criteria evaluation model and applied the HJ algorithm to optimize a solar–biomass system, increasing the solar heating fraction to 73.4% while reducing the life cycle cost by 19.9%. Wang et al. [29] developed a multiobjective optimization model centered on economy, energy efficiency, and environmental performance for rural residences in cold northwest China. Comparative optimization with HJ and HJ–PSO algorithms delivered a 30.03% increase in solar fraction, a system COP of 4.4, 14.30% lower annual costs, 25.39% CO2 emission reduction, and the optimal temperature difference for collection and storage activation/deactivation.
As shown in Table 1, recent years have witnessed notable progress in the optimization of multi-energy complementary heating systems, covering multiple dimensions, such as equipment modeling, optimization algorithms, and operational strategies, reflecting a trend toward diversification. However, there are some gaps in the existing literature: comparative performance analyses between different optimization algorithms and their applicability in system configurations across varying climate zones remain insufficient, with limited cross-validation and merit analysis. Moreover, multiobjective optimization studies focusing on the coupling of low-grade thermal energy sources, such as solar energy and wastewater-source heat pumps, for residential heating are still relatively limited, particularly in terms of system design and operational strategies that comprehensively consider multiple criteria including clean energy utilization efficiency, economic performance, and environmental benefits.
Table 1.
Comparison of current studies.
This design achieves deep integration of cross-seasonal solar thermal storage and bathing wastewater heat recovery by establishing a cascading energy structure covering “heat collection, storage, supply, and waste heat recovery.” It effectively addresses the challenge of matching energy sources of different grades, fundamentally differing from the simple superposition model of solar energy and heat pumps in existing research. For evaluation, an AHP–EWM combined weighting method was adopted to build a multidimensional assessment system balancing economic viability, environmental sustainability, and energy efficiency. This approach reconciles subjective experience-based judgments with objective data characteristics, enabling more scientific quantification of trade-offs among the three key indicators. It avoids evaluation biases from single weighting methods and provides clear guidance for multiobjective optimization. Concerning the complex equipment capacity configuration problem of the system, which features non-linearity and multiple peaks, this study compared three algorithms: HJ, PSO, and HJ–PSO. The hybrid HJ–PSO algorithm effectively escapes local optima and rapidly converges to global solutions, balancing optimization accuracy and computational efficiency. It is well-suited for complex system optimization involving multi-device coupling and adaptation to multiple climate zones. The research results form a technical closed loop covering system integration, evaluation methods, and optimization algorithms. This provides theoretical support for the engineering design of multi-energy complementary heating systems, as well as reliable algorithm validation and solution selection criteria for capacity configuration in similar systems across different climate zones.
2. System Design
2.1. Overview of Building
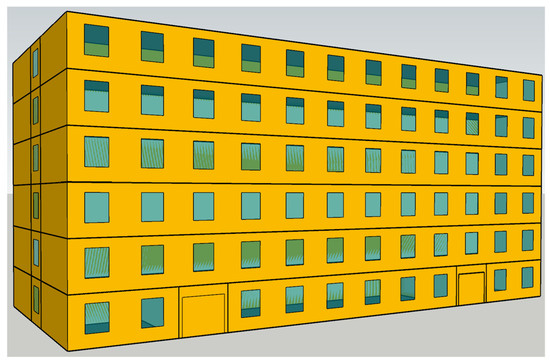
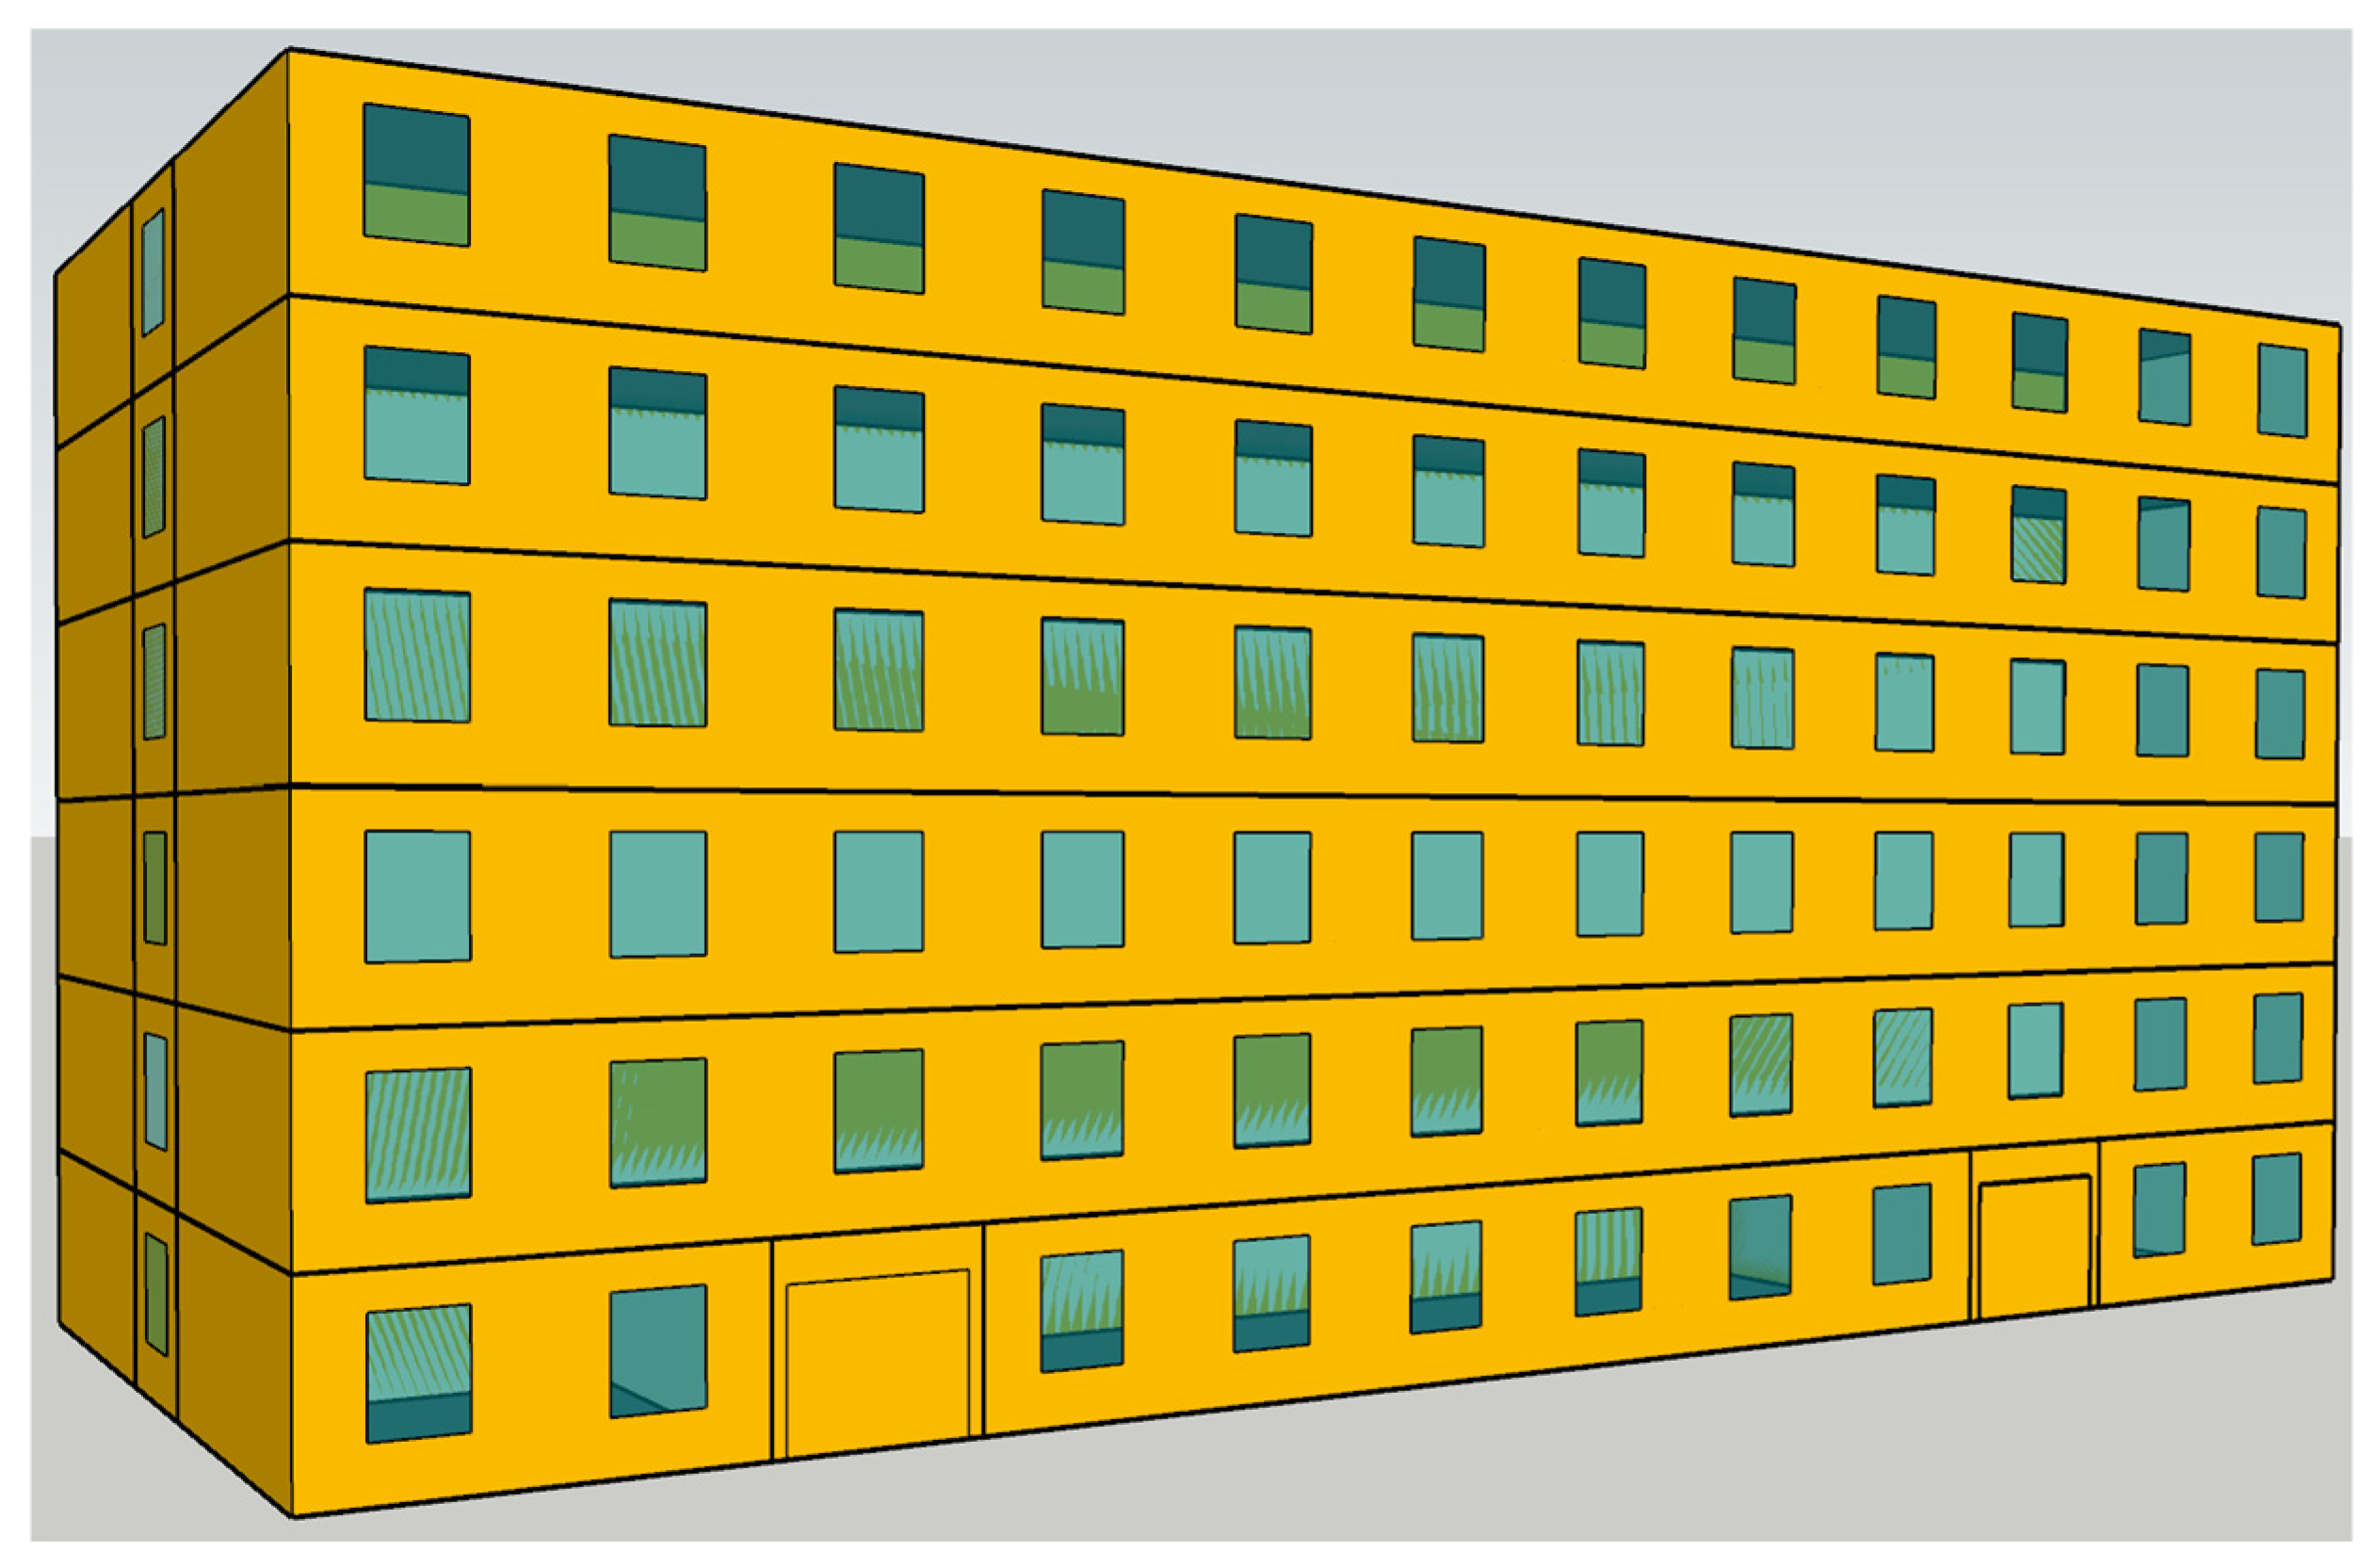
In this study, a six-story student dormitory building situated on a university campus in China was selected as a representative case for modeling and analysis. The building has a total height of 20.5 m and a heated floor area of 4359 m2, with a window-to-wall ratio of 0.6. The thermal transmittance of the building envelope complies with Chinese energy efficiency standards [30]. The annual heating load of the building was dynamically simulated and served as the fundamental input for system design and performance analysis. Figure 1 shows a schematic 3D representation of the building.
Figure 1.
Building model [31].
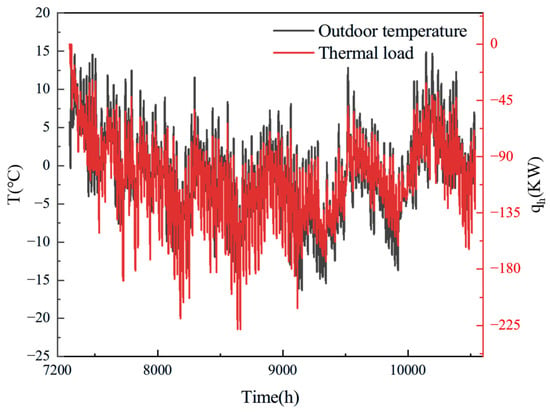
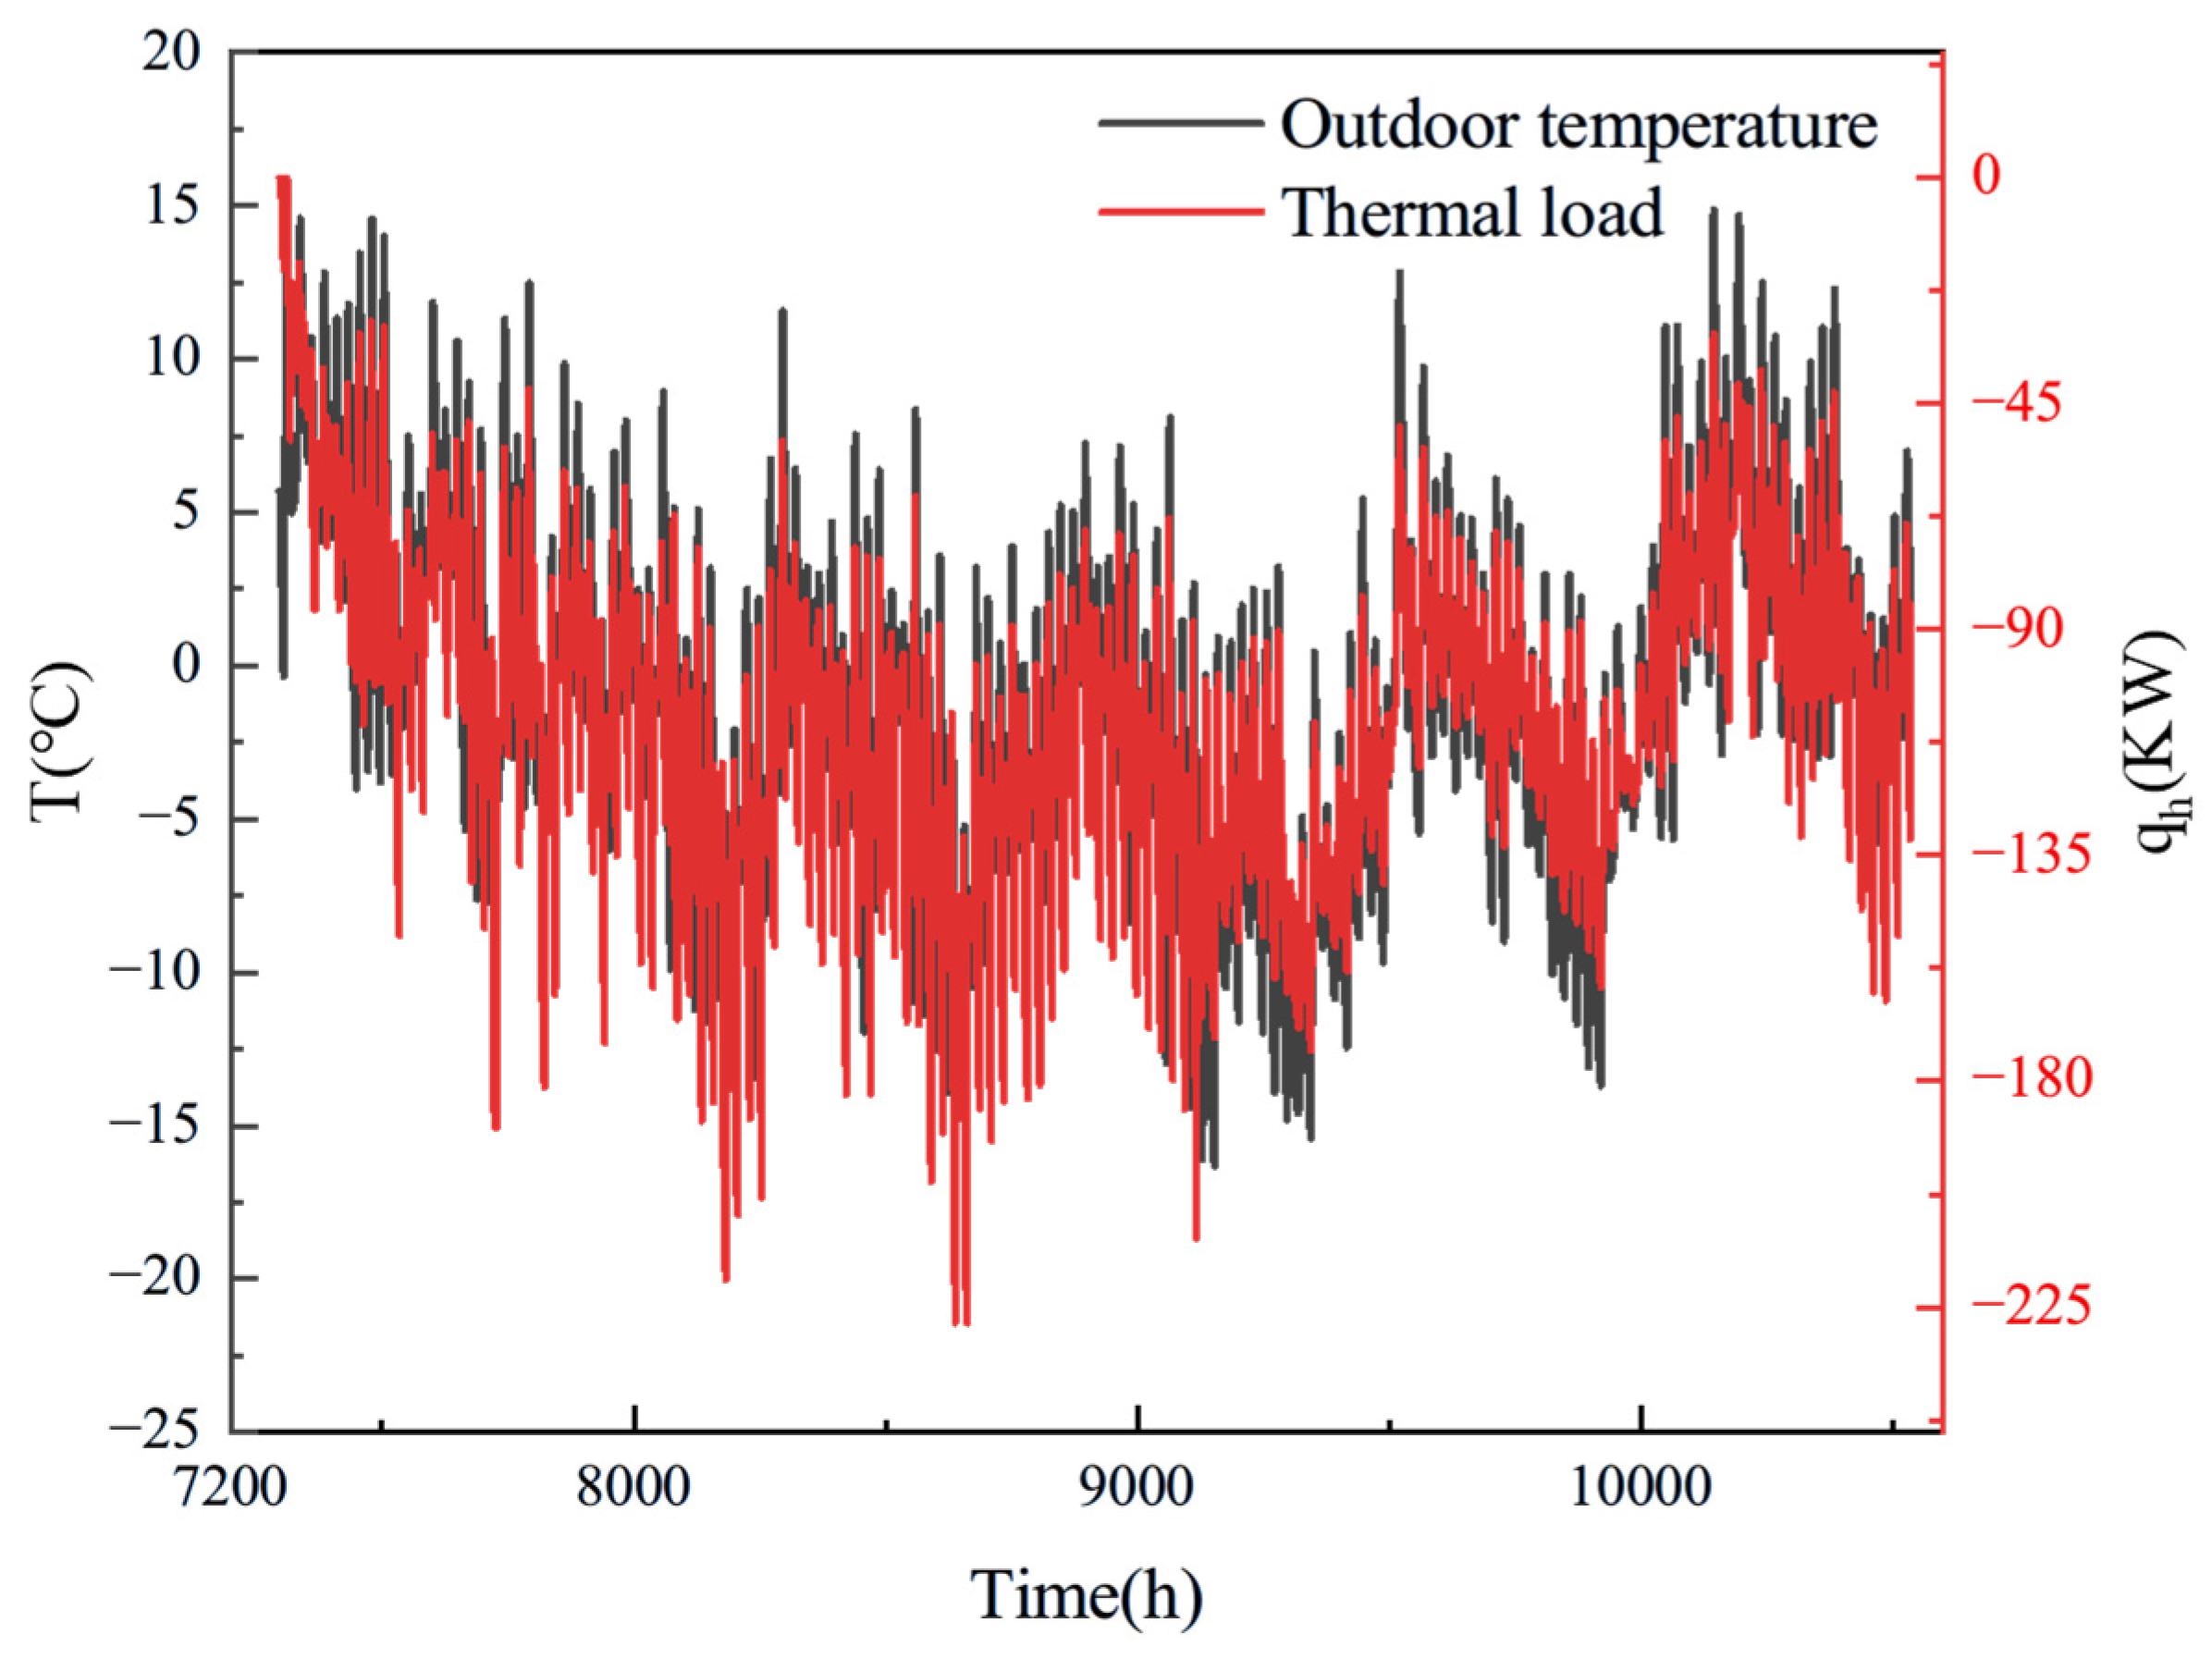
Typical meteorological year data for Lanzhou were obtained from the METEONORM database and processed using the Type15-2 module in TRNSYS. A simulation was performed with an hourly time step to model the heating load throughout the entire heating season, which spanned from hour 7296 to 10,536. Figure 2 shows the hourly profiles of the building heating load and outdoor temperature. The results showed that the peak heating load reaches 228.17 kW, with an accumulated seasonal demand of 486,718.87 kWh. The specific heating load per unit floor area was 50.26 W/m2, which aligns with design standard values for residential buildings in China [32]. The simulation results indicated a significant negative correlation between the hourly heating load and outdoor temperature.
Figure 2.
Simulation results of outdoor temperature and hourly heating load.
2.2. System Operating Principle
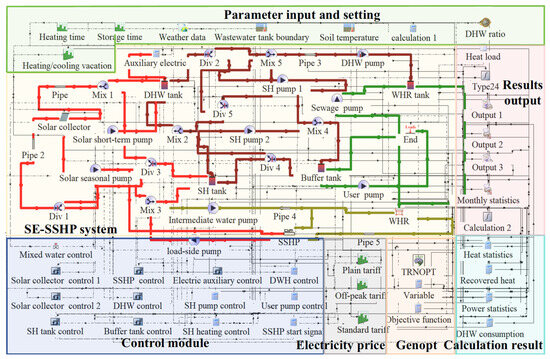
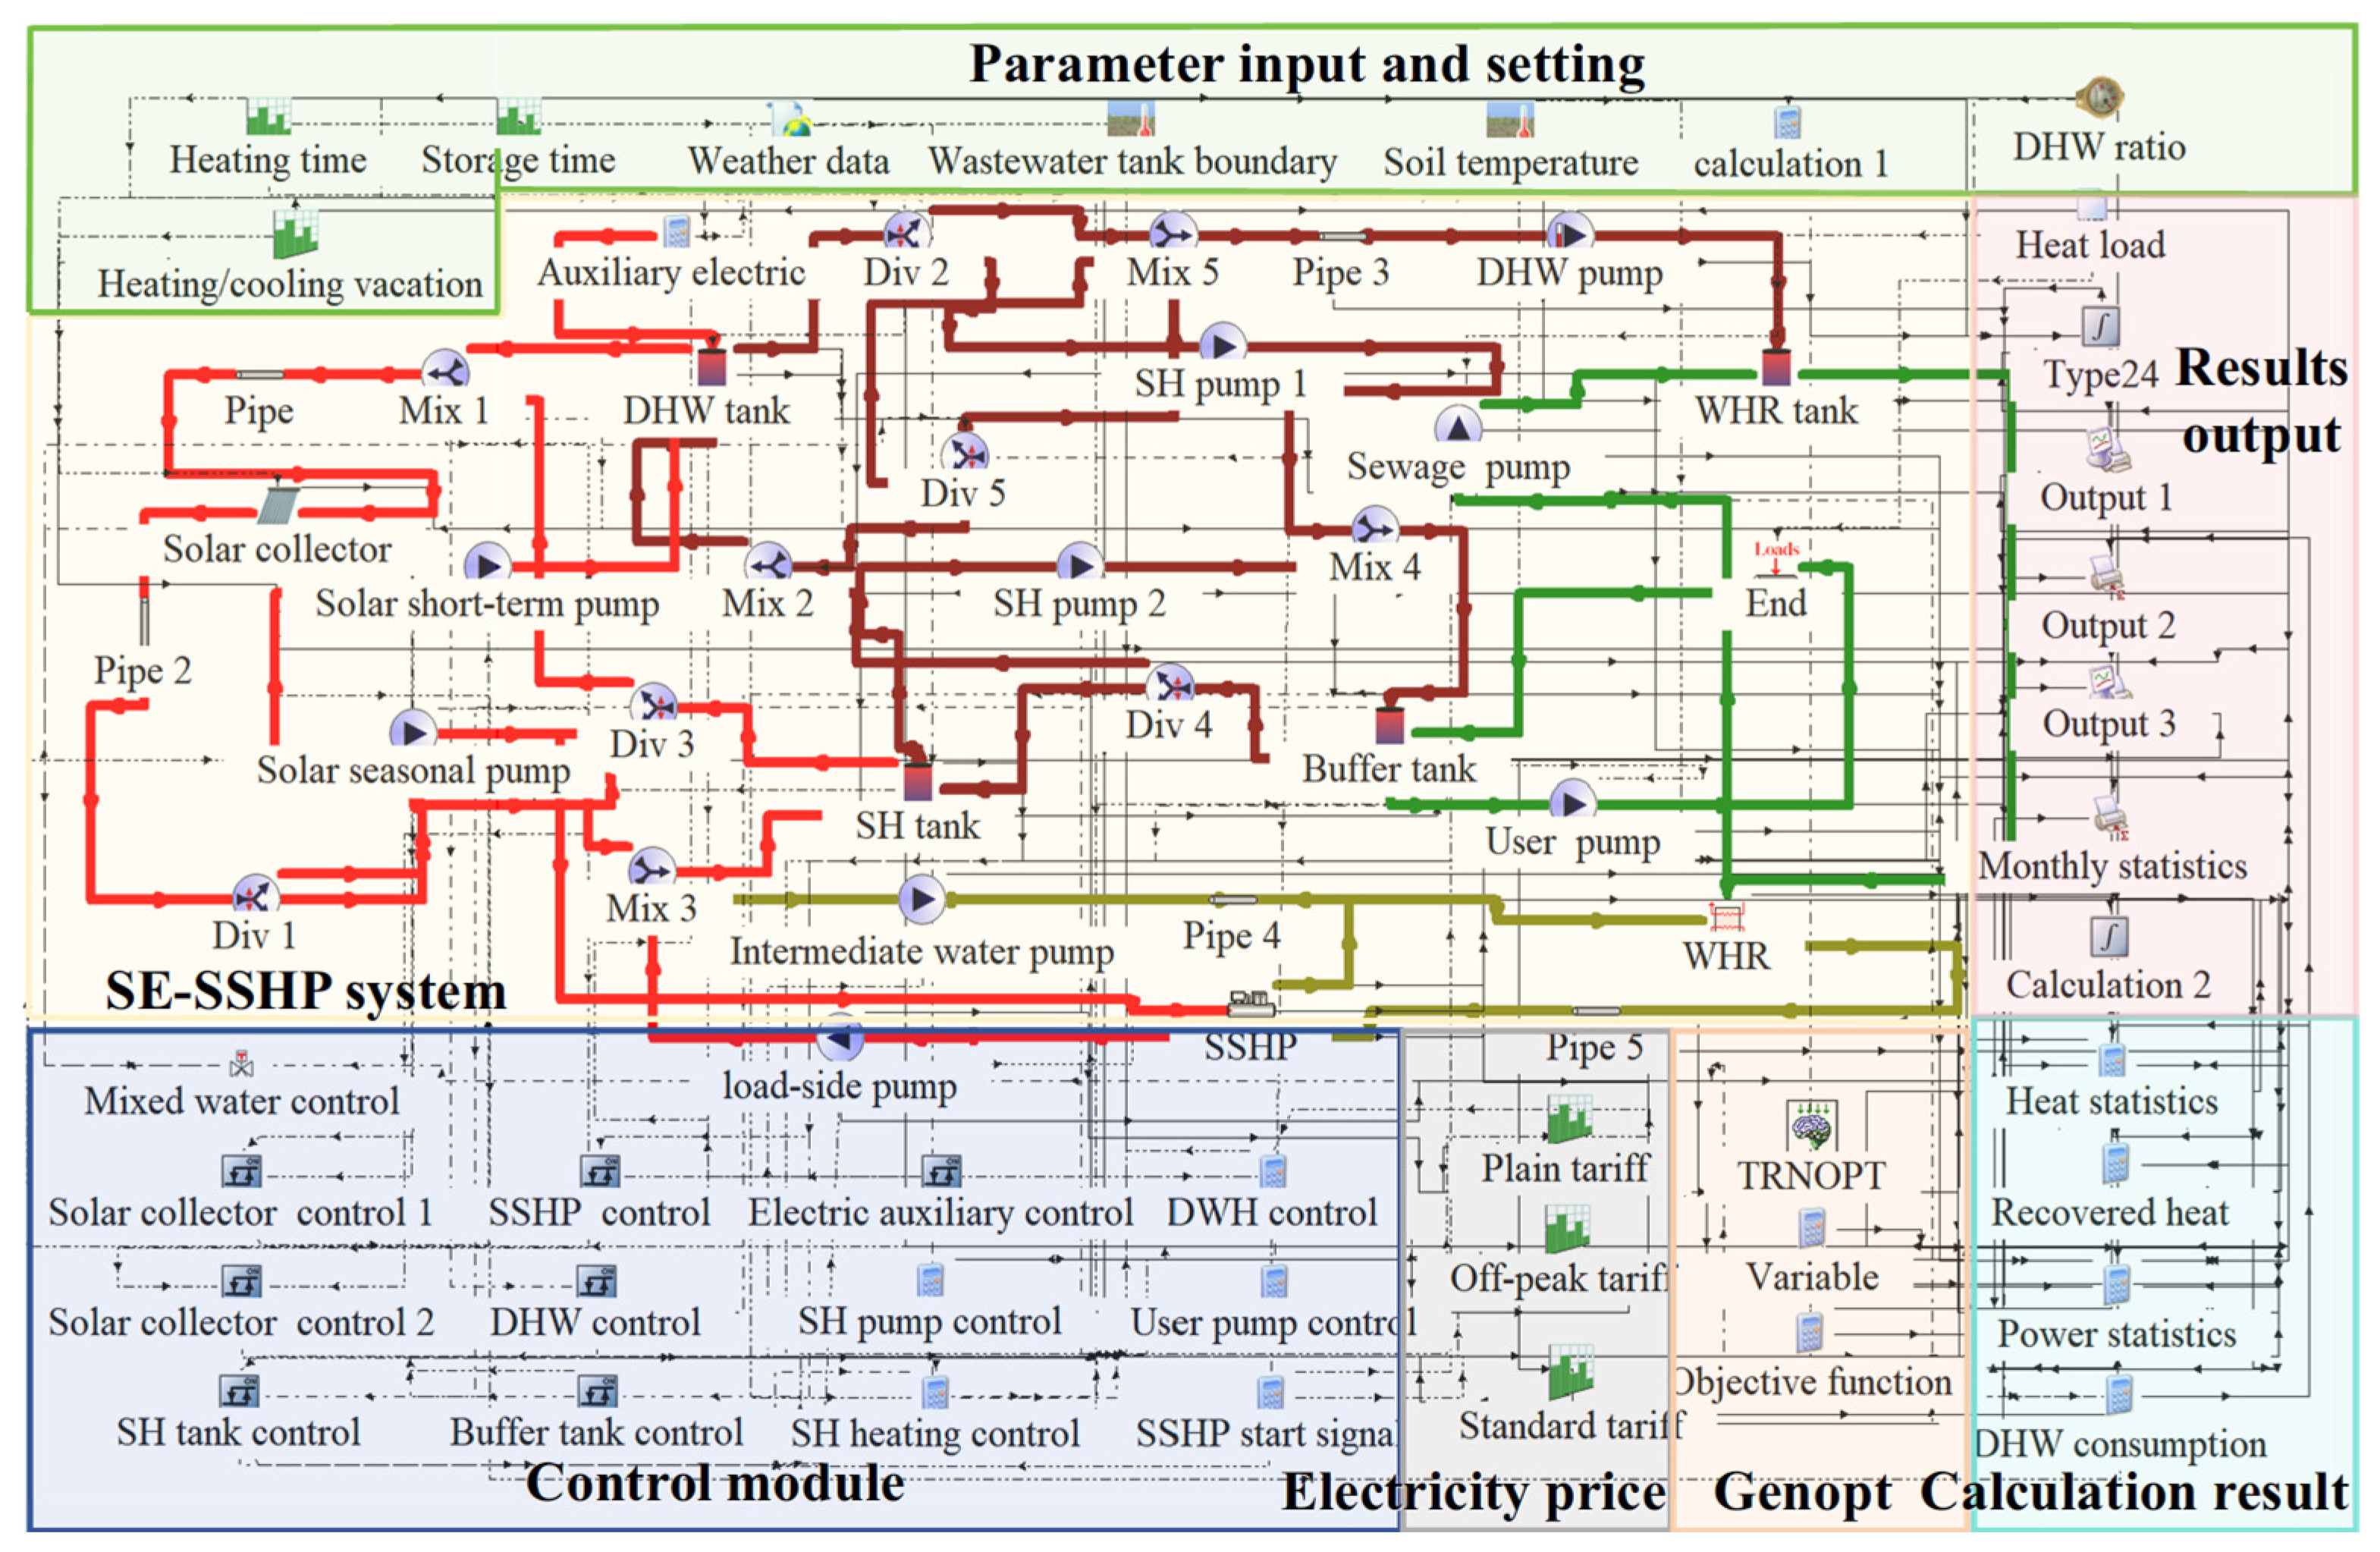
A solar–sewage-source heat pump coupled system (SE-SSHP) was designed, with the system configuration illustrated in Figure 3. The system primarily comprises a sewage-source heat pump unit, a waste heat recovery device, evacuated tube solar collectors, storage tanks, and circulation pumps. The following simplifications and assumptions were introduced during the development of the integrated multi-energy system model, in accordance with standard engineering practices:
Figure 3.
Simulation model of a solar–sewage-source heat pump coupled system (SE-SSHP).
- (1)
- The thermophysical properties of both the working fluid and the soil are constant, neglecting their dependence on temperature.
- (2)
- The flow velocity and temperature distribution of the working fluid are uniform across the pipe cross-section.
- (3)
- The soil is modeled as a homogeneous medium, with no consideration of moisture content variation in the heat transfer analysis.
- (4)
- The solar collector is represented as an integrated unit to facilitate the effective implementation of circulation pump control logic.
- (5)
- The wastewater tank provides sufficient insulation, filtration, and sediment removal functions; the influence of wastewater quality on the performance of the heat recovery system is neglected.
Under the condition of high-intensity solar radiation, the solar collectors absorb energy to heat the fluid within the collector tubes. The heated fluid is then circulated to both a seasonal underground thermal storage tank and a short-term storage tank for thermal energy accumulation. The short-term storage tank primarily supplies domestic hot water throughout the year. The electric auxiliary heater is activated when the stored water temperature is insufficient to meet the heating demand. If the outlet temperature of the seasonal storage tank also fails to meet requirements, the wastewater-source heat pump provides supplementary heating. Under extreme conditions wherein both heat sources are inadequate, the short-term storage tank serves as an auxiliary heat source. Taking advantage of the time-of-use electricity pricing policy, the system not only achieves load shifting through electric heating, but also efficiently utilizes solar and waste heat to generate high-temperature hot water. This integrated operational strategy ensures heating reliability while significantly improving thermal storage efficiency, economic performance, and environmental benefits.
2.3. System Equipment Parameters
The building is located in Lanzhou, where the initial soil temperature at the beginning of the heating season is 11.0 °C [29]. According to Ref. [29], the soil thermal conductivity, density, and specific heat capacity are 1.8 W/(m·K), 2200 kg/m3, and 1.748 kJ/(kg·K), respectively. Both the seasonal thermal storage tank and the wastewater heat recovery tank were buried at a depth of 1 m underground, in accordance with the design code for building water supply and drainage [33]. Table 2 presents the main equipment parameters of the SE-SSHP system.
Table 2.
Parameters of the main components in the simulation.
2.4. System Performance Evaluation Indicators
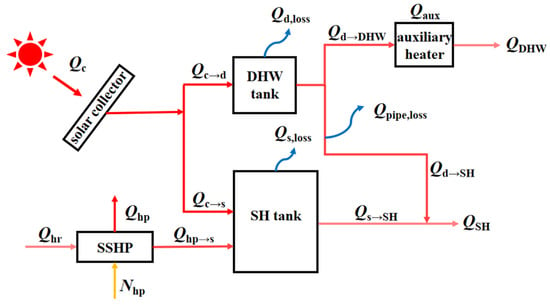
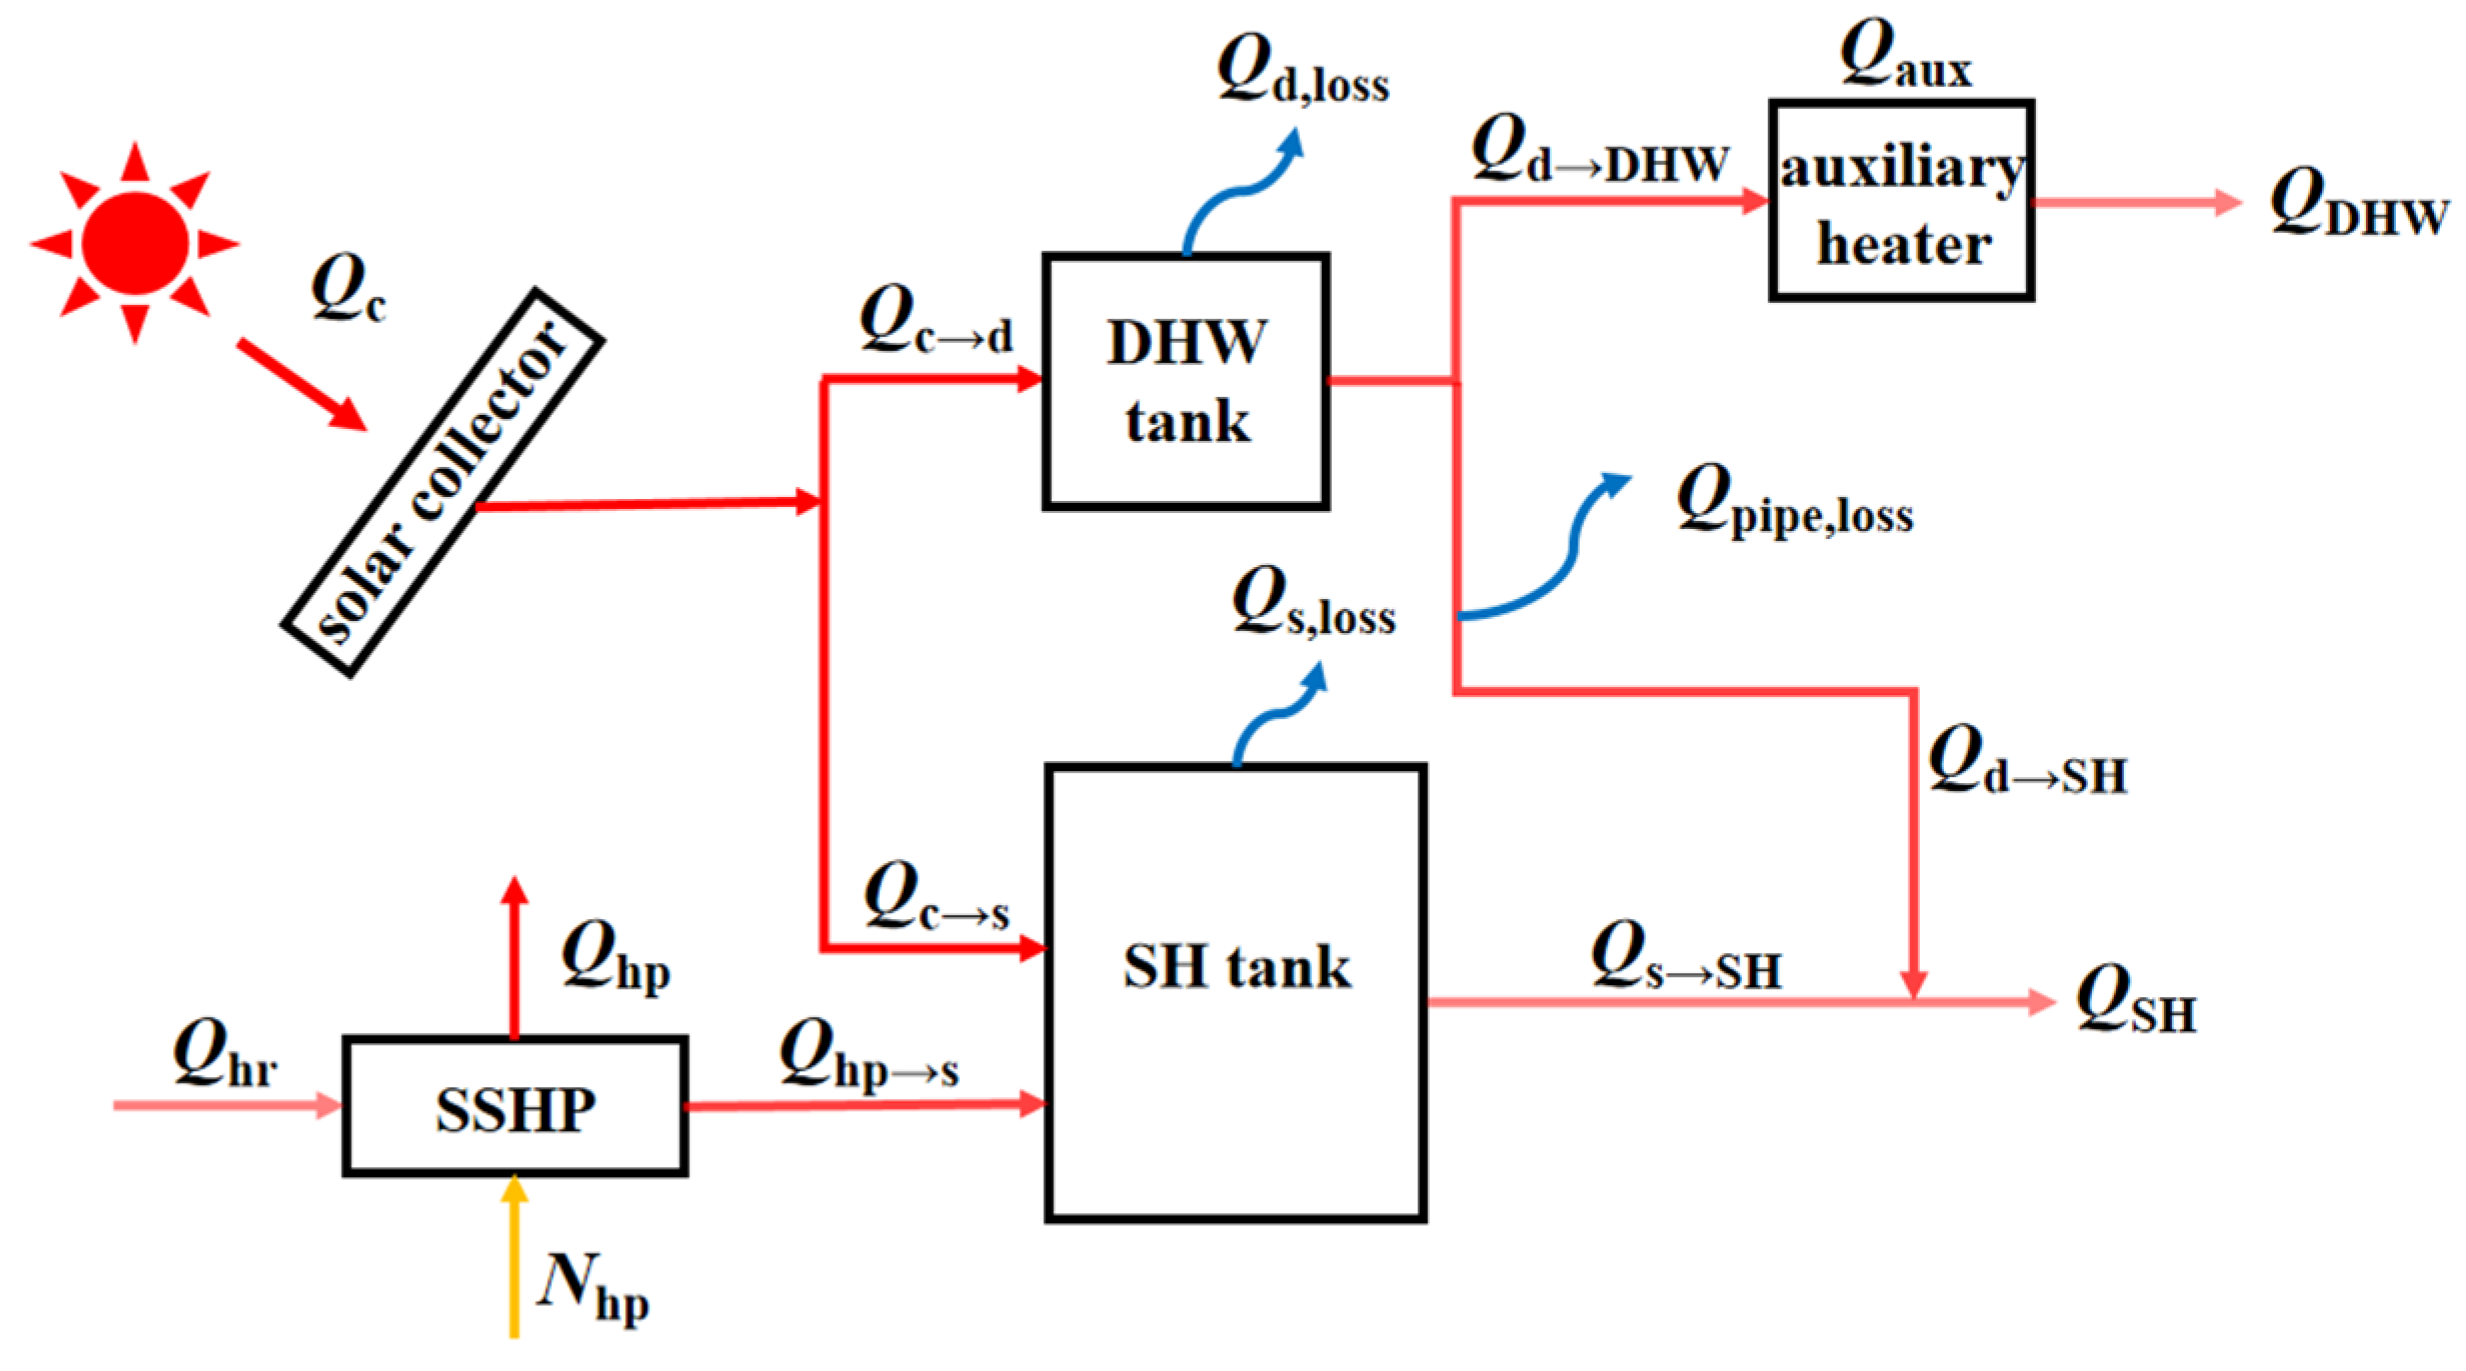
Figure 4 presents the system energy flow diagram. The solar collector converts the received solar irradiance into thermal energy Qc and stores it in both the seasonal storage tank and the short-term storage tank. Heat losses occur between the tanks and the surrounding environment, denoted by Qs,loss and Qd,loss, respectively. Specifically, Qs,loss refers to the heat loss caused by the heat exchange between the seasonal storage tank and the soil, accounting for the thermal stratification of the tank–soil interface. Qd,loss represents the heat loss due to the heat exchange between the short-term storage tank and the ambient air. In addition, the thermal losses in the supply and return pipelines were considered, expressed as Qpipe,loss. The auxiliary electric consumption for domestic hot water heating is denoted by Qaux. The heat recovered from bathing wastewater is represented by Qhr. The heating output of the heat pump unit is designated as Qhp. The total heat supply from the wastewater heat recovery subsystem is indicated by Qhp→S. The outlet water temperature of the waste heat recovery unit serves as the low-temperature heat source for the sewage-source heat pump. Since its COP strongly depends on the source-side temperature and load ratio, it cannot be simplified as a constant value. Ultimately, the solar radiation absorbed by the collector is utilized to meet both the domestic hot water demand and the building heating load .
Figure 4.
System energy flow diagram.
Based on the system energy balance equations, five performance evaluation indicators were defined: heating supply guarantee ratio, domestic hot water supply guarantee ratio, heat pump COP, overall system COP, and system energy supply guarantee ratio. These metrics quantitatively characterize the efficiency of the solar collection subsystem, the thermal storage subsystem, the auxiliary heating subsystem, and the integrated system as a whole. The specific calculation formulae and physical meanings are as follows [34]:
- (1)
- Heating supply guarantee ratio:
- (2)
- Domestic hot water supply guarantee ratio:
- (3)
- The heat pump COPhp and overall system COPsys:
- (4)
- System energy supply guarantee ratio:
Here, fsh is the heating supply guarantee ratio; fdhw is the DHW supply guarantee ratio; ftotal is the overall system energy supply guarantee ratio; COPhp is the heat pump COP value; COPsys is the system COP value; Qd→SH and Qs→SH are the heat supplied from the short-term thermal storage tank and the seasonal thermal storage tank to the building, respectively, kWh; Qd→DHW is the heat supply from the DHW storage tank to domestic hot water, kWh; Qaux is the auxiliary electric heating contribution, kWh; QSH and QDHW are the building heating load and DHW load, respectively, kWh; Naux is the electricity consumption of the auxiliary electric heater, kWh; Nhp is the heat pump unit energy consumption, kWh; and Nwp is the electricity consumption of the circulation pump, kWh.
2.5. Reliability Verification of System Simulation Model
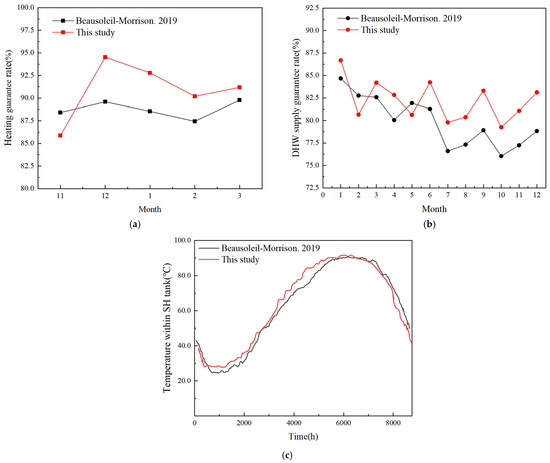
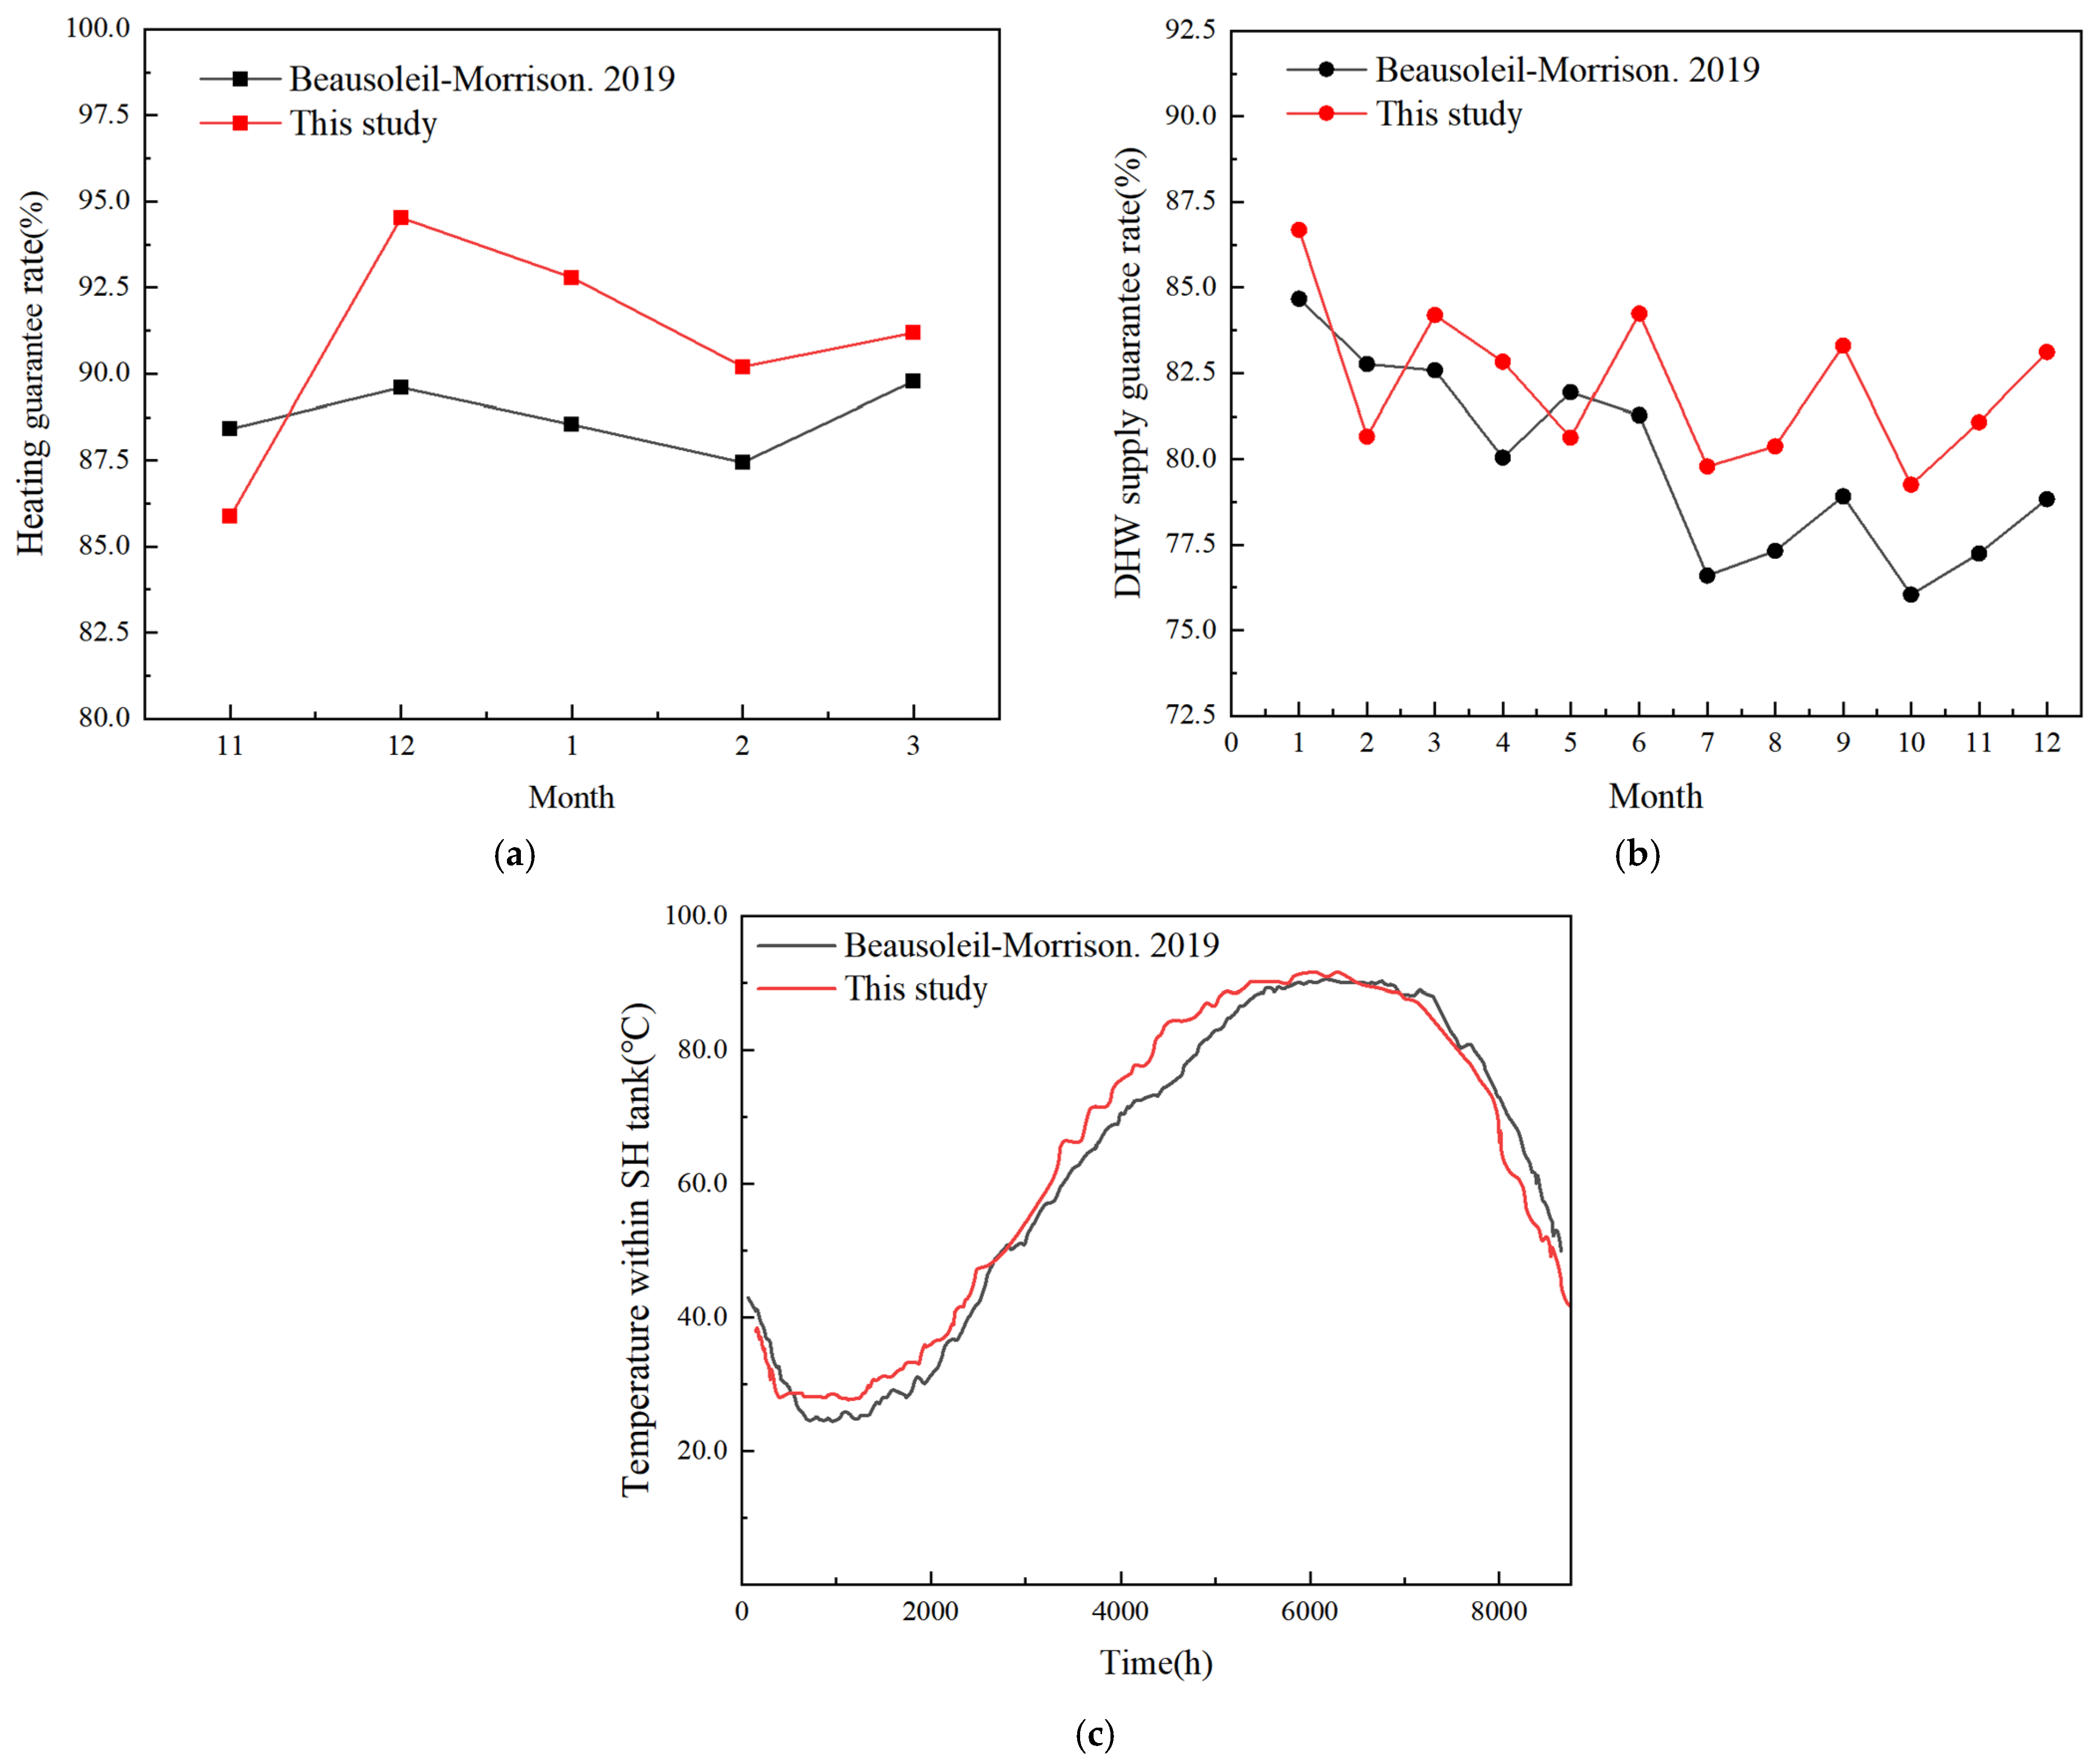
Owing to experimental constraints, no physical test platform for the SE–SSHP system was constructed in this study. To validate the accuracy of the developed model, simulation results were checked using a similar system model reported in the literature [35]. The reference model also employs a parallel configuration with long-term and short-term thermal storage tanks, a low-temperature radiant floor heating system on the user side, and an auxiliary electric heater as a supplementary heat source. The annual average temperature of the seasonal thermal storage tank obtained in this study was 66.62 °C, showing a relative deviation of only 2.95% from the value of 63.67 °C reported in the literature [35]. The average heating guarantee rate was 90.91%, with a relative deviation of 2.38% from the reference value. The average domestic hot water guarantee rate was 82.18%, corresponding to a relative deviation of 2.84%. As illustrated in Figure 5, The variation curves of each indicator are generally consistent with the reference data in terms of overall trend. The observed deviations can be primarily attributed to the following factors:
Figure 5.
(a) Validation of the heating guarantee rate of Beausoleil-Morrison et al. [35]. (b) Validation of the DHW supply guarantee rate of Beausoleil-Morrison et al. [35]. (c) Validation of the average SH tank temperature of Beausoleil-Morrison et al. [35].
- (1)
- Certain parameter settings and operational control logic (e.g., start/stop conditions, priority settings) in the proposed model are not fully consistent with those in the reference model.
- (2)
- The typical meteorological year data employed in the simulations differ from those used in the reference study.
3. Optimization Methods
3.1. Parameter Optimization Methods
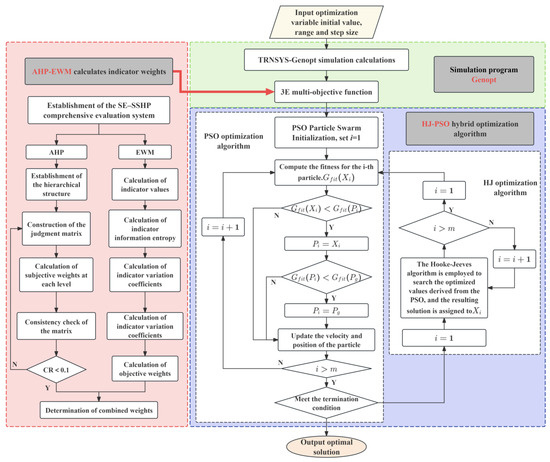
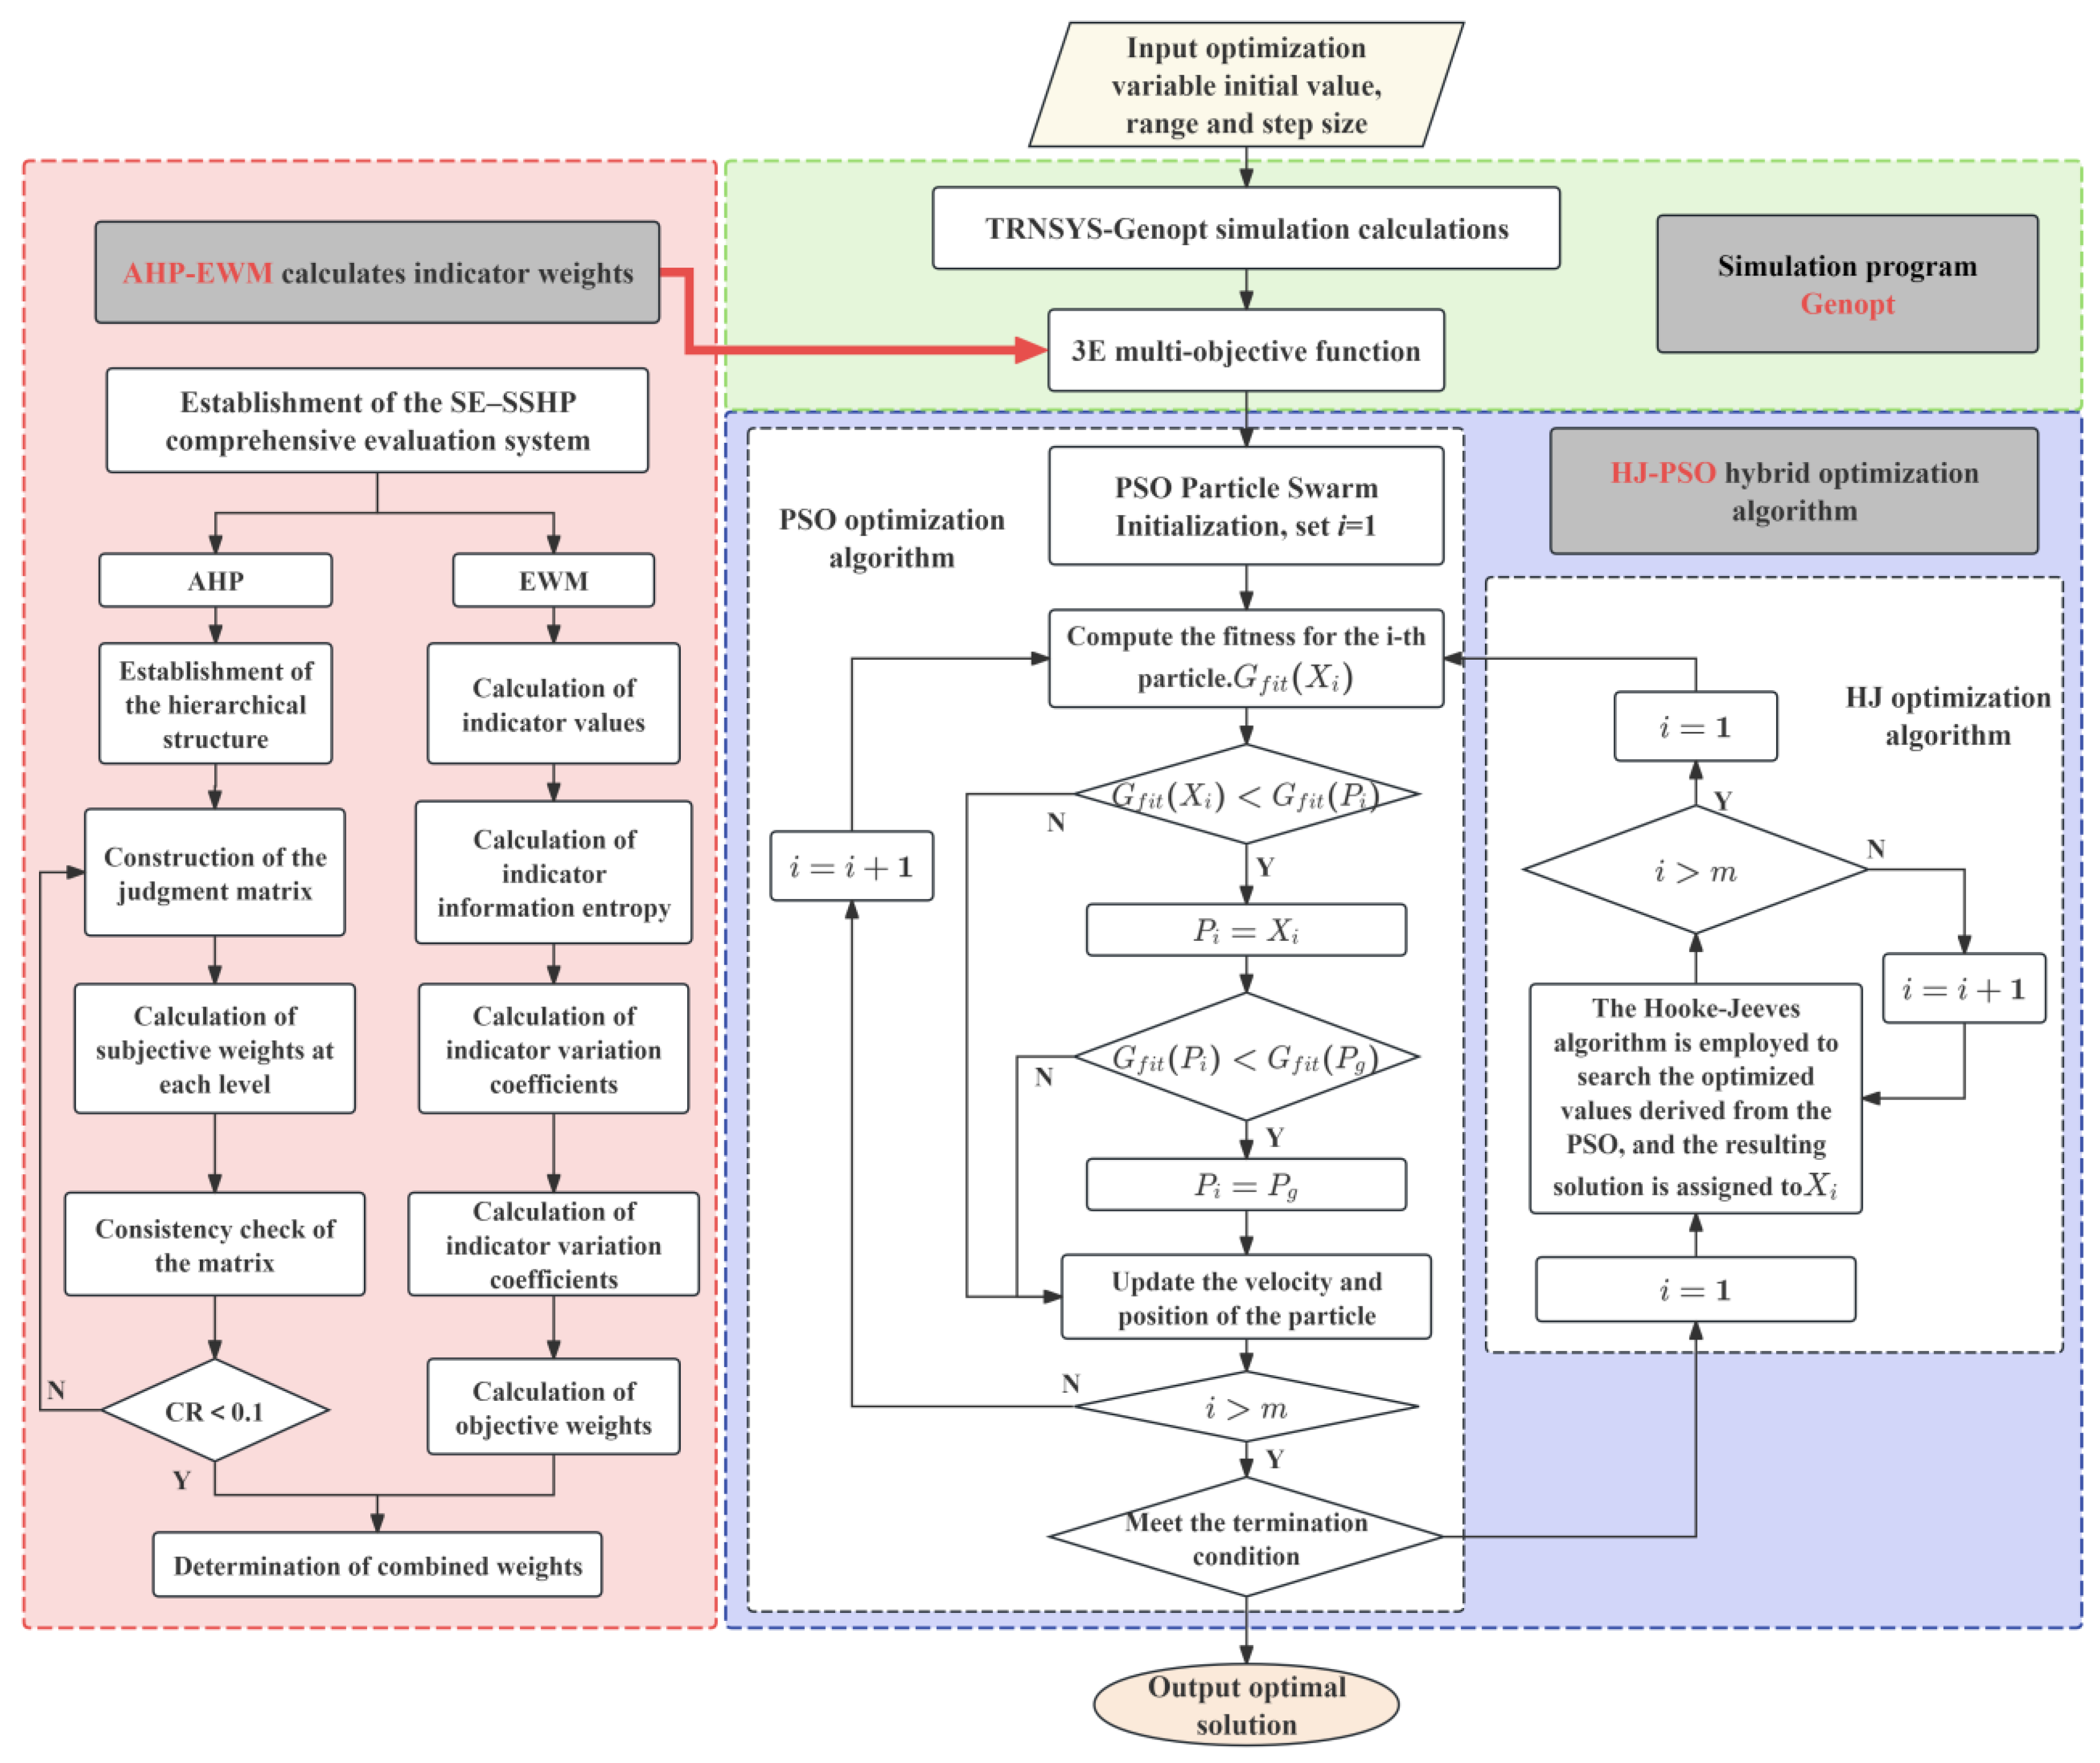
The AHP–EWM method integrates the subjective judgment capability of the AHP with the objective data characteristics of the EWM, which has been successfully applied in clean energy system assessment and multi-energy complementary optimization, providing a scientific basis for system performance evaluation [36]. To address the drawbacks of conventional algorithms, such as the low computational efficiency and the tendency to fall into local optima, this study adopted a hybrid HJ–PSO algorithm, which combines the global search capability of PSO with the rapid convergence of the HJ algorithm. The algorithm proceeds in two stages: first, PSO performs global optimization on both discrete and continuous variables, with continuous variable values confined to predefined grid points; subsequently, the optimal solution from the PSO is used as the initial value, discrete variables are fixed, and the HJ algorithm is applied to further optimize the continuous variables, with the results fed back into the next PSO iteration [25]. In this study, AHP–EWM provided the index weighting for decision-making, while the HJ–PSO produced specific solutions by integrating global search and local optimization capabilities. The combination of these two methods effectively addresses uncertainty and complexity, achieving a balance between optimization efficiency and solution quality. Figure 6 shows the detailed process.
Figure 6.
Flowchart of the HJ–PSO algorithm.
The collector area, collector azimuth and tilt angle, the storage volume of the seasonal thermal storage tank per unit collector area, the DHW tank volume, and the heating capacity of the sewage-source heat pump were selected as the optimization variables.
The optimization variables are as follows:
Here, Asolar is the collector area, m2; is the collector inclination, °; is the collector azimuth, °; VDHW is the DHW tank volume, m3; vSH is the seasonal heat storage water tank volume per unit collector area, m; and CAPhp is the heating capacity of the sewage-source heat pump, kWh.
3.2. Optimization Objective Function and Constraints
3.2.1. Economic Indicators
Considering that the SE-SSHP system represents a long-term investment project, its economic analysis must adequately account for the time value of money. Therefore, the use of dynamic economic evaluation methods is more appropriate. In this study, the dynamic investment payback period, dynamic annual cost, and economic savings rate were selected as key indicators for assessing the economic performance of the system. All costs in this study are presented in Chinese Yuan (CNY). For international comparison, an exchange rate of 1 USD = 7.2 CNY was adopted based on the average exchange rate in 2024.
The formula for the dynamic investment payback period is given as follows [37]:
Here, Tp is the dynamic investment payback period, a; It is the profit of the system in the t year of operation, million CNY; Ct is the operating cost of the system in the t year, million CNY; C0 is the system initial investment, million CNY; and i is the discount rate, taken as 2.8% [37].
The formula to determine the dynamic annual cost value is given as follows [38]:
Here, Zd is the annual calculated cost using the dynamic method, CNY/year; K is the total investment in equipment, CNY; C is the annual operating cost of the system, CNY; r is the loan interest rate or the internal rate of return specified by the relevant departmental standards, taken as 5%; and n is the equipment service life, taken as 20 years.
The economic savings rate is calculated using the following formula:
Here, ηost is the economic saving rate of the system, %; Zconv and Zcchp are the annualized dynamic costs of the system before and after optimization, respectively, in CNY.
In this study, the annual operating cost of the system was adjusted to better reflect practical engineering applications by incorporating a penalty function. Specifically, when the heating water temperature dropped below 40 °C, additional operating costs were imposed to ensure normal terminal heating. The annual operating cost of the system was calculated as follows:
Here, E is the local electricity price, CNY/kWh; Naux is the electricity consumption of the auxiliary electric heater, kWh; Nwp is the energy consumption of the water pump, kWh; Nhp is the energy consumption of the sewage-source heat pump, kWh; and Fes is the penalty cost incurred by the system when the penalty function is triggered, CNY.
3.2.2. Environmental Indicators
In the environmental assessment of energy systems, indicators, such as the standard coal equivalent substitution and the reduction in greenhouse gas emissions (CO2, SO2, and particulate matter), are commonly used to quantify the environmental benefits of multi-energy systems.
The formula for the conventional energy substitution of the system is as follows [38]:
Here, CEr is the replacement amount of conventional energy, kgce; CEt is the total energy consumption of the conventional system, kgce; and CEs is the total energy consumption of the system, kgce.
For the heating system, the total energy consumption of the conventional system is calculated as follows [38]:
Here, QH is the cumulative heat load in the heating season, MJ; q is the calorific value of standard coal, taken as 29.307 MJ/kgce; and is the operating efficiency of traditional energy as the heat source, 0.31 [38].
The emission reduction of CO2, SO2, and dust in the coupling system should be calculated according to the following formula [38].
Here, , , and are the CO2 emission reduction, SO2 emission reduction, and dust emission reduction, respectively, kg/year; CEr is the replacement amount of conventional energy, kgce; and , , and are the emission factors of CO2, SO2, and dust of standard coal, respectively, with the specific values being 2.47, 0.02, and 0.01 kg/kgce [30].
Through calculation, the CO2 emission reduction of the system was found to be 456,477.32 kg/a, which was significantly greater than the SO2 emission reduction of 3696.17 kg/a and the dust emission reduction of 1848.09 kg/a. Therefore, the CO2 emission reduction rate was selected as the environmental evaluation. The calculation formula is given as follows:
Here, ηenvironment denotes the environmental evaluation indicator, %; EXconv and EXcchp are the CO2 emission reductions of the system before and after optimization, respectively, kg.
3.2.3. Energy Efficiency Indicators
The energy-saving performance of the system was evaluated using the energy-saving rate, which is calculated as follows [39]:
Here, ηenergy is the energy-saving rate, %; PECconv and PECcchp are the primary energy consumptions of the system before and after optimization, respectively, kWh.
3.2.4. Objective Function
The AHP determines weights that reflect the subjective preferences of decision-makers, whereas the EWM yields weights that emphasize intrinsic data correlations. To improve the scientific basis and accuracy of weight determination, subjective and objective weights need to be integrated into a composite weighting scheme. This study developed a combined weighting model using linear weighted integration and introduced the Euclidean distance as a constraint in the calculation process. This constraint minimizes the deviation between the composite weight and the subjective and objective weights, ensuring a balanced representation of both decision-maker preference and objective data characteristics, thus establishing a more reliable optimization decision-making model.
The comprehensive weight is expressed as a linear combination of the subjective and objective weights, and the calculation formula is as follows:
Here, wi and wj are the subjective and objective weights, respectively; β and γ are the coefficients of subjective and objective preference degrees, respectively.
By introducing the Euclidean distance function, the relationship representing the degree of deviation between the subjective and objective weights and their corresponding preference coefficients can be expressed as follows:
Under the condition of minimizing the sum of squared deviations, the optimal combined weight assigns 40% to the subjective weights wi and 60% to the objective weights wj.
Based on the combined weighting, the final weights of the economic, environmental, and energy-saving evaluation indicators were determined. Accordingly, the system optimization objective function was constructed and calculated as follows:
Here, B is the optimal solution of the objective function, ηost represents the economic evaluation indicator values; ηenvironment represents the environmental evaluation indicator; and ηenergy is the energy-saving rate.
3.3. Comparison of Optimization Algorithm Performance
To comprehensively evaluate the performance of the three optimization algorithms, this study further analyzed and compared their convergence characteristics, computational efficiency, stability, and robustness based on the final optimization results.
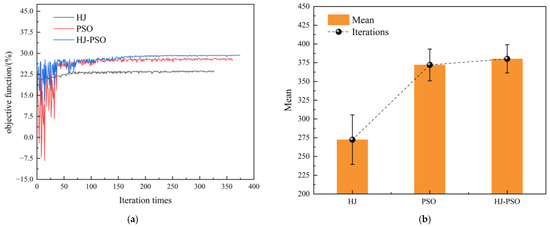
Figure 7a illustrates the iterative convergence process of the three algorithms. In the initial optimization stage, the objective function value fluctuated significantly due to the introduction of a penalty function when the system constraints were not satisfied. After approximately 40 iterations, the fluctuation amplitude decreased considerably, indicating that the algorithms could stably and synergistically optimize the multiple parameters of the SE-SSHP system. The HJ, PSO, and HJ–PSO algorithms satisfied the convergence accuracy requirements and obtained the optimal solution at the 237th, 360th, and 372nd iterations, respectively, thus verifying their convergence efficiency and multiobjective trade-off capability.
Figure 7.
(a) Iterative convergence process. (b) Algorithm performance comparison.
To account for the stochastic nature of the algorithms and assess the reliability of the optimization, each algorithm was executed independently for 20 runs. A run was considered successful if the obtained objective function value fell within 0.1% of the known global optimum. As summarized in Table 3 and illustrated in Figure 7b, all three algorithms consistently converged to the global optimum. Notably, the proposed HJ–PSO algorithm achieved a 100% success rate while requiring the shortest optimization time, outperforming both standalone HJ and PSO algorithms across all the evaluated metrics. Furthermore, the HJ–PSO algorithm exhibited the lowest standard deviation, indicating superior stability and enhanced robustness throughout the optimization process.
Table 3.
Comparison of optimization algorithms.
4. System Operation Parameters and Optimization Analysis
4.1. Optimization Results of System Parameters
Based on the operational parameters of the system and aiming at maximizing its comprehensive benefits, the HJ, PSO, and HJ–PSO algorithms were employed to optimize key system parameters including the collector area, tilt angle, azimuth angle, and the volumes of the SH and DHW tanks. Table 4 presents the optimal results obtained through iterative computation: collector area of 1118.47 m2, collector tilt angle of 51°, collector azimuth angle of −4°, SH tank volume of 1756 m3, DHW tank volume of 41.14 m3, and SSHP heating capacity of 864,800 kJ/h.
Table 4.
Optimized results of the system parameters.
4.2. Performance Analysis of Solar Collector System
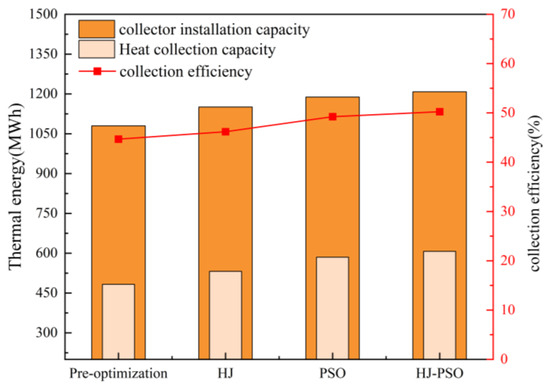
This study analyzed key performance parameters including the heat supplied by the collectors to the DHW tank and the system hot water supply assurance rate. The hot water supply assurance rate of the system was 82.18%. As illustrated in Figure 8, after optimization by different algorithms, the collector efficiency was significantly improved. The efficiencies obtained using the HJ, PSO and HJ-PSO algorithms were 46.2%, 49.23% and 50.2%, respectively, with the HJ-PSO hybrid algorithm achieving the most pronounced effect, improving efficiency by 5.5% compared with the pre-optimization condition. By optimizing critical parameters such as the collector installation capacity, azimuth angle, and tilt angle, the system achieved higher heat capture capacity and enhanced supply reliability even under comparable or slightly lower solar irradiation levels, thereby reducing its dependence on irradiation conditions. The application of optimization algorithms, particularly the HJ-PSO algorithm, effectively enhanced the overall annual performance of the solar thermal collector system.
Figure 8.
Heat collection capacity and heat collection efficiency by different algorithms.
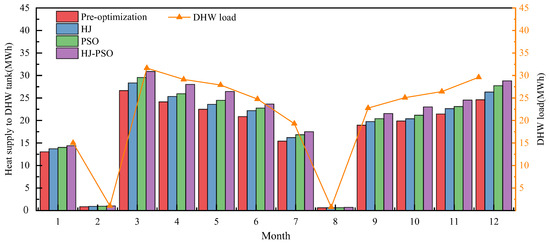
Figure 9 compares the annual heat supplied to the DHW tank by the solar thermal system under different optimization algorithms. As shown in Figure 8, the monthly DHW heat supply before optimization ranged from 13.02 to 26.63 MWh. After the optimization algorithms were implemented, the monthly DHW heat supply improved significantly in all cases. The HJ–PSO algorithm consistently achieved the highest heating performance across all months, with a supply range of 14.38–30.88 MWh. During peak load periods in winter and summer, the heat supply increased by more than 2 MWh, demonstrating strong seasonal load adaptability.
Figure 9.
Heat supply to DHW tank and DHW load of the system by different algorithms.
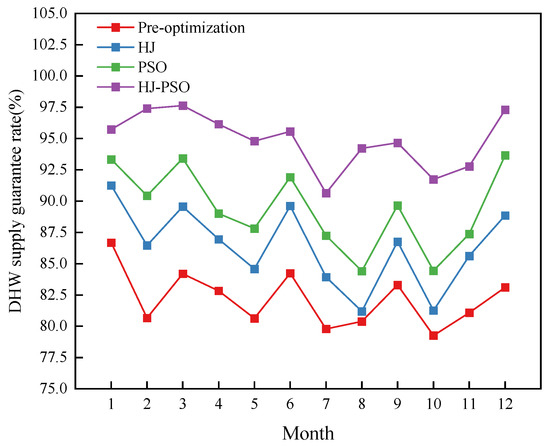
Figure 10 presents a comparison of the DHW supply guarantee rates achieved by the different optimization algorithms. After optimization, the monthly hot water assurance rate was markedly improved compared with that under the pre-optimization condition. The annual average hot water assurance rates under the HJ, PSO, and HJ–PSO algorithms reached 86.34%, 89.4%, and 94.88%, respectively, representing increases of 4.16%, 7.22%, and 12.7%. Notably, with the HJ–PSO algorithm, the monthly assurance rate was consistently maintained above 90% and reached a maximum of 97.0% in December. These results demonstrate that optimizing the collector capacity effectively enhances its coupling performance with the sewage-source heat pump unit, substantially increasing the solar energy contribution and consequently reducing the operating energy consumption of the heat pump unit during the heating season.
Figure 10.
DHW supply guarantee rate by different algorithms.
4.3. Performance Analysis of the Heat Storage Tank
The system employed two types of storage tanks: a DHW tank and an SH tank. The SH tank, with a larger volume and buried underground near the building, is primarily used for heating. The DHW tank is located in a separate equipment room and stores the daily solar thermal energy, which supplements high-temperature water when the supply temperature of the seasonal tank drops at the end of the heating season and also provides domestic hot water to meet daily demand.
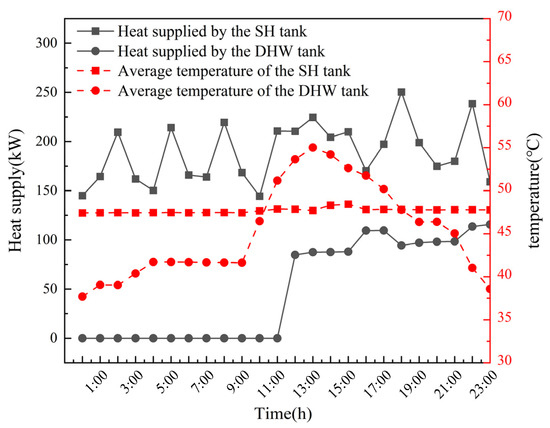
Figure 11 shows the hourly heat supply and average temperature variations in the DHW and SH tanks on a representative day of the heating season (January 15). The DHW tank temperature fluctuated over the course of the day, reaching a peak around 13:00 when solar radiation was strong and the collector fluid met circulation conditions, enabling rapid charging of the tank. After 17:00, as the heat gained by the collector fell below the threshold of the differential temperature controller, the DHW tank temperature reduced significantly. To maintain sufficient hot water supply in the evening, the electric auxiliary heater was activated, maintaining the average tank temperature above 40 °C. The SH tank, benefiting from excellent insulation, effectively limited heat loss to the soil, and its temperature remained stable between 46 and 48 °C under intelligent differential temperature control. While the heat output of the DHW tank varied according to daily hot water consumption, the SH tank adjusted its output flexibly in response to the hourly heating load of the building, ensuring a continuous and stable supply of heating water.
Figure 11.
Hourly heat supply and average temperature of the tank in a typical day during heating season (January 15).
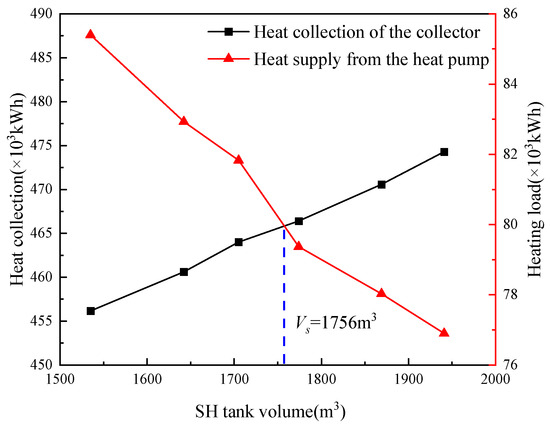
Figure 12 illustrates the effect of SH tank volume on the thermal energy collected by the solar collector and the heating output of the heat pump. As the tank volume increases from 1535 m3 to 1940 m3, the heat from the solar collectors shows a clear upward trend, while the heat from the heat pump decreases correspondingly. This inverse relationship highlights the role of larger storage volumes in mitigating solar intermittency and enhancing the utilization of surplus solar energy, thereby reducing the operational dependency on the heat pump. The intersection of the two curves at a tank volume of 1756 m3 represents a balanced design point where solar collection and heat pump output are optimally coordinated. This configuration minimizes overall system energy consumption and is recommended as the most economically and energetically favorable capacity, offering a practical reference for the design of similar integrated energy systems.
Figure 12.
Heat collection of the collector and heat supply from the heat pump with different tank volumes.
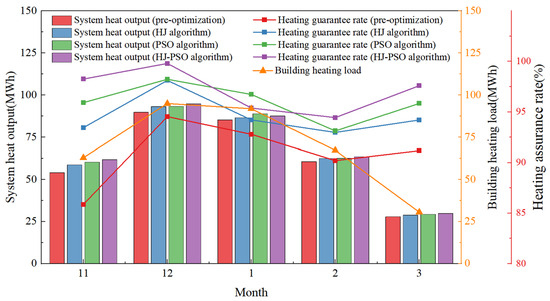
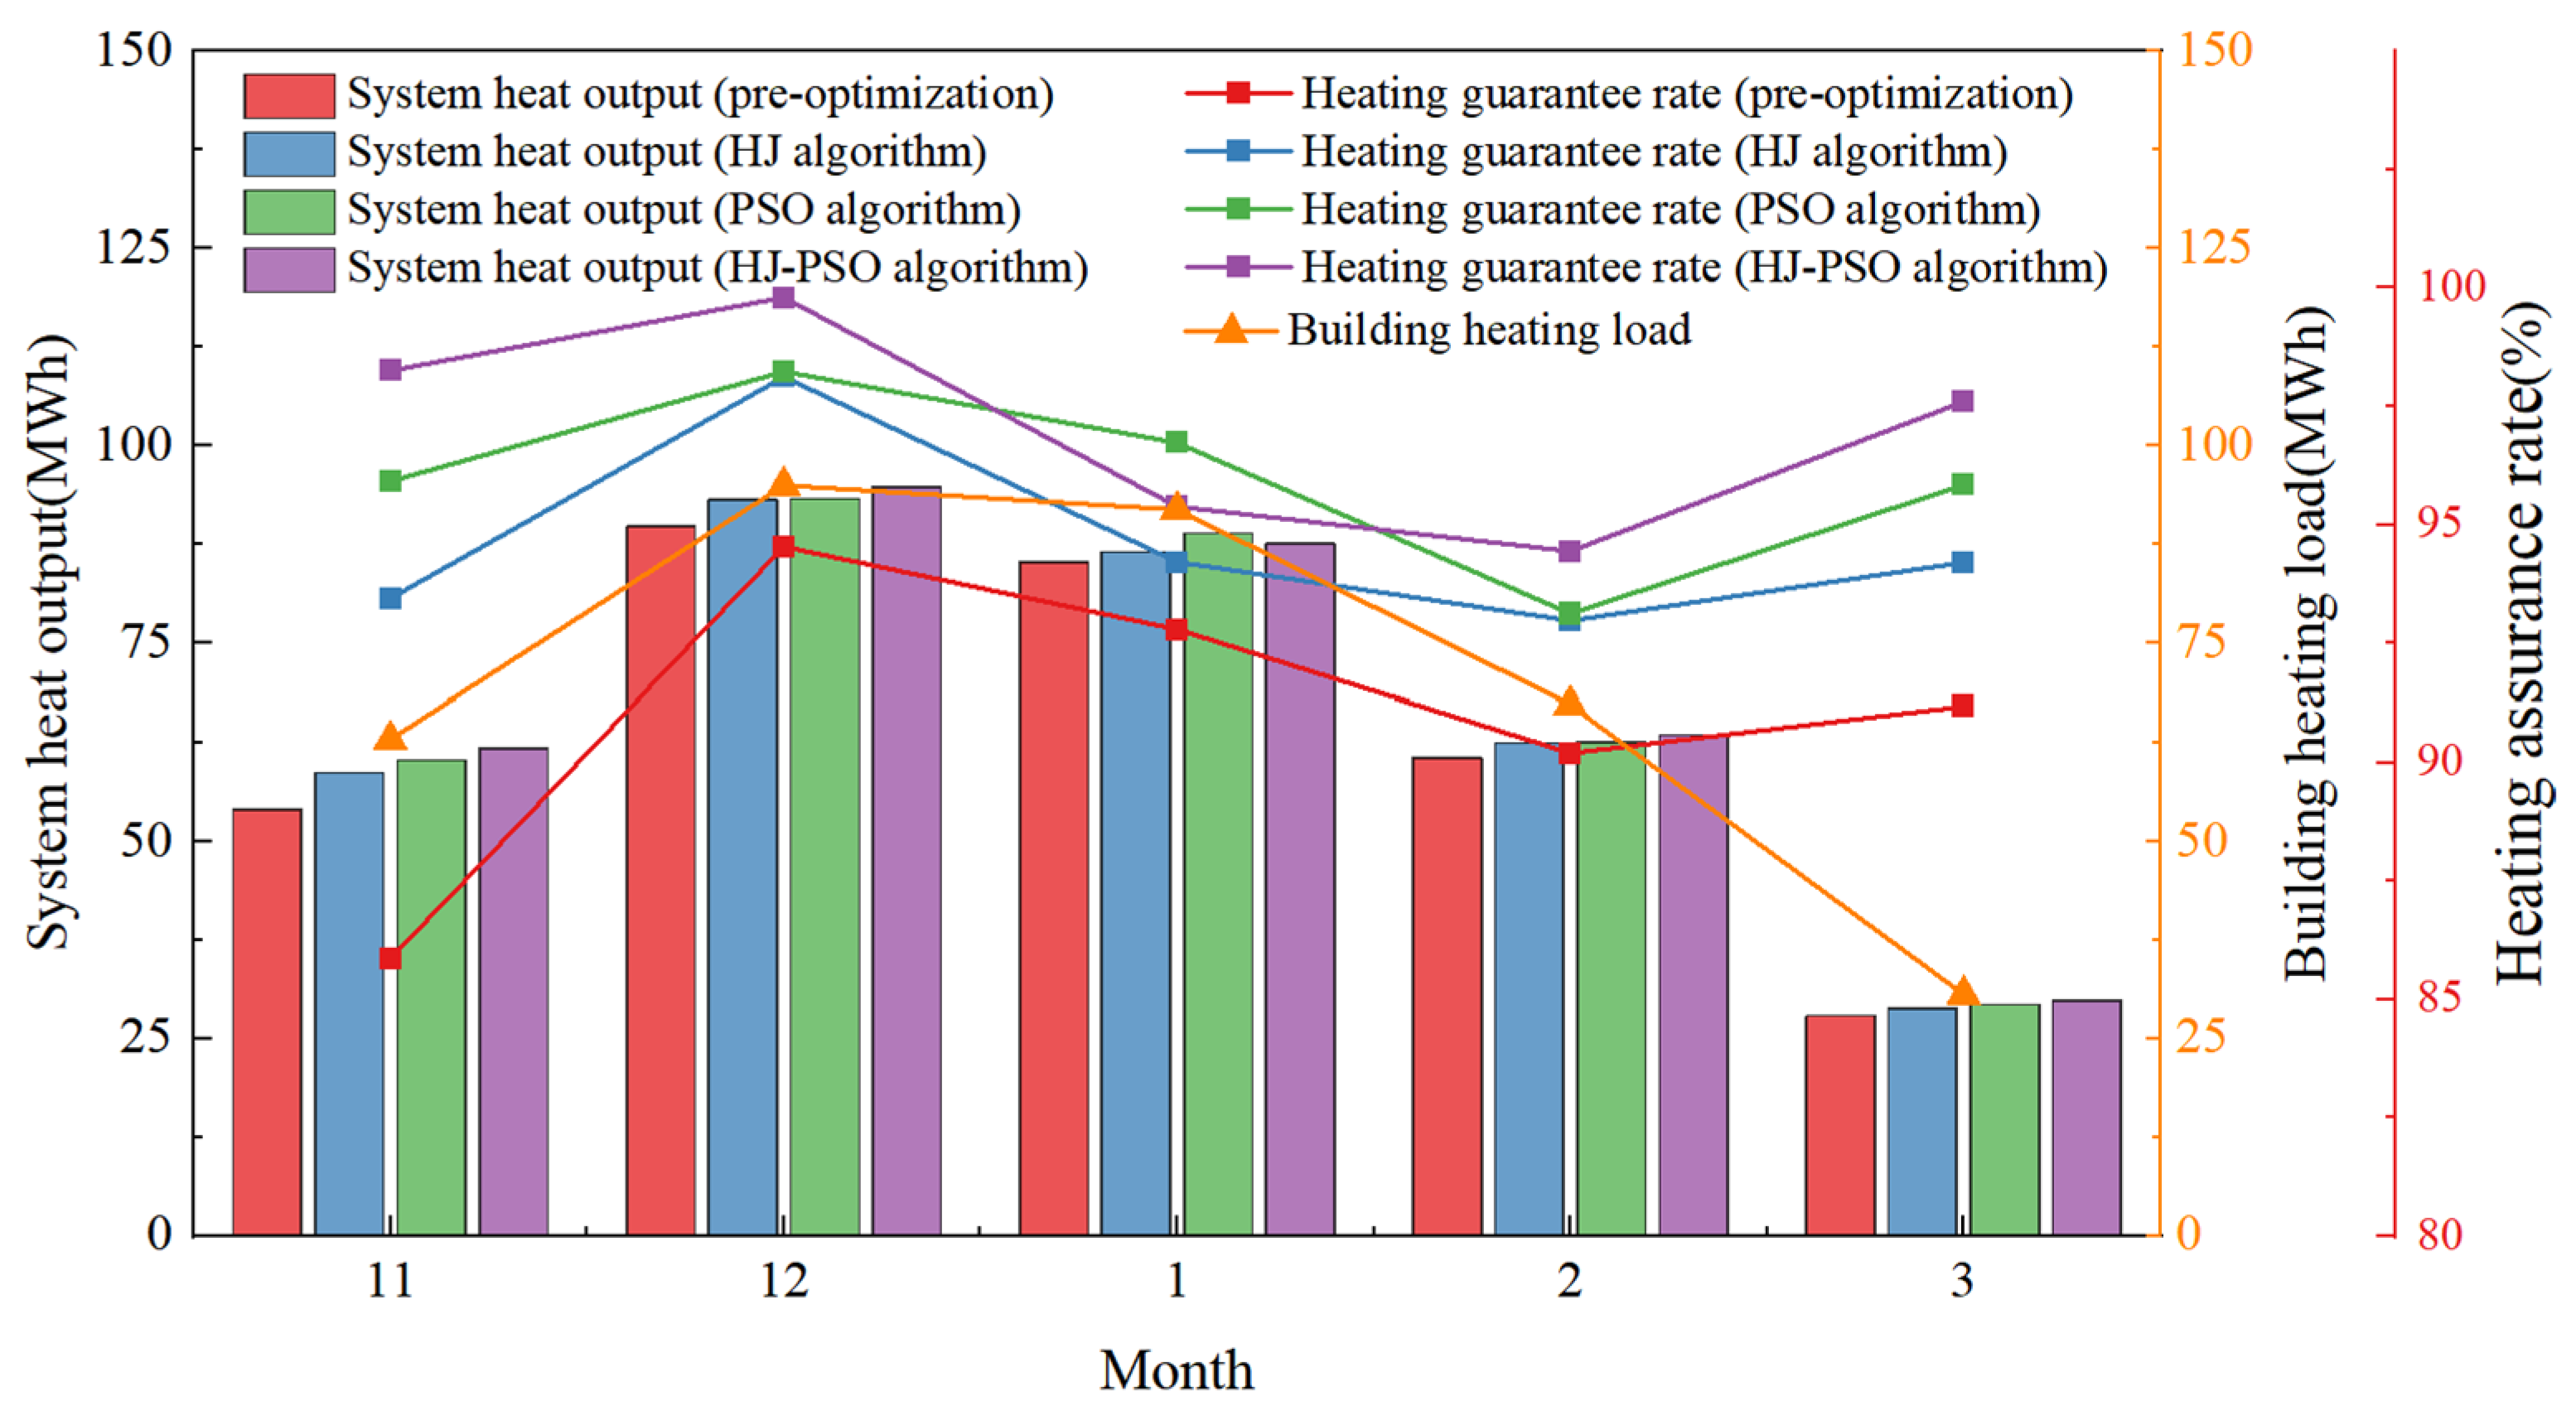
Figure 13 compares the monthly heating supply guarantee rate and heat output of the system before optimization and under the three optimization algorithms during the heating season. The heating assurance rate exhibited seasonal fluctuations. In January, when the load was highest, the guarantee rate improved from 90.20% before optimization to 94.44% with the HJ–PSO algorithm, indicating enhanced reliability during peak demand. The guarantee rate remained high in February and reached its maximum of 97.60% in March with increasing outdoor temperatures and decreasing heating load. All three optimization algorithms improved the monthly guarantee rates, with the HJ–PSO algorithm consistently performing the best, demonstrating superior system coordination and dynamic load matching. The optimized heat supply followed the building heating load trend. Under the HJ–PSO algorithm, the heat supply increased by 2.78% compared with the pre-optimized case, effectively reducing the energy consumption of the heat pump and auxiliary heating equipment. Throughout the heating season, the optimized system maintained high assurance rates, reflecting excellent operational stability.
Figure 13.
System heating supply guarantee rate and building heating load by different algorithms.
4.4. Performance Analysis of the Heat Pump Unit
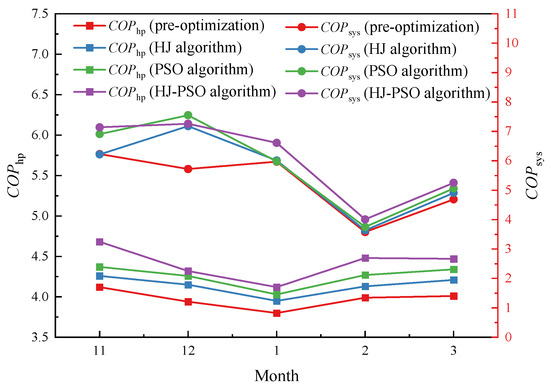
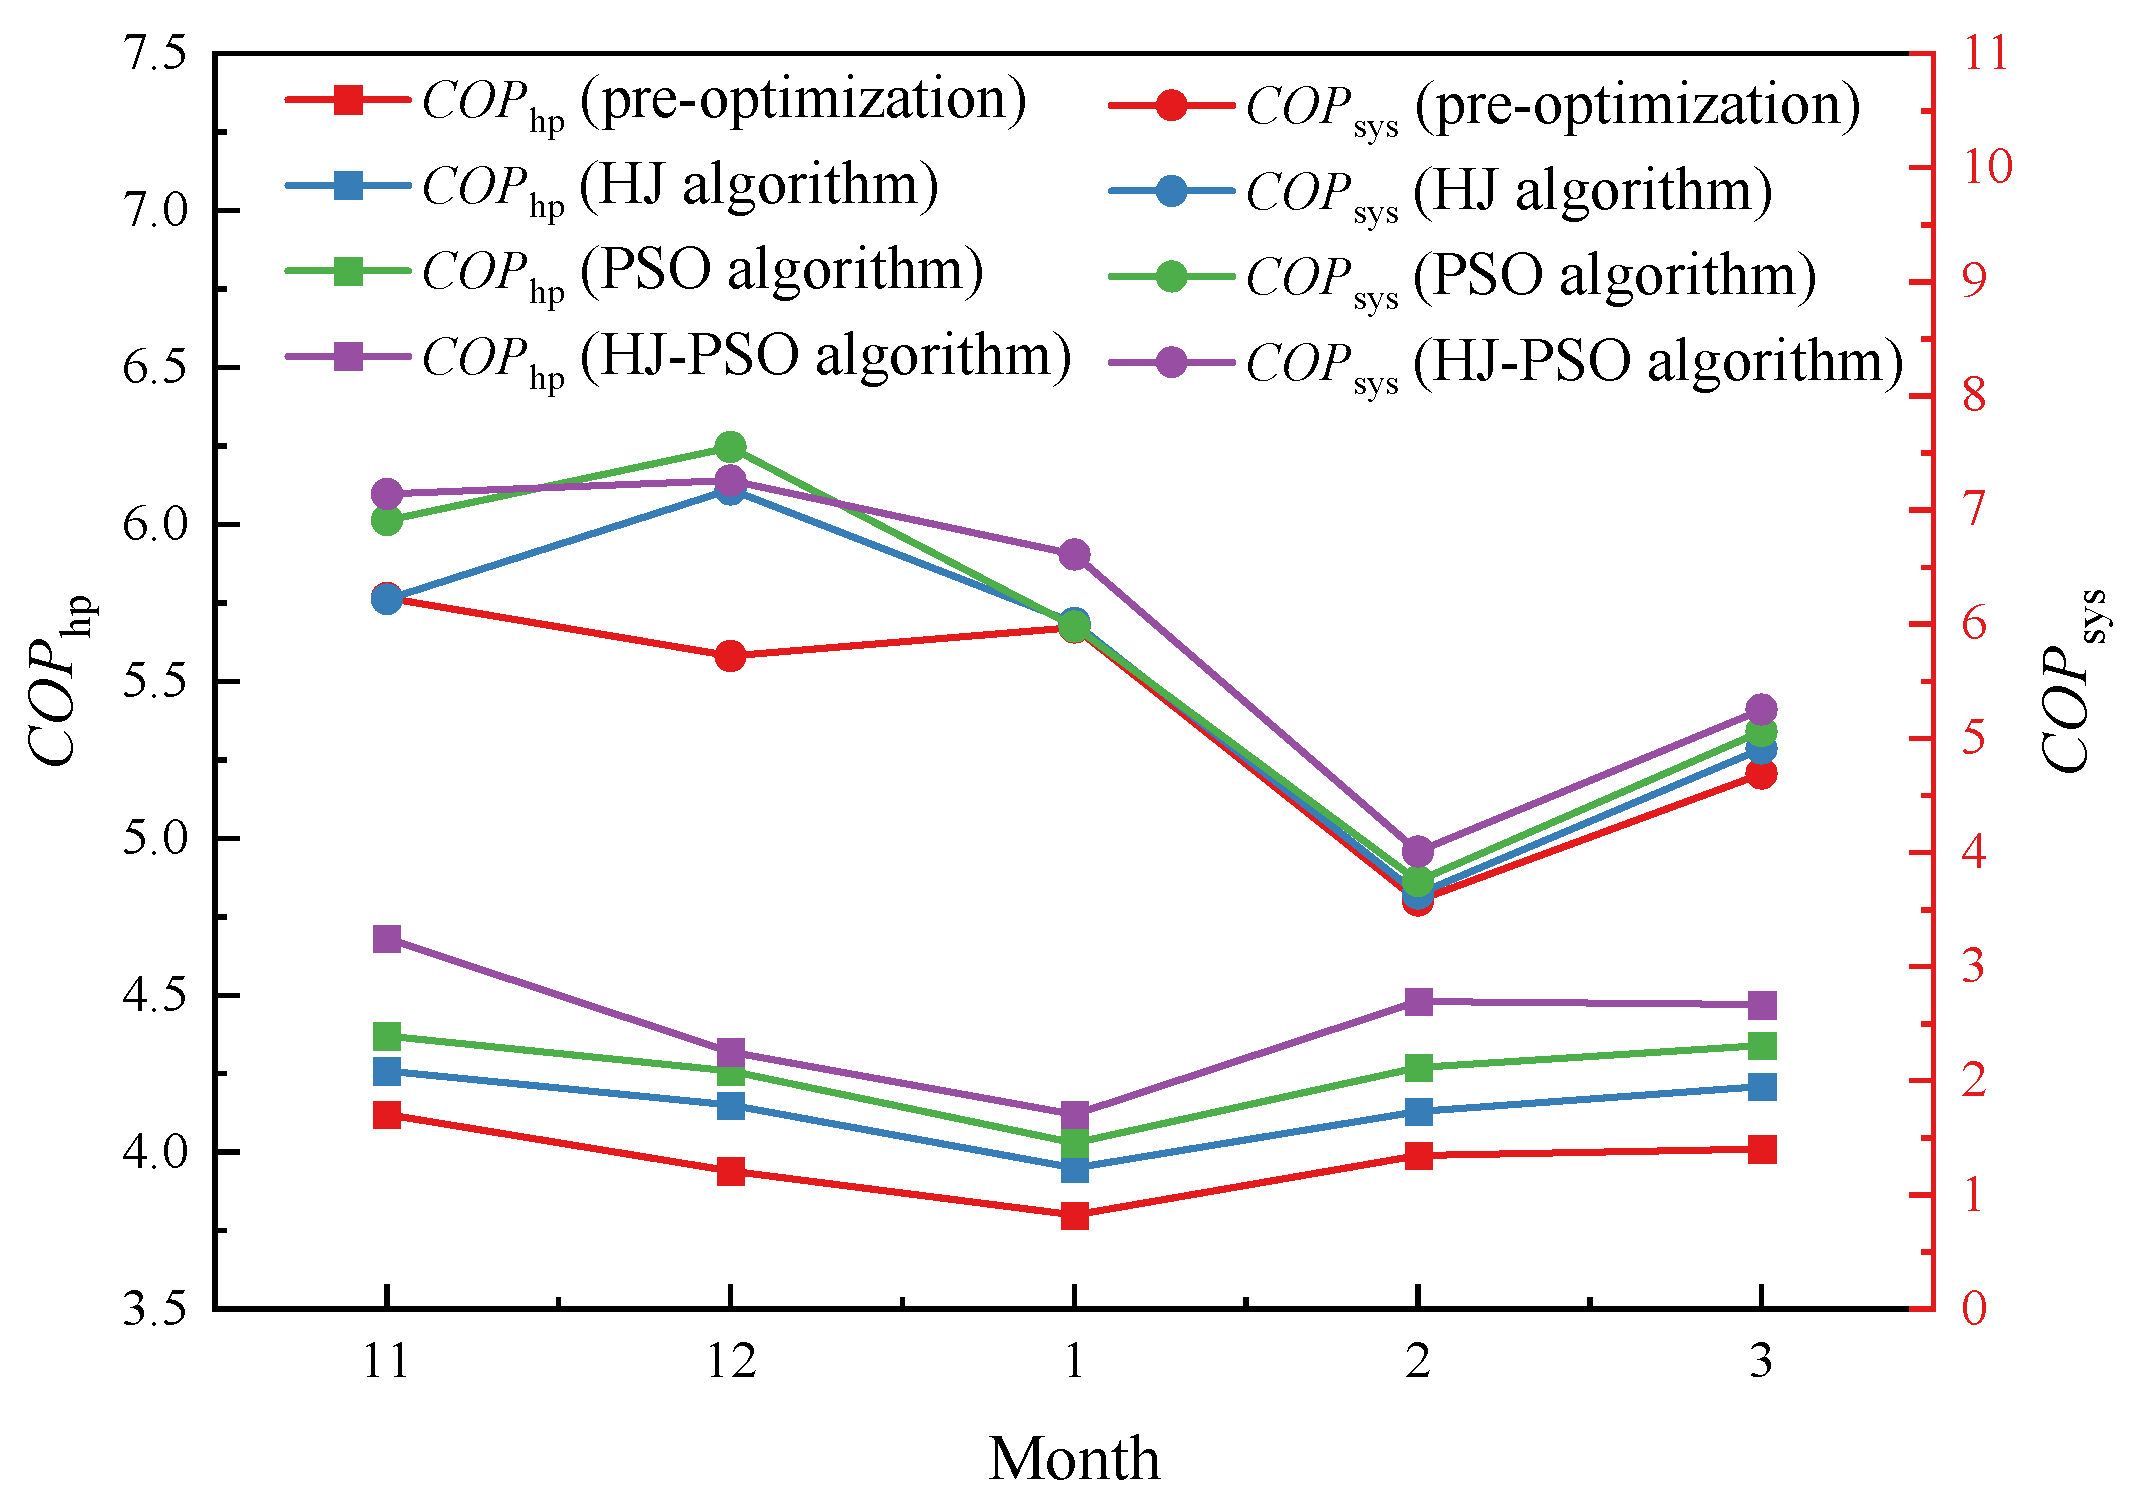
Figure 14 compares the monthly COPsys and COPhp during the heating season under different optimization algorithms. The results indicate that both the COPhp and COPsys values obtained with the three optimization algorithms were higher than those of the pre-optimization system. Furthermore, the HJ–PSO hybrid algorithm consistently outperformed the other two individual algorithms on both performance indicators across all months. The COPhp values ranged from 3.8 to 4.68, with the lowest value observed in January due to the peak heating load and lowest ambient temperatures, which significantly increased the compressor energy consumption. The most notable improvement was observed in December with the HJ–PSO algorithm, which increased the COPhp by approximately 12% compared with the baseline, demonstrating its effectiveness in enhancing heat pump efficiency under extreme operating conditions. The monthly COPsys varied between 3.64 and 7.55, reflecting the combined influence of solar radiation, load profile, and operational strategy on the overall system efficiency. The lowest COPsys occurred in February, attributable to weak solar irradiation and high heating demand, resulting in low solar fraction and elevated heat pump energy consumption. All three optimization algorithms improved the COPsys, with the HJ–PSO algorithm achieving the highest value every month. A particularly significant improvement was observed in December, where the COPsys increased from 6.23 to 7.14. This peak performance in December was facilitated by relatively higher soil temperatures and the effective charging state of the seasonal storage tank. Furthermore, the hybrid optimization algorithm enhanced solar utilization by dynamically coordinating the collector and storage operations, thereby reducing reliance on the heat pump. The annual average COPsys improved from 5.24 for the baseline system to 6.05 with the HJ–PSO algorithm, an increase of 15.57%. Moreover, the HJ–PSO algorithm resulted in reduced fluctuation and a more stable trend in the monthly COPsys values. This indicates that the hybrid algorithm effectively coordinated the collector, storage, and heat pump subsystems through dynamic operational adjustments, thereby enhancing the integrated system performance throughout the heating season, reducing dependency on conventional electricity, and delivering significant energy-saving benefits.
Figure 14.
COPhp values and COPsys values by different algorithms.
4.5. Comprehensive Performance Analysis
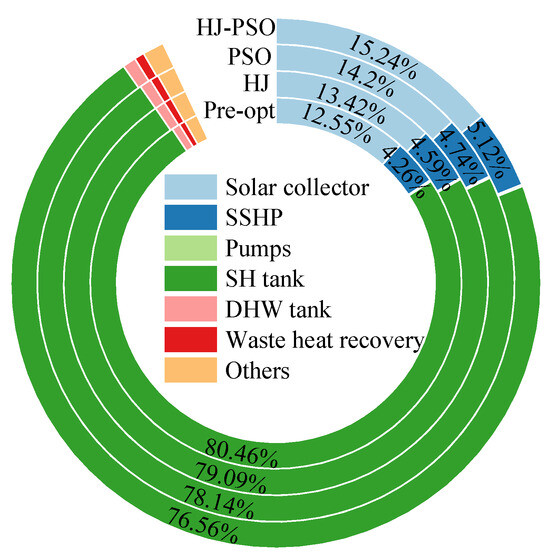
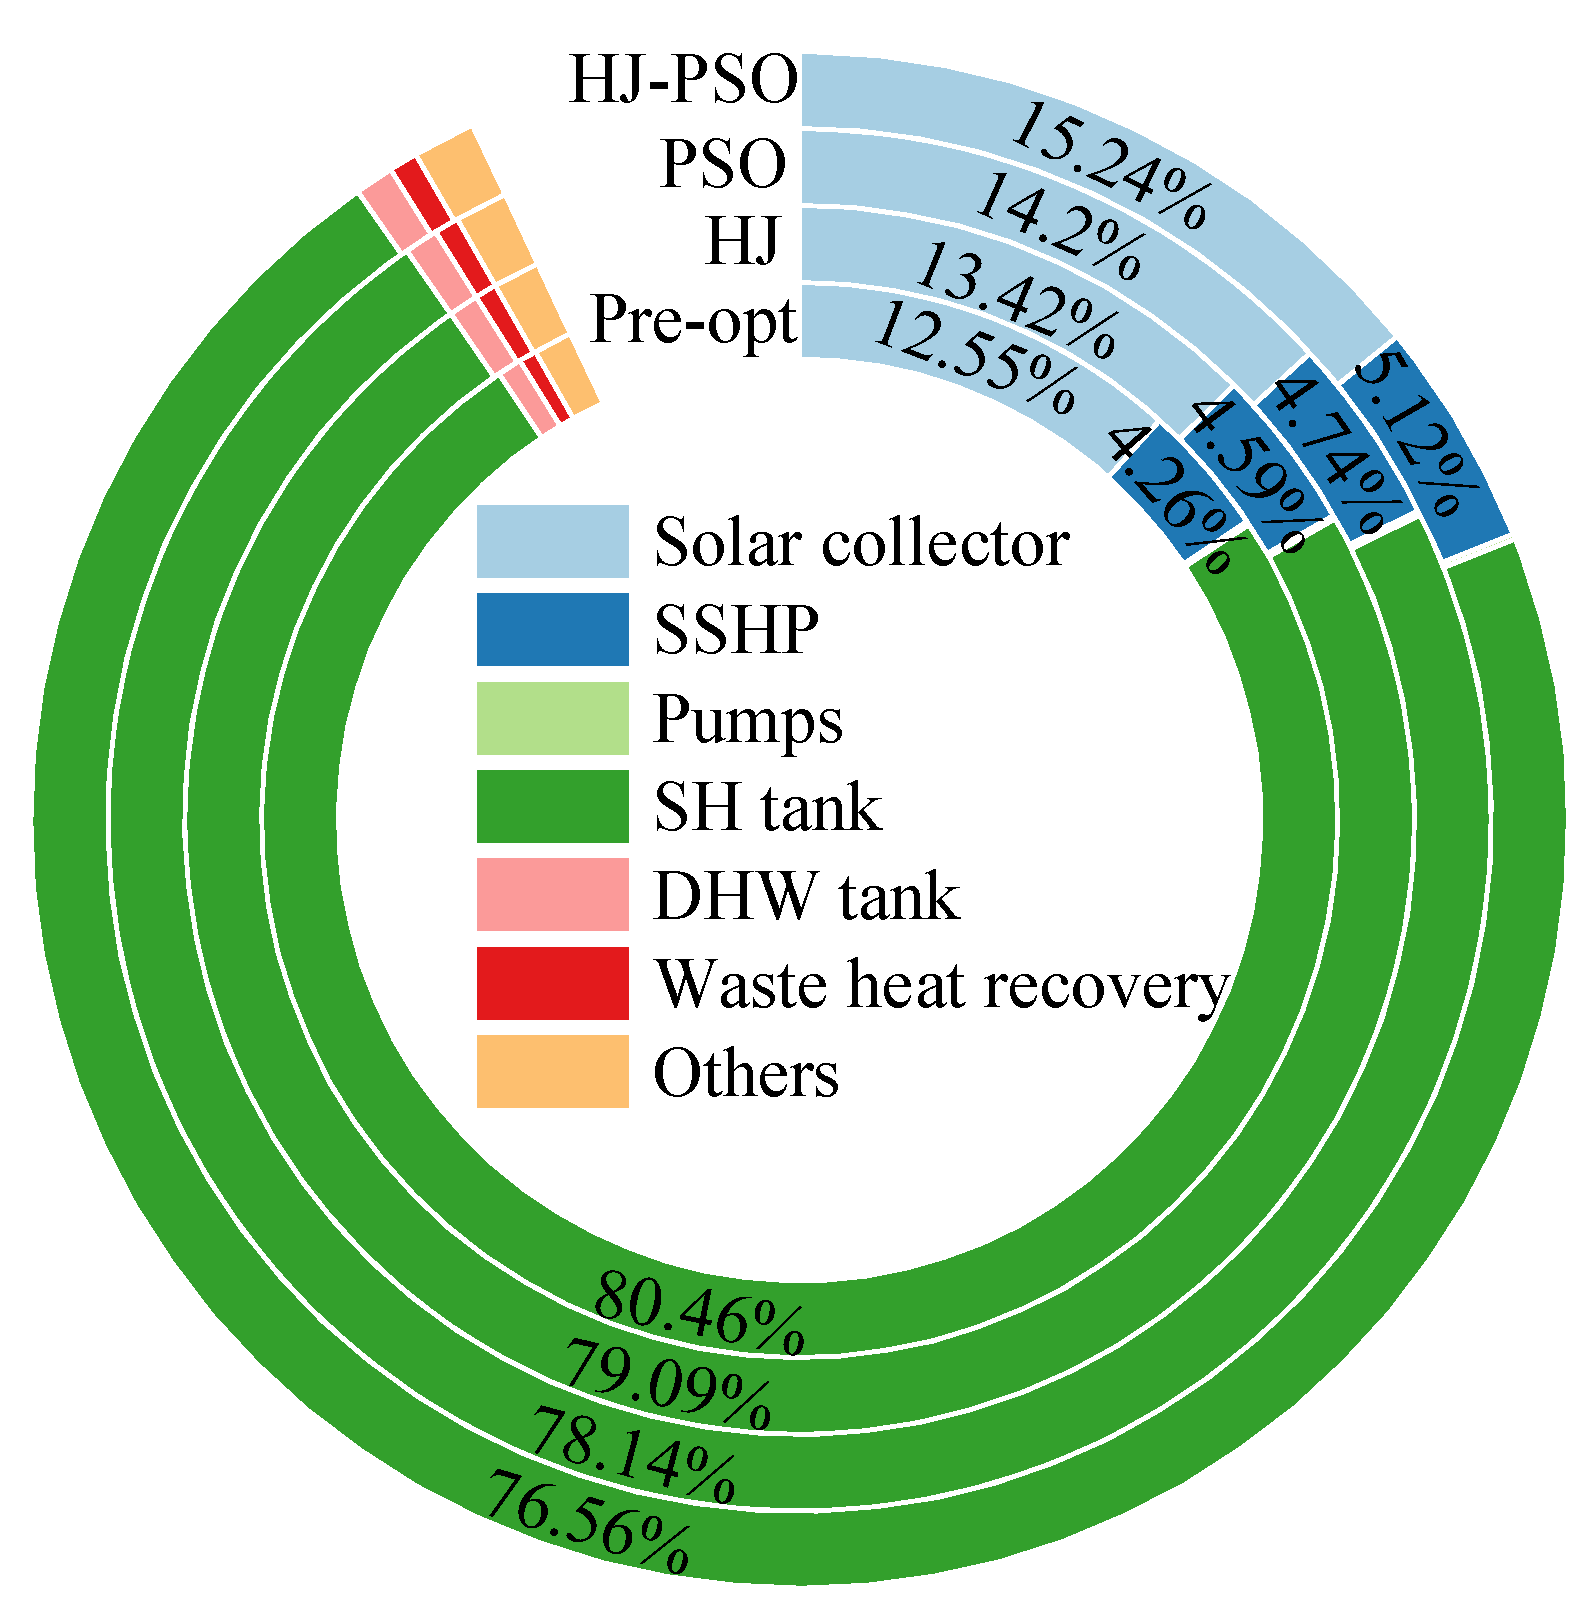
As illustrated in Figure 15, the proportion of the total initial investment allocated to key system components varies significantly across the different optimization algorithms. In the pre-optimization scenario, the investment proportions for solar collectors, sewage-source heat pump units, and seasonal thermal storage tanks were 12.55%, 4.26%, and 80.46%, respectively. After optimization with the HJ, PSO, and HJ–PSO algorithms, the proportions for seasonal thermal storage tanks decreased to 79.09%, 78.14%, and 76.56%, whereas that for the solar collectors increased correspondingly to 13.42%, 14.20%, and 15.24%. The optimization algorithms enhanced the solar energy utilization of the system by reasonably increasing the collector capacity. The moderate reduction in the SH tank share reflects improvements in the thermal storage operation strategy and the synergistic performance of the system components. The adjustment of the investment structure significantly improved the system economics; notably, under the HJ–PSO algorithm, the cost-saving rate reached 24%, and the dynamic payback period was shortened by approximately 4–5 years. These results indicate that optimizing the capacity allocation of key components can enhance the economic performance and energy sustainability of the system over its entire life cycle.
Figure 15.
Proportion of initial investment of equipment by different algorithms.
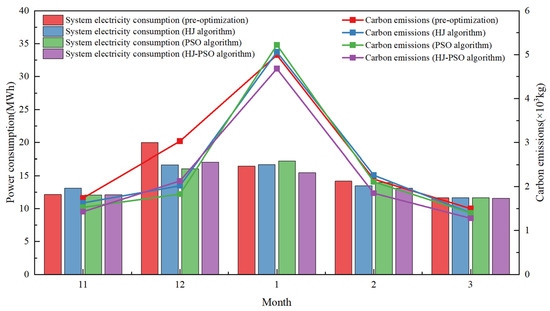
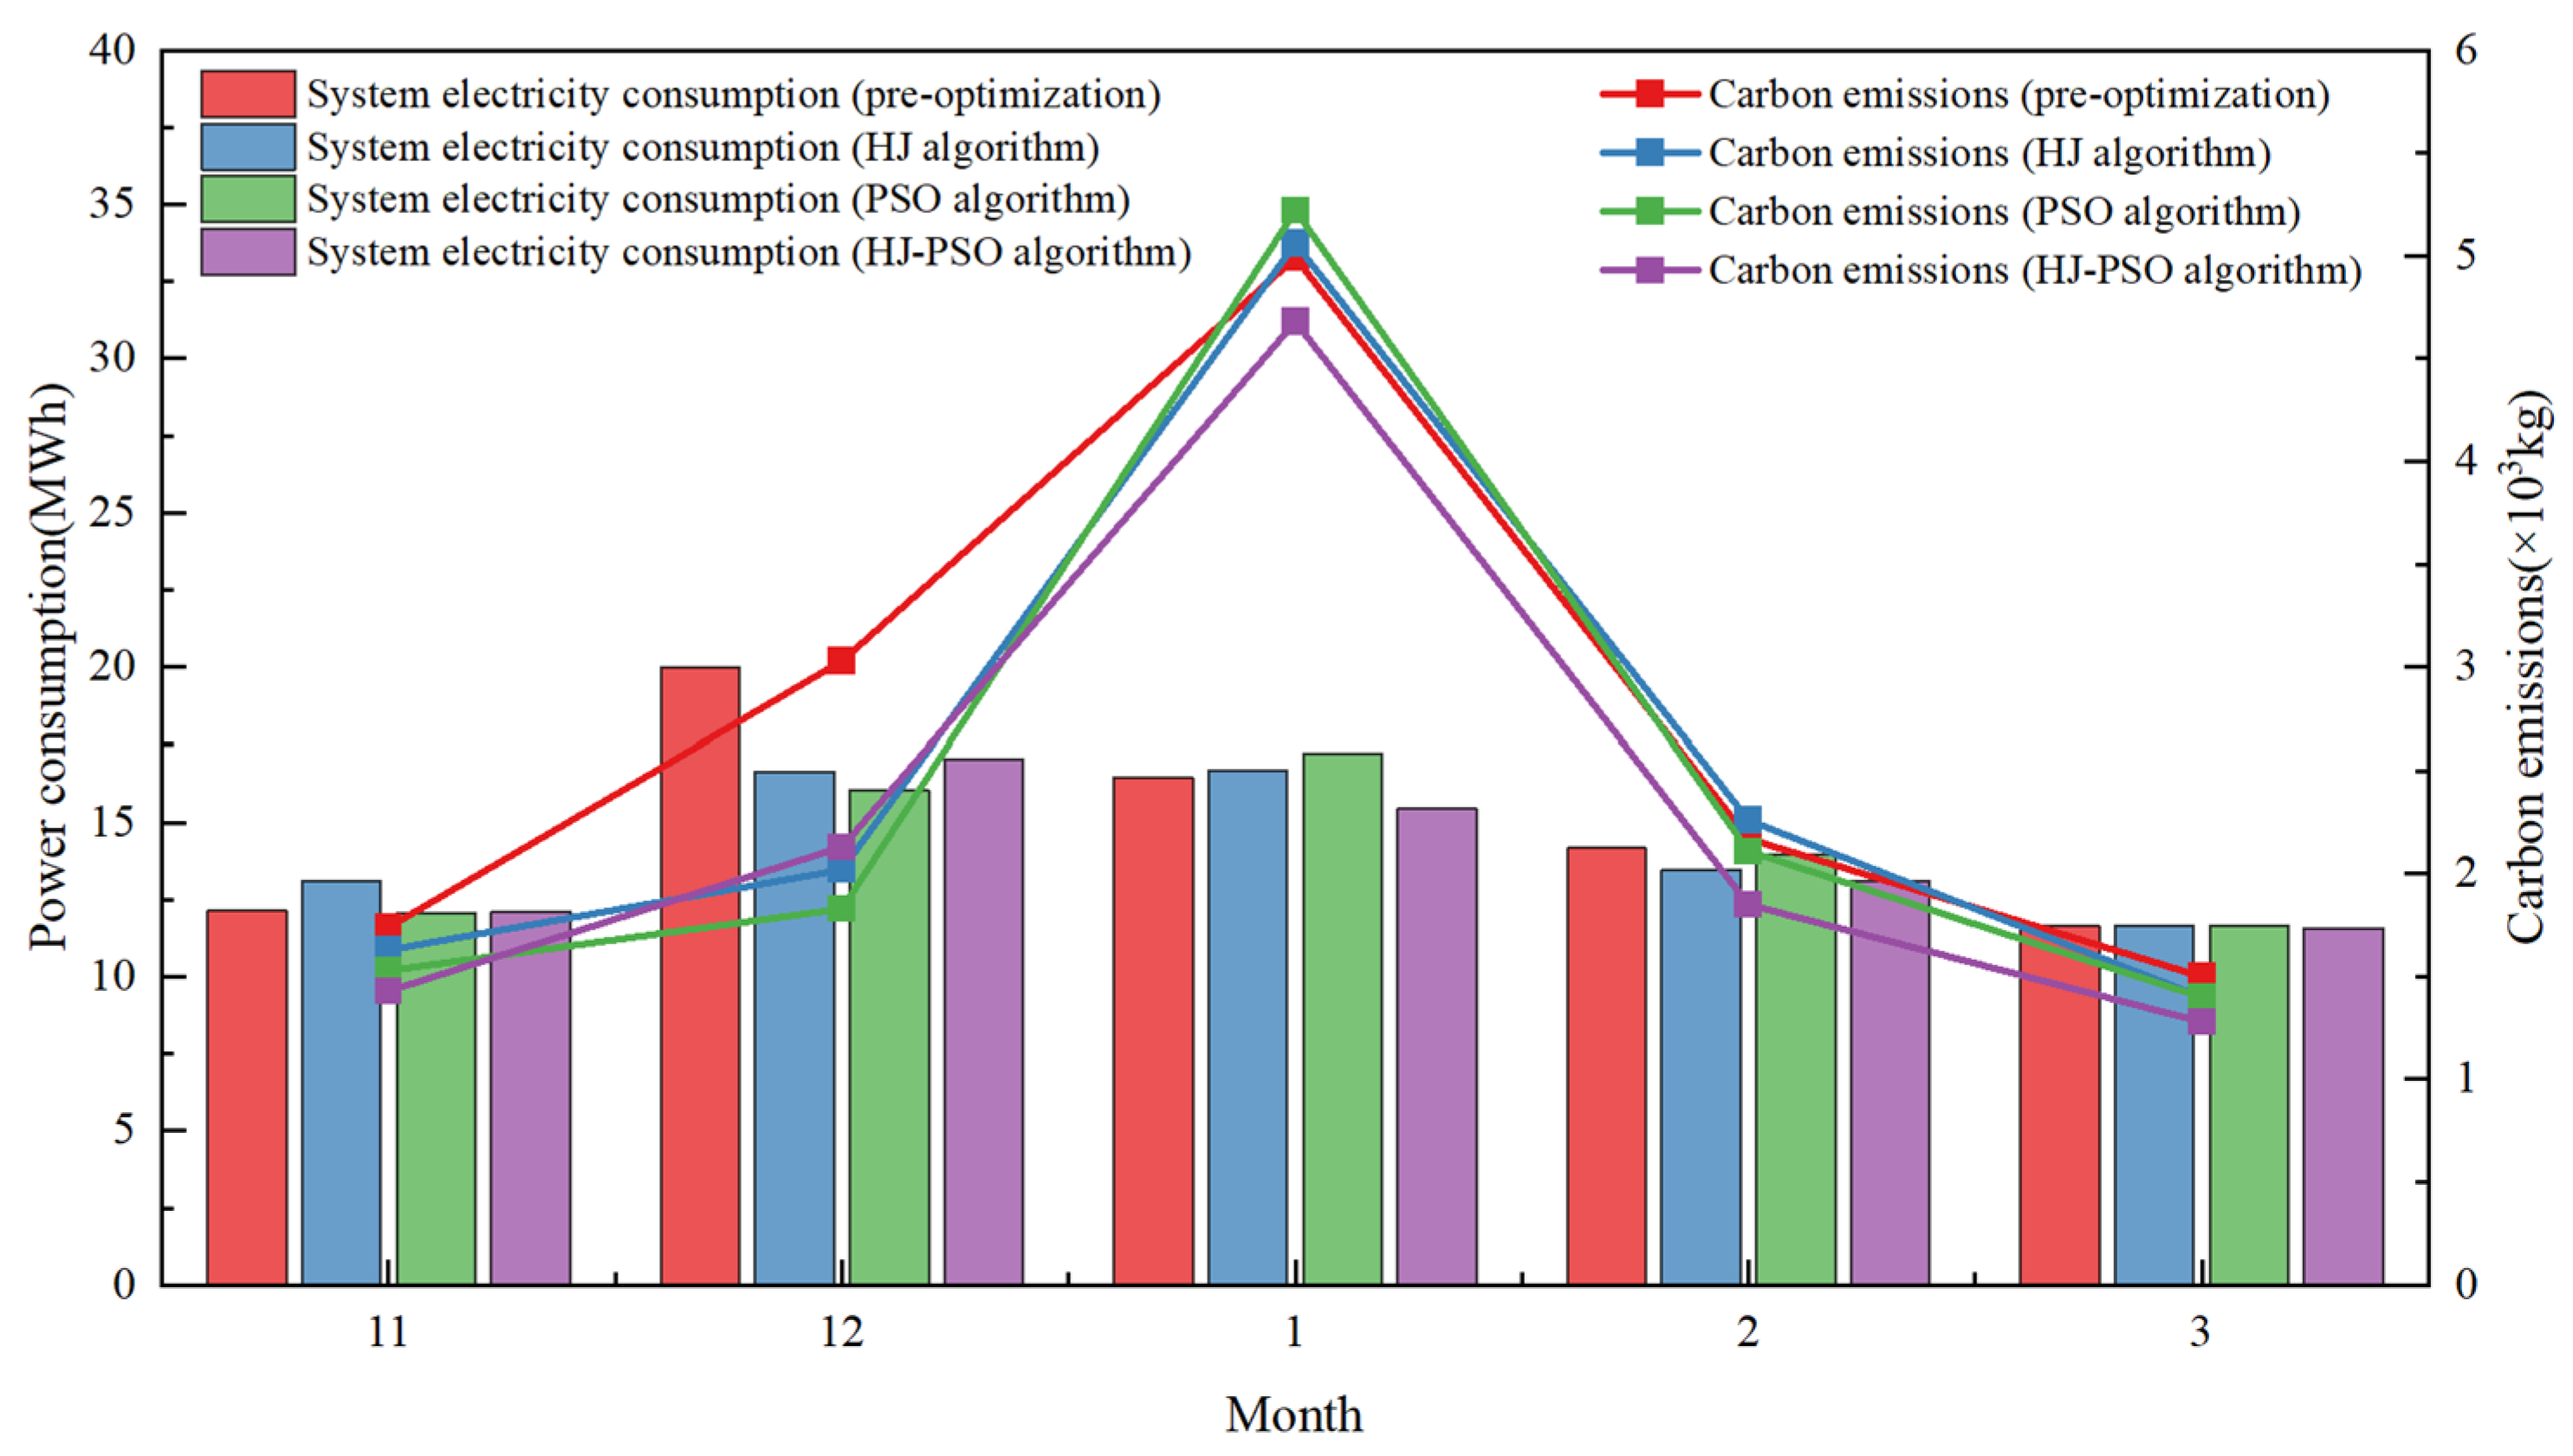
Figure 16 presents a comparison of the electricity consumption and carbon emissions of the system under different optimization algorithms. During the heating season, the total electricity consumption showed fluctuating trends, peaking at 19.98 MWh in January and dropping to approximately 11.63 MWh in March. All three optimization algorithms reduced energy consumption, with the HJ–PSO algorithm achieving the most significant result by lowering the electricity usage in January to 17.02 MWh, a reduction of 14.8% compared with the pre-optimized case. System CO2 emissions followed the same trend as electricity consumption: the peak emission in January decreased from 4990 to 4680 kg after HJ–PSO optimization, corresponding to a reduction of 6.2%. The annual cumulative emission reduction reached approximately 8.5%. The hybrid optimization algorithm improved operational strategies and equipment coordination efficiency, effectively reducing the load on high-energy-consuming devices while meeting heating demands. This not only enhanced the overall energy efficiency of the system, but also significantly improved environmental performance, providing an effective approach for reducing both operational carbon emissions and economic costs.
Figure 16.
Comparison of system electricity consumption and carbon emissions by different algorithms.
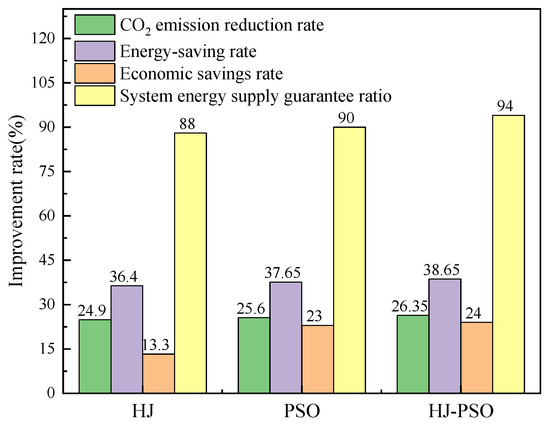
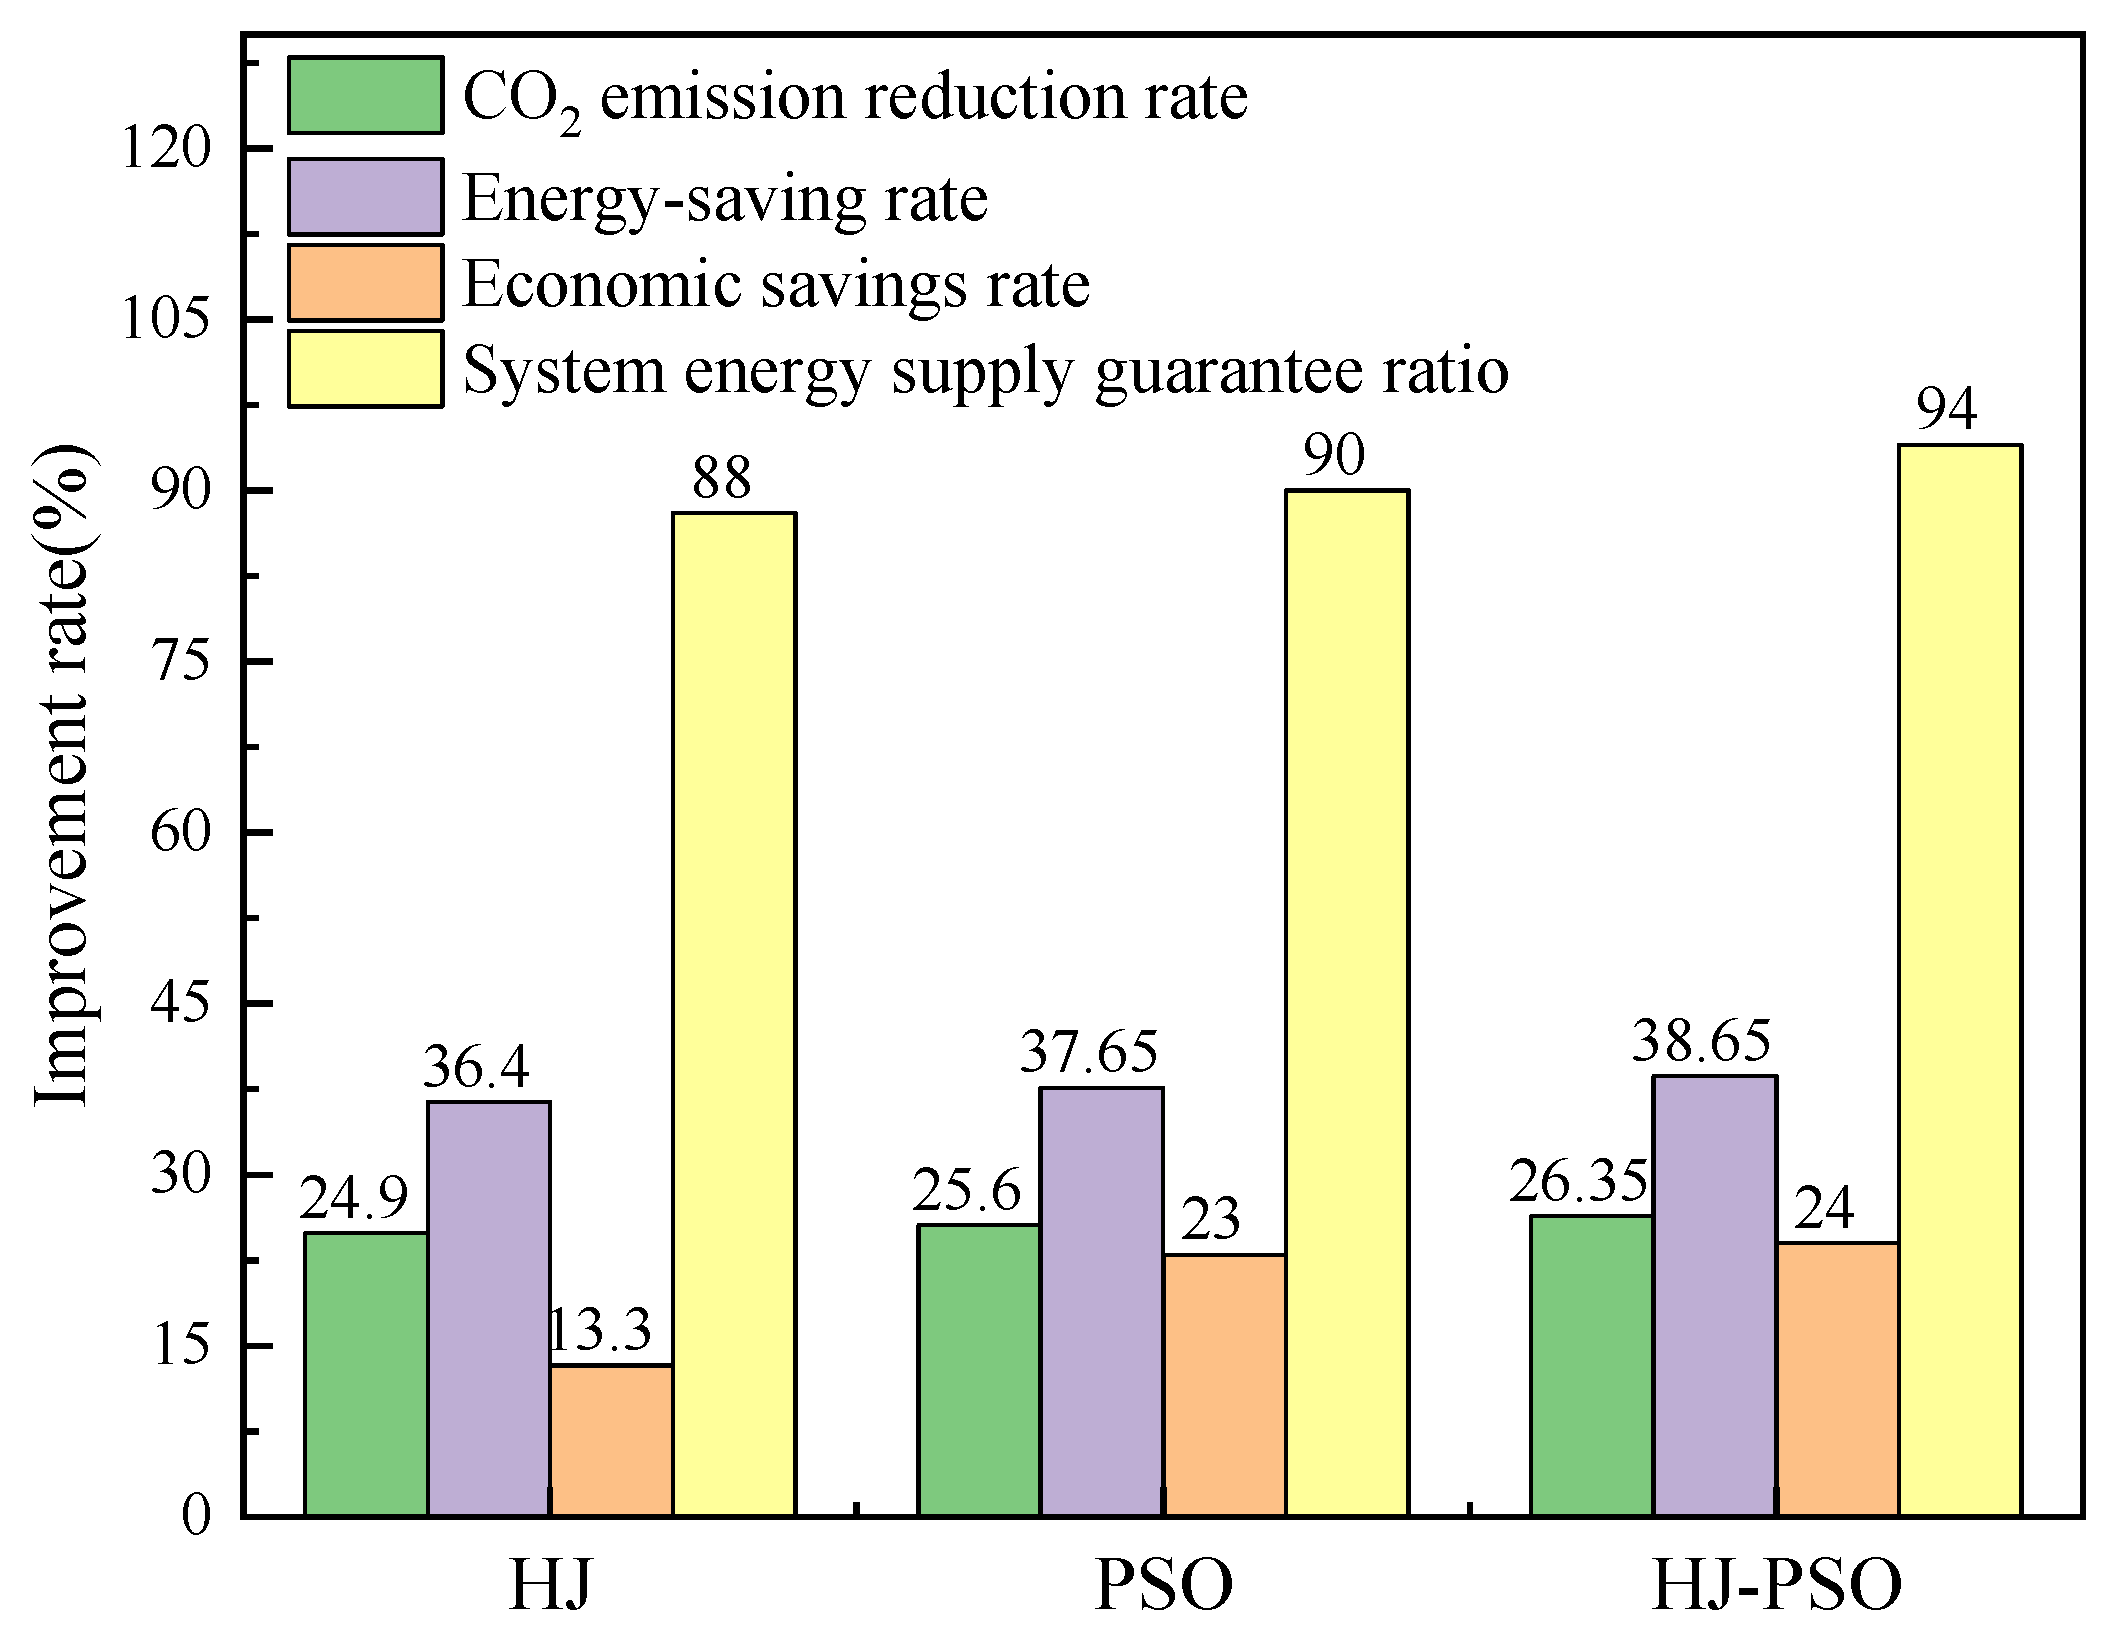
Figure 17 presents a comprehensive evaluation of the system from multiple dimensions, including economic performance, environmental benefits, energy savings, and system efficiency. The precision differences between the three optimization algorithms in capacity configuration were less than 3%, while the differences in the system cost-saving rate and energy-saving rate were controlled within 1%, indicating a high overall consistency of the optimization results. This demonstrates that the HJ–PSO hybrid algorithm can achieve the same optimization accuracy as the conventional HJ and PSO algorithms, with reliable and precise results. Following the optimization process, the substitution of the optimal values for each evaluation indicator into the multiobjective function yielded comprehensive system performance improvements of 23.71%, 28.39%, and 29.33% over the pre-optimization baseline for the three algorithms, respectively. Among them, the HJ–PSO algorithm enabled the SE-SSHP system to achieve the best overall benefit, with detailed performance improvement indicators summarized in Table 5.
Figure 17.
Improvement rates of various indicators by different algorithms.
Table 5.
System optimization benefit.
5. Adaptability Analysis of the Optimized System to Different Climate Zones
To further investigate the adaptability of the developed SE-SSHP system to different climate zones, six representative cities, Harbin, Urumqi, Beijing, Lanzhou, Shanghai and Chengdu, were selected for system operation analysis. These cities span three distinct climate divisions as specified in GB 50352-2019 Unified Standard for Civil Building Design [40], namely a severe cold region, cold region, and hot summer–cold winter region, all requiring both space heating and DHW supply.
Table 6 presents the optimal system parameter configurations obtained via the HJ–PSO algorithm for each city. Clearly, significant variations in solar radiation conditions and building heating loads across different climate zones led to distinct regional adaptability in key system equipment parameters. In terms of collector area allocation, Urumqi required the largest collector area due to its long and cold winters, while Shanghai, with a milder climate, required the smallest. This reflects the dominant role of heating demand in determining the scale of solar thermal collection. The tilt angle of collectors is correlated with local latitude and solar altitude angles; northern cities generally have greater tilt angles than southern cities, which enhances winter collection performance. In terms of thermal storage system configuration, the water tank volume per unit collector area ranged from 1.54 to 1.62 m3/m2, with relatively minor variations, indicating that this ratio remained relatively stable across different climate zones. However, the volume of the SH tank varied significantly among cities, influenced by both the collector area and heating load. A similar trend was observed for the DHW tank volume, which was affected by population size, water usage patterns, and climatic conditions. The heating capacity configuration of the wastewater-source heat pump further reflects the impact of climatic conditions and load demands. Harbin, with its prolonged cold period and high heating load, required the highest heating capacity, while Chengdu exhibited a relatively lower demand. These parameter differences clearly demonstrate that in the design of SE-SSHP systems across different climate zones, location-specific optimization based on local meteorological and load characteristics is essential to achieve a balance between energy efficiency and economic feasibility.
Table 6.
Optimization results of system parameters in different cities.
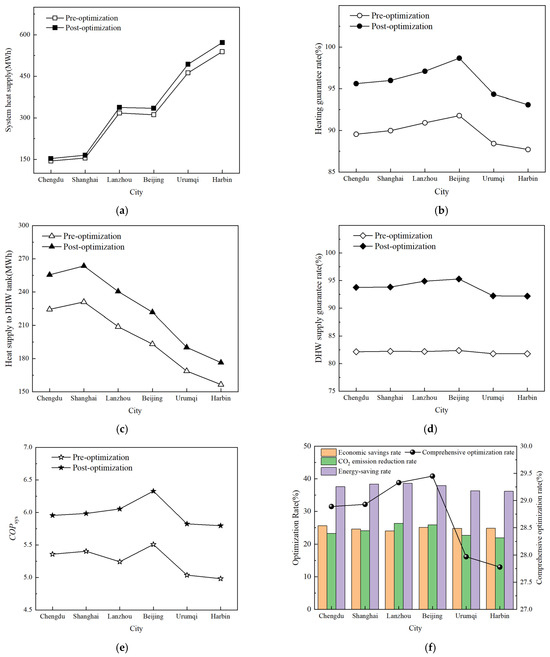
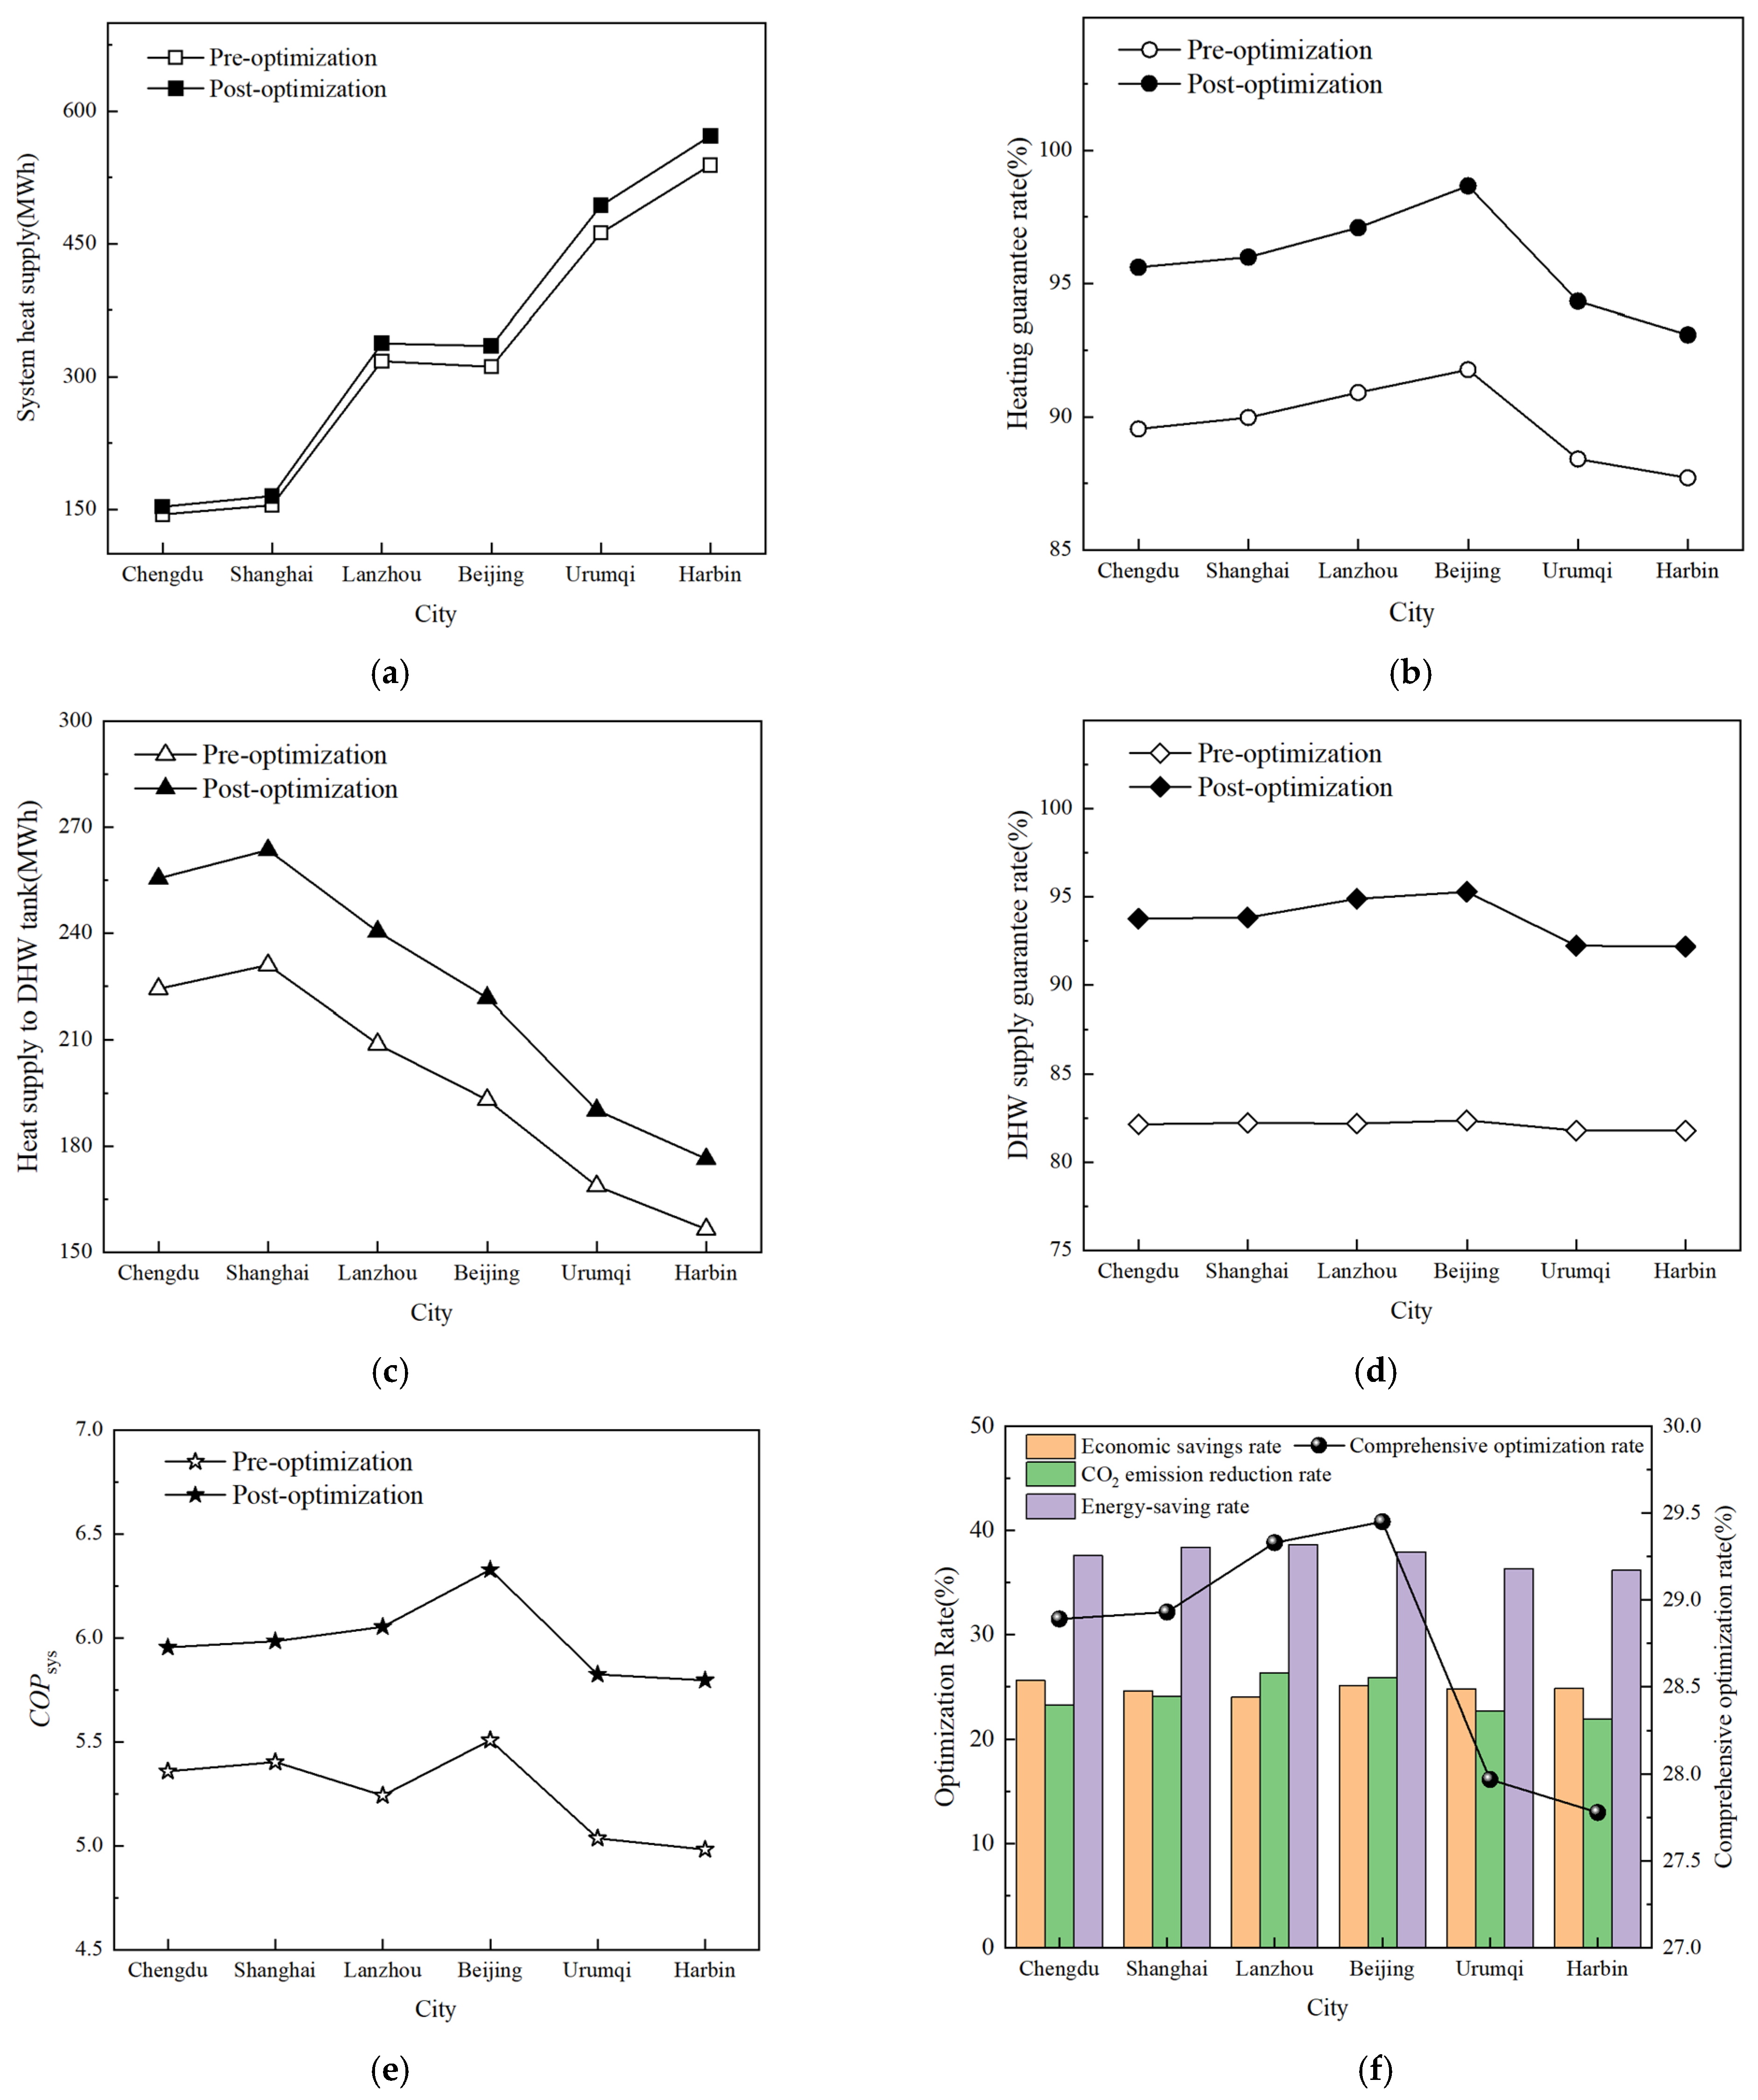
Figure 18 compares multiple indicators and optimization effects of different cities before and after optimization. The optimized SE-SSHP system exhibited distinct performance improvement characteristics across different climate zones. In severe cold regions, the improvement in the system heating capacity was limited. For Harbin, the heating supply increased from 539.05 to 572.09 MWh; for Urumqi, it increased from 462.17 to 493.15 MWh. The heating guarantee rates increased by 5.92% and 5.37%, respectively, while the DHW assurance rates improved by 10.39% and 10.43%. The COPsys values reached 5.82 and 5.80, respectively. This indicates that the optimized system prioritizes meeting heating demand, yielding significant improvements in regions with high heating loads and severe cold. However, due to unfavorable conditions such as low solar radiation intensity and short daylight hours, the reliability of the heating supply primarily depends on the stable output of the wastewater-source heat pump, and there is still room for improvement in the contribution of the solar thermal collection system. In cold regions, the overall optimization effect was more pronounced. For Lanzhou, the heating supply increased from 317.66 to 337.64 MWh; for Beijing, it increased from 311.33 to 334.83 MWh. The heating assurance rates improved by 6.18% and 6.90%, respectively, and the DHW assurance rates increased by 12.70% and 12.90%. The COPsys values increased to 6.05 and 6.33, respectively. The optimized solar thermal system handles a greater share of the heating load, effectively reducing the operational burden on the heat pump units and significantly improving the overall energy efficiency of the system. This is due to the fact that solar radiation conditions in such regions are more favorable than in severely cold areas; the synergistic effect of the wastewater-source heat pump and the thermal storage tank can effectively reduce the required capacity of the heat pump units. In hot summer–cold winter regions, Chengdu and Shanghai showed increases in the heating supply of 8.92 and 6.90 MWh, respectively. The DHW assurance rates improved by 11.60% for both cities, while the COPsys values increased to 5.98 and 5.95, respectively. Although the total annual solar radiation is substantial, frequent overcast and rainy weather in winter results in insufficient radiation stability. After optimization, the contribution of solar energy exhibits seasonal fluctuations; when radiation is insufficient, the system must regulate the wastewater-source heat pump to ensure a rapid response and maintain heating stability. In such regions, where solar resources are limited or installation space is insufficient, introducing a wastewater-source heat pump as an auxiliary heat source could effectively enhance system stability and energy efficiency.
Figure 18.
(a) Comparison of system heat supply before and after optimization in different cities. (b) Comparison of heating guarantee rates before and after optimization in different cities. (c) Comparison of DHW heat supply before and after optimization in different cities. (d) Comparison of DHW guarantee rates before and after optimization in different cities. (e) Comparison of COPsys before and after optimization in different cities. (f) Optimization rates of various indicators before and after optimization in different cities.
The cross-climatic zone comparison illustrated in Figure 18 revealed significant regional differences in system optimization outcomes. As optimization algorithms inherently involve trade-offs among multiple objectives and cannot simultaneously achieve optimal performance across all metrics, system design must be closely tailored to regional climatic characteristics and energy demand profiles. The results show that Beijing achieved the most pronounced overall improvement, with COPsys increasing by 13.1% and energy savings reaching 37.95%, attributable to its balanced solar radiation conditions, suitable load patterns, and efficient multi-energy subsystem synergy. An economic analysis indicates that Chengdu performed best in terms of operating cost optimization owing to its time-of-use electricity tariff structure, followed by cities in severe cold regions. However, in terms of overall equipment capacity optimization, cold regions exhibited the most significant enhancement. The optimized system demonstrated better equipment matching and energy consumption performance in cold climates, indicating that the proposed SE-SSHP system holds considerable engineering applicability and energy-saving potential in such regions. Based on these findings, differentiated design strategies are recommended depending on climate zones: In cold regions, the synergistic advantages of “solar + wastewater-source heat pump + thermal storage” should be fully utilized, with optimal control strategies to achieve overall system efficiency. In hot summer and cold winter regions, where solar availability may be limited, wastewater-source heat pumps should serve as the primary auxiliary heat source, with operational modes adjusted according to seasonal load variations. In severe cold regions, the wastewater-source heat pump should play a dominant role, supplemented by solar thermal systems, and thermal storage capacity should be rationally designed to ensure stable and continuous system operation.
6. Analysis of Wastewater Heat Recovery
This section focuses on the calculation of the waste heat utilization rate and energy utilization efficiency of the bathing wastewater heat recovery system, followed by a comprehensive analysis of its overall benefits. Based on the concept of recovering wastewater heat using the heat pump technology, the system employs a dedicated heat recovery device to achieve efficient recovery and reutilization of waste heat.
The performance coefficient of the wastewater heat recovery system for bathing is defined as the ratio of the total system heating output to the total system power consumption. The total heating output comprises the heat recovered by the heat exchanger and the heating capacity of the heat pump, while the total power consumption includes the electricity consumed by the heat pump and the circulation pumps. This relationship is mathematically expressed as follows:
Here, COPWHR is the coefficient of performance of the shower waste heat recovery system; Qb is the heat transfer capacity of the waste heat recovery, kWh.
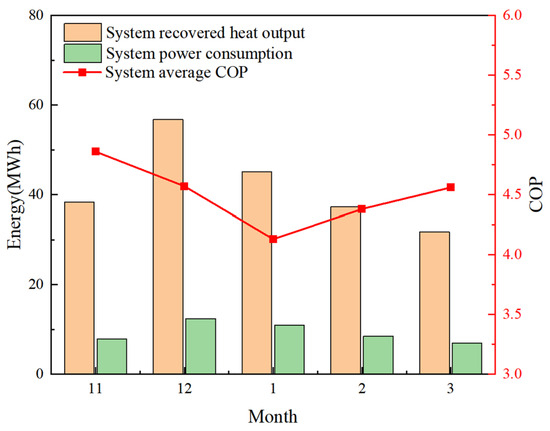
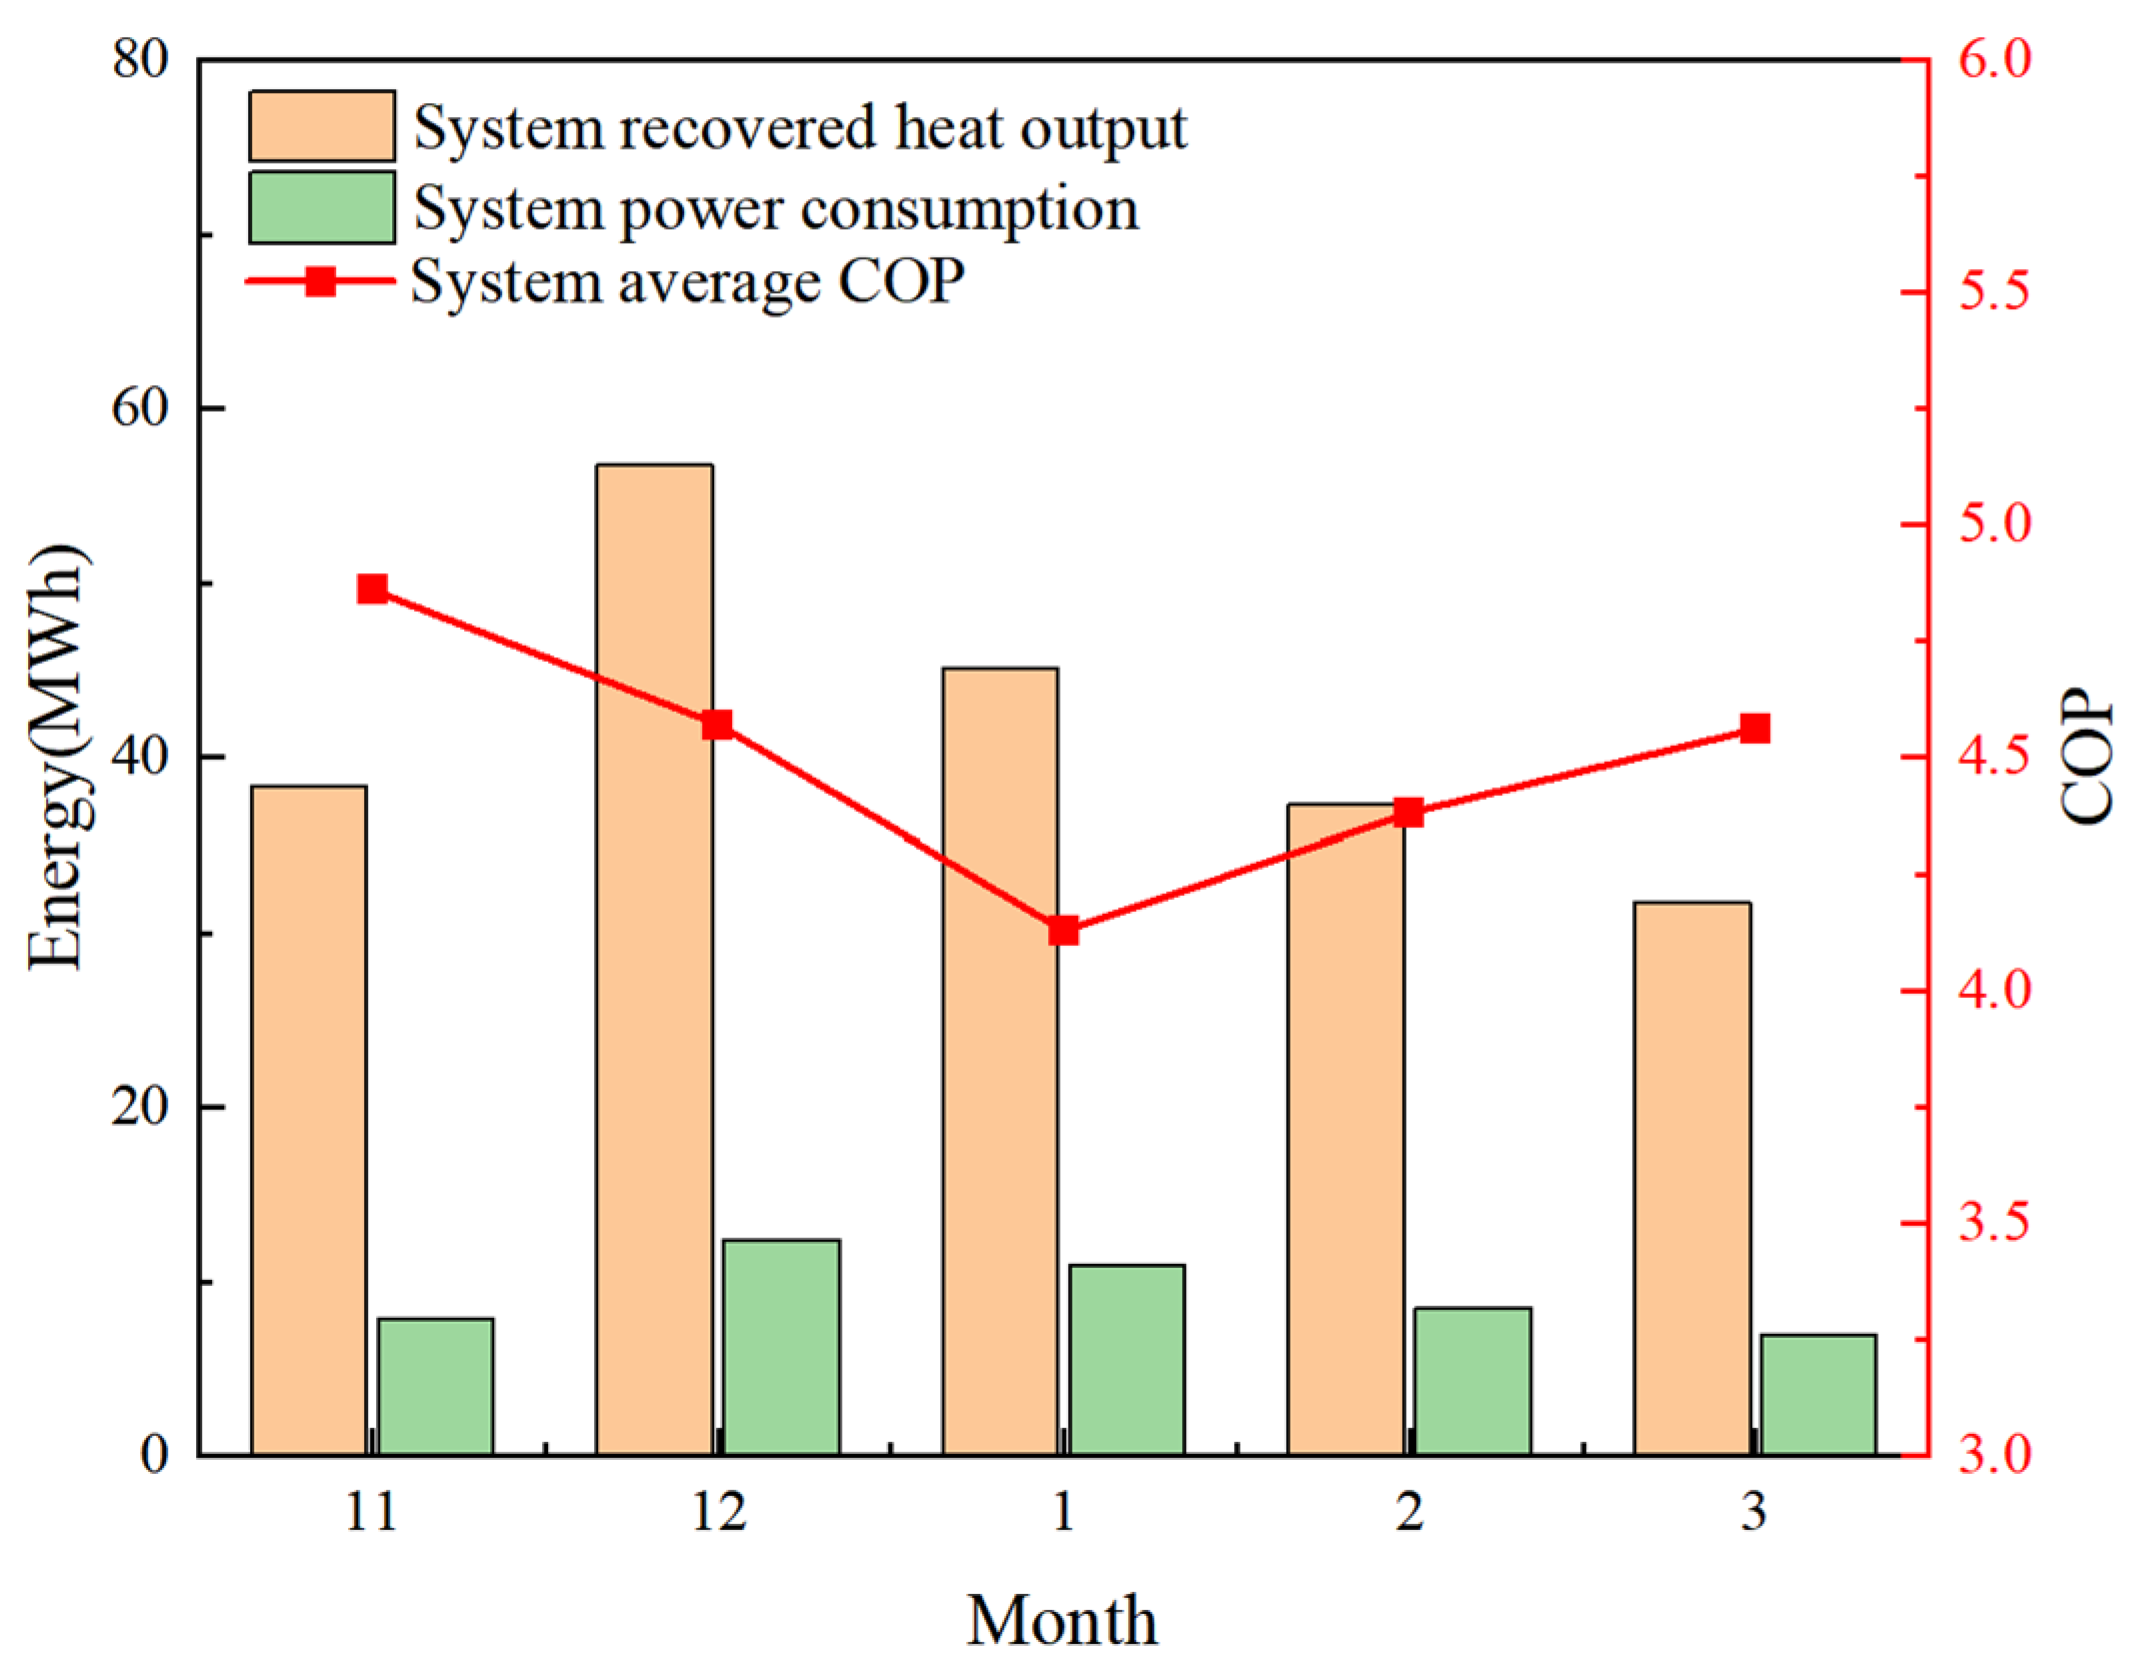
Figure 19 compares the monthly profiles of the heating output and the COPWHR for the shower waste heat recovery system during the heating season. As shown in the figure, the COPWHR during the heating season ranges from 4.13 to 4.86, demonstrating a stable overall performance. COPWHR reached its maximum value of 4.86 in November, while in January, it decreased to 4.13 due to lower outdoor temperature and higher heating demand. In terms of the heat recovery performance, the total heating output of the system peaked at 56.74 MWh in December and gradually decreased to 31.80 MWh in March, which was consistent with the seasonal variation in building hot water demand. The variation in power consumption showed a high degree of correlation with the heating output, reaching a maximum value of 12.42 MWh in December and decreasing to 6.97 MWh in March. This indicates that the system can dynamically adjust its operating state in response to load variations, exhibiting strong adaptability and operational efficiency. Over the heating season, the total recovered heat was 16.75 MWh, the heat pump heating output was 25.12 MWh, and the total power consumption was 9.35 MWh, resulting in an average COP of 4.5.
Figure 19.
Comparison of various indicators for different cities before and after optimization.
The analysis indicates that the system has a rational energy utilization structure, advanced technological integration, and notable energy-saving benefits. However, its economic feasibility requires further research and validation. By recovering wastewater heat for hot water supply in student dormitories, the sewage-source heat pump system can partially replace the electric auxiliary heating units, thereby significantly reducing the overall system energy consumption.
7. Conclusions
This study investigated the design and optimization of an integrated energy heating system for cold regions, taking a university dormitory building in China as a case study. A multiobjective optimization function based on the AHP–EMP weighting method was developed to balance economy, environmental performance, and energy efficiency. The optimization results of the HJ, PSO, and HJ–PSO algorithms were compared, and the adaptability of the hybrid algorithm across different climate zones was discussed with corresponding design recommendations. The main conclusions are as follows:
- (1)
- By integrating subjective AHP weights and objective EWM weights, the weights for economy, environmental performance, and energy efficiency were determined to be 42.24%, 25.48%, and 32.28%, respectively. The highest weight for the economy indicates that it remains a critical constraint in renewable energy heating systems.
- (2)
- Based on the climatic conditions of Lanzhou, the recommended optimized parameters were as follows: collector area of 1118.47 m2, tilt angle of 51°, azimuth angle of −4°; seasonal thermal storage tank volume of 1756 m3, and domestic hot water tank volume of 41.14 m3. This configuration can provide a scientific reference for similar projects in cold regions.
- (3)
- All three algorithms significantly improved system performance, with the HJ–PSO algorithm achieving the best results: economic saving rate of 24%, dynamic payback period shortened by 4–5 years, annual operating cost reduced by 39.08%, CO2 emissions reduced by 26.35%, system energy consumption lowered by 38.65%, heating and domestic hot water assurance rates consistently maintained above 94% and 90%, respectively, and average COPsys increased by 11.18%.
- (4)
- The optimization effectiveness of the SE-SSHP system varied across climate zones: cold regions achieved the best performance owing to balanced solar radiation and favorable load matching; in severe cold regions, emphasis must be placed on the dominant role of sewage-source heat pumps with appropriately sized thermal storage; in hot summer and cold winter regions, and sewage-source heat pumps should serve as an effective supplement to solar systems to achieve optimal energy efficiency across different climatic conditions.
Optimization results demonstrate that the optimal configuration of collector area, thermal storage tank volume, and heat pump capacity is achieved through dynamic device coupling and synergistic energy matching. Collector area selection must align solar resources with building thermal loads, maximizing non-heating season heat storage for direct heating in heating seasons to reduce energy consumption; tank volume optimization balances storage capacity and heat loss to ensure stable terminal temperature, while heat pump capacity coordinates with collector and tank characteristics to serve as primary heating during insufficient solar energy or peak loads. Throughout the heating season, the system prioritizes solar energy, thermal storage and waste heat recovery: early on, it relies on tank heat, mid-term uses tank return water for adequate supply, and late-term combines residual tank heat with shower waste heat, with optimized pump capacity avoiding idleness or shortages. The optimization algorithm also effectively provides optimal configurations for different climate zones. In cold regions, solar radiation is uniform and well-matched to thermal loads. Actual designs should prioritize ensuring a reasonable ratio between collector area and thermal storage tank volume, fully leveraging seasonal thermal storage’s capacity to transfer solar energy. Wastewater-source heat pumps should be positioned as auxiliary heat sources to maximize renewable energy substitution rates. In severely cold regions, the dominant role of sewage-source heat pumps should be reinforced by appropriately increasing their capacity and optimizing operating conditions. Simultaneously, we should shift the focus of thermal storage tank configuration from “long-term energy storage” to “short-term heat supplementation” to suppress daytime load fluctuations and withstand extreme low temperatures. In regions with hot summers and cold winters, where solar resources are abundant but winter heating loads are low, sewage-source heat pumps should serve as an effective supplement to solar systems. This approach accommodates load variations caused by fluctuations in solar radiation, establishing a flexible and adjustable coupled heating model.
Although this study reports certain improvements in the efficiency and reliability of multi-energy complementary systems, the conclusions are based on several idealized assumptions, such as neglecting the temperature dependence of fluid and soil thermal properties, simplifying the structural performance of the sewage pool, and disregarding water quality effects on the waste heat recovery subsystem. While these simplifications help to highlight the main factors and derive economically and energetically feasible solutions, they limit the accuracy of long-term system performance evaluation.
To enhance the engineering applicability and predictive reliability of the model, future research will focus on several aspects. First, by integrating operational data and dynamic thermal response tests with a Bayesian inversion method for uncertainty quantification, such work can achieve a closed-loop model calibration, enhancing its adaptability to diverse operating conditions. Second, to develop intelligent control strategies that incorporate load forecasting, weather variations, and energy policy, multi-time-scale collaborative optimization mechanisms can be established to address the dual challenges of renewable energy intermittency and uncertain user demand. Furthermore, dynamic and system-level collaborative optimization studies are required to reveal the temporal distribution characteristics of sewage waste heat under complex operating conditions and to construct scheduling models adapted to multi-energy complementary characteristics. Finally, integrating time-of-use electricity pricing and regional energy demand can facilitate multi-energy coupling strategies between sewage-source heat pumps and other low-grade heat sources, thereby improving integration efficiency and overall energy performance in building heating systems.
Author Contributions
Y.M.: Software, Investigation, Writing—Original Draft. Y.W. (Ye Wang): Methodology, Supervision, Writing—Review and Editing. Y.Z.: Data Curation. Y.W. (Yaqi Wen): Data Curation. Y.W. (Yagang Wang): Funding Acquisition, Writing—Review and Editing. All authors have read and agreed to the published version of the manuscript.
Funding
This work was supported by the National Natural Science Foundation of China (NSFC) [Grant Number 51476073], Gansu Provincial Key Laboratory of Solar Energy Utilization Open Project (GSKLSEU2025-ZD04), Gansu Province Natural Science Foundation (21JR7RA304, 24JRRA245), Gansu Province Higher Education Industry Support Plan Project (2023CYZC-38), and Fundamental Research Talent Selection Project of Lanzhou Jiaotong University (2022JC48).
Data Availability Statement
The data presented in this study are available on request from the corresponding author.
Conflicts of Interest
The authors declare no conflicts of interest.
Nomenclature
| SE-SSHP | Solar energy–sewage-source heat pump coupled system | C | Annual operating cost of the system, CNY |
| SSHP | Sewage-source heat pump | r | Loan interest rate or the internal rate of return specified by the relevant departmental standards, 5% |
| AHP | Analytic hierarchy process | E | Local electricity price, CNY/kWh |
| EMW | Entropy weight method | Fes | Penalty cost incurred by the system when the penalty function is triggered, CNY |
| HJ | Hooke–Jeeves algorithm | CEr | Replacement amount of conventional energy, kgce |
| PSO | Particle swarm optimization algorithm | i | Discount rate, 2.8% |
| SH | Seasonal heat storage | CEt | Total energy consumption of the traditional system, kgce |
| DHW | Domestic hot water | CEs | Total energy consumption of the system, kgce |
| COP | Coefficient of performance | QH | Cumulative heat load of the heating season, MJ |
| fsh | Heating supply guarantee ratio | q | calorific value of standard coal, 29.307 MJ/kgce |
| fdhw | DHW supply guarantee ratio | ηt | Operating efficiency of traditional energy as the heat source, 0.31 |
| ftotal | Overall system energy supply guarantee ratio | CO2 emission reduction, kg/year | |
| COPhp | Heat pump COP value | SO2 emission reduction, kg/year | |
| COPsys | System COP value | Dust emission reduction, kg/year | |
| Qs→SH | Heat supply from the SH tank to the building, kWh | Emission factors of CO2 of standard coal | |
| Qd→SH | Heat supply from the DHW tank to the building, kWh | Emission factors of SO2 of standard coal | |
| Qd→DHW | Heat supply from the DHW storage tank to domestic hot water, kWh | Emission factors of dust of standard coal | |
| Qhr | Heat recovery from bathing wastewater, kWh | Zconv | Annual value of the dynamic cost of the system before optimization, CNY |
| Qhp | Heat pump unit heat production, kWh | Zcchp | Annual value of the dynamic cost of the optimized system, CNY |
| Qhp→S | Total heat supply of the wastewater heat recovery system, kWh | EXconv | CO2 emissions of the system before optimization, % |
| Qaux | Auxiliary electric heating contribution, kWh | EXcchp | CO2 emissions of the system after optimization, % |
| QSH | Building heating load, kWh | PEC | Primary energy consumption, kWh |
| QDHW | DHW load, kWh | PECconv | Primary energy consumption of the heat source system before optimization, kWh; |
| Naux | Electricity consumption of the auxiliary electric heater, kWh | PECcchp | Primary energy consumption of the energy system after optimization, kWh |
| Nhp | Heat pump unit energy consumption, kWh | wi | Subjective weights |
| Nwp | the electricity consumption of the circulation pump, kWh | wj | Objective weights |
| Asolar | Collector area, m2 | β | Coefficients of subjective preference degrees |
| αs | Collector inclination, ° | γ | Coefficients of objective preference degrees |
| αa | Collector azimuth, ° | ηenvironmental | Values of environmental evaluation indicators |
| VDHW | DHW tank volume, m3 | ηenergy | Energy performance evaluation indicator values. |
| vSH | SH tank volume per unit collector area, m3/m2 | ηost | Economic evaluation indicator values; |
| CAPhp | Heating capacity of the SSHP, kWh | Zd | Annual value of the cost, CNY/year |
| Tp | Dynamic investment payback period, a | K | Total investment in equipment, CNY |
| It | Profit of the system in the t year of operation, million CNY | COPWHR | Shower waste heat recovery system COP |
| C0 | System initial investment, million CNY | OED | Orthogonal experimental design-based optimization |
References
- Wang, Y.; Ma, J.T.; Zhuang, P.Y.; Zhao, X.J.; Xiao, Q.X. Multi-objective optimization design of solar air collector with a frustum-shaped protrusion. Sol. Energy 2024, 267, 112121. [Google Scholar] [CrossRef] [Scilit]
- Yuan, M.; Thellufsen, J.Z.; Sorknæs, P.; Lund, H.; Liang, Y.T. District heating in 100% renewable energy systems: Combining industrial excess heat and heat pumps. Energy Convers. Manag. 2021, 244, 114527. [Google Scholar] [CrossRef] [Scilit]
- Huang, C.Y.; Wei, W.Z.; Sun, Y.Y.; Wang, W.; Li, Z.Y.; Wang, S.Q.; Deng, S.M. Energy saving and peak load shifting performance of tail water source heat pump integrated with large-scale thermal storage pool space heating system in technology park. Energy Convers. Manag. 2023, 287, 117032. [Google Scholar] [CrossRef] [Scilit]
- Wang, Y.; Chen, X.Q.; Qi, X.B. Numerical study on the effect of optimizing the Trombe wall structure with built-in fins on improving building energy efficiency in severe cold regions. Renew. Energy 2024, 222, 119856. [Google Scholar] [CrossRef] [Scilit]
- Lahlou, F.Z.; Mackey, H.R.; Al-Ansari, T. Role of wastewater in achieving carbon and water neutral agricultural production. J. Clean. Prod. 2022, 339, 130706. [Google Scholar] [CrossRef] [Scilit]
- Statista. Water and Wastewater Treatment Market Size Worldwide in 2020, with a Forecast to 2028 (in Billion U.S. Dollars). Available online: https://www.statista.com/statistics/1199744/market-size-water-and-wastewater-treatment-global/ (accessed on 1 March 2022).
- Araz, M.; Hepbasli, A.; Biyik, E.; Shahrestani, M.; Yao, R.; Essah, E.; Shao, L.; Oliveira, A.C.; Ekren, O.; Günerhan, H. Performance evaluation of a building integrated photovoltaic (BIPV) system combined with a wastewater source heat pump (WWSHP) system. Energy Procedia 2017, 11, 155. [Google Scholar] [CrossRef] [Scilit]
- Zhang, Q.L.; Fan, X.Q.; Zhang, W.J.; Wang, Z.M. Utilization potential and economic feasibility analysis of bathing sewage and its heat generated in colleges and universities. Energy Procedia 2017, 12, 513. [Google Scholar] [CrossRef] [Scilit]
- Ma, L.D.; Ren, T.X.; Zhang, T.J.; Zhao, T.Y.; Zhang, J.L. Experimental study on effect of operating parameters on performance of serially cascaded wastewater source heat pump. J. Build. Eng. 2020, 32, 101458. [Google Scholar] [CrossRef] [Scilit]
- Maddah, S.; Deymi-Dashtebayaz, M.; Maddah, O. 4E analysis of thermal recovery potential of industrial wastewater in heat pumps: An invisible energy resource from the iranian casting industry sector. J. Clean. Prod. 2020, 265, 121824. [Google Scholar] [CrossRef] [Scilit]
- Durdevic, D.; Balic, D.; Frankovic, B. Wastewater heat utilization through heat pumps: The case study of City of Rijeka. J. Clean. Prod. 2019, 231, 207–213. [Google Scholar] [CrossRef] [Scilit]
- Zhang, X.; Rhee, K.N.; Jung, G.J.; Kim, C. Exploring energy efficiency and savings potential of a horizontal domestic drain water heat recovery system in high-rise apartment buildings. Energy Build. 2024, 325, 115038. [Google Scholar] [CrossRef] [Scilit]
- Zhuang, Z.Y.; Zhao, J.; Mi, F.F.; Zhang, T.; Hao, Y.G.; Li, S.Y. Application and analysis of a heat pump system for building heating and cooling using extracting heat energy from untreated sewage. Buildings 2023, 13, 1342. [Google Scholar] [CrossRef] [Scilit]
- Brands, M.; Fung, A.S. Viability of large-scale wastewater-and ground-source distributed heat pump systems for cold-climate urban decarbonization: Case study of a proposed campus building. J. Build. Eng. 2025, 108, 112776. [Google Scholar] [CrossRef] [Scilit]
- Ordóñez, A.; Solís, I.; González, A.; Iglesias-Rodríguez, F.J.; Álvarez, R. Thermal use of urban wastewater: Some case studies. Energy Rep. 2025, 14, 5883–5892. [Google Scholar] [CrossRef] [Scilit]
- Murr, R.; Faraj, J.; El Hage, H.; Khaled, M. Using heat recovered from drain water and exhaust gases to enhance heat pump performance-Numerical study with economic and environmental insights. Int. J. Thermofluids 2025, 27, 101214. [Google Scholar] [CrossRef] [Scilit]
- Atmaca, İ.; Çağlar, A.; Soylu, S.K.; Evlice, F.; Özdemir, N. Comprehensive 4E assessment of wastewater-source heat pumps for domestic hot water in tourism facilities. J. Build. Eng. 2026, 121, 115652. [Google Scholar] [CrossRef] [Scilit]
- Ozcan, H.G.; Hepbasli, A.; Abusoglu, A.; Anvari-Moghaddam, A. Energy, exergy, economic, environmental and sustainability (4ES) analyses of a wastewater source heat pump system for district heating applications based on real operational data. Sustain. Energy Technol. Assess. 2023, 56, 103077. [Google Scholar] [CrossRef] [Scilit]
- Çiçek, A.; Sengör, I.; Erenoglu, A.K.; Erdinç, O. Decision making mechanism for a smart neighborhood fed by multi-energy systems considering demand response. Energy 2020, 208, 118323. [Google Scholar] [CrossRef] [Scilit]
- Guo, Z.Q.; Wang, J.J.; Dong, F.X.; Xu, H.W. Multi-objective optimization of multi-energy complementary system based on cascade utilization of heat storage. Energy Convers. Manag. 2024, 299, 117864. [Google Scholar] [CrossRef] [Scilit]
- Sun, Z.P. Optimization design of multi-energy complementary system in northern rural areas based on TRNSYS. Energy Sav. Technol. 2021, 39, 173–177. [Google Scholar]
- Wang, Q.L.; Zhou, E.Z.; Tu, L.J.; Guo, J.X.; Ding, X.F.; Yang, Q. Optimization of multi-source complementary heating system based on solar heating. J. Sol. Energy 2021, 42, 178–185. [Google Scholar]
- Wang, Z.G.; Chen, H.Y.; Sun, X.; Lu, H.B.; Wang, T.Y. Optimizing the solar-air hybrid source heat pump heating system based on the particle swarm algorithm. Energy Rep. 2022, 8, 379–393. [Google Scholar] [CrossRef] [Scilit]
- Zhang, T.H.; Wang, F.X.; Gao, Y.; Liu, Y.J.; Guo, Q.; Zhao, Q.X. Optimization of a solar-air source heat pump system in the high-cold and high-altitude area of China. Energy 2023, 268, 126653. [Google Scholar] [CrossRef] [Scilit]
- Li, J.; Xu, W.; Feng, X.M.; Qiao, B.; Xing, L.; Liu, C.; Xue, H.Y. Optimal allocation method of multi-energy system based on hybrid optimization algorithm. Energy Rep. 2023, 9, 1415–1423. [Google Scholar] [CrossRef] [Scilit]
- Gao, M.Z.; Li, X.C.; Zhang, G.C.; Zhang, Q.; Mu, G.; Zhang, H.B.; Zhang, D.G. Research on the matching relationship of multi-energy collaborative temperature control in factory farming system based on TRNSYS. Therm. Sci. Eng. Prog. 2024, 53, 102700. [Google Scholar] [CrossRef] [Scilit]
- Shi, B.Q.; Li, Y.C.; Lu, J.; Kong, X.F.; Wang, Q.W.; Li, Y. Short- and long-term heating performances and optimization of solar heating coupled with groundwater source heat pump (SH-GWSHP) system for 24-h running buildings in Tibetan Plateau, China. Appl. Therm. Eng. 2024, 243, 122609. [Google Scholar] [CrossRef] [Scilit]
- Ding, Y.X.; Li, Y.C.; Ding, C.; Guo, X.W.; Zhang, J.X. Multi-objective optimization study of coupled solar-biomass heating system for northern farmhouses based on FAHP-HJ methodology. Energy 2025, 332, 137164. [Google Scholar] [CrossRef] [Scilit]
- Wang, Y.; Zhou, J.; Ma, Y.O.; Zhao, Y.N. Multi-objective optimization and operation characteristics analysis of multi-energy complementary heating systems in cold regions. Therm. Sci. Eng. Prog. 2025, 65, 103897. [Google Scholar] [CrossRef] [Scilit]
- GB/T 50176-2016; Thermal Design Code for Civil Buildings. Ministry of Housing and Urban-Rural Development of the People’s Republic of China: Beijing, China; China Architecture & Building Press: Beijing, China, 2016.
- Univ. of W.-M. Solar Energy Laboratory. Trnsys 18; Solar Energy Laboratory, Univ. of Wisconsin-Madison: Madison, WI, USA, 2018. [Google Scholar]
- Lu, Y.Q. Practical Handbook of Heating and Air-Conditioning Design, 2nd ed.; China Architecture & Building Press: Beijing, China, 1993. [Google Scholar]
- GB/T 50015-2019; Standard for Design of Building Water Supply and Drainage. Ministry of Housing and Urban-Rural Development of the People’s Republic of China: Beijing, China; China Planning Press: Beijing, China, 2019.
- Wang, S.M. Simulation and Optimization of Solar Seasonal Thermal Storage Heating System. Master’s Thesis, Southeast University, Nanjing, China, 2022. [Google Scholar]
- Beausoleil-Morrison, I.; Kemery, B.; Wills, A.D.; Meister, C. Design and simulated performance of a solar-thermal system employing seasonal storage for providing the majority of space heating and domestic hot water heating needs to a single-family house in a cold climate. Sol. Energy 2019, 191, 57–69. [Google Scholar] [CrossRef] [Scilit]
- Wang, Y.J. Study on the Applicability of Wind Power Storage System Application Scenarios Based on AHP–EWM. Master’s Thesis, Shenyang University of Technology, Shenyang, China, 2024. [Google Scholar]
- Lu, J. Technologies and Applications of Multi-Energy Complementary Building Energy Systems, 3rd ed.; Science Press: Beijing, China, 2021. [Google Scholar]
- Gong, X.M. Application and Optimization of Solar Water Heating and Ground Source Heat Pump Technology in Building Energy Conservation; China Electric Power Press: Beijing, China, 2018. [Google Scholar]
- Esrafilian, M.; Ahmadi, R. Energy, environmental and economic assessment of a polygeneration system of local desalination and CCHP. Desalination 2019, 454, 20–37. [Google Scholar] [CrossRef] [Scilit]
- GB 50352-2019; Unified Standard for Civil Building Design. Ministry of Housing and Urban-Rural Development of the People’s Republic of China: Beijing, China; China Construction Industry Press: Beijing, China, 2019.

Disclaimer/Publisher’s Note: The statements, opinions and data contained in all publications are solely those of the individual author(s) and contributor(s) and not of MDPI and/or the editor(s). MDPI and/or the editor(s) disclaim responsibility for any injury to people or property resulting from any ideas, methods, instructions or products referred to in the content. |
© 2026 by the authors. Licensee MDPI, Basel, Switzerland. This article is an open access article distributed under the terms and conditions of the Creative Commons Attribution (CC BY) license.