


Abstract
This study aims to determine the current seismic resistance of two masonry minarets that were severely damaged during the 6 February 2023 Kahramanmaraş earthquakes, while also evaluating whether a model-updating approach based on experimental dynamic characteristics can reliably capture the actual seismic behavior and collapse mechanism of such structures under real earthquake conditions. The dynamic characteristics of the minarets were identified using Operational Modal Analysis (OMA) based on previous in-situ vibration measurements. These characteristics were used to calibrate finite element models through a model-updating process employing Multi-Criteria Decision-Making (MCDM) methods. The initial modal analyses revealed discrepancies of up to 13.7% in natural frequencies and 9.7% in mode shapes. After applying MCDM methods to a wide set of model variants, these differences were reduced to 2.0% and 9.2%, respectively, improving the agreement between numerical and experimental results. Once the most representative models were obtained, nonlinear seismic analyses were performed using actual ground motion records from the earthquake. The results included evaluations of peak displacements, base shear forces, and principal stresses. The concentration of principal stresses near the transition zone showed good qualitative agreement with the observed collapse locations, indicating a reasonable consistency between numerical results and observed damage patterns. These findings demonstrate the value of integrating OMA-based model updating with MCDM methods and support a data-driven framework for assessing the seismic performance of historical masonry structures.
1. Introduction
In the geographies where humanity resides, buildings can serve as both a shelter and a place for various functions and activities, reflecting the cultural identity, history, and social fabric of the people. However, in the face of natural events like disasters, these buildings must ensure the safety of people and safeguard material and moral values. In this context, the resilience of structures against natural disasters constitutes a critical research area for structural engineering studies.
Earthquakes are natural disasters that can significantly affect structural performance, making them a critical factor for engineers during the design phase. In fact, earthquakes can be considered real-life tests conducted in the Earth’s laboratory, challenging the durability and safety standards of structures. These tests, which occur as sudden and intense tremors, may cause structural collapse, resulting in serious loss of life and property. To mitigate such losses, buildings are expected to meet various performance levels, as defined by seismic regulations. The Turkey Building Earthquake Code (TBEC-2018) outlines four distinct building performance levels [1]:
- Continuous Use Performance Level: This performance level corresponds to the situation where structural damage to the building structural system elements does not occur or the damage remains negligible.
- Limited Damage Performance Level: This performance level denotes the point at which the building structural system elements sustain limited damage, thereby limiting the nonlinear behavior.
- Controlled Damage Performance Level: This performance level corresponds to a level of damage that is not very severe and mostly repairable in order to ensure life safety.
- Collapse Prevention Performance Level: This performance level corresponds to the pre-collapse conditions in which severe damage to the structural elements of the building occurs. This performance level prevents either partial or total collapse of the building.
A detailed review of numerous factors, including design, geometry, floor plan layout, positioning of the structural system and structural elements, construction process, soil effect, proximity to active faults, material selection, and environmental conditions, determines the performance of the structures according to the performance levels given above.
Researchers frequently conduct field studies [2,3,4,5] to determine the behavior of structures under earthquake effects. Researchers [6,7,8,9,10,11,12,13] also conduct numerical analysis studies to predict the behavior of structures during potential earthquakes. Realism in the finite element models of the structures allows for more realistic results from these numerical studies. Establishing the most appropriate finite element model geometry of the structure or reflecting the existing material properties of the structure into the finite element model can enhance the realism of finite element models. This issue is a separate research topic and requires extensive experimental studies [14]. The operational modal analysis method is currently being studied to establish the most appropriate finite element model of the structures [15,16,17]. Operational modal analysis tests provide the dynamic characteristics of the structure. These characteristics serve as crucial data, providing insight into the current state of the structure. In the light of the experimentally obtained dynamic characteristics, model updating can be performed for the finite element model of the structure [18]. It is very important to perform various analyses after model updating in order to obtain more realistic results. Researchers use various methods during the model-updating process. One of the most frequently used methods by researchers is manual update. In this study, the Multi-Criteria Decision-Making (MCDM) method has been applied for the first time in the model-updating process. The application of these methods constitutes one of the most original aspects of the study. This approach is commonly utilized in diverse areas of civil engineering for evaluating and choosing between alternatives [19,20,21,22,23,24]. In this way, the user factor has been disabled during the modal analysis update, and the selection has been made automatically based on the previously established criteria.
In the scope of this paper, operational modal analysis tests of a masonry minaret were carried out. The finite element model created for the minaret was updated using various MCDM methods in the light of the results (dynamic characteristics) obtained from the experimental tests. Nonlinear earthquake analyses were performed for the updated finite element model. The main objective of this study is to evaluate whether the model updating approach can accurately represent the actual seismic behavior and collapse mechanism of the structure. Recent studies have emphasized the role of model updating techniques in reducing uncertainties in finite element models and improving the agreement between numerical predictions and experimental observations [7,8]. Various optimization-based and objective-function-oriented approaches have been proposed in the literature; however, these studies are generally limited to controlled conditions or simplified structural systems, and direct validation of updated models against real earthquake-induced damage remains scarce.
The study includes several distinctive aspects that differentiate it from previous research. The first and perhaps the most interesting of these is the collapse of the masonry minaret, which is the subject of the study and for which operational modal analysis tests were conducted prior to the 6 February 2023 earthquakes (first shock, Mw = 7.7). Therefore, the dynamic characteristics used in the model-updating process represent the actual pre-damage condition of the structure. Numerous studies focus on conducting earthquake analyses for updated finite element models, as previously mentioned. However, it is almost impossible to know how accurate the numerical analysis results are. Vibrating a real structure under a real earthquake acceleration record is a costly and challenging process that poses significant risks to building safety. However, applying a real earthquake acceleration record to a model-updated finite element model highlights the importance and effectiveness of the updating process. Another distinguishing feature of this study is the application of various MCDM methods during the model updating phase. The adoption of MCDM methods in this study stems from inherent challenges in traditional model updating approaches. Conventional methods, particularly manual updating, rely heavily on the engineer’s experience, rendering the process subjective, time-consuming, and difficult to replicate. This approach typically terminates upon finding a satisfactory solution rather than systematically searching for an optimal one. Finite element model updating is fundamentally a multi-objective problem. The objective is to simultaneously minimize error across multiple dynamic characteristics, such as multiple natural frequencies and their corresponding mode shapes. These criteria are often conflicting; improving accuracy for one mode may compromise accuracy for another. MCDM methods are uniquely suited to address these limitations. Rather than combining multiple objectives into a single function that may be potentially biased, MCDM provides a structured and transparent framework for evaluating candidate models simultaneously against these conflicting criteria. This study leverages various MCDM techniques to systematically rank a broad set of potential models. This approach eliminates the subjectivity of manual calibration and directly addresses the multi-objective nature of the problem, enabling the identification of the model that represents the best possible compromise across all measured dynamic properties. Consequently, MCDM offers a more robust, objective, and defensible methodology for selecting the most accurate model parameters, which is critical for reliable seismic analysis. Studies in the literature generally prefer the manual-update process for model updating. Using the Technique for Order Preference by Similarity to Ideal Solution (TOPSIS), Multi-Attributive Border Approximation Area Comparison (MABAC), Vikriterijumsko KOmpromisno Rangiranje (VIKOR), and Preference Ranking on the Basis of Ideal–Average Distance (PROBID) methods, a large number of modal analyses were performed for the masonry minaret and the data obtained were evaluated. This evaluation provided model parameters that closely matched the experimentally determined dynamic characteristics. Thus, the study presents an approach that differs from those in the existing literature. Another difference in this study is that it uses the acceleration records from the 6 February 2023 earthquake for nonlinear analyses. Studies in the literature typically use earthquakes that occur close to the selected structure or those with large acceleration amplitudes. The obtained results are the outcome of analyses conducted using the applied acceleration record. These results merely provide insight into the potential damage or stress increases in the selected structure during a potential earthquake. However, it is almost impossible to know how the selected structure will behave in a possible earthquake. This study, in contrast to others, analyses the performance of a masonry minaret during an earthquake. In other words, it examines whether model updating can accurately capture the actual earthquake performance of the masonry minaret. In this way, the accuracy of the earthquake performance of the structures following model updating can be determined. This study used data from station 8003 in Osmaniye for the nonlinear analyses of the masonry minaret during the first shock of the 6 February 2023 earthquakes (Mw = 7.7). The location of station 8003 is 1.52 km from the masonry minaret. Accordingly, the applied acceleration record can be considered representative of the ground motion experienced by the structure.
The main contributions of this study can be summarized as follows: (i) the use of operational modal analysis data obtained prior to the earthquake to represent the undamaged state of the structure, (ii) the integration of multi-criteria decision-making methods into the model-updating process to systematically evaluate alternative models, and (iii) the assessment of the seismic performance of a masonry minaret using real earthquake ground motion records, enabling a direct comparison between numerical results and observed damage patterns.
2. Multi-Criteria Decision-Making Methods (MCDM)
In this study, the model-updating problem is formulated as a multi-criteria decision-making (MCDM) problem in which each finite element model represents an alternative, and the comparison between numerical and experimental results defines the evaluation criteria. The criteria used in the evaluation process include the relative differences between the experimentally obtained and numerically calculated natural frequencies, as well as the Modal Assurance Criterion (MAC) values corresponding to the identified mode shapes. For each alternative model, frequency errors were calculated for the first four modes, and the corresponding MAC values were obtained. These parameters were used to construct the decision matrix. In this matrix, frequency differences were treated as cost-type criteria (to be minimized), whereas MAC values were considered benefit-type criteria (to be maximized). All criteria were normalized using standard normalization procedures specific to each MCDM method. The weighting scheme was determined based on engineering judgment, considering the relative reliability of the dynamic characteristics, where natural frequencies were assigned higher weights due to their lower sensitivity to measurement noise compared to mode shapes. Equal weighting was assigned to all criteria in order to avoid introducing subjective bias into the model-updating process. Subsequently, the TOPSIS, MABAC, VIKOR, and PROBID methods were applied independently to rank the alternative models. The optimal model was selected based on the ranking results obtained from these methods, ensuring that the selected model provides the best compromise between minimizing frequency errors and maximizing modal correlation with the experimental results.
Effective decision-making is essential for success across various industries, particularly in construction, where a substantial amount of information needs to be managed. Construction processes and procedures encompass numerous tasks, processes, and requirements, each involving a diverse range of factors and considerations. Consequently, decision-making in these contexts can be both complex and labor-intensive. Therefore, it is important to establish a framework that can effectively characterize such intricate scenarios. Multi-Criteria Decision-Making (MCDM) methods have emerged as a significant branch of operations research designed to tackle these challenges [25,26]. MCDM pertains to the process of making decisions when faced with multiple, often conflicting criteria. This approach involves evaluating real-world situations under specific conditions, utilizing both qualitative and quantitative criteria to identify the most suitable alternative or solution [27]. In MCDM, decision-makers start by identifying all viable alternatives for addressing a problem. To determine the most suitable option, it is essential to assign weights to the criteria, with more critical factors receiving greater importance. In this study, the criteria weights were determined by the decision-maker.
After establishing these weights, decision-makers evaluate the available alternatives. Ultimately, the best option is selected through calculations assisted by computer software [25,27]. There are various methods for MCDM when performing these calculations. This study aims to determine the optimal parameters by employing well-established and commonly used MCDM methods, including the Technique for Order Preference by Similarity to Ideal Solution (TOPSIS) [24,28,29,30], Multi-Attributive Border Approximation Area Comparison (MABAC) [31,32,33], VIšekriterijumsko KOmpromisno Rangiranje (VIKOR) [34,35,36] and Preference Ranking on the Basis of Ideal–Average Distance (PROBID) [24,37]. These methods were implemented using the Python programming language.
2.1. The TOPSIS Method
The TOPSIS method is based on the principle of ranking alternatives by their closeness to the positive ideal solution and their distance from the negative ideal solution. The positive ideal solution consists of the maximum values for all criteria, while the negative ideal solution consists of the minimum values for those same criteria [38]. The TOPSIS method is applied by following these steps [39]:
- Creation of the decision matrix: The decision matrix is a table that displays the performance of various alternatives based on specific criteria. Each row in the matrix corresponds to an alternative, while each column represents a criterion.
- Normalization: The decision matrix is adjusted so that all criteria have equal importance. This adjustment is calculated using Equation (1).where xij is the salience level of stakeholder i based on attribute j, rij is the normalized value of the salience level of stakeholder i based on attribute j.
- Weighting: The significance of each criterion will be established by the decision-makers using the binary decision matrix.
- Creation of the Weighted Normalized Matrix: The normalized matrix is multiplied by the weights assigned by the decision-makers, following Equation (2), to create the weighted normalized matrix.where wj is the objective weight of attributes and vij is the value of the salience level of stakeholder i based on the weighted normalized attribute j.
- Identifying positive and negative ideal solutions involves determining the maximum and minimum values of the criteria. The positive ideal solution reflects the highest values, while the negative ideal solution reflects the lowest values. The calculations for these solutions are based on the following Equations (3) and (4).where J and J′ represent the set of benefit and cost attributes respectively. The higher the benefit attribute, the better, and the lower the cost attribute, the better. is the positive ideal solution, and is the negative ideal solution.
- Ranking of alternatives: The best alternative is identified by ranking all options based on their closeness to the ideal solution. This is done by calculating the Euclidean distances to both the positive ideal solution and the negative ideal solution, as outlined in Equations (5)–(7).
2.2. The MABAC Method
The MABAC model, originally introduced by Pamucar and Cirovic in 2015 [22], calculates the distance between each alternative and the Boundary Approximation Area (BAA). This model offers several beneficial features: (1) the results obtained from the MABAC method are stable; (2) the computational equations are straightforward; (3) it accounts for the hidden values of gains and losses; and (4) it can be combined with other methods. Consequently, the MABAC method serves as an excellent tool for achieving reasonable decision-making outcomes [22].
MABAC evaluates decision alternatives through a systematic process that includes the following steps:
- A decision matrix of size n by m is first defined, where n represents the number of alternatives and m denotes the number of criteria (Equation (8)).
- The second step involves normalizing the decision matrix using Equation (9), which represents both benefit and cost criteria.
- A weighted matrix is created using values from the normalized matrix according to Equation (10).
- Determination of the BAA matrix. The BAA for all criteria can be determined using the Equation (11) below.
- Equation (12) calculates the distances of alternatives from the BAA for matrix elements (Q).
- The inclusion of a given alternative A in the BAA (G, G+ or G−) is determined according to Equation (13).
- As a final step, the alternatives are ranked according to the sum of their distances to the areas approaching the boundaries (Equation (14)).
2.3. The VIKOR Method
The VIKOR method utilizes a consensus mechanism to evaluate alternatives by measuring their distance from the ideal solution. The VIKOR method was originally developed by Serafim Opricovic to tackle decision-making challenges involving conflicting and irreconcilable criteria from various entities. This methodology assumes that a compromise is acceptable for resolving such conflicts and aims to help the decision-maker identify a solution that closely aligns with the ideal outcome. The alternatives are evaluated according to all specified criteria, allowing VIKOR to rank them and determine the closest ideal compromise [40]. VIKOR evaluates decision alternatives through a systematic process that includes the following steps [41]:
- The initial step involves identifying the best value and the worst value for a specific criterion function. Equation (15) is to be applied to utility criteria.
- In the case of cost criteria, the following, Equation (16), is used.
- The and values are then calculated according to Equations (17) and (18) below.
- The Qi value is calculated according to Equation (19).where , , , , and stands for the weight adopted for the “most criteria” strategy.
- In the next step, the alternatives S, R, and Q are ranked in ascending order, resulting in three separate ranked lists.
- Finally, a compromise solution is proposed by taking into account both the advantages and acceptable stability conditions derived from the three rankings obtained in the previous step. The best alternative is identified as the one with the lowest value in the leading position of the Q ranking.
2.4. The PROBID Method
PROBID, which stands for Preference Ranking Based on Ideal–Average Distance, is a Multi-Criteria Decision-Making method. This approach evaluates alternative performances for each criterion by measuring their distance from the ideal and average values. Initially, it is assumed that a set of non-dominated optimal solutions are formulating the equation and solving the relevant multi-objective optimization (MOO) problem. The next step is to construct a decision matrix. Following this, the objectives are normalized using one of several techniques, such as vector normalization, sum normalization, max–min normalization, or max normalization. Subsequently, the weights for each objective are either provided by the decision-makers or determined using one of the available weighting methods. Ultimately, the optimal solutions are ranked, and the highest-ranked solution is selected [24]. PROBID evaluates decision alternatives through a systematic process that includes the following steps [24]:
- First, a decision matrix is created.
- Next, the decision matrix is normalized using vector methods.
- Finally, a normalized weighted decision matrix is generated.
- The weighted decision matrix is normalized according to Equation (20) and sorted by criteria, considering their type. This process creates a matrix of successive positive ideal solutions.where , is the set of benefit criteria, and is the set of cost criteria.
- The average value for each objective column is calculated using Equation (21).
- The average solution is calculated according to Equation (22).
- In the next step, the Euclidean distance of each solution to each of the m ideal solutions, as well as the average solution, is calculated iteratively. The distance to the ideal solutions is computed using Equation (23):
- The overall distances to the positive and negative ideals are calculated using Equations (24) and (25).
- In the final step, the positive-ideal and negative-ideal ratio (R), followed by the performance score (Pi) for each solution, are calculated, as outlined in Equation (26).
3. Numerical Application
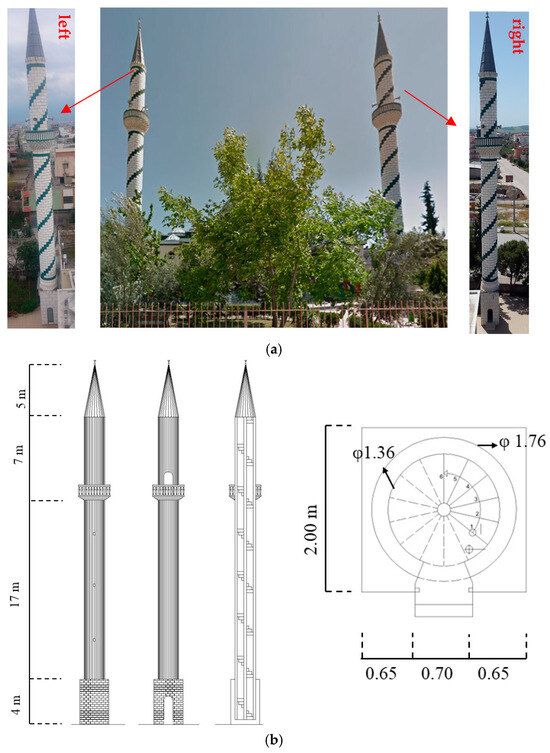
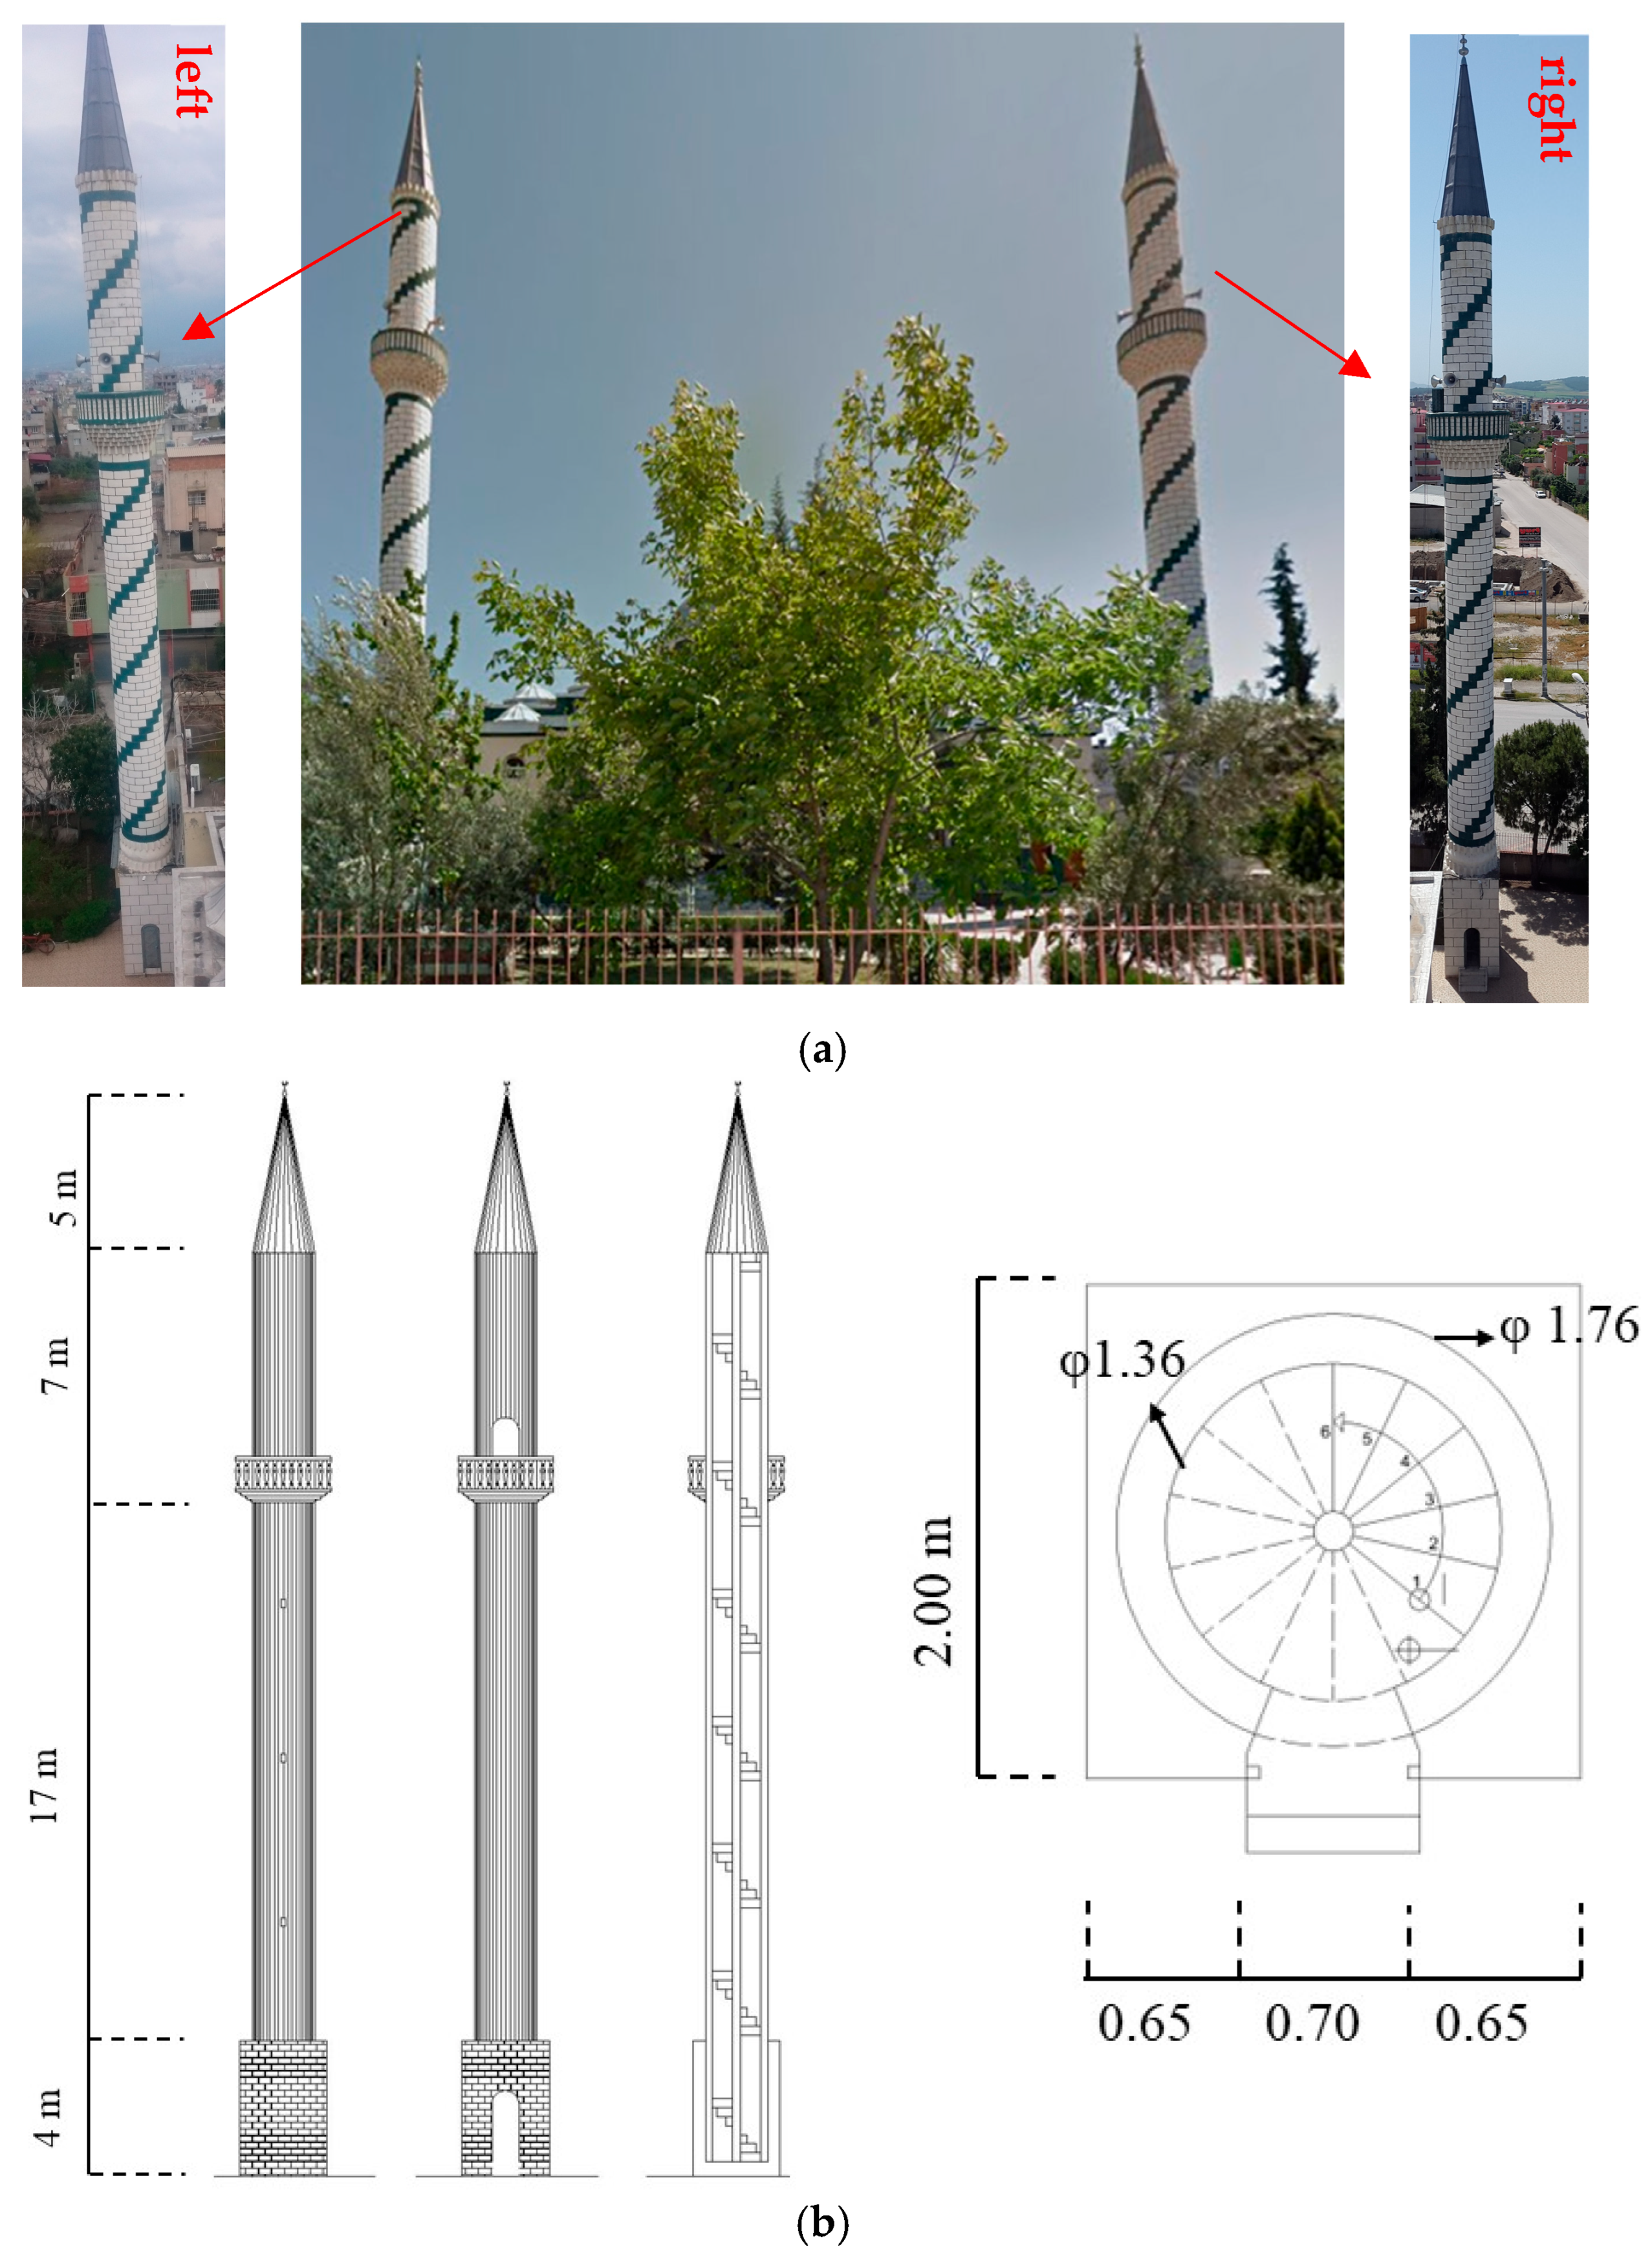
The minaret subject to the study belongs to the Imam-ı Azam mosque in Osmaniye (Turkey) (latitude: 37.0852° and longitude: 36.2548°). Built in the 1900s, the mosque features two minarets. These two minarets have a masonry structural system. The minarets, built independently from the mosque, share all geometrical features. These minarets consist of a pulpit, transition zone, cylindrical body, balcony, upper part of the minaret, spire, and end ornament sections. The pulpit section of the minaret is square, while the transition zone, cylindrical body, and upper part are cylindrical, and the spire is cone-shaped. The minarets feature a single balcony, and this section is decorated with muqarnas. The height of the minarets is 33 m. Figure 1 presents various images of the minarets taken before the 6 February 2023 earthquakes, along with the geometric features of the minarets.
Figure 1.
(a) General view of the minaret and (b) architectural drawings of the minaret, including elevation views and the plan view of the structure.
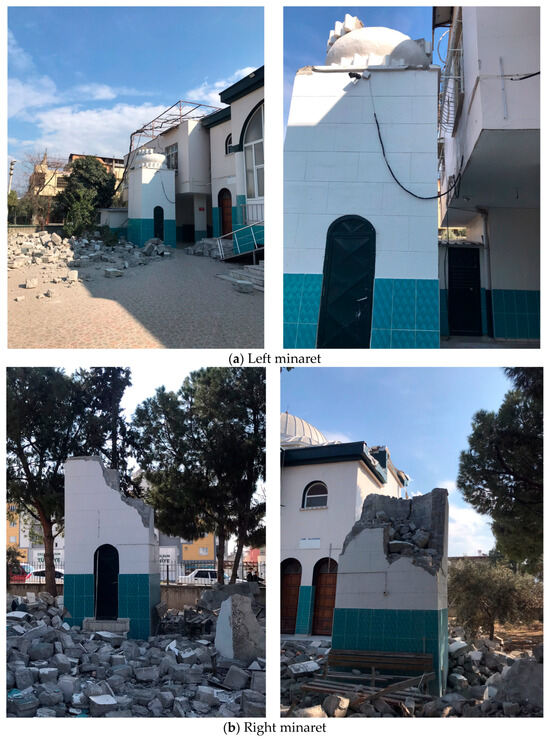
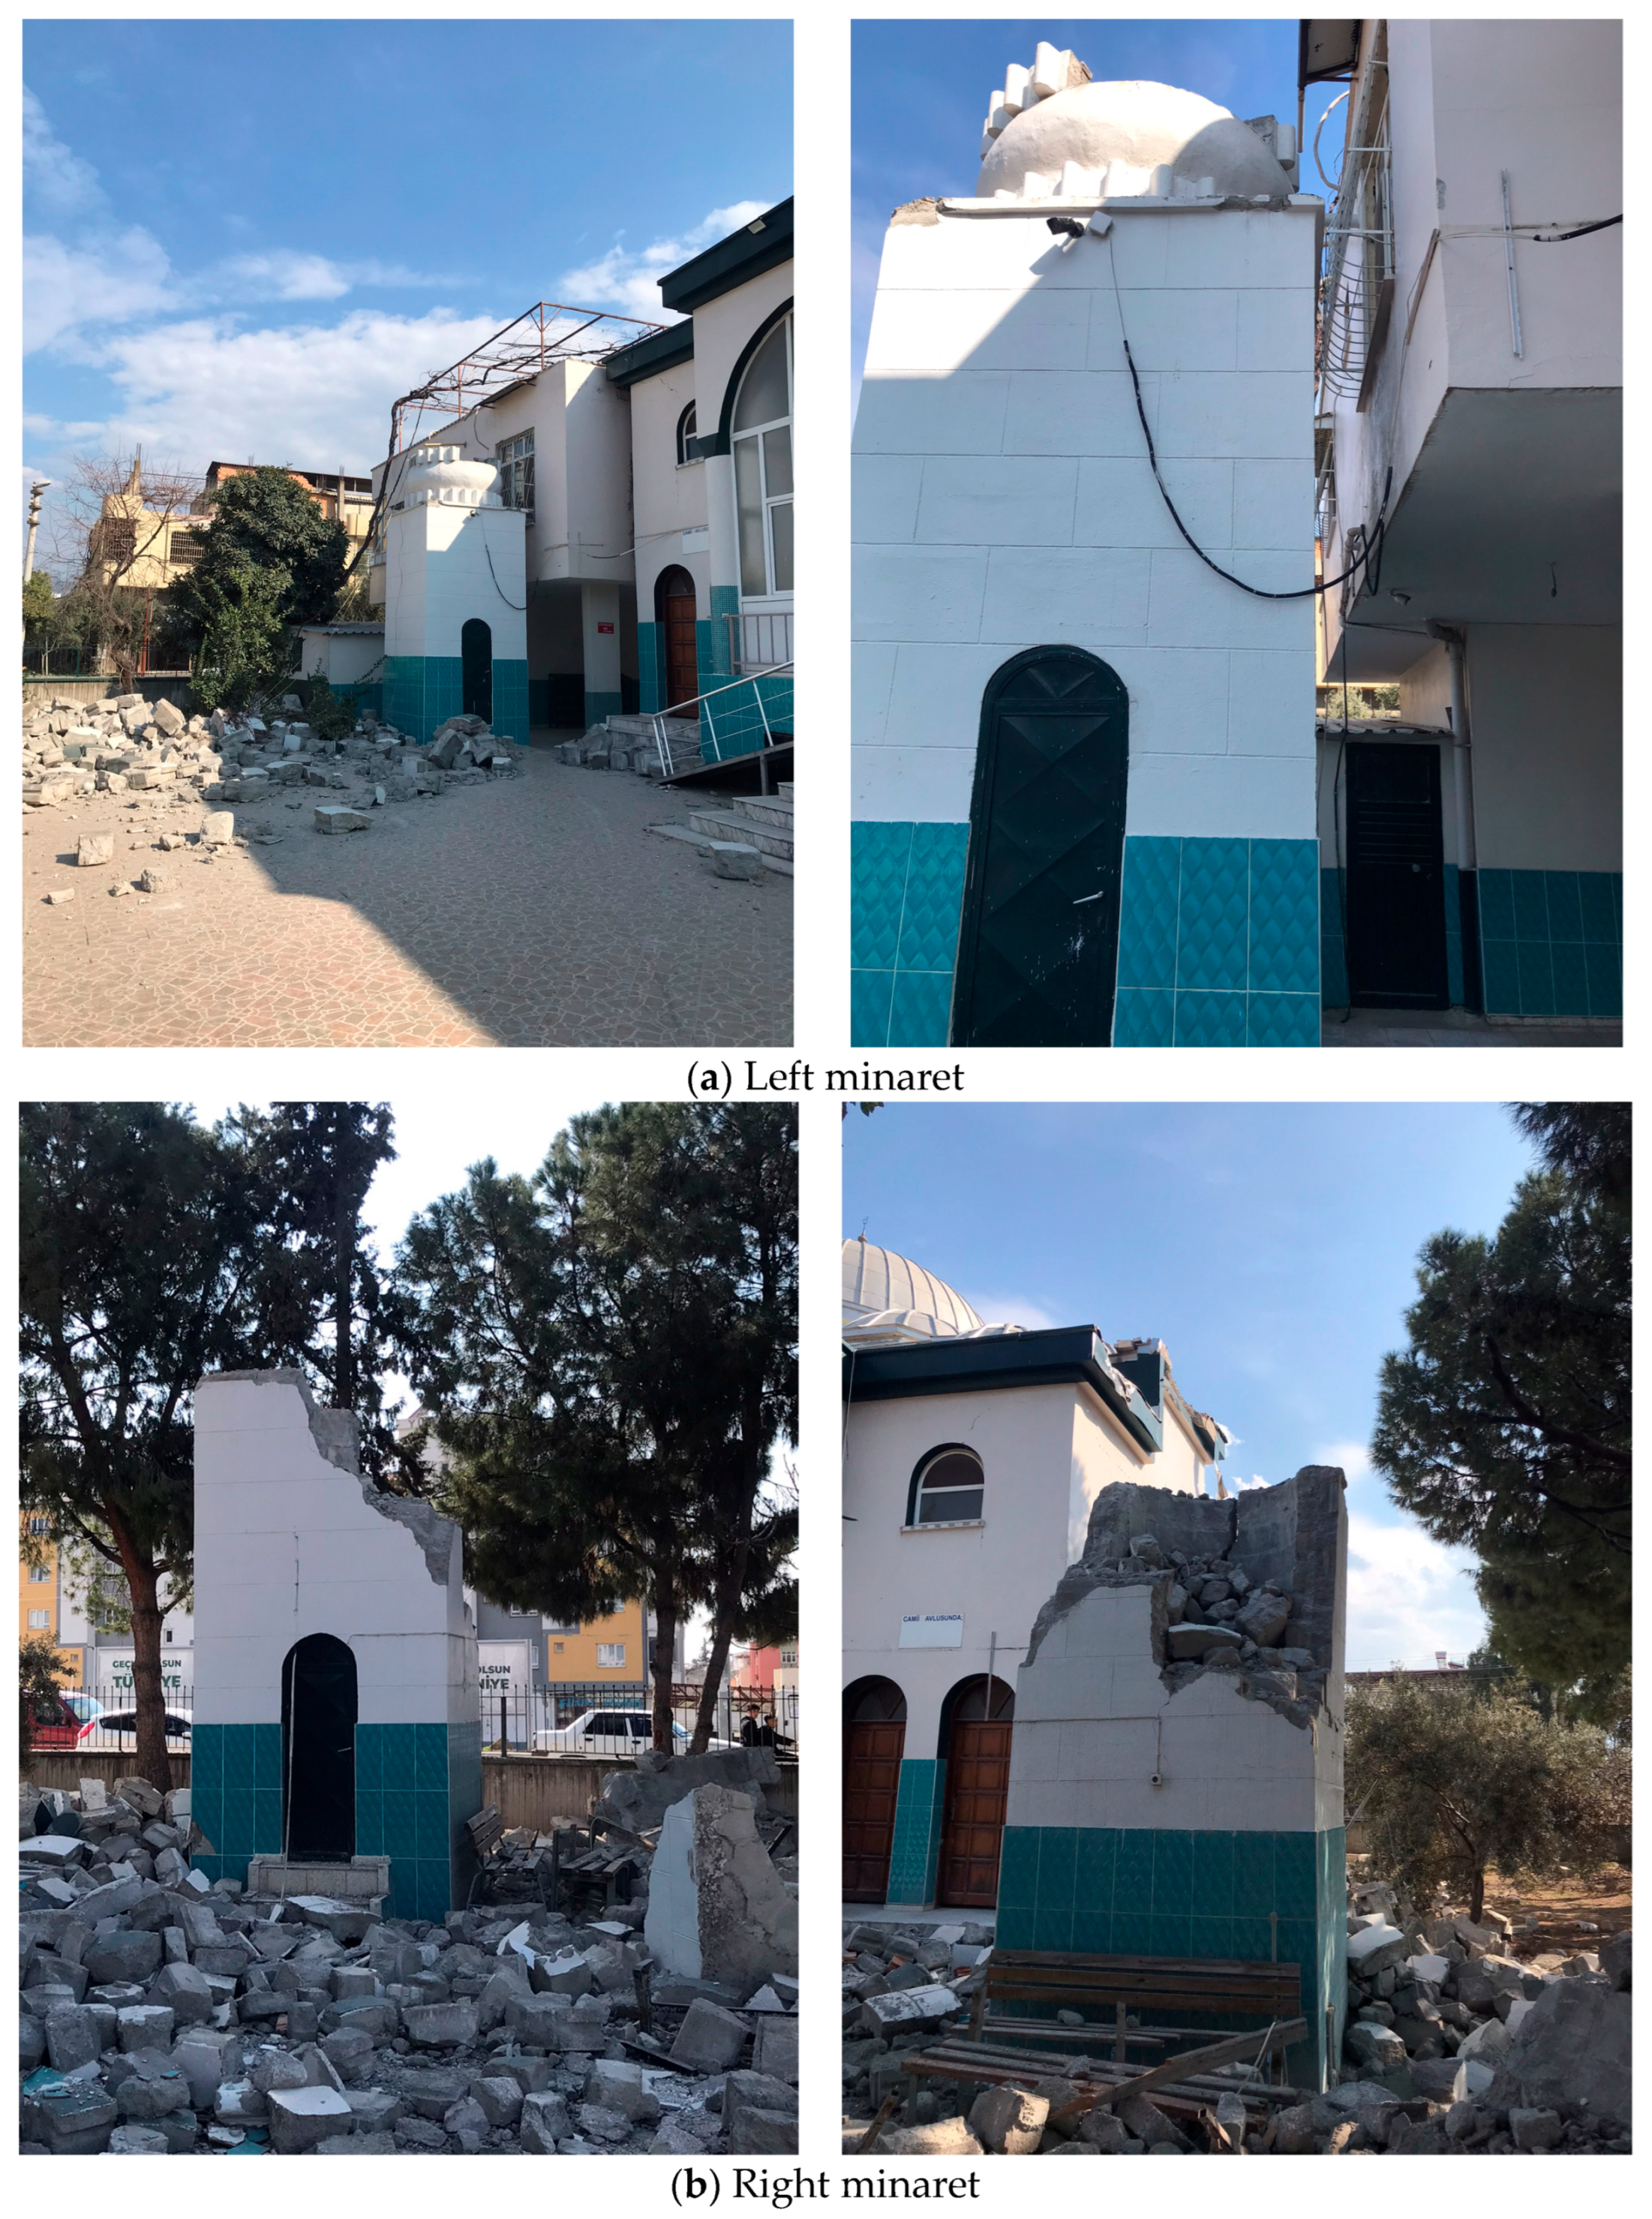
During the 6 February 2023 earthquakes, the minarets of the Imam-ı Azam mosque collapsed. The collapse occurred during the first shock (Mw = 7.7). The upper part of the minarets in the transition zone collapsed. The mosque suffered little damage in these earthquakes. Most of the damage observed was hairline cracks in the walls. Figure 2 provides images of the collapse condition for the minarets.
Figure 2.
Collapse condition of the minarets.
3.1. Operational Modal Analysis Tests
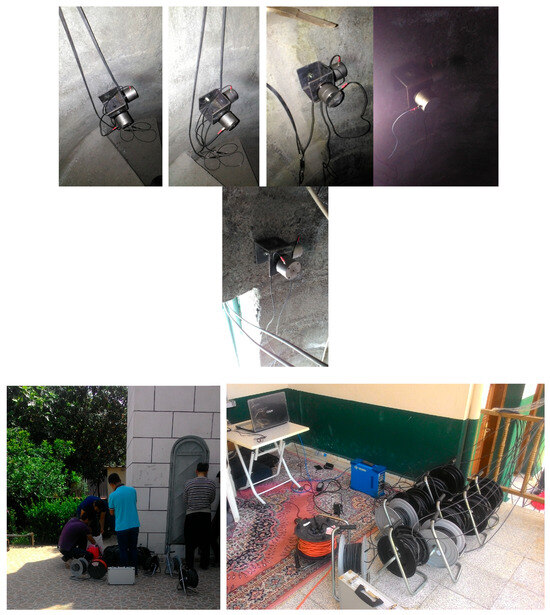
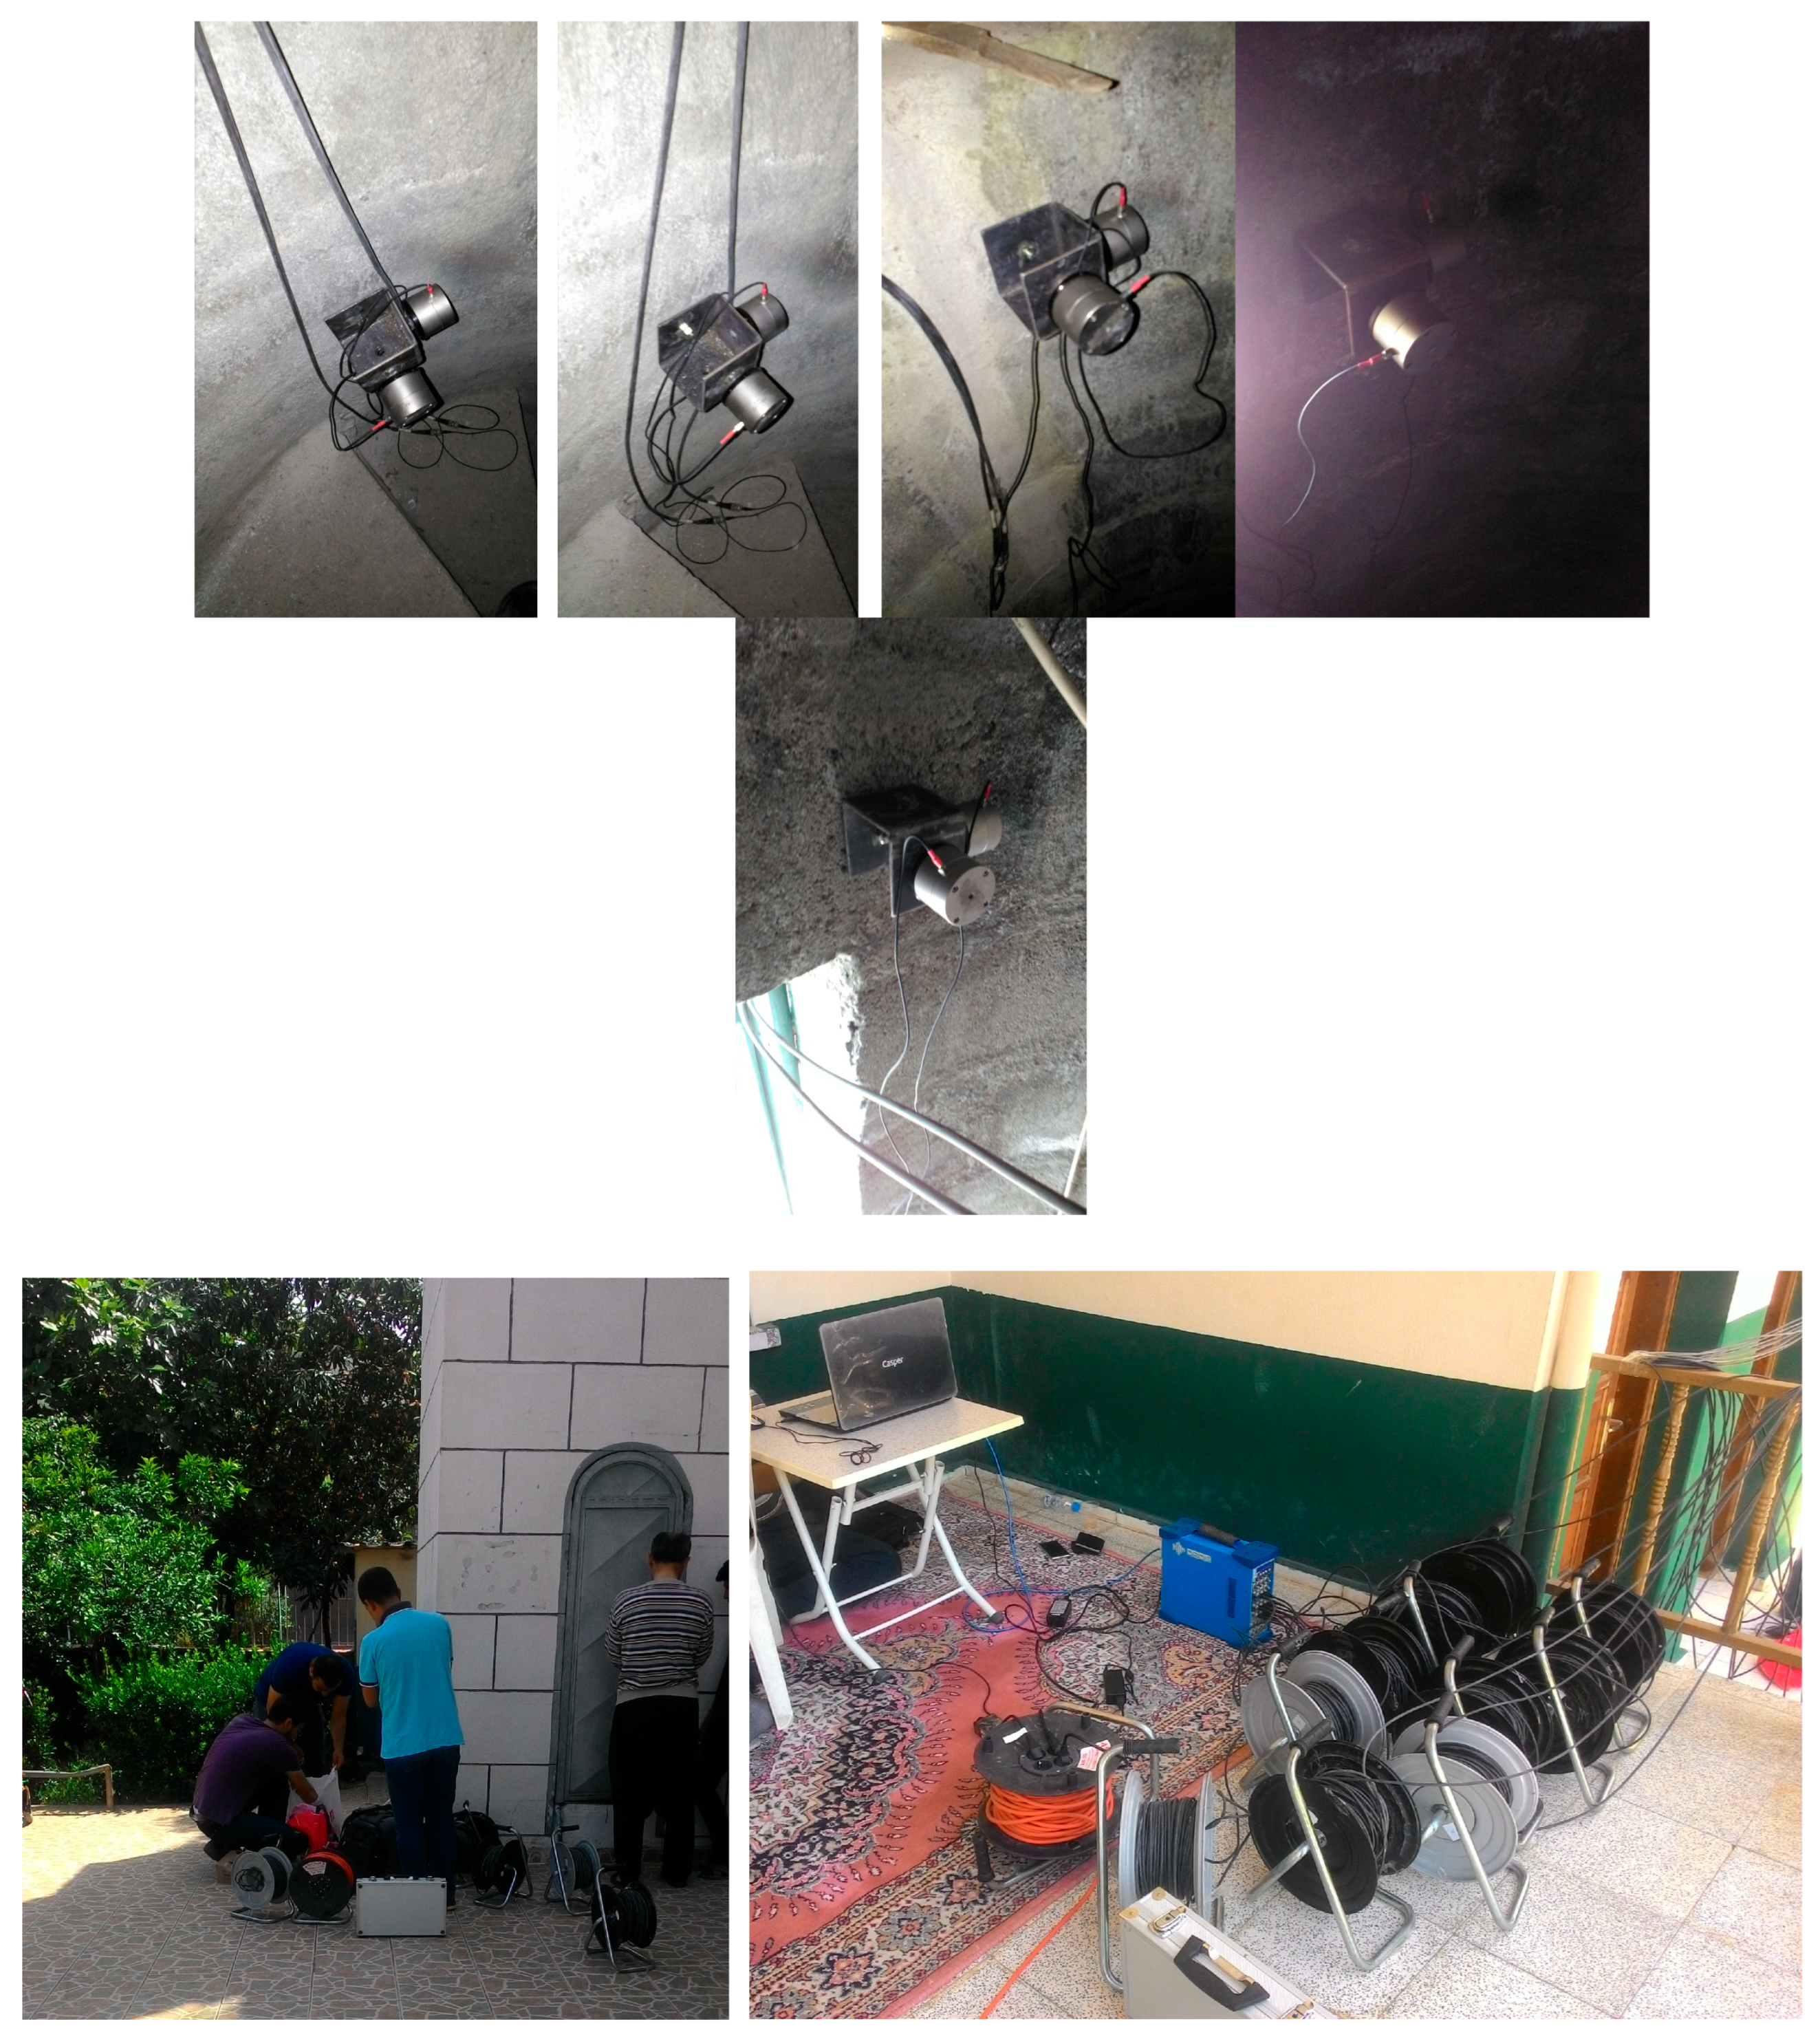
Operational modal analysis tests for the two minarets of the Imam-ı Azam Mosque were conducted prior to the structural damage. These tests were performed on the same day for both minarets (Figure 3). Ten uniaxial accelerometers (KB12VD) were used in the measurements. These accelerometers were placed at five different points of the masonry minaret. At each location, two accelerometers perpendicular to each other in the plane (x-y) were used. It was ensured that these accelerometers were on the same vertical direction of the minaret and had approximately the same plane coordinates. The parameters of the experimental measurements are frequency range = 0–10 Hz, spectral lines = 6401, average number = 5, and total measurement time = 3200 s. FFT (fast Fourier transform) was performed for the raw signals received from the accelerometers. The EFDD method then determined the dynamic characteristics of the masonry minaret by filtering the data according to the weight functions.
Figure 3.
Operational modal analysis tests for the Imam-Azam Mosque minarets.
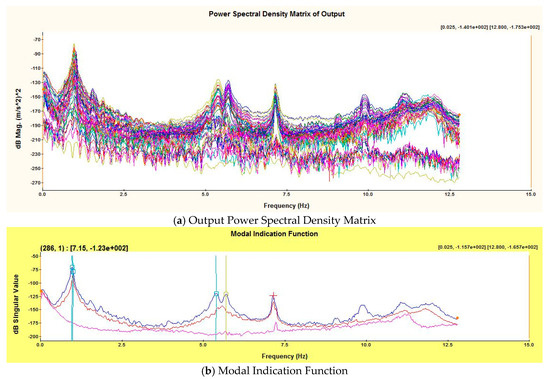
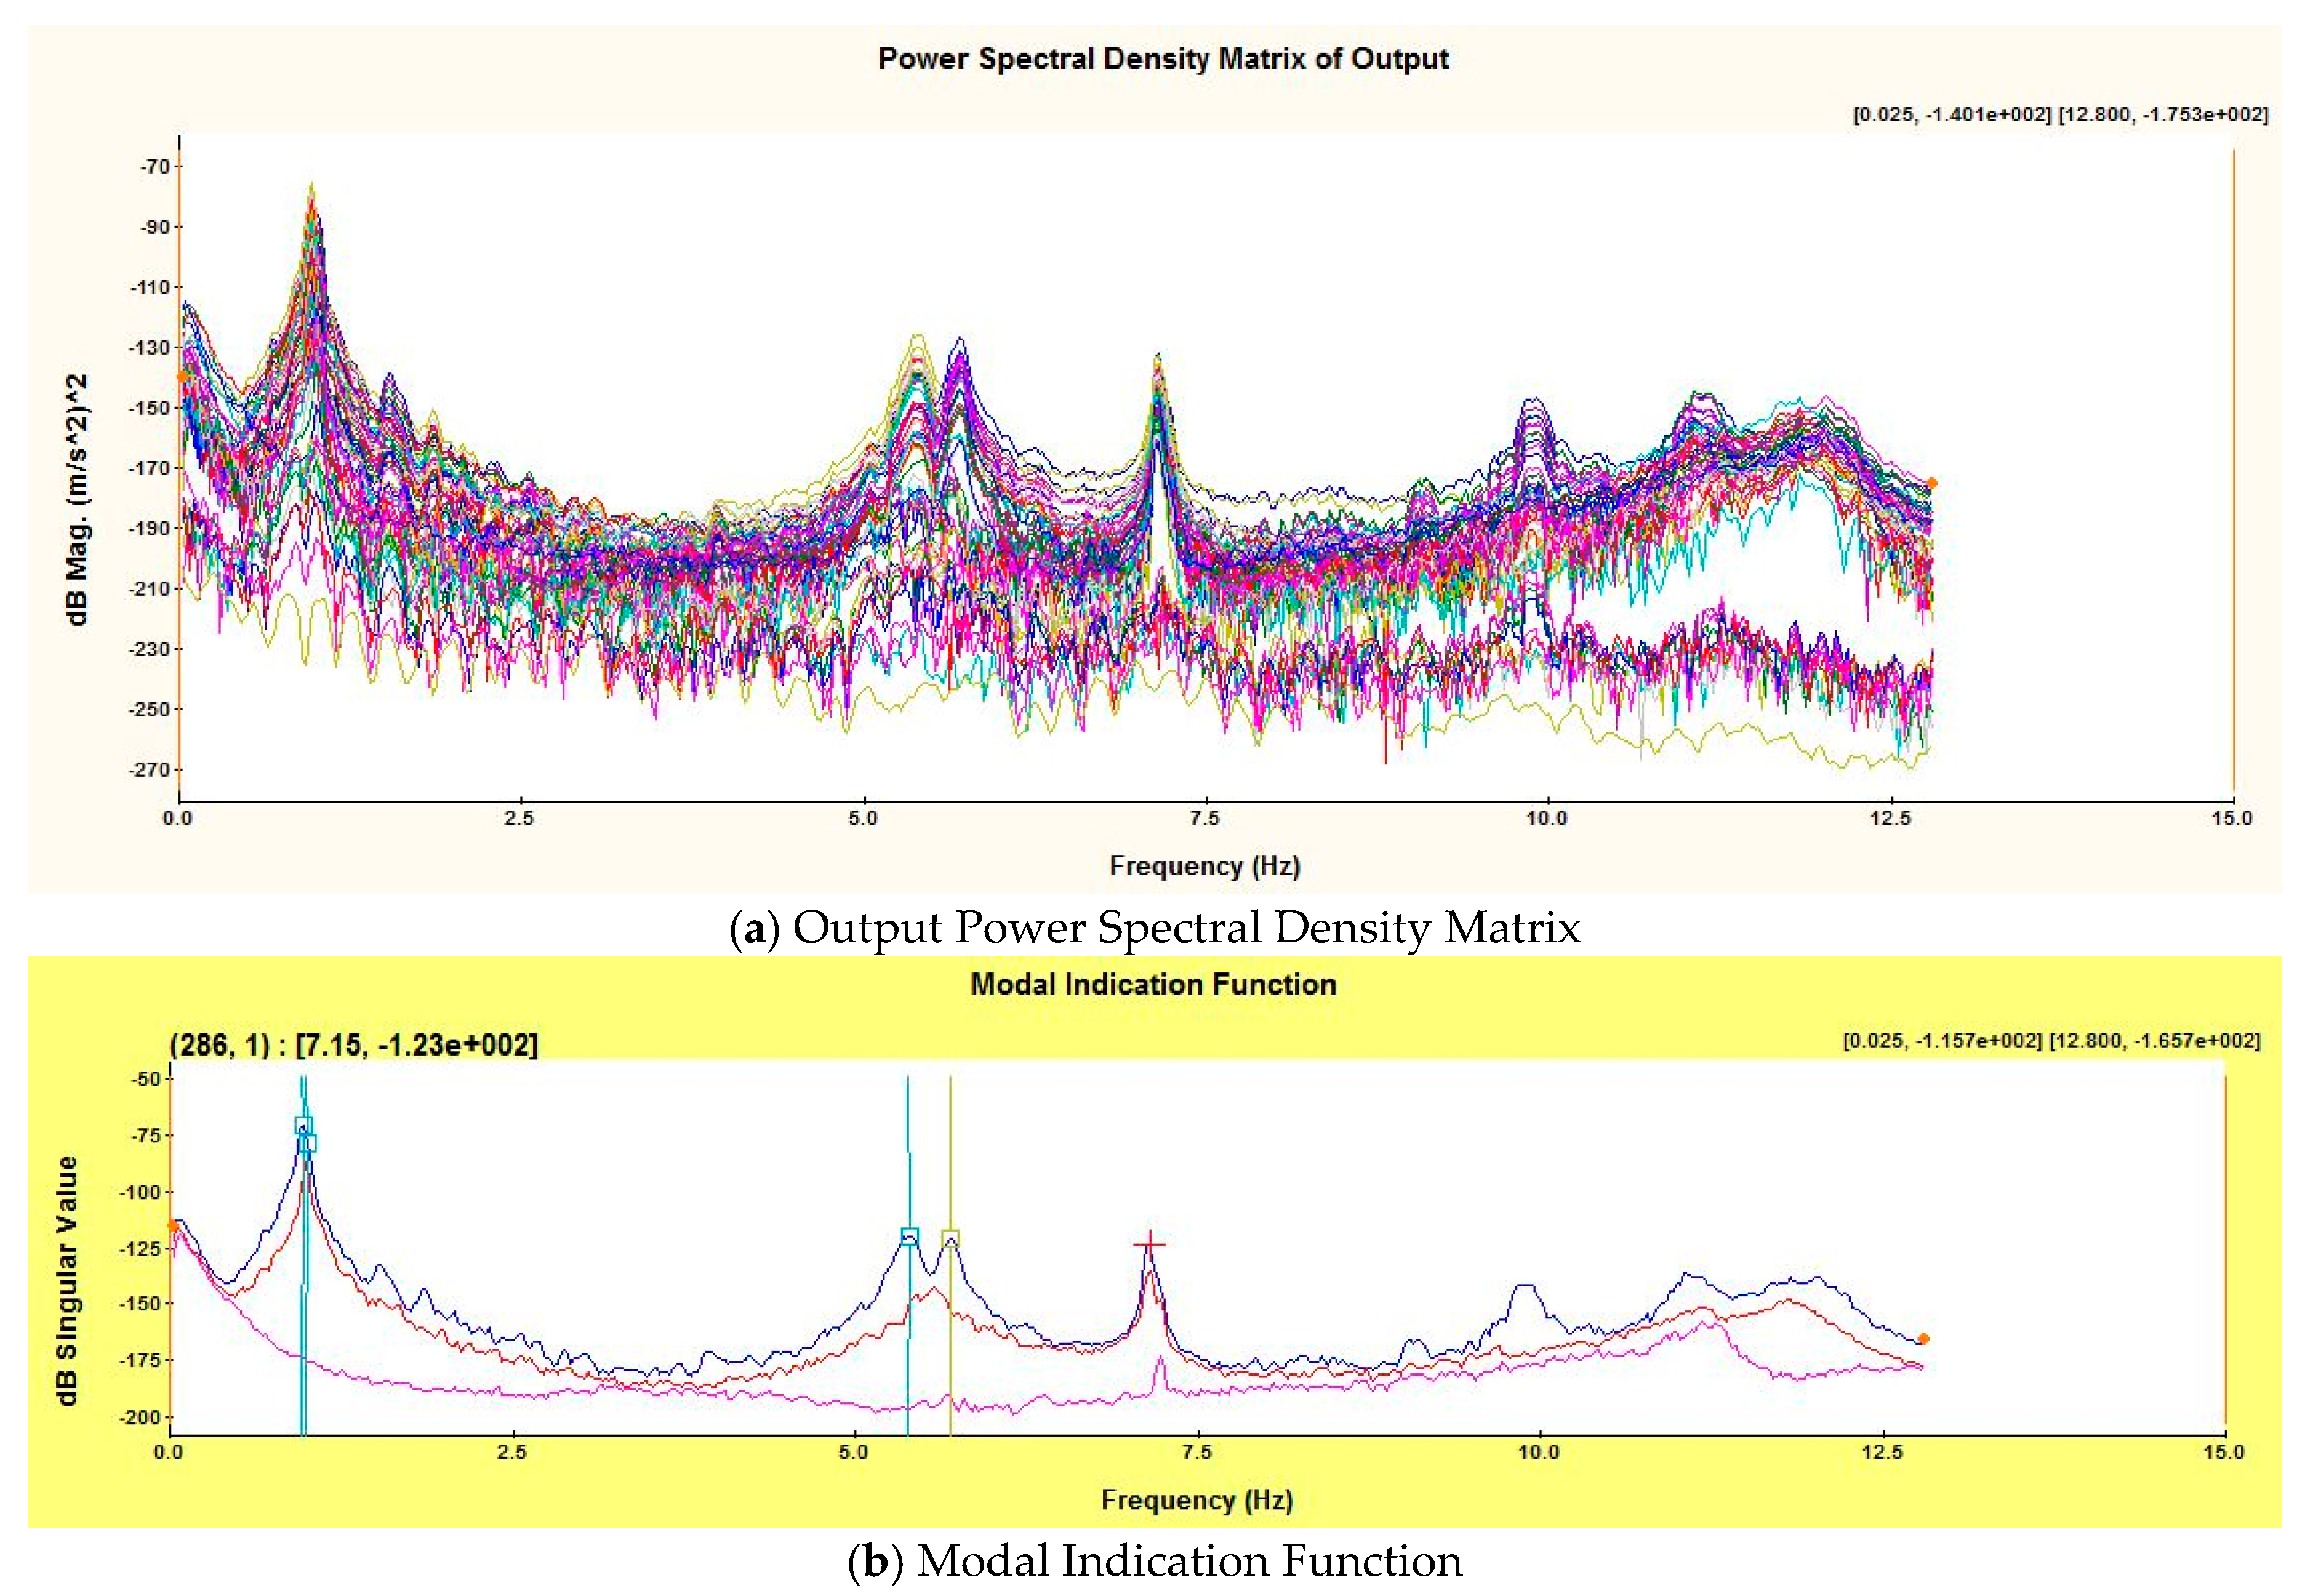
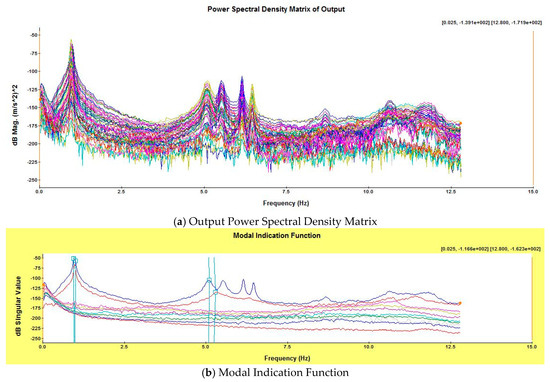
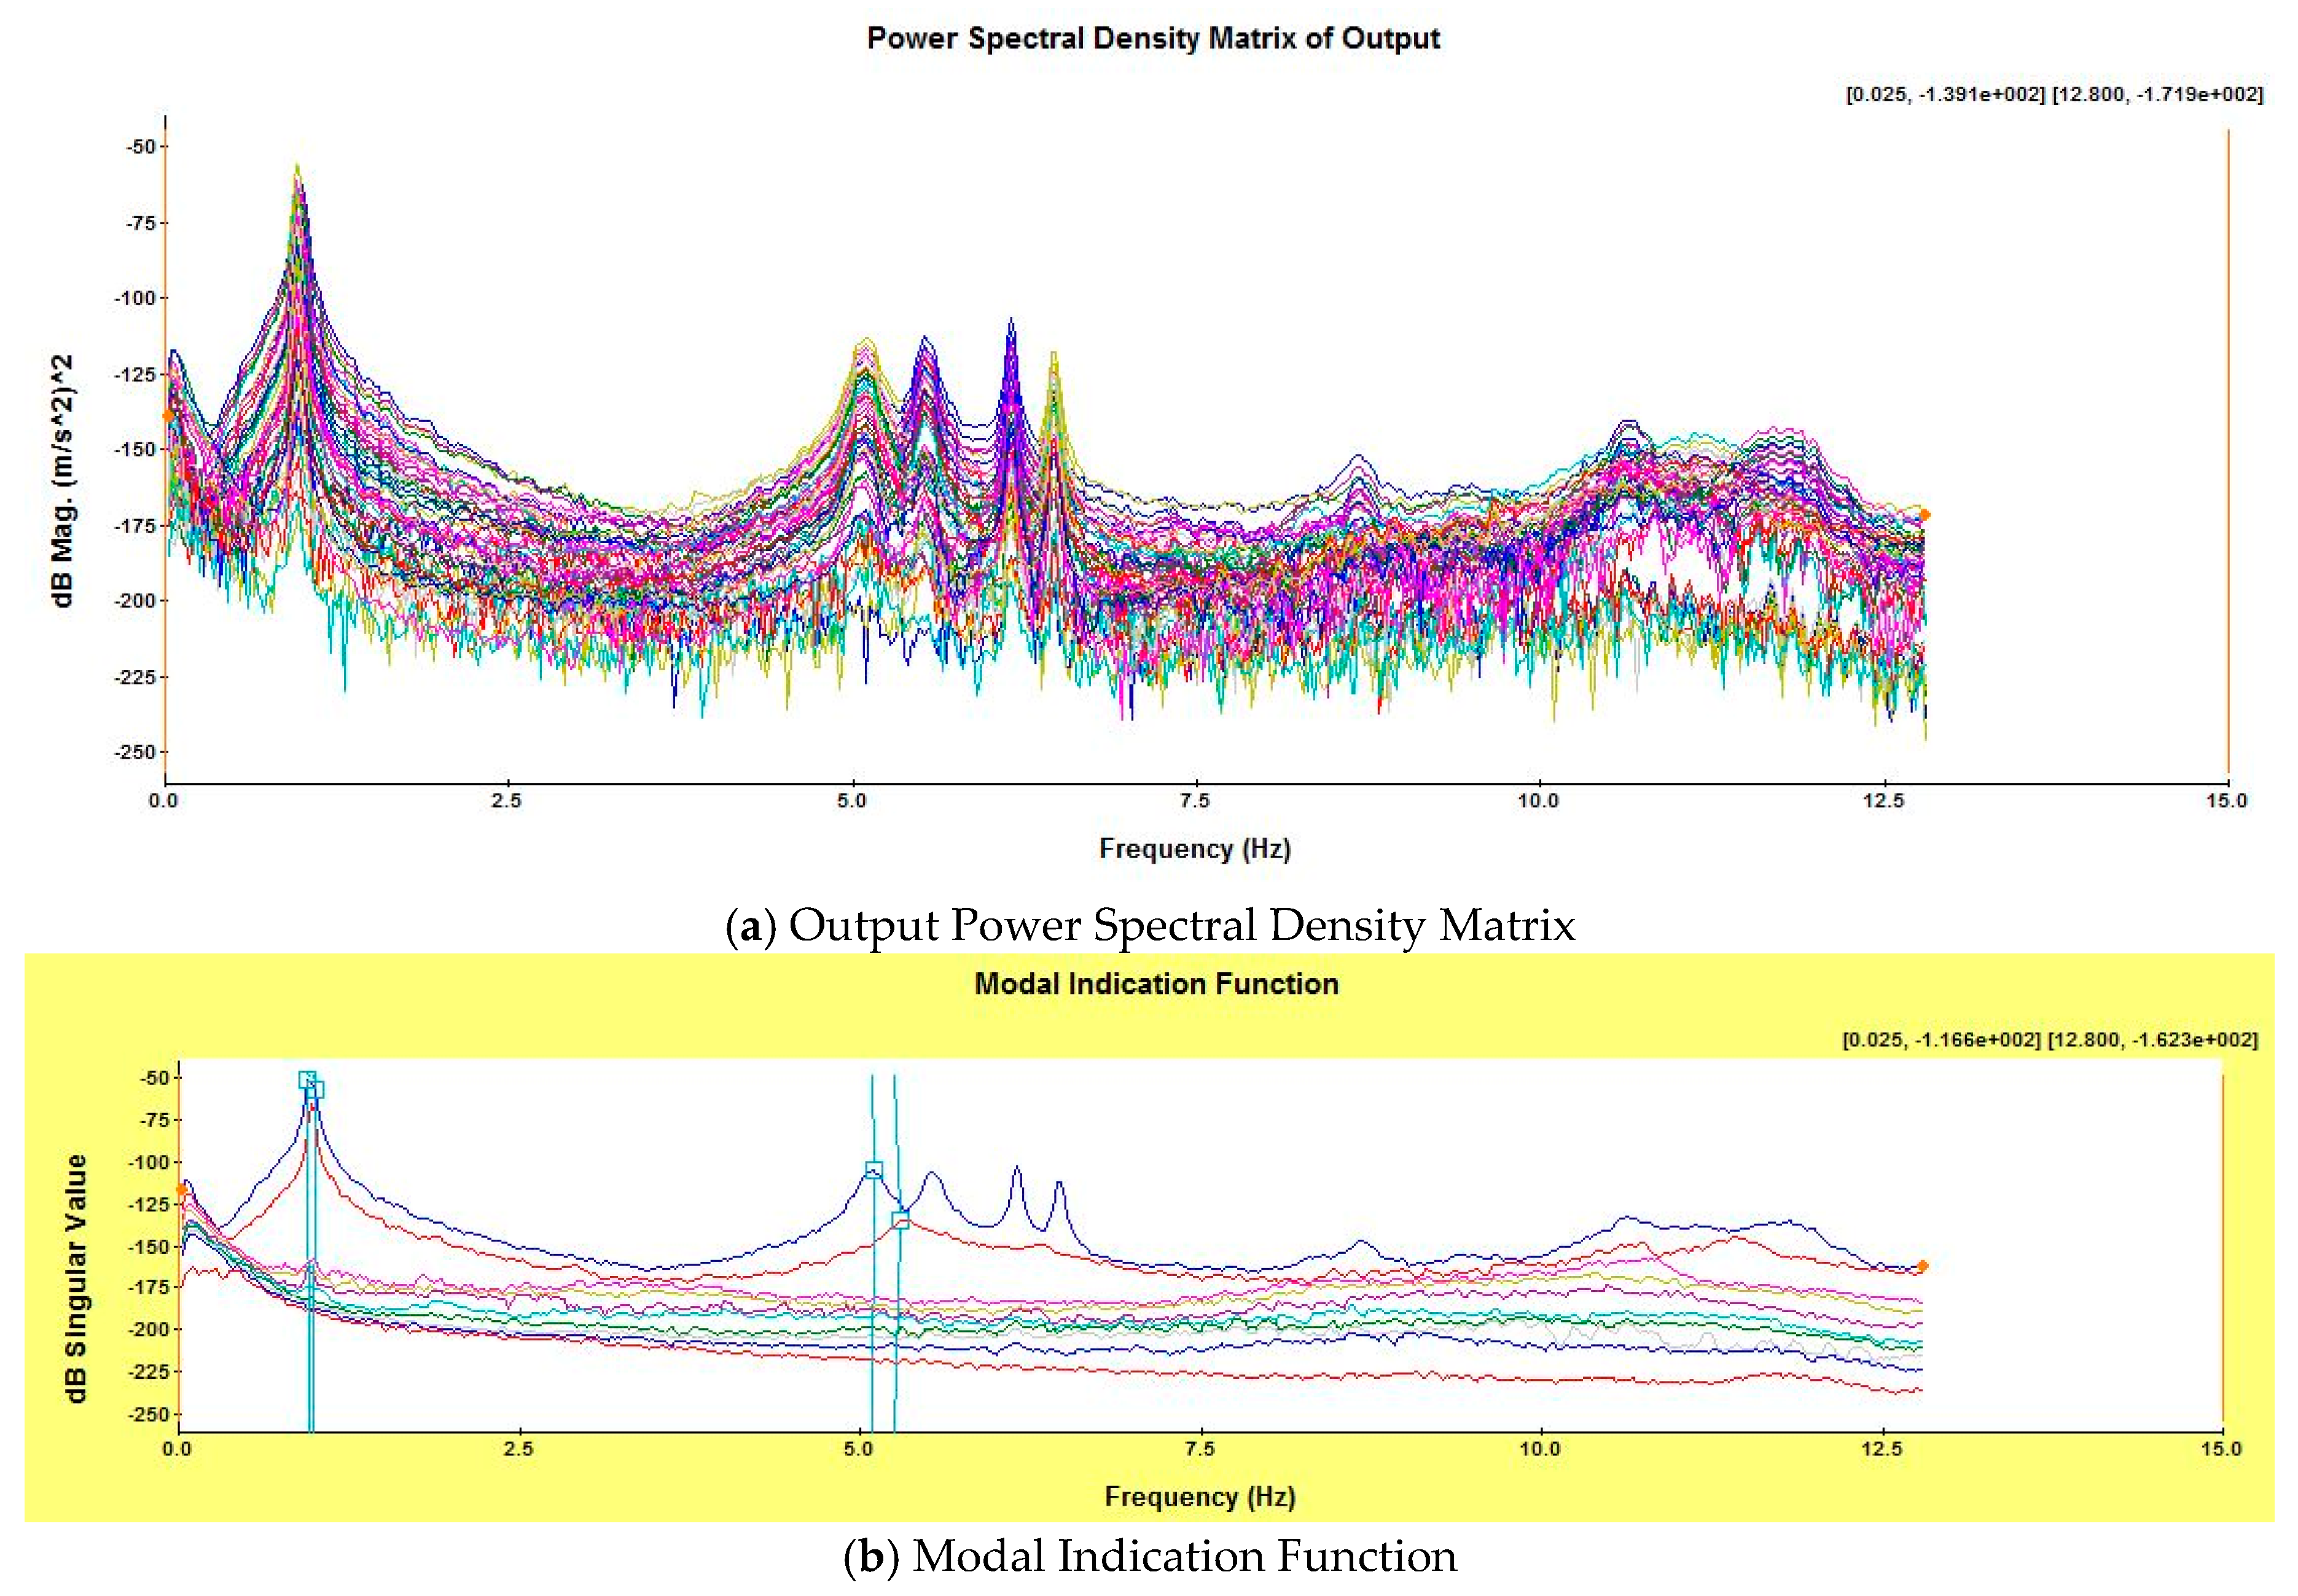
Figure 4 and Figure 5 display the output power spectral density matrices and modal indication function graphs obtained from the operational modal analysis of both minarets.
Figure 4.
The left minaret’s output power spectral density matrix and modal indication function graphs.
Figure 5.
The right minaret’s output power spectral density matrix and modal indication function graphs.
The output power spectral density matrix and modal indication function graphs obtained for the minarets were approximately the same. Therefore, approximately the same frequency and mode shapes were obtained for the two minarets. The natural frequency values were determined as 0.96 Hz, 0.98 Hz, 5.09 Hz, and 5.24 Hz for the left minaret and 0.96 Hz, 0.98 Hz, 5.12 Hz, and 5.19 Hz for the right minaret, respectively. The corresponding mode shapes at these frequencies also show strong similarity. When the modal assurance criterion (MAC) values obtained from both experimental tests are compared, a similarity of 100% is observed for the first and second modes, and 99% for the third and fourth modes. The mode shapes of the minaret exhibit lateral motion primarily in the y-direction for the first and third modes, and in the x-direction for the second and fourth modes. Since the minarets are approximately symmetrical in plan, their stiffness and mass centers are very close to each other. As a result, the first and second mode shapes exhibit similar dynamic behavior, as do the third and fourth modes.
Considering the results obtained experimentally, finite element models reflecting the current condition of the minarets were created. Due to the similarity of the results for the left and right minarets, these models were prepared only for the left minaret.
3.2. Finite Element Modelling
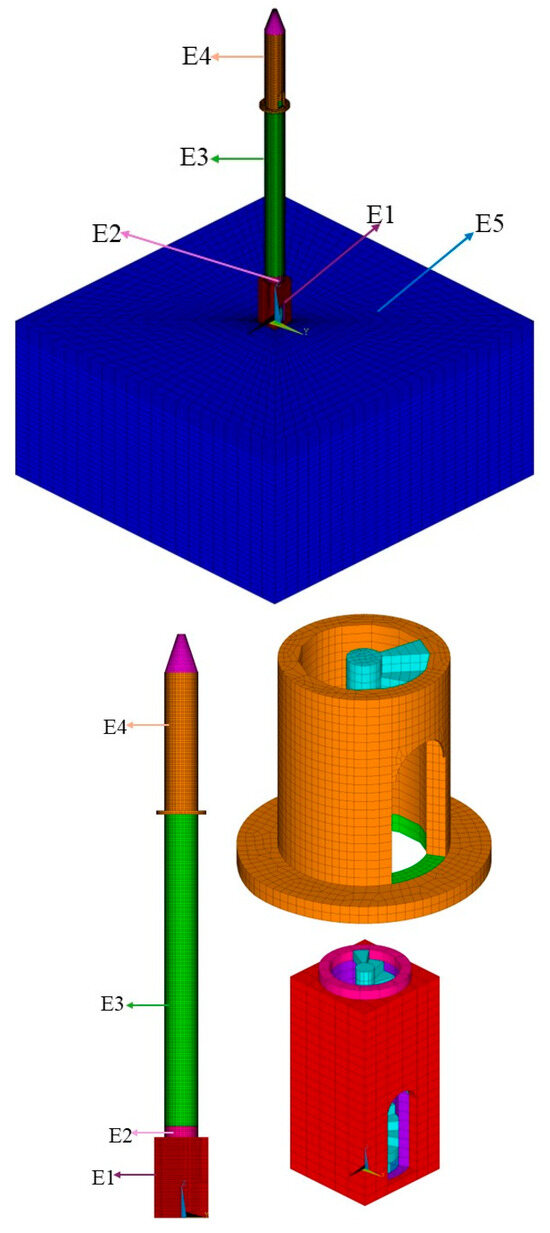
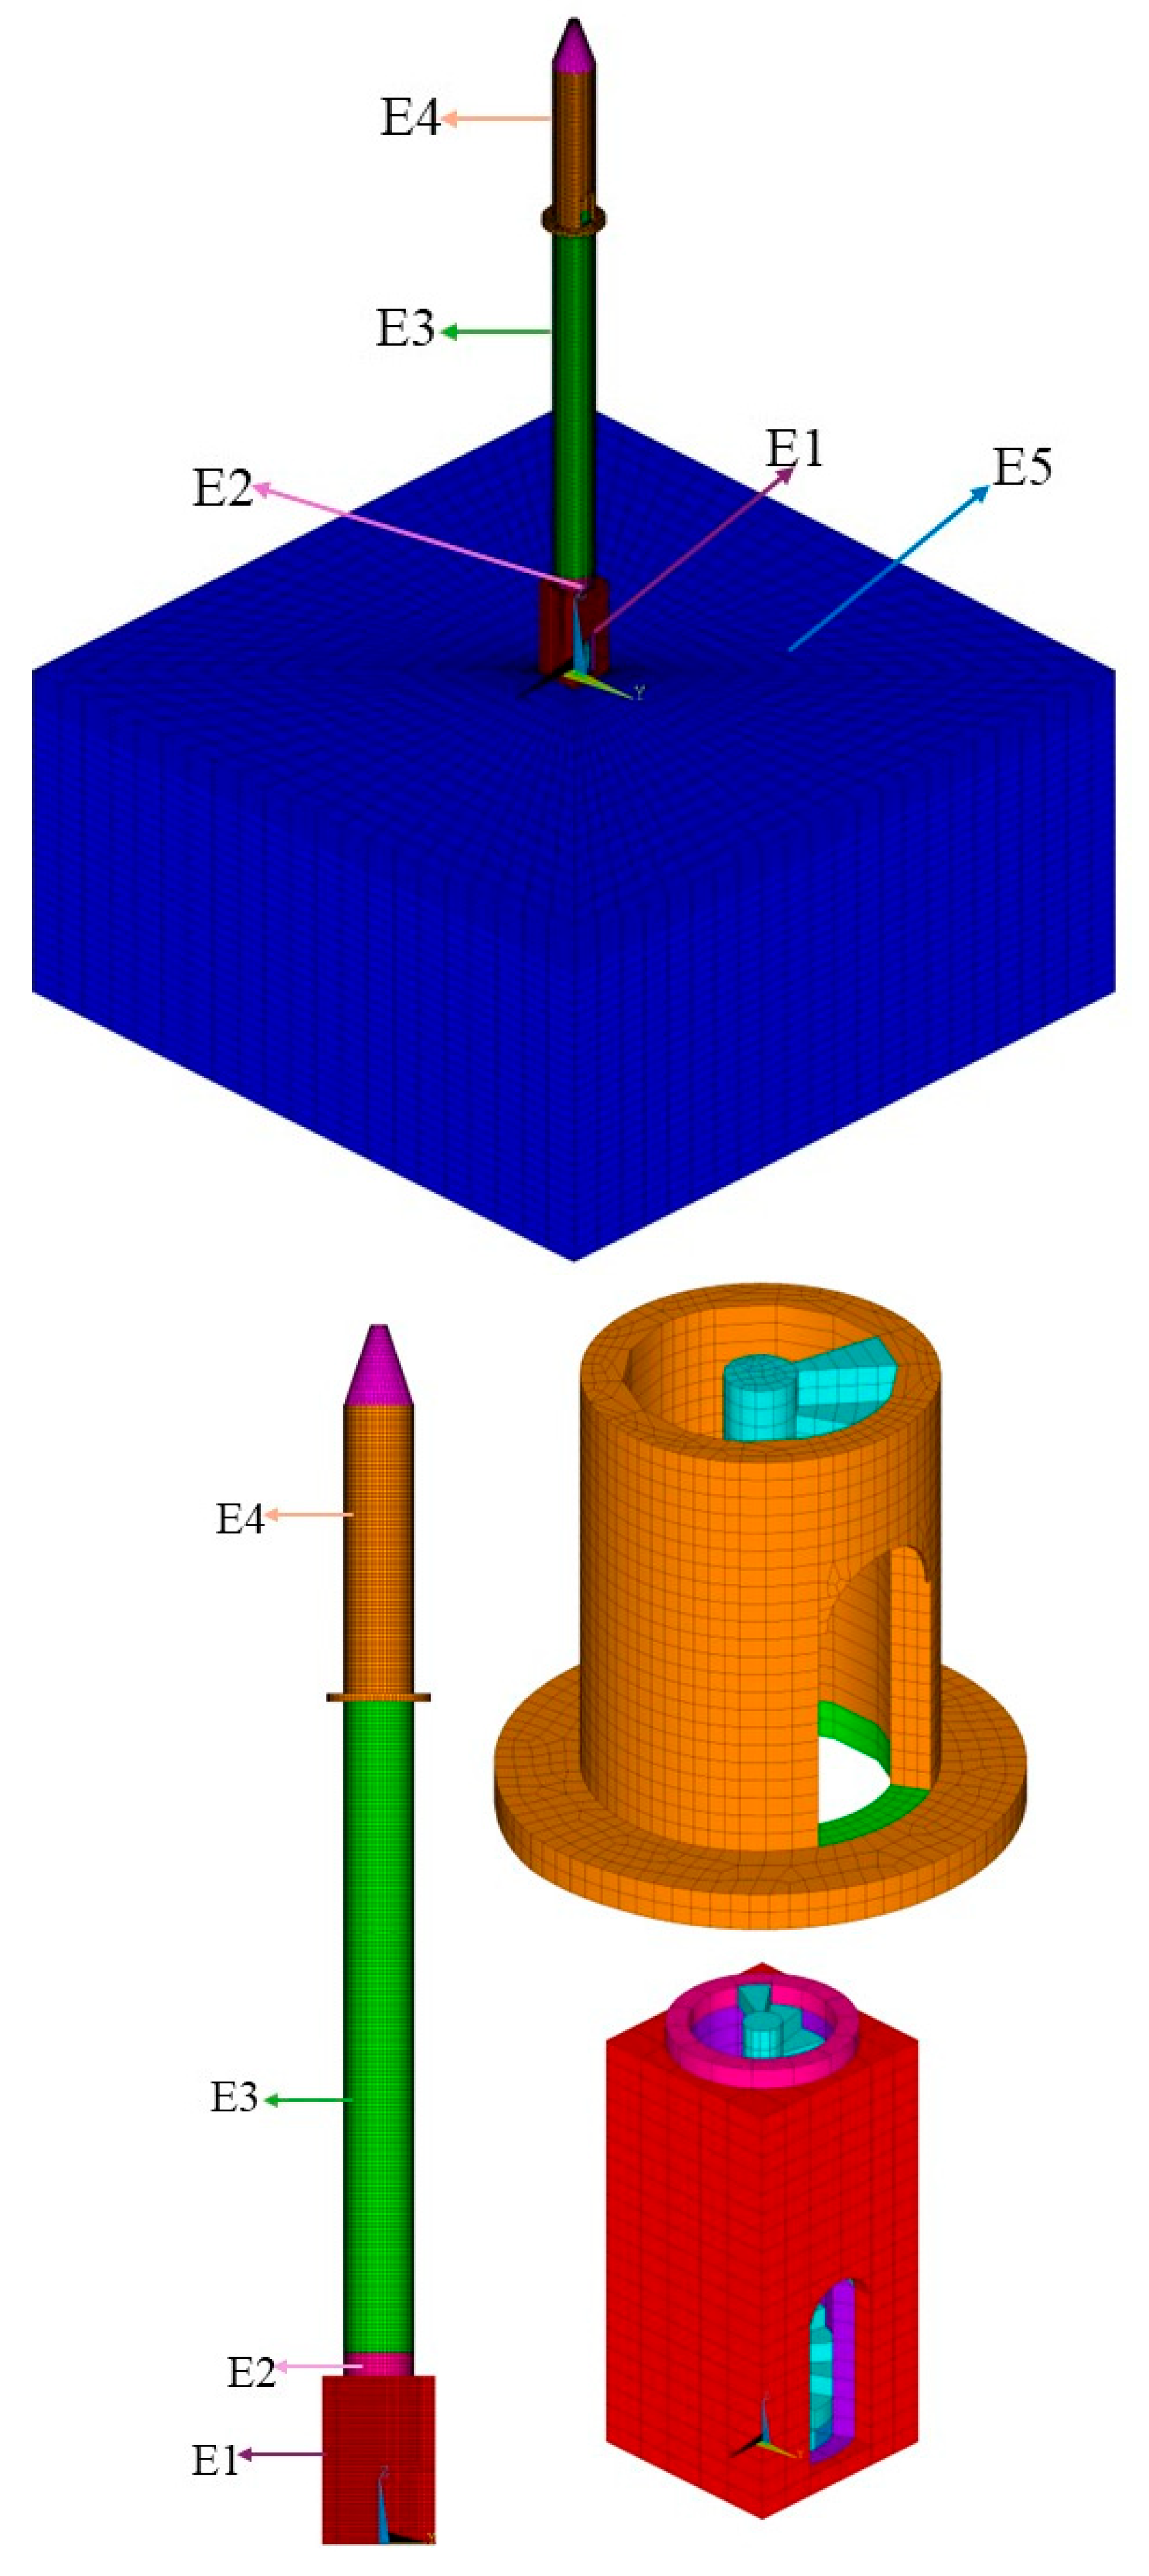
The finite element model for the minaret was prepared using the ANSYS v24 software program. The model includes door–window openings and spiral staircases. Since the soil domain will also be used as a parameter in the model-updating process, the soil domain is also modelled. The macro-modelling approach adopted in this study is widely used in the analysis of masonry structures, as it enables efficient modeling of large-scale systems while adequately capturing the overall nonlinear structural response. Previous studies have successfully applied this approach to investigate the seismic behavior of historical masonry structures, confirming its suitability for such analyses [41,42,43,44]. Modelling was performed with 160,588 nodes and 139,095 elements using the SOLID65 element. SOLID65 is an 8-noded, three-dimensional, solid, isoparametric, hexahedral element capable of simulating cracking in tension and crushing in compression, which makes it particularly suitable for modeling the nonlinear behavior of masonry structures. Its ability to represent material degradation under seismic loading conditions is critical for realistic performance assessment. Furthermore, the SOLID65 element has been extensively used and validated in studies focusing on the nonlinear modeling of masonry structures. The material properties were defined based on the available literature and experimental data, including modulus of elasticity, compressive strength, and tensile behavior. Nonlinear material behavior was incorporated to account for cracking and damage mechanisms typical of masonry structures. The initial material properties were adopted from the literature for similar masonry structures and were subsequently calibrated through the model-updating process based on experimentally obtained dynamic characteristics. Therefore, the final model parameters reflect the actual structural behavior rather than solely relying on the initial assumptions. Apart from the soil domain, four different parameters were used. These parameters represent various parts of the minaret, including the pulpit, transition, cylindrical body, and honeycomb. A total of five material parameters were considered: E1, E2, E3, and E4 for masonry units, and E5 for the soil material model. Boundary conditions were defined to realistically represent the support conditions of the minaret. The interaction between structural components was assumed to be fully bonded. The model was calibrated through the updating process using experimentally obtained dynamic characteristics. Figure 6 presents the finite element model of the minaret. The selected mesh density was defined by considering a balance between computational efficiency and accuracy and is consistent with mesh resolutions adopted in similar studies. The mesh was refined to adequately capture geometric details and stress concentration regions, particularly in transition zones. Therefore, the adopted mesh is considered sufficient to provide stable and reliable results for the purposes of this study.
Figure 6.
Finite element modelling of the minaret.
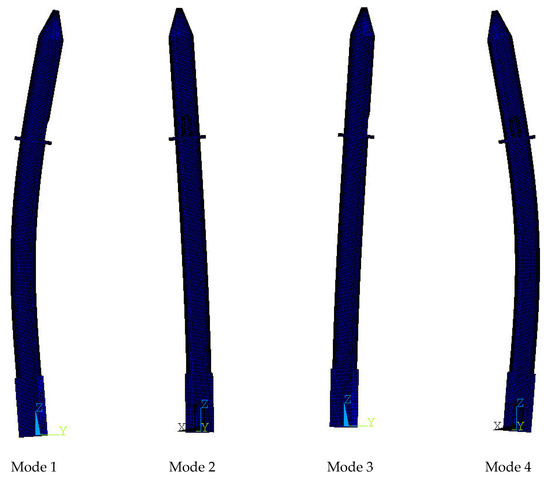
For the initial analysis, the minaret modulus of elasticity was assumed to be 16,000 MPa (E1 = E2 = E3 = E4 = 16,000 MPa), and the soil domain modulus of elasticity was assumed to be 90 MPa (E5 = 90 MPa). The finite element modal analysis results yielded the first four frequency values of 0.837 Hz, 0.846 Hz, 4.693 Hz, and 4.737 Hz, respectively. The effective modal mass participation ratios for the first four modes were determined to be 70% in the Y-direction for the first mode, 68% in the X-direction for the second mode, 10% in the Y-direction for the third mode, and 9% in the X-direction for the fourth mode, respectively. These modes were considered in the study as they adequately represent the dynamic response of the structure. For these frequency values, differences of 12.8%, 13.7%, 7.8%, and 9.6% were observed compared to the experimentally obtained frequencies. Figure 7 presents the corresponding mode shapes. The mode shapes obtained from the finite element analyses were compared with those obtained experimentally using the Modal Assurance Criterion (MAC). The MAC values were calculated as 97.8%, 97.3%, 90.3%, and 92.6%, respectively. In order to reduce the frequency differences and increase the MAC values, a model updating procedure was performed.
Figure 7.
Mode shapes of the first four frequencies for the initial finite element model.
3.3. Model Updating
The modulus of elasticity was selected as a variable parameter for the model-updating process. Numerous modal analyses were performed for varying modulus of elasticity values. Initially, modal analyses were performed for E1, E2, E3, and E4 in the range of 10,000 MPa to 30,000 MPa and for increments of 1000 MPa. In these analyses, soil modulus of elasticity values between 10 MPa and 210 MPa and for 40 MPa increments were used for E5. A total of 60 modal analyses were performed for these ranges. The results obtained from these analyses were compared with the experimental results in terms of frequency and MAC values. The range of modulus of elasticity was narrowed for modulus of elasticity values that give closer results to each other. Thus, more detailed analyses were performed for E1, E2, E3, and E4 for 2000 MPa increment intervals between 14,000 MPa and 24,000 MPa and for E5 for 20 MPa increment intervals between 90 MPa and 170 MPa. A total of 6480 analyses were performed for these ranges.
Multi-Criteria Decision-Making methods were used to compare the modal analysis results with the experimental results. MCDM methods represent a powerful operational model for addressing decision-making problems based on various decision criteria [45]. These methods are widely used by decision-makers in many application areas to solve their problems [46,47,48]. The MCDM method’s fundamental principle involves selecting criteria, choosing alternatives, weighting the criteria, and evaluating a set of alternatives based on these weights. The weights determined by the decision-maker were assigned as 20% for the first and second frequencies, 15% for the third and fourth frequencies, 10% for the first and second mode shapes, and 5% for the third and fourth mode shapes.
The decision-making techniques outlined earlier were utilized to select several alternatives during the model updating. The results are summarized in the table below. Based on the criteria, the 12 most suitable alternatives were identified from a total of 1280 options. Notably, in three out of the four different Multi-Criteria Decision-Making techniques, row 1270 emerged as the most suitable alternative. However, in the MABAC method, this alternative was ranked second. Table 1 presents 12 modal analysis results from four different methods that closely match the experimental results. For Table 1, the “A” index symbolizes each analysis output. In addition, the numbers given between 1 and 12 in the table show the ranking of the analytical results closest to the experimental results. In other words, the results numbered 1 indicate the closest values, and the results numbered 12 indicate the farthest values.
Table 1.
Results of the MCDM methods.
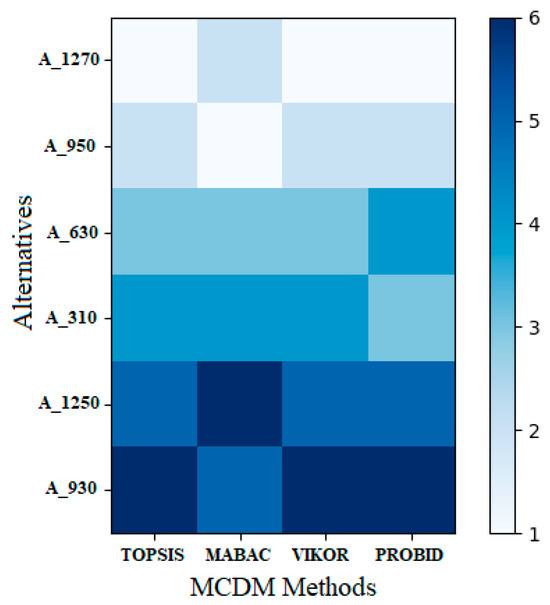
Figure 8 illustrates the graphical results for the first six alternatives listed in the table above. Based on these results, the most favorable alternatives for the TOPSIS and VIKOR methods are rows 1270, 950, 630, 310, 1250, and 930, in that order. For the MABAC method, the preferred alternatives are rows 950, 1270, 630, 310, 930, and 1250. In the case of the PROBID method, the recommended rows are 1270, 950, 310, 630, 1250, and 930.
Figure 8.
Heat map resulting from the MCDM methods.
Table 2 presents the results of the 12 modal analyses that closely match the experimental results.
Table 2.
Comparison of the FEM solutions and experimental results.
Upon analyzing Table 2, it can be concluded that A_1270 is the modal analysis result that most closely aligns with the experimental results in terms of frequency differences and MAC values. The modulus of elasticity values for A_1270 analysis are 22,000 MPa, 22,000 MPa, 22,000 MPa, 18,000 MPa, and 130 MPa for E1, E2, E3, E4, and E5, respectively. Table 3 presents a comparison between the results of the A_1270 analysis, the results before the model updating, and the experimental results.
Table 3.
Comparison of the FEM solutions and experimental results.
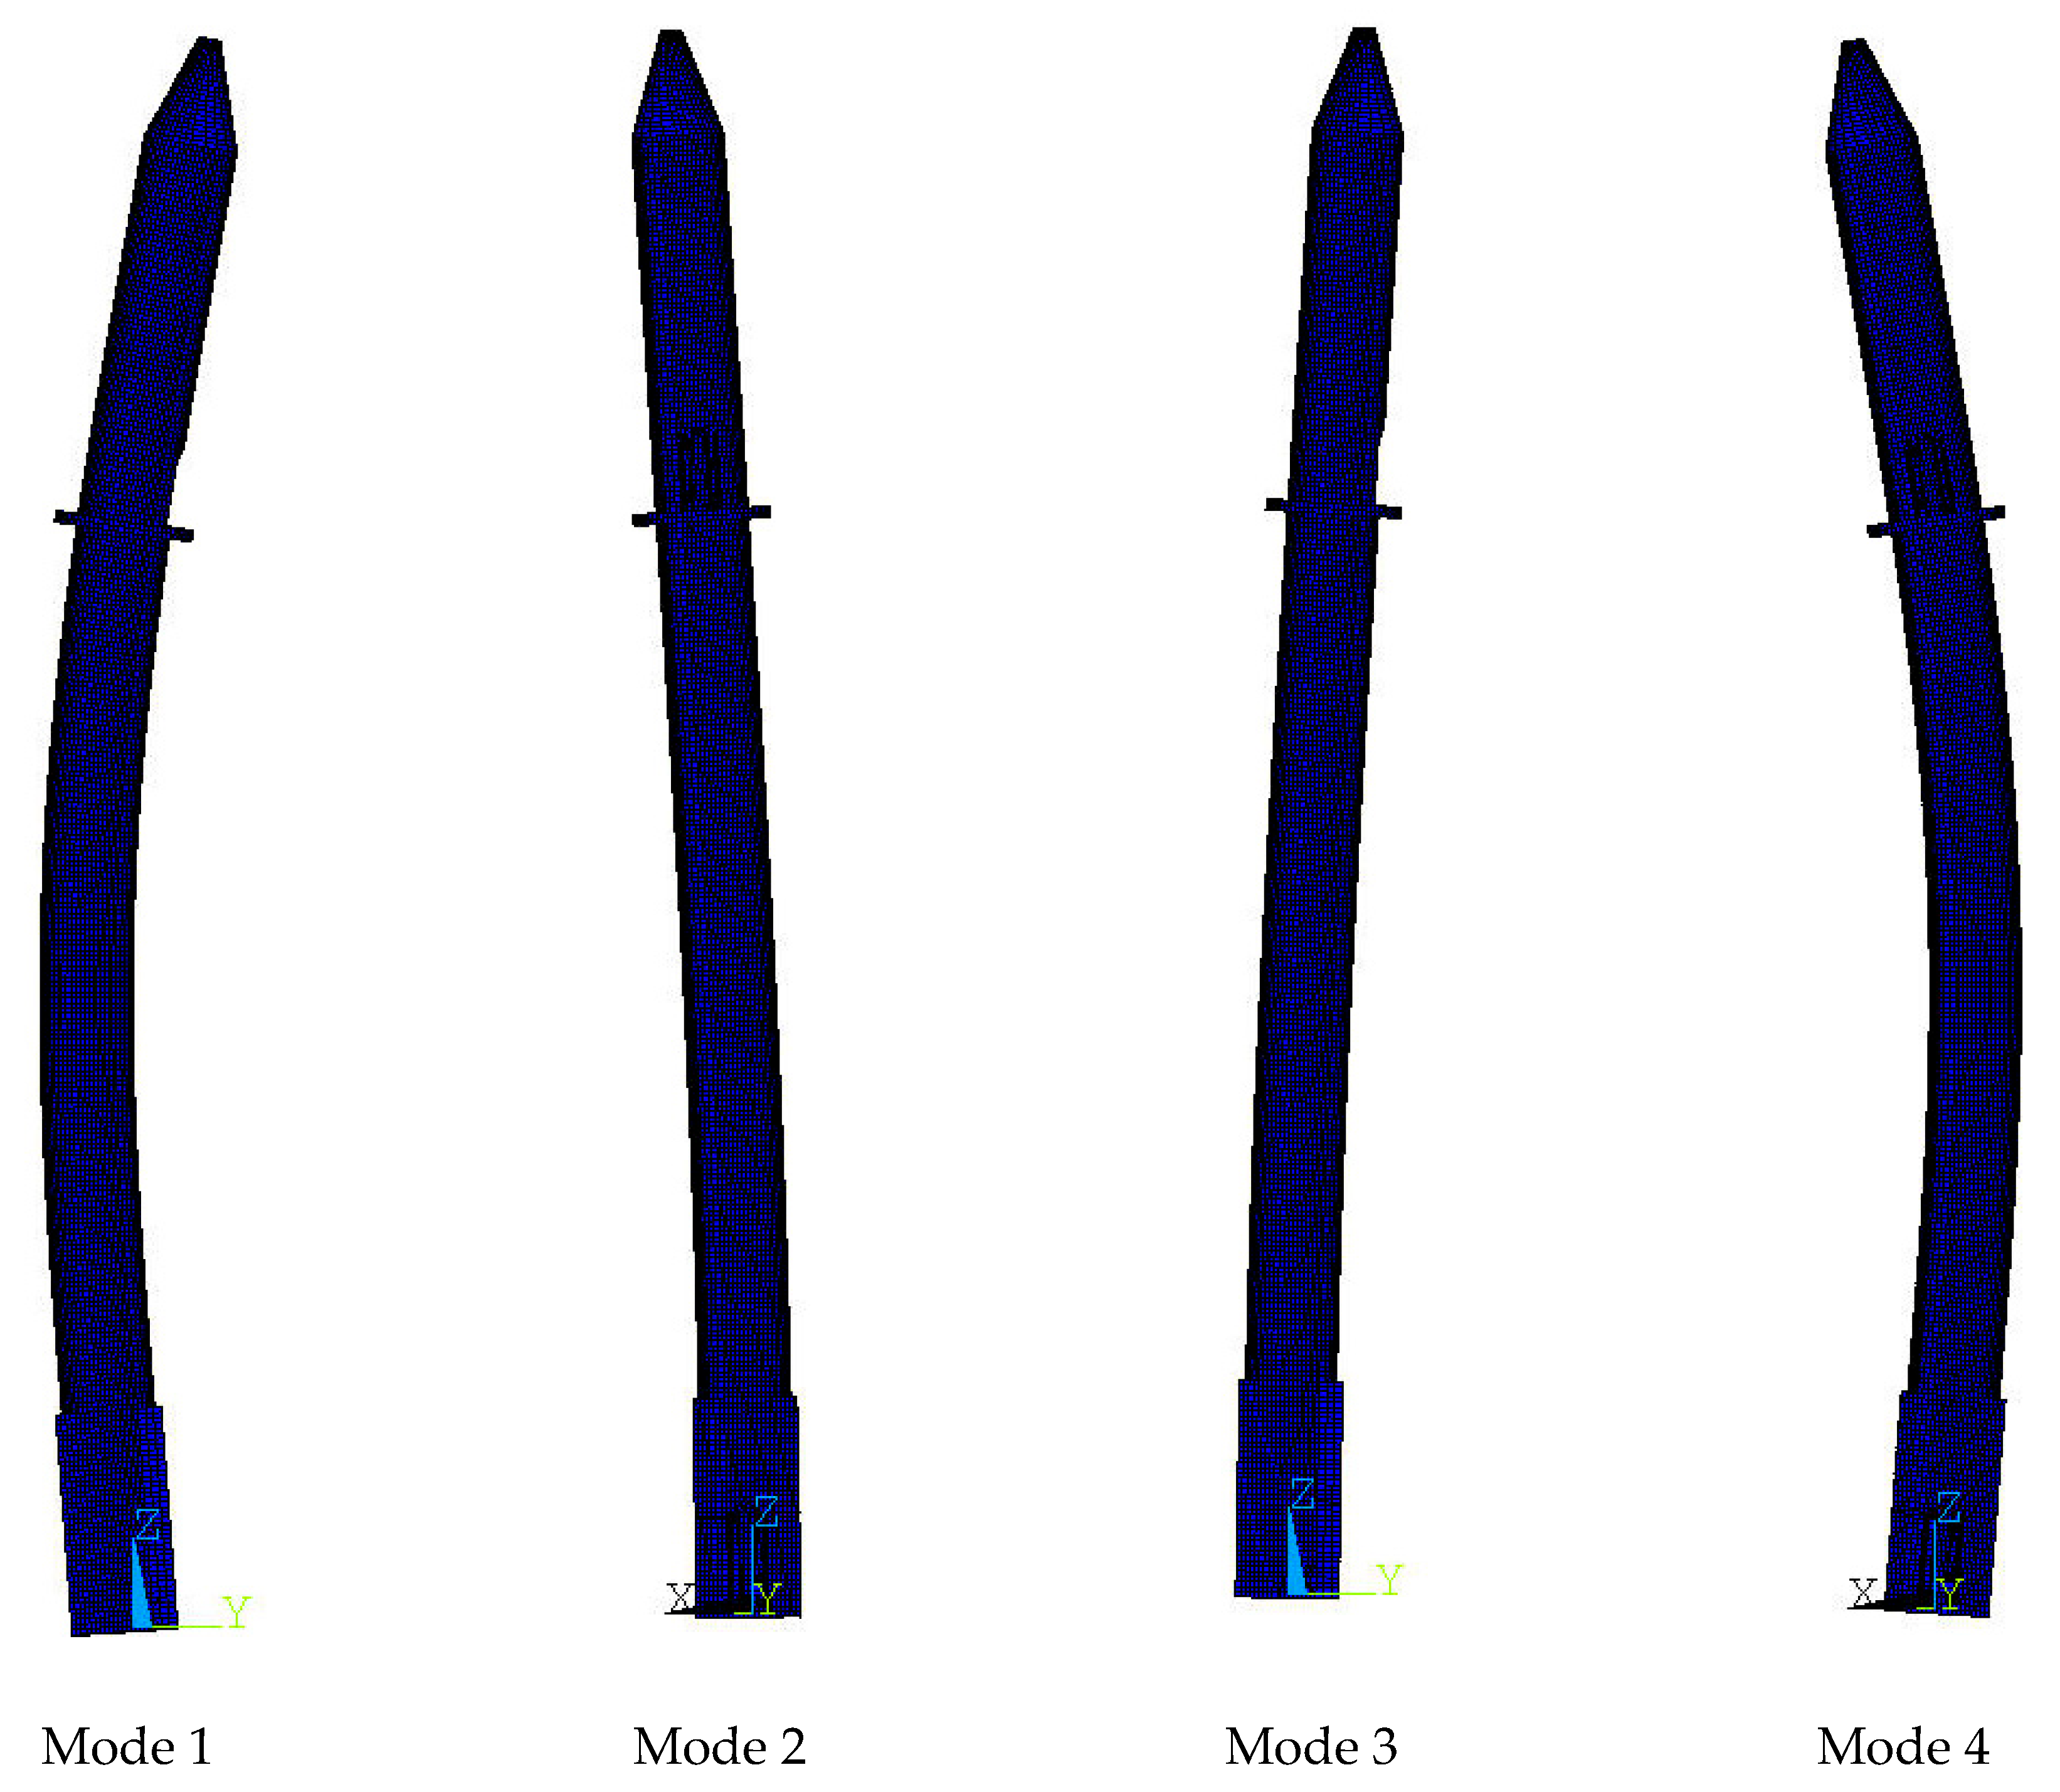
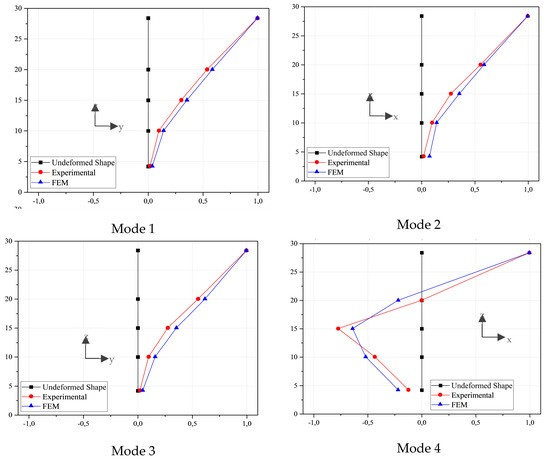
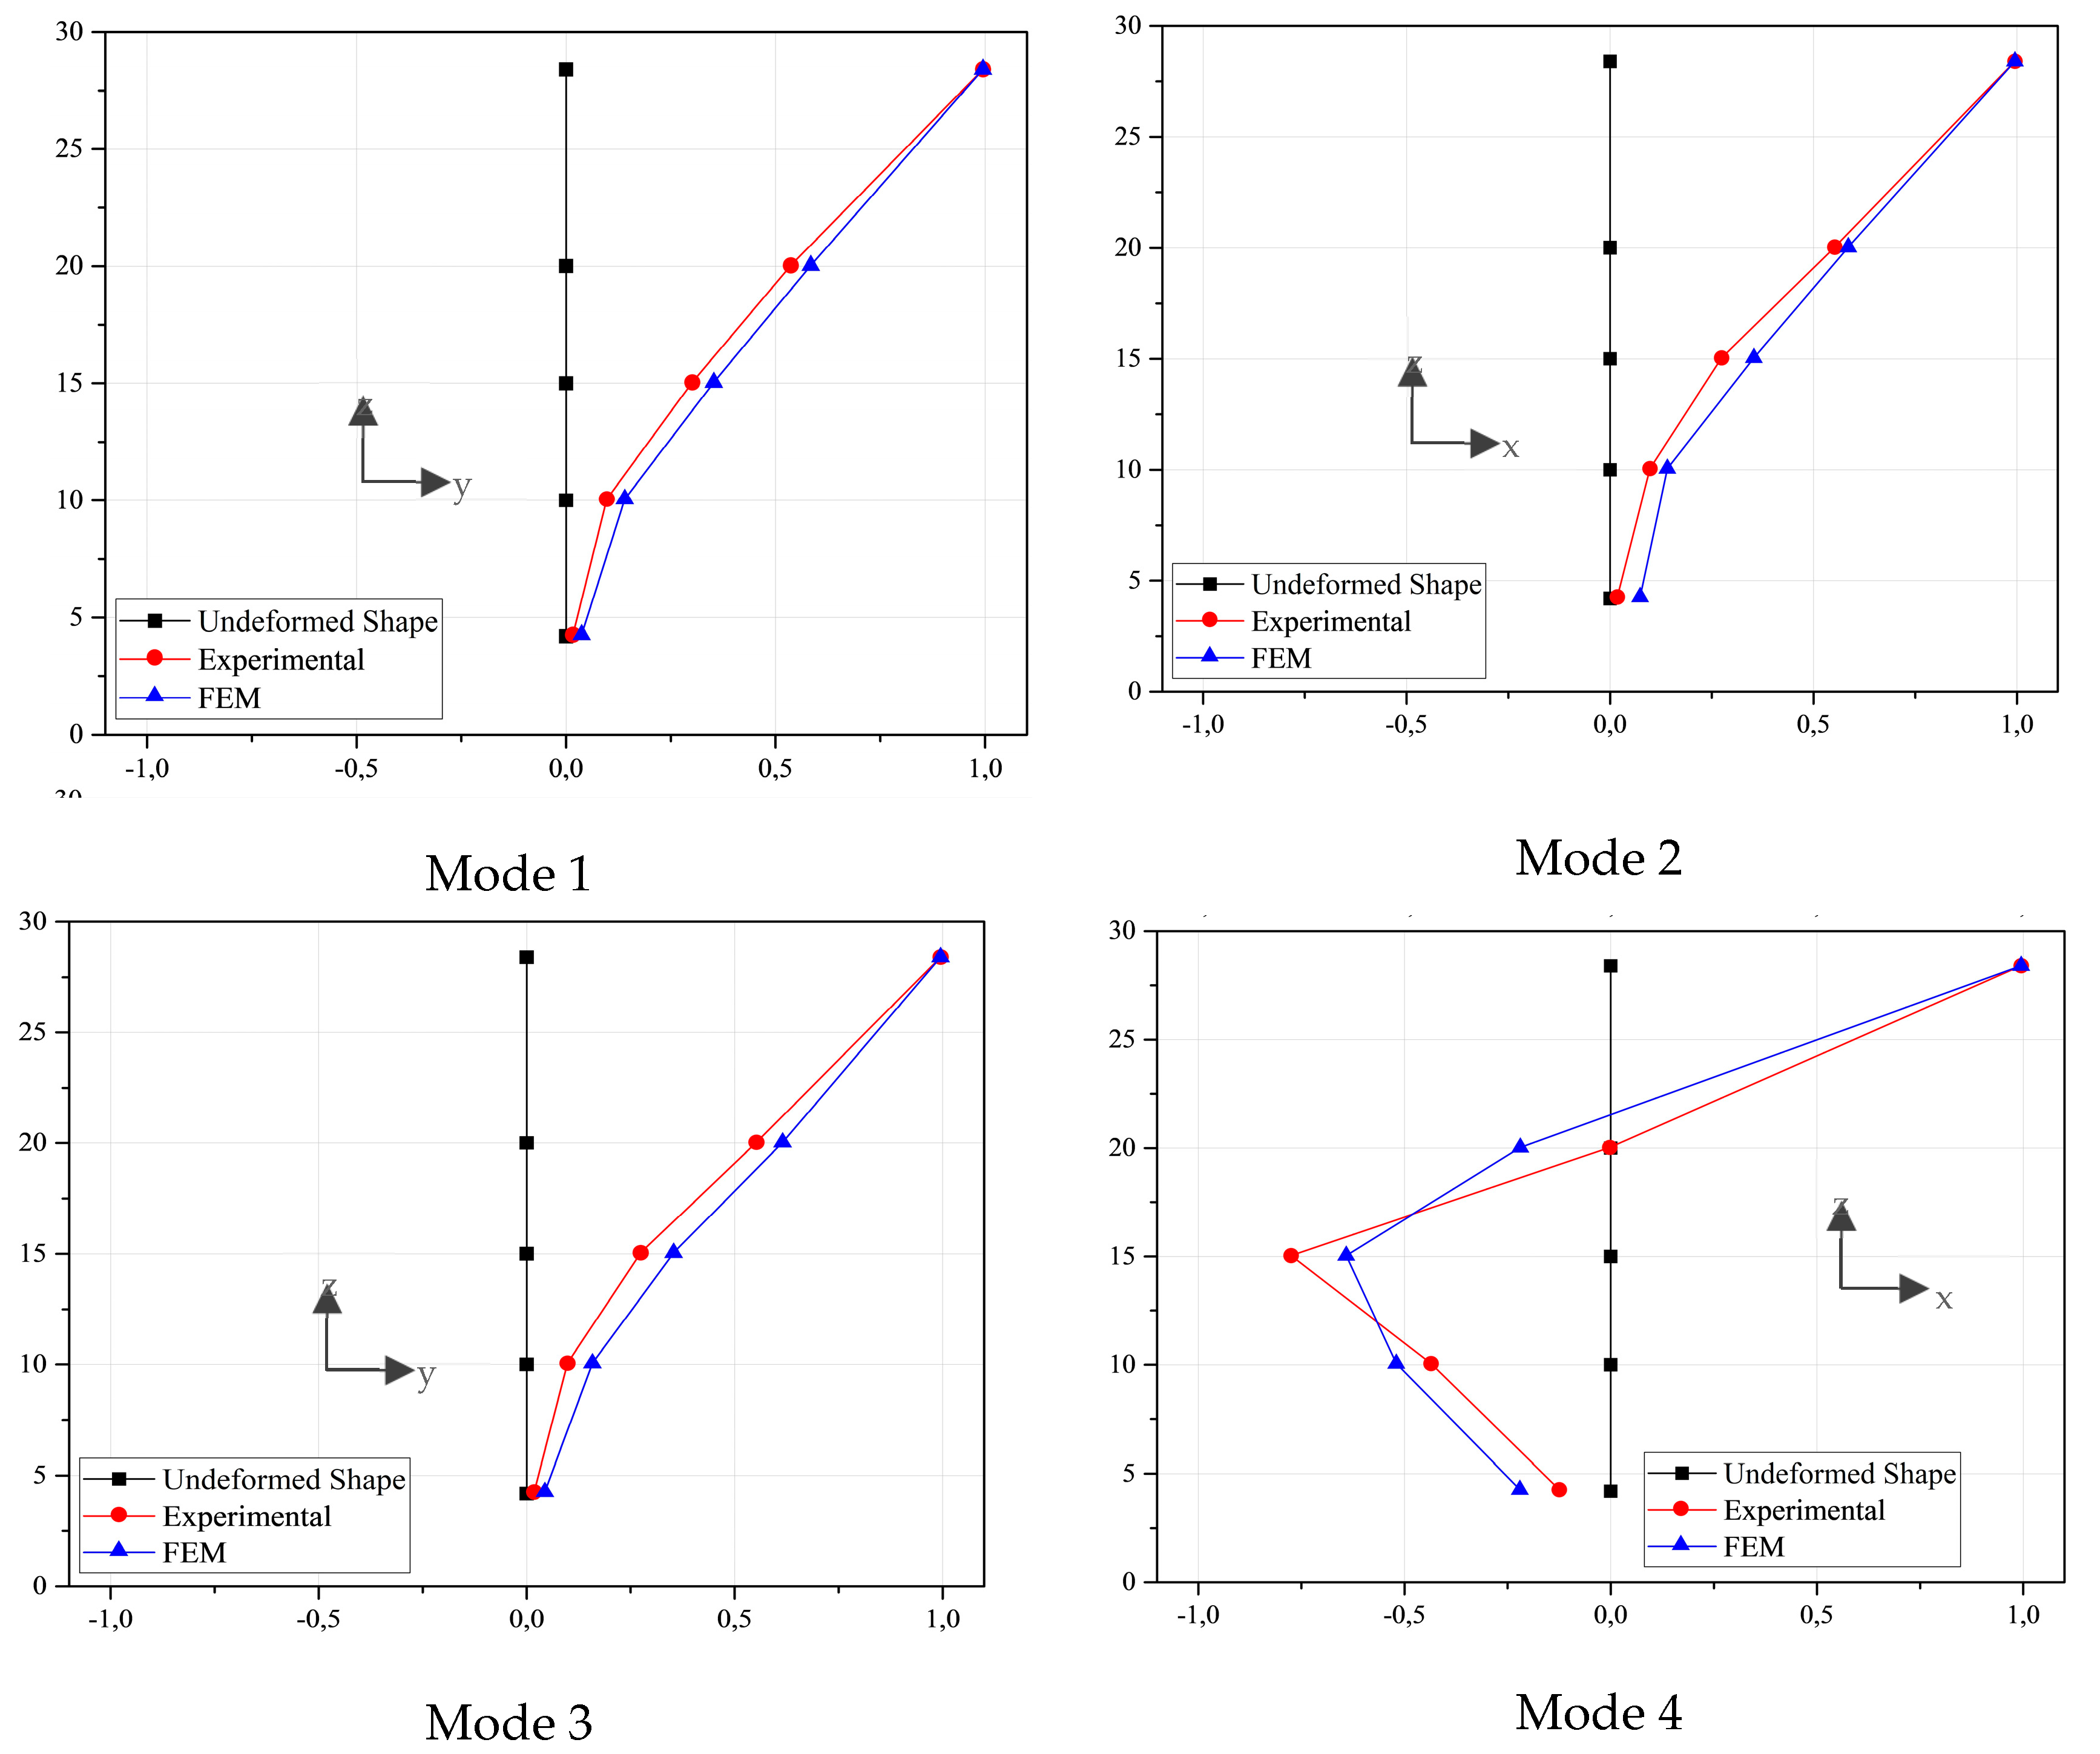
After the model-updating process, the frequency differences decreased by up to 2% (third frequency). Other frequency values revealed smaller differences. The third frequency revealed a minimum MAC value of 90.8% in the mode shapes of the various frequencies (third frequency). In other mode shapes, MAC values were determined as higher rates. Figure 9 presents a visual comparison of the mode shapes after the model updating.
Figure 9.
Visual comparison of the mode shapes after model updating.
3.4. Earthquake Analysis
Nonlinear time–history analyses were performed to evaluate the seismic response of the updated finite element model. The acceleration record obtained from station 8003, located 1.52 km from the minaret, was used as input ground motion for the analyses. The analyses were carried out considering material nonlinearity, allowing the simulation of damage progression and potential collapse mechanisms. The nonlinear material behavior of masonry was modeled by considering cracking in tension and crushing in compression. This approach allows the simulation of stiffness degradation and damage evolution under seismic loading conditions. Rayleigh damping was assumed, and a damping ratio of 5% was adopted, which is consistent with commonly accepted values for masonry structures reported in the literature. A step-by-step integration procedure was employed to ensure numerical stability and convergence during the nonlinear analysis. The results were evaluated in terms of displacement, stress distribution, and damage patterns.
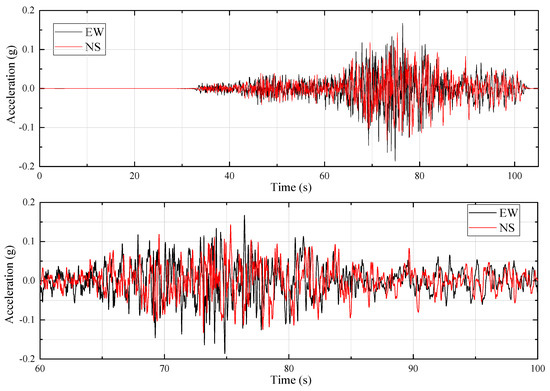
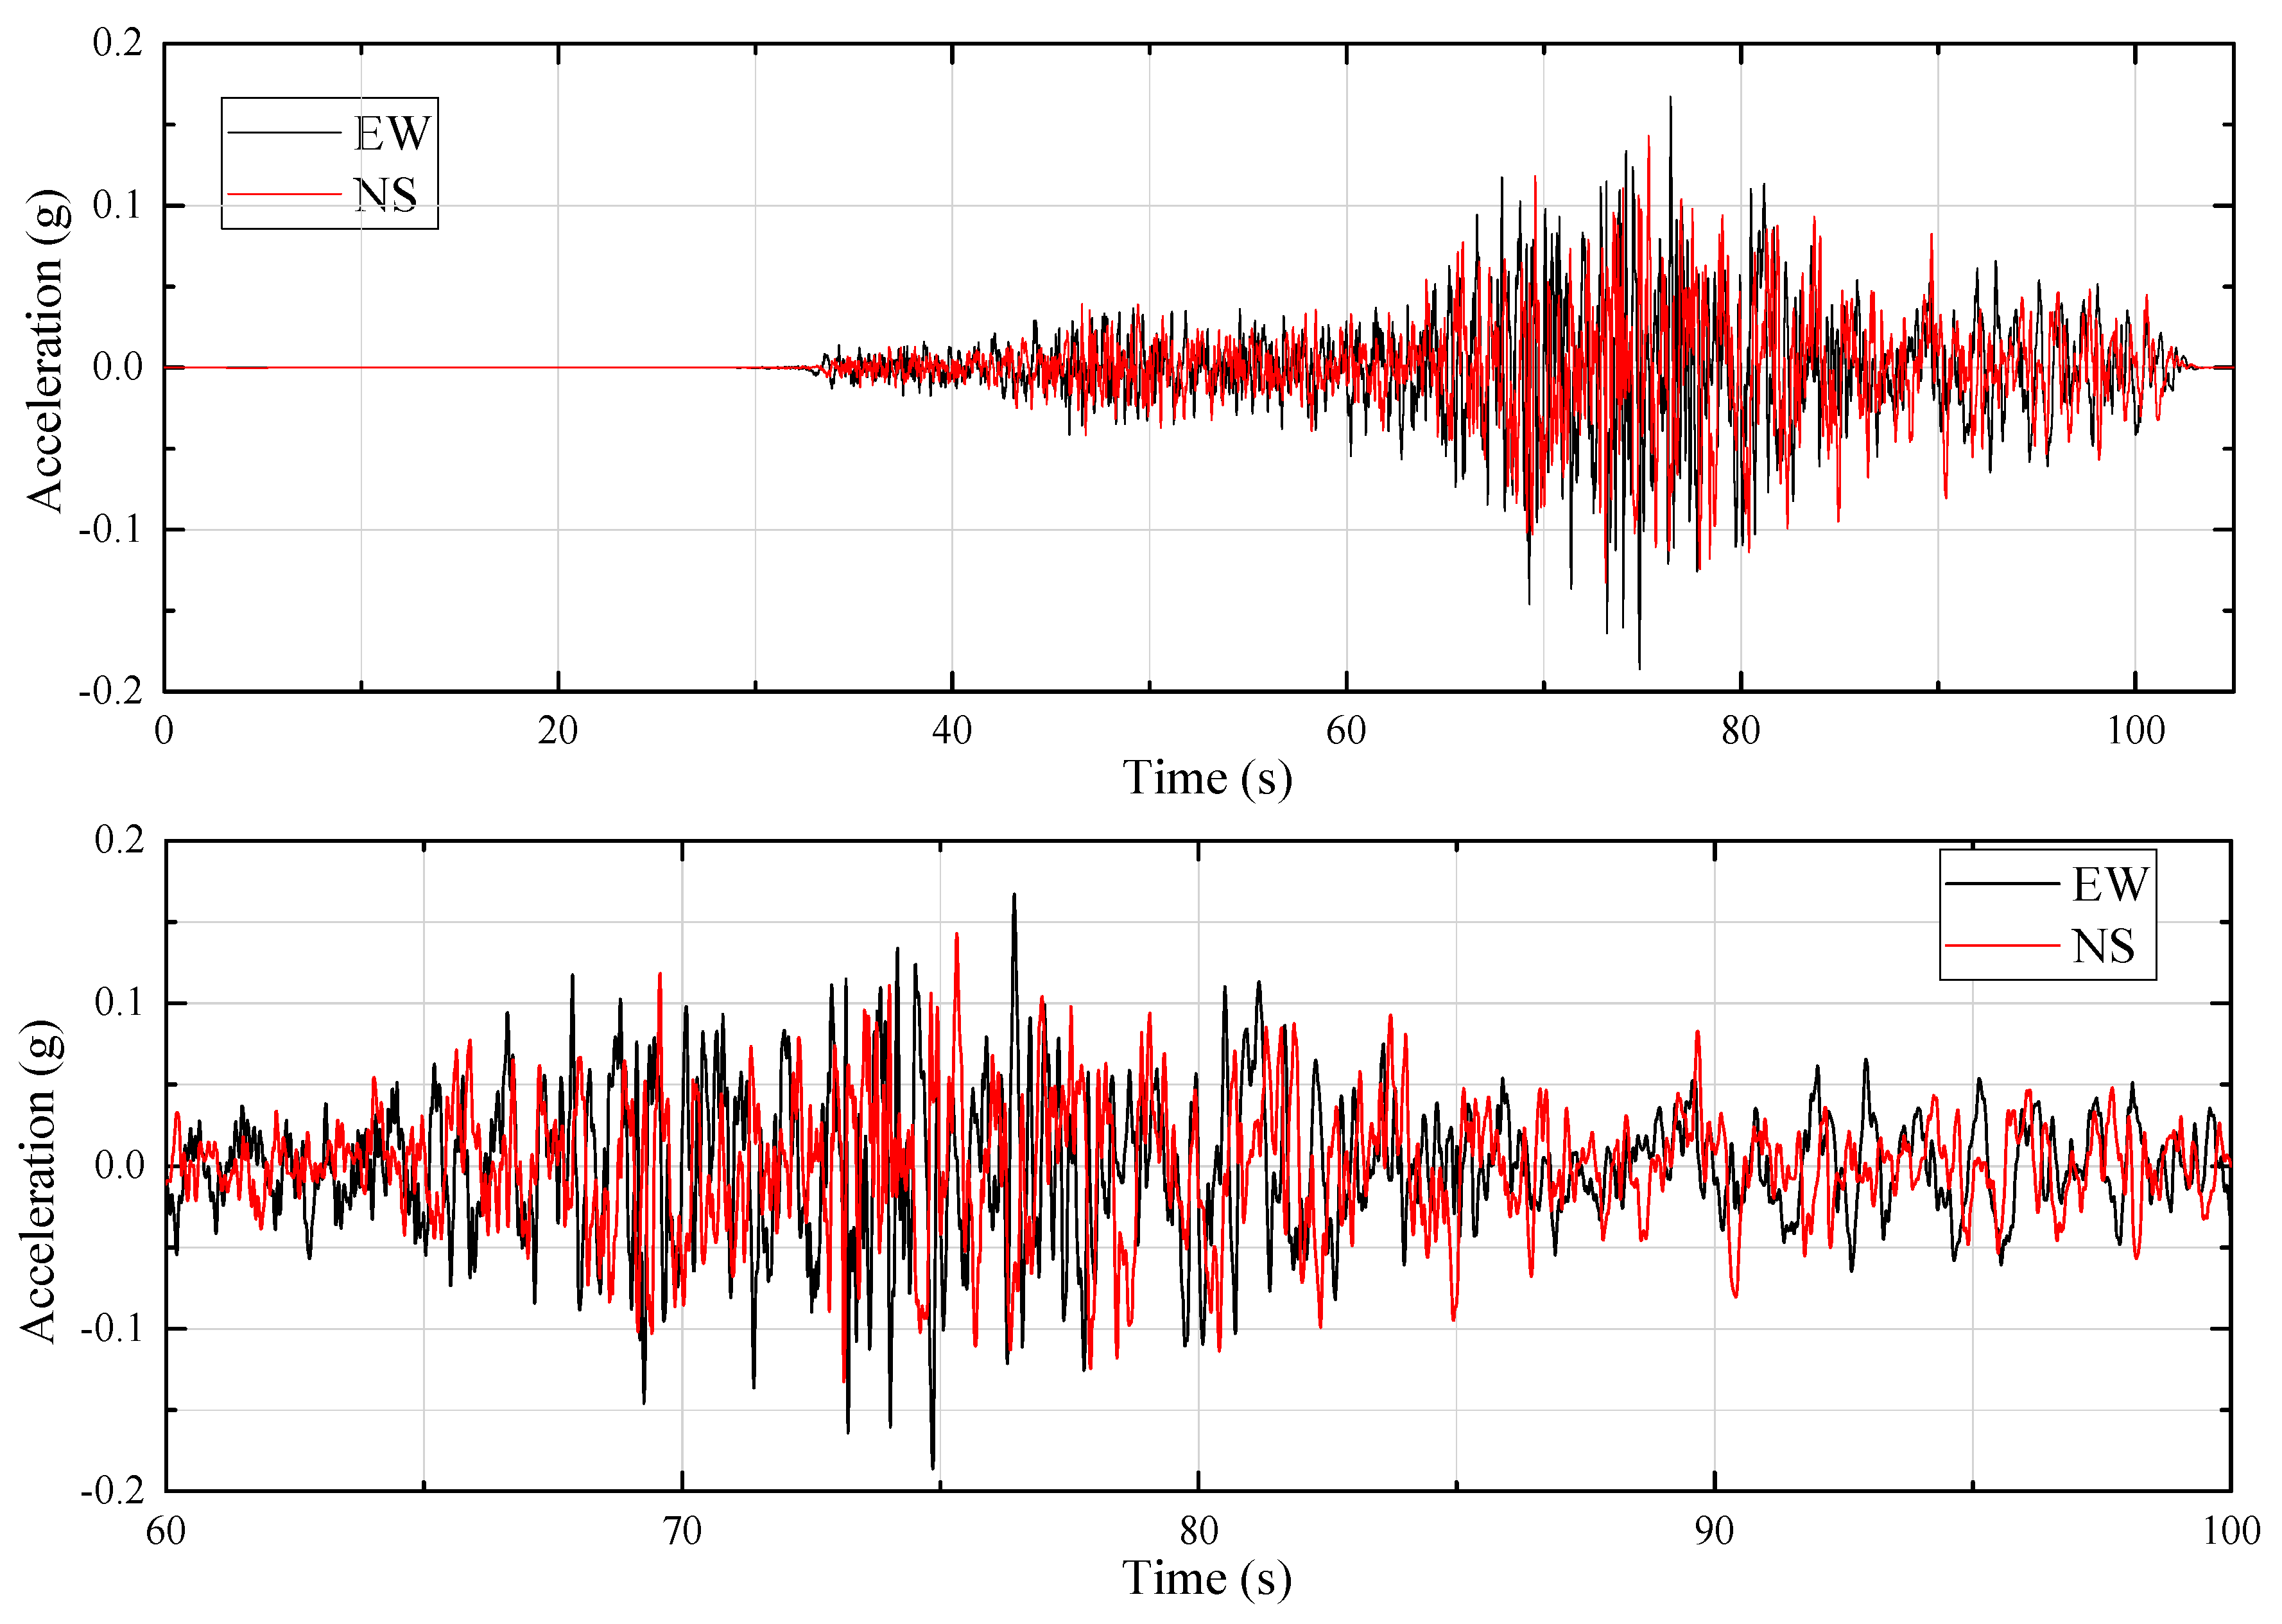
Nonlinear time–history analyses of the minaret were performed using the north–south (NS) and east–west (EW) components of the 6 February 2023 earthquake (first shock, Mw = 7.7) recorded at the Osmaniye (8003) station. The vertical component of the ground motion was not included in the analyses, as the primary focus of the study is on the lateral response and associated damage mechanisms of the structure, for which the horizontal components are generally considered to be the most influential in slender masonry systems. The acceleration records were used directly without scaling in order to preserve the actual characteristics of the earthquake. It was observed that significant acceleration amplitudes start approximately after the 60th second; therefore, the analyses were initiated from this point to focus on the strong-motion phase of the record and to improve computational efficiency. No additional filtering or signal modification was applied. Figure 10 presents the earthquake acceleration components.
Figure 10.
The north–south (NS) and east–west (EW) components of the Osmaniye (8003) station.
In time–history analyses, two earthquake acceleration components were applied to the structure simultaneously. Then, these acceleration components were rotated by 90°, and the analyses were repeated. The analyses where the north-south component was applied in the x direction and the east-west component in the y direction were labelled as NSx/EWy, and the analyses where the north-south component was applied in the y direction and the east-west component in the x direction were labelled as NSy/EWx.
For the finite element model, the nonlinear behavior of the material was considered with the Drucker Prager criterion. For this criterion, the cohesion was chosen as 3.08 MPa, and the internal friction angle and dilatation angle were chosen as 37°. In addition, the soil domain is considered as linear elastic. Mass is neglected for this domain.
4. Analysis Results and Discussions
The evaluation of nonlinear seismic solutions for the minaret took into account peak displacement, base shear forces, and principal stresses.
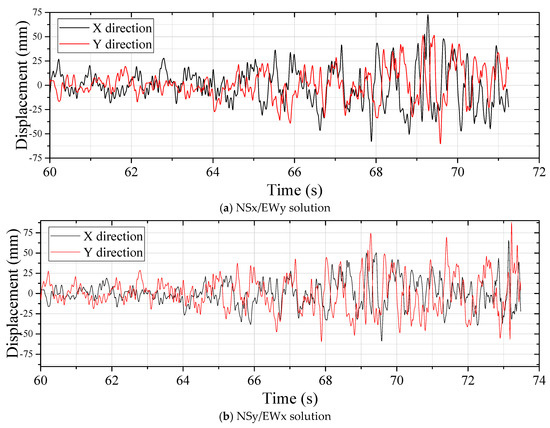
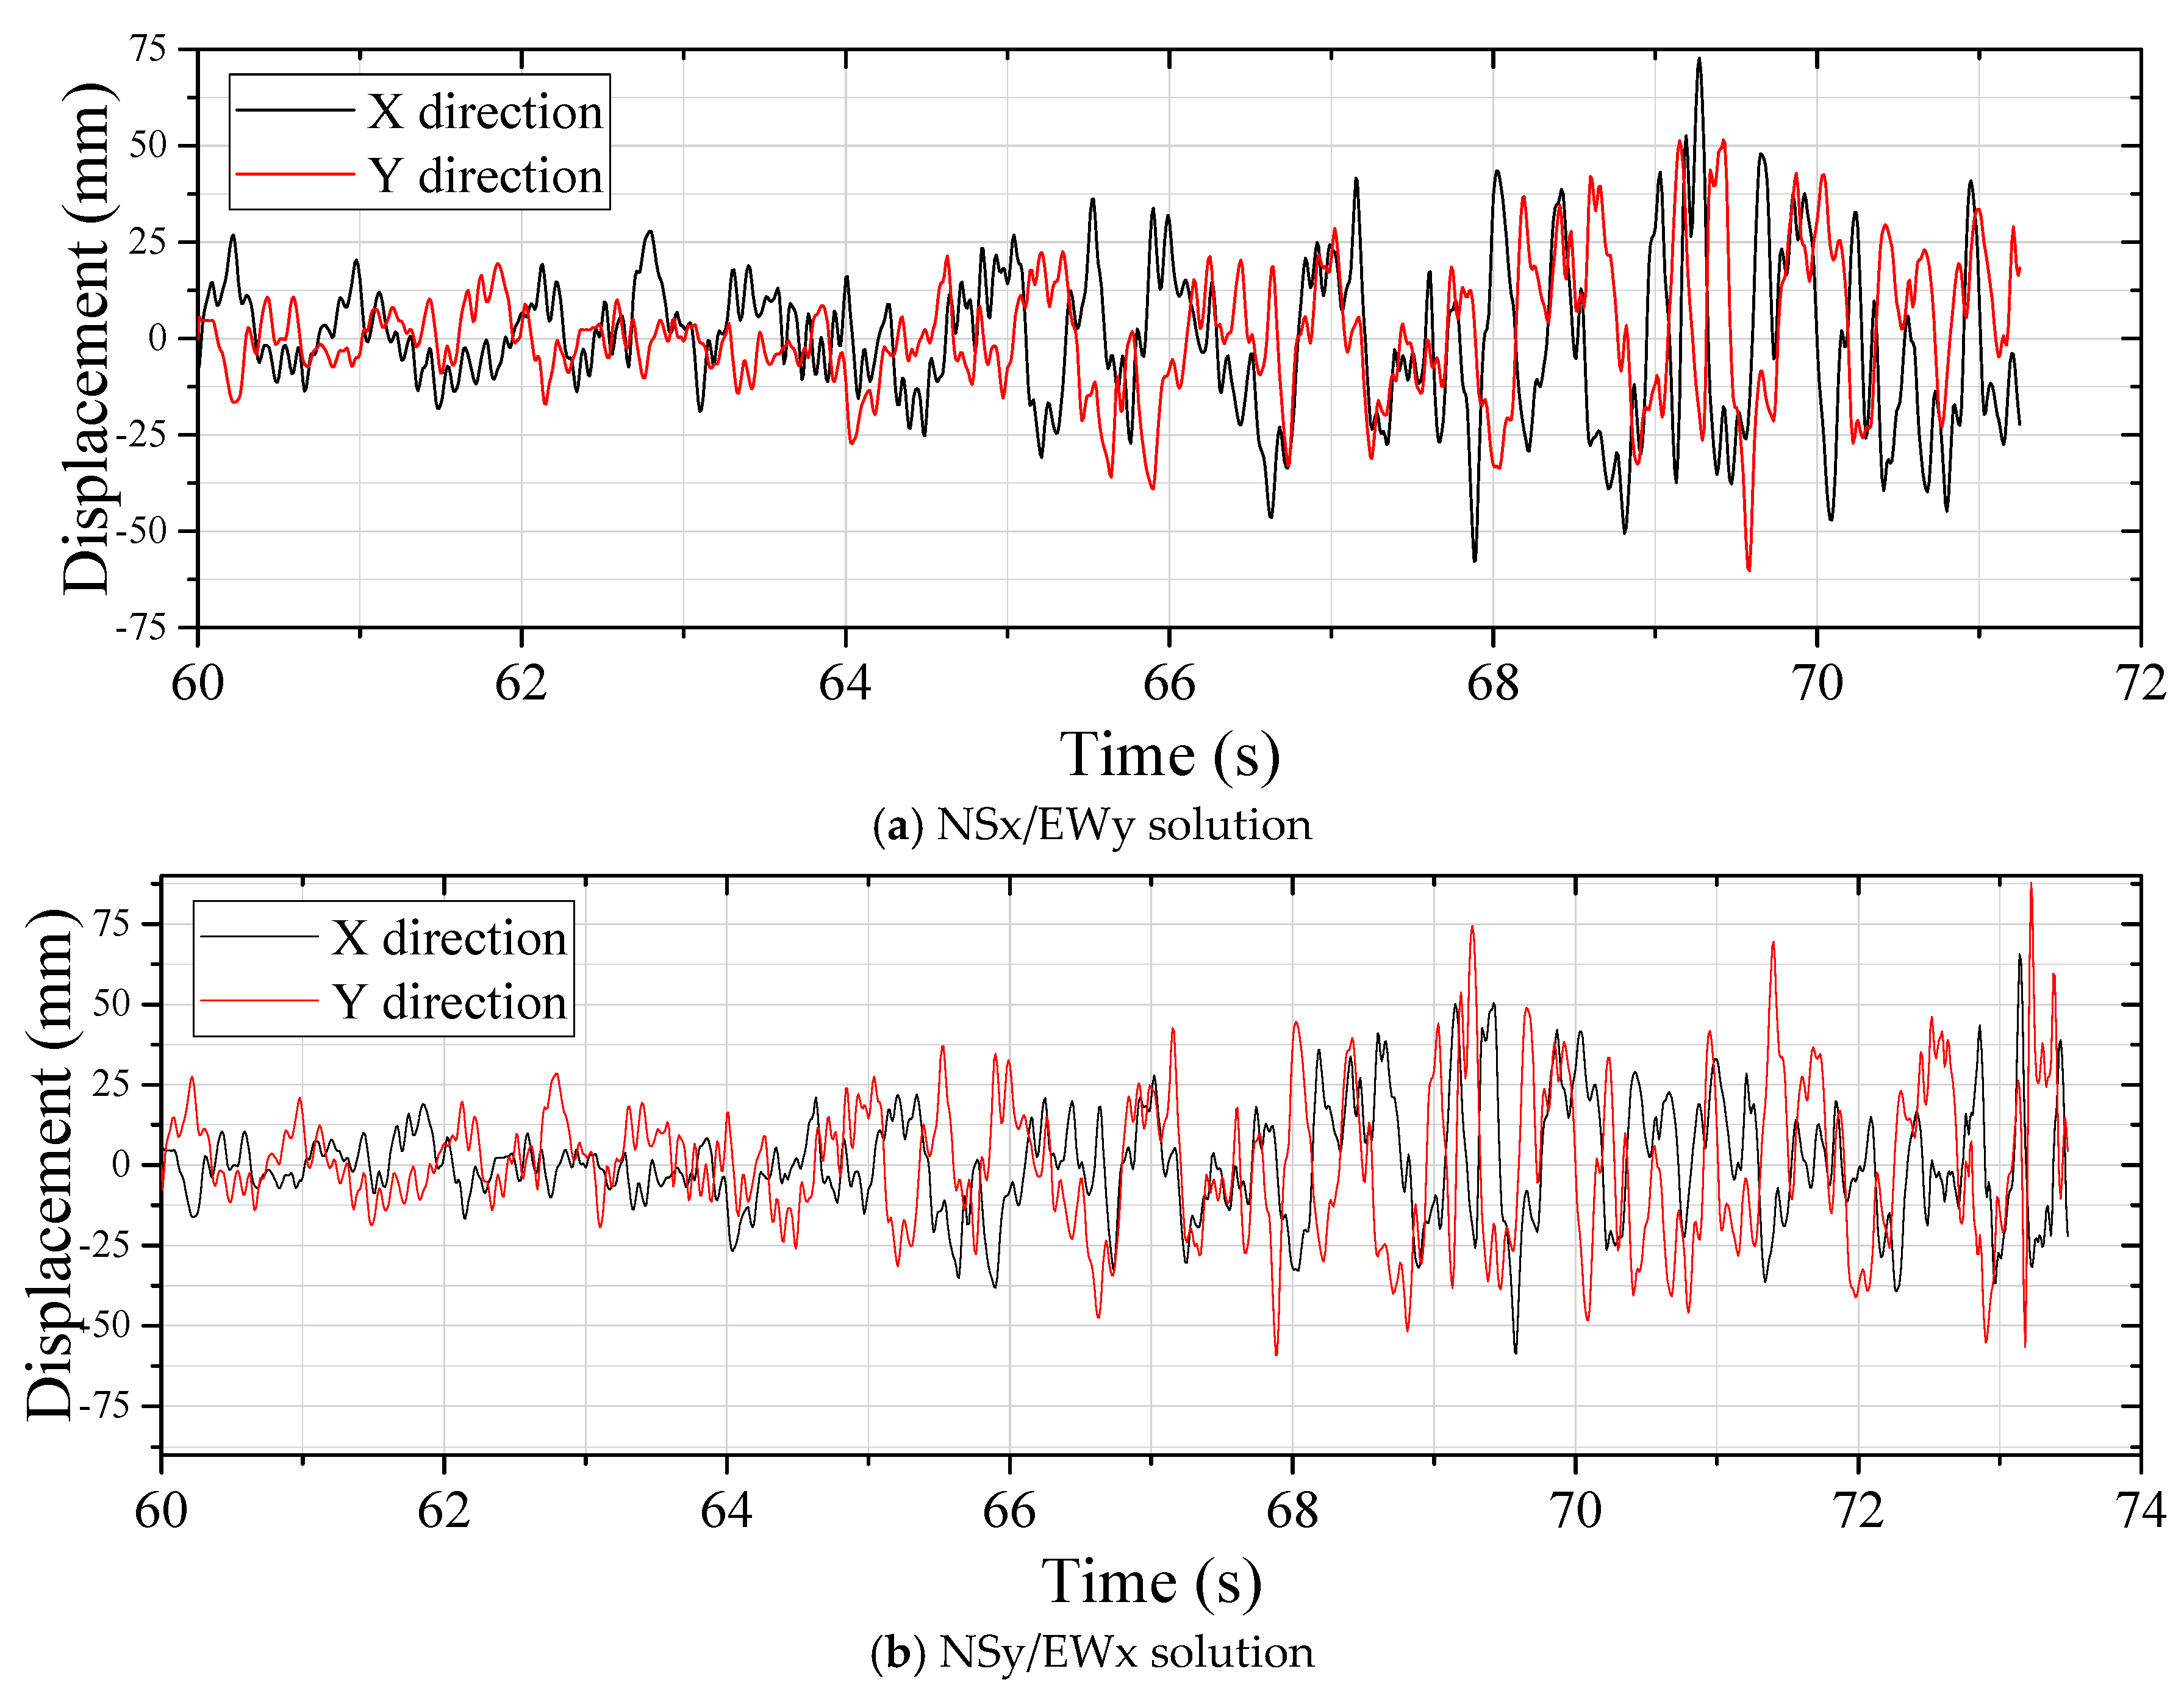
- Peak displacements obtained from both solutions were of comparable magnitude. The maximum displacement values were 72.82 mm in the x-direction (NSx/EWy) and 87.90 mm in the y-direction (NSy/EWx), with corresponding orthogonal values of 60.28 mm and 65.54 mm, respectively. Figure 11 presents the variation of peak displacements with time.
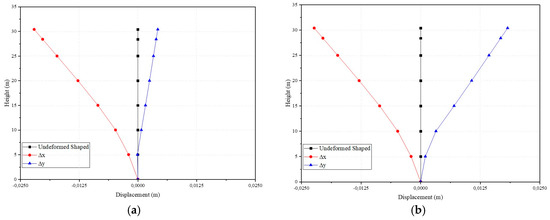
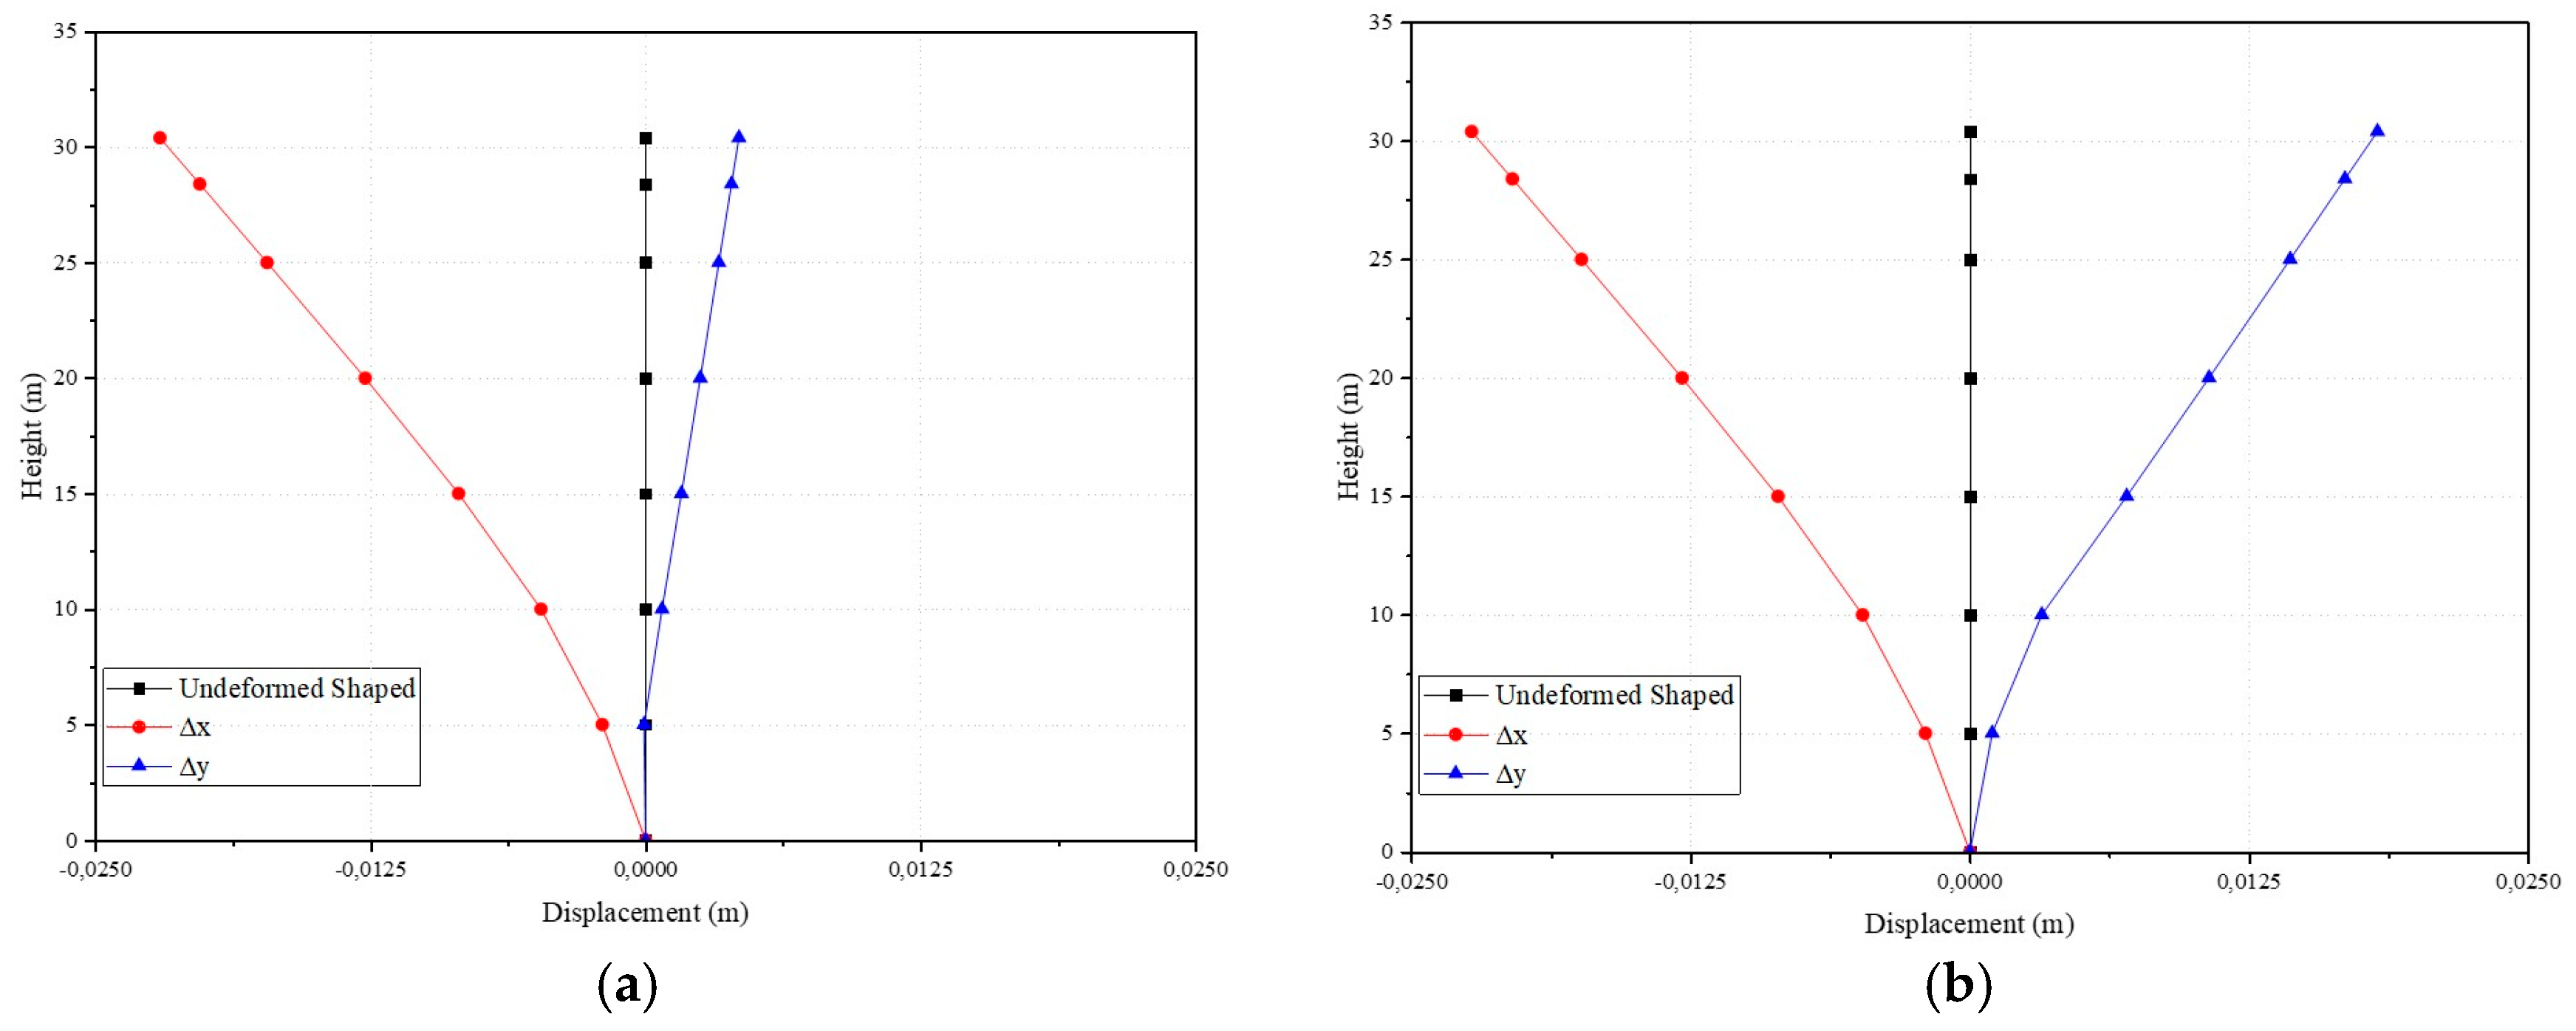
- The variation of absolute lateral displacement along the height of the minaret is presented in Figure 12. As expected, displacement values increase with height due to the cantilever-like behavior of the structure. This distribution provides insight into the overall deformation profile of the minaret under seismic loading.
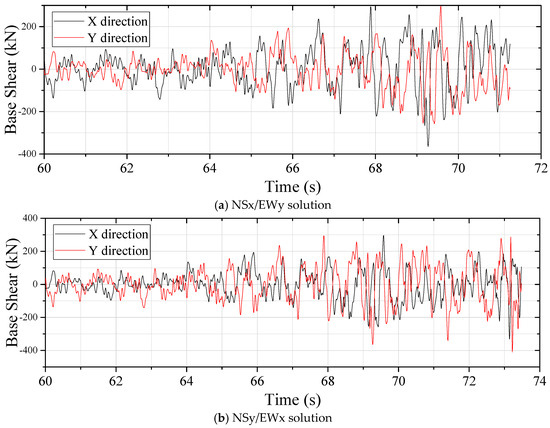
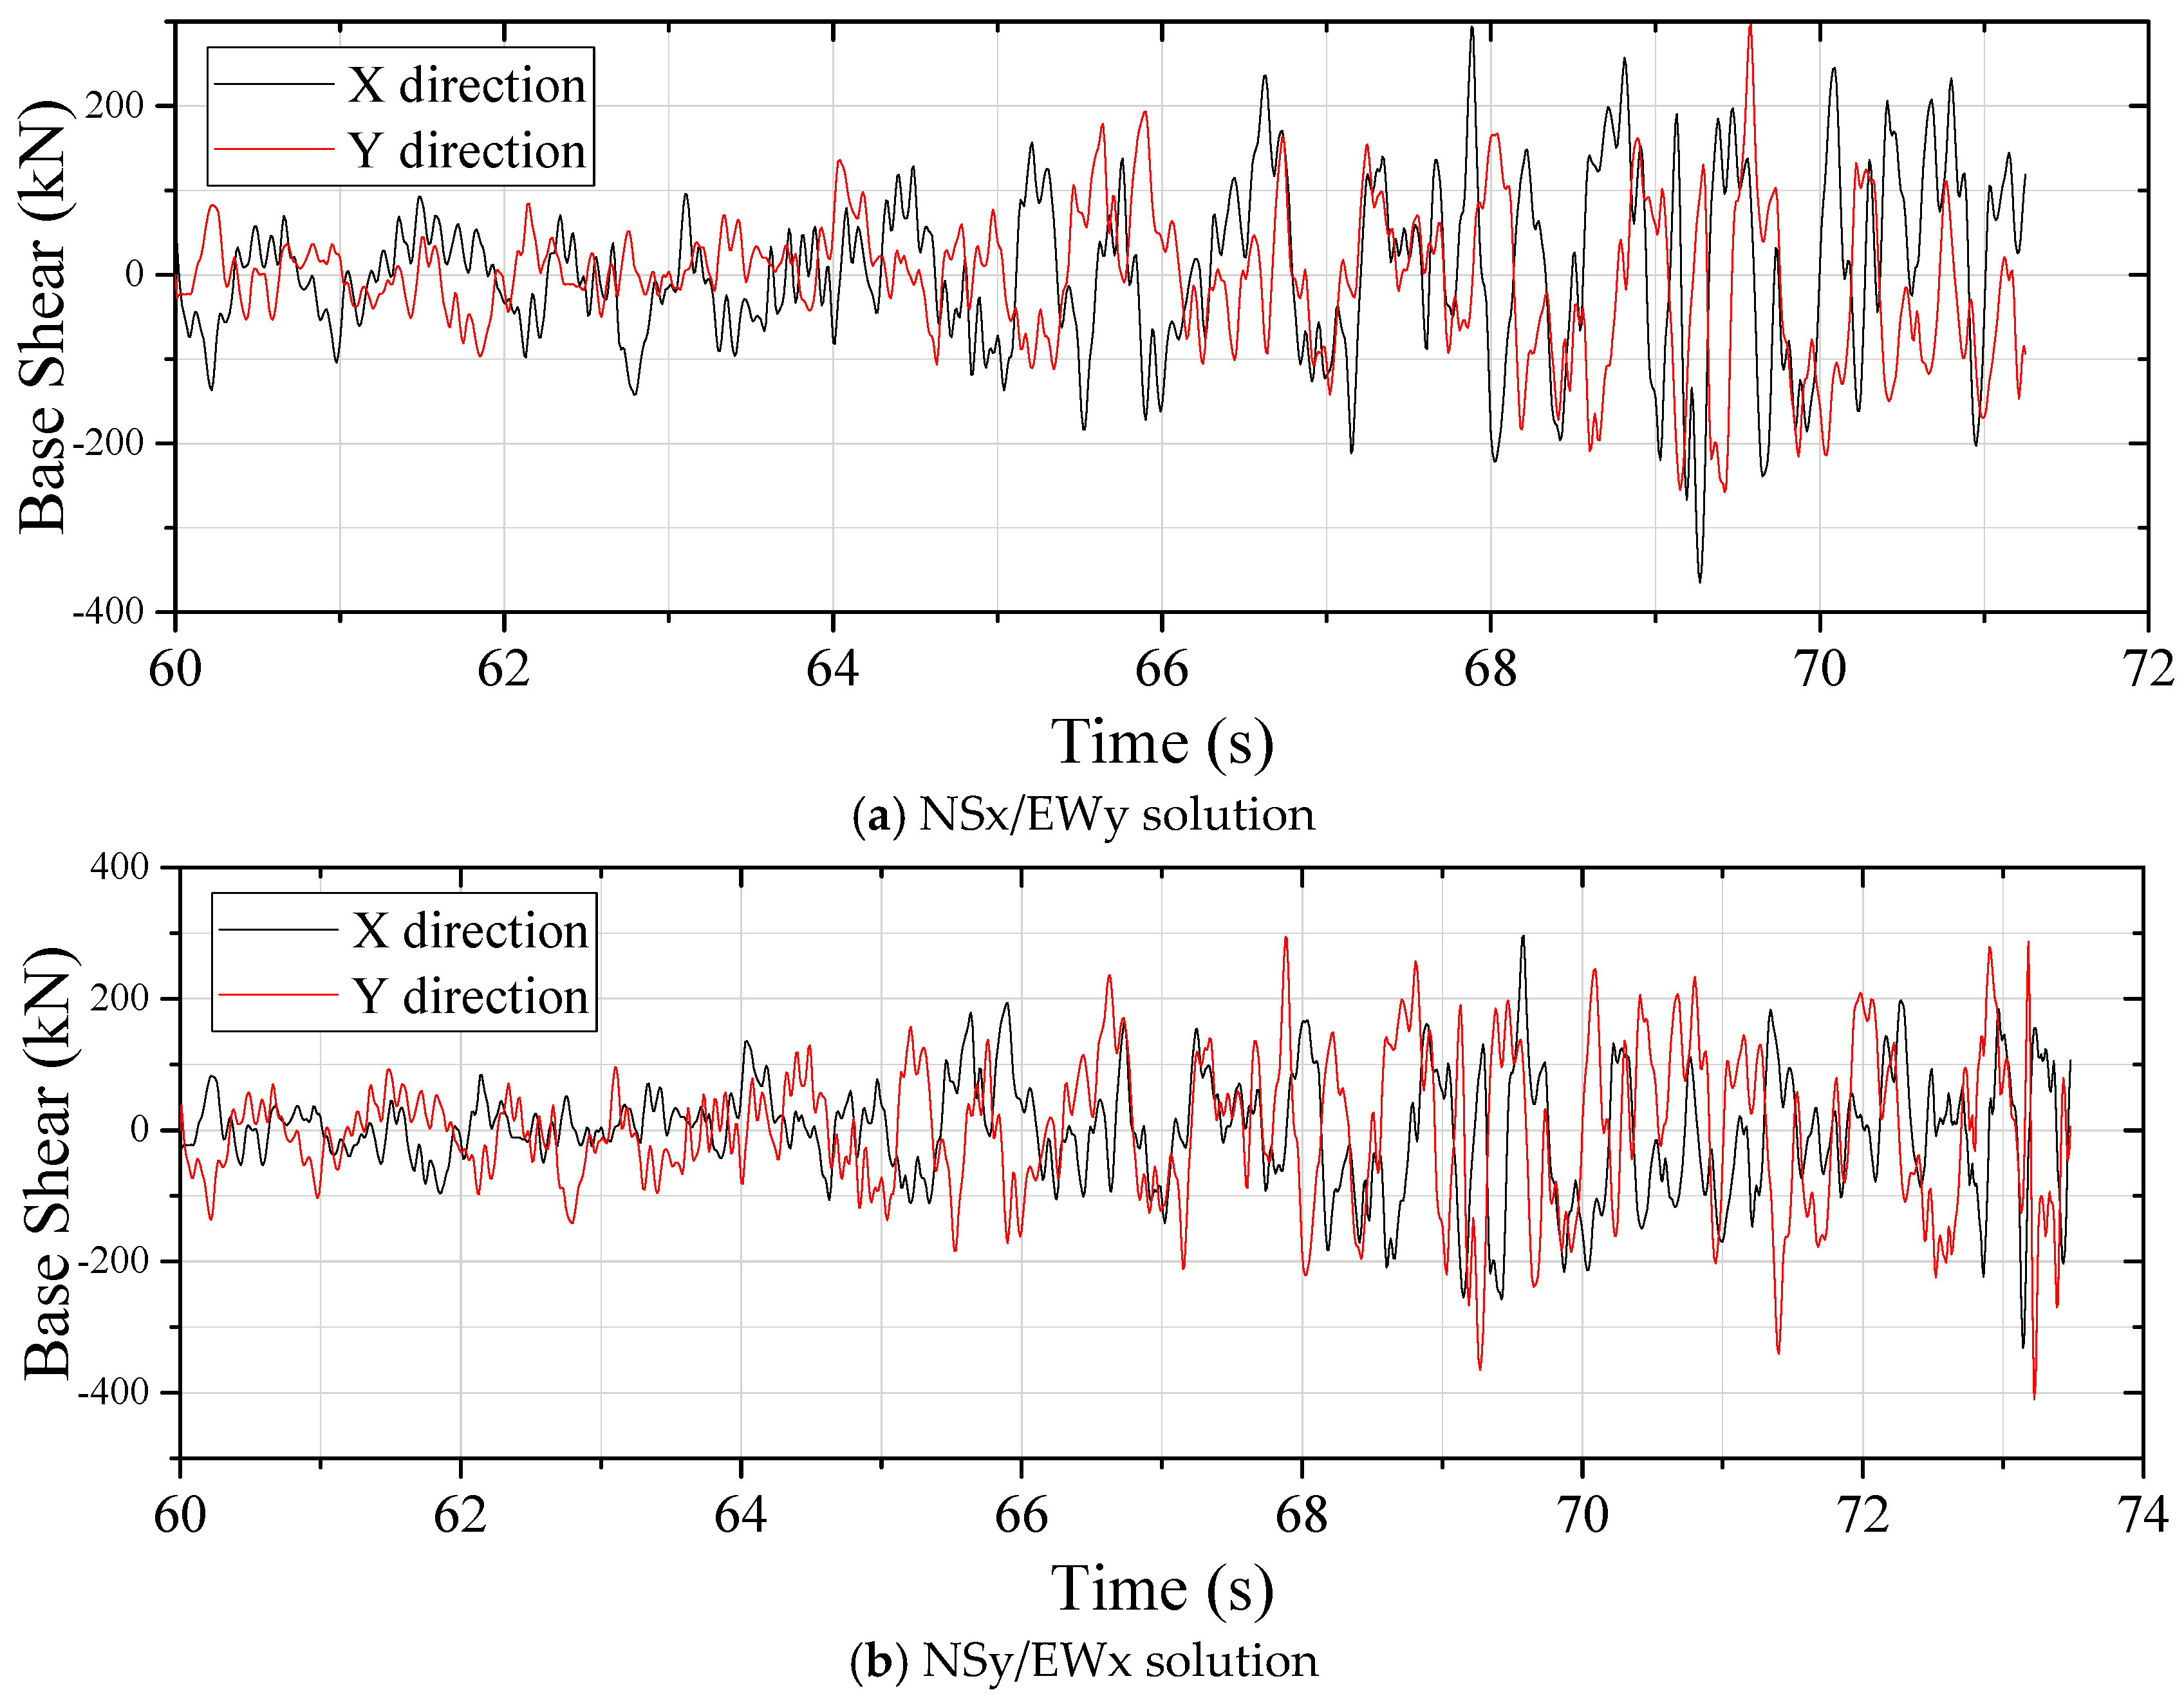
- Base shear forces obtained from both analyses also showed similar trends. The maximum base shear values were 364.99 kN (x-direction, NSx/EWy) and 410.56 kN (y-direction, NSy/EWx), while the corresponding orthogonal values were 296.41 kN and 331.86 kN, respectively. Figure 13 presents the variation of base shear forces with time.
- Table 4 presents the absolute maximum values of the peak displacement and base shear force for both solutions. The similarity between these values can be attributed to the approximately symmetrical geometry of the minaret, while minor differences arise from local geometric irregularities such as openings.
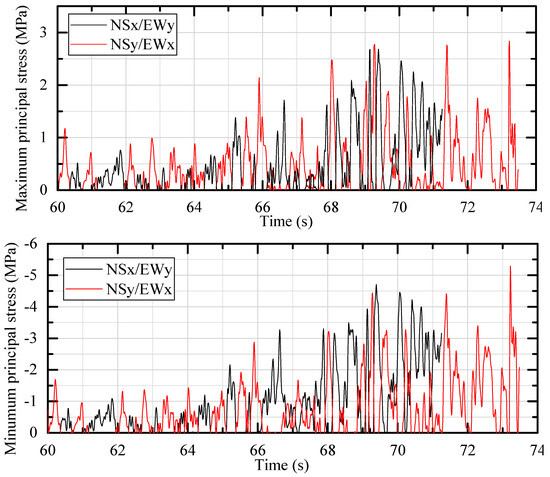
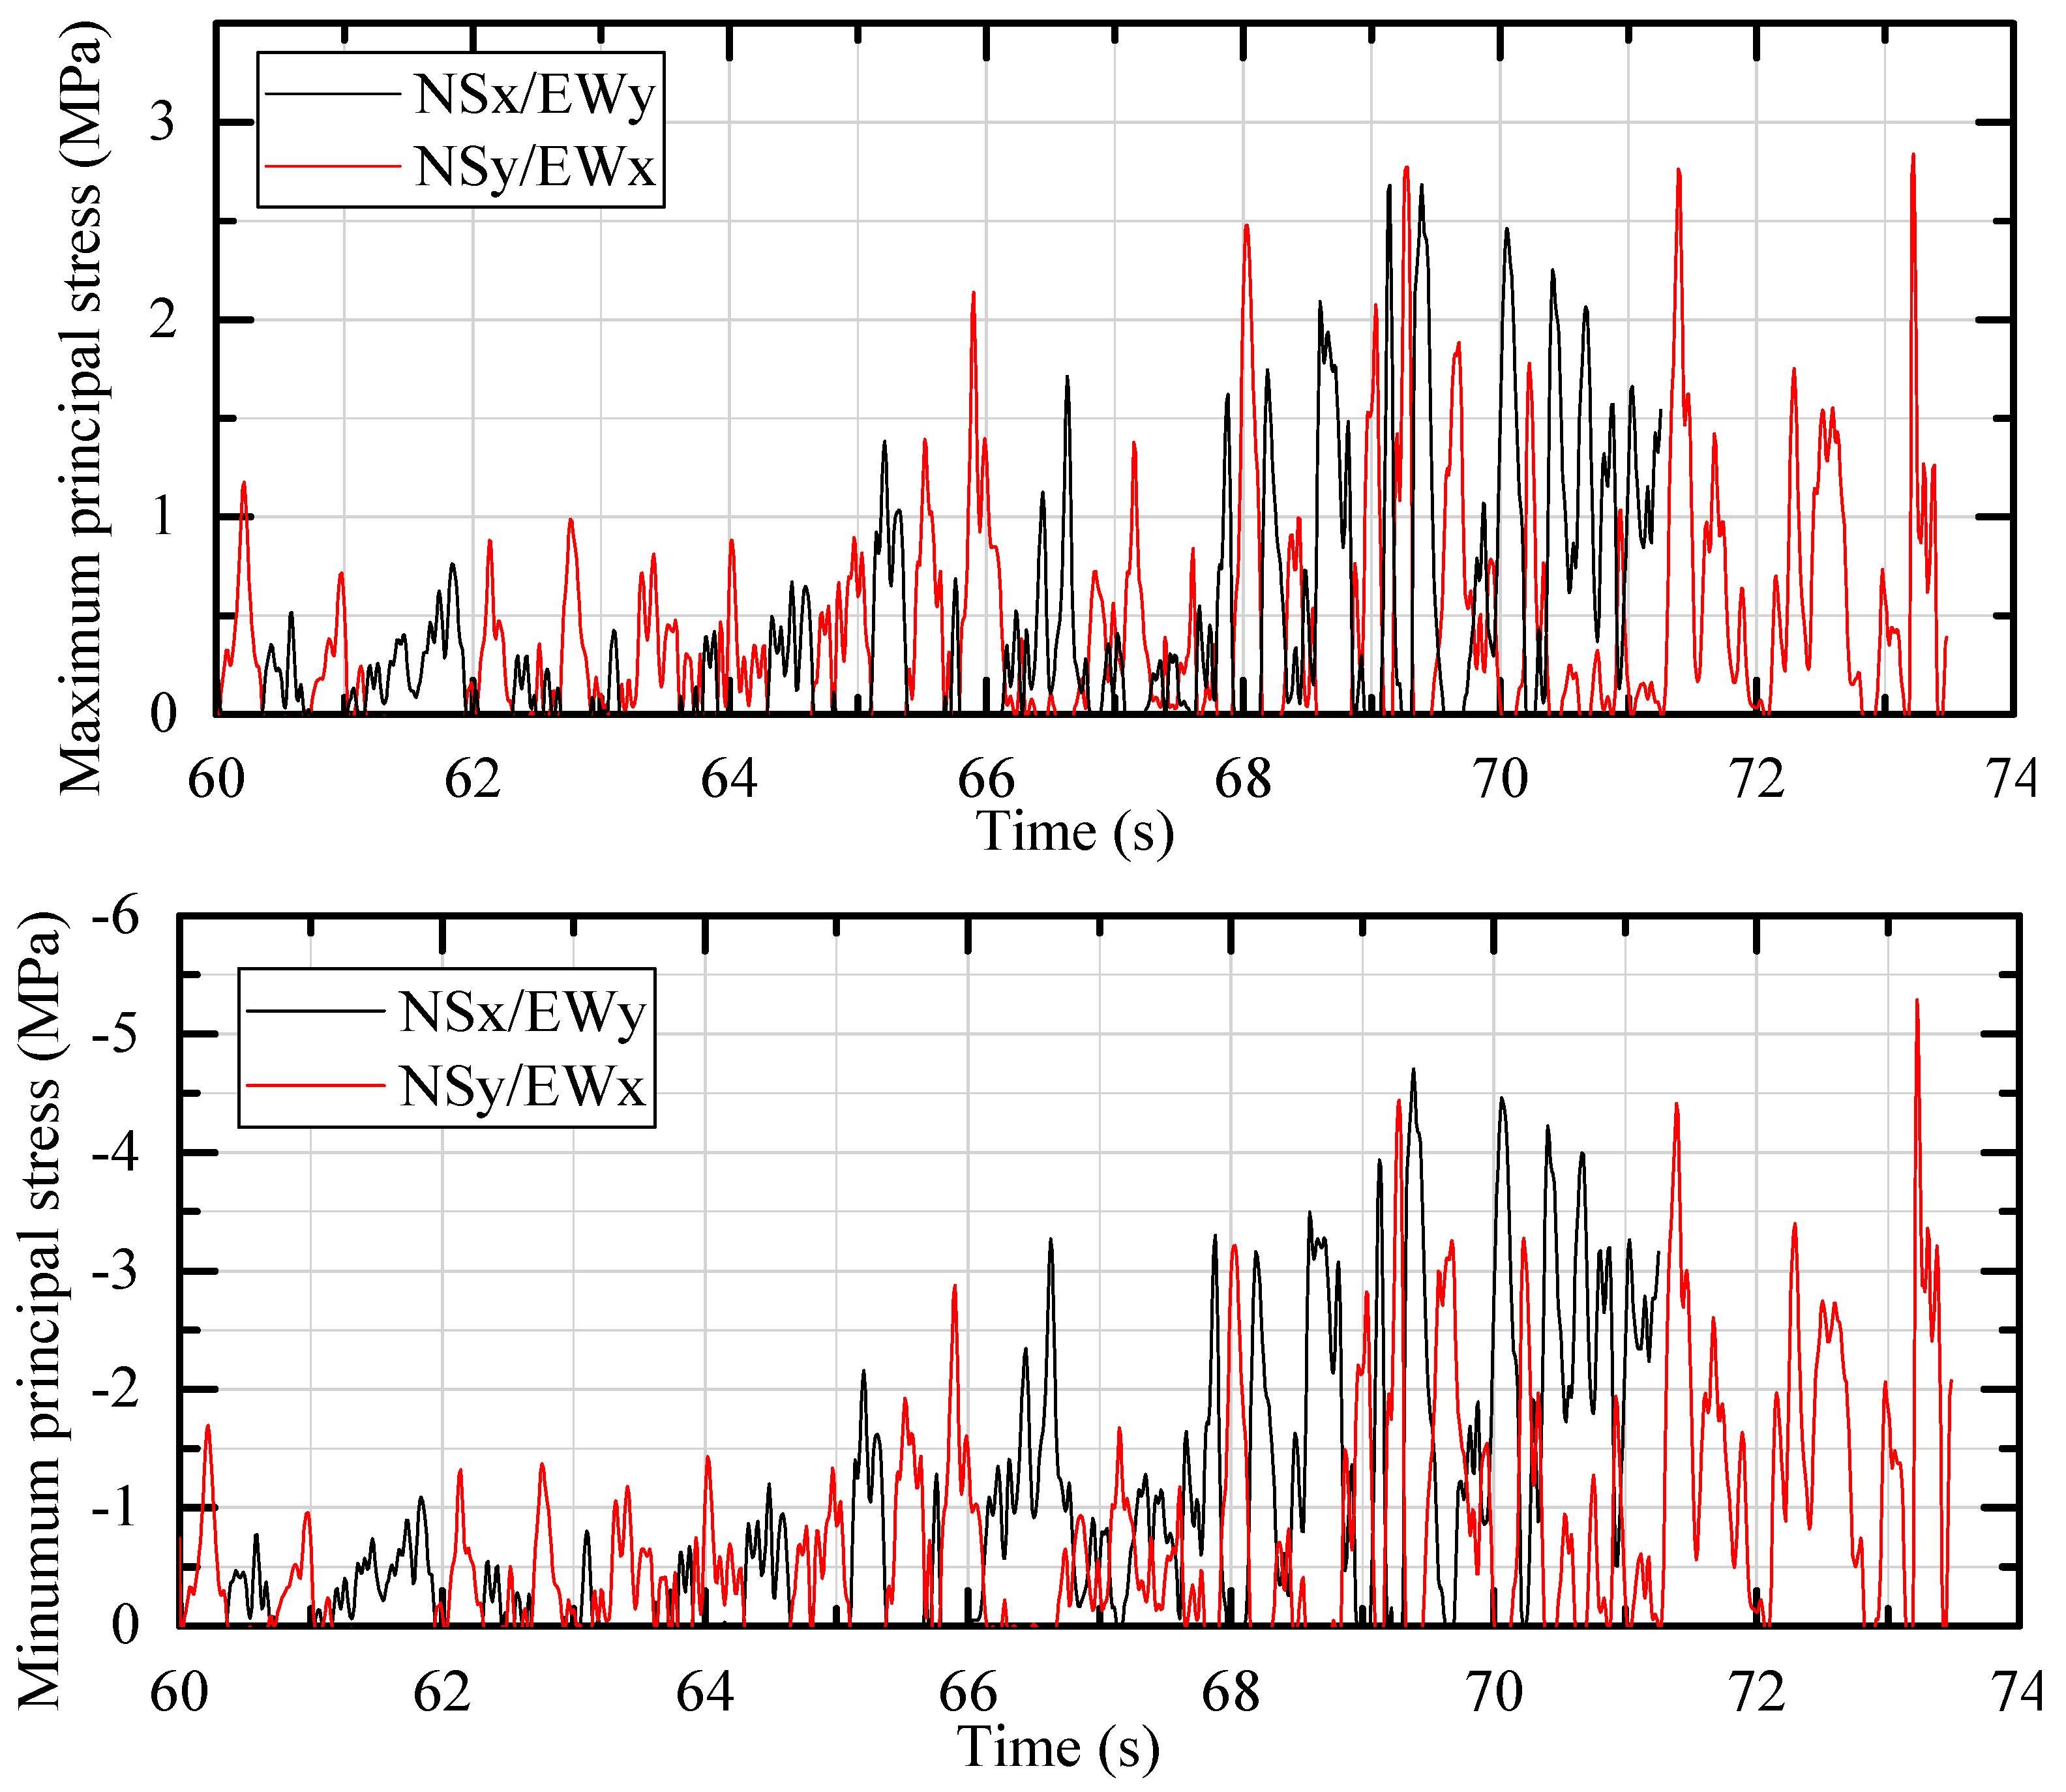
- The principal stress results indicate that the maximum principal stresses reached 2.68 MPa and 2.84 MPa for the NSx/EWy and NSy/EWx solutions, respectively. The absolute maximum values for the minimum principal stresses were obtained as 4.70 MPa and 5.29 MPa for the NSx/EWy and NSy/EWx solutions, respectively (Table 5). To evaluate the stress levels obtained from the nonlinear analyses, the compressive and tensile strengths of the masonry material were taken into account. According to the recommendation in Eurocode 6, the elasticity modulus of the masonry minaret was calculated using the equation E = 1000 fc, where E represents the elasticity modulus and fc denotes the compressive strength. Following the model-updating process, the elasticity modulus was considered to be 22,000 MPa for materials E1, E2, and E3, and 18,000 MPa for material E4. Accordingly, the compressive strength was taken as 22 MPa (for materials E1–E3) and 18 MPa (for material E4). Assuming that the tensile strength of the masonry is approximately 10% of its compressive strength, the tensile strength was accepted as 2.2 MPa (for materials E1–E3) and 1.8 MPa (for material E4). These values exceed the estimated tensile strength of the masonry in certain regions, indicating localized damage potential. In contrast, the minimum principal stresses remained below the compressive strength, suggesting a low likelihood of compressive failure (Table 5).
- The distribution of principal stresses shows similar trends for both loading cases. Figure 14 presents the variation of principal stresses with time.
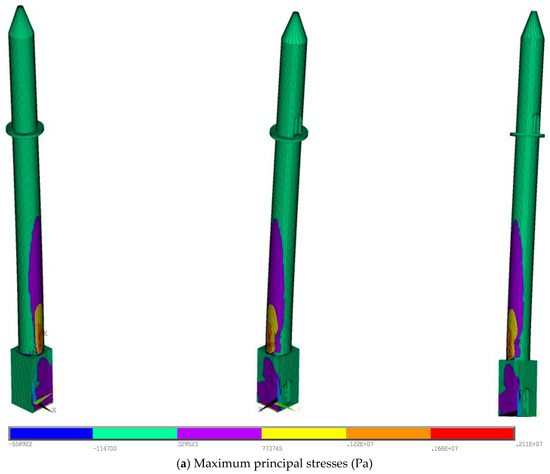
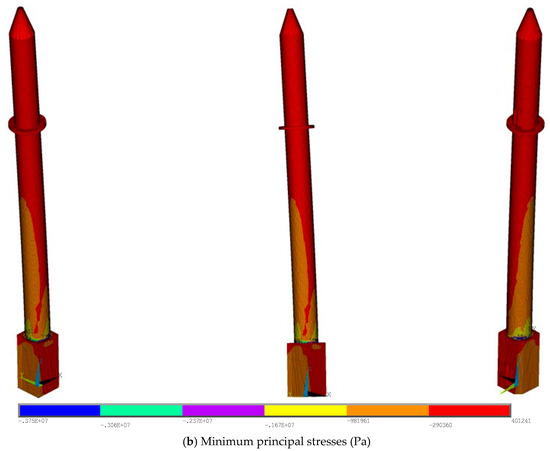
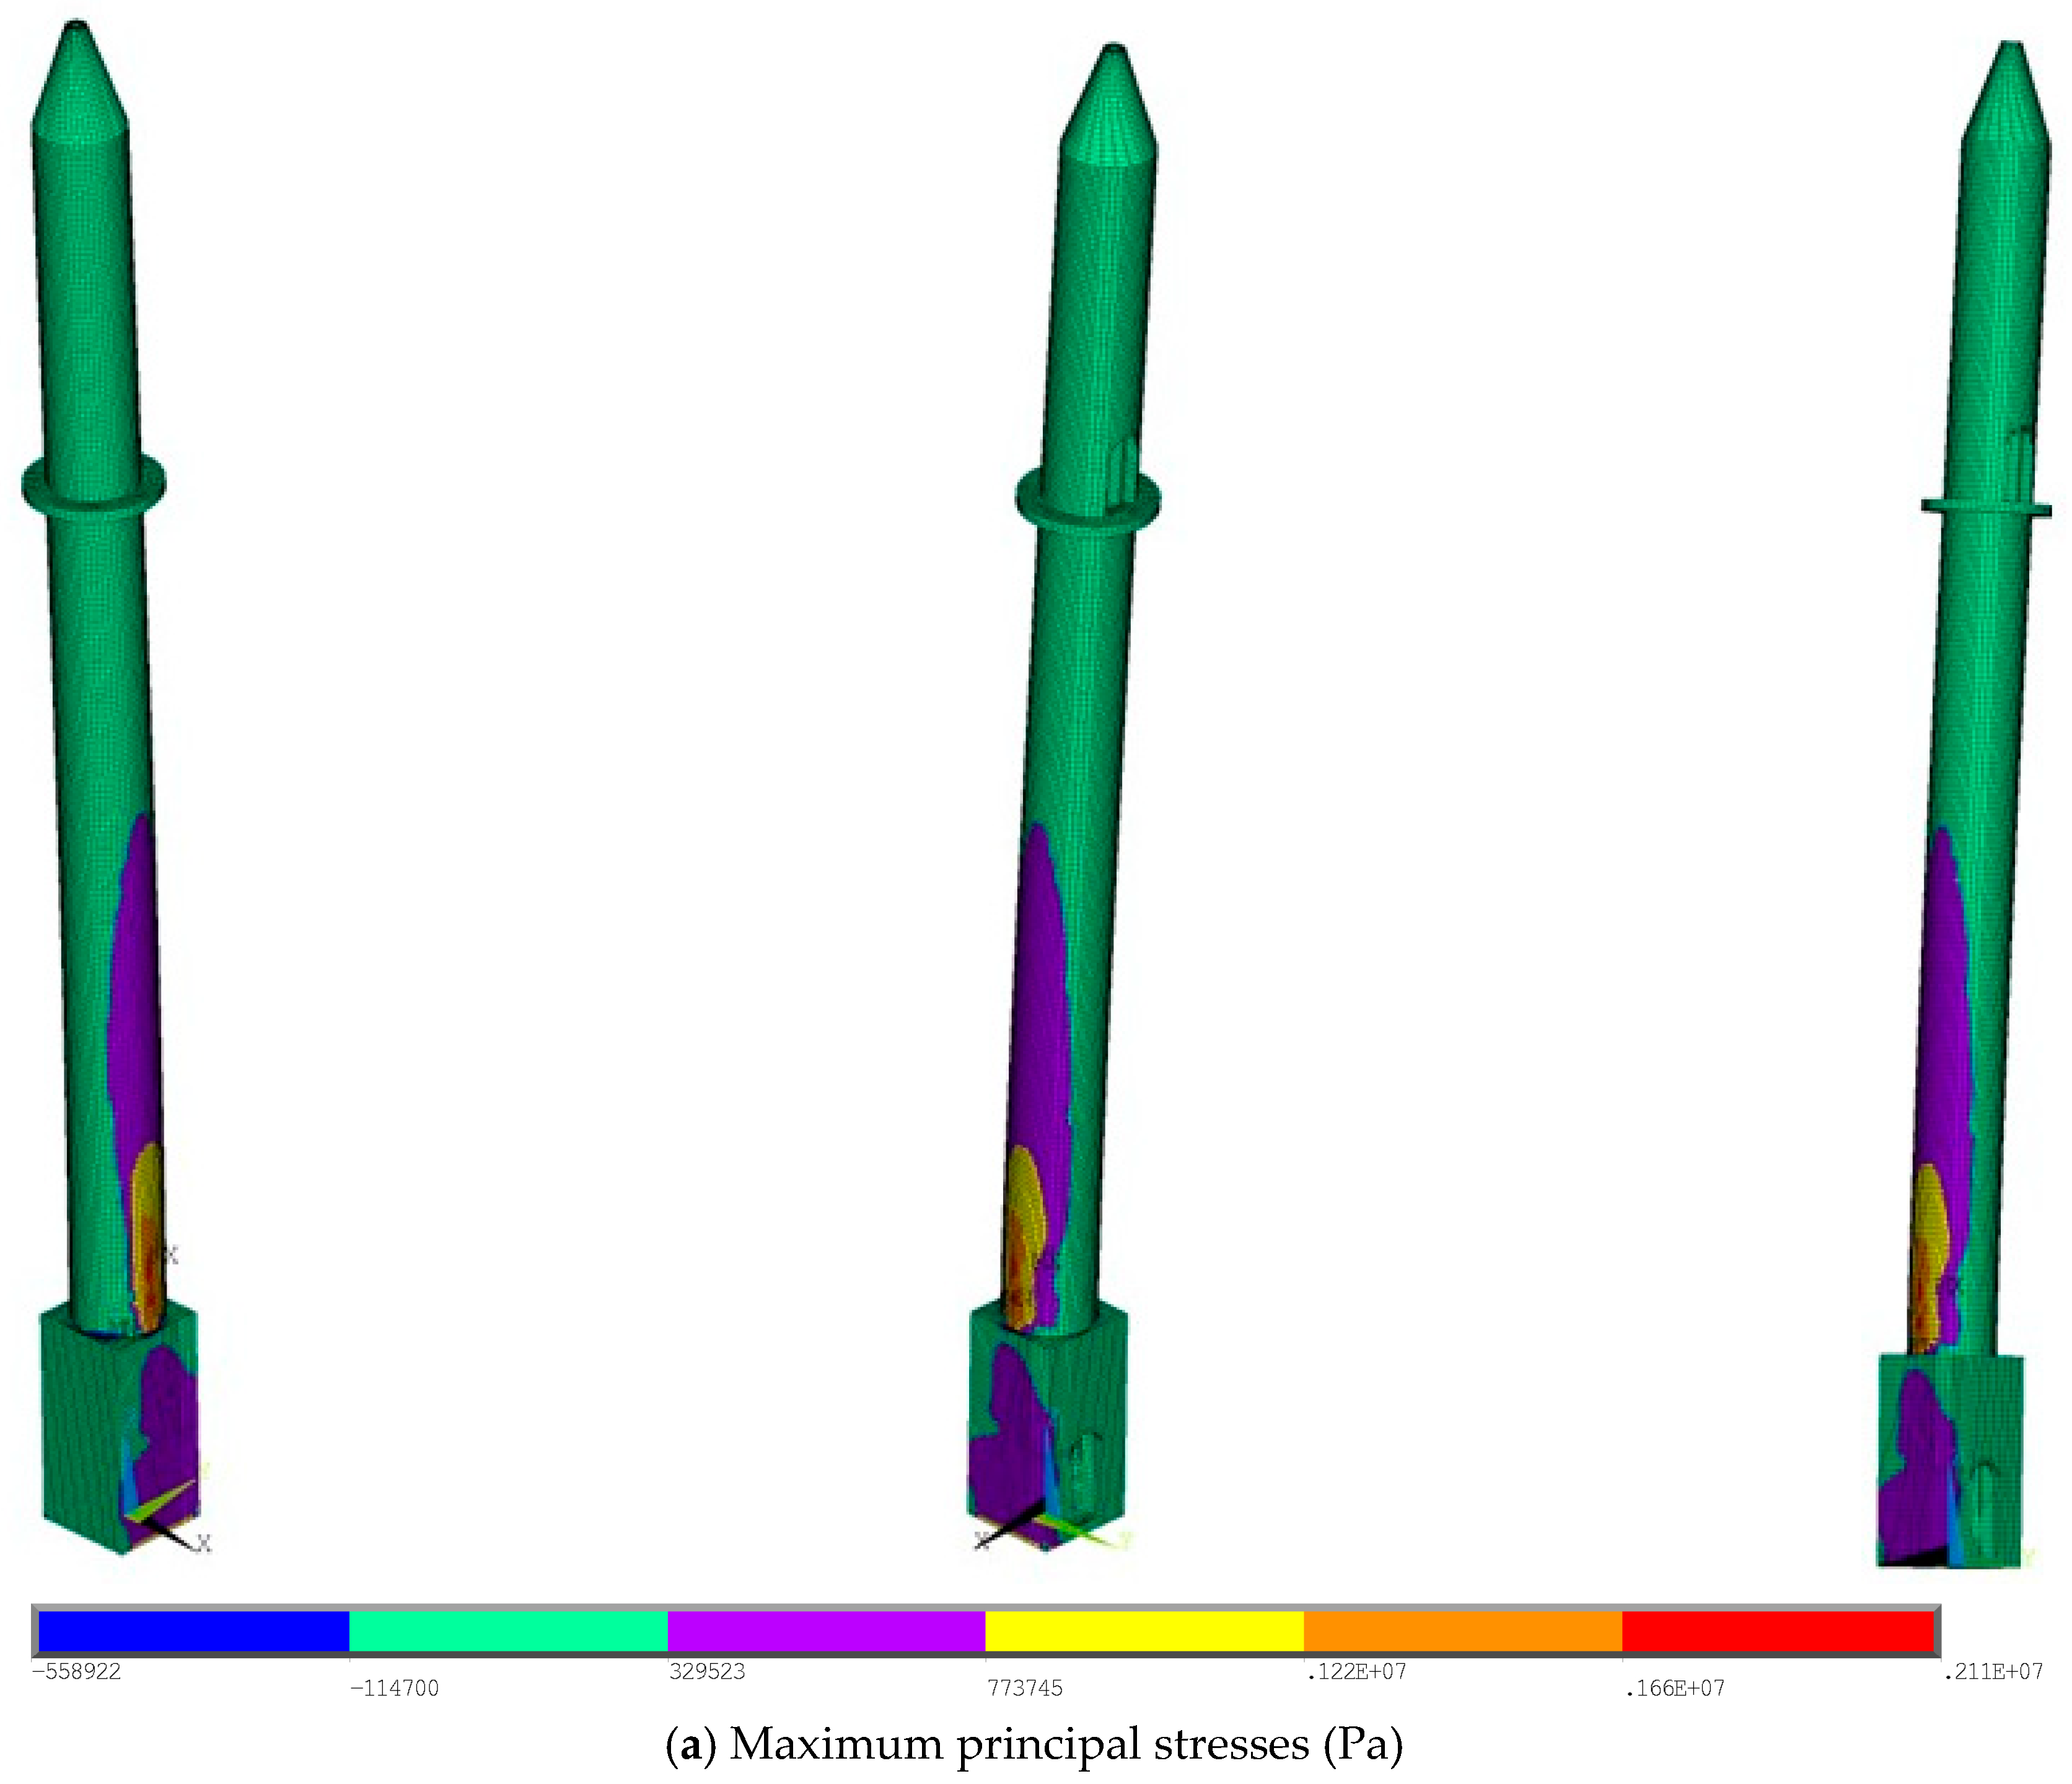
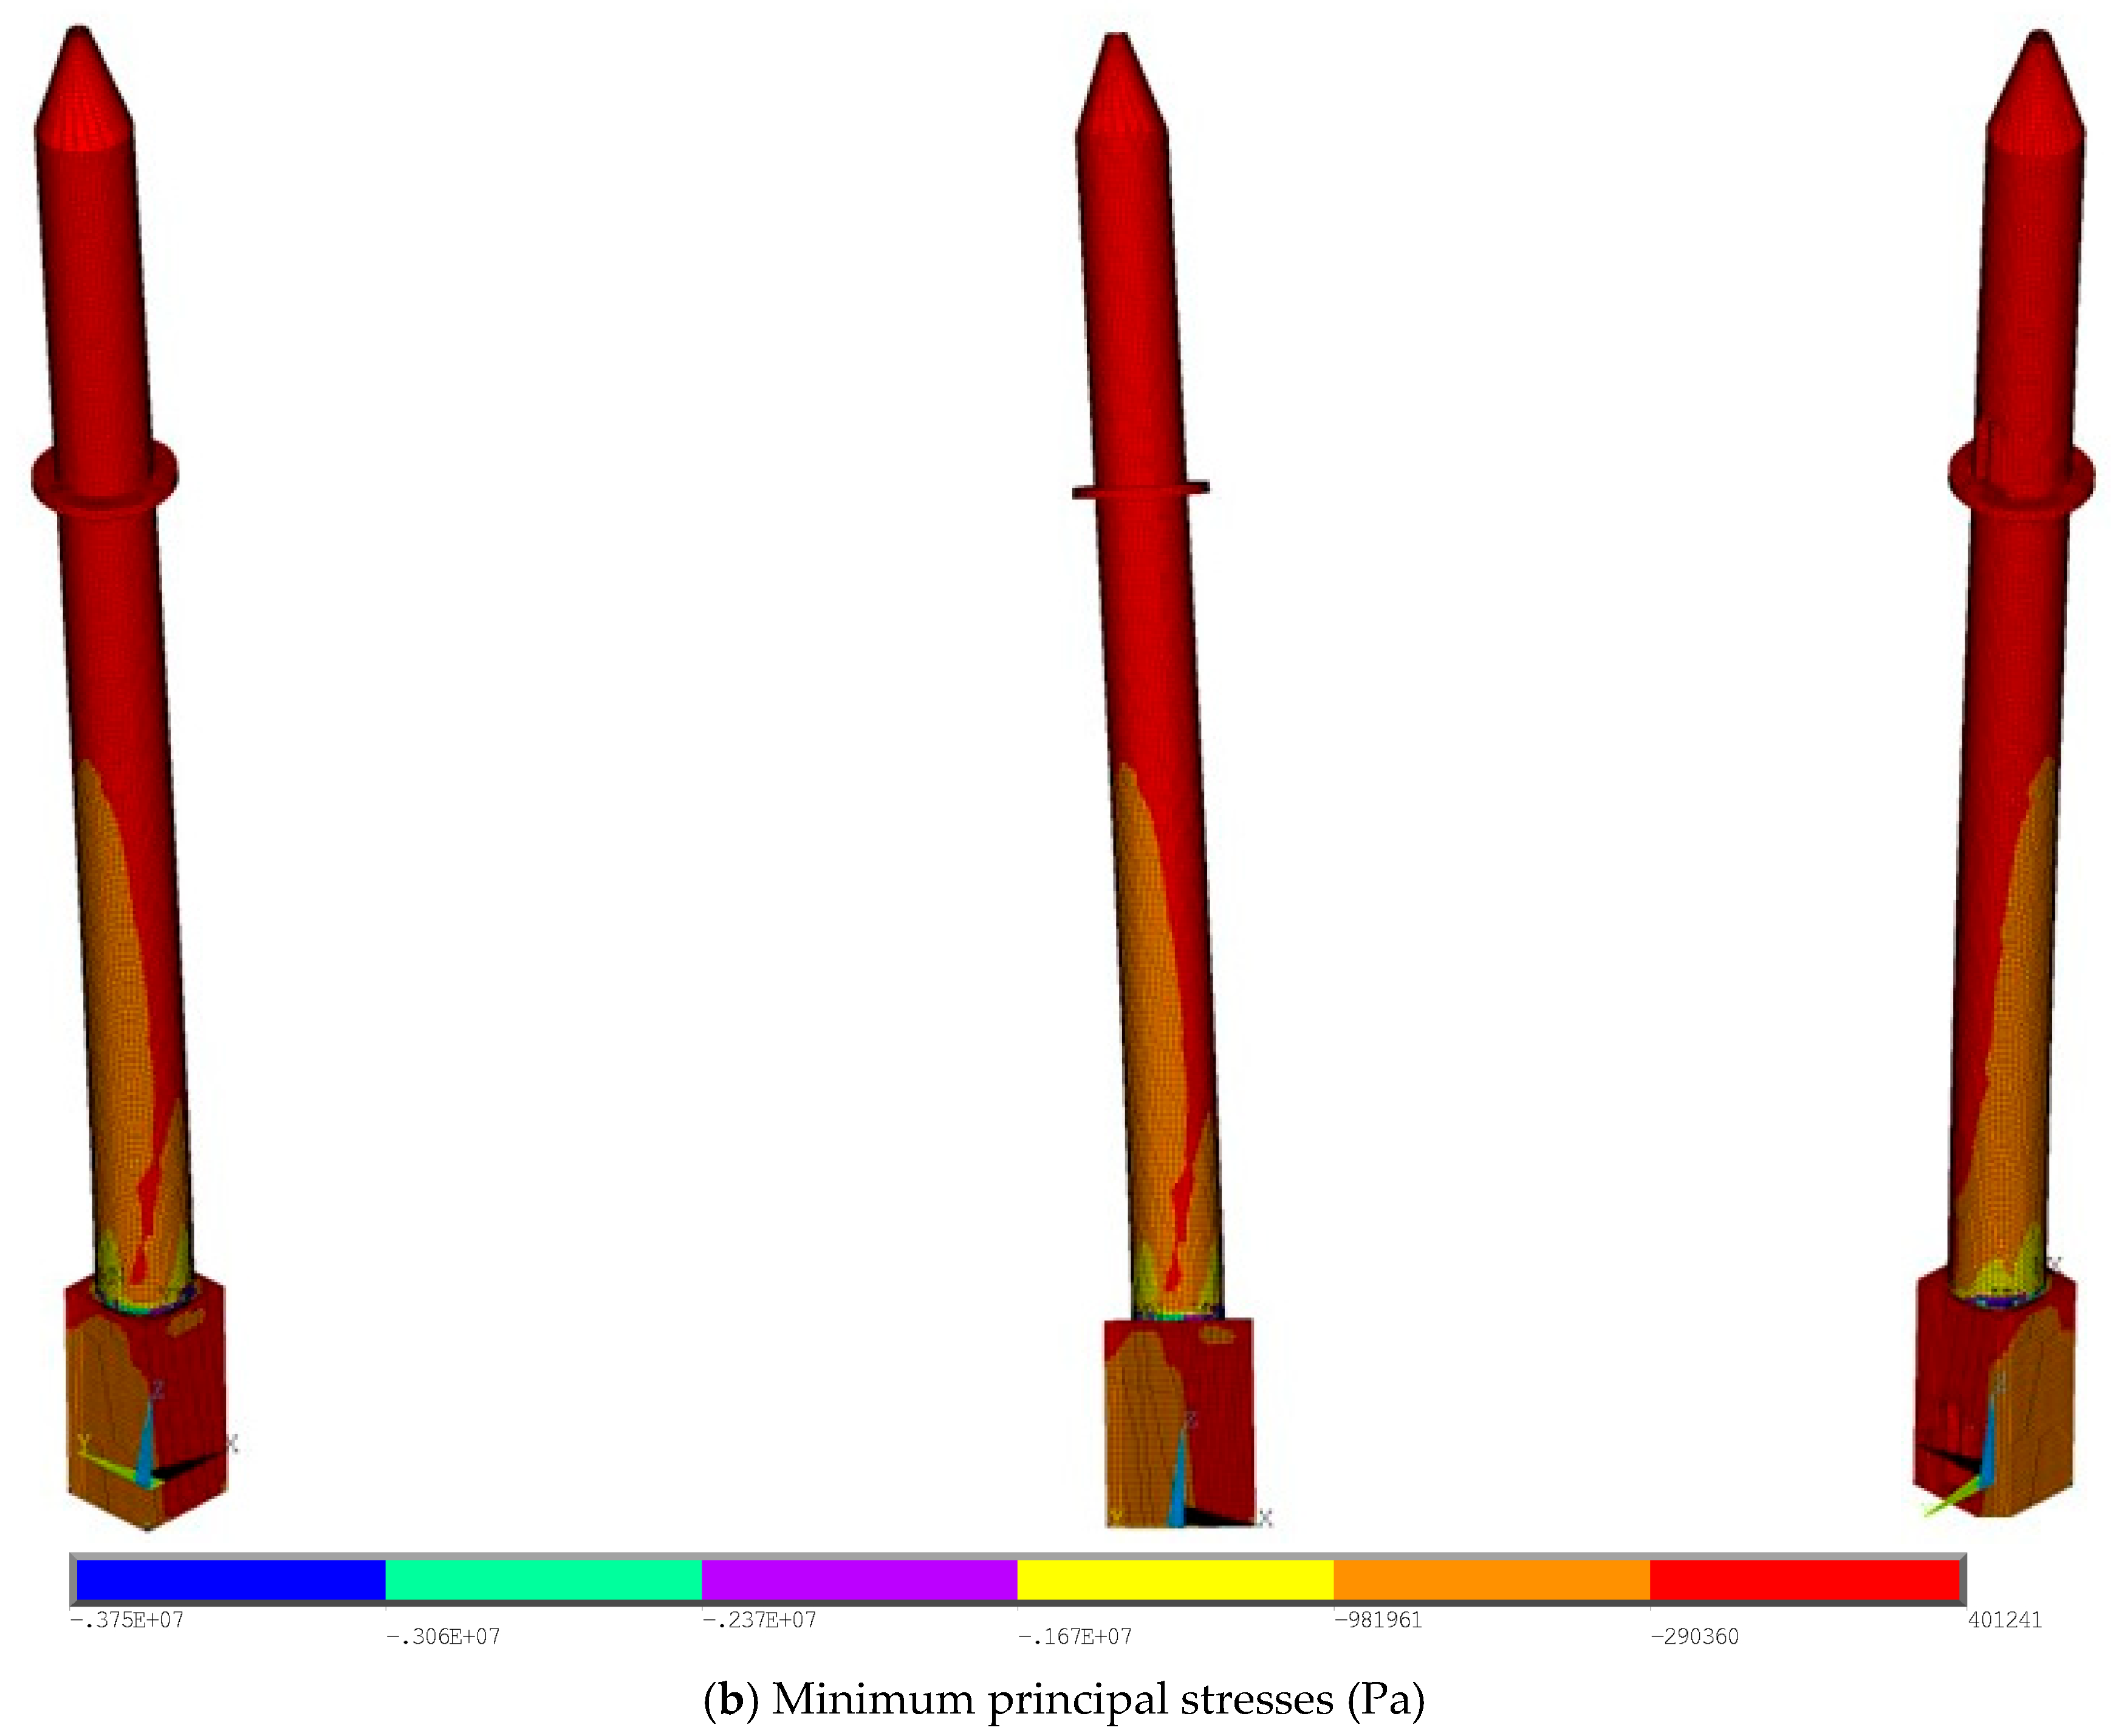
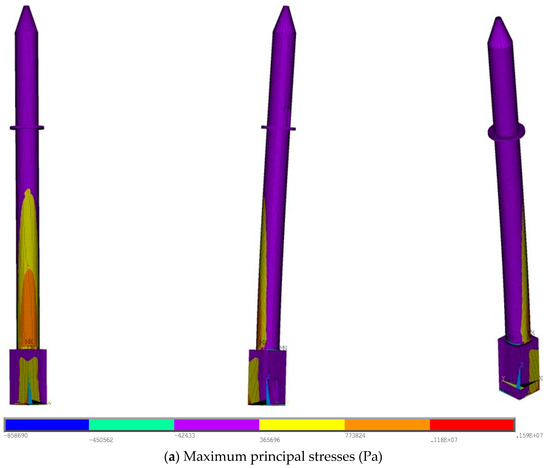
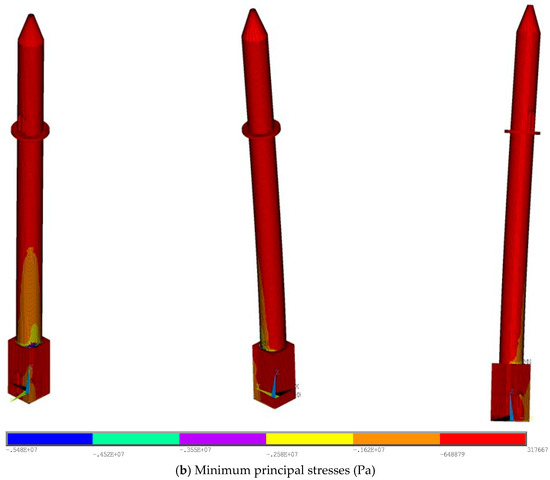
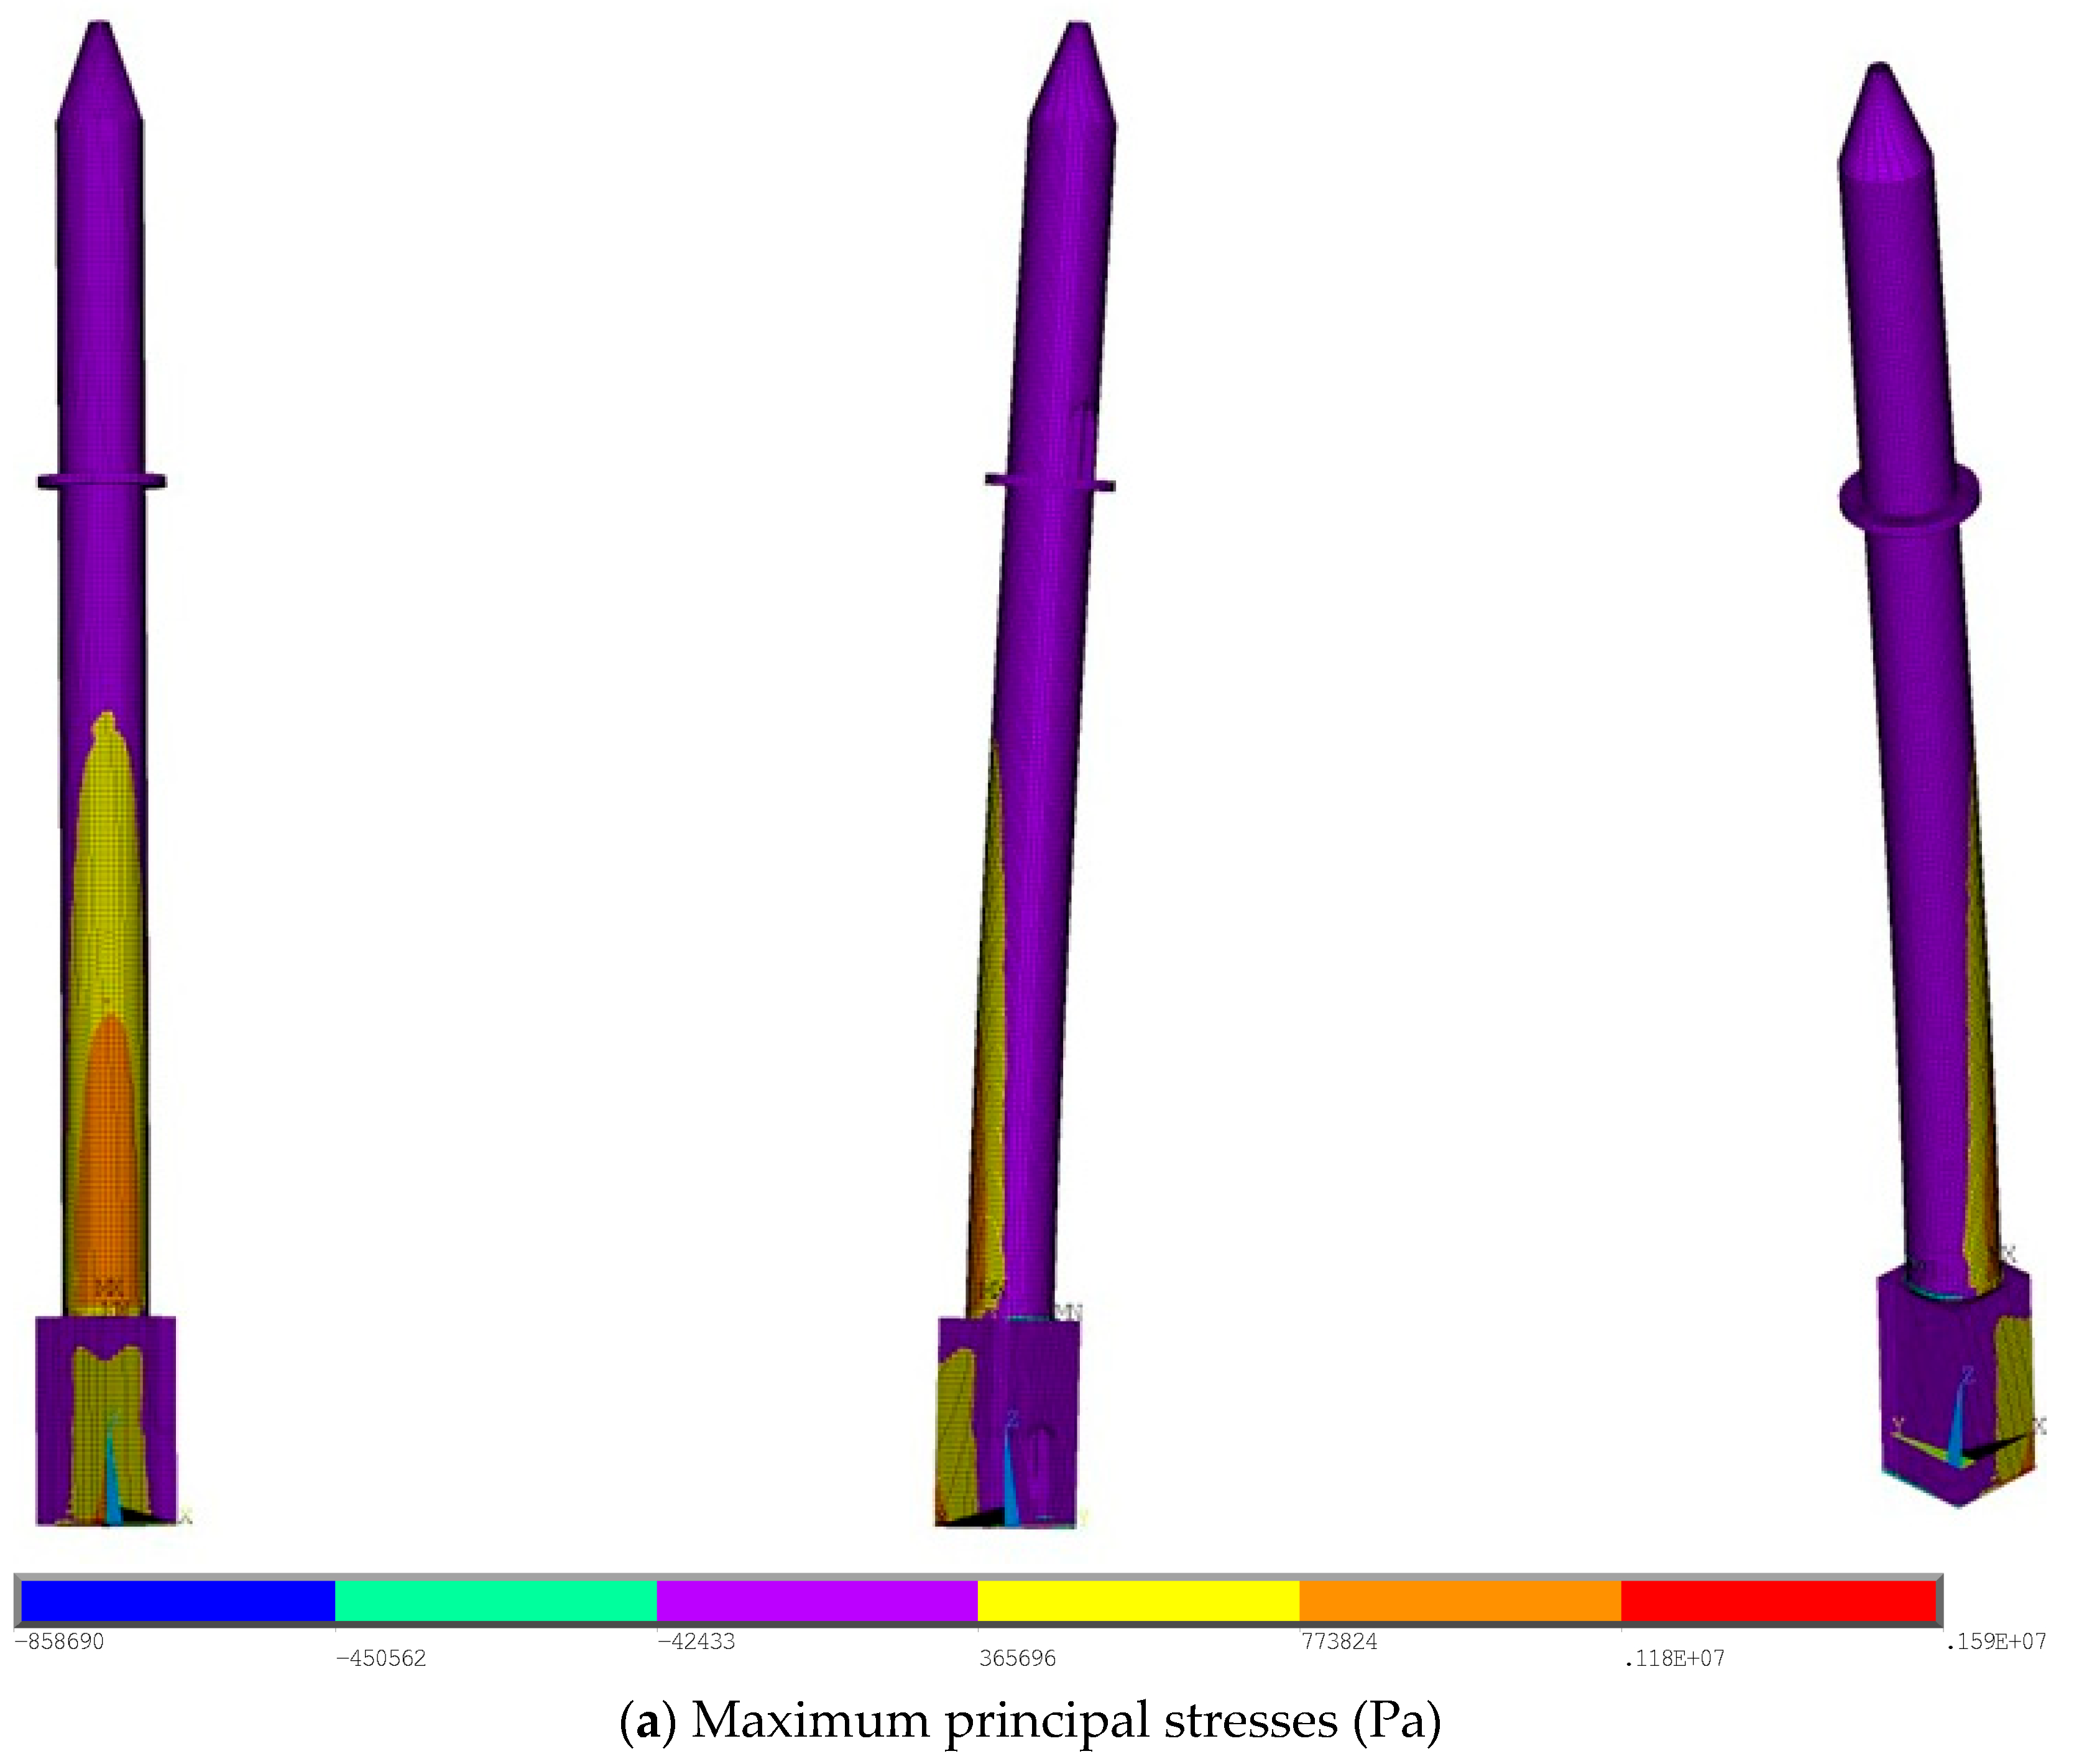
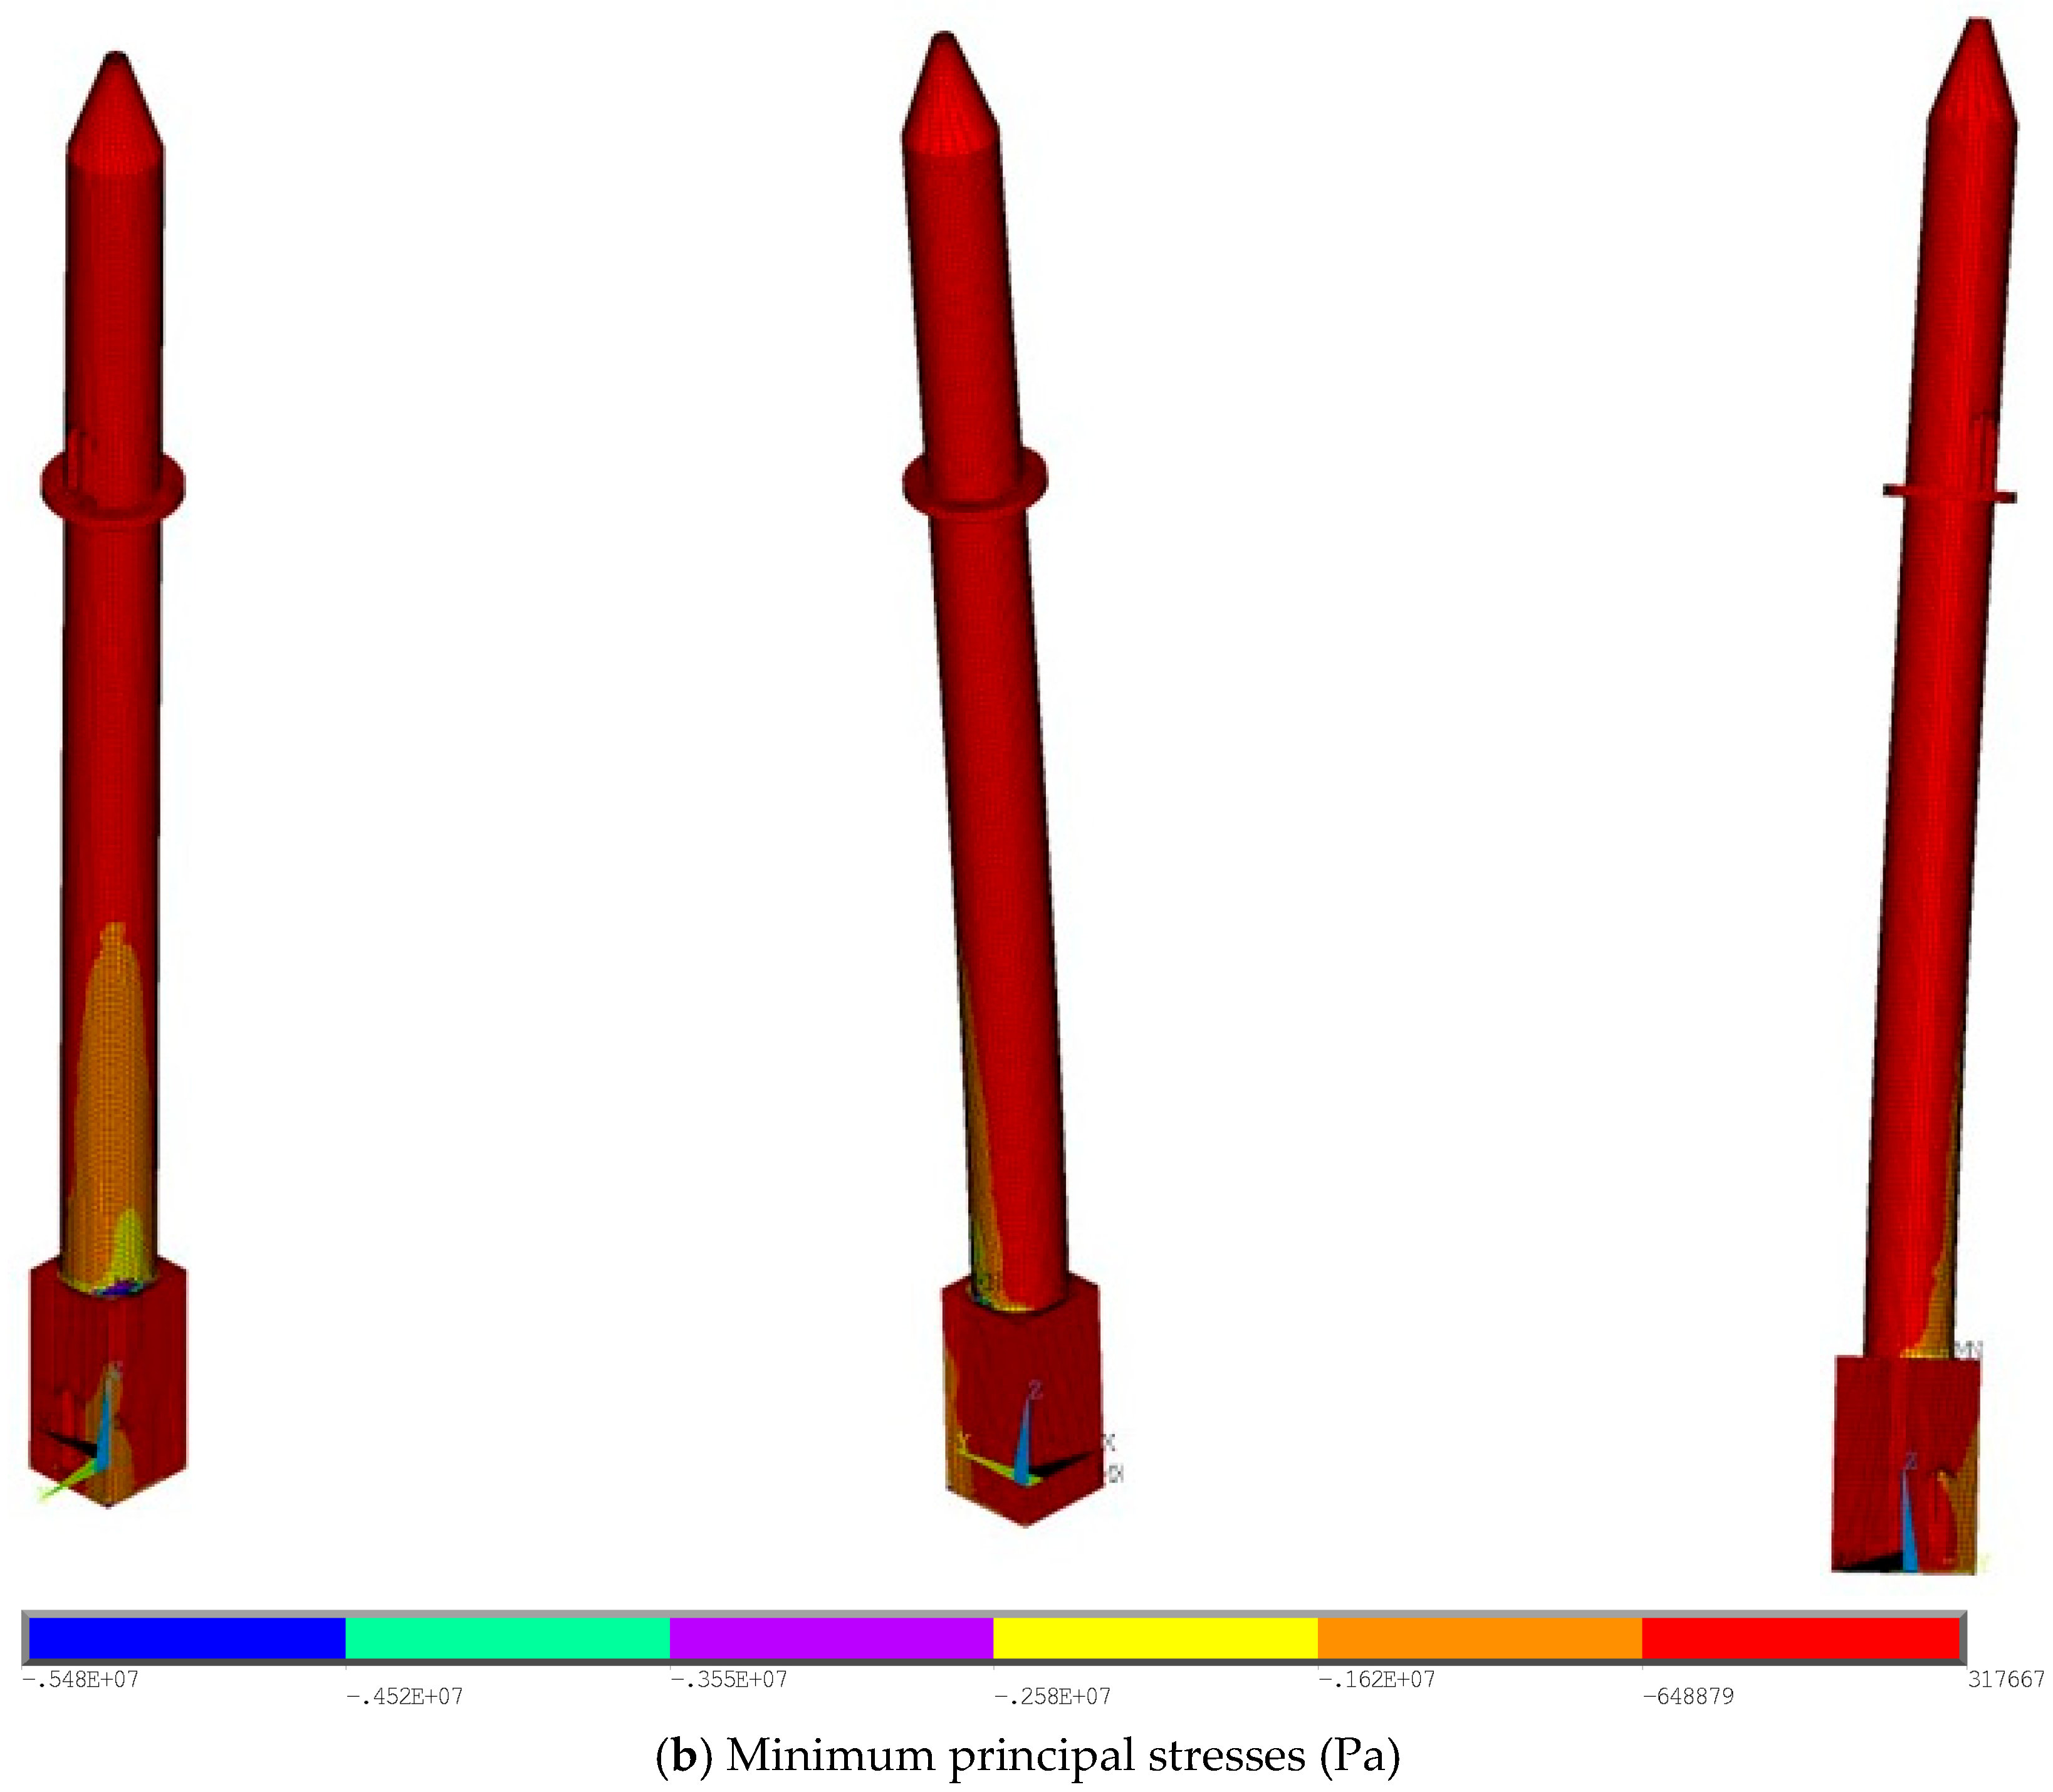
- In the nonlinear solutions performed for the minaret, collapse occurred at 71.25 s for NSx/EWy and 73.48 s for NSy/EWx. Figure 15 and Figure 16 present contour plots of principal stresses prior to collapse. Analysis of the principal stress graphs typically reveals stress increases in the transition zone.
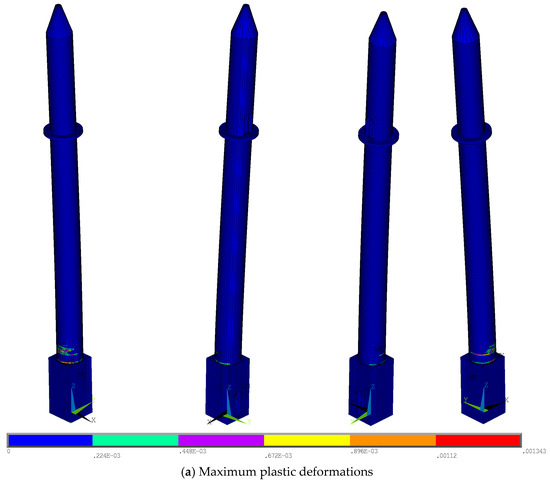
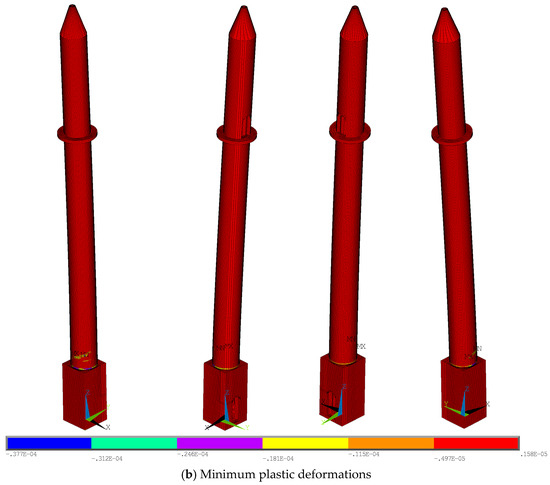
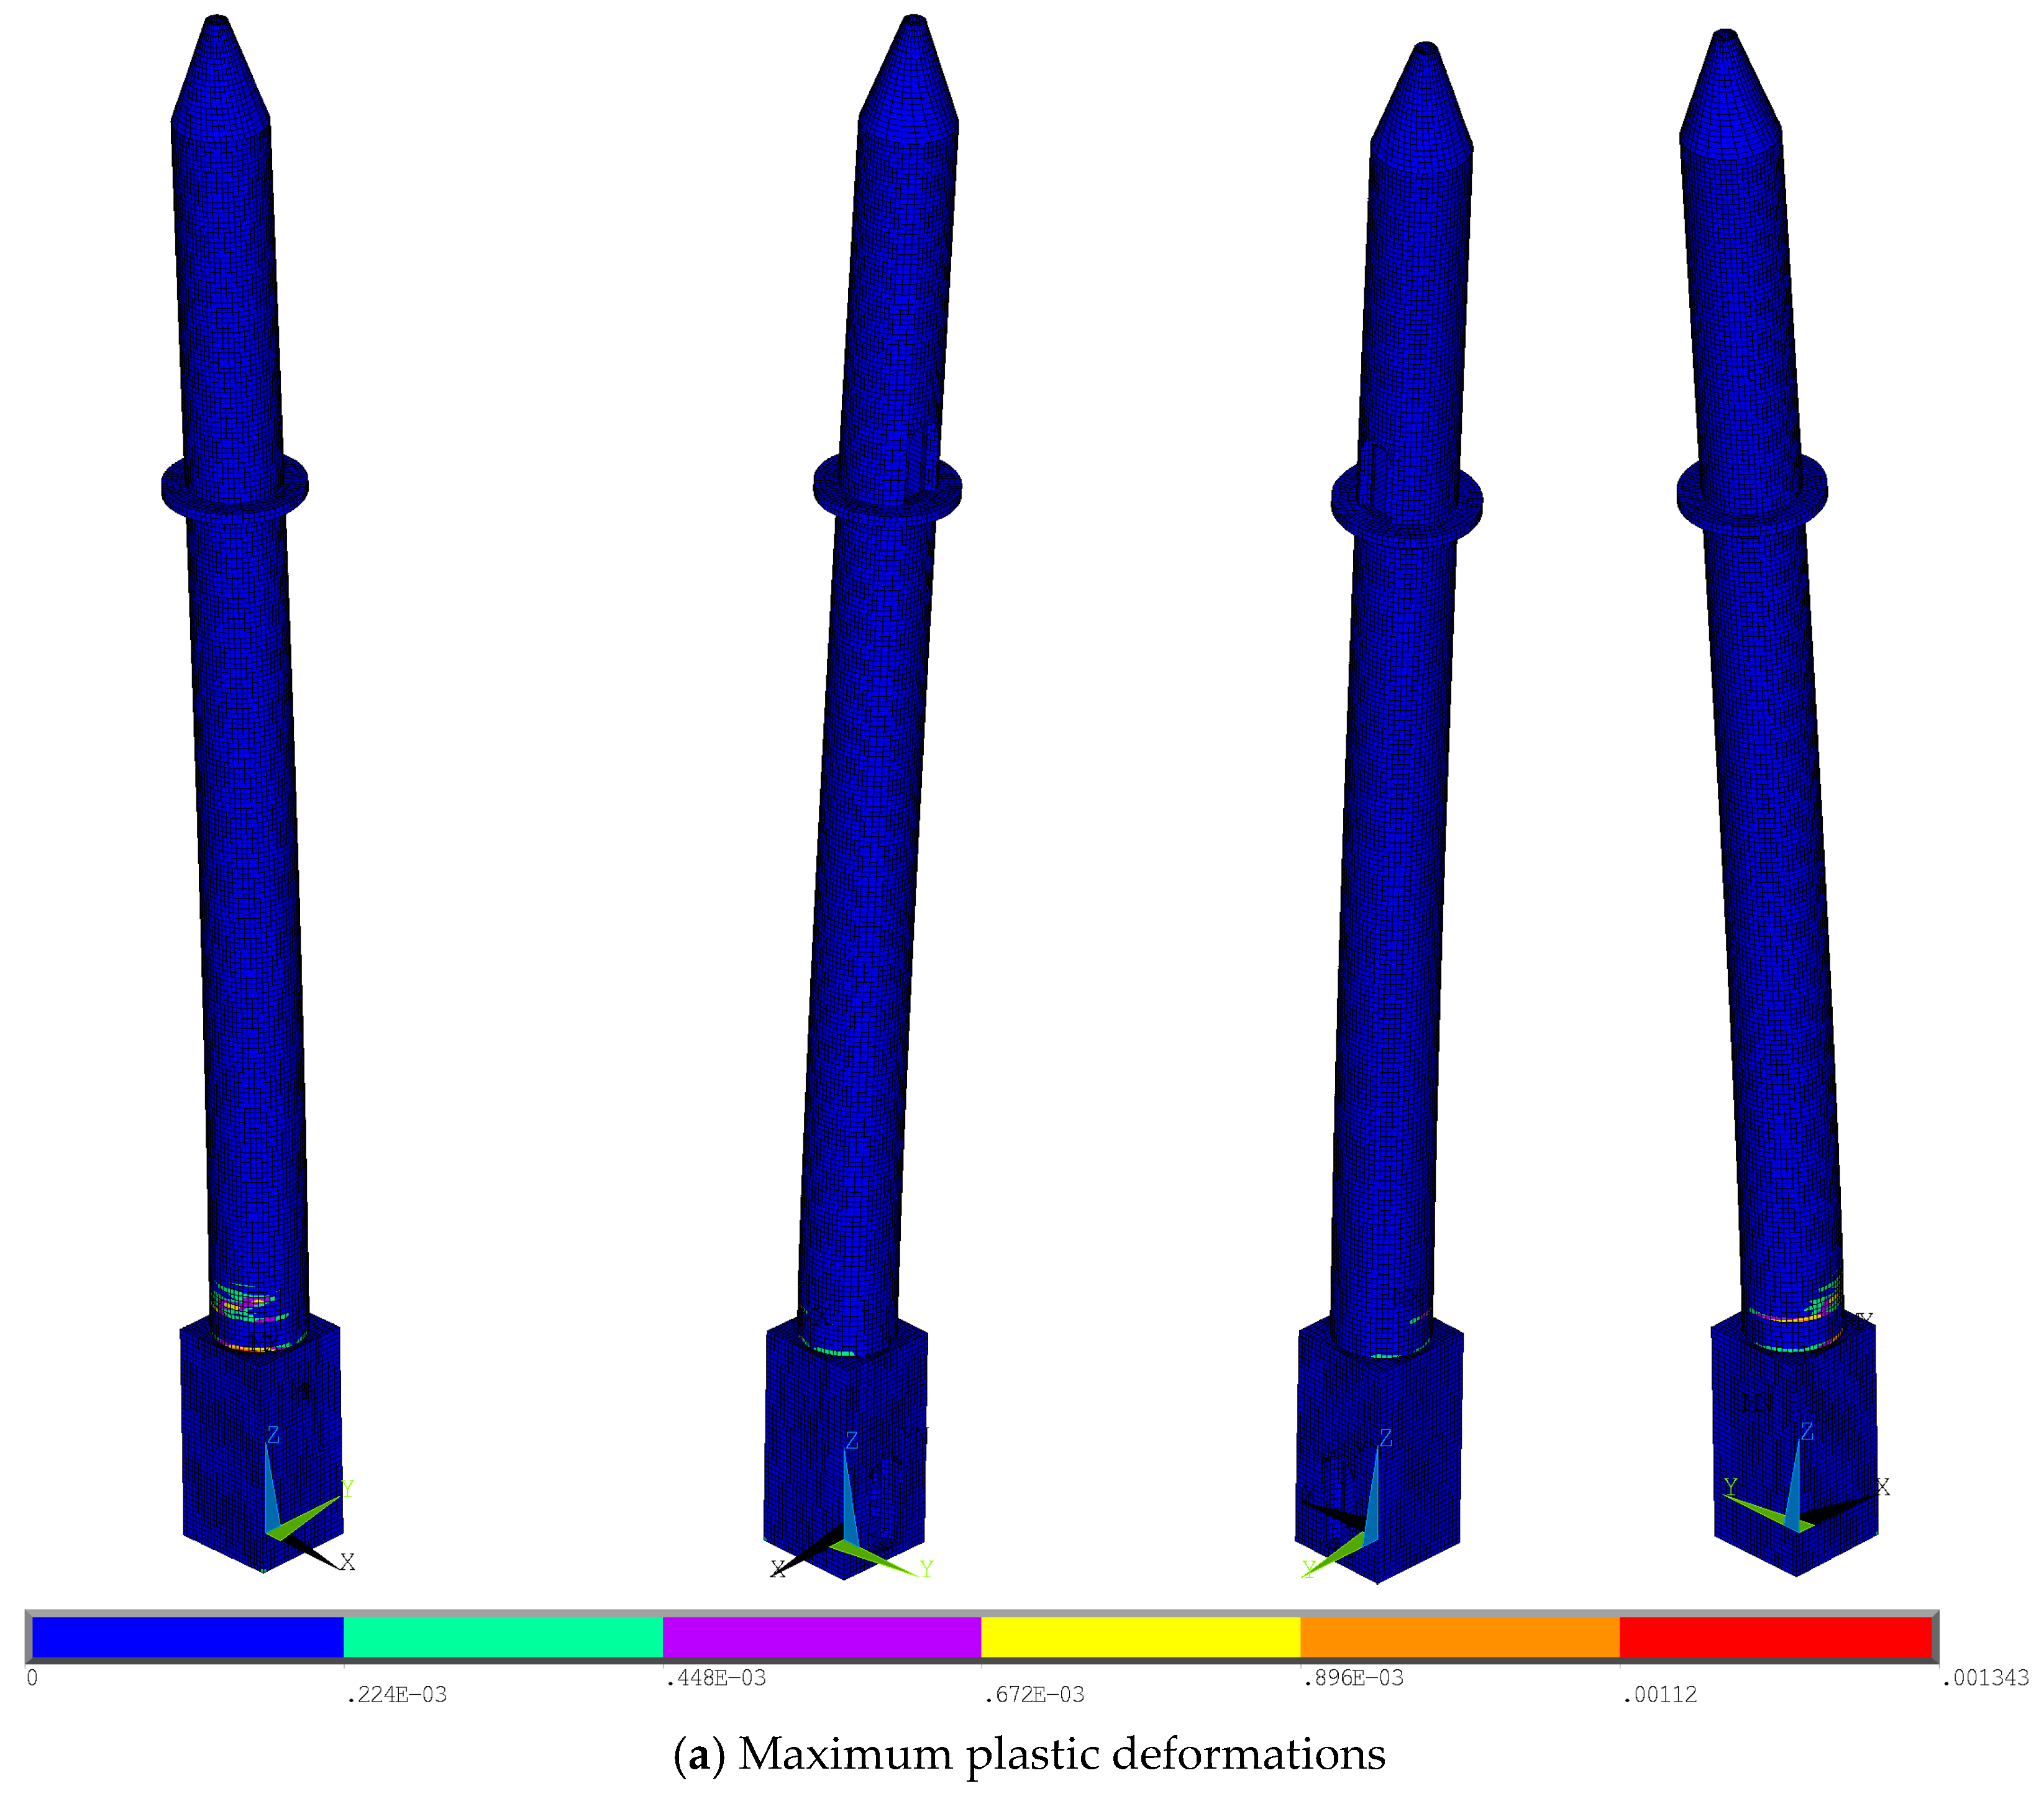
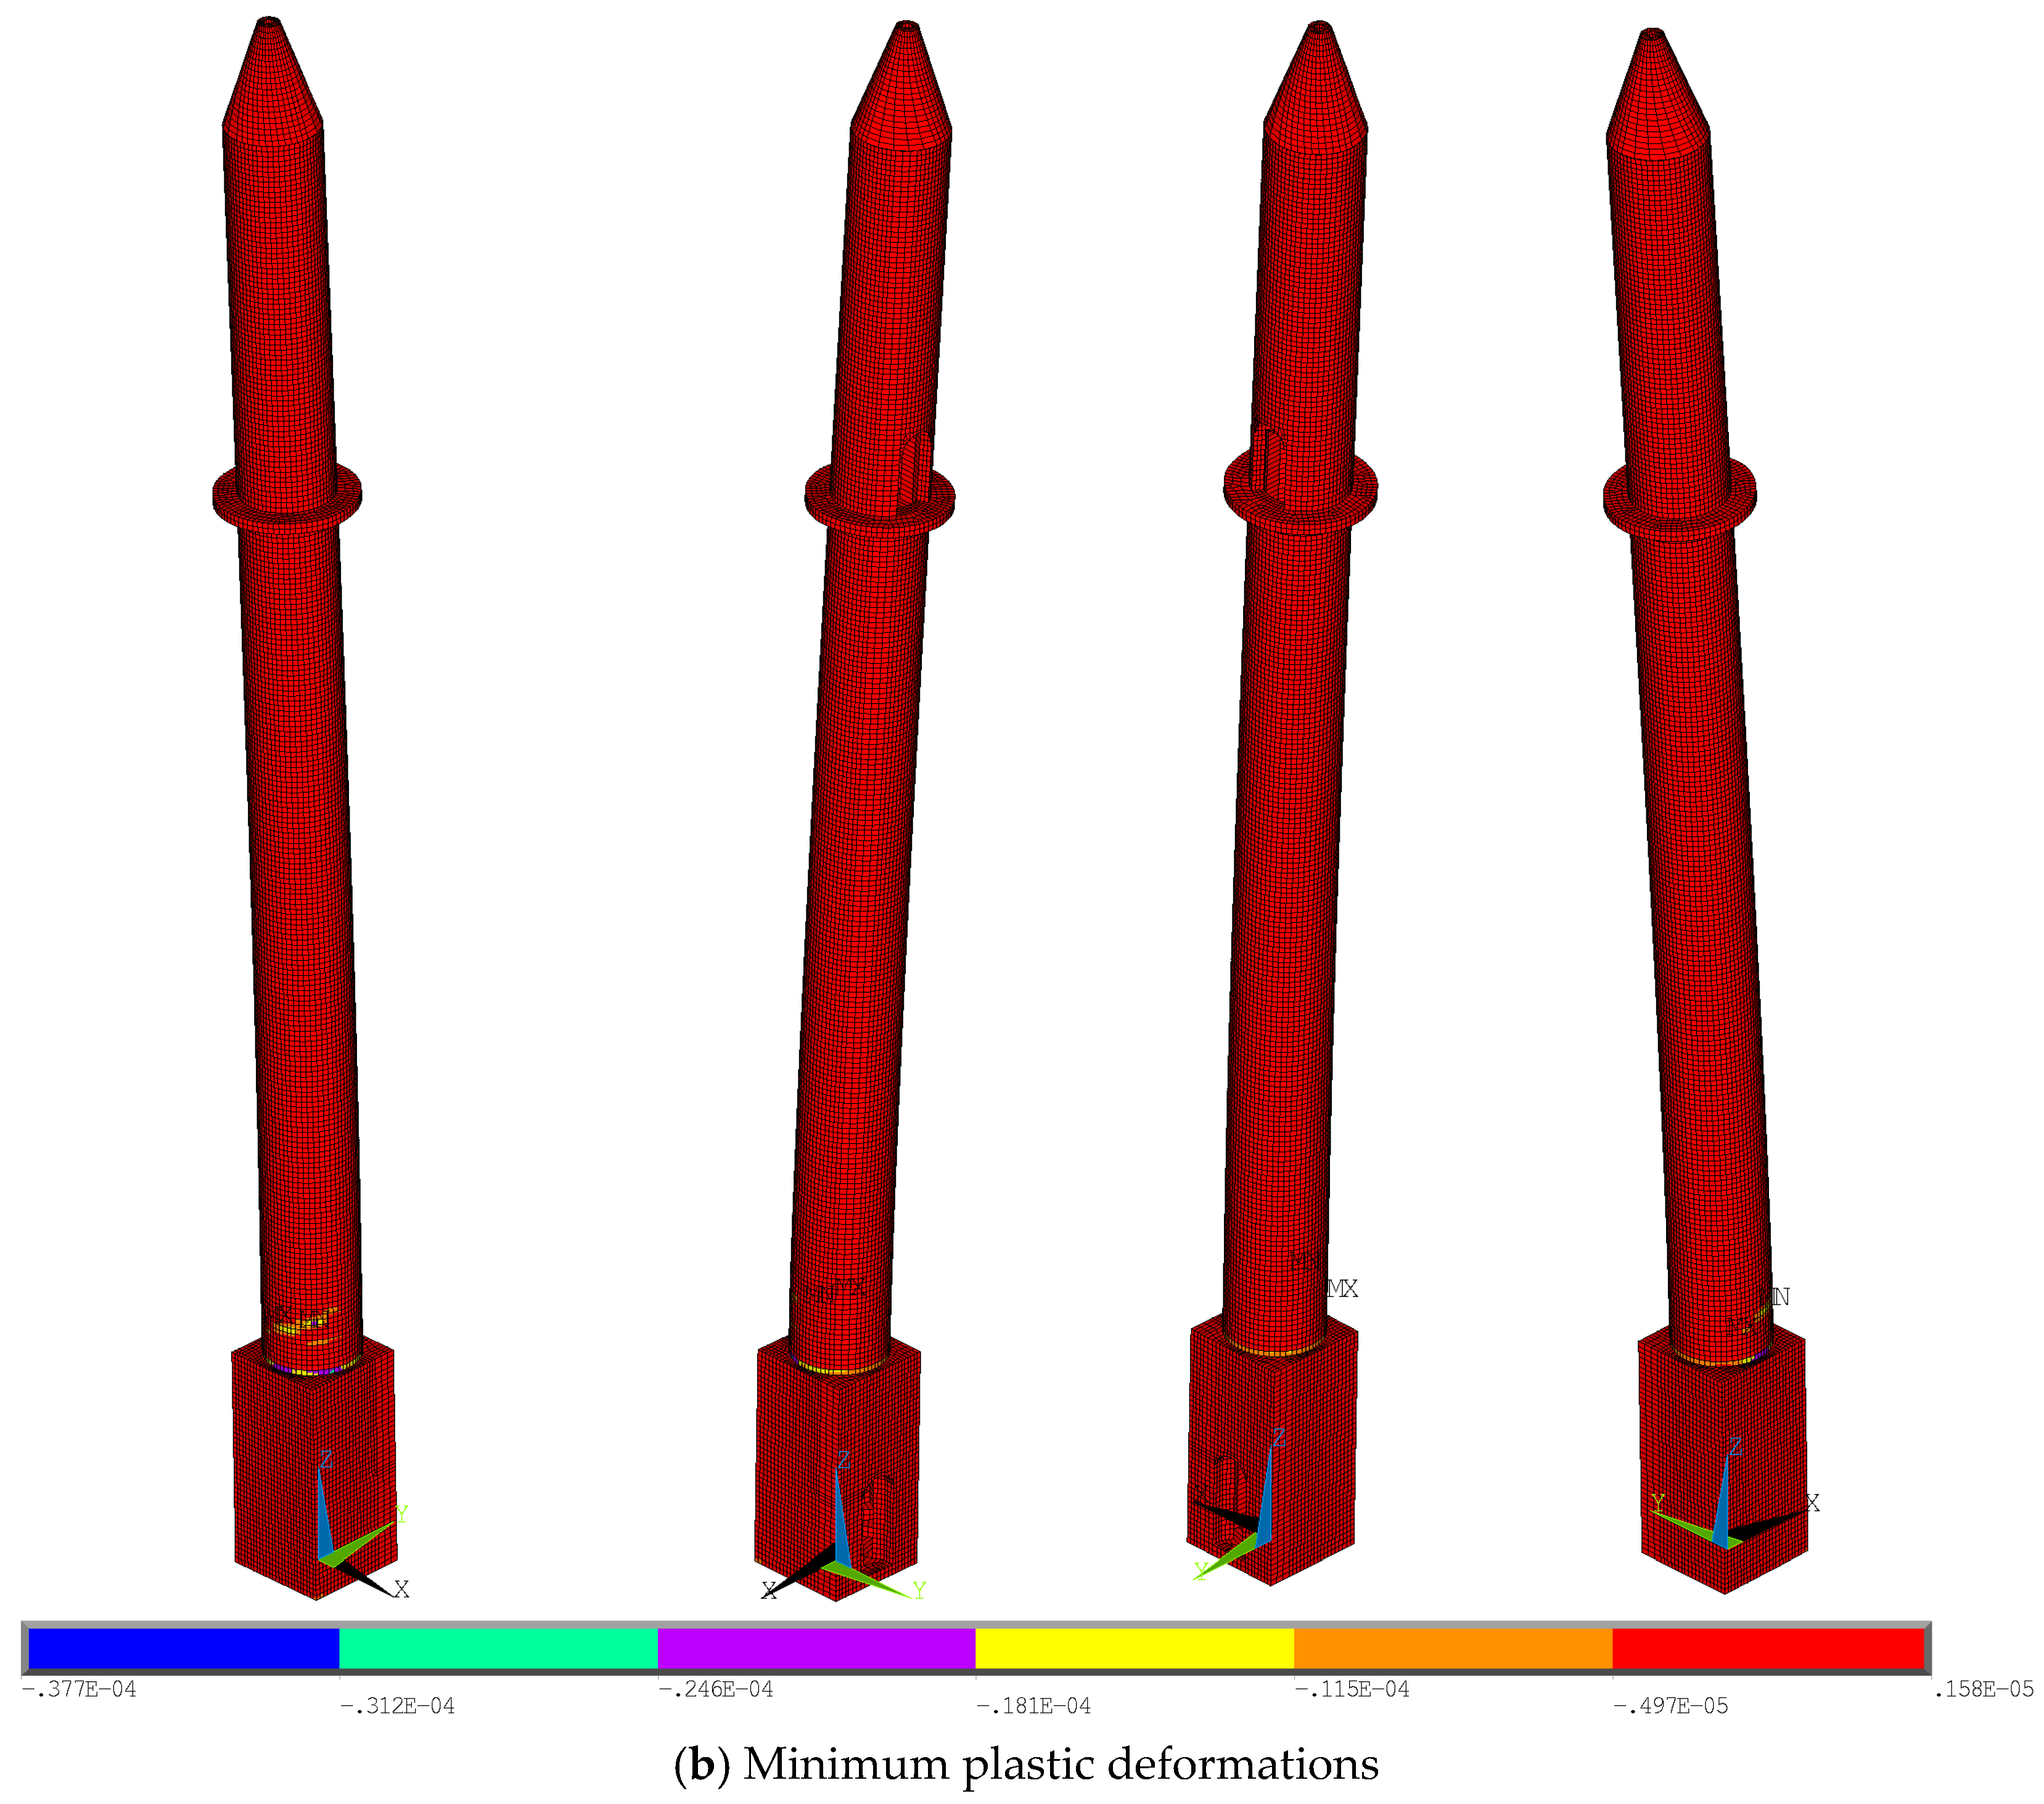
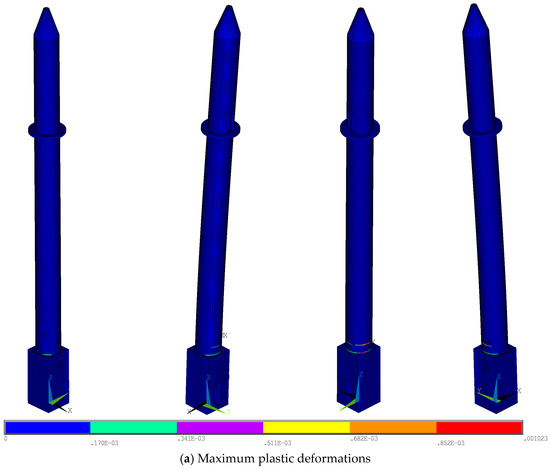
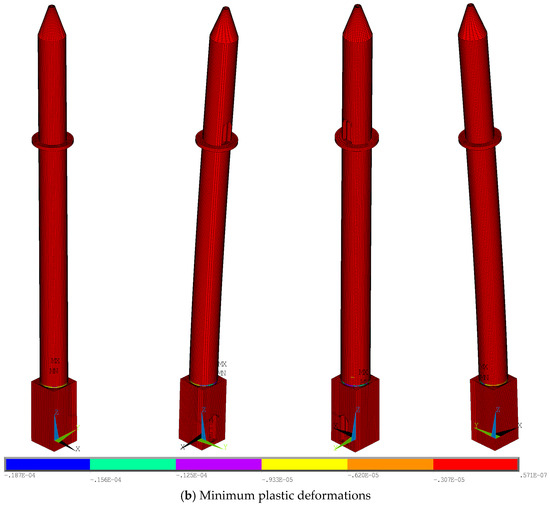
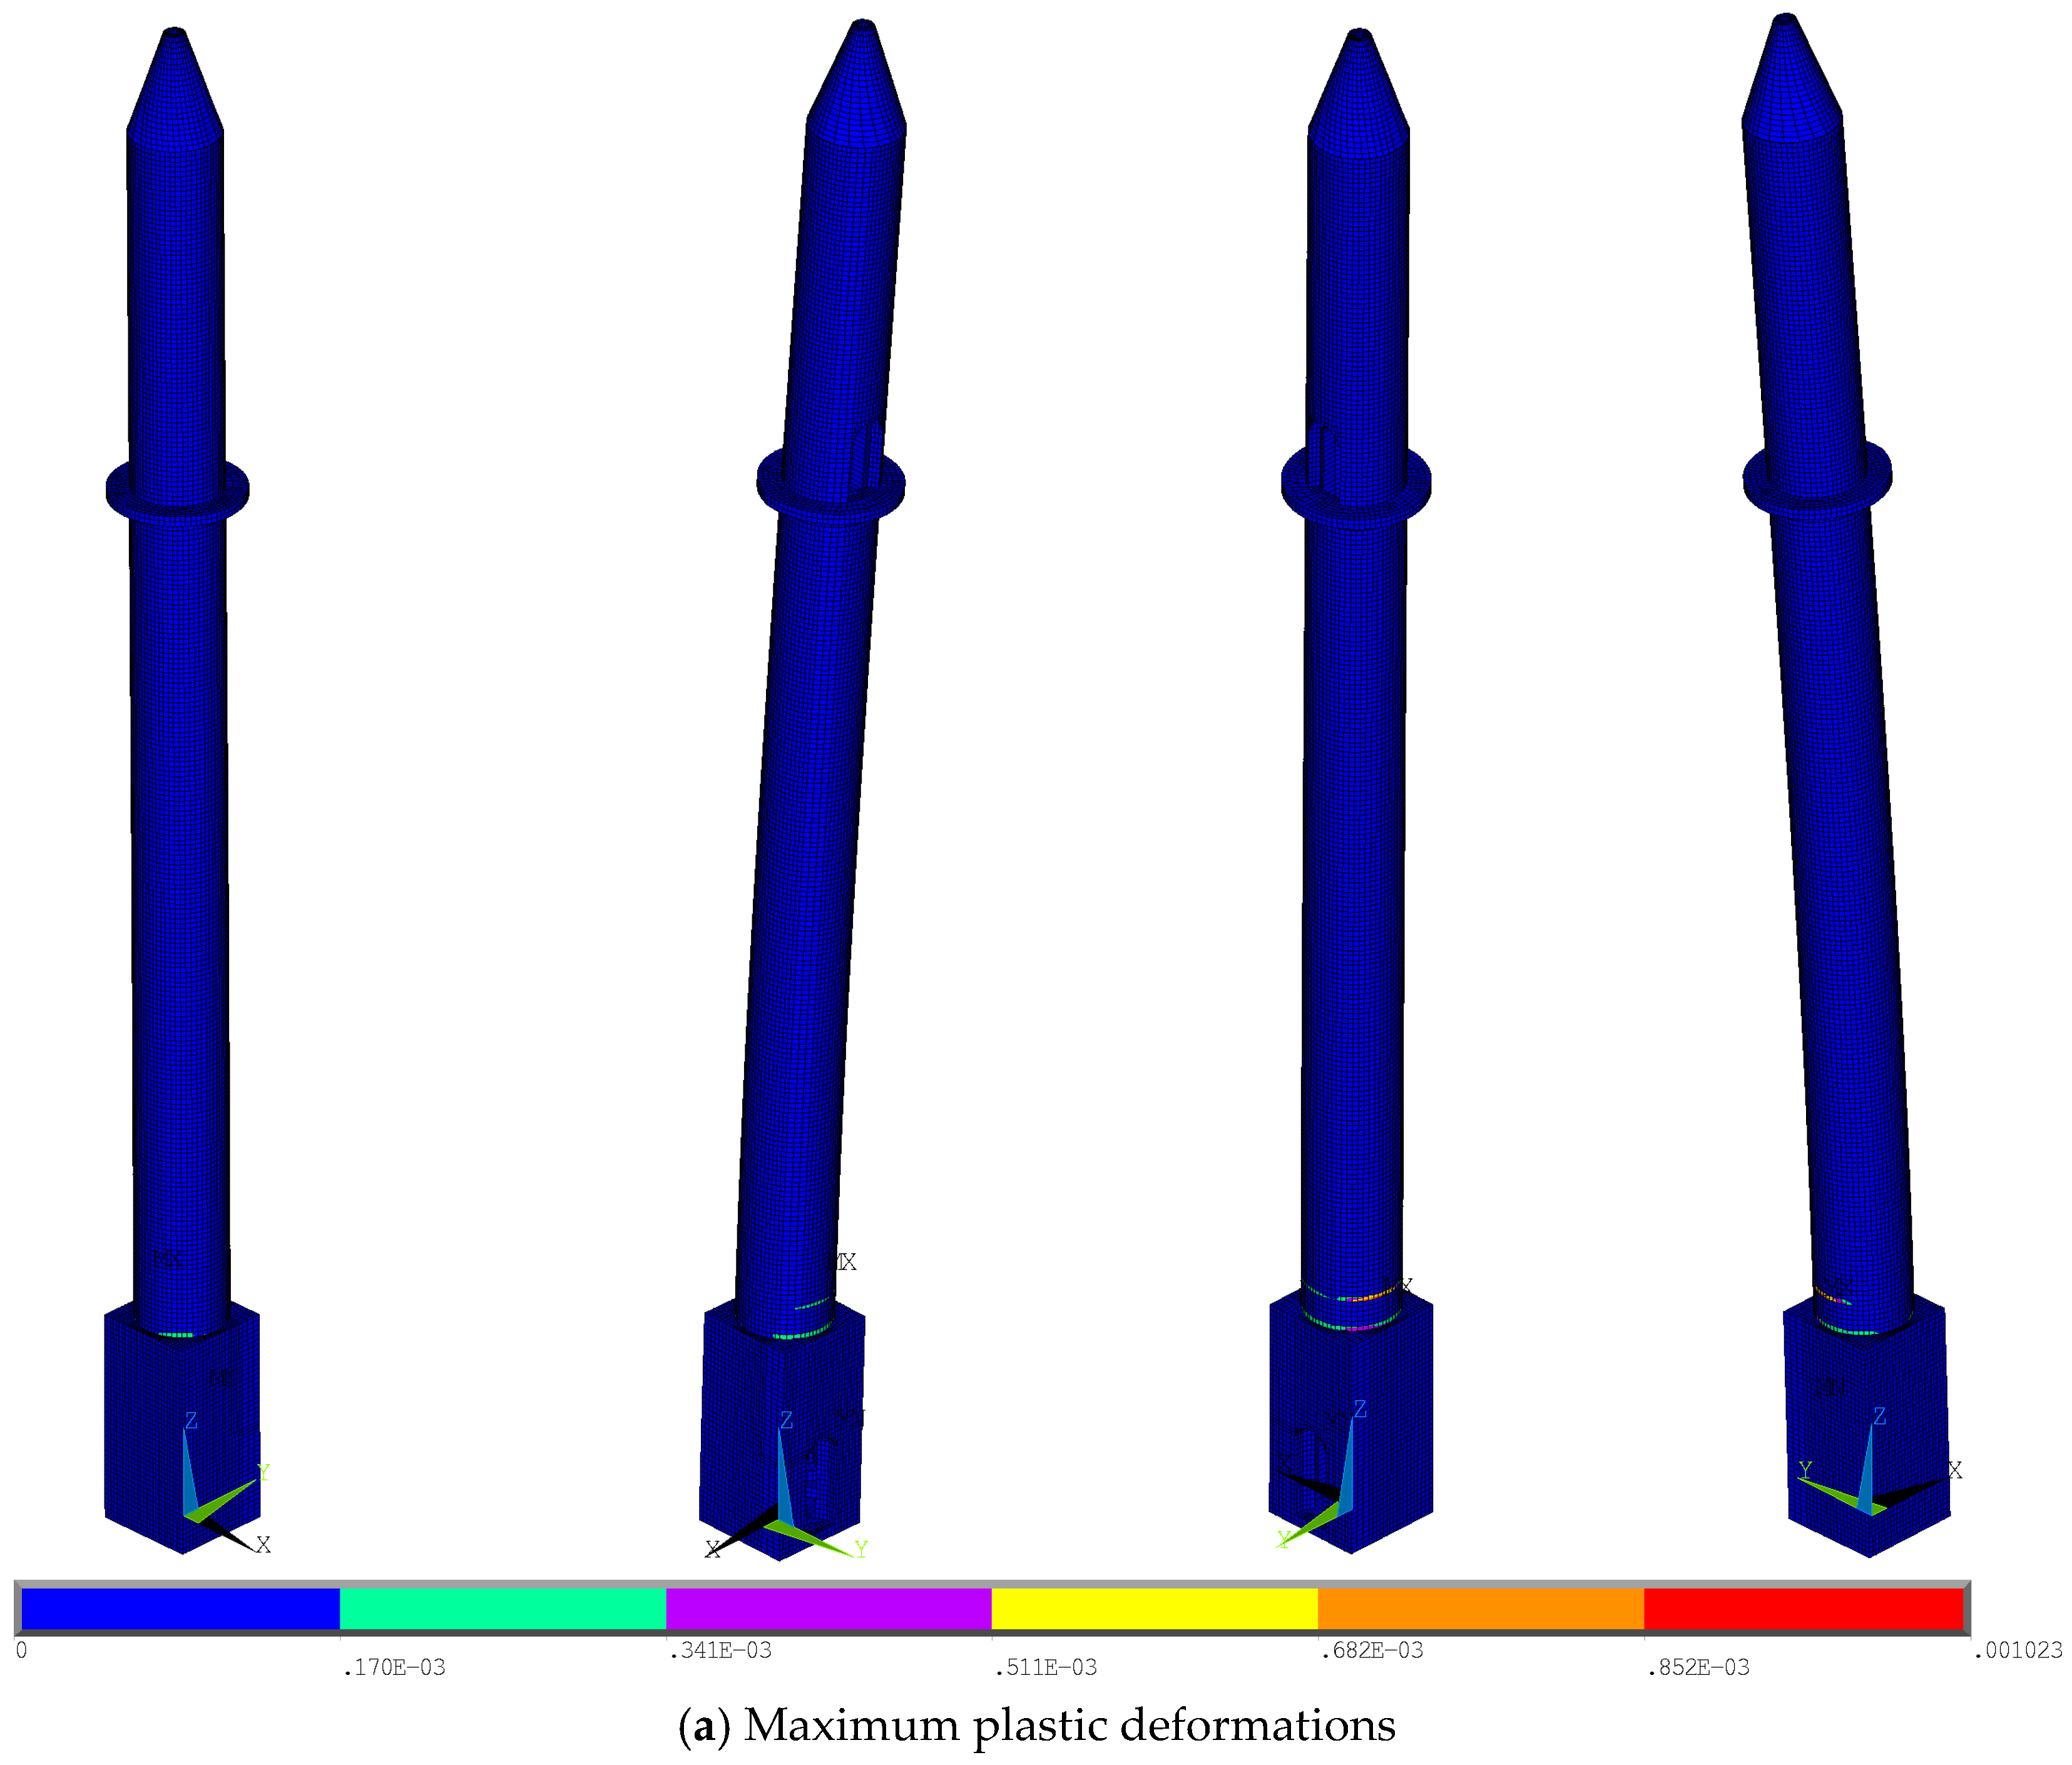
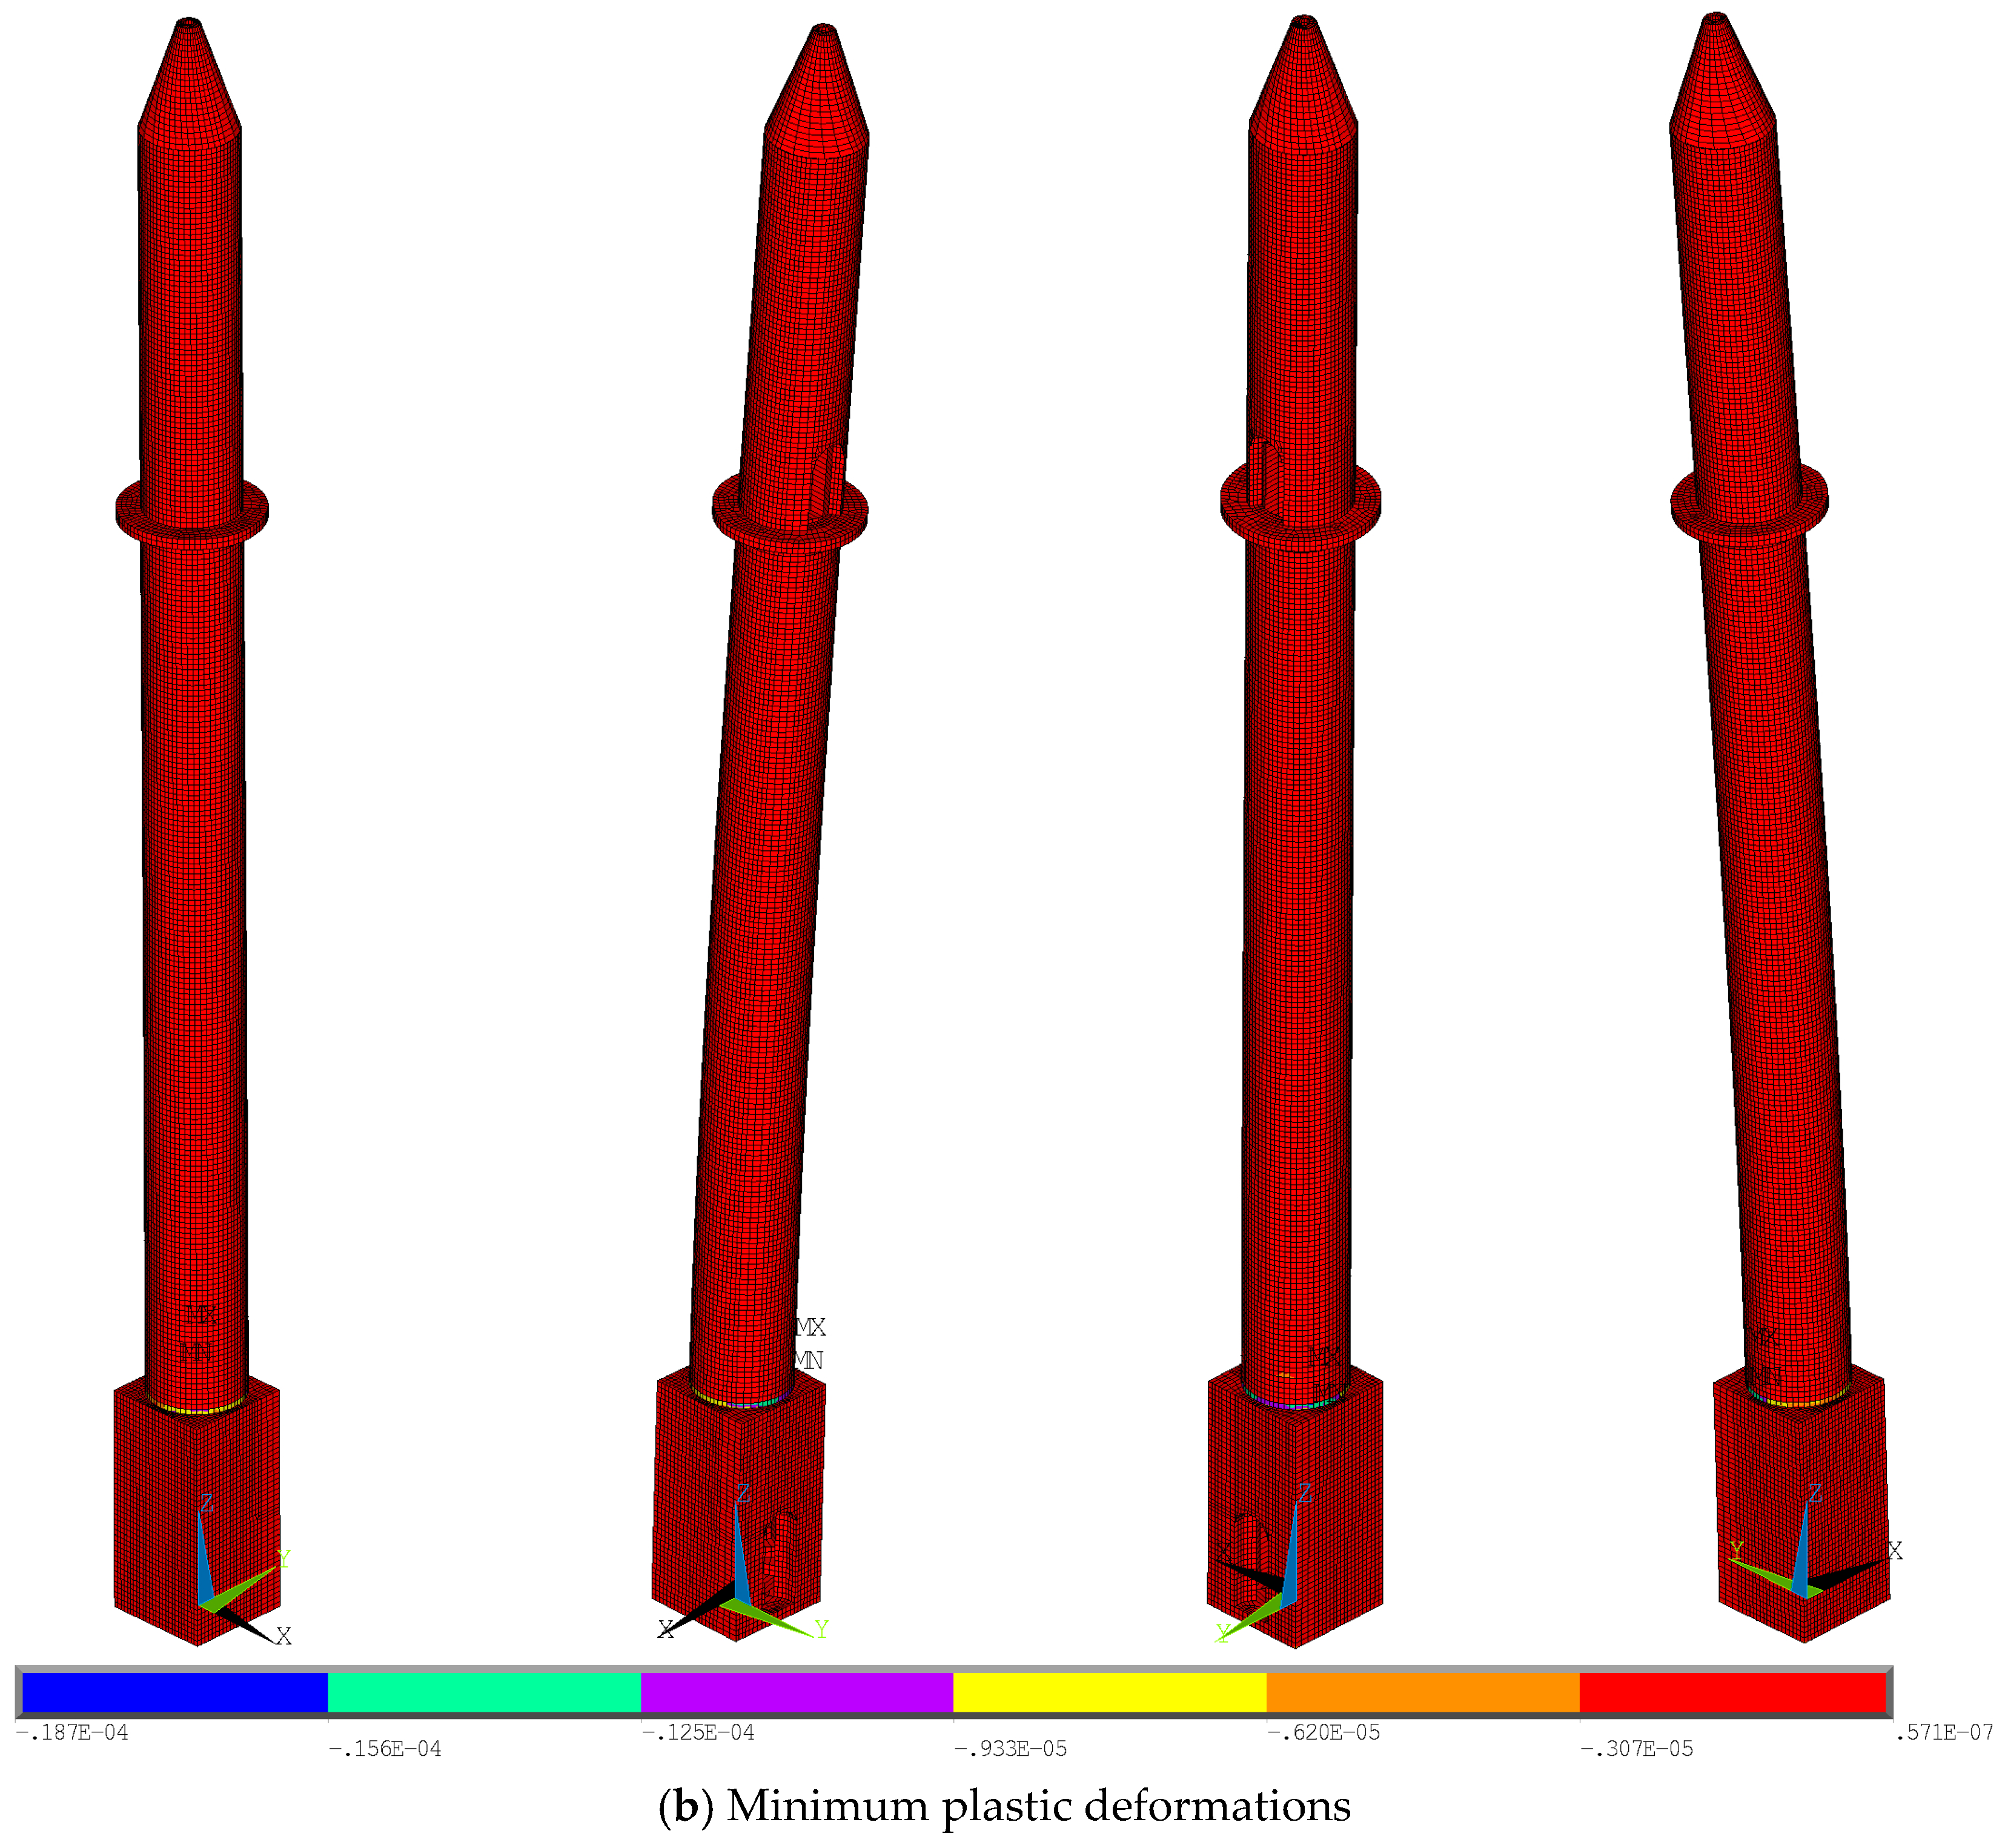
- The analysis of plastic deformations (Figure 17 and Figure 18) reveals that stress concentrations commonly occur in the transition zones. This situation indicates a potential for damage in these regions. The minarets examined in this study sustained damage from the transition zones and collapsed during the 6 February 2023 earthquake. The observed damage in the minarets shows good qualitative agreement with the numerical results. The observed damage in the minarets confirms the accuracy of the conducted analyses.
Figure 11.
Variation of the peak displacements with time.
Figure 12.
Variation of the lateral displacement with height for (a) the NSx/EWy solution and (b) the NSy/EWx solution.
Figure 13.
Variation of the base shear forces with time.
Table 4.
The absolute maximum values for the top displacement and base shear force of the minaret for the earthquake solutions.
Table 5.
Absolute maximum values of the principal stresses for minaret solutions.
Figure 14.
Variation of the principal stresses with time.
Figure 15.
Principal stress contour graphs for NSx/EWy solutions.
Figure 16.
Principal stress contour graphs for NSy/EWx solutions.
Figure 17.
Plastic deformation contour graphs for NSx/EWy solutions.
Figure 18.
Plastic deformation contour graphs for NSy/EWx solutions.
Minaret-type structures can be classified as tower-type structures. One of the critical issues in such structures is the stress concentration that may occur in transition zones. The collapse of the Imam-ı Azam Mosque minarets is likely associated with the inability of this region to accommodate stress increases. Reducing stress concentrations in these zones could potentially improve the structural performance and reduce the likelihood of similar damage. For this type of structure, various strengthening strategies may be considered to address stress concentrations in critical regions. Steel confinement rings and fiber-reinforced composite applications are among the possible approaches. While such measures may be applied to existing structures, careful consideration of transition zones in the design of new structures may also contribute to improved seismic performance. In this context, avoiding abrupt geometric discontinuities can be considered a practical and straightforward approach.
Additionally, previous model updating studies have largely relied on user experience. Based on the weights determined using the proposed MCDM method, the dynamic model of the structure can be evaluated more rapidly and on a more scientific basis, with reduced reliance on experience. The model-updating process required in each analysis proceeds quite slowly when using traditional methods. With the proposed method, repeated analyses can be carried out more quickly and efficiently.
5. Conclusions
In this study, the seismic performance of a masonry minaret damaged during the 6 February 2023 earthquakes was evaluated using a model-updating approach based on operational modal analysis data. The results were assessed by comparing numerical predictions with observed structural behavior.
The main contribution of this study lies in the combined use of pre-earthquake operational modal analysis data, multi-criteria decision-making methods, and real earthquake ground motion records within a unified framework. This approach enables a direct comparison between numerical results and observed damage patterns, providing a data-driven and objective assessment of structural behavior. In this context, the study offers a practical methodology for evaluating the seismic performance of historical masonry structures.
Initial modal analyses showed differences in frequency and mode shapes of up to 13.7% and 9.7%, respectively. After applying MCDM methods to a large set of model variants, these differences were reduced to 2.0% and 9.2%, indicating a significant improvement in the agreement between numerical and experimental results. Nonlinear earthquake analyses performed using the updated model showed collapse at 71.25 s and 73.48 s in the x and y directions, respectively. Similar trends observed in peak displacement, base shear forces, and principal stresses can be attributed to the approximately symmetrical geometry of the minaret.
The nonlinear time–history analyses showed that the maximum principal stresses were concentrated near the transition zone of the minaret, indicating a high potential for damage in this region. These stresses exceeded the estimated tensile strength of the masonry in certain areas, while the minimum principal stresses remained below the compressive strength, indicating a low probability of compressive failure. The results suggest that damage is primarily governed by tensile effects. The collapse pattern obtained from the simulations showed good qualitative agreement with the observed failure mechanism during the 6 February 2023 earthquakes, where the minaret collapsed from the upper transition segment. This indicates that the finite element model can capture key aspects of the seismic behavior and collapse mechanism of the structure.
In addition, the study demonstrates that model updating based on operational modal analysis improves the agreement between numerical and experimental results. The application of Multi-Criteria Decision-Making (MCDM) methods proved to be an effective tool in the model-updating process, providing a systematic approach for selecting model parameters and enhancing the reliability of the simulation outcomes.
It is well established in the literature that transition zones are among the most vulnerable regions in slender masonry structures such as minarets. The concentration of stress observed in these zones during the nonlinear analyses is consistent with this understanding. For the Imam-ı Azam Mosque minaret, reducing stress concentrations in the transition zone may improve structural performance. Therefore, targeted reinforcement strategies should be considered for such critical regions. Among the applicable solutions are steel confinement rings and fiber-reinforced composite applications. For newly designed minaret-type structures, enhancing the strength of transition zones or avoiding abrupt geometric discontinuities can contribute to improved seismic resilience.
Future studies may further extend the present work by incorporating the vertical component of ground motion, investigating different material modeling approaches, and validating the proposed methodology through additional case studies and experimental investigations. In addition, applying the proposed framework to different types of historical masonry structures could improve its general applicability.
The findings and strengthening recommendations of this study are based on a single case study and a specific ground–motion record; therefore, they should be interpreted within this scope and further supported by additional analytical and experimental studies.
Funding
This research received no external funding.
Data Availability Statement
The data presented in this study are available in [TADAS] at [https://tadas.afad.gov.tr/, accessed on 28 February 2026].
Conflicts of Interest
The authors declare no conflicts of interest.
References
- TBEC 2018; Turkish Building Earthquake Code 2018. Disaster and Emergency Management Agency (AFAD): Ankara, Türkiye, 2018.
- Dedeoğlu, İ.Ö.; Yetkin, M.; Calayır, Y. Seismic performance of masonry structures in the rural area during the November 23, 2022, Düzce-Gölyaka earthquake. J. Build. Eng. 2024, 96, 110373. [Google Scholar] [CrossRef] [Scilit]
- Yetkin, M.; Dedeoğlu, İ.Ö.; Tunç, G. February 6, 2023, Kahramanmaraş twin earthquakes: Evaluation of ground motions and seismic performance of buildings for Elazığ, southeast of Türkiye. Soil Dyn. Earthq. Eng. 2024, 181, 108678. [Google Scholar] [CrossRef] [Scilit]
- Karatas, I.; Budak, A. Deep learning-based recognition of construction activities in real construction site environment. Eng. Constr. Archit. Manag. 2026, 33, 1536–1555. [Google Scholar] [CrossRef] [Scilit]
- Dedeoğlu, İ.Ö.; Yetkin, M.; Calayır, Y.; Erkek, H. January 24, 2020 Sivrice-Elazığ (Türkiye) earthquake: The seismic assessment of the earthquake territory, Geotechnical findings and performance of masonry buildings. Iran. J. Sci. Technol. Trans. Civ. Eng. 2024, 48, 2393–2412. [Google Scholar] [CrossRef] [Scilit]
- Yetkin, M.; Calayır, Y.; Sayın, E.; Karaton, M. Nonlinear seismic behavior of a historical dam for different soil groups. Sigma J. Eng. Nat. Sci. 2018, 36, 1009–1022. [Google Scholar]
- Valente, M. Seismic vulnerability assessment and earthquake response of slender historical masonry bell towers in South-East Lombardia. Eng. Fail. Anal. 2021, 129, 105656. [Google Scholar] [CrossRef] [Scilit]
- Valente, M. Earthquake response and damage patterns assessment of two historical masonry churches with bell tower. Eng. Fail. Anal. 2023, 151, 107418. [Google Scholar] [CrossRef] [Scilit]
- Işık, E.; Avcil, F.; Harirchian, E.; Arkan, E.; Bilgin, H.; Özmen, H.B. Architectural characteristics and seismic vulnerability assessment of a historical masonry minaret under different seismic risks and probabilities of exceedance. Buildings 2022, 12, 1200. [Google Scholar] [CrossRef] [Scilit]
- Yetkin, M. Operational modal analysis method application and seismic performance evaluation for an iconic historical building constructed with different construction materials: Historical Elazığ Government Office (Türkiye). Case Stud. Constr. Mater. 2024, 21, e04111. [Google Scholar] [CrossRef] [Scilit]
- Karataş, İ.; Budak, A. Influence on construction waste of the lean–building information modelling interaction. Proc. Inst. Civ. Eng. Eng. Sustain. 2024, 177, 242–255. [Google Scholar] [CrossRef] [Scilit]
- Erkek, H.; Yetkin, M.; Calayır, Y. Investigation of the earthquake behavior of the historical Adana Great Clock Tower using FEM updated based on environmental vibration data. Rev. Construcción 2024, 23, 335–353. [Google Scholar] [CrossRef] [Scilit]
- Kocaman, İ.; Gedik, Y.; Okuyucu, D. Assessment of seismic behavior of historical masonry cupolas: Case of Emir Saltuk Cupola. J. Build. Eng. 2024, 82, 108275. [Google Scholar] [CrossRef] [Scilit]
- Erkek, H.; Yetkin, M. Assessment of the performance of a historic minaret during the Kahramanmaraş earthquakes (Mw 7.7 and Mw 7.6). Structures 2023, 58, 105620. [Google Scholar] [CrossRef] [Scilit]
- Yetkin, M.; Calayır, Y.; Erkek, H. Determining dynamic characteristics of reinforced concrete minarets and updating their finite element models using environmental vibration data. Fırat Univ. Turk. J. Sci. Technol. 2018, 13, 93–98. [Google Scholar]
- Calayır, Y.; Yetkin, M.; Erkek, H. Finite element model updating of masonry minarets by using operational modal analysis method. Structures 2021, 34, 3501–3507. [Google Scholar] [CrossRef] [Scilit]
- Karatas, I. Deep learning-based system for prediction of work at height in construction site. Heliyon 2025, 11, e41779. [Google Scholar] [CrossRef] [Scilit] [PubMed]
- Yetkin, M.; Erkek, H.; Calayır, Y. Comparison of measurements with and without reference in operational modal analysis method: A minaret example. J. Inst. Sci. Technol. 2021, 11, 2069–2078. [Google Scholar] [CrossRef] [Scilit]
- Belay, S.; Goedert, J.; Woldesenbet, A.; Rokooei, S. AHP-based multi-criteria decision analysis of success factors to enhance decision making in infrastructure construction projects. Cogent Eng. 2022, 9, 2043996. [Google Scholar] [CrossRef] [Scilit]
- Monghasemi, S.; Nikoo, M.R.; Khaksar Fasaee, M.A.; Adamowski, J. A novel multi-criteria decision making model for optimizing time–cost–quality trade-off problems in construction projects. Expert Syst. Appl. 2015, 42, 3089–3104. [Google Scholar] [CrossRef] [Scilit]
- Nilashi, M.; Zakaria, R.; Ibrahim, O.; Majid, M.Z.A.; Zin, R.M.; Farahmand, M. MCPCM: A DEMATEL-ANP-based multi-criteria decision-making approach to evaluate the critical success factors in construction projects. Arab. J. Sci. Eng. 2015, 40, 343–361. [Google Scholar] [CrossRef] [Scilit]
- Pamučar, D.; Ćirović, G. The selection of transport and handling resources in logistics centers using MABAC. Expert Syst. Appl. 2015, 42, 3016–3028. [Google Scholar] [CrossRef] [Scilit]
- Sánchez-Garrido, A.J.; Navarro, I.J.; Yepes, V. Multi-criteria decision-making applied to the sustainability of building structures based on Modern Methods of Construction. J. Clean. Prod. 2022, 330, 129724. [Google Scholar] [CrossRef] [Scilit]
- Wang, Z.; Rangaiah, G.P.; Wang, X. Preference ranking on the basis of ideal-average distance method for multi-criteria decision-making. Ind. Eng. Chem. Res. 2021, 60, 11216–11230. [Google Scholar] [CrossRef] [Scilit]
- Chen, L.; Pan, W. Review fuzzy multi-criteria decision-making in construction management using a network approach. Appl. Soft Comput. 2021, 102, 107103. [Google Scholar] [CrossRef] [Scilit]
- Jato-Espino, D.; Castillo-Lopez, E.; Rodriguez-Hernandez, J.; Canteras-Jordana, J.C. A review of application of multi-criteria decision making methods in construction. Autom. Constr. 2014, 45, 151–162. [Google Scholar] [CrossRef] [Scilit]
- Zhu, X.; Meng, X.; Zhang, M. Application of multiple criteria decision making methods in construction: A systematic literature review. J. Civ. Eng. Manag. 2021, 27, 372–403. [Google Scholar] [CrossRef] [Scilit]
- Dudek, A.; Jefmański, B. The fuzzy TOPSIS method and its implementation in the R programme. Inform. Ekon. 2015, 1, 19–27. [Google Scholar] [CrossRef] [Scilit]
- Emovon, I.; Oghenenyerovwho, O.S. Application of MCDM method in material selection for optimal design: A review. Results Mater. 2020, 7, 100115. [Google Scholar] [CrossRef] [Scilit]
- Tan, T.; Mills, G.; Papadonikolaki, E.; Liu, Z. Combining multi-criteria decision making (MCDM) methods with building information modelling (BIM): A review. Autom. Constr. 2021, 121, 103451. [Google Scholar] [CrossRef] [Scilit]
- Chatterjee, K.; Zavadskas, E.K.; Tamošaitiene, J.; Adhikary, K.; Kar, S. A hybrid MCDM technique for risk management in construction projects. Symmetry 2018, 10, 46. [Google Scholar] [CrossRef] [Scilit]
- Đoković, L.; Doljanica, D. Application of AHP and MABAC methods in the framework of multi-criteria decision-making in the selection of investment projects. J. Process Manag. New Technol. 2023, 11, 105–114. [Google Scholar] [CrossRef] [Scilit]
- Matić, B.; Jovanović, S.; Das, D.K.; Zavadskas, E.K.; Stević, Z.; Sremac, S.; Marinković, M. A New Hybrid MCDM Model: Sustainable Supplier Selection in a Construction Company. Symmetry 2019, 11, 353. [Google Scholar] [CrossRef] [Scilit]
- Gao, Z.; Liang, R.Y.; Xuan, T. VIKOR method for ranking concrete bridge repair projects with target-based criteria. Results Eng. 2019, 3, 100018. [Google Scholar] [CrossRef] [Scilit]
- Lam, W.S.; Lam, W.H.; Jaaman, S.H.; Liew, K.F. Performance Evaluation of Construction Companies Using Integrated Entropy–Fuzzy VIKOR Model. Entropy 2021, 23, 320. [Google Scholar] [CrossRef] [Scilit]
- Mardani, A.; Zavadskas, E.K.; Govindan, K.; Senin, A.A.; Jusoh, A. VIKOR Technique: A Systematic Review of the State of the Art Literature on Methodologies and Applications. Sustainability 2016, 8, 37. [Google Scholar] [CrossRef] [Scilit]
- Park, M.; Wang, Z.; Li, L.; Wang, X. Multi-objective building energy system optimization considering EV infrastructure. Appl. Energy 2023, 332, 120504. [Google Scholar] [CrossRef] [Scilit]
- Hwang, C.L.; Yoon, K. Multiple Attribute Decision Making: Methods and Applications; Springer: Berlin, Germany, 1981. [Google Scholar]
- Gaur, S.; Dosapati, S.; Tawalare, A. Stakeholder assessment in construction projects using a CRITIC-TOPSIS approach. Built Environ. Proj. Asset Manag. 2023, 13, 217–237. [Google Scholar] [CrossRef] [Scilit]
- Wei, J.; Lin, X. The multiple attribute decision-making VIKOR method and its application. In Proceedings of the 4th International Conference on Wireless Communications, Networking and Mobile Computing; The Institute of Electrical and Electronics Engineers, Inc.: New York, NY, USA, 2008; pp. 1–4. [Google Scholar]
- Opricovic, S. Multicriteria optimization of civil engineering systems. Fac. Civ. Eng. 1998, 2, 5–21. [Google Scholar]
- Mobarhan Zad, S.; Rahai, M.; Ranjbar, S.; Moghadas Nejad, F. Structural damage analysis using finite element model updating enhanced by response surface methodology. Sci. Rep. 2026, 16, 1066. [Google Scholar] [CrossRef] [Scilit] [PubMed]
- Di Re, P.; Vangelisti, I.; Lofrano, E. Influence of the objective function in the dynamic model updating of girder bridge structures. Buildings 2025, 15, 341. [Google Scholar] [CrossRef] [Scilit]
- Tran, M.Q.; Sousa, H.S.; Matos, J.; Fernandes, S.; Nguyen, Q.T.; Dang, S.N. Finite Element Model Updating for Composite Plate Structures Using Particle Swarm Optimization Algorithm. Appl. Sci. 2023, 13, 7719. [Google Scholar] [CrossRef] [Scilit]
- Panjwani, S.; Kumar, S.N.; Ahuja, L. Multi-criteria decision making and its applications. Int. J. Innov. Technol. Explor. Eng. 2019, 8, 149–153. [Google Scholar] [CrossRef] [Scilit]
- Zavadskas, E.K.; Antuchevičienė, J.; Kapliński, O. Multi-criteria decision making in civil engineering. Part II—Applications. Eng. Struct. Technol. 2015, 7, 151–167. [Google Scholar] [CrossRef] [Scilit]
- Gallo, W.W.C.; Clemett, N.; Gabbianelli, G.; O’Reilly, G.; Monteiro, R. Influence of parameter uncertainty in multi-criteria decision-making. J. Earthq. Eng. 2023, 27, 1769–1794. [Google Scholar] [CrossRef] [Scilit]
- Shmlls, M.; Abed, M.; Fořt, J.; Horvath, T.; Bozsaky, D. Towards closed-loop concrete recycling: Life cycle assessment and multi-criteria analysis. J. Clean. Prod. 2023, 410, 137179. [Google Scholar] [CrossRef] [Scilit]

Disclaimer/Publisher’s Note: The statements, opinions and data contained in all publications are solely those of the individual author(s) and contributor(s) and not of MDPI and/or the editor(s). MDPI and/or the editor(s) disclaim responsibility for any injury to people or property resulting from any ideas, methods, instructions or products referred to in the content. |
© 2026 by the author. Licensee MDPI, Basel, Switzerland. This article is an open access article distributed under the terms and conditions of the Creative Commons Attribution (CC BY) license.