


Abstract
Glass-Fiber-Reinforced Polymer (GFRP) bars are emerging as an alternative to steel reinforcement in concrete structures thanks to their high mechanical performance and intrinsic resistance to corrosion. Nevertheless, their actual sustainability must be verified through an assessment that considers long-term durability, life cycle environmental impacts, and economic feasibility. The replacement of steel reinforcement with GFRP in concrete bridge decks is herein evaluated through an integrated methodology. First, a comprehensive literature review examines the degradation processes observed experimentally and the associated long-term evolution of mechanical properties, providing the basis for defining realistic durability scenarios. Subsequently, a comparative Life Cycle Assessment is conducted adopting a cradle-to-grave system boundary and using Environmental Product Declarations to build the Life Cycle Inventory and perform the Impact Assessment. Normalization and weighting phases are included for a better understanding of the overall impacts of the two alternatives. In parallel, a Cost Analysis is performed consistently with the system boundaries and scenarios considered in the Life Cycle Assessment. Finally, the Envision protocol, a framework to evaluate sustainability and resilience of infrastructures, is applied to identify credits directly influenced by the adoption of GFRP reinforcement. The results show that steel reinforcement exhibits lower initial environmental impacts and remains more economical over short service life horizons. However, if the extended durability of GFRP is considered, the reduction in heavy maintenance activities allows this solution to achieve superior environmental performance and improved economic balance. The Envision-based evaluation further confirms the potential contribution of GFRP reinforcement to higher sustainability ratings in infrastructure projects.
1. Introduction
The durability of reinforced concrete structures is a critical concern in civil engineering, particularly in aggressive exposure environments where conventional steel reinforcement is susceptible to corrosion. This degradation mechanism progressively impairs the structural performance and reduces reliability over time. Consequently, frequent maintenance interventions are required, resulting in substantial economic burdens and adverse environmental impacts. The necessity to ensure long-term structural performance has increased interest in alternative materials capable of mitigating corrosion-related deterioration. In this context, Glass-Fiber-Reinforced Polymer (GFRP) reinforcement has emerged as a viable substitute for conventional steel reinforcement [1,2]. Owing to its inherent corrosion resistance, GFRP eliminates the primary degradation processes typically affecting steel-reinforced concrete structures [3]. This feature reduces the need for repair or replacement interventions, thereby diminishing the associated economic and environmental impacts [4,5]. Although corrosion resistance is a primary advantage, the long-term durability of GFRP bars is governed by multiple degradation mechanisms affecting the fibers, the polymeric matrix, and the fiber-matrix interfacial region. Exposure to aggressive environments progressively weakens these constituents, while sustained loading conditions can further accelerate deterioration processes. Nevertheless, available experimental evidence suggests that GFRP bars can exhibit satisfactory long-term performance under a wide range of environmental conditions, making them a suitable solution for applications where durability and reduced maintenance are critical requirements. In addition to the intrinsic properties of GFRP reinforcement, its manufacturing processes, which are still in relatively early stages of industrial development, are characterized by high energy demand, resulting in greater initial environmental impacts and higher production costs compared to conventional steel reinforcement [6]. The balance between these higher initial burdens and potential long-term durability advantages therefore emphasizes the need for comprehensive analyses that compare different reinforcement solutions across their entire life cycle.
Sustainability considerations in the construction sector have promoted the systematic adoption of methodologies that quantify environmental impacts throughout the production, operational, and end-of-life phases of a system. In this context, Life Cycle Assessment (LCA) has become a fundamental analytical tool for the comprehensive evaluation of environmental burdens, in accordance with internationally recognized Standards such as ISO 14040 [7] and ISO 14044 [8]. LCA comprises four main phases: goal and scope definition, life cycle inventory, life cycle impact assessment, and interpretation. To improve result interpretation, optional procedures such as normalization and weighting can be incorporated. These procedures facilitate the comparison of impact categories and clarify the relative importance of specific environmental indicators, enabling the derivation of aggregated scores for a more comprehensive and simplified evaluation of the overall environmental performance [9].
The environmental assessment of GFRP rebars is increasingly relevant in the context of sustainable infrastructure design, with LCA being the established methodology for quantifying impacts associated with material production, use, maintenance, and end-of-life stages. Accordingly, several studies have investigated GFRP reinforcement using different functional units, system boundaries, and service life assumptions, identifying the main variables influencing environmental performance. These studies generally reported lower environmental impacts compared to conventional steel reinforcement, when equivalent structural performance was considered.
Isildar et al. [10] compared the manufacturing impacts of GFRP and steel rebars, showing that while GFRP exhibits higher impacts on an equal mass basis due to its energy-intensive production, this trend is reversed when comparisons are made based on equivalent structural performance. Assuming that the mass of GFRP required to achieve the same performance is approximately one quarter of that of steel, and that its service life is twice as long, the environmental profile shifts in favor of GFRP in most impact categories, highlighting the importance of mass and durability assumptions.
Sbahieh et al. [11] conducted a cradle-to-gate LCA and reported that GFRP rebars perform better than steel in ten out of fourteen impact categories, including climate change, fossil fuel depletion, heat stress, and water consumption. The authors further showed that the environmental impact of reinforced concrete elements is dominated by cement and reinforcement materials, while the contribution of water is comparatively limited, even when alternative water sources are considered. Several studies extended the assessment to cradle-to-grave system boundaries to explicitly account for durability and maintenance effects. Al Omar et al. [12] reported that GFRP rebars emit approximately 17% less carbon dioxide equivalent than steel over their entire life cycle on a mass basis, with reductions increasing to between 77.9% and 85.3% when the lower mass required for equivalent structural performance is considered.
Cadenazzi et al. [13] assessed a reinforced concrete bridge designed for a 100-year service life using FRP reinforcement and compared it with a steel-reinforced alternative requiring reconstruction to match the same duration. While construction-stage impacts were similar, the FRP solution showed lower impacts in most categories over the full life cycle, with normalized results confirming the marginal relevance of the categories where steel performed better. More recent studies have focused on aggressive environments, where durability plays a critical role. Dong et al. [14] showed that GFRP-reinforced seawater–sea sand concrete beams exhibit reductions of up to 26% in climate change impacts compared to steel-reinforced beams when equal service life is assumed, with further advantages observed when longer service life or increased transport distances are considered.
Cadenazzi et al. [15] reported comparable cradle-to-gate impacts for steel- and GFRP-reinforced flood mitigation channels, but significantly lower cradle-to-grave impacts for the GFRP solution due to substantially reduced maintenance requirements.
Overall, the reviewed studies consistently demonstrate that the environmental performance of GFRP reinforcement is strongly influenced by its lower mass, extended service life, and reduced maintenance needs. Although GFRP production may entail higher impacts on a mass basis, LCA comparisons aligned to equivalent structural performance and realistic service life assumptions generally indicate that GFRP rebars can achieve lower life cycle environmental impacts than conventional steel reinforcement. Nevertheless, several critical aspects require further investigation. The production of GFRP involves significant energy consumption and the use of non-renewable resources, primarily associated with the manufacturing of glass fibers [10]. Furthermore, recycling options for GFRP are still limited; the inherent difficulty of separating fibers from the polymeric matrix restricts end-of-life recovery processes, which often results in landfilling [16]. Recent research has investigated alternative strategies, including the incorporation of GFRP into concrete or asphalt through the partial replacement of aggregates with macro-fibers, thereby enhancing mechanical performance and promoting sustainability [17,18]. In contrast, steel exhibits a high degree of circularity, as reinforcement bars typically contain over 95% recycled content, significantly reducing the demand for raw materials and their associated environmental impacts [19].
Alongside environmental considerations, economic aspects play a pivotal role in guiding sustainable decision-making in infrastructure design. A comprehensive evaluation of initial, maintenance, and end-of-life costs allows for a more accurate understanding of the long-term implications of different reinforcement solutions. Owing to their enhanced corrosion resistance and reduced maintenance requirements, GFRP-reinforced structures have been shown to offset their higher initial costs through substantial long-term savings compared to steel-based solutions [13,15]. Therefore, only an approach that integrates both environmental and economic perspectives can provide an accurate and holistic assessment of sustainable alternatives in structural design. In this context, sustainability rating systems are increasingly adopted by owners, planners, designers and stakeholders, serving as structured frameworks to support informed decision-making in infrastructure development. The sustainability of infrastructure projects can be assessed through internationally recognized protocols such as ENVISION [20], LEED for Infrastructure [21], BREEAM Infrastructure [22], and the Infrastructure Sustainability (IS) rating scheme [23]. These frameworks provide standardized methodologies to evaluate environmental, social, and economic performance across the entire life cycle of a project. Their application enables transparent and comparable assessments, supports evidence-based decision-making, and promotes the adoption of best practices, ultimately fostering more resilient, resource-efficient, and socially acceptable infrastructure developments. Among these protocols, ENVISION has been identified as one of the most comprehensive and up-to-date rating frameworks.
The proposed integrated LCA–Envision framework aims to deliver a comprehensive sustainability assessment of steel and GFRP reinforcement systems, extending the evaluation beyond conventional environmental and economic indicators to encompass a broader, multi-criteria perspective. The study combines a critical review of the long-term performance of GFRP bars with a comparative Life Cycle Assessment conducted in accordance with current standards, adopting a cradle-to-grave system boundary and considering realistic durability scenarios through the systematic introduction of durability-adjusted Service Life Factors (SLFs), which explicitly account for differences in the expected service life of the reinforcement materials within the LCA framework. In contrast to previous studies, which typically assume identical reference service lives for steel and FRP reinforcement, the present methodology directly incorporates anticipated durability differentials into the environmental assessment, thereby establishing a more rigorous and realistic basis for evaluating the long-term sustainability performance of alternative reinforcement strategies.
While existing LCA studies generally report favorable environmental performance of GFRP reinforcement compared to steel, the assumptions adopted for steel production are not always explicitly specified. Based on the unitary impact values reported, these assessments appear to be representative of steel produced through blast furnace–basic oxygen furnace routes, typically associated with virgin steel production. In contrast, current steel reinforcement is predominantly manufactured via electric arc furnace processes with high contents of recycled material, resulting in substantially lower environmental impacts. This paper explicitly addresses this gap by reassessing the comparative environmental performance of GFRP and steel reinforcement using life cycle inventory data representative of current recycled steel production.
The present study addresses these limitations through an integrated assessment that differs from previous work in several respects. The comparison is structured around three service life scenarios (50, 75, and 100 years) using SLF as a scaling tool to adjust the impacts of the steel-reinforced solution proportionally, thereby ensuring a durability-informed and internally consistent basis for comparison. A further distinguishing aspect concerns the life cycle inventory data adopted for steel reinforcement. Most existing studies rely on datasets representative of virgin steel produced via the blast furnace, basic oxygen furnace route, which carries a Global Warming Potential of approximately 3 kg CO2 eq./kg. The present work instead adopts EPD-based data for electric arc furnace steel with high recycled content, consistent with current European production practice and associated with substantially lower emission values. This choice reflects actual market conditions and avoids a systematic overestimation of the environmental burden of steel. The Life Cycle Inventory is built entirely from certified Environmental Product Declarations, ensuring full traceability of input data. Finally, the quantitative outcomes of the LCA and cost analysis are interpreted within the Envision sustainability rating framework, translating environmental and economic results into infrastructure sustainability credits, a connection not previously established in the literature. By explicitly considering recycled steel production, the present study offers a comparison that better reflects current market conditions and avoids overestimating the environmental burden associated with steel reinforcement.
This approach yields a more accurate and contextually relevant comparison between the two reinforcement solutions, enabling a critical reassessment of the environmental benefits commonly ascribed to GFRP in the existing literature. The analysis thereby contributes to a more nuanced and evidence-based understanding of the sustainability trade-offs inherent in reinforcement material selection, with particular relevance to structural applications in which durability constitutes a primary design criterion.
2. Durability of GFRP Reinforcements
The long-term durability of GFRP reinforcement has been extensively investigated due to the susceptibility of glass fibers, polymer matrix and fiber-matrix interface to degradation induced by moisture, alkaline environments, elevated temperatures and sustained mechanical loading. Micelli and Nanni [24] demonstrated that alkaline exposure is the predominant contributor to degradation, whereas other environmental conditions have a comparatively minor effect. Benmokrane et al. [25] evaluated GFRP bars manufactured using vinyl ester, polyester, and epoxy resins under accelerated alkaline conditions, reporting that vinyl ester and epoxy bars retained superior mechanical performance, while polyester bars exhibited more rapid deterioration. In a subsequent study, Benmokrane et al. [26] examined the influence of the bar diameter and confirmed that degradation is predominantly surface-driven and more pronounced in larger bars. Field investigations by Sakuraba et al. [27] confirmed these findings, employing interlaminar shear strength to assess degradation due to moisture ingress and surface cracking. Furthermore, predictive models proposed by Valter and Ralejs [28] and Chen et al. [29] demonstrated that accelerated aging tests are essential for estimating long-term performance, particularly with respect to tensile strength, which is widely recognized as the most critical parameter for design applications and service-life assessments, as it governs the structural integrity and load bearing capacity of reinforced concrete elements over time. For this reason, particular emphasis is deliberately placed on the assessment of the residual tensile strength, either measured after defined conditioning periods or extrapolated through validated predictive models. This parameter represents a fundamental basis for durability evaluation, supports the definition of realistic service life scenarios and provides insights into the applicability of GFRP reinforcement in both conventional and long-term structural applications. The focus on tensile performance is further supported by the extensive research conducted by Saad et al. [30] on the bond behavior of GFRP bars, which has shown that bond strength is not significantly influenced by aggressive environments. Numerous studies have examined GFRP bars embedded in concrete and exposed to alkaline and acidic solutions, seawater, and direct sunlight, confirming that the bond performance of GFRP bars remains essentially unchanged under such degrading agents, regardless of exposure duration. Consequently, durability characterization based on tensile strength retention provides a reliable basis for identifying the main degradation processes and clarifying the long-term behavior of GFRP bars.
Moisture-induced degradation has been examined thoroughly. Robert et al. [31] investigated concrete-embedded bars conditioned in water between 23 °C and 50 °C for 240 days, reporting a reduction in tensile strength from 788 MPa to 665 MPa under the most severe condition. Using Arrhenius extrapolation, the authors estimated that at low environmental temperatures close to 6 °C, GFRP would retain 90% of its strength for approximately one year, whereas a 75% retention threshold may correspond to a service life exceeding 210 years. These findings indicate that moisture alone, without the accelerating effect of temperature, induces only limited deterioration.
The influence of saline exposure has also been evaluated. Robert and Benmokrane [32] conditioned sand-coated bars in a 3% sodium chloride solution at temperatures ranging from 23 °C to 70 °C for up to 365 days. Although strength losses remained modest, with a decrease from 788 MPa to a minimum value of 702 MPa, temperature was found to be the dominant factor. According to Arrhenius projections, a 25% strength reduction would occur after 200 years at 10 °C and only 35 years at 50 °C, whereas a 30% reduction would be reached after 200 years in the latter conditions. These results confirm that chloride exposure becomes critical primarily when combined with elevated temperature.
Marine environments have been investigated through field-simulated studies. Morales et al. [33] examined bars embedded in seawater concrete under subtropical conditions of 25 °C and 71% relative humidity and compared them with specimens immersed in seawater at 60 °C. After 24 months, field-conditioned bars retained between 86% and 98.7% of their tensile strength, whereas immersion at 60 °C produced significantly lower retention values between 70% and 73.5%. These observations highlight the protective role of concrete, which mitigates chloride ingress and slows degradation.
Alkaline attack is generally recognized as the most severe degradation mechanism for GFRP reinforcement. Arczewska et al. [34] conditioned bars from two manufacturers in alkaline solutions at 50 °C to 70 °C for periods of up to five months and developed a diffusion-based degradation model. Predictions indicate that tensile strength retention exceeds 80% after more than 150 years, based on specimens aged for five months at 70 °C. The study also revealed a clear correlation between bar diameter and degradation rate, with smaller bars degrading more rapidly due to a higher surface-to-volume ratio. Long-term projections showed that an 8 mm bar could experience more than four times the strength loss of a 35 mm bar after 100 years. However, Benmokrane et al. [26] reported opposite trends, with higher degradation observed in larger bars. These inconsistencies emphasize the influence of manufacturing parameters such as fiber volume fraction, resin formulation and surface coating, highlighting the need for standardized characterization protocols. Standardized alkaline resistance tests have also been conducted. Nanni et al. [35] conditioned un-loaded bars from two manufacturers in alkaline solutions at 60 °C for at least 90 days according to ASTM D7705 [36]. The specimens retained approximately 89% of their initial tensile strength, confirming adequate resistance under standardized testing conditions.
The combined effects of chemical exposure, mechanical loading and environmental cycling have also been examined. Lu et al. [37] reported that bare bars retained approximately 70% of their strength after 180 days in alkaline conditions and about 80% after saline exposure. For concrete-embedded specimens subjected to wet and dry saline cycles and sustained loading, retention remained approximately 90%, with sustained load accelerating degradation by up to 5%. Using the methodology of Fib Bulletin 40 [38], the authors projected a long-term strength retention range between 63% and 75% over 100 years, depending on temperature and humidity.
Additional investigations addressed the combined effects of sustained loading and elevated temperature. Debaiky et al. [39] exposed bars of different diameters to temperatures of up to 73 °C under sustained stresses ranging from 19% to 29% of the guaranteed tensile strength. Substantial deterioration was observed when elevated temperature, sustained load and aggressive exposure acted simultaneously. Particularly, rebars with a diameter of 12.7 mm aged in an alkaline solution for four months at 57 °C under sustained loading exhibited a tensile strength retention of 83.0%. The authors noted, however, that such conditions represent conservative worst-case scenarios and do not reflect typical service conditions, particularly for bars embedded in concrete.
Long-term field performance has been also validated by studies on existing infrastructure. Al-Khafaji et al. [40] extracted bars from eleven bridges that had been in service for 15 to 20 years. The assessed strength loss after two decades was approximately 2.5%. When extrapolated to 100 years, residual strength ranged between 85.0% assuming linear degradation and 96.4% assuming logarithmic degradation. These findings confirm that laboratory-based accelerated aging generally overestimates on-field deterioration.
Collectively, the literature demonstrates that degradation of GFRP bars is governed primarily by temperature, chemical exposure, sustained load and, in some cases, bar diameter. Alkaline environments and elevated temperatures induce the most significant deterioration, whereas moisture and saline environments are generally less harmful unless combined with high temperature or mechanical stress. Concrete consistently provides a protective barrier that significantly reduces degradation rates. These observations support the long-term durability of GFRP reinforcement in concrete structures, particularly in cold and moderate climates. Table 1 summarizes the findings collected through the literature review on the durability characterization of GFRP bars, with a focus on their tensile strength retention. Overall, the experimental and predictive data show that even under aggressive conditioning regimes, GFRP bars retain tensile strength levels that meet or exceed the 80% threshold prescribed by ASTM standard D7957 [41] for alkaline exposure after 90 days at 60 °C, supporting projections of potential service lives exceeding 100 years.
Table 1.
Summary of tensile strength retentions of rebars in alkaline environments.
These inconsistencies emphasize the influence of manufacturing parameters on long-term durability. Resin formulation is among the most critical factors: polyester bars exhibit tensile strength losses of approximately 25% after 5000 h at 60 °C, compared to 14% for vinyl ester and epoxy systems, with interlaminar shear strength retention reaching 87% for vinyl ester and epoxy against 79% for polyester [26]. The fiber type also plays a fundamental role: alkali-resistant glass fibers retain approximately 75% of their strength after 540 days at 60 °C, whereas E-glass fibers under the same conditions lose nearly 59% of their initial strength [39]. Alternative fiber systems such as basalt show predicted tensile strength retention of approximately 72% at 100 years in concrete environments [42], comparable to or slightly lower than standard GFRP under moderate conditions. The fiber volume fraction further affects durability through its influence on water absorption: bars with high fiber content (approximately 84% by weight) absorb only 0.63% water, whereas lower fiber content systems, typical of polyester-based products, reach 1.15%, accelerating the ingress of aggressive agents [5]. Surface treatment represents an additional source of variability: after 20 years of tidal zone exposure, ribbed bars retain 84.4% of their interlaminar shear strength, while sand-coated bars retain 78.1%, reflecting the greater surface area exposed to aggressive agents in the latter [43]. Bar diameter also affects degradation rate, as smaller bars present a higher surface-to-volume ratio: 10 mm bars retain 72–77% of tensile strength after six months in alkaline solution, compared to 83–86% for 19.5 mm bars, with long-term projections indicating degradation rates up to four times higher for 8 mm bars relative to 35 mm bars [26]. Taken together, these factors imply that durability data obtained for one product cannot be directly extended to another, highlighting the need for standardized characterization protocols and product-specific testing in service life assessment.
The implementation of these predictive models is governed by the primary assumption that the single dominant degradation mechanism of the material will not change with time and temperature during the exposure, but the rate of degradation will be accelerated with the increase in temperature [29]. This convergence between real-world performance and laboratory simulations confirms that modern GFRP bars maintain their structural integrity well beyond the typical design life of structures. However, it remains critical to recognize that laboratory-based accelerated aging generally overestimates on-field deterioration, as the concrete environment shields the reinforcement from direct aggressive chemical exposure. In conclusion, the environmental reduction factors currently adopted by major design codes are considered increasingly conservative for high-durability GFRP reinforcements, supporting the assumption of a 100-year design life for the infrastructure considered in this study.
Design provisions, including ACI 440.1R-22 [44], AASHTO LRFD-GFRP (2nd edition—2018) [45] and CNR-DT 203/R1/2025 [46], incorporate residual tensile strength through environmental reduction factors applied to the guaranteed tensile strength. A residual strength retention of approximately 80% corresponds to an environmental factor of 0.8, which aligns with values recommended for moderate exposure. More severe environments are associated with reduction factors of 0.7 in AASHTO and CNR provisions, whereas ACI adopts a slightly less conservative value of 0.85. The results obtained in the present study refer to an environmental reduction factor of 0.8 and align with the ranges prescribed in these standards.
3. Methodology and Assessment Framework
The methodological LCA framework adopted in this study is structured according to ISO 14040 and ISO 14044 Standards [7,8] and integrates environmental assessment, economic analysis, and sustainability evaluation through the Envision protocol [20]. The overall structure of the analysis is illustrated in Figure 1, which presents the sequential phases and their interconnections, from initial data collection to the interpretation of results. The workflow includes the following phases:
Figure 1.
Workflow for the Life Cycle Assessment and Cost Analysis.
- Definition of goal and scope in accordance with ISO standards
- Specification of the functional unit
- Life cycle inventory analysis based on elaboration of Environmental Product Declarations (EPDs) and emission databases
- Assessment of environmental impacts including normalization and weighting
- Definition of service life scenarios accounting for durability differences
- Economic evaluation through cost analysis
- Integration of outcomes through the Envision sustainability protocol.
This integrated framework ensures methodological rigor while explicitly incorporating durability-based degradation modelling of GFRP bars into both environmental and economic assessments. This approach provides a more realistic and comprehensive basis for the comparative evaluation of steel and GFRP reinforcement alternatives in RC bridge deck applications.
3.1. Goal and Scope of the Analysis
The goal of the present LCA analysis is to evaluate and compare the environmental impacts of the life cycle of a reinforced concrete (RC) bridge deck using two alternative reinforcement solutions: conventional steel rebars and GFRP rebars. The objective is to identify the material that results in lower environmental impacts over the entire life cycle and provide insights for guiding the design of more sustainable infrastructures.
In accordance with ISO 14040 [7], the functional unit is defined as the quantified performance reference to which all inventory inputs and outputs are related. The functional unit adopted in this study is a RC bridge deck with a span length of 30 m, designed and verified to satisfy all applicable limit state requirements for both reinforcement alternatives. Both solutions fulfil the respective ULS and SLS requirements of their governing standards, ensuring that the comparison is based on code-compliant structural designs rather than on assumed equivalent cross-sections. For the GFRP-reinforced solution, SLS verifications, specifically deflection and crack width control, are more restrictive than ULS, resulting in higher reinforcement ratios compared to the steel-reinforced alternative. Regarding concrete cover, the same value as for the steel-reinforced solution was adopted conservatively for the GFRP-reinforced solution as well, since GFRP rebars are inherently corrosion-resistant and current design guidelines would in principle allow for reduced cover.
The system boundaries adopt a cradle-to-grave life cycle approach, including the production of steel, GFRP, and concrete (A1–A3 LCA stages); their transport to the construction site (A4); installation (A5); deconstruction and demolition (C1); transportation to disposal (C2); and end-of-life treatment (C3–C4). In this study, ordinary maintenance activities are excluded from the LCA. This assumption can be considered conservative, as steel-reinforced structures typically require more maintenance, particularly in aggressive environments, thereby increasing their environmental impacts.
According to ISO 14040 [7], which defines the system boundary as the set of criteria specifying which unit processes are included in the product system, the temporal extent of the analysis is defined through three service life scenarios: 50, 75, and 100 years.
The 50-year scenario corresponds to the standard design life of steel-reinforced structures, whereas the two longer scenarios are based on the enhanced durability of GFRP reinforcement. To ensure comparability and the achievement of the target service life of the longer scenarios (75 and 100 years), demolition and reconstruction of the structure are assumed for the steel-reinforced alternative.
Then, to understand the impacts of mainteinance interventions in the steel-reinforced deck, an additional alternative scenario is studied, comparing steel and GFRP and setting 100 years as service life for the infrastructure.
The analysis considers core impact categories and the associated indicators identified by ISO standards [47] and reported in Table 2. Environmental Product Declarations (EPDs) were used as the primary data source. Instead, transport-related impacts were estimated using characterization factors provided by the European Platform on LCA (EPLCA) established by the Directorate General for Environment (DG-ENV) and the Joint Research Centre (JRC) of the European Commission [48], and national emission datasets for transport. In this study, emission factors were sourced from the ISPRA portal [49], published by the Italian national environmental protection agency. Equivalent datasets released by corresponding national institutions can be adopted to apply the same methodology in other geographical contexts.
Table 2.
Core impact categories and associated impact indicators.
3.2. Definition of the Functional Unit and Life Cycle Inventory
The LCA is conducted choosing as a functional unit an RC bridge deck with a span length of 30 m, whose transverse cross section is shown in Figure 2, using the material quantities specified during its design.
Figure 2.
Transverse cross-section of the bridge deck selected as the functional unit (dimensions expressed in centimeters). The reinforcement layout of the RC slab is illustrated in Detail A, while the reinforcement layout of the RC kerbs is shown in Detail B.
The design of the reinforcement systems is carried out in accordance with a comprehensive regulatory framework, encompassing national Italian regulations, European standards, and internationally recognized guidelines. Specifically, the definition of design actions and load combinations is based on the provisions of [50,51].
For the conventional steel-reinforced concrete solution, the design follows the criteria and detailing rules prescribed in [52,53]. Conversely, the GFRP-reinforced concrete solution is designed according to the AASHTO guidelines [45]. This includes the verification of serviceability limit states (SLS) governing deflection and crack width control, which are particularly critical for GFRP due to its lower elastic modulus compared to steel.
The reinforcement design allows for the determination of the required masses of steel and GFRP, as well as the net volumes of concrete for each alternative. In line with the AASHTO LRFD Guide Specifications (2018), the design assumes adequate bond between the GFRP bars and the concrete through standard anchorage and development length requirements. In the present study, the bond behavior was not explicitly modeled; instead, the sectional analysis is based on the conventional assumption of perfect bond between the reinforcement and the concrete, thereby ensuring strain compatibility throughout the analysis.
The resulting values for both reinforcement configurations, used for the calculation of emissions, are summarized in Table 3.
Table 3.
Concrete and reinforcement net quantities.
3.3. Environmental Product Declarations as a Tool for Life Cycle Assessment
LCA models are commonly constructed using environmental databases, such as Ecoinvent [54], GaBi [55] and Athena [56], which provide structured information about materials, production processes, transport, energy use, and waste management. Commercial software tools, including SimaPro [57], OpenLCA [58], and OneClick LCA [59], typically rely on these databases to build the Life Cycle Inventory and perform impact assessment, normalization, and weighting according to established methods. These tools allow users to model the life cycle of products and infrastructures by linking individual processes to corresponding database entries. This study adopts a different approach. The procedure relies primarily on EPDs and data provided by the European Commission through the EPLCA [48] and ISPRA [49]. This allows for a targeted selection of data specific to materials and processes used for the case study, ensuring a high degree of specificity and transparency. Consequently, the approach provides more accurate control over input data and a more precise representation of the system compared with database-based methods. For the comparative analysis, EPDs for concrete, steel reinforcement, and GFRP reinforcement were used as the principal data sources.
Multiple EPDs were collected from the International and Italian EPD portals [60,61] and subsequently pre-processed prior to incorporation into the LCA framework. In total, four EPDs were used for concrete, six for steel reinforcement, and six for GFRP reinforcement. For concrete and steel, the selected EPDs were issued by Italian manufacturers, resulting in limited inter-producer variability and a dataset representative of the national production context. For GFRP reinforcement, the limited availability of publicly accessible EPDs necessitated the inclusion of datasets from internationally recognized manufacturers across different geographical contexts. The observed variability is therefore attributable primarily to differences in regional production conditions rather than to the manufacturing process itself and is expected to affect mainly region-specific impact categories such as water scarcity while exerting negligible influence on globally aggregated indicators such as Global Warming Potential.
To aggregate the information contained in the selected EPDs, Marsh et al. [62] proposed the calculation of weighted averages based on production volumes through Equation (1):
where is the weighted average of the impact associated with a specific impact category and phase of the life cycle, is the volume of production associated with the p-th EPD, and is the impact for the considered category and life cycle stage retrieved from the p-th EPD.
This procedure was applied to elaborate upon the EPD data for concrete and steel reinforcement considered in the study. The resulting weighted average values for concrete are presented in Table 4, while those for steel reinforcement are summarized in Table 5. Since production volumes and market shares for GFRP reinforcement manufacturers are not publicly available, the aggregation of EPD data was performed using arithmetic means (Table 6). This simplification may introduce distortions due to the unequal representativeness of individual producers and therefore constitutes a source of uncertainty in the LCA. This limitation is explicitly acknowledged and discussed in the results interpretation section. The resulting datasets form the basis for the subsequent Life Cycle Inventory and impact assessment phases of the study.
Table 4.
Results of weighted averages on EPDs for concrete class C35/45 (unit: 1 m3) [60,61].
Table 5.
Results of weighted averages on EPDs for steel rebars (unit: 1 kg) [60,61].
Table 6.
Results of mean averages on EPDs for GFRP rebars (unit: 1 kg) [60,61].
3.4. Normalization and Weighting
In addition to the standard LCA phases, this study applies normalization and weighting. These steps facilitate the aggregation of impact categories, enabling the derivation of overall scores that allow global comparisons between design alternatives. The methodology for both phases follows the approach developed by the DG-ENV and JRC, scientific bodies of the European Commission, through the EPLCA [48]. For normalization, the EC recommends using external normalization factors, obtained by dividing the total annual global impact of each category by the global population, thereby expressing impacts on a per capita basis, thus providing a meaningful scale for evaluating the relative magnitude of each impact category. For weighting, the EC proposes a set of factors derived using multiple analytical approaches. These values reflect the relative importance of each impact category and allow the aggregation of normalized results into a single indicator. The final score, aggregating the results of diverse impact categories, is calculated according to Equation (2):
where i is the index of the impact category, n is the total number of aggregated impact categories, is the characterized impact, is the normalization factor associated with the i-th category and is the related weighting factor. Specifically, the ratio between and results in the normalized impact for the i-th impact category, that multiplied by gives the related weighted impact.
3.5. Long-Term Scenarios Based on Durability Considerations
To account for differences in durability between steel and GFRP, a Service Life Factor (SLF) was introduced. The SLF is defined as the ratio of the service lives of the two structural solutions and is applied as a multiplicative coefficient to the environmental impacts of the steel-reinforced alternative, thus adjusting the impacts in proportion to the relative service life of the materials. The application of the SLF is of fundamental importance for the 75- and 100-year service life scenarios. In the first, the steel-reinforced solution is assigned a service life of 50 years, while the GFRP-reinforced solution is assumed to last 75 years, resulting in an SLF of 1.5. In the second scenario, the steel-reinforced solution again has a service life of 50 years, whereas the GFRP-reinforced solution is assumed to last 100 years, yielding an SLF of 2. In this way, the application of the SLF adjusts the environmental impacts of the steel-reinforced solution to account for differences in expected service life, enabling a durability-informed comparison between the two reinforcement strategies.
The selected service life values are consistent with the durability evidence discussed in Section 2 and with commonly adopted design references in bridge engineering. A service life of 100 years corresponds to the typical design working life for bridge structures according to European standards [51]. The intermediate scenario of 75 years was introduced as a transitional durability condition between conventional and corrosion-resistant reinforcement systems. Conversely, a service life of 50 years was assumed for the steel-reinforced solution, which is consistent with the reference time horizon commonly adopted in the assessment and management of existing bridges according to Italian national guidelines [63]. For the steel-reinforced solution, reconstruction at the end of the 50-year service life was assumed as a conservative modelling approach within the Life Cycle Assessment framework, acknowledging that ordinary maintenance activities are excluded from the system boundary of the present analysis.
3.6. Cost Analysis
The economic analysis evaluates the costs associated with the materials used in the structural system, which are concrete, steel reinforcement, and GFRP reinforcement, as well as the costs of installation, demolition, and transport to disposal, corresponding to the system boundaries defined for the LCA. Unit prices for concrete and steel reinforcement are obtained from the “Prezziario Regione Piemonte 2025” [64], an official and consolidated price list commonly used to define the cost of works in public procurements in the region of origin of the authors.
For GFRP reinforcement, the unit price was determined as the arithmetic mean of quotations obtained from multiple manufacturers, since no official or consolidated price list is currently available for this material. This resulted in a representative market value of 6.49 €/kg.
All the prices for materials include production, labor, equipment rental, transport, overhead, and profit.
Since the comparison involves costs occurring at different times along the life cycle, all monetary values must be discounted using the standard Net Present Value (NPV) approach with a 1% discount rate, consistent with the method adopted by Cadenazzi et al. [13].
3.7. Implementation of the Envision Protocol
The methodology proposed in this work is fully compatible with the structure of the Envision Protocol [20]. The protocol requires the definition of a baseline, corresponding in this study to the bridge deck reinforced with conventional steel rebars. This baseline is compared with the alternative solution employing GFRP reinforcement. The Envision Protocol is organized into credits, many of which are general and can be assigned to both the baseline and the alternative configuration according to the same criteria. Several credits reflect design decisions or project strategies that are independent of the reinforcement technology. For example, credits related to the use of renewable energy during the design process can be applied to both the steel- and GFRP-reinforced solutions and are thus considered baseline credits. The research proposes to identify the credits for which the adoption of GFRP reinforcement has the potential to improve performance relative to the baseline.
The methodology for assigning Envision credits is based on the comparative results of the LCA and Cost Analysis. Credits were selected based on their direct sensitivity to the choice of reinforcement material, focusing on durability, maintenance requirements, and life-cycle environmental performance. For each credit, the ‘Level of Achievement’ (from Improved to Restorative) was determined by quantifying the percentage of reduction in impacts (e.g., GWP, energy, or waste) achieved by the GFRP solution compared to the steel baseline. Specifically, the Service Life Factor (SLF) was used as a key metric to evaluate credits related to waste and emissions, as the extended durability of GFRP directly reduces the frequency of reconstruction and associated environmental burden. Table 7 summarizes the Envision credits identified as sensitive to the reinforcement material replacement, detailing the specific intent and the metric used for score assignment based on the LCA and Cost Analysis results.
Table 7.
Envision credits affected by GFRP reinforcement and evaluation criteria.
4. Results and Discussion
4.1. Life Cycle Assessment Results
4.1.1. Impacts from Phases A1 to A5
The LCA stage A begins with the production phases, A1 to A3, covering raw material extraction through manufacturing. The environmental impacts associated with each of these phases are calculated through Equation (3):
where represents the environmental impact related to the i-th phase of LCA stage A (numbered as specified in Table 4, Table 5 and Table 6). The terms and denote the reinforcement masses of the slab and kerbs, respectively, while and represent the corresponding concrete net volumes; these values are obtained from Table 3. The parameter is the impact indicator associated with the reinforcement for the considered i-th phase derived from Table 5 and Table 6, whereas denotes the indicator related to concrete, obtained from Table 4. Equation (3) is applied separately for the two reinforcement types (RTs) considered in this study. The following phase, A4, considers the impacts associated with transporting materials from production plants to the construction site. The assessment involves several preliminary steps: defining assumed transport distances for each material, determining the effective distances to be used in the analysis, estimating emissions based on the selected transport mode, and characterizing these emissions using the methods and characterization factors provided by the European Commission. In this study, stage A4 assumes generic supplier locations and fixed transport distances of 50 km for concrete and 100 km for both steel and GFRP.
This assumption is consistent with common practice in LCA studies of construction materials, where transportation contributes marginally to overall environmental impacts relative to material production stages.
The number of vehicle trips is calculated by dividing the mass of each material by the capacity of the reference vehicle, set at 16 tons. Multiplying the number of trips by the one-way distance between the production plant and the construction site, and accounting for a round trip, yields the total equivalent transport distance for all materials (Table 8).
Table 8.
Equivalent transportation distances for materials (LCA phase A4).
Transport-related emissions are estimated using the ISPRA database, as detailed in Appendix A. These emissions are then characterized according to the analyzed impact categories. Characterization factors from the European Commission databases are multiplied by the corresponding emission quantities from transportation, yielding impact indicators per kilometer traveled by the reference vehicle for each category. Transportation impacts are obtained by multiplying these indicators by the equivalent transport distances previously calculated for each material. The final phase of stage A, A5, addresses the impacts of installation and construction operations. Due to uncertainty regarding specific procedures and equipment, these impacts are estimated as 10% of those calculated for the production phases (A1 to A3). Since installation procedures are similar for both reinforcement solutions, the same percentage was applied to steel and GFRP, avoiding overestimation that would result from directly applying 10% to the GFRP quantities. The detailed numerical results of LCA stage A are reported in Appendix A.
4.1.2. Impacts from Phase C1–C4
Stage C begins with phase C1, which considers the impacts of deconstruction and demolition. Then, phase C2 addresses the emissions associated with transporting deconstructed or demolished materials to disposal sites. The assessment follows the methodology applied in stage A4. Transport distances are assumed to be 30 km for all materials. Equivalent transport distances are calculated, resulting in 908.57, 903.44, 108.99 and 46.14 km respectively for concrete (steel RC deck), concrete (GFRP RC deck), steel rebars and GFRP rebars. Multiplying these distances by the characterized impacts for the reference environmental categories yields the transportation impacts for both reinforcement solutions.
Phase C3 accounts for emissions arising from the treatment of waste materials before their final disposal, while phase C4 covers the environmental impacts linked to the ultimate disposal of these waste materials. The environmental impacts corresponding to stage C of the LCA, with the exception of phase C2, are determined using Equation (4). This equation is analogous to Equation (3), but it is applied to the environmental indicators specific to stage C, whose phases are numbered as reported in Table 4, Table 5 and Table 6 instead of those for stage A.
The detailed numerical results of LCA stage C are reported in Appendix A.
4.1.3. “Cradle-to-Grave” Impacts
The total environmental impact over the entire life cycle is obtained by summing the contributions of LCA stages A and C, assuming at this point the same service life for both reinforcement solutions. Particularly, the total impact is calculated using Equation (5):
where denotes the total environmental impact from cradle to grave, represents the environmental impact associated with the i-th phase of LCA stage A calculated through Equation (3), and denotes the environmental impact associated with the j-th phase of LCA stage C derived from Equation (4). The indices i and j correspond to the numbering of the respective phases reported in Table 4, Table 5 and Table 6. Again, Equation (5) is applied twice to account for the two reinforcement types considered in this study, obtaining the “Cradle-to-Grave” impacts reported in Table 9.
Table 9.
Cradle-to-grave environmental impacts for the two solutions.
As indicated in Table 9, the GFRP-reinforced solution exhibits higher impacts compared to the traditional steel-reinforced one for the entire set of considered impact categories. Consequently, assumptions regarding the greater durability of GFRP are critical to assess its long-term benefits, including potential reductions in environmental impacts.
By implementing Equation (2), the “Cradle-to-Grave” impacts of Table 9 are used for normalization and weighting procedures to calculate global impacts reported in Table 10, allowing the identification of the most significant impact categories for both reinforcement solutions (characterized by the higher weighted scores). The results reported in Table 11 indicate that the two most significant impact categories common to both solutions are Climate Change and Depletion of Abiotic Fossil Resources, corresponding to the Global Warming Potential (GWP) and Abiotic Depletion Potential-Fossil (ADP-F) indicators, respectively. The findings also show that GFRP exhibits a substantially higher impact in the Depletion of Metals and Mineral Resources (ADP-M) category compared to steel, primarily due to differences in material composition and life-cycle characteristics.
Table 10.
Cradle-to-grave normalized and weighted impacts for both solutions.
Table 11.
Costs of materials and operations with reference to total quantities.
In particular, the production of glass fibers requires the extraction of significant quantities of mineral raw materials, including silica and other mineral constituents, resulting in comparatively higher resource depletion indicators.
The recycling of composite materials, particularly those with polymer matrices, remains highly complex, often resulting in end-of-life landfilling and contributing to increased resource depletion impacts. This trend is further confirmed by the weighting analysis. The ADP-M category accounts for less than 1% of the total weighted impacts for steel, whereas it reaches around 20% for GFRP (1.25 out of the total weighted score, equal to 6.15). This marked contrast highlights the significance of end-of-life limitations and underscores the environmental challenges associated with the limited recyclability of polymer matrix composites.
It is acknowledged that emerging mechanical, thermal, and chemical recycling technologies for composite materials may progressively reduce this limitation, potentially lowering ADP-M impacts in future assessments as end-of-life recovery processes mature.
4.1.4. Long-Term Scenarios
To account for the different service lives of the two reinforcement solutions, the Service Life Factor (SLF) is applied in the environmental assessment. This approach explicitly incorporates durability into the comparison, allowing the results to reflect not only the intrinsic impacts of the materials but also their long-term performance. Based on durability considerations, two long-term scenarios are therefore investigated. Figure 3 presents a comparative overview of the environmental impacts associated with the two reinforcement solutions across the full set of analyzed impact categories. As described in the methodology section, impact values for the SLF = 1.5 and SLF = 2 scenarios are obtained by scaling the steel-related impacts, previously calculated using Equation (5) and reported in Table 10, by the corresponding service life factor, while the impacts of the GFRP solution remain unchanged. For each impact category, the maximum value observed among all alternatives and scenarios is set as the 100% reference, and the remaining results are expressed as relative percentages of this value, enabling a clear and consistent comparison of the different reinforcement strategies.
Figure 3.
Comparison between the impacts of the two alternative reinforcements associated with the entire set of analyzed impact categories considering various SLFs.
In the first scenario, the steel-reinforced solution is assumed to have a service life of 50 years, while the GFRP-reinforced alternative is assumed to last 75 years, corresponding to an SLF of 1.5 applied to the steel solution. Under this assumption, the GFRP alternative shows total impacts lower than steel in the Climate Change, Marine Eutrophication, Terrestrial Eutrophication, and Photochemical Ozone Creation categories. Impacts are instead comparable for Acidification and Fossil Resource Depletion. The second scenario assumes a service life of 50 years for steel reinforcement and 100 years for GFRP, resulting in an SLF of 2. In this case, the GFRP solution exhibits lower total impacts across a wider range of categories, including Climate Change, Acidification, Marine Eutrophication, Terrestrial Eutrophication, Photochemical Ozone Creation, and Fossil Resource Depletion. The results are nearly balanced for Water Scarcity, while Ozone Depletion, Freshwater Eutrophication, and, most notably, Mineral and Metal Resource Depletion remain the most critical categories for the GFRP alternative. The detailed numerical results associated with each service life scenario are reported in Appendix B. The same analysis can be applied to normalized and weighted data. Weighting results reported in Figure 4 show that for the 100-year scenario, the overall score for the GFRP alternative is lower than the steel one. This emphasizes that in terms of overall environmental impact, extending the service life of GFRP to 100 years provides significant long-term advantages across multiple impact categories.
Figure 4.
Comparison between the weighted impacts of the two alternative reinforcements considering a service life of up to 100 years.
Comparing the LCA results obtained in this study with those reported in the literature reveals notable discrepancies, which are not necessarily contradictory. The present study appears more conservative regarding the environmental impacts of GFRP relative to steel. In the literature, the environmental advantages of GFRP are generally more pronounced, and in some cases these advantages are reported even without assuming scenarios of greater durability for the composite material. This discrepancy is largely attributable to differences in the unitary impacts of steel production considered in previous studies versus those used here. For example, in the Climate Change category, several studies report a Global Warming Potential (GWP) for steel production of approximately 3 kg CO2 eq., whereas this study considers 0.6 kg CO2 eq., i.e., five times lower. The higher values in the literature correspond to steel produced via the blast furnace-basic oxygen furnace (BF-BOF) route, producing virgin steel. In contrast, the GWP indicator used in this study refers to steel produced via electric arc furnace (EAF), which incorporates over 99% recycled material, as indicated in the referenced EPDs. This difference in production processes significantly affects overall emissions, resulting in substantially lower environmental impacts for steel produced via EAF.
4.1.5. Sensitivity Analysis on Results from Several EPDs
A sensitivity analysis on the Environmental Product Declarations (EPDs) considered for GFRP reinforcement helps in quantifying the variability of the environmental impact results relative to the mean values obtained for the full life cycle assessment and identifing the extent to which the choice of a specific manufacturer’s EPD may influence the overall outcomes. The analysis is carried out on the six EPDs sourced from different GFRP manufacturers. It should be noted that most of the EPDs examined were not complete across all life cycle stages; in several cases, data for specific phases were absent. Where a given manufacturer’s EPD did not report values for a particular life cycle stage, the missing data were supplemented with the mean values derived from those EPDs that did report the information considered. The results are presented in Figure 5, alongside the mean value used as the reference in the broader LCA and the corresponding impacts for the steel reinforcement scenarios. The results reveal a degree of variability across the EPDs examined. However, the overall spread is considered acceptable, exhibiting a satisfactory level of consistency across the considered EPDs, particularly for the most representative impact indicators, such as GWP and ADPF. On this basis, the use of mean EPD data is deemed appropriate for the purposes of the present analysis, which is oriented towards the preliminary design phase of infrastructure projects. It is acknowledged that as the project progresses towards the executive design stage, the adoption of EPD data specific to the selected manufacturer becomes increasingly important in order to ensure greater accuracy and representativeness of the environmental assessment.
Figure 5.
Sensitivity analysis results considering EPDs from 6 GFRP producers and life cycle impact comparison with base cases.
4.1.6. Use of Seawater and Marine-Based Aggregates for GFRP-Reinforced Concrete Elements
Since the construction sector is a major consumer of freshwater resources [65], several studies have proposed the use of seawater in concrete production, highlighting its environmental benefits, particularly in regions affected by water scarcity. However, the high chloride content of seawater induces unacceptable corrosion of steel reinforcement. Conversely, GFRP, being inherently resistant to corrosion, enables the use of seawater and marine-based aggregates, potentially reducing the freshwater footprint of concrete production. Moreover, studies have demonstrated that this alternative composition does not adversely affect concrete performance compared to conventional mixes and is suitable for structural applications [66,67]. Based on the findings reported by Arosio et al. [68], adopting marine aggregates and seawater in concrete mixes can result in up to an 80% reduction in the Water Depletion Potential for concrete production, compared to traditional mixes. These reductions are particularly relevant for coastal areas and regions mostly affected by water scarcity. Figure 6 compares the two reinforcement solutions, considering the use of marine-based aggregates and seawater in the GFRP alternative, for the three service life factors (SLF) analyzed in this study. Overall, the GFRP-reinforced deck exhibits a slight reduction in water depletion potential (WDP) compared to the conventional steel-reinforced concrete deck. In the 100-year scenario (SLF = 2), the WDP for the GFRP deck is 16,900 m3, approximately 10% lower than that of the steel-reinforced deck, which reaches 18,700 m3. As highlighted by previous results, this reduction is, overall, limited due to the high impacts associated with GFRP rebars and particularly their production.
Figure 6.
Comparison between the impacts of the two alternatives for reinforcement with reference to the “Water scarcity” impact category considering the use of alternative concrete for different SLFs.
4.2. Cost Analysis
With reference to the quantities defined in Table 3, the overall costs for materials and operations considered in the analysis are calculated and reported in Table 11. Discount of long-term costs is performed using the well-known economic formula for NPV, considering a discount rate of 1%, in line with Cadenazzi et al. [13]:
where C is the cost occurring at time t and i is the discount rate adopted.
Figure 7 presents the results of the cost analysis for the steel-reinforced and GFRP-reinforced deck solutions respectively for the three analyzed service life scenarios, obtained by implementing Equation (6). Comparing the two solutions under the assumption of equal service life, the steel-reinforced deck demonstrates superior economic performance. Specifically, the steel option reaches an NPV of approximately €88,000, whereas the GFRP solution shows a higher initial NPV of about €113,000. This difference reflects the higher initial material costs associated with GFRP reinforcement. However, this baseline comparison does not account for the potentially extended service life that GFRP composites can provide. In the first extended scenario, GFRP is assumed to provide a service life of 75 years. The costs of the GFRP-reinforced solution include initial construction expenses and the discounted costs associated with demolition and material transport at the end of its life cycle. For the steel solution, the costs of the initial 50-year cycle, analyzed previously, are considered. To achieve a total service life of 75 years, reconstruction is required after the first cycle. Consequently, the steel solution’s life cycle costs are adjusted proportionally for the remaining 25 years, including half of the construction costs projected for year 50 and half of the demolition and transport costs projected for year 75, discounted accordingly. As illustrated in Figure 7, this results in an increase in the cumulative NPV of the steel solution to €116,000, while GFRP-related costs slightly decrease to €110,000; therefore, the overall economic performance of the two solutions is nearly equivalent. In the second scenario, GFRP is assumed to have twice the durability of steel, enabling a total service life of 100 years. As in the previous scenario, GFRP costs include initial construction and discounted demolition and end-of-life transport costs, projected to year 100. For the steel solution, the costs of the first 50-year cycle are initially considered. To maintain structural functionality over the entire 100-year period, a second complete life cycle is required, encompassing reconstruction, demolition, transport of the decommissioned material, and the associated costs. Construction costs projected for year 50 and demolition and transport costs projected for year 100 are discounted, effectively applying the discounting procedure to the steel solution’s first life-cycle costs twice. As a result, the cumulative NPV of the steel solution increases, reaching approximately €141,000 for SLF = 2. Conversely, the NPV of the GFRP-reinforced deck remains about €110,000 over the entire 100-year period. The analysis indicates that in this scenario, the overall cost of GFRP is lower than that of steel reinforcement, demonstrating that GFRP represents a more cost-effective solution over the long term.
Figure 7.
Cumulative Net Present Values for the different analyzed scenarios.
Overall, the results of the analysis are already encouraging when comparing steel and GFRP in the 75-year service life scenario, with benefits further amplified in the 100-year scenario.
While GFRP is currently more expensive than steel reinforcement, it is anticipated that ongoing technological improvements and increased production capacity could reduce its cost in the near future. Consequently, the economic competitiveness of GFRP may improve over time, potentially enhancing its long-term benefits when compared to conventional steel reinforcement.
It should be noted that the present results are conservative, as costs associated with ordinary maintenance, likely more frequent for steel-reinforced structures, are not included. Accounting for these costs would further increase the advantages of the GFRP alternative.
4.3. Implementation of the Envision Protocol
Based on the results of the LCA and cost analysis, Table 12 identifies the credits for which the GFRP-reinforced concrete deck enables an improvement in the score of the Envision protocol. Table 12 also reports the corresponding results for these credits, referring to 75 and 100 year service life scenarios. Considering the credits evaluated, 44 points can be awarded assuming a 75-year service life, corresponding to 4.4% of the total 1000 points available in the protocol. This means that the use of GFRP rebars in bridge decks allows a potential improvement of 4.4% in the score relative to the baseline scenario with conventional steel reinforcement. In the 100-year service life scenario, 70 points can be awarded, corresponding to 7% of the total 1000 points available. This value is significant, as it approaches the 10% threshold representing the difference between two consecutive award levels defined by Envision and could meaningfully contribute to achieve a higher certification level. These results further support and validate the positive findings from the LCA and cost analyses regarding the use of GFRP bars as a replacement for steel in reinforced concrete bridge decks.
Table 12.
Levels of achievement for the Envision credits considered—Service life scenarios of 75 and 100 years.
4.4. Alternative 100-Year Service Life Scenario
An alternative scenario lasting 100 years is studied. Particularly, in the case of steel reinforcement, the progressive deterioration due to corrosion necessitates periodic maintenance interventions every 20 years (at years 20, 40, 60, and 80), followed by complete structural demolition and replacement at the end of the service life (year 100). In contrast, GFRP reinforcement, owing to its inherent corrosion resistance, is assumed to require no maintenance intervention throughout the entire 100-year service life. For the analysis, the deck is subdivided into two zones characterized by different levels of degradation severity. The zones in proximity to the supports, extending over one-sixth of the total span at each end, are subjected to greater exposure to moisture and aggressive agents and associated with a higher degree of deterioration. The central zone, comprising the remaining four-sixths of the span (20 m), is considered with a lower severity of degradation. A concrete cover restoration thickness of 40 mm (including the application of the passivating agent) is assumed for the zones near the supports, while a thickness of 10 mm is adopted for the central zone. For each maintenance cycle of the steel-reinforced deck, two materials are involved: a structural repair mortar and a passivating agent applied to the exposed reinforcement. Material quantities are determined based on the net exposed reinforcement surface area after removal of concrete cover, estimated at an incidence of 0.19 m2/m2 (net area, excluding overlaps), yielding a total passivant application area of 26.96 m2. Given a density of 1900 kg/m3 and an applied thickness of 2 mm, the passivating agent amounts to 102.5 kg per intervention. The repair mortar, with a density of 2150 kg/m3, results in restoration masses of 9331 kg for the deck slab and 2872 kg for the edge beams in the heavily deteriorated zones (40 mm thickness) and 4666 kg and 1436 kg respectively in the central zone (10 mm thickness) for a total of 18,305 kg of repair mortar per maintenance cycle. The unit environmental impacts of the intervention materials are sourced from the respective Environmental Product Declarations (EPDs), covering life cycle stages A1–A3 (manufacturing), A4 (transport to site), A5 (installation), and C1–C4 (end of life). Total environmental impacts, whose results are reported in Table 13, are calculated by multiplying the material quantities by the corresponding impact values per unit of material (kg).
Table 13.
LCA impacts for the steel-reinforced deck including maintenance scenarios (stage B).
The results are graphically presented in Figure 8, in comparison with the other scenarios examined in the study.
Figure 8.
Comparison of total impacts between alternative and base scenarios.
The life cycle cost analysis of the alternative scenario was also conducted consistently with the previously performed analyses. Unit prices related to maintenance interventions were sourced from regional price lists and manufacturer technical datasheets and are summarized in Table 14 and Table 15. For concrete cover demolition, differentiated unit costs were applied based on zone: 15.10 €/m2 for the zones near the supports and 14.09 €/m2 for the central zone, as derived from the Piedmont Regional Price List (Prezzario Regione Piemonte). The passivating agent was costed at 35.00 €/m2 of treated surface (with 10 m of reinforcements on each square meter). The structural repair mortar was valued at 41.94 €/m2·cm, applied at differentiated thicknesses (40 mm at the supports, 10 mm in the central zone). Based on these unit rates and the computed surface areas (141.9 m2 for the support zones and 283.8 m2 for the central zone), the nominal cost of each maintenance intervention amounts to €46,816, comprising €6141 for cover demolition, €4967 for passivant application, and €35,708 for repair mortar installation.
Table 14.
Unitary costs of materials and operations with reference to maintainance interventions.
Table 15.
Costs of materials and operations referred to total quantities for a single maintainance intervention.
Under the 100-year scenario with maintenance interventions every 20 years, the steel reinforcement solution entails four repair cycles (at years 20, 40, 60, and 80), followed by final demolition at year 100. The net present value (NPV) of the four maintenance interventions, discounted at a 1% rate, amounts to €116,824 (€38,408 at t = 20; €31,477 at t = 40; €25,797 at t = 60; €21,142 at t = 80). Including the discounted cost of final demolition (€8017), the cumulative NPV of the steel scenario reaches €199,675. The GFRP solution, requiring no maintenance interventions over the 100-year service life, yields a cumulative NPV of €107,948, comprising solely the discounted end-of-life demolition cost. As pointed out in Figure 9, the whole-life economic advantage of the GFRP solution therefore amounts to approximately €91,727, more than offsetting its higher initial construction cost.
Figure 9.
Comparison of total impacts between alternative and base scenarios.
Based on the obtained results, this alternative scenario shows a generally lower environmental impact across most of the categories considered. However, it performs worse in terms of Global Warming Potential (GWP), while results for Abiotic Depletion Potential—Fossil Fuels (ADPF) are broadly comparable between the two reinforcement solutions. These two indicators represent the most significant among those examined, thus preventing an unambiguous environmental advantage for this scenario. On the other hand, from an economic standpoint, the alternative scenario proves substantially less viable, with costs nearly twice those estimated for the GFRP-based scenarios. This difference likely reflects the greater complexity of selective retrofitting interventions compared to the comprehensive demolition strategies analysed in the baseline scenarios of the present study.
5. Conclusions
This study addressed the need for structural reinforcement solutions capable of jointly satisfying mechanical performance, durability, and environmental and economic sustainability by conducting a comparative LCA of traditional steel reinforcement and GFRP rebars for bridge deck applications.
Despite the robustness of the proposed methodology, several limitations should be acknowledged. The life cycle inventory relies on a number of simplifying assumptions that were intentionally introduced to maintain methodological transparency and reproducibility, while reflecting a conservative approach that avoids overestimating the environmental advantages of the GFRP solution.
- Transport distances were defined based on representative average values, as project-specific logistics data were not available at the current design stage; actual supply chain configurations may vary depending on the geographic context.
- End-of-life scenarios were modeled using conventional assumptions, as established recycling pathways for GFRP reinforcement are still under development; future advances in circular economy strategies could further improve the environmental performance of composite solutions.
- EPD-based inventory data were aggregated as weighted averages across manufacturers, following a well-established and transparent procedure; nonetheless, regional variability in production processes may introduce some degree of uncertainty in the results.
- Maintenance modeling was based on simplified assumptions, without incorporating probabilistic deterioration curves or detailed inspection and repair cycles.
- The analysis was conducted on a single structural typology, which limits the direct generalizability of the findings to other infrastructure categories or exposure conditions.
Nevertheless, the proposed framework remains a structured and reproducible tool for sustainability-oriented decision-making, and can be progressively refined as more detailed, project-specific data become available in advanced design stages.
Main Results of the Analysis
The work contributes to the existing literature by explicitly linking durability-driven service life assumptions to long-term environmental and economic performance, an aspect that remains insufficiently quantified in current comparative assessments. The main outcomes of the present study are summarized below.
- A targeted review of durability studies on GFRP rebars identified tensile strength retention as the governing parameter for long-term performance. The assumption of approximately 80% tensile strength retention under aggressive environmental conditions, supported by published experimental evidence for reference periods of up to 100 years, provided a rational basis for defining realistic service life scenarios. While inherently dependent on the available literature, this assumption allowed the environmental and economic analyses to be framed within a consistent and transparent durability-based perspective.
- The LCA, conducted following a “cradle-to-grave” approach in accordance with ISO 14040 and ISO 14044 [7,8], and primarily based on data from Environmental Product Declarations aggregated as weighted averages according to production volumes of the respective manufacturers, proved to be a fundamental tool in designing sustainable infrastructures. The results of the implemented methodology demonstrated that steel reinforcement remains the most advantageous solution for short service life scenarios from both environmental and economic standpoints. However, the results clearly indicate that this conclusion cannot be generalized to extended time horizons. At 75 years, several impact categories already favor GFRP, while at 100 years, the composite reinforcement outperforms steel in most environmental indicators, including Climate Change and Fossil Resource Depletion, with an overall weighted impact reduction of 12%. The economic analysis exhibits a consistent trend, showing that the higher initial cost of GFRP is progressively offset over time, leading to cost reductions of more than 20% in the 100-year scenario.
- The investigation of seawater use in concrete production highlighted that although reductions in water scarcity impacts can be achieved, the overall sustainability gains remain limited by the energy-intensive nature of GFRP manufacturing and by current limitations in recyclability. This finding underscores that the environmental performance of composite-reinforced systems is strongly influenced not only by durability benefits but also by upstream production processes, which currently represent a critical bottleneck.
- From a broader infrastructure sustainability perspective, the application of the Envision protocol showed that the adoption of GFRP reinforcement leads to measurable improvements in sustainability ratings. Estimated award-level increases of 4.4% and 7% for the 75- and 100-year scenarios, respectively, indicate that durability-oriented material choices can contribute tangibly to enhanced sustainability certification outcomes.
Overall, the results show that steel reinforcement is more suitable for short-term applications, whereas GFRP becomes increasingly advantageous for extended design service lives, particularly in aggressive environments. Reducing current uncertainties in long-term durability would enable less conservative design provisions and allow the full environmental and economic potential of GFRP-reinforced concrete to be more effectively realized. Furthermore, advances in recycling technologies for composite materials represent a promising research direction that could significantly reduce the end-of-life environmental impacts of GFRP. Developing efficient recycling pathways would substantially improve the overall environmental profile of GFRP reinforcement, potentially making it the preferred solution across a broader range of service life scenarios.
Author Contributions
Data curation, F.S.; formal analysis, F.S.; methodology, M.M.; validation, M.M.; writing—original draft preparation, F.S.; writing—review and editing, M.M. and M.C.; conceptualization, D.M. and M.C.; supervision, M.C.; funding acquisition, D.M. All authors have read and agreed to the published version of the manuscript.
Funding
This research was financially supported by MUR–DM 352/2022, co-funded by Masera Engineering Group S.r.l. (Torino, Italy) under the PNRR–NGEU action.
Data Availability Statement
The data supporting the results of this study are available from the corresponding author upon reasonable request. Environmental Product Declarations used in this study are publicly available at the International EPD System library (https://www.environdec.com/library, accessed on 25 August 2025) and the EPD Italy portal (https://www.epditaly.it/ricerca-epd/, accessed on 25 August 2025).
Conflicts of Interest
Davide Masera is the CEO of Masera Engineering Group, a civil engineering firm that co-funded the PhD scholarship of Mattia Mairone within the action of the Italian Ministry of Univeristy of Research DM 352/2022.
Appendix A. Detailed Impacts Results
This appendix reports the detailed numerical results of the LCA corresponding to stages A and C. Specifically, stage A includes the impacts related to raw material extraction and manufacturing (A1–A3), transportation of materials to the construction site (A4), and installation and construction activities (A5). Stage C comprises the impacts associated with deconstruction and demolition (C1), transportation of waste materials to treatment or disposal facilities (C2), waste treatment prior to disposal (C3), and final disposal (C4), in accordance with the adopted LCA framework. Table A1 reports the characterized environmental impacts associated with 1 km of transport performed by the reference vehicle adopted for LCA stage A4. The values are derived from the ISPRA emission database assuming a heavy-duty rigid diesel truck with a gross vehicle weight exceeding 32 tons and compliant with the Euro VI (A/B/C) standard. The reported indicators represent the impact per kilometer traveled and are used to calculate the total transportation impacts by multiplying these values by the equivalent transport distances determined for each material.
Table A1.
Characterized impacts for 1 km of transport with the reference vehicle.
Table A4 and Table A5 present the characterized environmental impacts associated with LCA stage C for the steel-reinforced and GFRP-reinforced solutions, respectively. For each impact category, the contributions of deconstruction and demolition, C1; transportation, C2; waste treatment, C3; and final disposal, C4 are reported separately, together with the corresponding total emissions.
Table A2.
Cradle-to-gate (LCA stage A) impacts for the steel-reinforced solution.
Table A3.
Cradle-to-gate (LCA stage A) impacts for the GFRP-reinforced solution.
Table A4.
Impacts resulting from LCA stage C for the steel-reinforced solution.
Table A5.
Impacts resulting from LCA stage C for the GFRP-reinforced solution.
Appendix B. Cradle-to-Grave Detailed Impacts for Extended Service Life Scenarios
This appendix reports the detailed numerical results of the cradle-to-grave LCA obtained by accounting for different service lives of the reinforcement solutions through the application of the Service Life Factor. Two long-term scenarios are considered, corresponding to SLF values of 1.5 and 2, reflecting alternative durability assumptions for steel- and GFRP-reinforced systems. Table A6 summarizes the cradle-to-grave environmental impacts associated with both reinforcement solutions, assuming a service life of 75 years for the GFRP-reinforced alternative and 50 years for the steel-reinforced solution, corresponding to an SLF of 1.5 applied to the steel impacts. Table A7 reports the cradle-to-grave environmental impacts associated with both reinforcement solutions, assuming a service life of 100 years for the GFRP-reinforced alternative and 50 years for the steel-reinforced solution, corresponding to an SLF of 2 applied to the steel impacts. As for the SLF = 1.5 scenario, the impacts of the GFRP solution are assumed to remain unchanged.
Table A6.
Cradle-to-grave impacts for the two reinforcement solutions considering a service life of 75 years (SLF = 1.5).
Table A7.
Cradle-to-grave impacts for the two reinforcement solutions considering a service life of 100 years (SLF = 2).
References
- Sun, J.H.; Su, N.J.; He, Z.Q.; Jia, R.X.; Liu, Y.; Lin, F.K.; Ka, T.A. Durability of concrete-encapsulated GFRP bars subjected to seawater immersion. Case Stud. Constr. Mater. 2024, 20, e03249. [Google Scholar] [CrossRef] [Scilit]
- Esmaeili, Y.; Eslami, A.; Newhook, J.; Benmokrane, B. Performance of GFRP-Reinforced Concrete Beams Subjected to High-Sustained Load and Natural Aging for 10 Years. J. Compos. Constr. 2020, 24, 04019063. [Google Scholar] [CrossRef] [Scilit]
- Gemi, L.; Madenci, E.; Özkılıç, Y.O. Experimental, analytical and numerical investigation of pultruded GFRP composite beams infilled with hybrid FRP reinforced concrete. Eng. Struct. 2021, 244, 112790. [Google Scholar] [CrossRef] [Scilit]
- Gooranorimi, O.; Nanni, A. GFRP Reinforcement in Concrete after 15 Years of Service. J. Compos. Constr. 2017, 21, 04017024. [Google Scholar] [CrossRef] [Scilit]
- Manalo, A.; Maranan, G.; Benmokrane, B.; Cousin, P.; Alajarmeh, O.; Ferdous, W.; Liang, R.; Hota, G. Comparative durability of GFRP composite reinforcing bars in concrete and in simulated concrete environments. Cem. Concr. Compos. 2020, 109, 103564. [Google Scholar] [CrossRef] [Scilit]
- Liddell, H.P.H.; Cresko, J.W.; Liddell, H.P.H.; Brueske, S.B.; Carpenter, A.C.; Cresko, J.W. Manufacturing Energy Intensity and Opportunity Analysis for Fiber-Reinforced Polymer Composites and Other Lightweight Materials. In Proceedings of the American Society for Composites—31st Technical Conference (ASC 2016), Williamsburg, VA, USA, 19–21 September 2016. [Google Scholar]
- BS EN ISO 14040:2006+A1:2020; Environmental Management—Life Cycle Assessment—Principles and Framework. BSI British Standards Institution: London, UK, 2020.
- BS EN ISO 14044:2006+A2:2020; Incorporating Corrigendum May 2018, Environmental Management—Life Cycle Assessment—Requirements and Guidelines. British Standards Institution: London, UK, 2021.
- Pizzol, M.; Laurent, A.; Sala, S.; Weidema, B.; Verones, F.; Koffler, C. Normalisation and weighting in life cycle assessment: Quo vadis? Int. J. Life Cycle Assess. 2017, 22, 853–866. [Google Scholar] [CrossRef] [Scilit]
- Işildar, G.Y.; Morsali, S.; Gari, Z.H.Z. A comparison LCA of the common steel rebars and FRP. J. Build. Pathol. Rehabil. 2020, 5, 8. [Google Scholar] [CrossRef] [Scilit]
- Sbahieh, S.; Mckay, G.; Al-Ghamdi, S.G. A comparative life cycle assessment of fiber-reinforced polymers as a sustainable reinforcement option in concrete beams. Front. Built Environ. 2023, 9, 1194121. [Google Scholar] [CrossRef] [Scilit]
- Omar, S.A.; Abdelhadi, A. Comparative Life-Cycle Assessment of Steel and GFRP Rebars for Procurement Sustainability in the Construction Industry. Sustainability 2024, 16, 3899. [Google Scholar] [CrossRef] [Scilit]
- Cadenazzi, T.; Dotelli, G.; Rossini, M.; Nolan, S.; Nanni, A. Life-cycle cost and life-cycle assessment analysis at the design stage of a fiber-reinforced polymer-reinforced concrete bridge in Florida. Adv. Civ. Eng. Mater. 2019, 8, 128–151. [Google Scholar] [CrossRef] [Scilit]
- Dong, S.; Li, C.; Xian, G. Environmental impacts of glass-and carbon-fiber-reinforced polymer bar-reinforced seawater and sea sand concrete beams used in marine environments: An LCA case study. Polymers 2021, 13, 154. [Google Scholar] [CrossRef] [Scilit]
- Cadenazzi, T.; Keles, B.; Rahman, M.K.; Nanni, A. Life-Cycle Cost and Life-Cycle Assessment of a Monumental Fiber-Reinforced Polymer Reinforced Concrete Structure. J. Constr. Eng. Manag. 2022, 148, 05022007. [Google Scholar] [CrossRef] [Scilit]
- Williams, T.; Navarro, C.; Giffin, C.; Zhang, B.; Yu, Z.; Nutt, S. A Structural Chemistry Look at Composites Recycling. Mater. Horiz. 2020, 7, 2479–2486. [Google Scholar] [CrossRef] [Scilit]
- Fu, B.; Liu, K.C.; Chen, J.F.; Teng, J.G. Concrete reinforced with macro fibres recycled from waste GFRP. Constr. Build. Mater. 2021, 310, 125063. [Google Scholar] [CrossRef] [Scilit]
- Shiverskii, A.V.; Kukharskii, A.V.; Lomov, S.V.; Abaimov, S.G. Recycling glass fiber-reinforced plastic in asphalt concrete production. AIMS Mater. Sci. 2024, 11, 231–242. [Google Scholar] [CrossRef] [Scilit]
- Sansom, M.; Avery, N. Briefing: Reuse and recycling rates of UK steel demolition arisings. Proc. Inst. Civ. Eng. Eng. Sustain. 2014, 167, 89–94. [Google Scholar] [CrossRef] [Scilit]
- Institute for Sustainable Infrastructure. ENVISION: Sustainable Infrastructure Framework Guidance Manual, 3rd ed.; Institute for Sustainable Infrastructure (ISI): Washington, DC, USA, 2018; Available online: https://www.sustainableinfrastructure.org (accessed on 25 August 2025).
- U.S. Green Building Council. LEED Rating System. Available online: https://www.usgbc.org/leed (accessed on 25 August 2025).
- Building Research Establishment. BREEAM Infrastructure. Available online: https://breeam.com/breeam-infrastructure (accessed on 25 August 2025).
- Infrastructure Sustainability Council. Infrastructure Sustainability Rating Scheme. Available online: https://www.iscouncil.org/is-rating/ (accessed on 15 October 2025).
- Micelli, F.; Nanni, A. Durability of FRP rods for concrete structures. Constr. Build. Mater. 2004, 18, 491–503. [Google Scholar] [CrossRef] [Scilit]
- Benmokrane, B.; Ali, A.H.; Mohamed, H.M.; ElSafty, A.; Manalo, A. Laboratory assessment and durability performance of vinyl-ester, polyester, and epoxy glass-FRP bars for concrete structures. Compos. Part B Eng. 2017, 114, 163–174. [Google Scholar] [CrossRef] [Scilit]
- Benmokrane, B.; Manalo, A.; Bouhet, J.C.; Mohamed, K.; Robert, M. Effects of Diameter on the Durability of Glass Fiber–Reinforced Polymer Bars Conditioned in Alkaline Solution. J. Compos. Constr. 2017, 21, 04017040. [Google Scholar] [CrossRef] [Scilit]
- Sakuraba, H.; Manalo, A.; Alajarmeh, O.; Benmokrane, B. Durability assessment of GFRP bars in concrete exposed to field environment based on interlaminar shear strength. Case Stud. Constr. Mater. 2025, 22, e04599. [Google Scholar] [CrossRef] [Scilit]
- Valter, T.; Ralejs, T. Durability and service life prediction of GFRP for concrete reinforcement. In Proceedings of the 4th International Conference on Fibre-Reinforced Plastics for Reinforced Concrete Structures FRPRCS-5, Cambridge, UK, 16–18 July 2001; Volume 1, pp. 505–514. [Google Scholar]
- Chen, Y.; Davalos, J.; Ray, I. Durability prediction for GFRP reinforcing bars using short-term data of accelerated aging tests. J. Compos. Constr. 2006, 10, 279–286. [Google Scholar] [CrossRef] [Scilit]
- Saad, S.; Polak, M.A. Bond Behavior of Glass Fiber-Reinforced Polymer (GFRP) Bars Embedded in Concrete: A Review. Materials 2025, 18, 3367. [Google Scholar] [CrossRef] [Scilit] [PubMed]
- Robert, M.; Cousin, P.; Benmokrane, B. Durability of GFRP Reinforcing Bars Embedded in Moist Concrete. J. Compos. Constr. 2009, 13, 66–73. [Google Scholar] [CrossRef] [Scilit]
- Robert, M.; Benmokrane, B. Combined effects of saline solution and moist concrete on long-term durability of GFRP reinforcing bars. Constr. Build. Mater. 2013, 38, 274–284. [Google Scholar] [CrossRef] [Scilit]
- Morales, C.N.; Claure, G.; Emparanza, A.R.; Nanni, A. Durability of GFRP reinforcing bars in seawater concrete. Constr. Build. Mater. 2021, 270, 121492. [Google Scholar] [CrossRef] [Scilit]
- Arczewska, P.; Polak, M.A.; Penlidis, A. Degradation of glass fiber reinforced polymer (GFRP) bars in concrete environment. Constr. Build. Mater. 2021, 293, 123451. [Google Scholar] [CrossRef] [Scilit]
- Nanni, A.; Caso, F.D.; Emparanza, A.R.; Palacios, J.M.; Mairone, M.; Heydarpour, K.; Nolan, S. Waterline Pile Cap Footings for Bridges Using Large Diameter FRP Reinforcing Material: Characterization and Design; Technical Report; University of Miami and Florida Department of Transportation—Research Center: Coral Gables, FL, USA, 2025. Available online: https://rosap.ntl.bts.gov/view/dot/86810 (accessed on 25 August 2025).
- ASTM Standard ASTM D7705/D7705M-12; Test Method for Alkali Resistance of Fiber Reinforced Polymer (FRP) Matrix Composite Bars Used in Concrete Construction. ASTM International: West Conshohocken, PA, USA, 2012.
- Lu, C.; Qi, Z.; Zheng, Y.; Xuan, G.; Yan, Y. Long-term tensile performance of GFRP bars in loaded concrete and aggressive solutions. J. Build. Eng. 2023, 64, 105587. [Google Scholar] [CrossRef] [Scilit]
- fib Task Group 9.3. FRP Reinforcement in RC Structures; Technical Report, fib Bulletin 40; International Federation for Structural Concrete: Lausanne, Switzerland, 2007. [Google Scholar]
- Debaiky, A.S.; Nkurunziza, G.; Benmokrane, B.; Cousin, P. Residual Tensile Properties of GFRP Reinforcing Bars after Loading in Severe Environments. J. Compos. Constr. 2006, 10, 370–380. [Google Scholar] [CrossRef] [Scilit]
- Al-Khafaji, A.F.; Haluza, R.T.; Benzecry, V.; Myers, J.J.; Bakis, C.E.; Nanni, A. Durability Assessment of 15- to 20-Year-Old GFRP Bars Extracted from Bridges in the US. II: GFRP Bar Assessment. J. Compos. Constr. 2021, 25, 04021004. [Google Scholar] [CrossRef] [Scilit]
- ASTM D7957/D7957M-22; Standard Specification for Solid Round Glass Fiber Reinforced Polymer Bars for Concrete Reinforcement. ASTM International: West Conshohocken, PA, USA, 2022.
- Serbescu, A.; Guadagnini, M.; Pilakoutas, K. Mechanical Characterization of Basalt FRP Rebars and Long-Term Strength Predictive Model. J. Compos. Constr. 2015, 19, 04014037. [Google Scholar] [CrossRef] [Scilit]
- Al-Zahrani, M.M. Durability of concrete-embedded GFRP bars after 20 years of tidal zone exposure: Correlation with accelerated aging tests. Case Stud. Constr. Mater. 2024, 21, e03435. [Google Scholar] [CrossRef] [Scilit]
- ACI Committee 440; Building Code Requirements for Structural Concrete Reinforced with Glass Fiber-Reinforced Polymer GFRP) Bars-Code and Commentary. American Concrete Institute: Farmington Hills, MI, USA, 2023.
- AASHTO LRFD Bridge Design Guide Specifications for GFRP-Reinforced Concrete, 2nd ed.; American Association of State Highway and Transportation Officials: Washington, DC, USA, 2018.
- CNR-DT 203/R1/2025; Consiglio Nazionale Delle Ricerche, I’Struzioni per la Progettazione, l’Esecuzione ed il Controllo di Strutture di Calcestruzzo Armato con Barre di Materiale Composito Fibrorinforzato. Consiglio Nazionale delle Ricerche (CNR): Rome, Italy, 2025.
- BS EN 15978:2011; Incorporating Corrigendum November 2011, Sustainability of Construction Works—Assessment of Environmental Performance of Buildings—Calculation Method. BSI British Standards Institution: London, UK, 2012.
- European Platform on Life Cycle Assessment. Environmental Footprint Reference Packages. Available online: https://eplca.jrc.ec.europa.eu (accessed on 25 August 2025).
- Istituto Superiore per la Protezione e la Ricerca Ambientale (ISPRA). La Banca Dati Dei Fattori di Emissione Medi del Trasporto Stradale in Italia. Available online: https://fetransp.isprambiente.it (accessed on 26 August 2025).
- D.M. 17 gennaio 2018; Ministero Delle Infrastrutture e Dei Trasporti. Norme Tecniche per le Costruzioni. Gazzetta Ufficiale della Repubblica Italiana, n. 42 del 20 Febbraio 2018. Suppl. ordinario n. 8; Ministero delle Infrastrutture e dei Trasporti (MIT): Rome, Italy, 2018.
- EN 1990; Eurocode 0: Basis of Structural Andgeotechnical Design. European Committee for Standardization (CEN): Brussels, Belgium, 2006.
- EN 1992-1-1; Eurocode 2: Design of Concrete Structures—Part 1-1: General Rules and Rules for Buildings, Bridges and Civil Engineering Structures. European Committee for Standardization (CEN): Brussels, Belgium, 2005.
- EN 1992-2; Eurocode 2: Design of Concrete Structures—Part 2: Concrete Bridges—Design and Detailing Rules. European Committee for Standardization (CEN): Brussels, Belgium, 2005.
- Ecoinvent. Database. Available online: https://ecoinvent.org/database (accessed on 25 August 2025).
- GHG Protocol. GaBi Databases. Available online: https://ghgprotocol.org/gabi-databases (accessed on 25 August 2025).
- Athena Sustainable Materials Institute. Databases. 2025. Available online: https://www.athenasmi.org/our-software-data/lca-databases/ (accessed on 25 August 2025).
- SimaPro Craft. Available online: https://simapro.com/craft/ (accessed on 25 August 2025).
- openLCA. Available online: https://www.openlca.org (accessed on 25 August 2025).
- One Click LCA. Infrastructure LCA. Available online: https://oneclicklca.com/software/design-construction/lca-for-infrastructure (accessed on 25 August 2025).
- EPD Italy. Available online: https://www.epditaly.it/ricerca-epd/ (accessed on 25 August 2025).
- International EPD System. EPD Library. Available online: https://www.environdec.com/library (accessed on 25 August 2025).
- Marsh, E.; Hattam, L.; Allen, S. A method to create weighted-average life cycle impact assessment results for construction products, and enable filtering throughout the design process. J. Clean. Prod. 2025, 491, 144467. [Google Scholar] [CrossRef] [Scilit]
- Ministero delle Infrastrutture e della Mobilità Sostenibili. Italian Guidelines for Risk Classification and Management of Existing Bridges; Decreto ministeriale n. 204 del 1 luglio 2022, allegato a, 2022; Gazzetta Ufficiale n. 196 del 23 agosto 2022; Ministero delle Infrastrutture e della Mobilità Sostenibili: Rome, Italy, 2022.
- Regione Piemonte. Prezzario Regione Piemonte. 2025. Available online: https://www.regione.piemonte.it/web/temi/protezione-civile-difesa-suolo-opere-pubbliche/opere-pubbliche/prezzario-regione-piemonte-2025 (accessed on 10 October 2025).
- Miller, S.A.; Horvath, A.; Monteiro, P.J. Impacts of booming concrete production on water resources worldwide. Nat. Sustain. 2018, 1, 69–76. [Google Scholar] [CrossRef] [Scilit]
- Younis, A.; Ebead, U.; Suraneni, P.; Nanni, A. Fresh and hardened properties of seawater-mixed concrete. Constr. Build. Mater. 2018, 190, 276–286. [Google Scholar] [CrossRef] [Scilit]
- Nishida, T.; Otsuki, N.; Ohara, H.; Garba-Say, Z.M.; Nagata, T. Some considerations for the applicability of seawater as mixing water in concrete. Sustain. Constr. Mater. Technol. 2013, 27, B4014004. [Google Scholar] [CrossRef] [Scilit]
- Arosio, V.; Arrigoni, A.; Dotelli, G. Reducing water footprint of building sector: Concrete with seawater and marine aggregates. IOP Conf. Ser. Earth Environ. Sci. 2019, 323, 012127. [Google Scholar] [CrossRef] [Scilit]
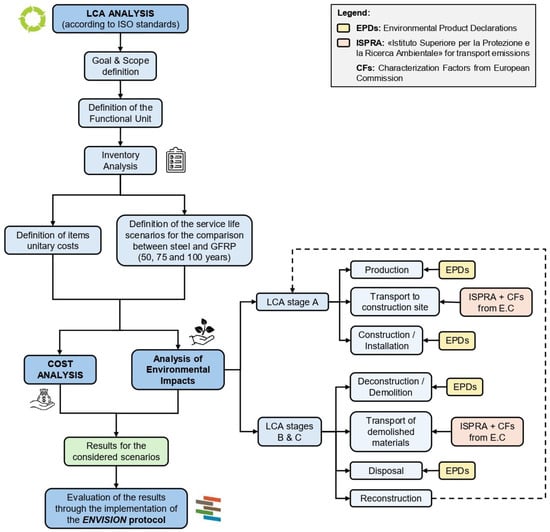
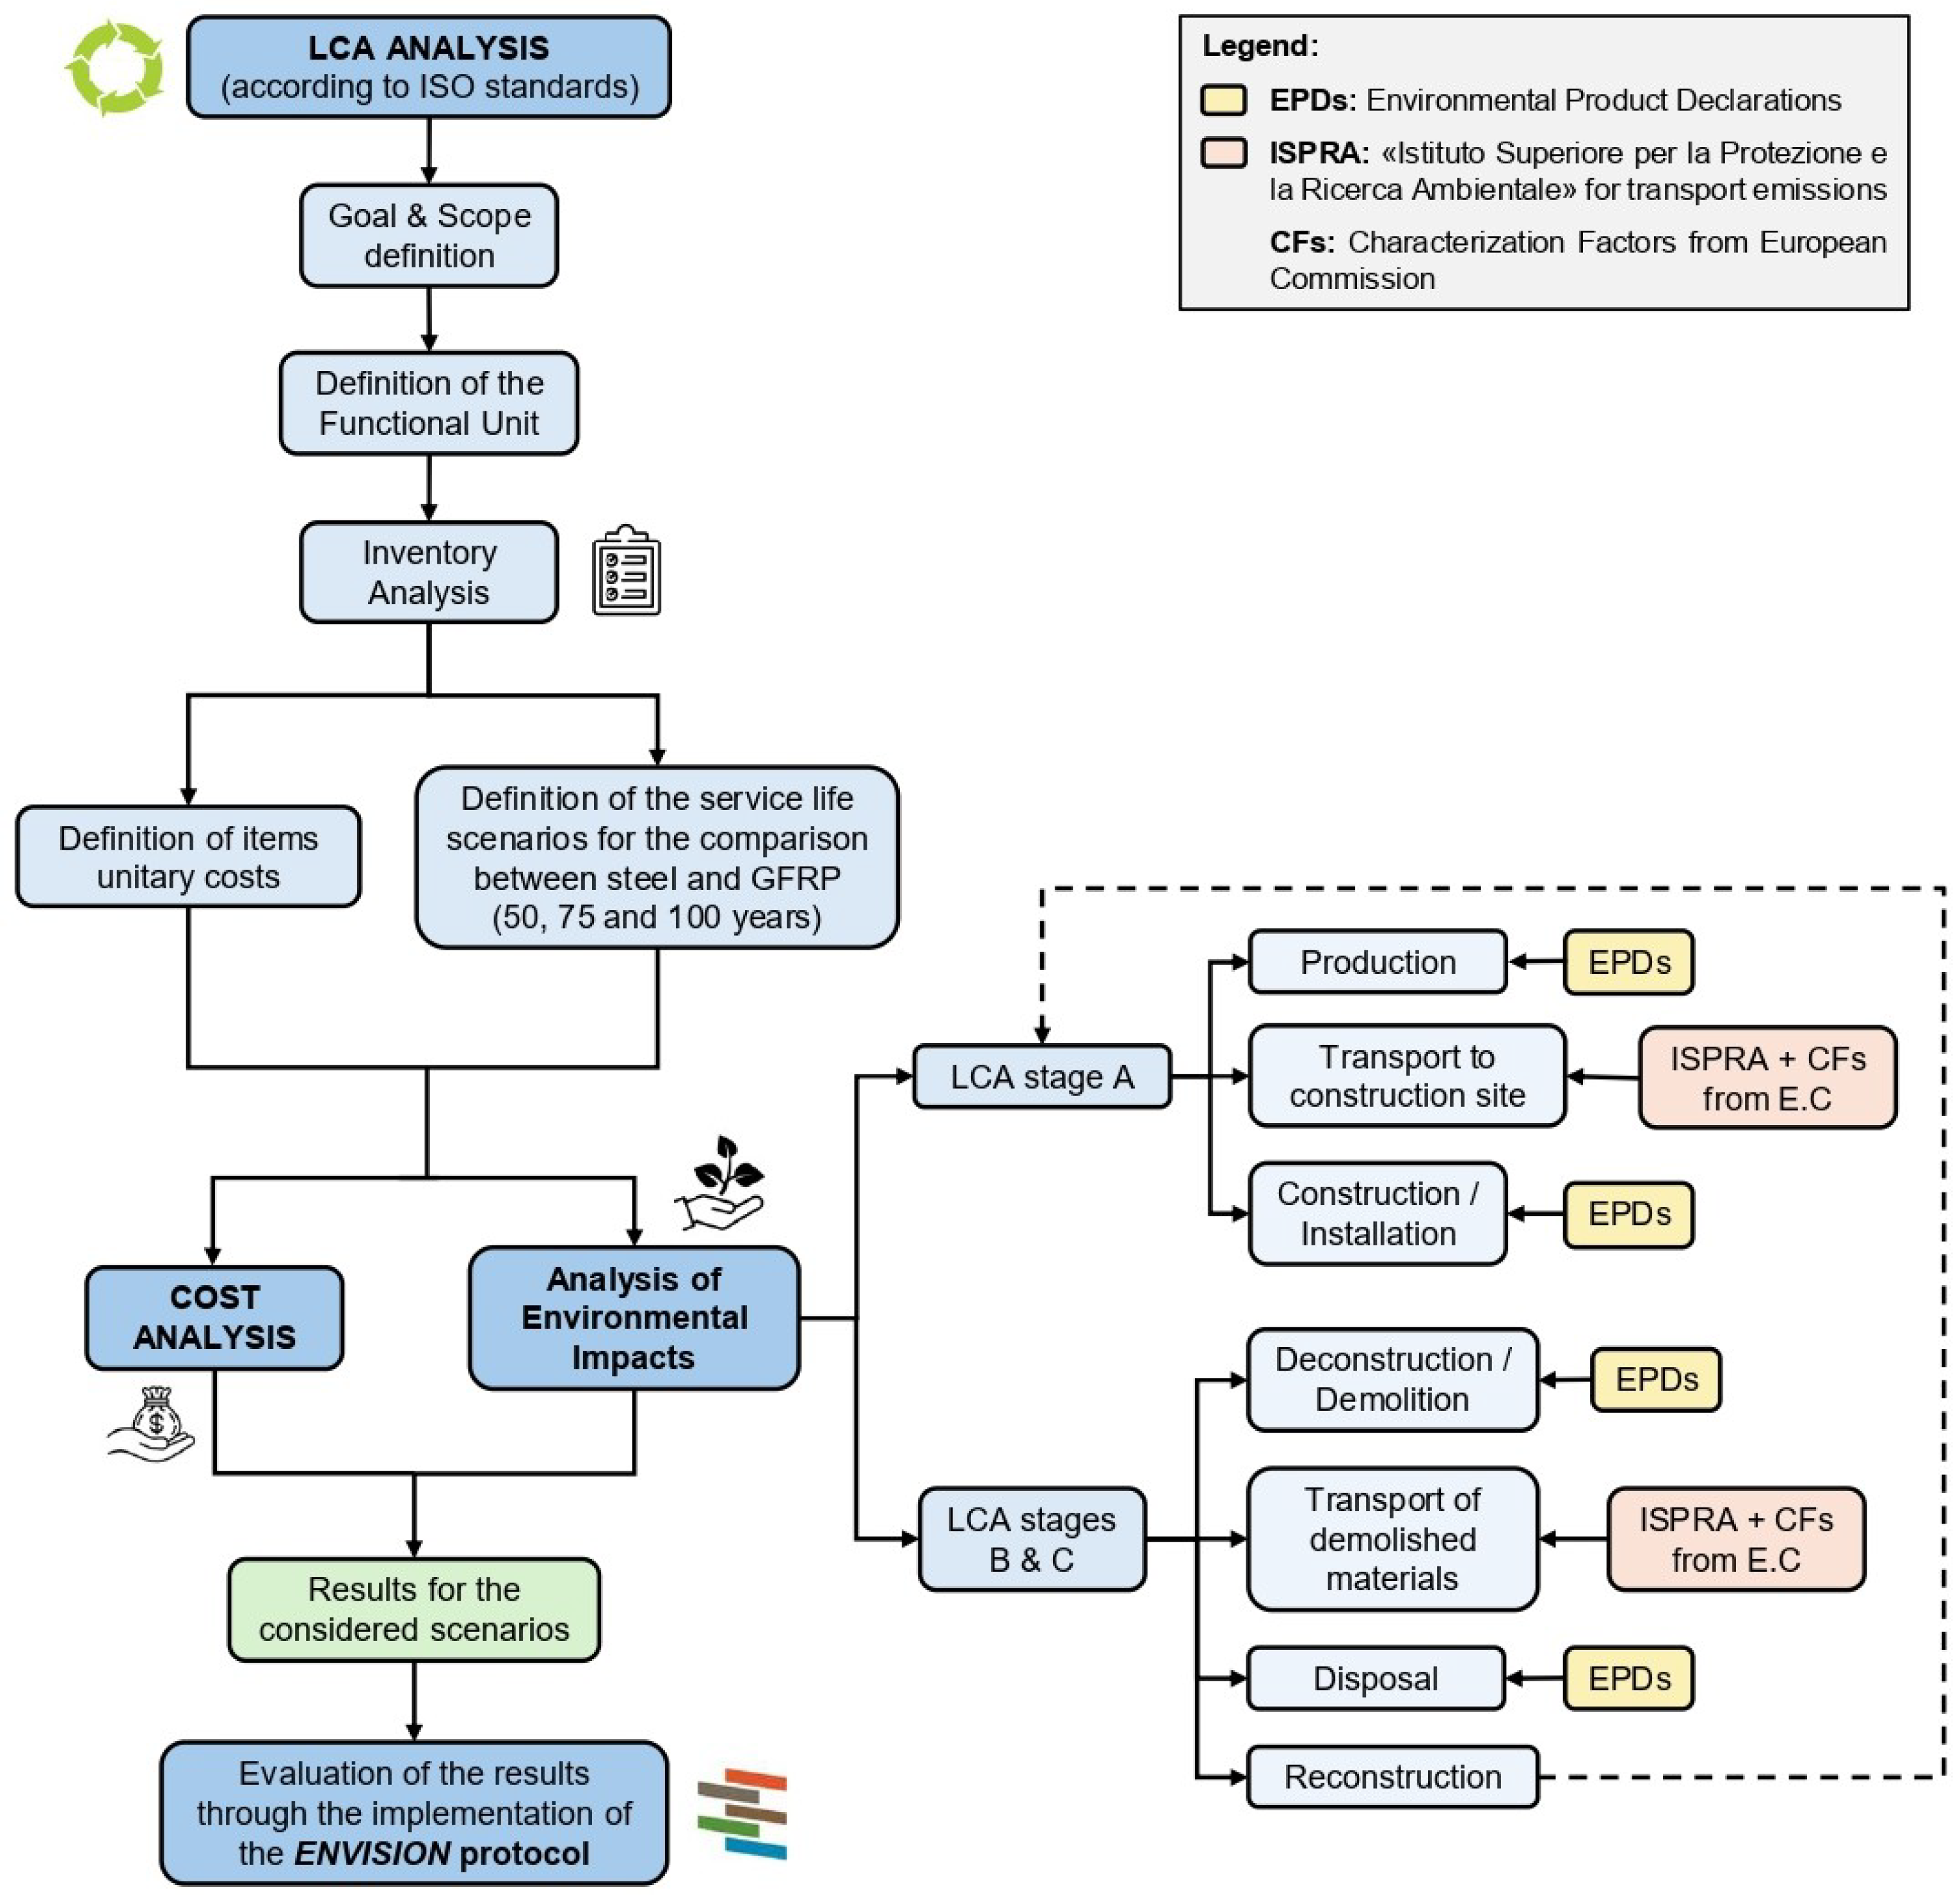
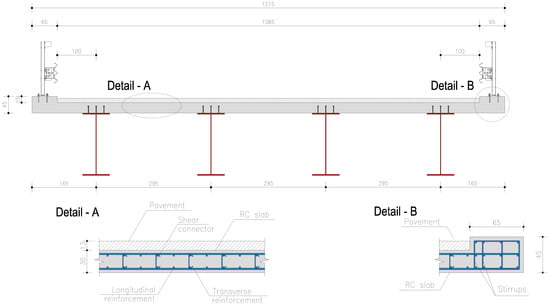
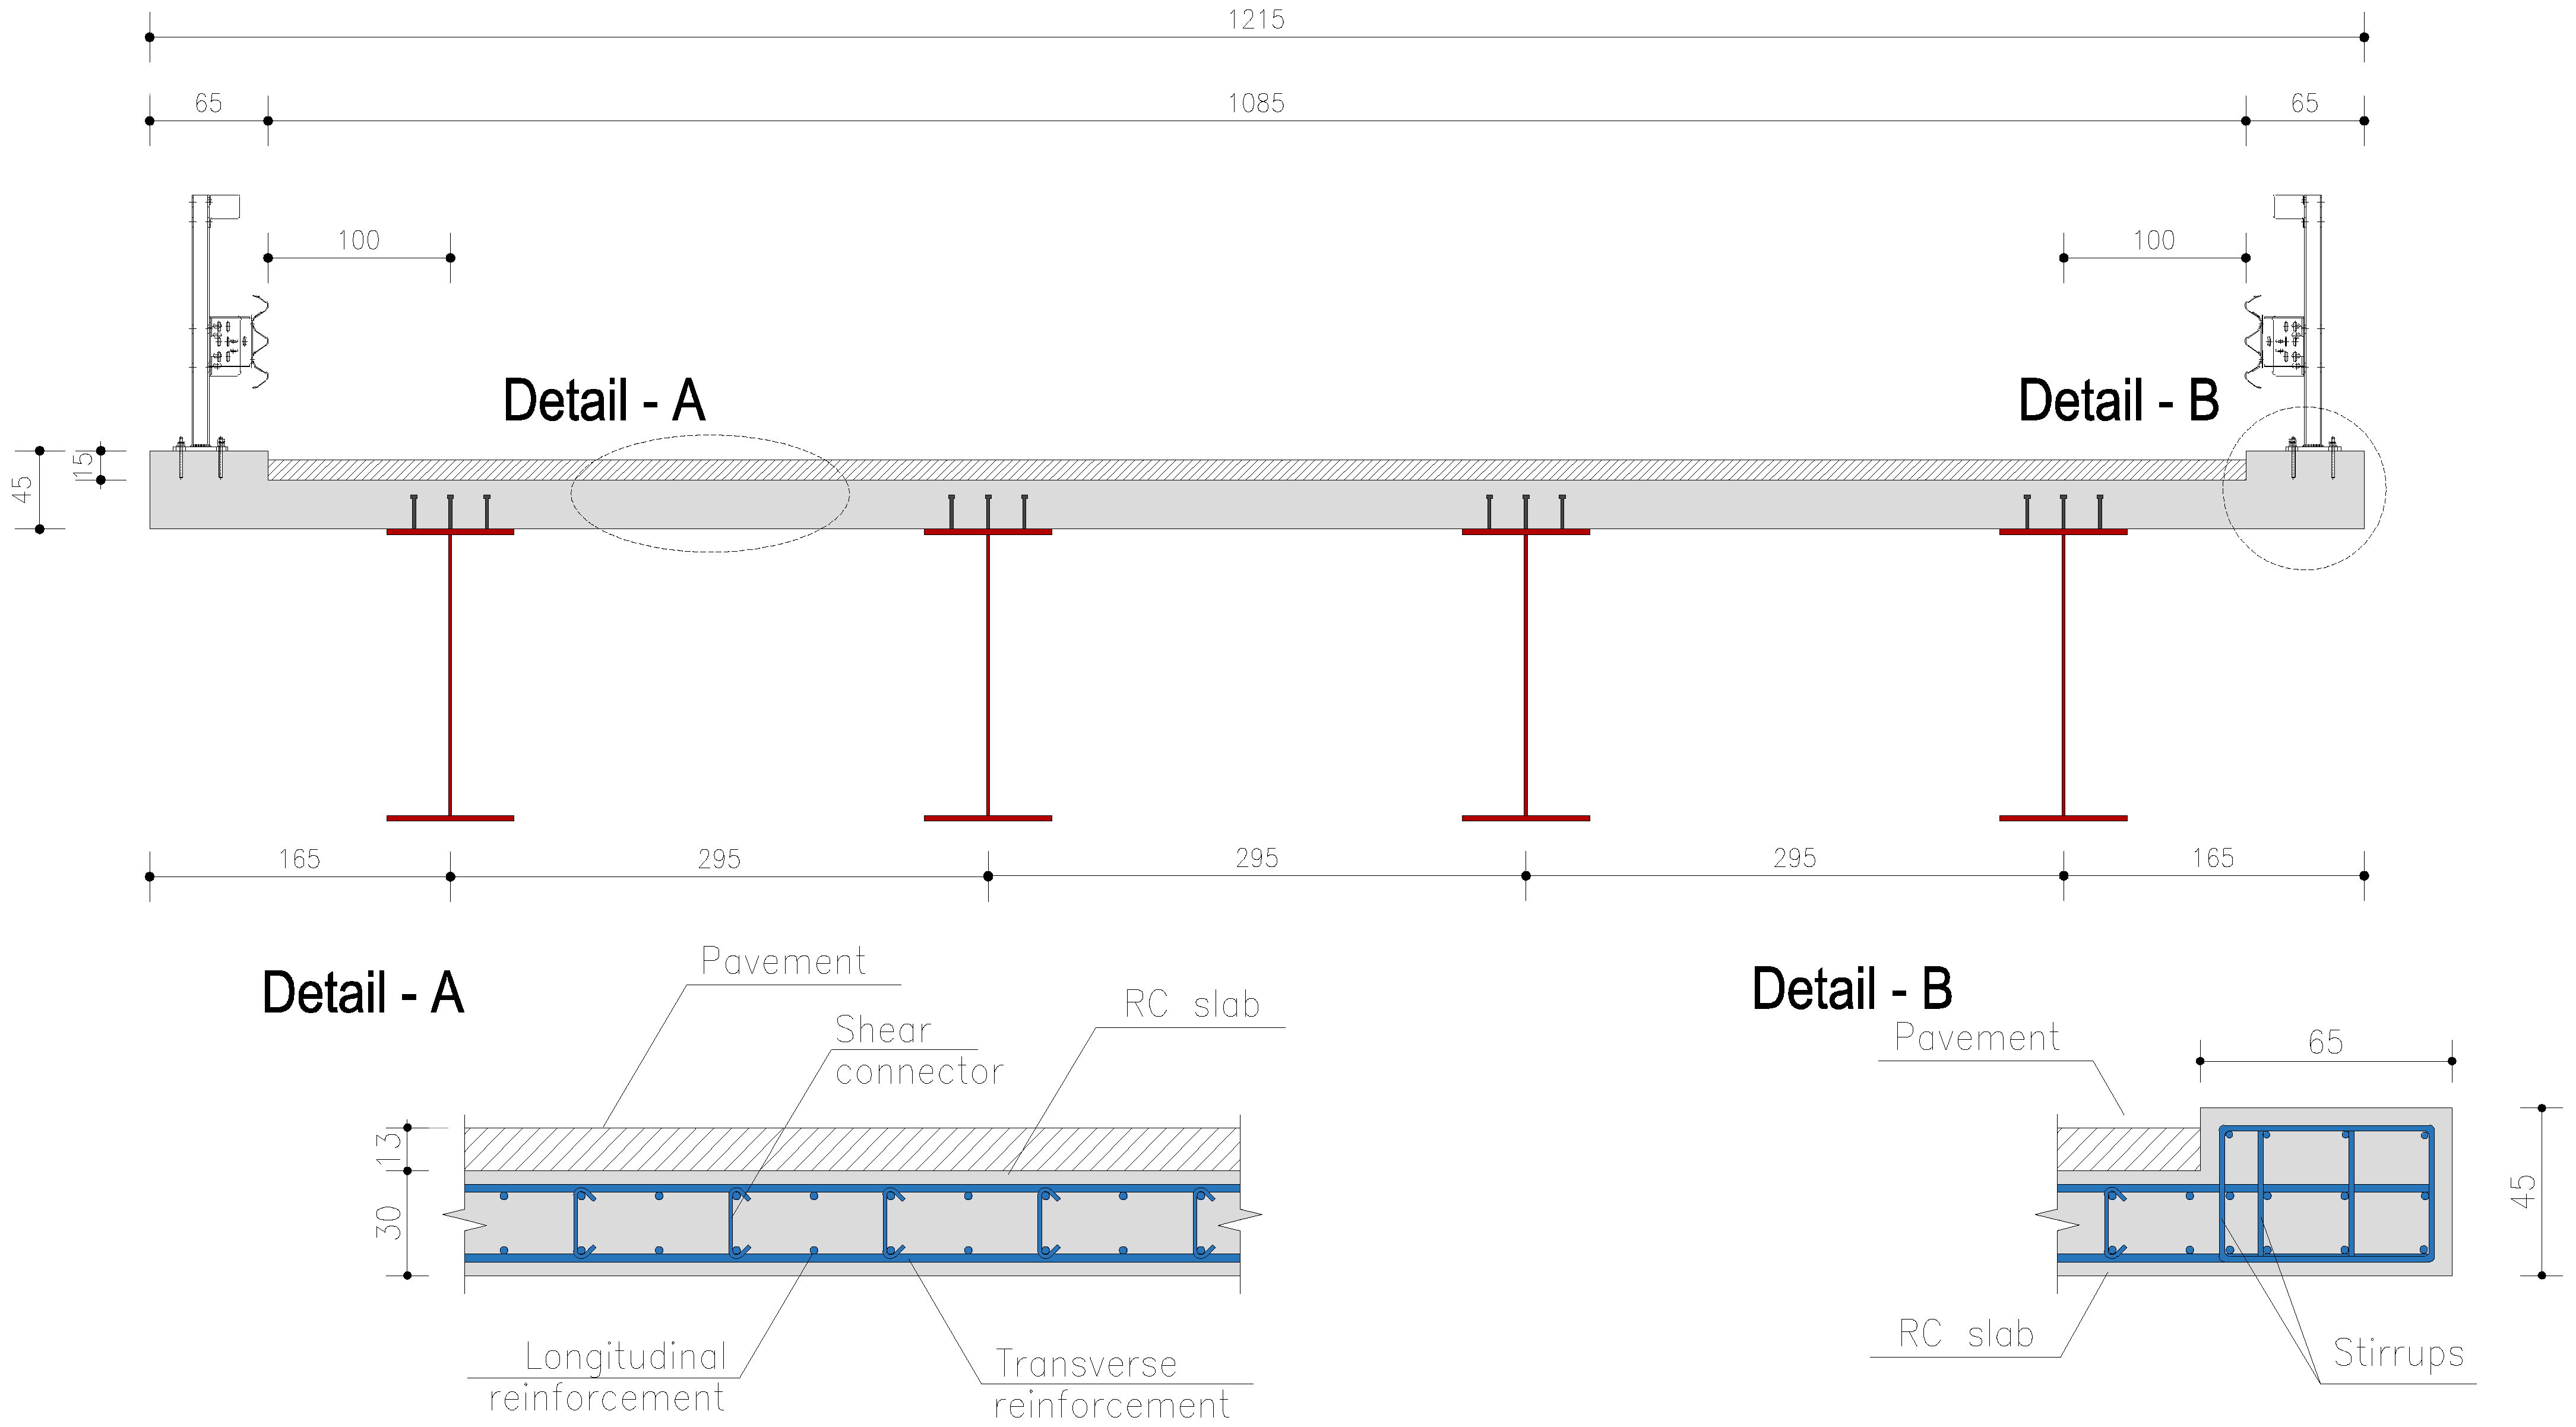
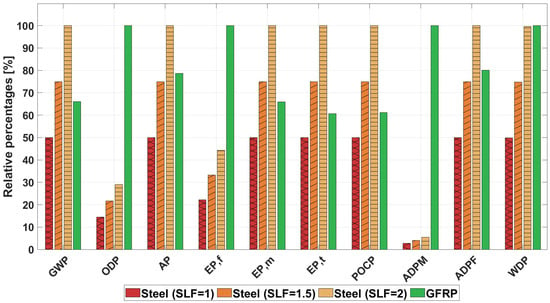
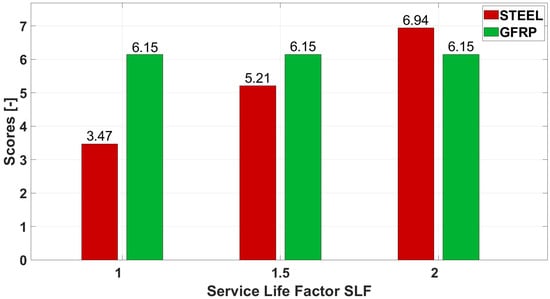
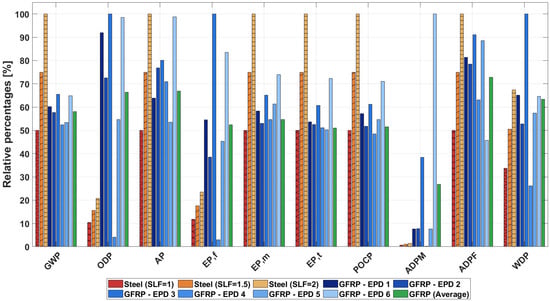
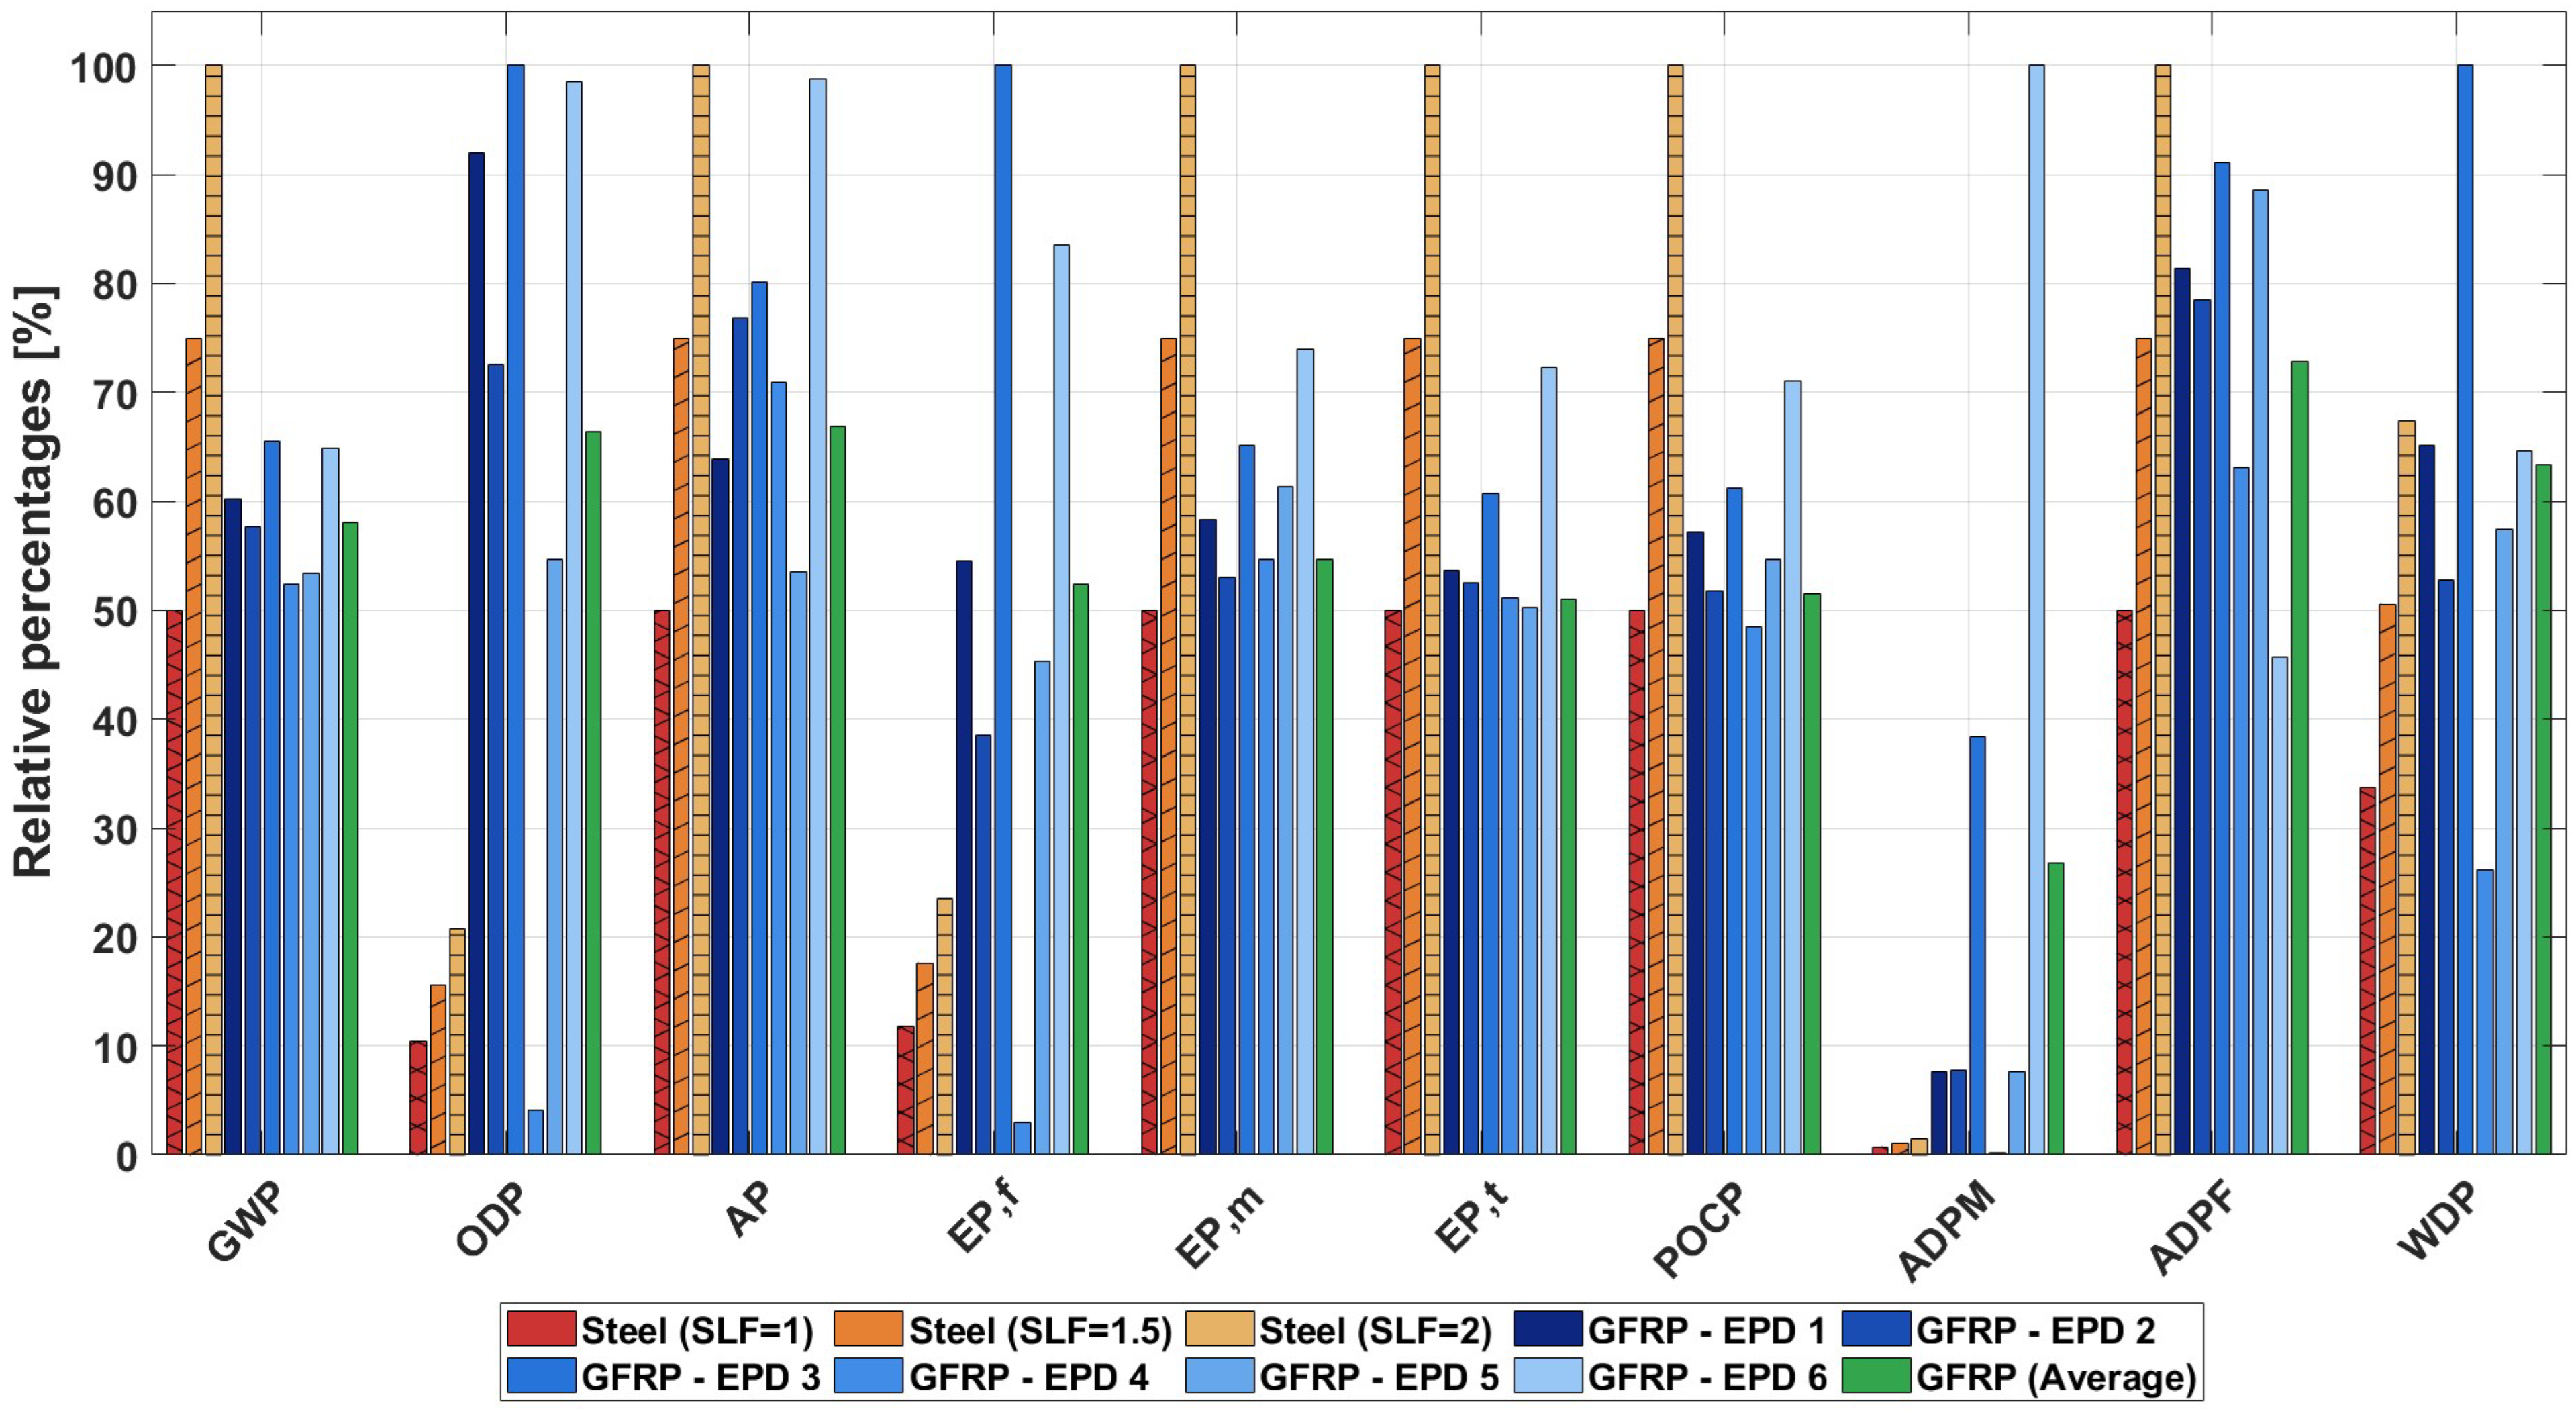
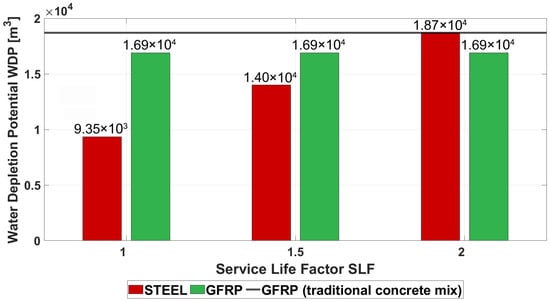
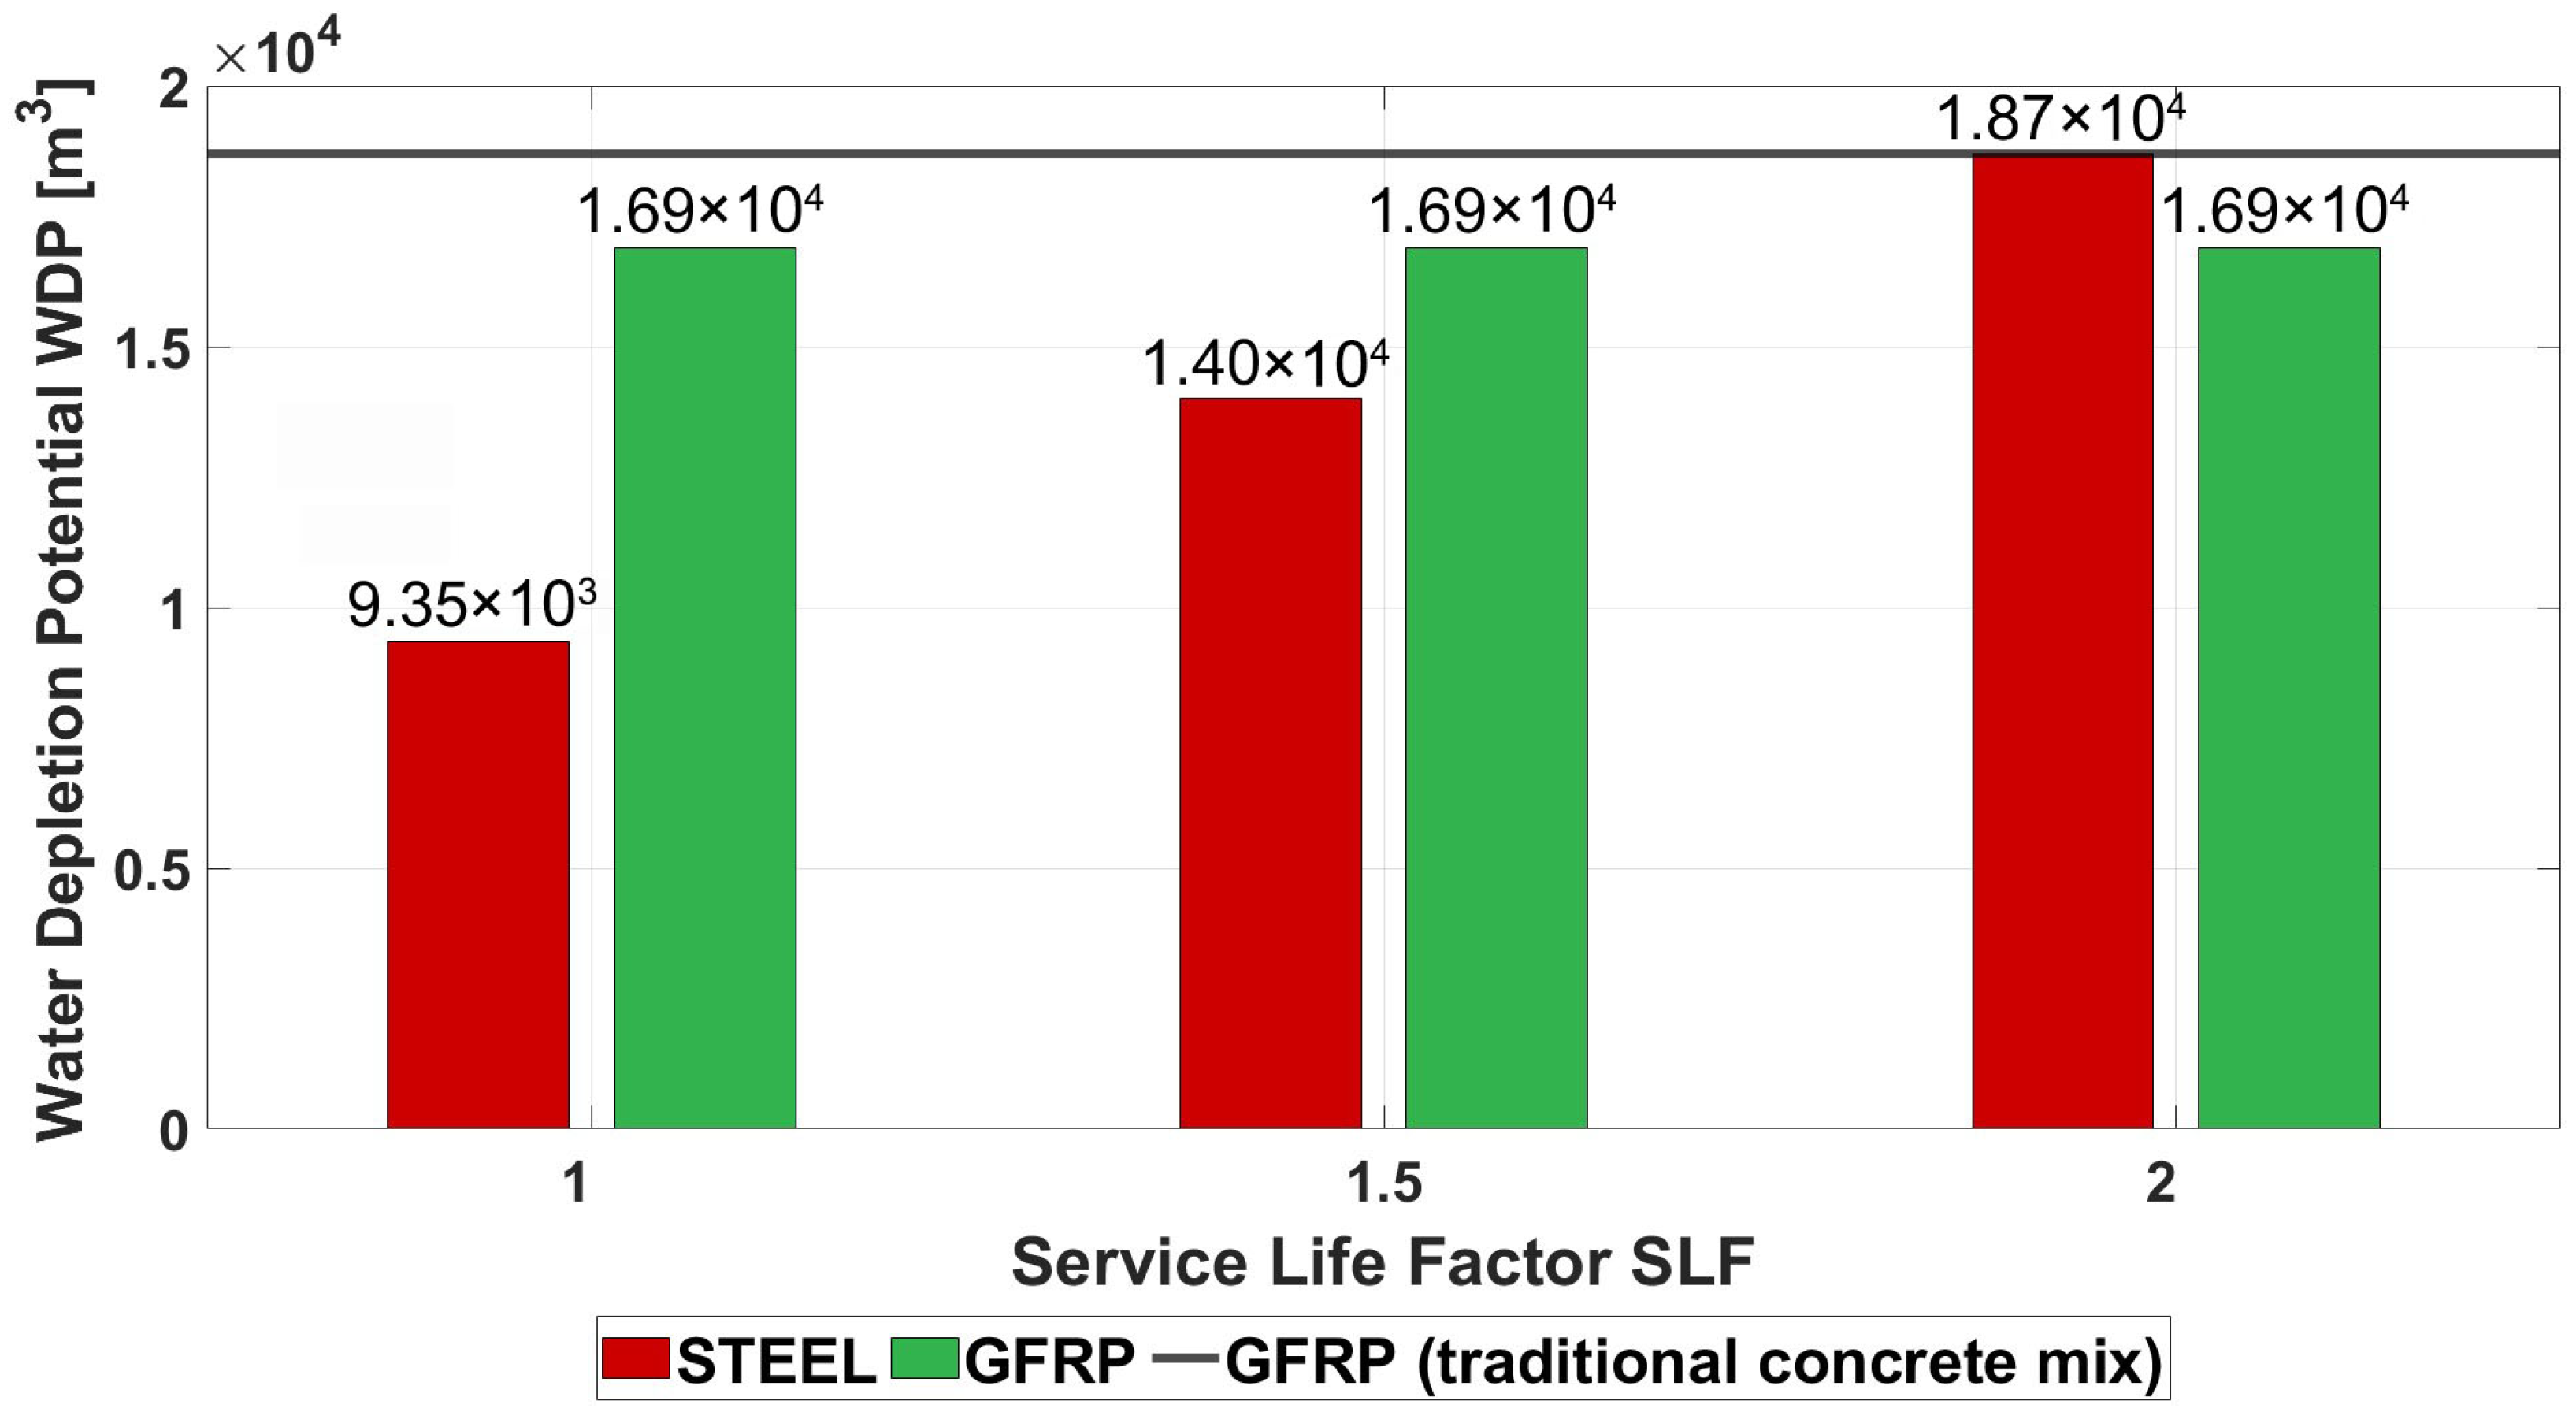
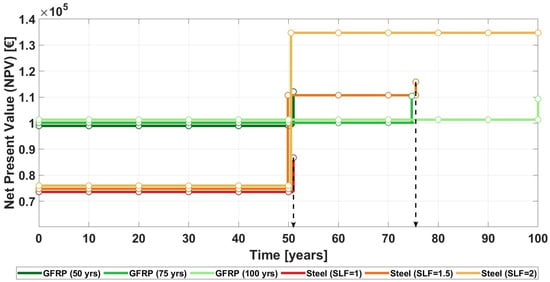
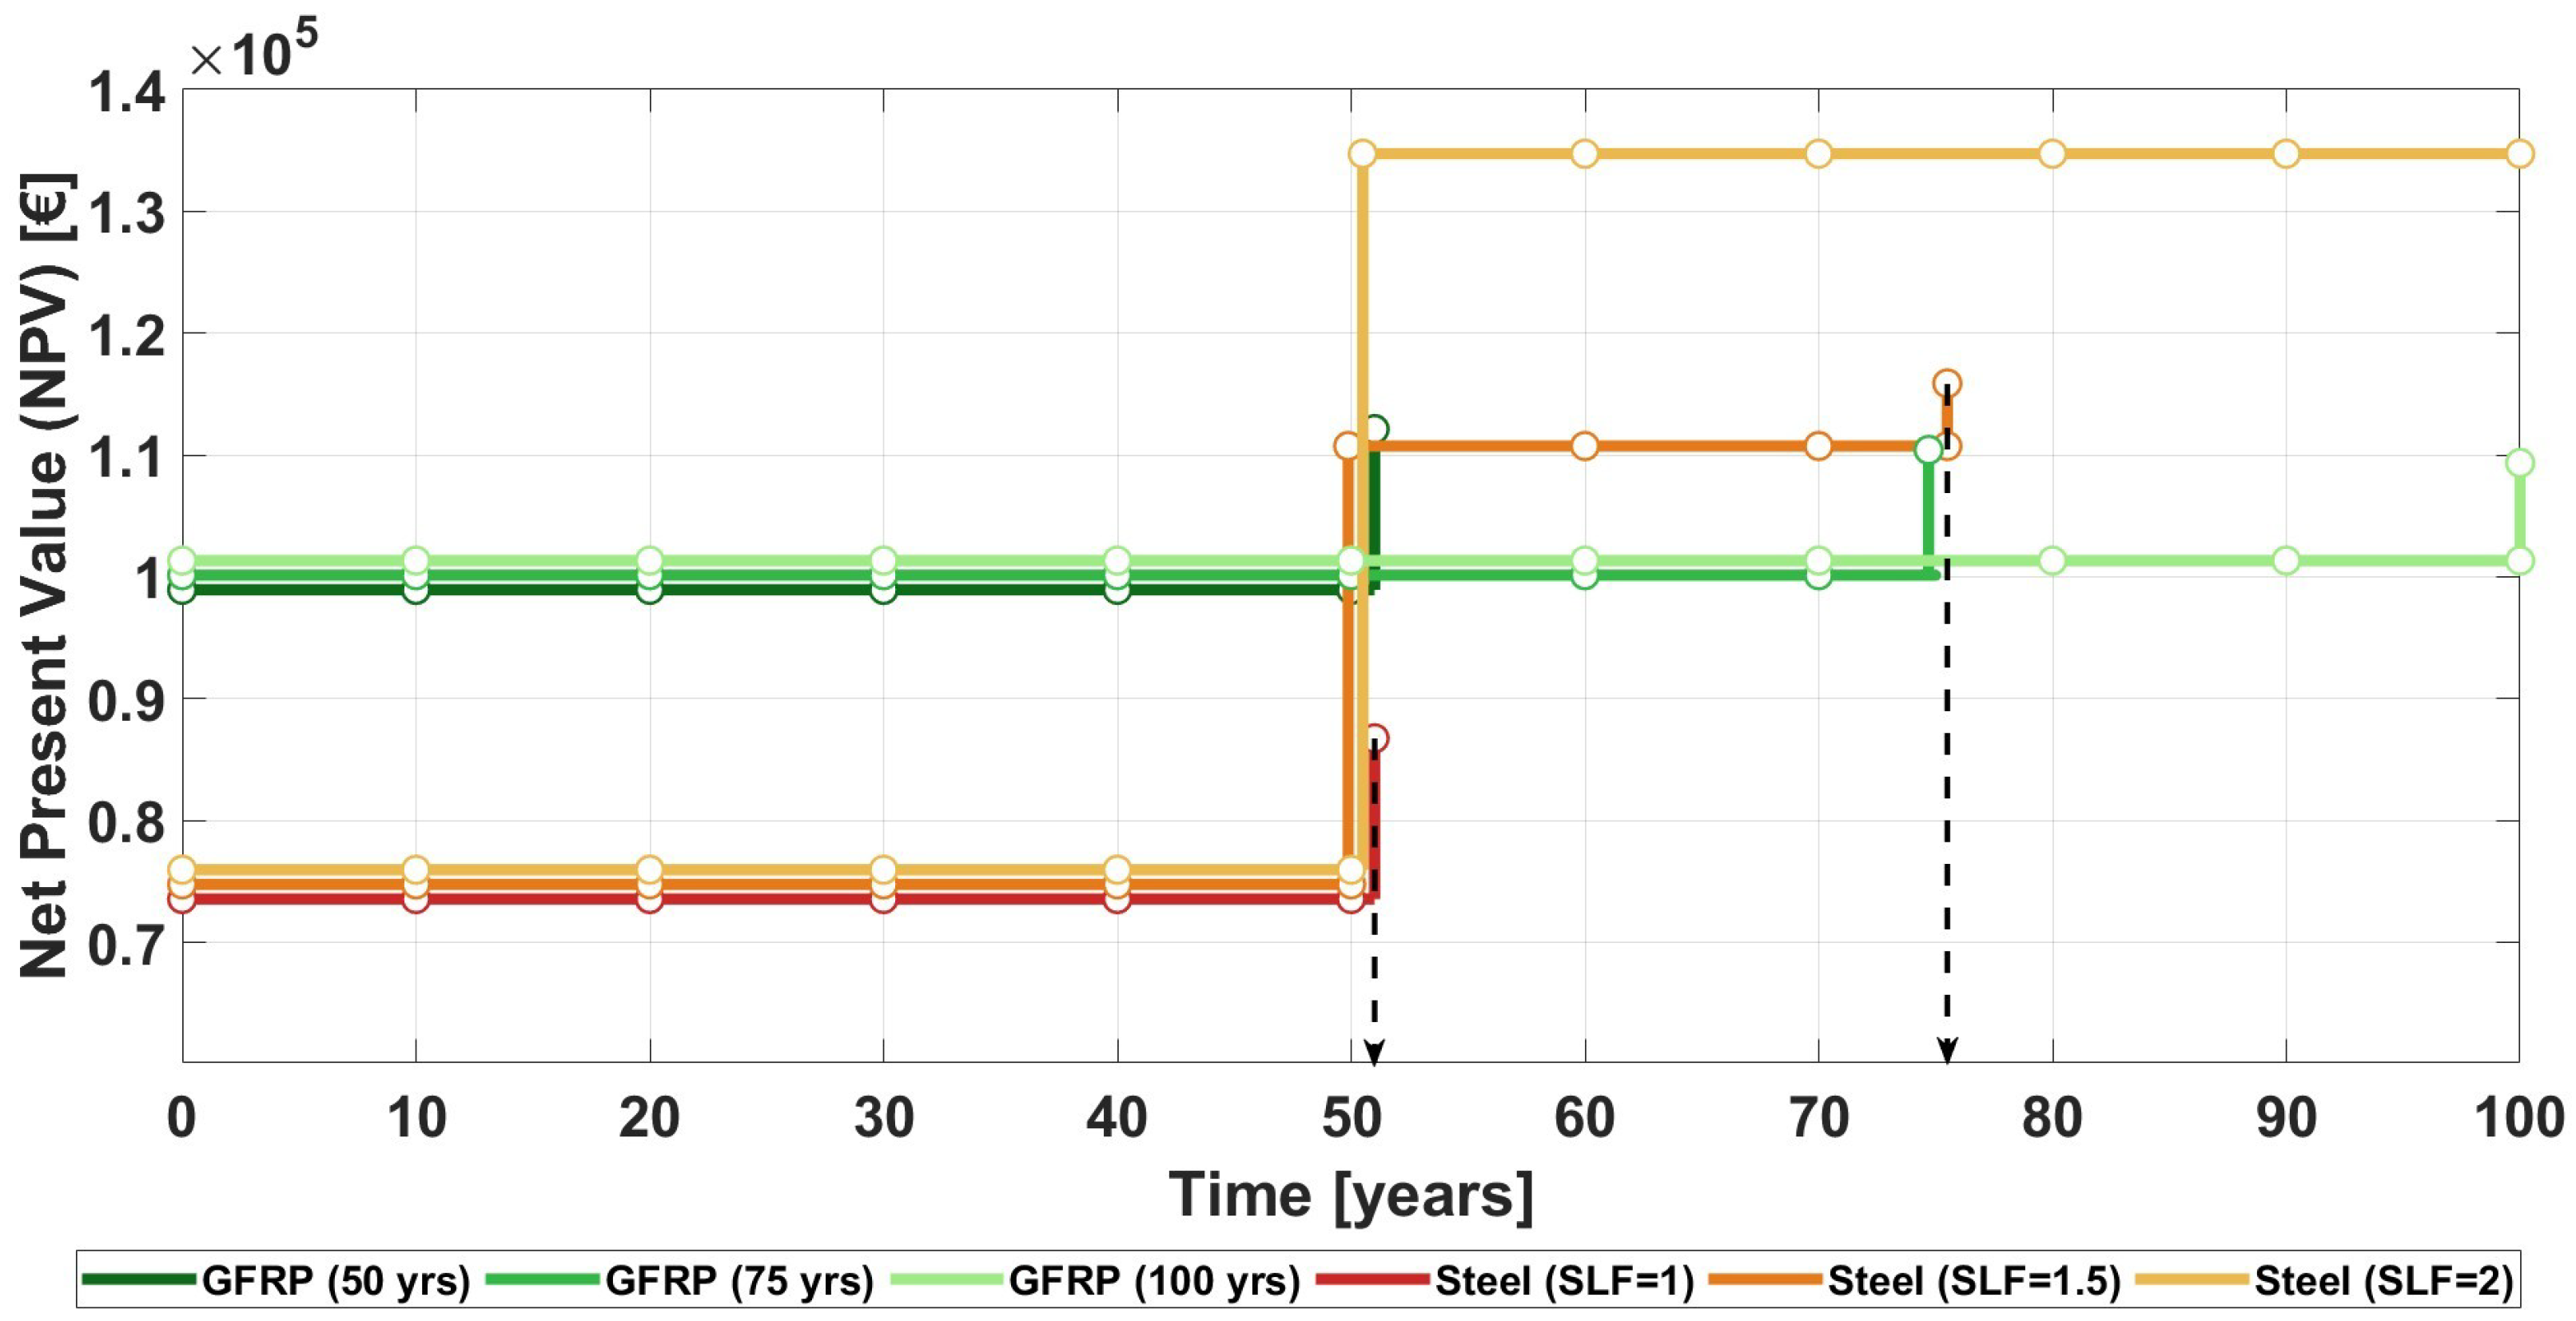
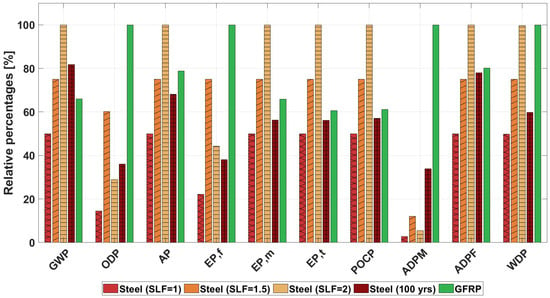
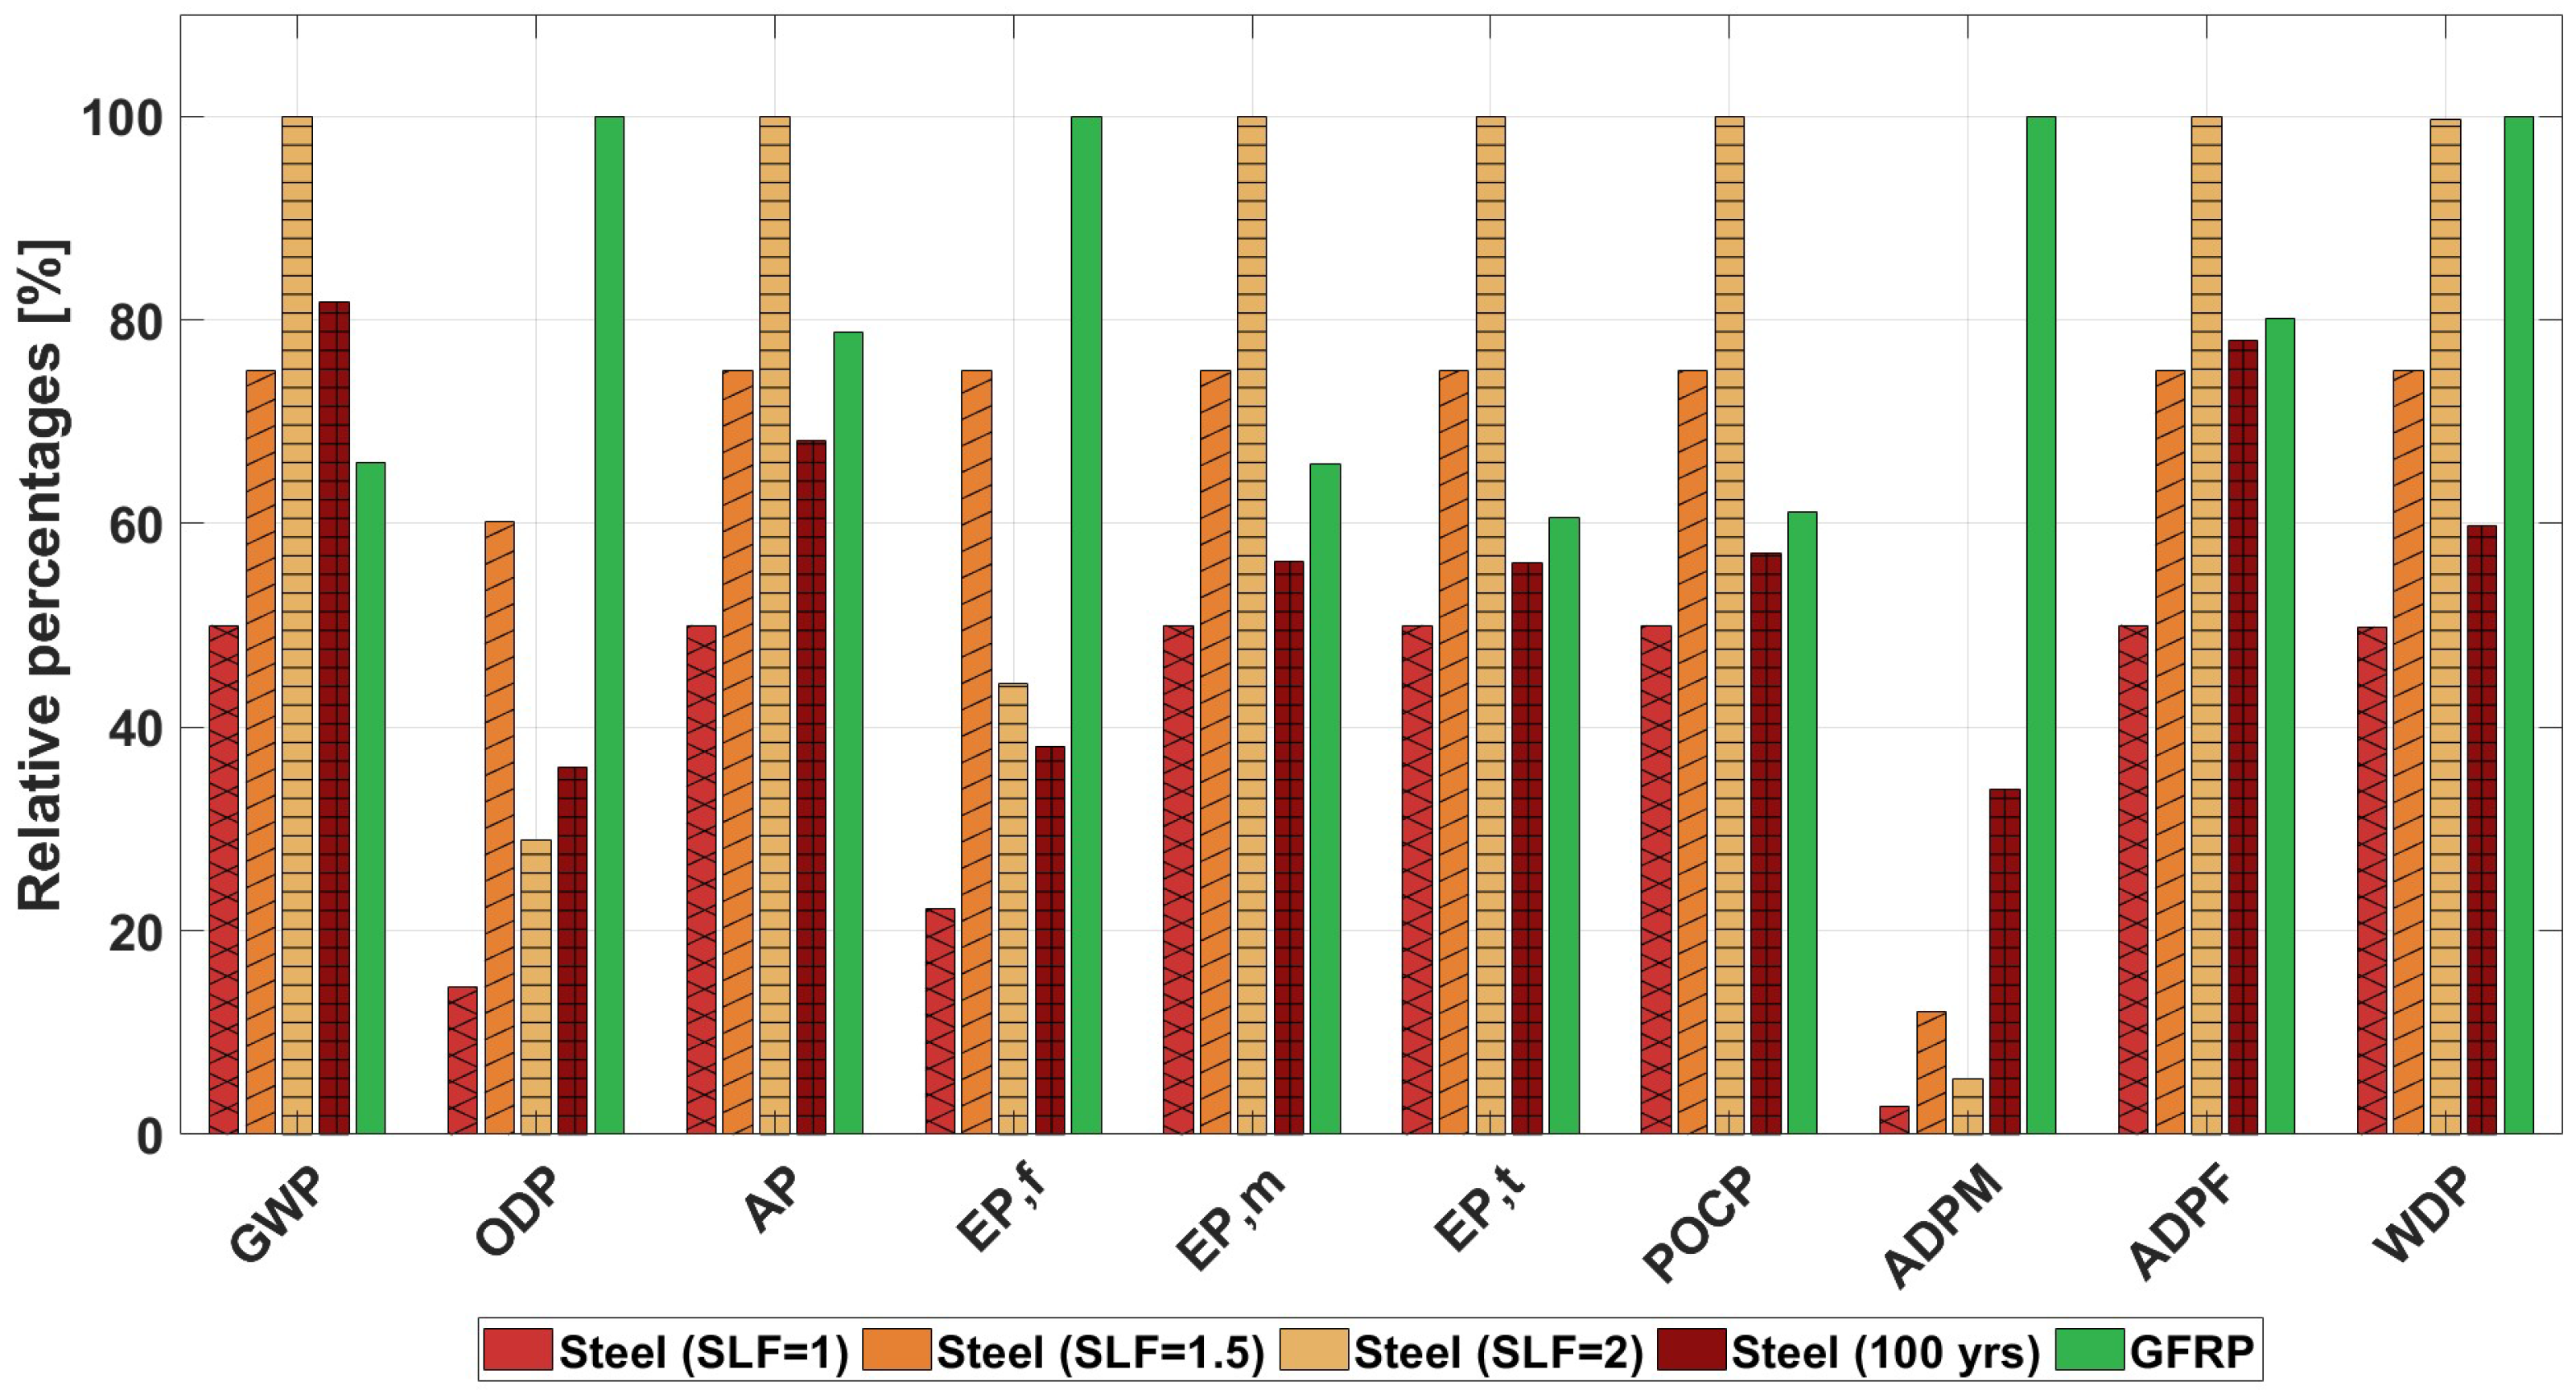
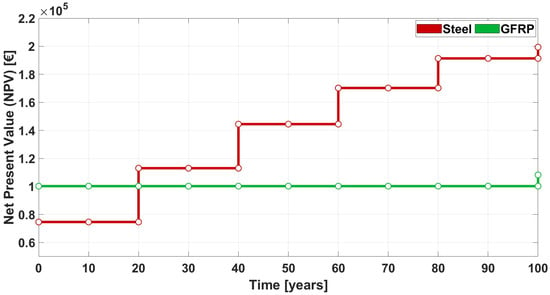
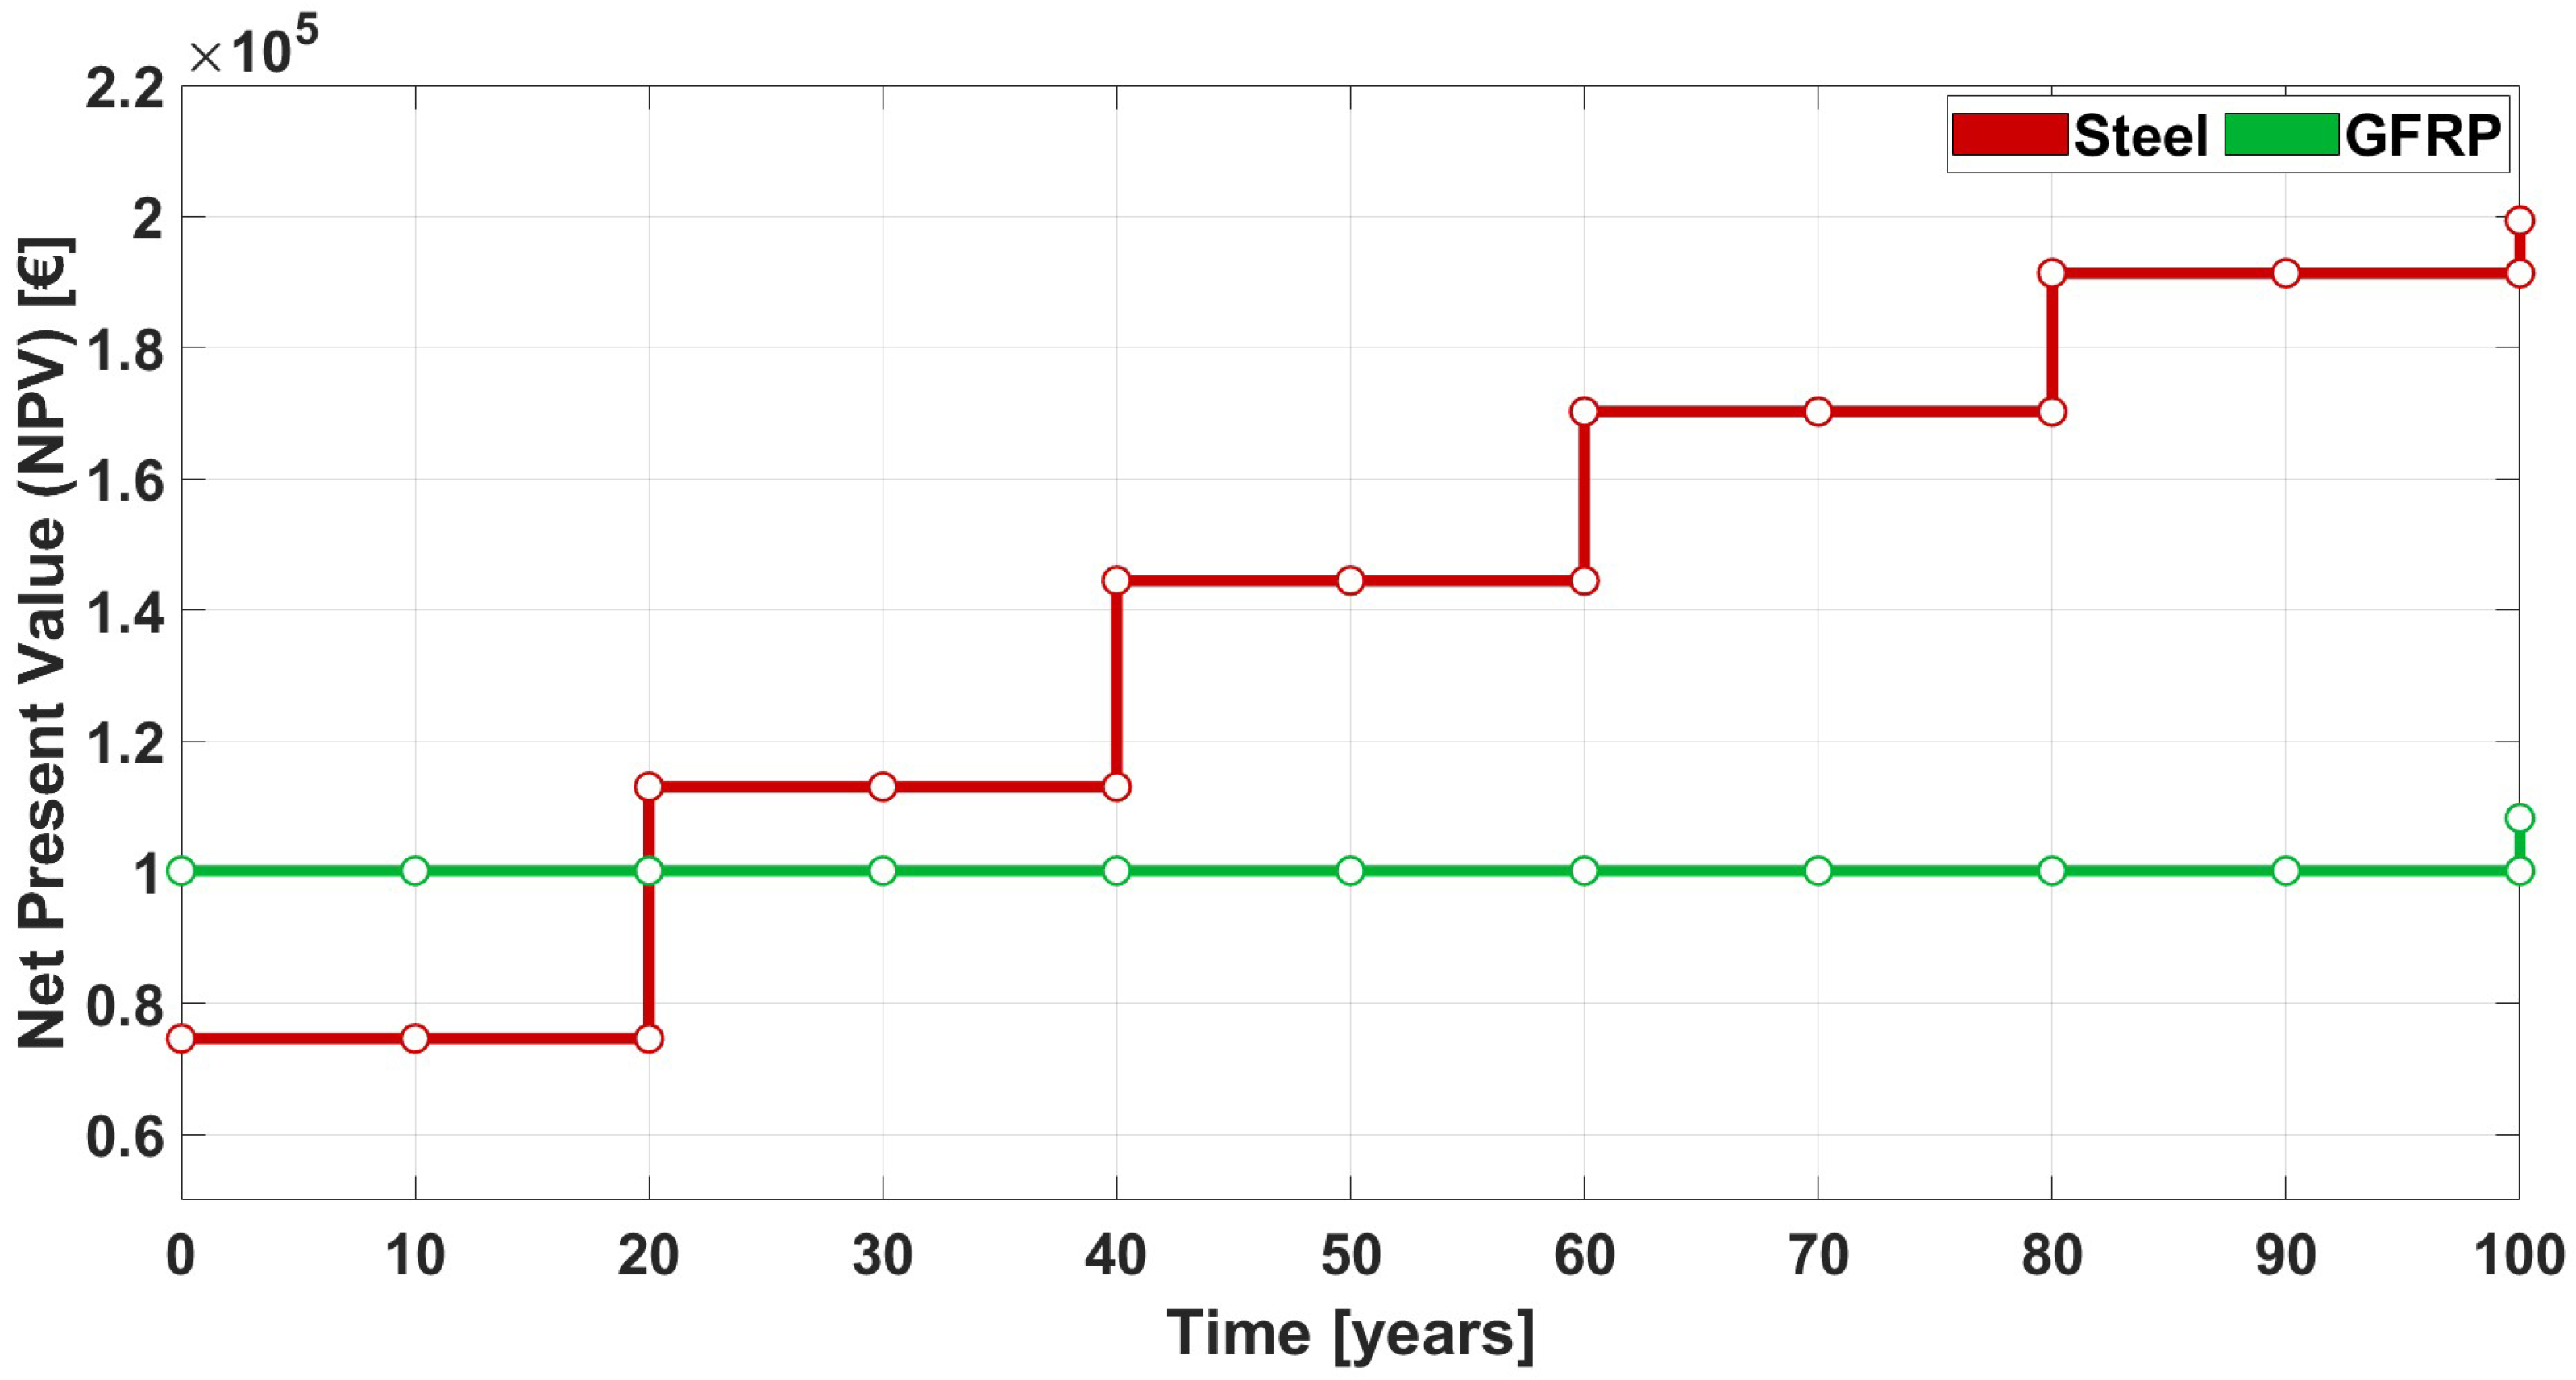

Disclaimer/Publisher’s Note: The statements, opinions and data contained in all publications are solely those of the individual author(s) and contributor(s) and not of MDPI and/or the editor(s). MDPI and/or the editor(s) disclaim responsibility for any injury to people or property resulting from any ideas, methods, instructions or products referred to in the content. |
© 2026 by the authors. Licensee MDPI, Basel, Switzerland. This article is an open access article distributed under the terms and conditions of the Creative Commons Attribution (CC BY) license.