


Abstract
As the most prevalent type of existing building in China, masonry structures are susceptible to cracking due to the low tensile strength of the masonry material. In the event of a sudden, strong earthquake, they are highly prone to brittle collapse, leaving occupants little time and space to escape. Based on this, combining the advantages of the elastoplastic mechanical theory and the nonlinear finite element (FE) method, this study adopts different modeling methods: integral modeling (IM), contact element discrete modeling (CEDM), spring element discrete modeling (SEDM), and co-node discrete modeling (CNDM). FE models of unreinforced masonry walls (UMWs) are established, respectively, and a monotonic pushover mechanical performance analysis is carried out. The accuracy of the adopted modeling methods is verified against existing test results for UMW specimens. Through parametric analysis of aspect ratios (0.5, 0.75, 1.0, and 1.25), axial compression ratios (0.1, 0.3, 0.5, 0.7, and 0.8), and mortar strengths (M5, M7.5, and M10), the characteristic mechanical performance factors of UMWs are determined. A novel strength index is proposed to discriminate between failure modes and elucidate the damage mechanism of UMWs. The results indicate that the ultimate load and its corresponding displacement change systematically with variations in aspect ratios, axial compression ratios, and mortar strengths. Furthermore, integrating stress cloud maps with the proposed strength index provides a quantitative basis for discriminating between flexural and shear failure modes in UMWs. All four modeling methods can, to varying degrees, capture the pushover behavior of UMWs, and quantifiable selection schemes are provided to balance analysis accuracy and computational cost. The analytical methods and findings presented in this work can be applied to performance assessment, seismic design, and engineering practice of UMWs.
1. Introduction
Masonry structures are not only low-cost in materials but also excellent in thermal and sound insulation, fire resistance, and durability. They are widely used in low- to medium-rise buildings, especially in urban and rural residences, where masonry structures are abundant and hold a dominant position [1]. As one of the structural forms with the weakest seismic capacity and potential to incur the most severe damage in buildings, masonry structures often result in significant economic losses and casualties during sudden seismic disasters [2]. Under seismic action, unreinforced masonry walls (UMWs) are subjected to the combined effects of compressive stress from vertical loads and shear stress from horizontal seismic action, resulting in complex in-plane forces [3]. Accurate evaluation of the pushover performance of UMWs provides a reliable basis for their seismic design and is of great significance for ensuring their seismic safety. Finite element (FE) simulation technology provides a powerful and flexible research platform for the pushover performance analysis of masonry structures through its full-process refined simulation, high economic benefits and efficiency, and strong damage visualization and mechanism insight capabilities. It not only overcomes the limitations of traditional test methods, such as high cost, long cycle, and limited data, but also reveals the nonlinear behavior and damage mechanism of UMWs at the mesoscopic level, thereby providing a solid theoretical basis and technical support for the accurate evaluation of seismic performance and reinforcement transformation of UMWs.
The choice of FE modeling methods for UMWs directly influences the analysis results of their pushover performance. Commonly used FE modeling methods for UMWs are generally categorized into integral modeling and discrete modeling. In integral modeling, no distinction is made between masonry blocks and mortar during modeling; the interaction between blocks and mortar is disregarded, and they are combined into a homogenized material simulated using a unified masonry constitutive relationship [4,5,6]. Discrete modeling includes two sub-methods: one ignores the geometric dimensions of mortar, integrates masonry blocks and the surrounding half-thickness mortar into a homogenized composite block solid element, and accounts for effects such as bond, friction, and damping between blocks through interface elements [7,8,9,10,11,12]; the other models masonry blocks and mortar separately as distinct materials, assigning different elastoplastic constitutive relationships to each [13,14,15,16]. Recently, extensive research on the numerical simulation of UMWs has been conducted by international scholars. Bomben et al. [17] compared mesoscale and macro-modeling approaches under cyclic loading. It was found that the macro-modeling approach was computationally robust but exhibited significant variability in results, whereas the mesoscale approach was accurate but computationally expensive. Akcan et al. [18] simulated the in-plane failure of UMWs using the discrete finite element method (FDEM) and the applied element method (AEM) and compared the computational cost, accuracy, and sensitivity to material parameters. Khorami et al. [19] proposed an algorithm based on nonlinear topology optimization, which identified critical regions in the structure for mesoscale modeling and achieved a 30–46% reduction in computational time while maintaining accuracy. Prosperi et al. [20] compared the performance of macro-modeling and simplified mesoscale approaches in the simulation of settlement-induced damage in masonry walls. It was noted that the macro-modeling approach was computationally efficient but less accurate, whereas the simplified mesoscale approach better captured crack patterns. The above studies indicated that achieving a balance between computational accuracy and efficiency remains a central issue in numerical simulation research on UMWs.
The selection of appropriate constitutive relationships and modeling methods during FE simulation plays a decisive role in the accuracy of the analysis. A variety of compressive constitutive relationship models and expressions, including those for masonry, blocks, and mortar, have been proposed by many scholars through comparisons and analyses of the elastoplastic deformation and damage mechanisms of UMWs under different compression states [21,22,23,24]. These models and expressions can accurately simulate the mechanical behavior of UMWs under static and dynamic loads, as well as the strain hardening and softening phenomena in masonry during loading. For discrete modeling, the key lies in simulating interface element constitutive models that can simplify mortar node layers and capture bonding, tensile cracking, shear sliding, and damage between masonry blocks. A variety of new nonlinear interface element constitutive models have been proposed by different scholars. The mechanical behavior of mortar nodes under loads is simulated by considering the coupling of damage and frictional sliding [25,26,27,28], explicit large deformation analysis [29], iterative constitutive models of linear interface elements for shearing based on sub-stepping technology considering Coulomb friction failure surfaces [30], and coupled damage plasticity constitutive models based on the traction separation law [31,32]. Their analysis accuracy and computational efficiency are verified through different failure criteria.
The analysis of damage mechanisms and failure modes in masonry structures represents one of the most challenging issues in structural engineering [33]. Some researchers have applied nonlinear material models and failure criteria, comparing the accuracy and cost of analyses across modeling methods, such as monolithic and discrete approaches [34]. Both monotonic pushover and cyclic loading, as in-plane loading methods, have been shown to accurately analyze the mechanical performance of masonry structures [35,36,37]. Studies have also examined the influence of key factors such as aspect ratios [38,39], axial compression ratios [40,41,42,43], and mortar strengths [44,45] on the seismic behavior of masonry structures and preliminarily explored their damage mechanism and failure modes from perspectives such as load–displacement curves and stress cloud maps.
The development and exploration of various modeling methods and constitutive relationships for UMWs are presented in the aforementioned studies. Furthermore, targeted experiments and numerical simulations are conducted to investigate the factors influencing the mechanical properties of UMWs, such as aspect ratios, axial compression ratios, and mortar strengths, and preliminary discussions of the damage mechanism and failure mode of UMWs are presented using load–displacement curves or cloud maps. However, three main problems still exist in the existing research: (1) Most studies focus only on a single modeling method, no comprehensive comparative analysis is conducted by integrating common existing modeling methods for UMWs, and no quantifiable FE modeling selection scheme for UMWs is established. Research that provides an integrated, unified analysis and discussion of the key factors affecting the seismic performance of UMWs is relatively scarce. (2) Studies on the damage mechanism and failure modes of UMWs mostly rely on the observation of test phenomena and the analysis of macro-mechanical responses, which are essentially qualitative or semi-quantitative analyses and fail to fully reveal the inherent causal relationship between internal force redistribution, dynamic crack propagation, and the final failure mode. (3) Related to the classification and analysis of failure modes in Problem (2), the determination of failure modes still relies heavily on empirical and qualitative judgments. The problem lies in the lack of a quantitative judgment index system capable of accurately identifying different stress stages and warning of specific failure modes. It is difficult to define quantitative thresholds for key nodes, such as peaks and sharp declines in the evolution of normal and shear stress, and there is also a lack of universal criteria that can clearly distinguish between dominant failure modes controlled by shear or flexure.
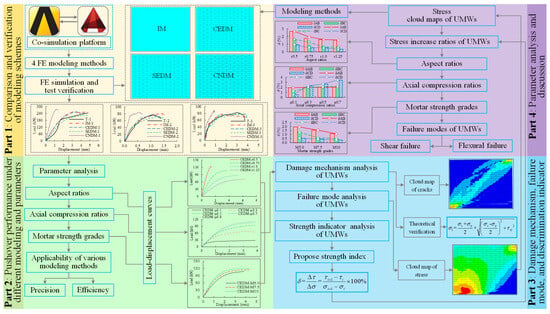
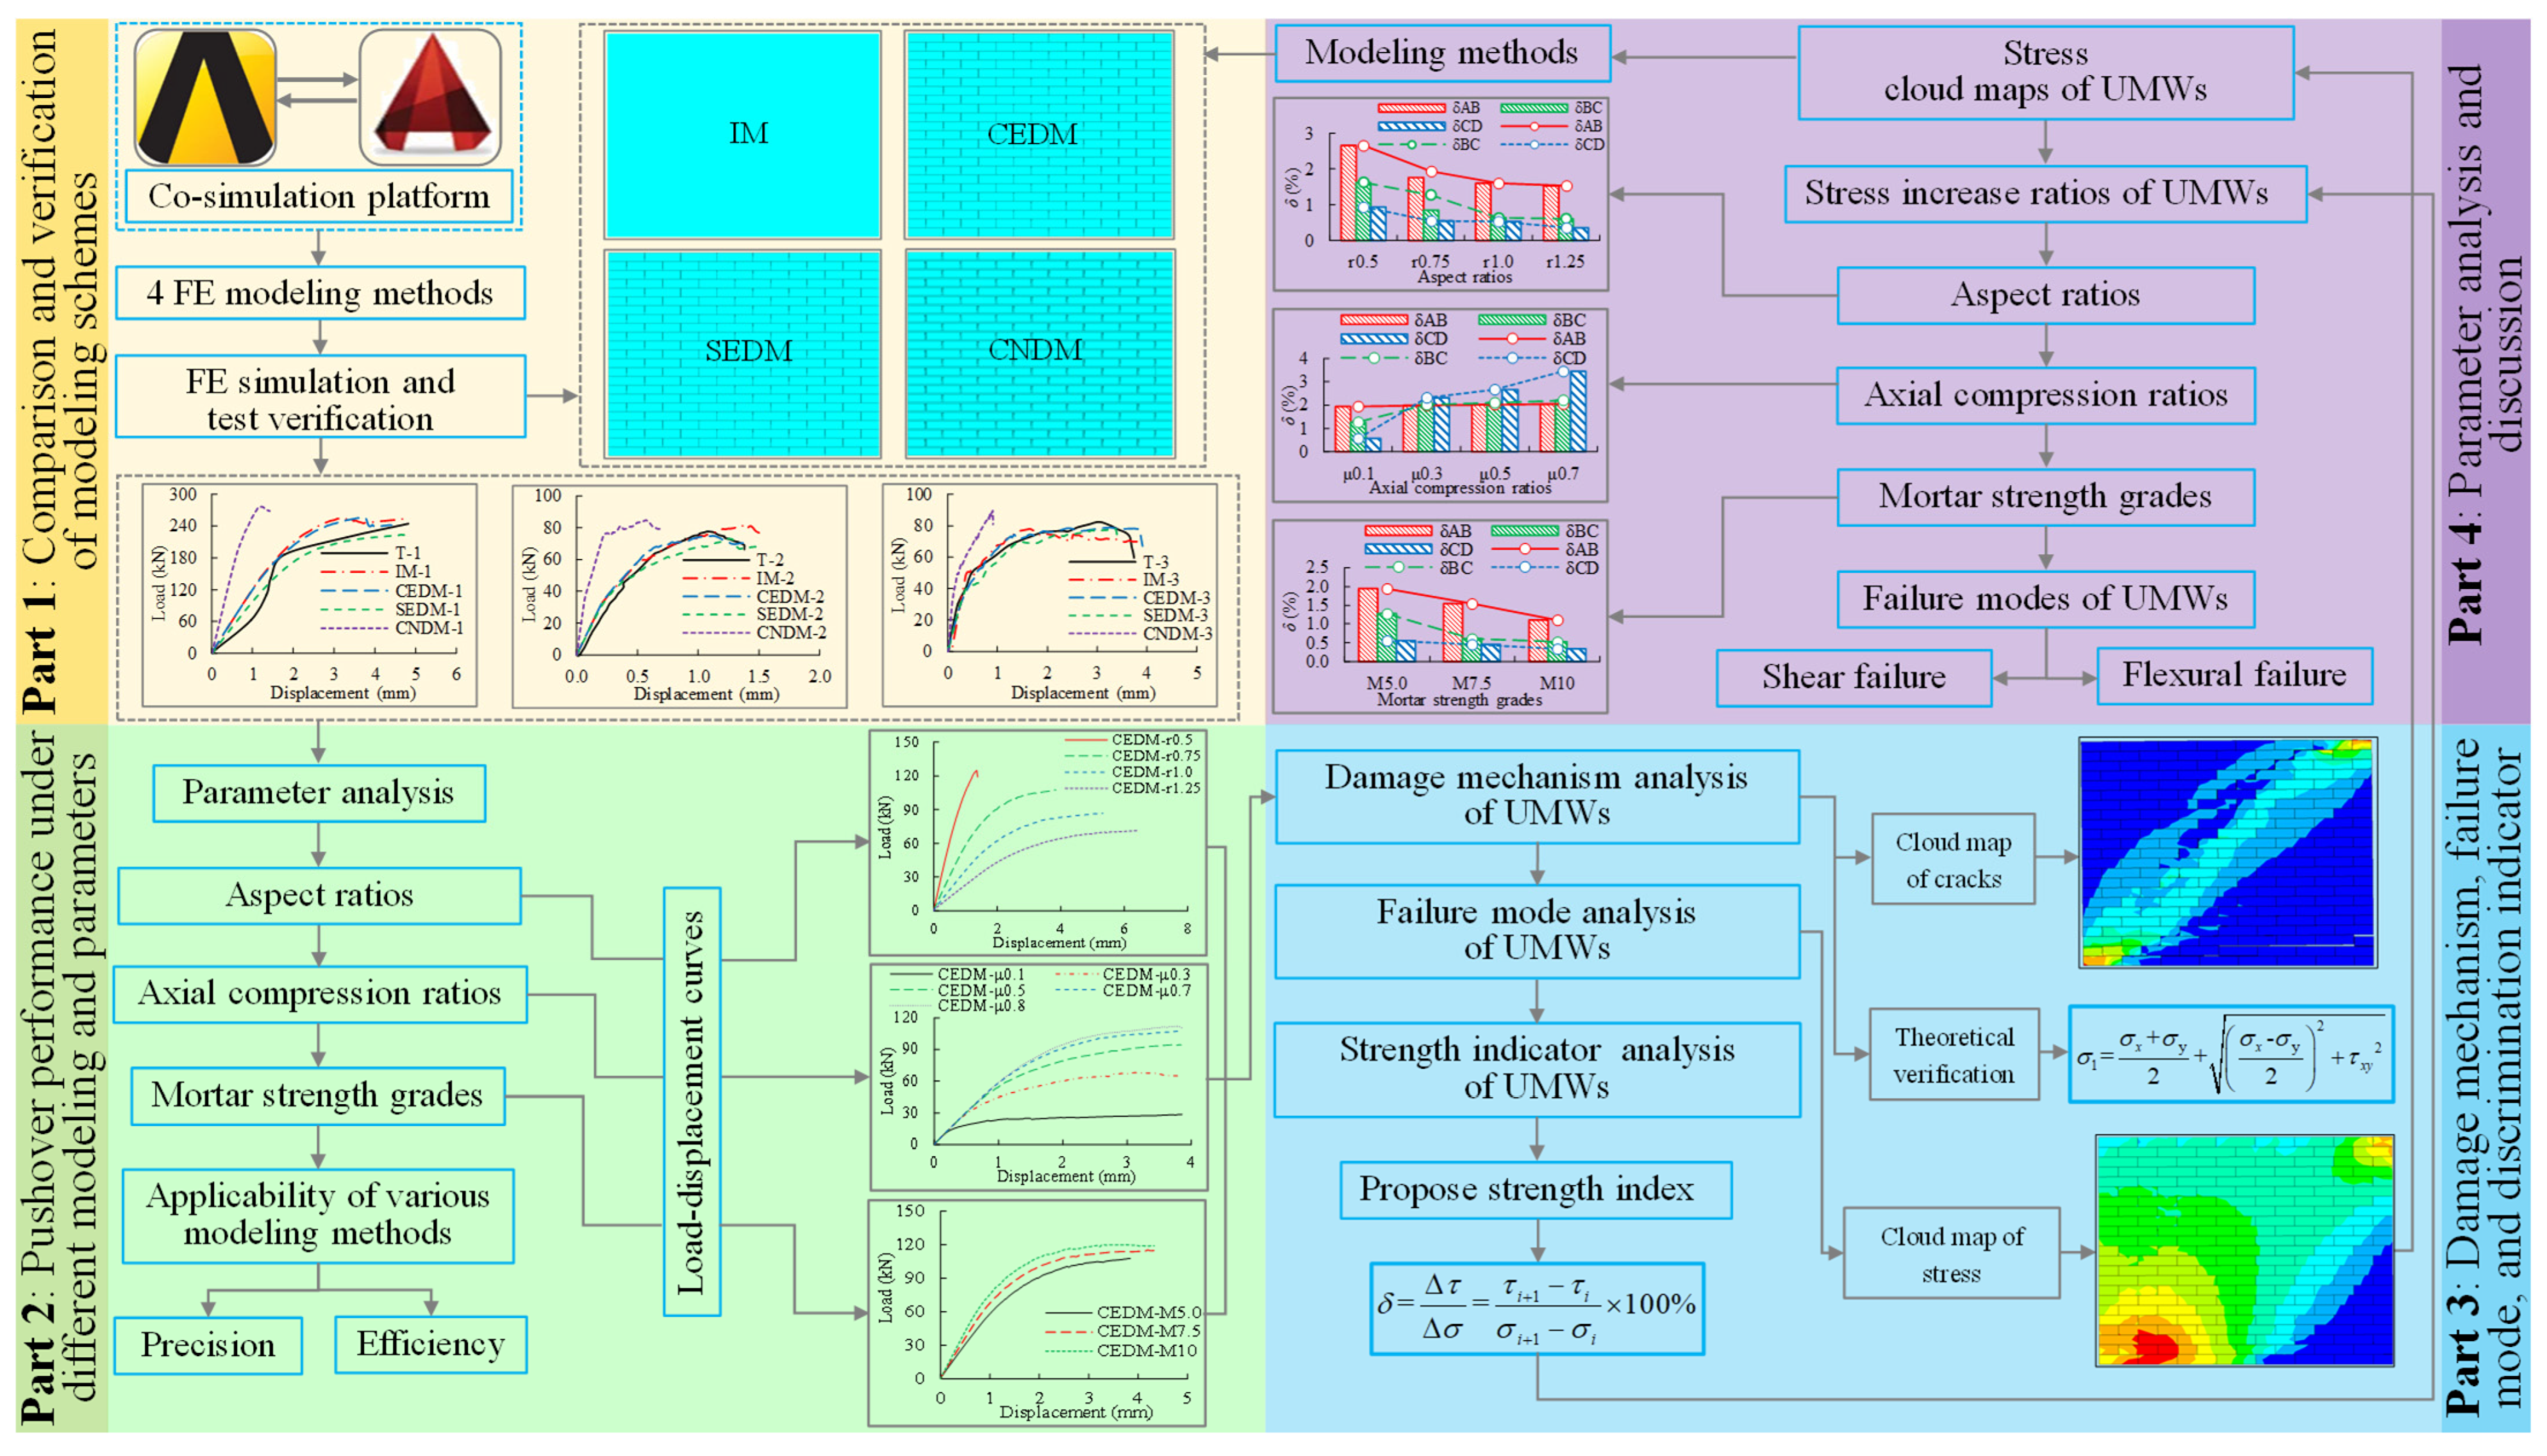
The aforementioned problems hinder further improvements in the precision of performance-based seismic design and evaluation for UMWs. To address these, a series of studies on the modeling methods, damage mechanisms, and failure modes of UMWs’ pushover performance is carried out in this work. FE simulation is implemented in the general FE analysis software ANSYS (Version 2021 R1). Firstly, four FE models of UMWs are established using different modeling methods: integral modeling (IM), contact element discrete modeling (CEDM), spring element discrete modeling (SEDM), and co-node discrete modeling (CNDM). The accuracy and rationality of FE modeling methods for UMWs are verified against existing UMW test results. Secondly, a static elastoplastic FE simulation is conducted with varying parameters, including aspect ratios, axial compression ratios, and mortar strengths, to comprehensively assess their influence on the pushover performance of UMWs. A single-push curve is used instead of a hysteretic curve in FE simulations to improve computational efficiency. Finally, by utilizing stress cloud maps and proposing a strength index based on the relationship between the improvement ratios of normal stress and shear stress at the key element with the maximum stress of UMW, the damage mechanism of UMWs and the transformation relationship of failure modes between flexural failure and shear failure are explored, and a quantitative discrimination basis is provided. To aid understanding, a framework chart for this study is presented in Figure 1. The modeling methods and research conclusions presented in this work can provide theoretical references and technical guidance for the seismic evaluation, reinforcement, and renovation of UMWs.
Figure 1.
Framework chart.
2. FE Modeling of UMWs
2.1. Modeling Methods
- (1)
- IM
In the basic model of UMW, MU10 ordinary sintered bricks are adopted for the masonry blocks, and M5 cement mortar is used for the mortar, with a Poisson’s ratio of 0.2 and a density of 2000 kg·m−3. UMW is simulated using the Solid65 element from the element library, with the mesh division size of 60 mm.
- (2)
- CEDM
Surface-to-surface contact is adopted; contact pairs are formed by the Targe170 element and the Conta174 element. Bonded rough contact is selected for contact control, and the friction coefficient between contact elements is set to 0.7. The dimensions of the masonry block before equivalence are 240 mm, 115 mm, and 53 mm in length, width, and height, respectively, while after equivalence, they become 250 mm, 115 mm, and 63 mm, respectively.
- (3)
- SEDM
A discrete modeling method for UMWs is implemented using normal and tangential-Combin39 elements. The nonlinear normal spring simulates the tensile bonding between masonry blocks and prevents compressive penetration, while the nonlinear tangential spring models the tangential bonding and slip behavior between the masonry blocks. The dimensions of the equivalent masonry blocks are consistent with those used in the CEDM.
- (4)
- CNDM
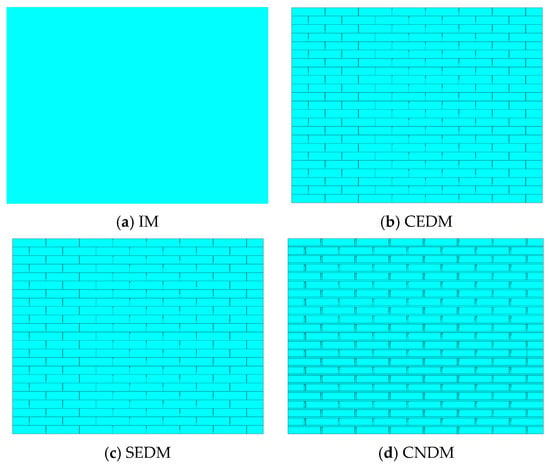
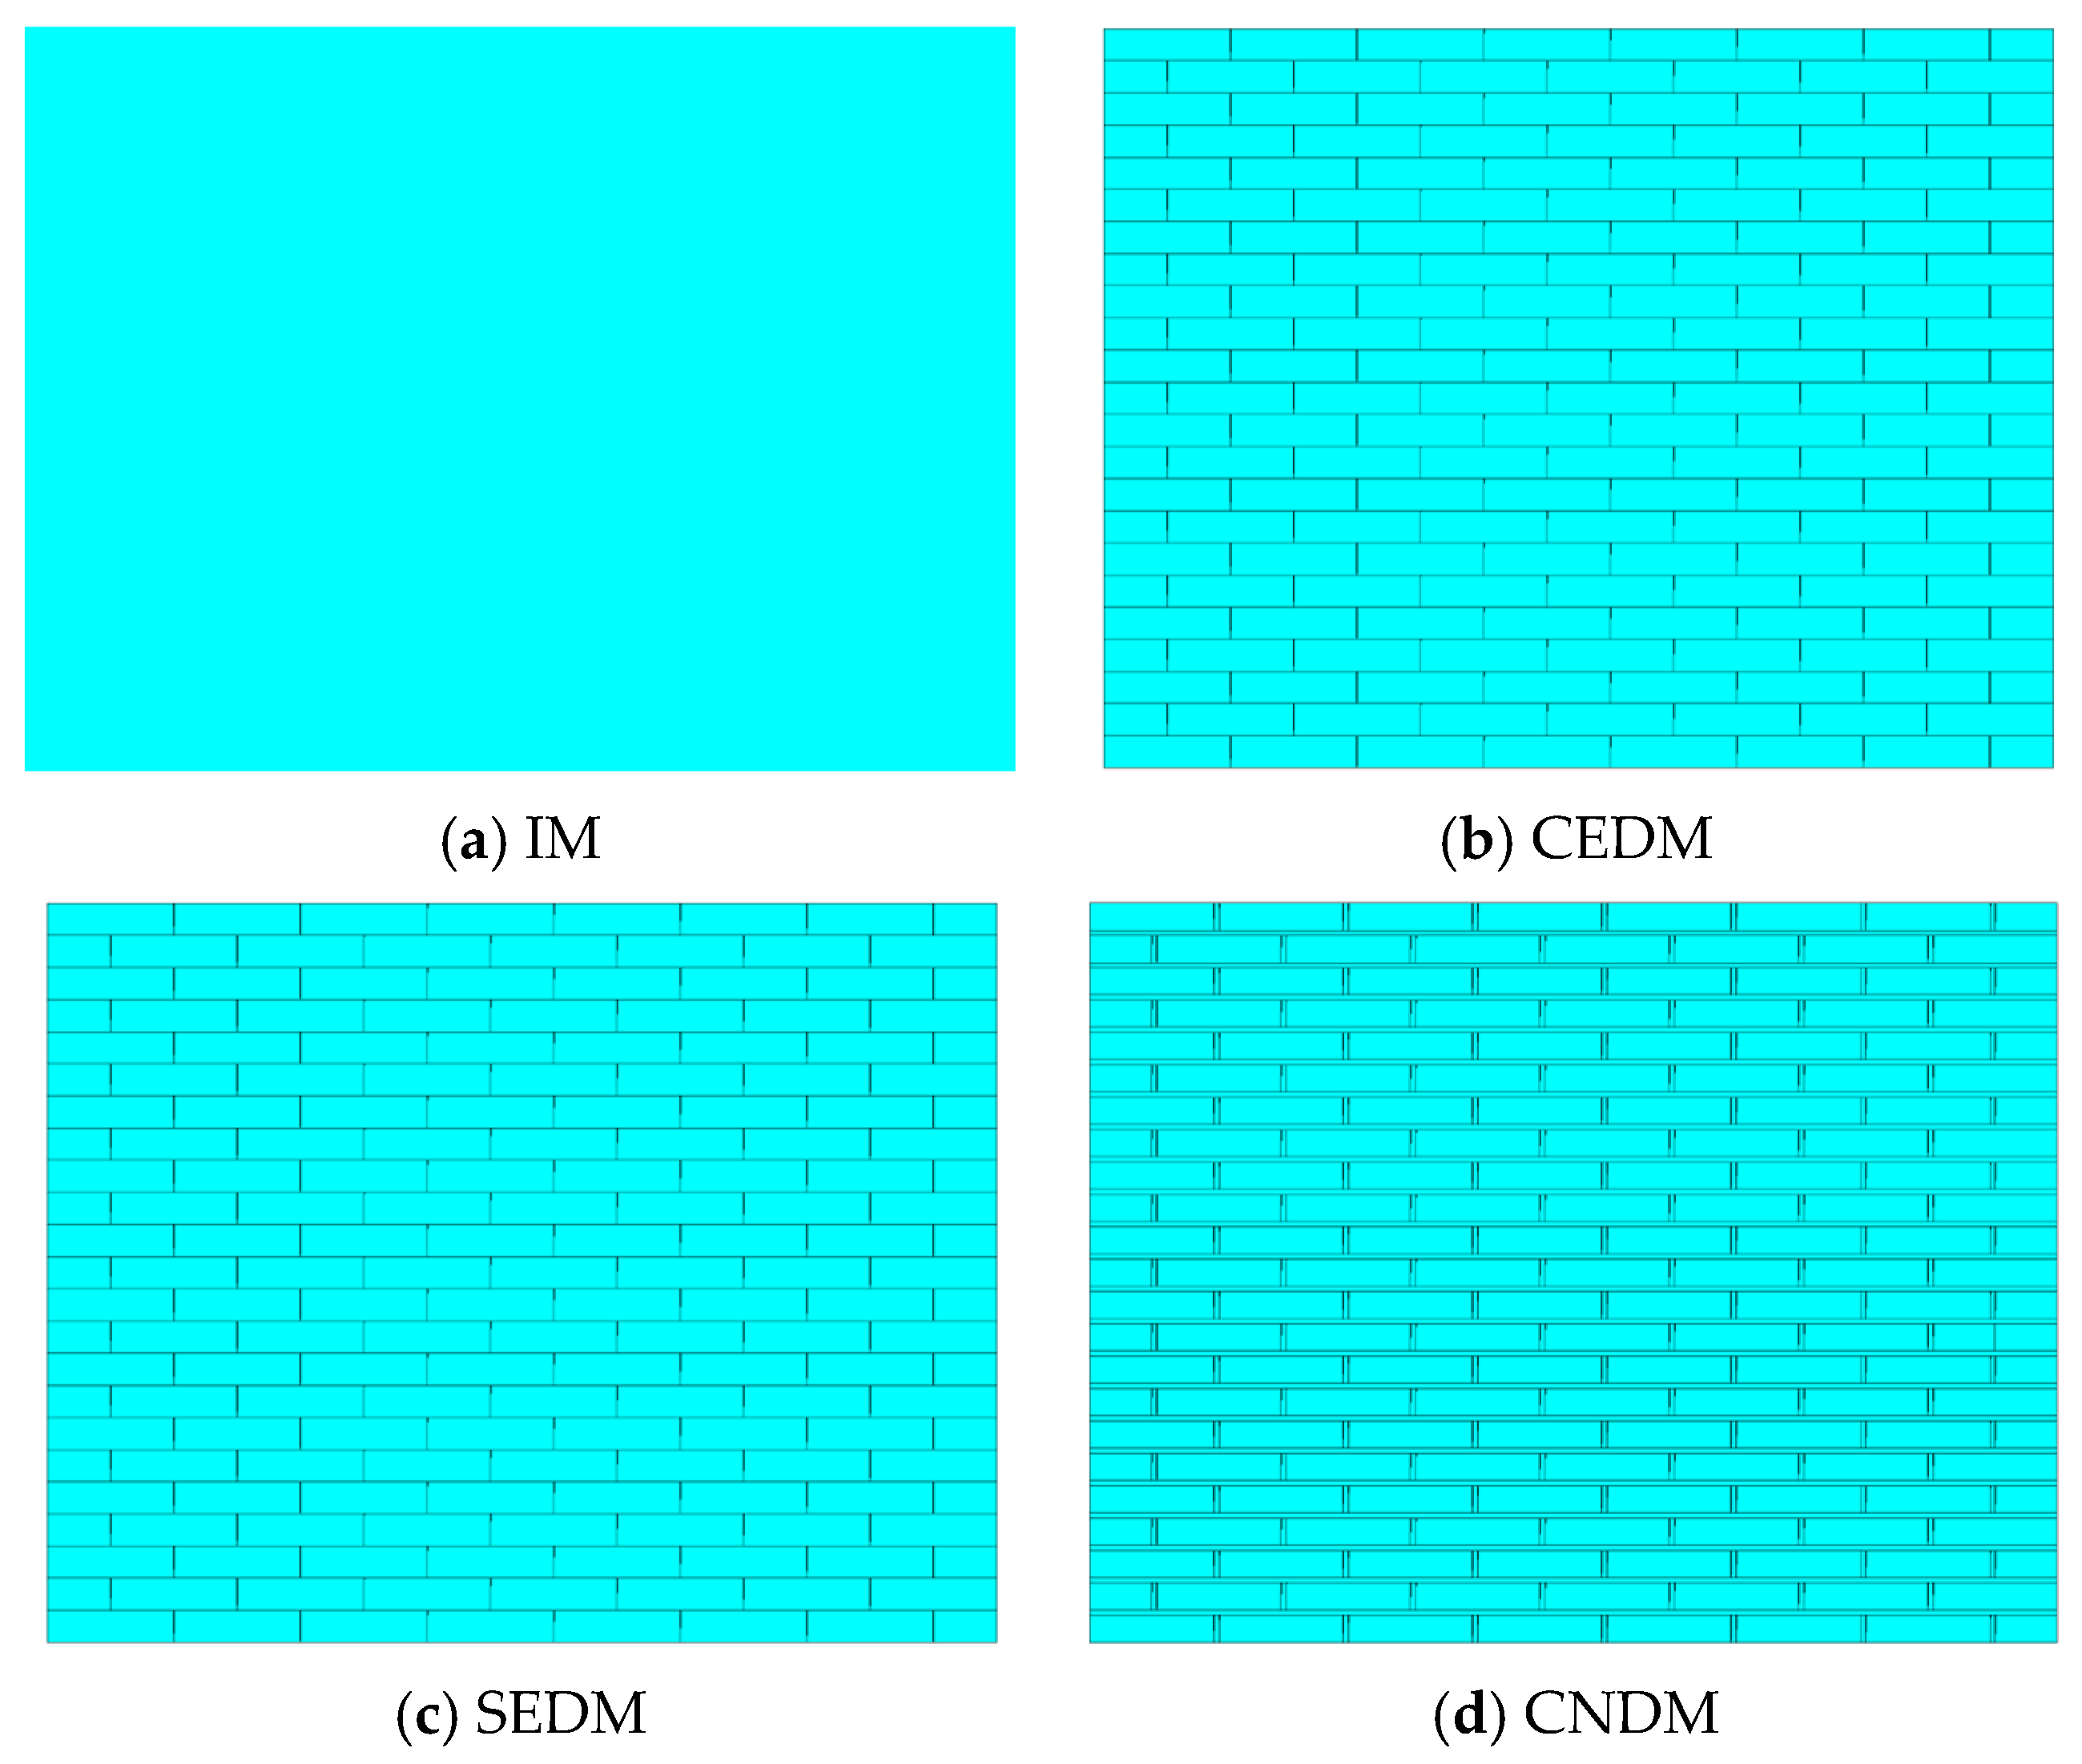
The failure of UMWs often occurs within the mortar layers or at the interfaces between masonry blocks and mortar. In the modeling, masonry blocks and mortar are modeled separately with their respective material properties, both simulated using the Solid65 element. All degrees of freedom at the nodes on the interface between two materials are coupled. The masonry blocks are meshed at 60 mm, while the mortar is meshed at 10 mm in the thickness direction and 60 mm in the other directions. FE models for four different modeling methods are shown in Figure 2a–d.
Figure 2.
FE models of UMWs using 4 modeling methods.
2.2. Violation Criteria
Concrete and masonry materials are both classified as typical quasi-brittle materials and are considered to share consistent core mechanical characteristics: their tensile strength is significantly lower than their compressive strength, their yielding behavior is sensitive to compression, and they exhibit distinct failure modes under multiaxial stress states. The William–Warnke failure criterion is represented by a five-parameter formulation, by which the yield evolution and failure law of such quasi-brittle materials can be accurately described. Therefore, to analyze the yielding behavior of masonry materials, the concrete material failure criterion developed for the Solid65 element is employed. In this criterion, tensile failure of masonry is determined by the maximum tensile stress criterion, while under triaxial compressive stress states, the William–Warnke five-parameter failure criterion is selected as the core model for predicting the nonlinear response of masonry structures. From a theoretical perspective, this system of constitutive and failure criteria is suitable for describing the nonlinear mechanical behavior of masonry materials. Its expression can be described as follows:
where Fσ denotes the principal stress state function; fc represents the uniaxial compressive strength, MPa; and S stands for the failure surface function.
The state of the material after cracking can be described by three parameters: the shear transfer coefficient for open cracks is taken as 0.3–0.5; the shear transfer coefficient for closed cracks is taken as 0.9–1.0; and the tensile stress release multiplier, which allows the tensile stress perpendicular to the cracking direction to be slowly released after element cracking to facilitate numerical convergence, is taken as 0.6.
2.3. Constitutive Relations
The multi-linear kinematic hardening model (MKIN) is adopted to define the constitutive relationship for UMWs.
- (1)
- Constitutive relationship of masonry
For the nonlinear FE analysis of UMWs, the appropriate selection of elastoplastic constitutive relationships for materials is vital. Masonry is a heterogeneous and anisotropic material, and its constitutive relationships are typically expressed in logarithmic, polynomial, or piecewise forms.
Considering the distribution characteristics of the strength failure of masonry, for the research on masonry under monotonic compression, the selected masonry constitutive relationship [22] is expressed as follows:
where η is defined as 1.633, and fm and ε0 are the stress and strain at the peak point of masonry under compression, respectively.
The average compressive strength fm of UMWs can be obtained from the Chinese standard (GB 50003-2011, MHURD) [46], and its expression can be denoted as follows:
where f1 is the average compressive strength of masonry bricks, and f2 is the average compressive strength of mortar. When ordinary sintered bricks are adopted, k1 is taken as 0.78 and α as 0.5. When f2 < 1 MPa, k2 = 0.6 + 0.4 f2, and in other cases, k2 = 1.0.
The average tensile strength ft,m, and average shear strength fv,m of masonry are represented as follows:
where k3 is 0.141, and k5 is 0.125 when common fired bricks are adopted.
The elastic modulus of masonry under compression [47] is expressed as follows:
Based on the uniaxial compression test results and failure characteristics, the relationship between the peak strain ε0 and average compressive strength fm of masonry is indicated as follows:
The expression for the relationship between the ultimate compressive strain εm and the peak strain ε0 is denoted as follows:
- (2)
- Constitutive relationship of masonry blocks
The two-stage uniaxial compressive stress–strain constitutive relationship [21] is adopted for masonry blocks, and its expression is described as follows:
where fbc is taken as the compressive strength of masonry blocks, and ε0 is 0.015.
The elastic modulus of masonry blocks is closely related to their compressive strength and increases with it. The expression for the elastic modulus of masonry blocks is indicated as follows:
- (3)
- Constitutive relationship of mortar
The constitutive relationship model for mortar adopts the segmented concrete compressive stress–strain curve equation [48], and its expression can be represented:
where fmc is taken as the compressive strength of mortar, ε0 is 0.002, and εm is 0.0033.
The elastic modulus of mortar is closely related to its compressive strength and increases as the compressive strength of mortar increases. The expression for the elastic modulus of mortar can be described as follows:
- (4)
- Constitutive relationship of the spring element
The restoring force model for compression and tension of the normal spring is linear [49], and the expression for the force–displacement constitutive relationship can be indicated as follows:
where Fc is the force exerted on the normal spring, Δxc is the spring deformation, Δxc,u is the ultimate spring deformation, Kc is the spring stiffness, fc is the mortar compressive strength, ΔA is the bonding area borne by a single spring, Δt is the mortar joint thickness, and εc,u is the ultimate compressive strain, taken as 0.035.
The force–displacement constitutive relationship of the tangential spring consists of two parts, determined by the mortar bond properties and the friction between the masonry blocks and mortar. The four-stage spring force–displacement constitutive relationship [49] is represented as follows:
where Fv is the force exerted on the tangential spring; Fv,max is the ultimate bearing capacity of the tangential spring; Δxv is the spring deformation, in which Δxv,0, Δxv,c, Δxv,max, and Δxv,u denote the elastic deformation, cracking deformation, ultimate deformation, and failure deformation of the spring, respectively; μ is the friction coefficient, taken as 0.4; σ0 is the vertical compressive stress; and fv is the shear strength of mortar.
2.4. Boundary Condition and Loading Method
- (1)
- Boundary condition
All nodes on the bottom surface of UMW are subjected to full degree-of-freedom constraints to restrict the overall rigid body displacement and rotation of UMW. A rigid beam is arranged on the top surface of UMW, and its bottom nodes are coupled with the top nodes of UMW. On the one hand, uniform compression on the top surface of UMW is ensured by this rigid beam; on the other hand, the application of lateral displacement is facilitated by it. Meanwhile, to avoid the interference of out-of-plane warping and torsion, out-of-plane degree-of-freedom constraints are imposed on this rigid beam.
- (2)
- Loading method
First, a uniformly distributed vertical pressure is applied at the top. Subsequently, a monotonic horizontal displacement is imposed at the vertical edge nodes on the right side of the rigid beam. Finally, loading continues until UMW reaches its ultimate bearing capacity or numerical divergence occurs.
The arc length method enables the tracing of the descending branch of the equilibrium path, yet the resulting ultimate load is slightly lower than that obtained with the Newton–Raphson (NR) iteration method. In contrast, when using the NR iteration method with the crushing option disabled, the calculated ultimate load aligns more closely with actual conditions. If analysis of the descending branch of the load–displacement curve is required, the arc length method with the crushing option disabled may be used, though this method introduces certain errors. Thus, the ultimate bearing capacity of UMWs is determined using the NR iteration method with the crushing option disabled. In this setup, automatic sub-step control is enabled for each load step, and large deformation analysis, along with line search, is activated. The force convergence criterion is applied with a tolerance of 0.05 to ensure robust nonlinear convergence.
2.5. Legend Numbering
To demonstrate the mechanical behavior of UMWs under varying parameters while ensuring the clarity and conciseness of the figures and tables, the legend numbers are listed in Table 1.
Table 1.
Parameter numbers for FE analysis.
2.6. Comparison of FE Simulation and Test Results
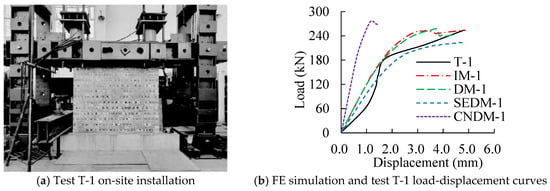
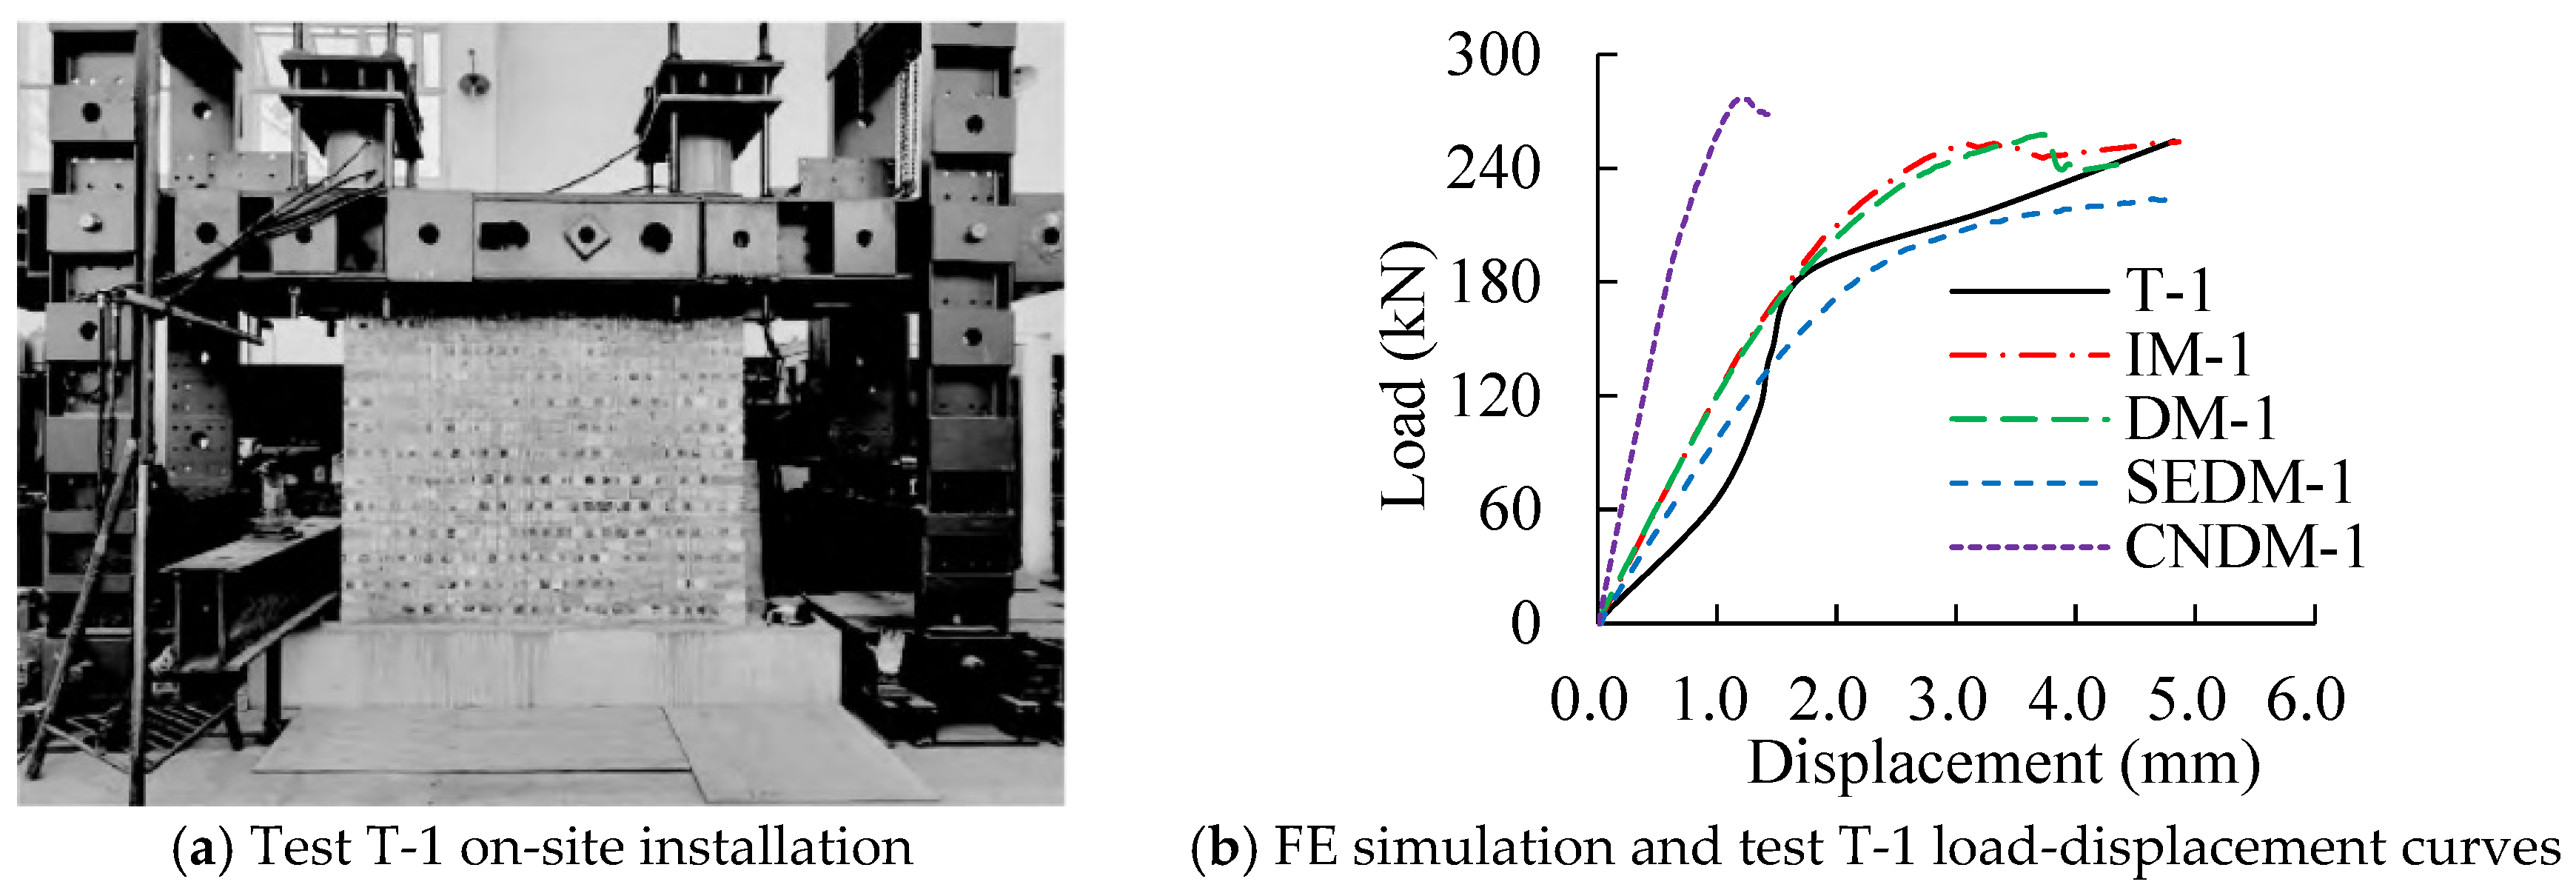
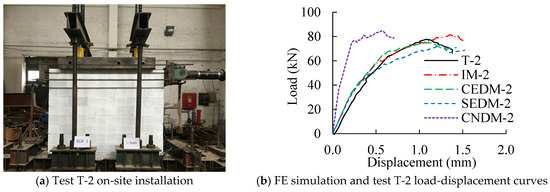
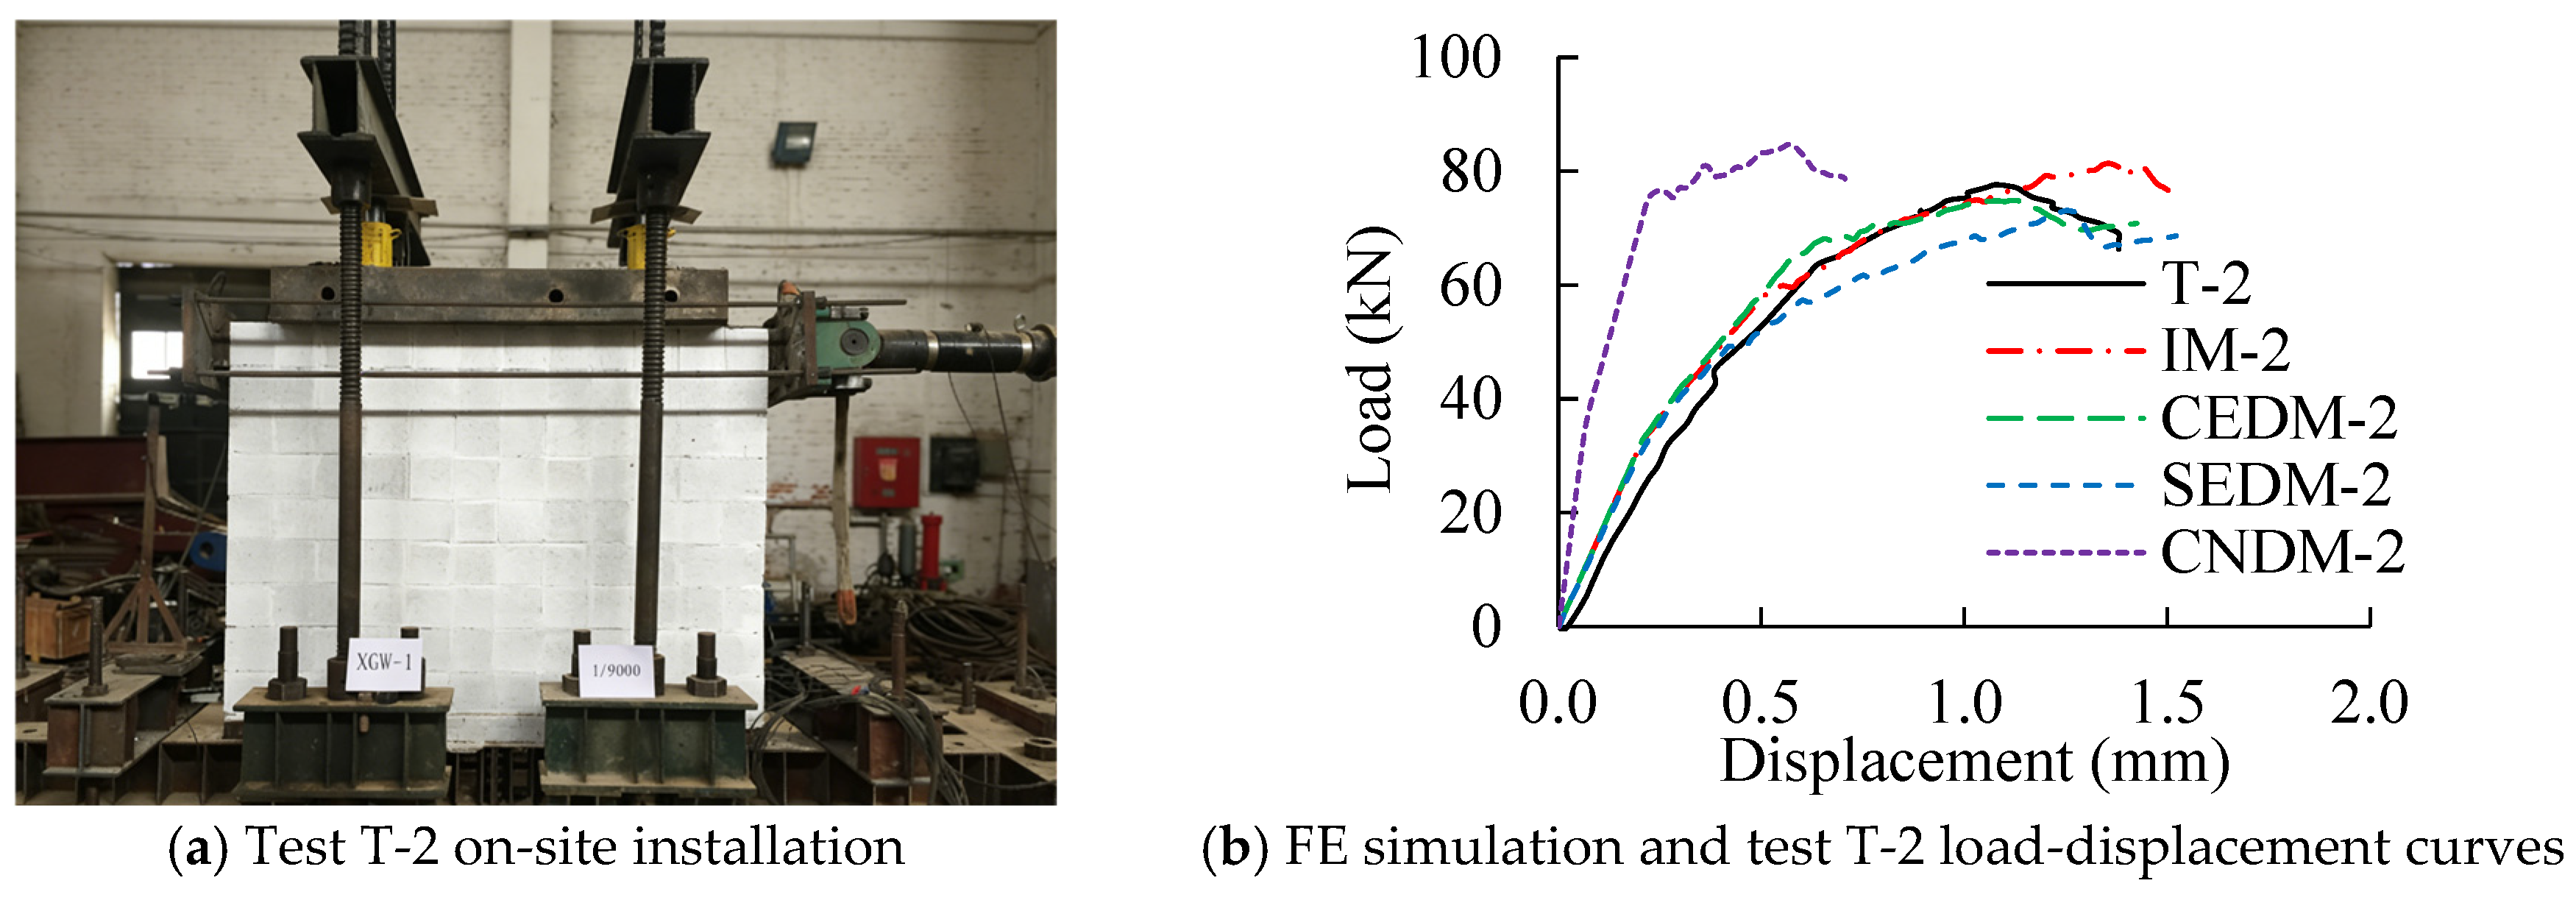
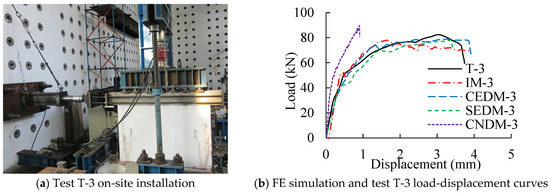
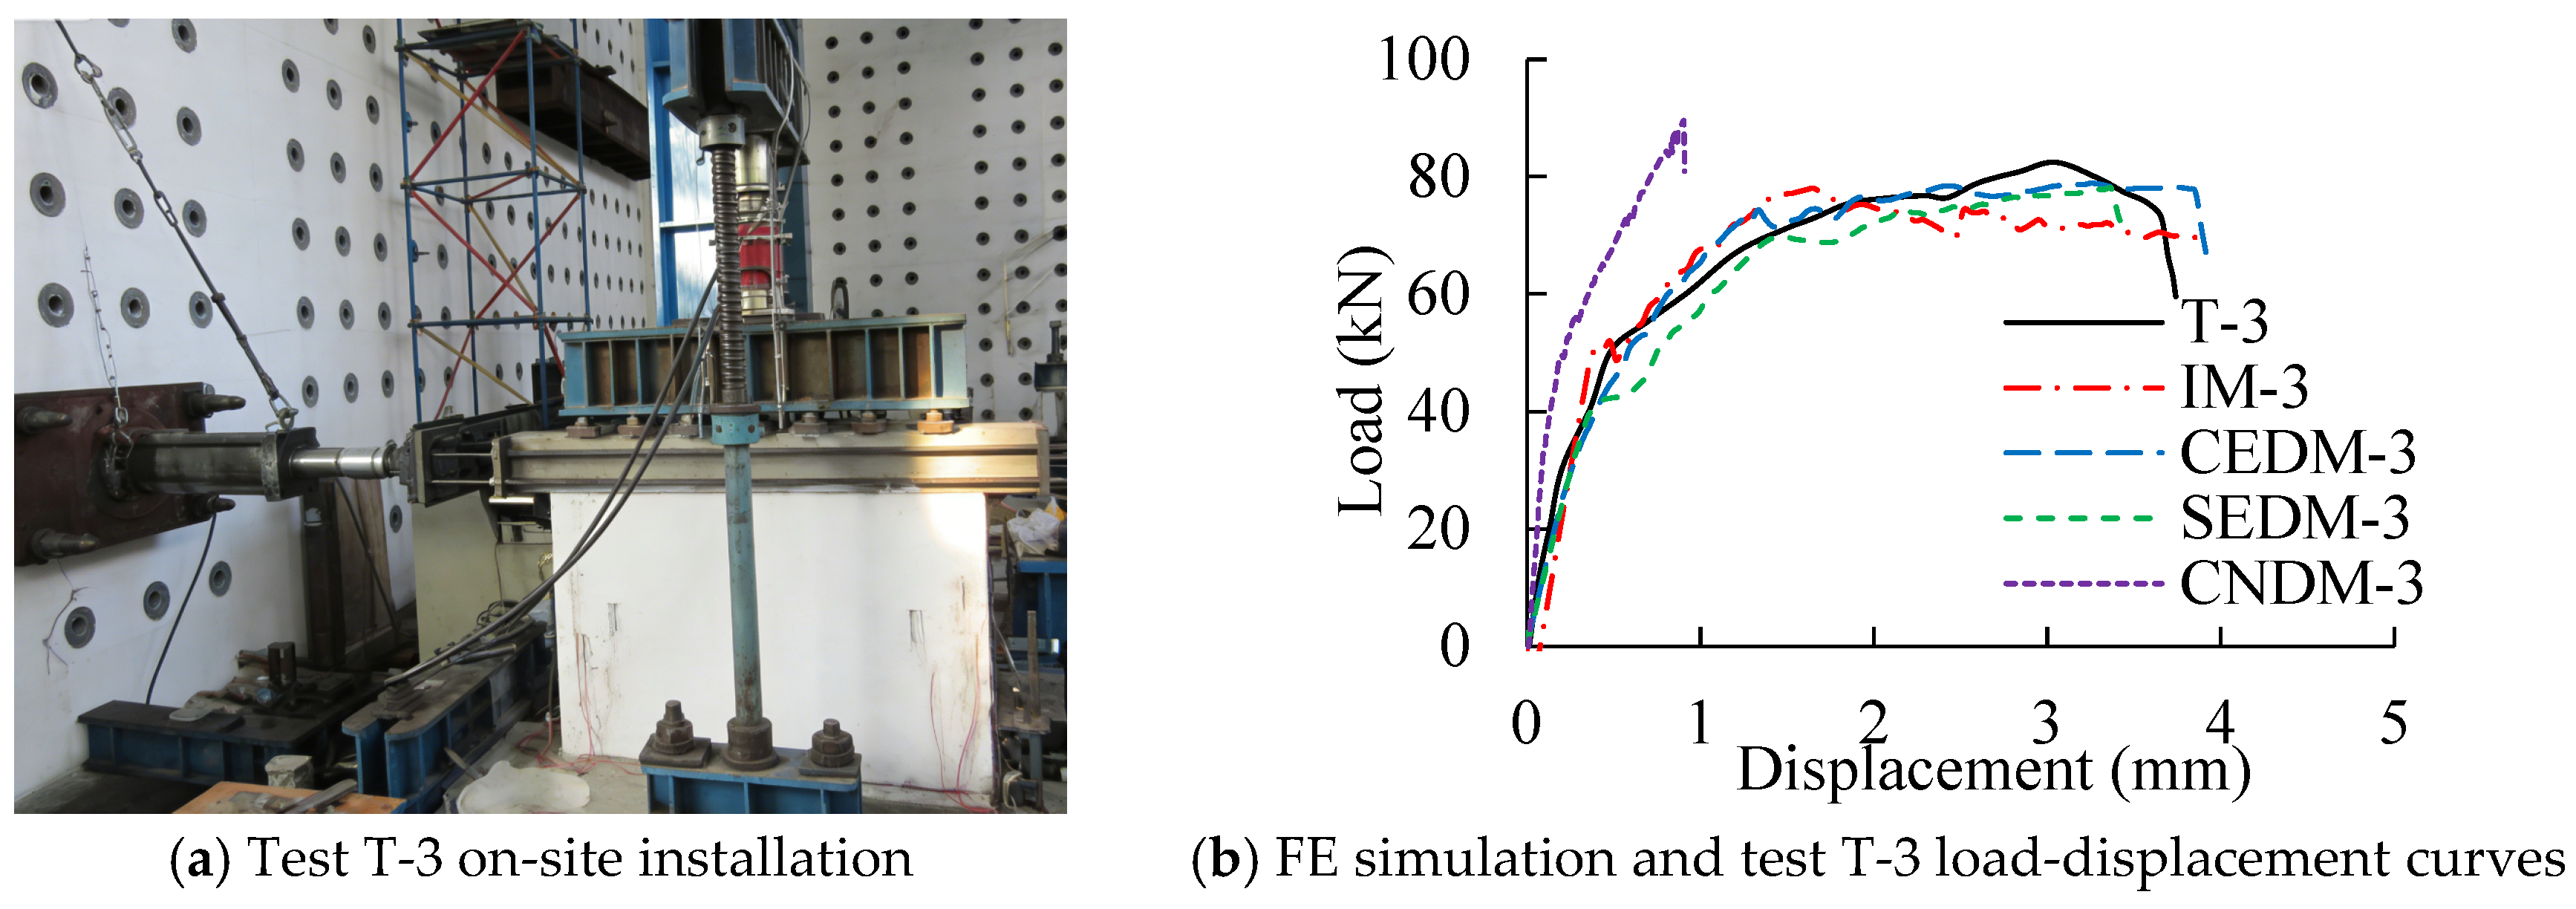
Four FE modeling methods are adopted in this study to numerically simulate UMW wall specimens reported in three existing studies. Given that the hysteretic backbone curves of such simple members are generally similar to monotonic loading curves, all simulations are conducted under monotonic loading conditions. The computed load–displacement curves are compared with experimental backbone curves reported in the literature. The specimens are referred to as T-1 [50], T-2 [51], and T-3 [52] in the original studies. The specimen loading setup and comparisons of load–displacement curves are shown in Figure 3, Figure 4 and Figure 5. Comparisons between FE simulation results obtained from different modeling methods and the experimental results are presented in Table 2.
Figure 3.
Comparison of FE simulation and test T-1.
Figure 4.
Comparison of FE simulation and test T-2.
Figure 5.
Comparison of FE simulation and test T-3.
Table 2.
Comparison of ultimate loads between numerical simulations and tests for specimens T-1, T-2, and T-3.
From the figures and table, the FE simulation results for CEDM, IM, SEDM, and CNDM show increasing deviations from the test results, although the overall trends are generally consistent. Specifically, compared with the three test results, from the perspective of the ultimate load of UMWs, the difference in the CEDM results is the smallest, at 3.6%, while the difference in the CNDM results is the largest, at 13.1%. From the perspective of the stiffness variation trend of UMWs, the difference in the results of CEDM is found to be the smallest, while that of CNDM is found to be the largest. The main reasons for the above differences are attributed to the fact that idealized loading conditions and mesh discretization are adopted in FE simulations, whereas, after the peak load is reached in the actual specimens, response variations are caused by the combined effects of material plastic damage, nonlinear behavior, and the discreteness of the masonry material and its installation. Furthermore, unavoidable adverse factors present in the tests, such as gaps between the loading apparatus and the loading beam and looseness of the tension bolts, are considered to contribute to deviations in the displacement measurements. The accuracy of the four FE modeling methods adopted in this study is validated, providing a basis for the selection scheme of different modeling methods in Section 2.7.
2.7. Quantitative Selection Scheme for Modeling Methods
Based on the comparison between FE simulations and the test results presented in Section 2.6, it can be concluded that under the same convergence criteria (force convergence tolerance of 0.05 and automatic sub-step control), all four modeling methods are able to complete the pushover analysis from the initial stage to the peak load. However, after the peak load is reached, relatively stable convergence is still able to be maintained by IM, and good convergence can be maintained by both CEDM and SEDM, whereas convergence difficulties are encountered by CNDM once the descending branch appears. It is indicated by these results that the complexity of the model directly affects the convergence performance in the descending branch, and the most significant convergence difficulty is exhibited by CNDM due to the large difference in stiffness between the mortar elements and the masonry block elements.
IM offers significant advantages in simple modeling, high computational efficiency, and robust convergence, making it suitable for simulating the overall seismic performance of large-scale UMW structures. However, this method neglects the interaction between masonry blocks and mortar, making it difficult to accurately predict local stress distribution and the development of fine-scale cracks. CEDM simulates interface bonding, sliding, and frictional behavior using surface-to-surface contact elements, balancing analysis accuracy and computational efficiency while more accurately reflecting the actual failure process. It is suitable for studying the failure mechanisms of UMWs that require a detailed analysis of interface behavior. SEDM replaces the mechanical behavior of interfaces with nonlinear spring elements, maintaining computational stability and efficiency while avoiding complex contact definitions. It is suitable for medium-scale analyses and situations where interface nonlinearity can be simplified. However, its spring parameters are calibrated experimentally, and its simulation accuracy is slightly lower than that of the contact element model. CNDM separately models masonry blocks and mortar as solid entities, each assigned its respective material constitutive. Since cracks in UMWs primarily occur in the mortar layer, this method can realistically capture material nonlinearity and internal stress distribution, making it suitable for detailed analysis of small components or critical areas.
For evaluating computational efficiency, the analysis time is recorded on the same workstation (AMD Ryzen 9 9950X 16-Core Processor @ 4.30 GHz, 48 GB RAM) using the Test-1 model. To ensure reliability, the model for each modeling method is run three times, and the average solution time is recorded. The results are as follows: IM: 83 s; CEDM: 372 s; SEDM: 493 s; CNDM: 631 s. Combined with the analysis accuracy results presented in Figure 3, Figure 4 and Figure 5 and Table 2, a quantitative selection scheme for 4 UMW modeling methods is provided:
- (1)
- In terms of analysis accuracy, the ranking from high to low is CEDM, IM, SEDM, and CNDM;
- (2)
- In terms of computational efficiency, the ranking from high to low is IM, CEDM, SEDM, and CNDM.
3. Damage Mechanism and Failure Mode of UMWs
3.1. Damage Mechanism Analysis of UMWs
- (1)
- FE analysis
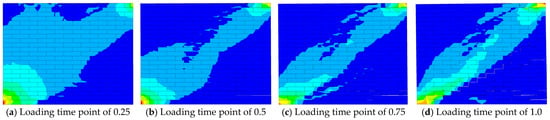
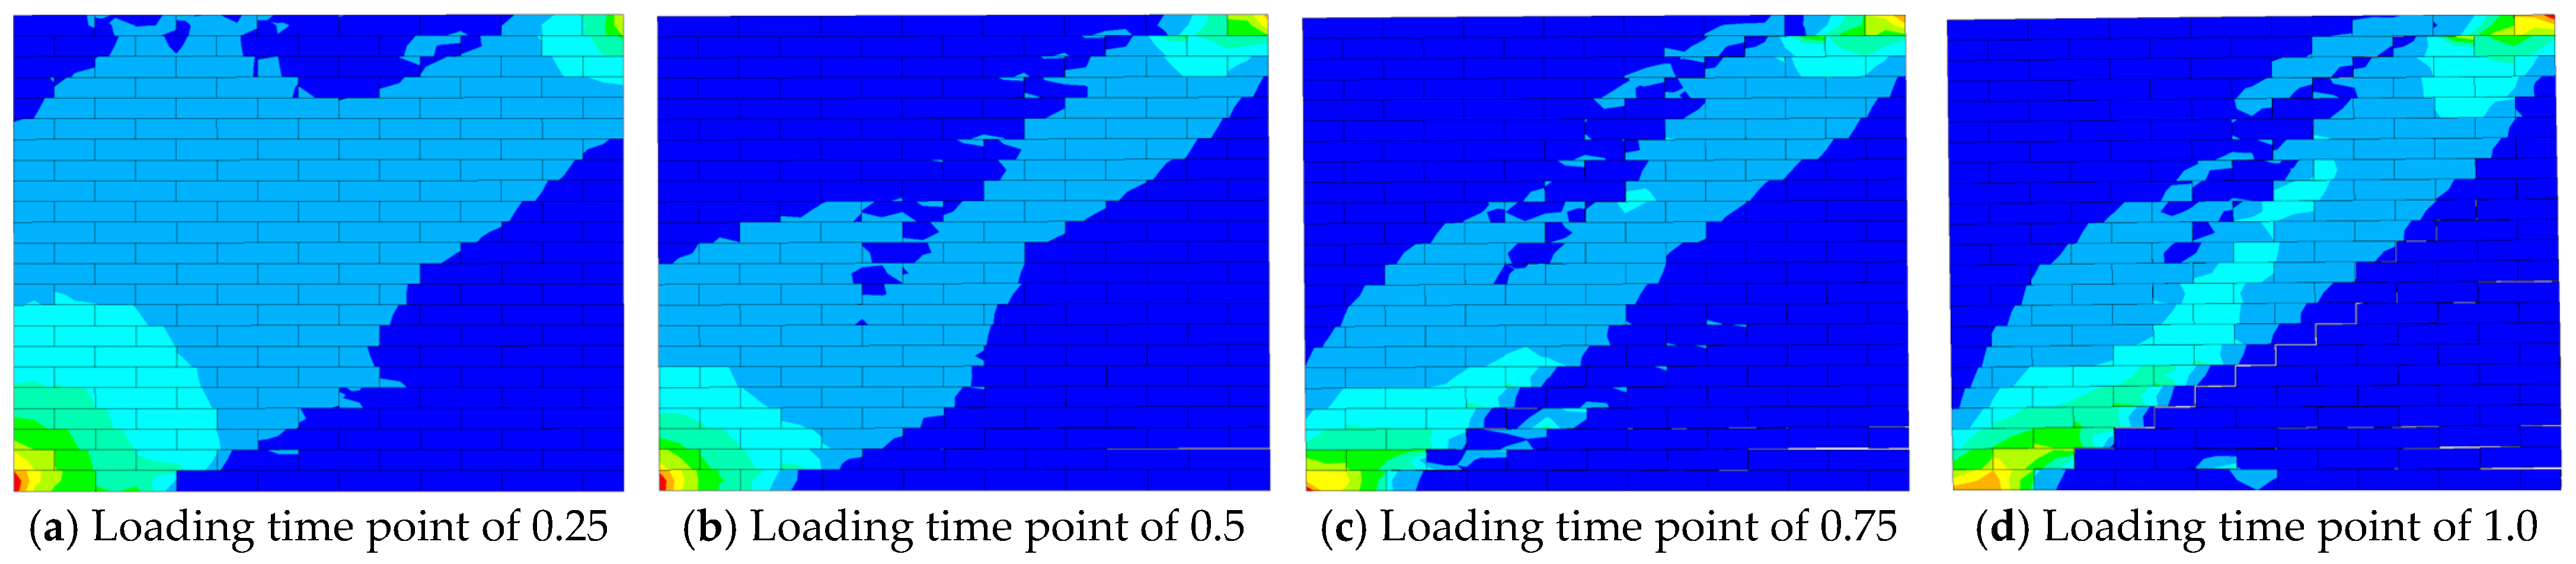
A monotonic pushover analysis is conducted to investigate the mechanical behavior of UMW with an aspect ratio of 0.75 and an axial compression ratio of 0.7 under combined vertical and horizontal loads. In the modeling, CEDM, which accounts for bond slip behavior, is adopted to accurately simulate the interaction between masonry blocks. The crack dynamic development cloud maps are shown in Figure 6. FE simulation results indicate that when UMW reaches its ultimate bearing capacity, diagonal cracks propagate across the UMW surface from the central region toward the corners, exhibiting characteristics of shear failure. Simultaneously, horizontal cracks develop at the bottom of UMW due to flexural-dominated stress.
Figure 6.
Cloud map of crack dynamic development in UMW. Note: The color scale ranges from blue (minimum stress value) to red (maximum stress value), indicating stress concentration regions and their variation trends. The same meaning applies to similar figures below.
- (2)
- Theoretical analysis
To validate the accuracy of FE model in predicting crack development in UMWs, the principal stress theory is adopted as the fundamental basis, and an analysis is carried out in combination with the formula for the principal stress under a plane stress state. As a brittle material, the initiation and propagation of cracks in masonry are governed by the first principal stress. Nodes within the crack development zone are selected, and their stress components are extracted for calculation. The corresponding formula for calculating the principal stress is given as follows:
where σ1 represents the first principal stress, σx denotes the normal stress in the x-axis, σy signifies the normal stress in the y-axis, and τxy indicates the shear stress.
Table 3 presents FE simulation results for the first principal stress and tensile strength at each node in the UMW crack region. As shown in Table 3 and Figure 6, the first principal tensile stress σ1 at each node exceeds the masonry tensile strength ft,m. This verifies the accuracy of FE modeling in simulating crack development in UMW.
Table 3.
Comparison of first principal stress and tensile strength.
3.2. Failure Mode Analysis of UMWs
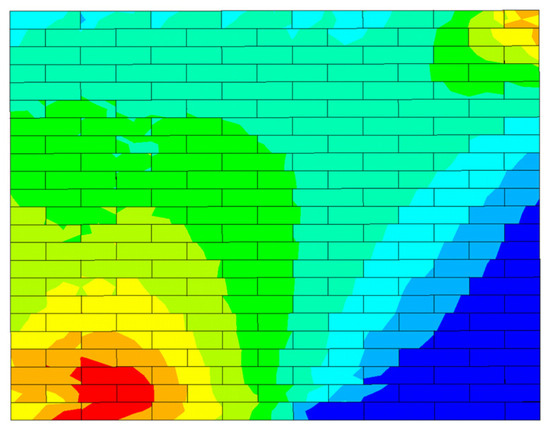
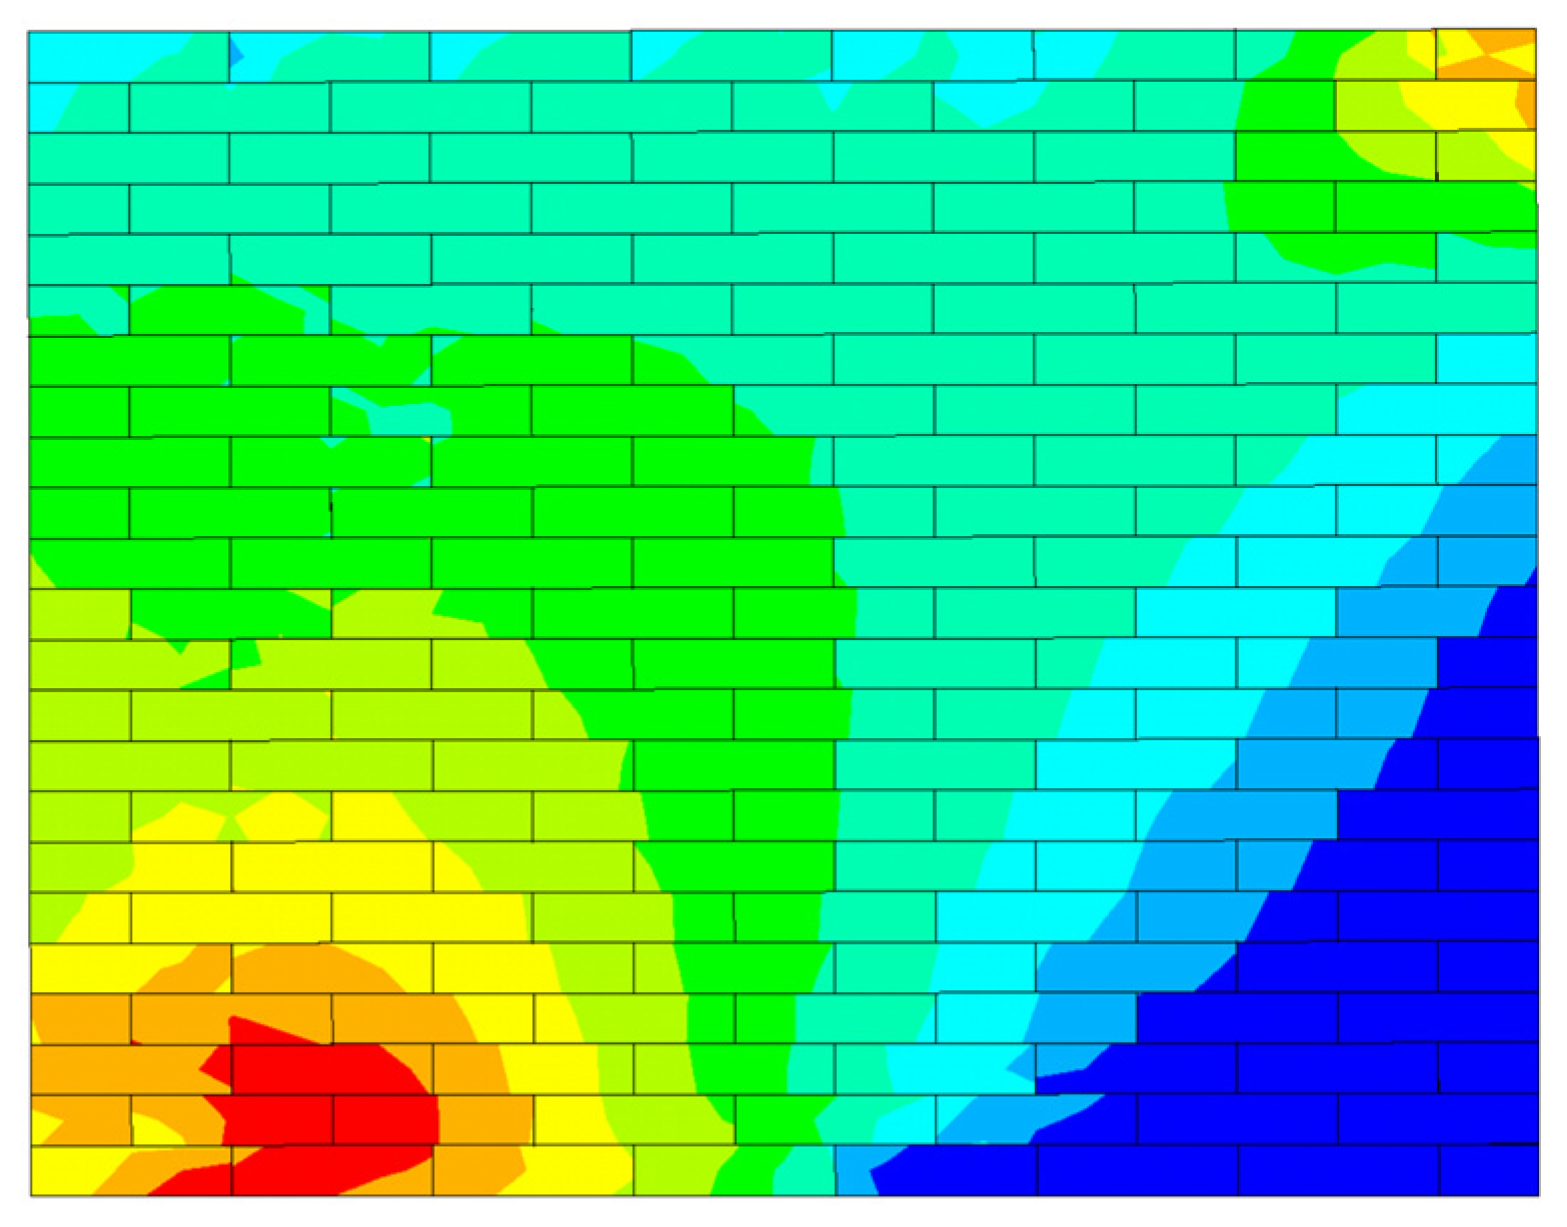
The stress cloud maps obtained from FE simulations can visually identify stress concentration regions in UMWs that serve as starting points for crack initiation and failure, as shown in Figure 7. Under monotonic pushover loading, the UMW exhibits continuous high-stress bands along the diagonal, forming a stress failure surface that triggers cracking and reduces bearing capacity. The final failure mode of UMW tends to be brittle, dominated by shear failure. Based on a comparative analysis of stress cloud maps under varying parametric conditions, the influence patterns of varying factors on the failure modes of UMWs can be systematically revealed.
Figure 7.
The stress cloud map of the UMW.
3.3. Strength Index Analysis of UMWs
The failure process of UMWs is complex. In existing methods, qualitative descriptions are primarily based on macroscopic deformation or the final failure pattern, such as crack observation, macroscopic response analysis, and stress contour judgment at the moment of failure. Using these methods, the stress evolution mechanism during the failure process is difficult to quantify; they are often considered descriptive rather than predictive and static rather than dynamic. To quantitatively characterize the tendency of UMW failure modes, a new strength index, δ, based on the stress increment ratio, is proposed in this study. By tracking the variation in the ratio of the shear stress increment to the normal stress increment throughout the entire loading process, the initiation and development of cracks are linked to internal stress redistribution, and a continuous quantification of the failure mode is achieved from a mechanical perspective. Its innovativeness is considered to lie in the following aspects: the continuous evolution trajectory of the failure mode is reflected by this index, rather than only the final failure being described; how cracks are initiated and developed is reflected by this index through the magnitude of the stress increment, by which a direct link is established between the change in internal stress and the final failure pattern; and, based on the calculation of stress data in the initial loading stage, the failure mode of the unreinforced masonry wall can be predicted before a large number of visible cracks appear. Compared with existing methods, the index δ represents an advancement: from post-event description to pre-event prediction and from phenomenological observation to mechanistic explanation. By calculating the relative magnitude of δ within the same parameter series, designers can predict the wall’s potential failure mode under the expected load at the design stage, enabling targeted cross-sectional design and retrofitting. This predictive capability, which is absent in existing methods, is regarded as having significant practical engineering value. The strength index δ is rendered as follows:
where δ is the ratio of the increment in shear stress Δτ to the increment in normal stress Δσ, τ is the shear stress, σ is the normal stress, and i represents varying loading time points.
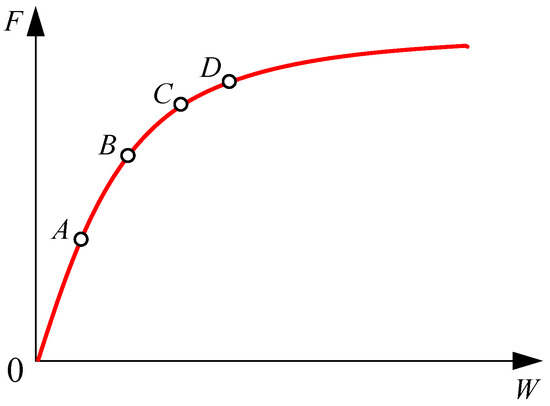
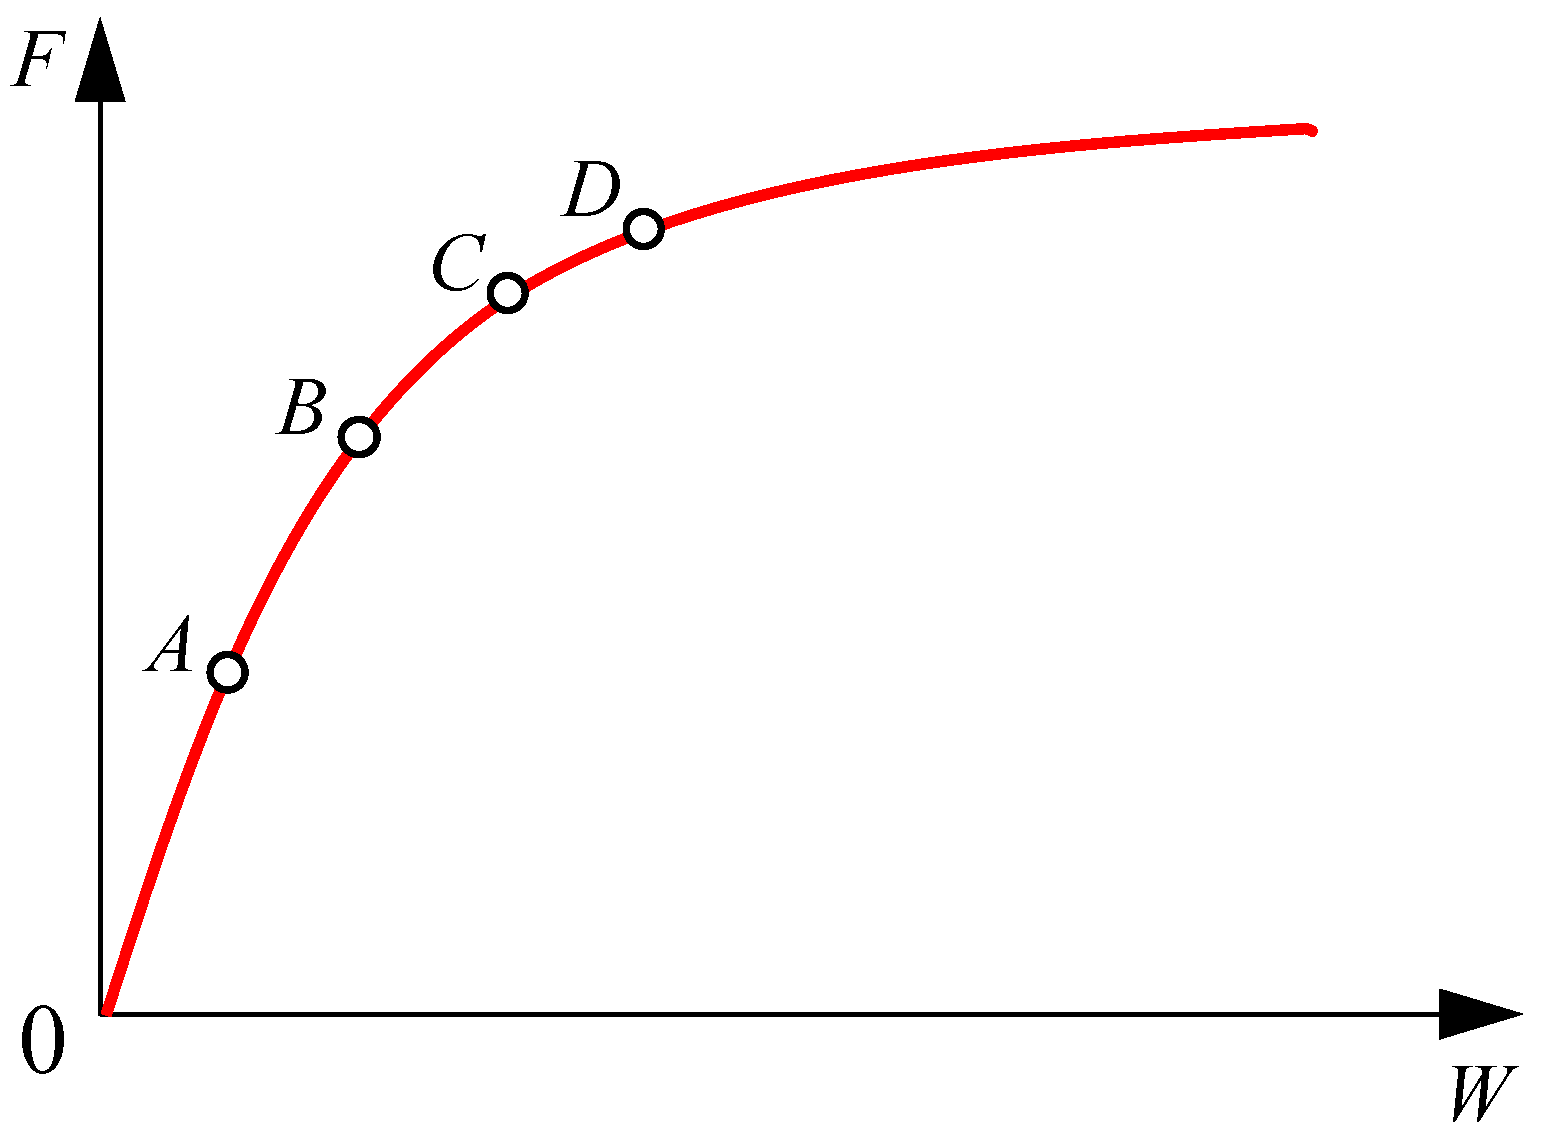
The proposed strength index determines whether the failure mode of UMW tends toward shear failure, flexural–shear composite failure, or flexural failure by analyzing the relative increments in normal and shear stress at key elements of UMW at different loading time points and evaluating changes in their ratios. Based on the stress cloud maps from Section 2.2, the element with the maximum stress variation in UMW is selected, and four distinct loading time points—A, B, C, and D—from the initial stage to the cracking stage on the load–displacement curve are identified using interpolation, as shown in Figure 8. The strength ratio δ of the increments of normal stress to shear stress at these four loading time points is calculated under varying parameters. The dynamic variation of δ reveals the evolutionary trend of failure mode: if δ gradually decreases, it indicates that the failure mode of UMW transitions from being dominated by shear failure to flexural–shear composite failure and finally to flexural failure; if δ gradually increases, it indicates that the failure mode shifts from being dominated by flexural failure to flexural–shear composite failure and ultimately to shear failure.
Figure 8.
Selection of loading time points of the strength index.
Varying parameters (such as aspect ratios, axial compression ratios, and mortar strengths) alter the stress path, thereby influencing the damage mechanism and failure modes of UMWs. The proposed index can correlate parameter variations with the evolution pattern of δ, revealing the sensitivity of parameters to the damage mechanism and failure modes. In combination with Equation (19), a further analysis of the damage mechanism and failure modes of UMWs under varying parameters will be conducted in Section 4.
At the same time, the limitations of this index are recognized: the numerical value of δ is observed to vary with parameters such as the aspect ratio, axial compression ratio, and mortar strength, making it difficult to adopt a unified absolute threshold for determining failure modes under all working conditions; the calculation of δ is considered to depend on the selection of key elements in FE analysis, and the choice of different elements may have an impact on the results, so in practical application, comprehensive judgment is still required in combination with stress contours. However, by analyzing the relative magnitude and variation trend of δ within the same parameter series, an effective quantitative judgment basis can still be established: in a given parameter series, when δ value falls within the first quarter interval of that series, the failure mode is characterized as shear-dominated; when δ value falls within the last quarter interval, the failure mode tends to be flexural-dominated; when δ value is in the middle interval, the unreinforced masonry wall is identified as exhibiting a combined flexural–shear failure mode.
4. Parameter Analysis
The aspect ratios, axial compression ratios, and mortar strengths of UMWs are selected as parameters. Assuming other variables remain unchanged, monotonic pushover analyses are performed on FE models of UMWs. By comparatively analyzing the mechanical performance, damage mechanism, and failure modes of UMWs under these parameters, the influence of these parameters on the bearing capacity and seismic performance of UMWs is revealed.
4.1. Aspect Ratios
To investigate the influence of aspect ratio on the mechanical performance of UMWs, this section maintains a constant width of 1.88 m and varies the height to achieve different aspect ratios. Four FE models of UMWs with aspect ratios of 0.5, 0.75, 1.0, and 1.25 are established accordingly.
- (1)
- Mechanical performance analysis of UMWs under varying aspect ratios
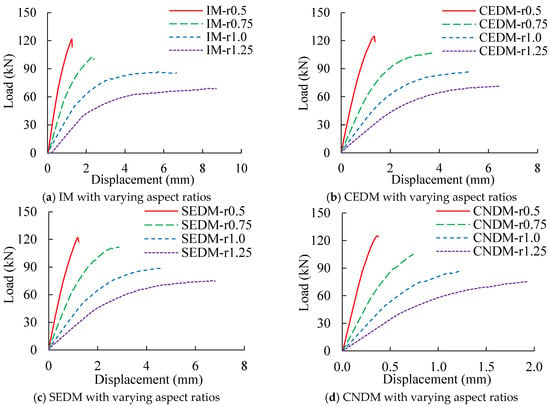
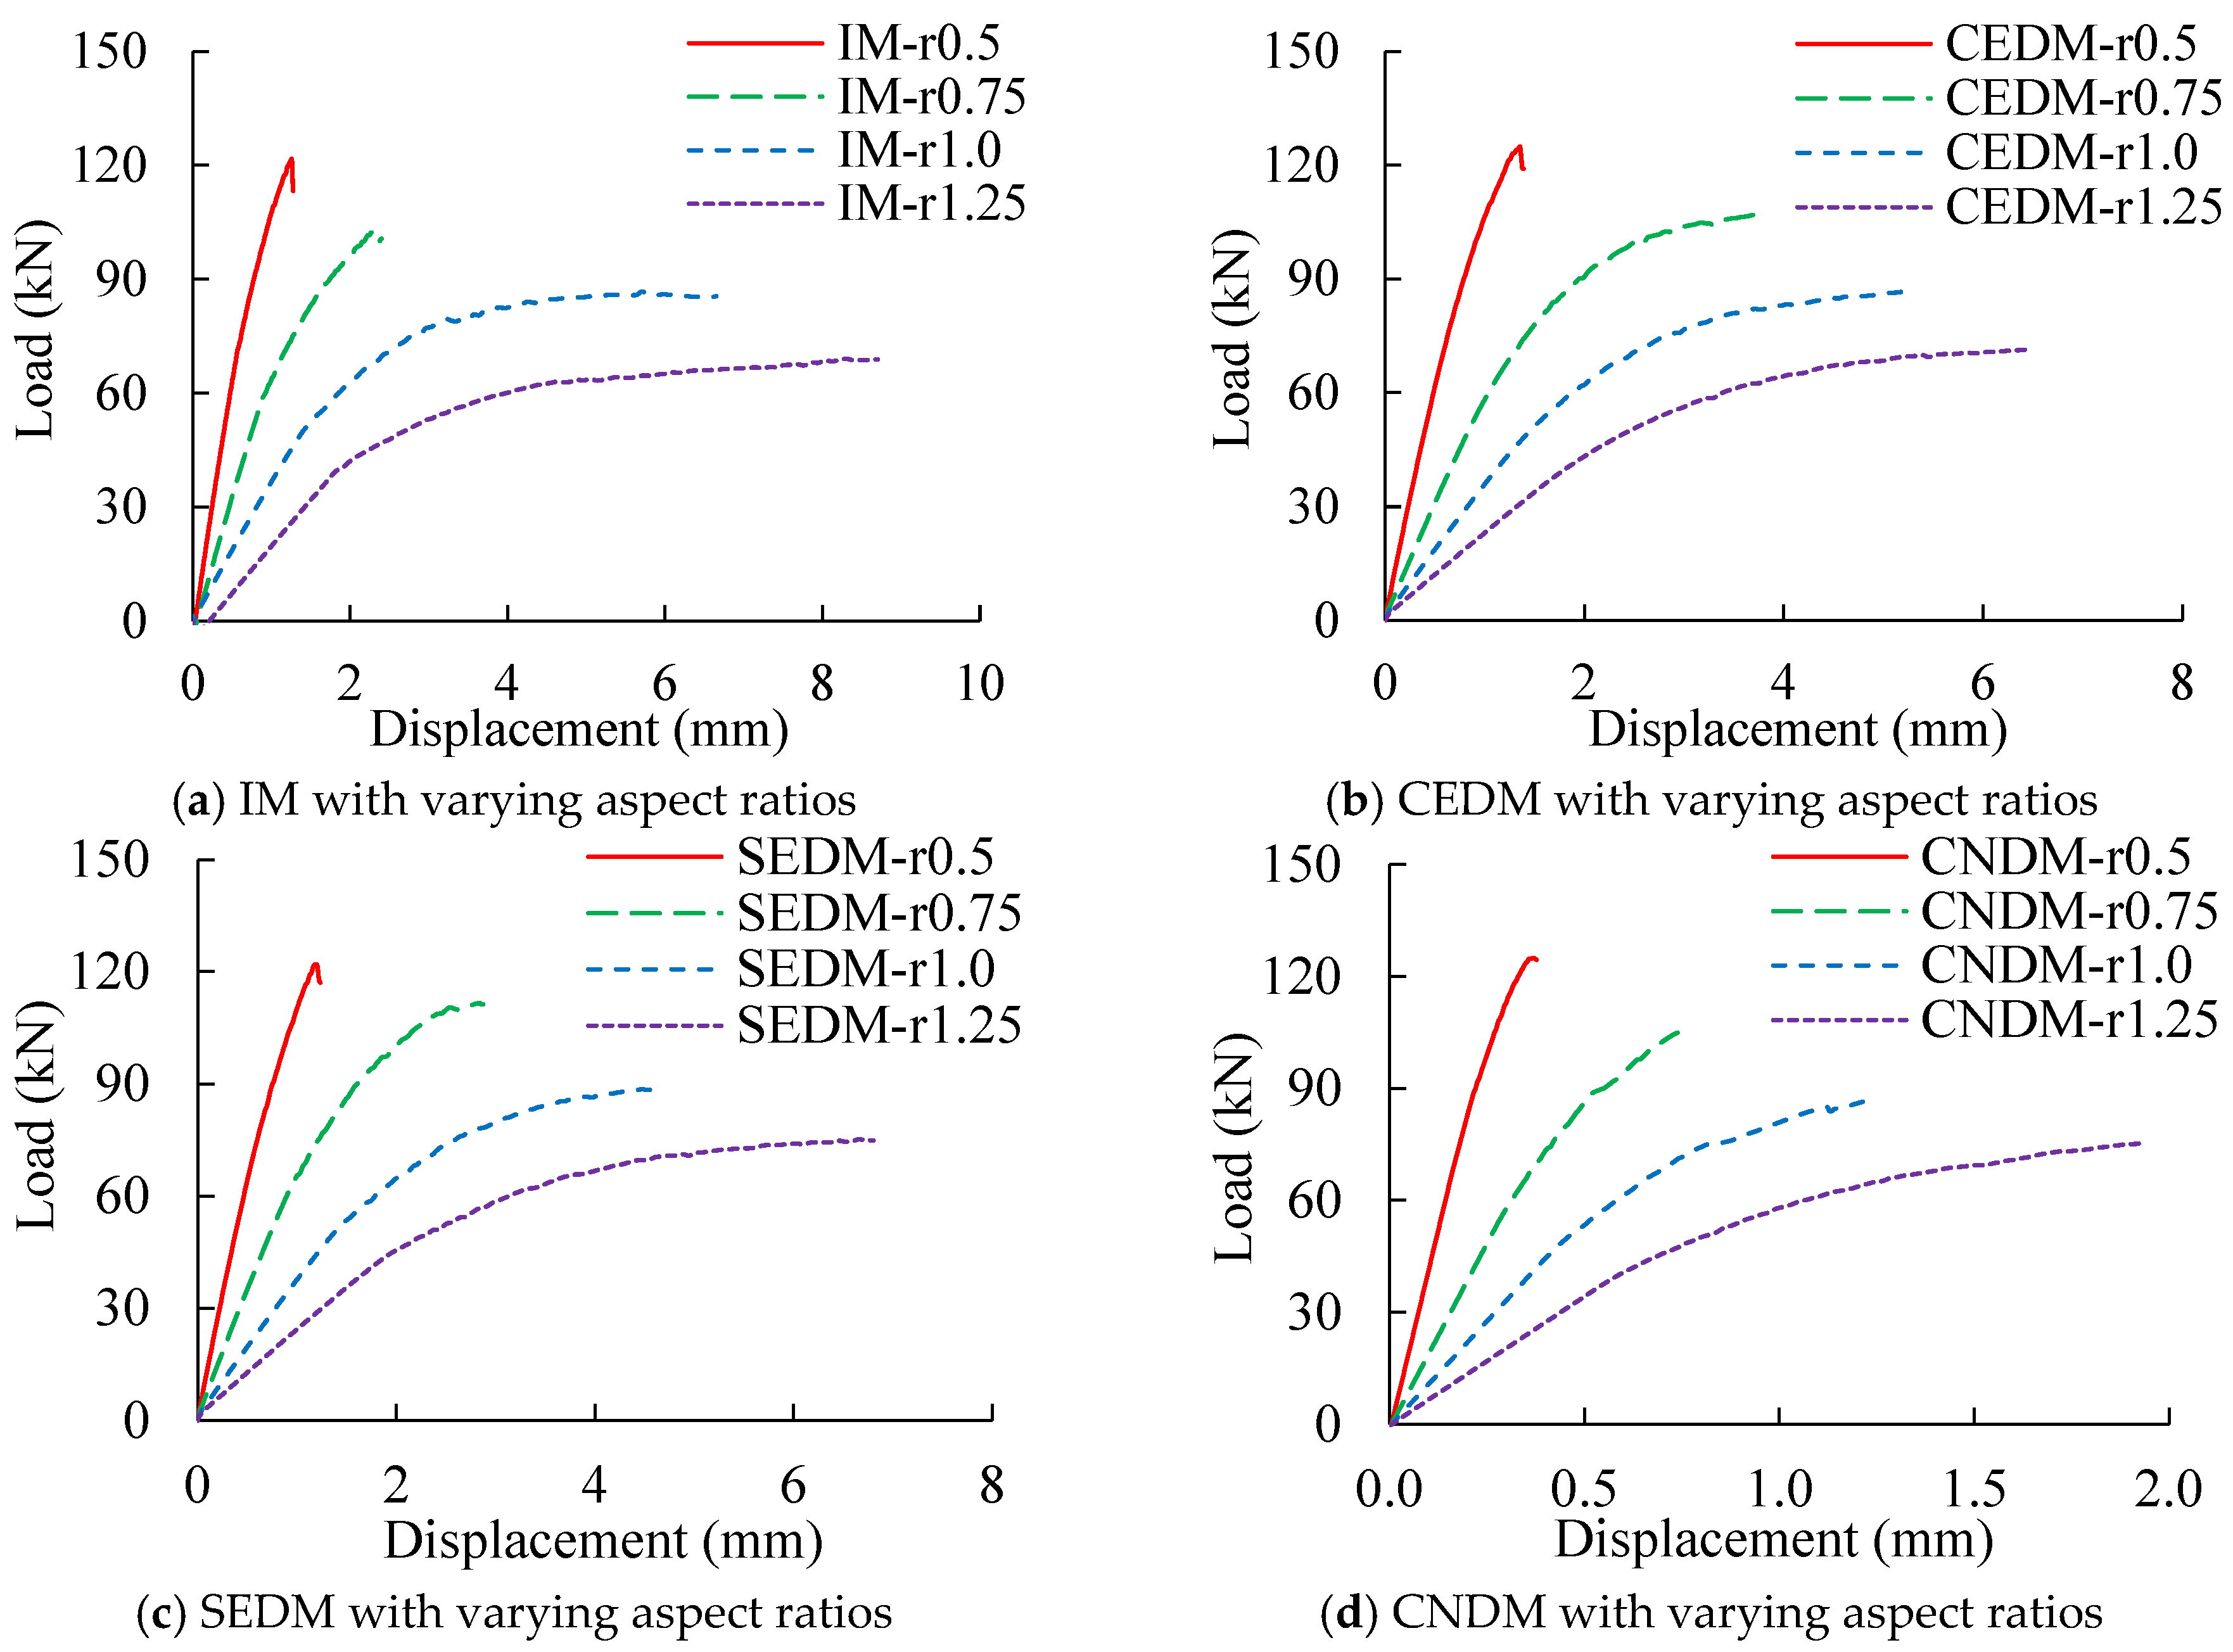
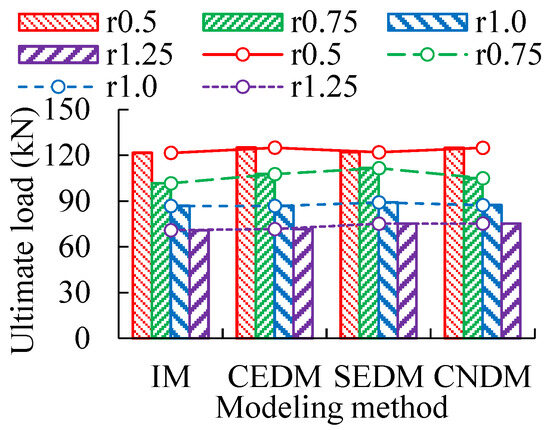
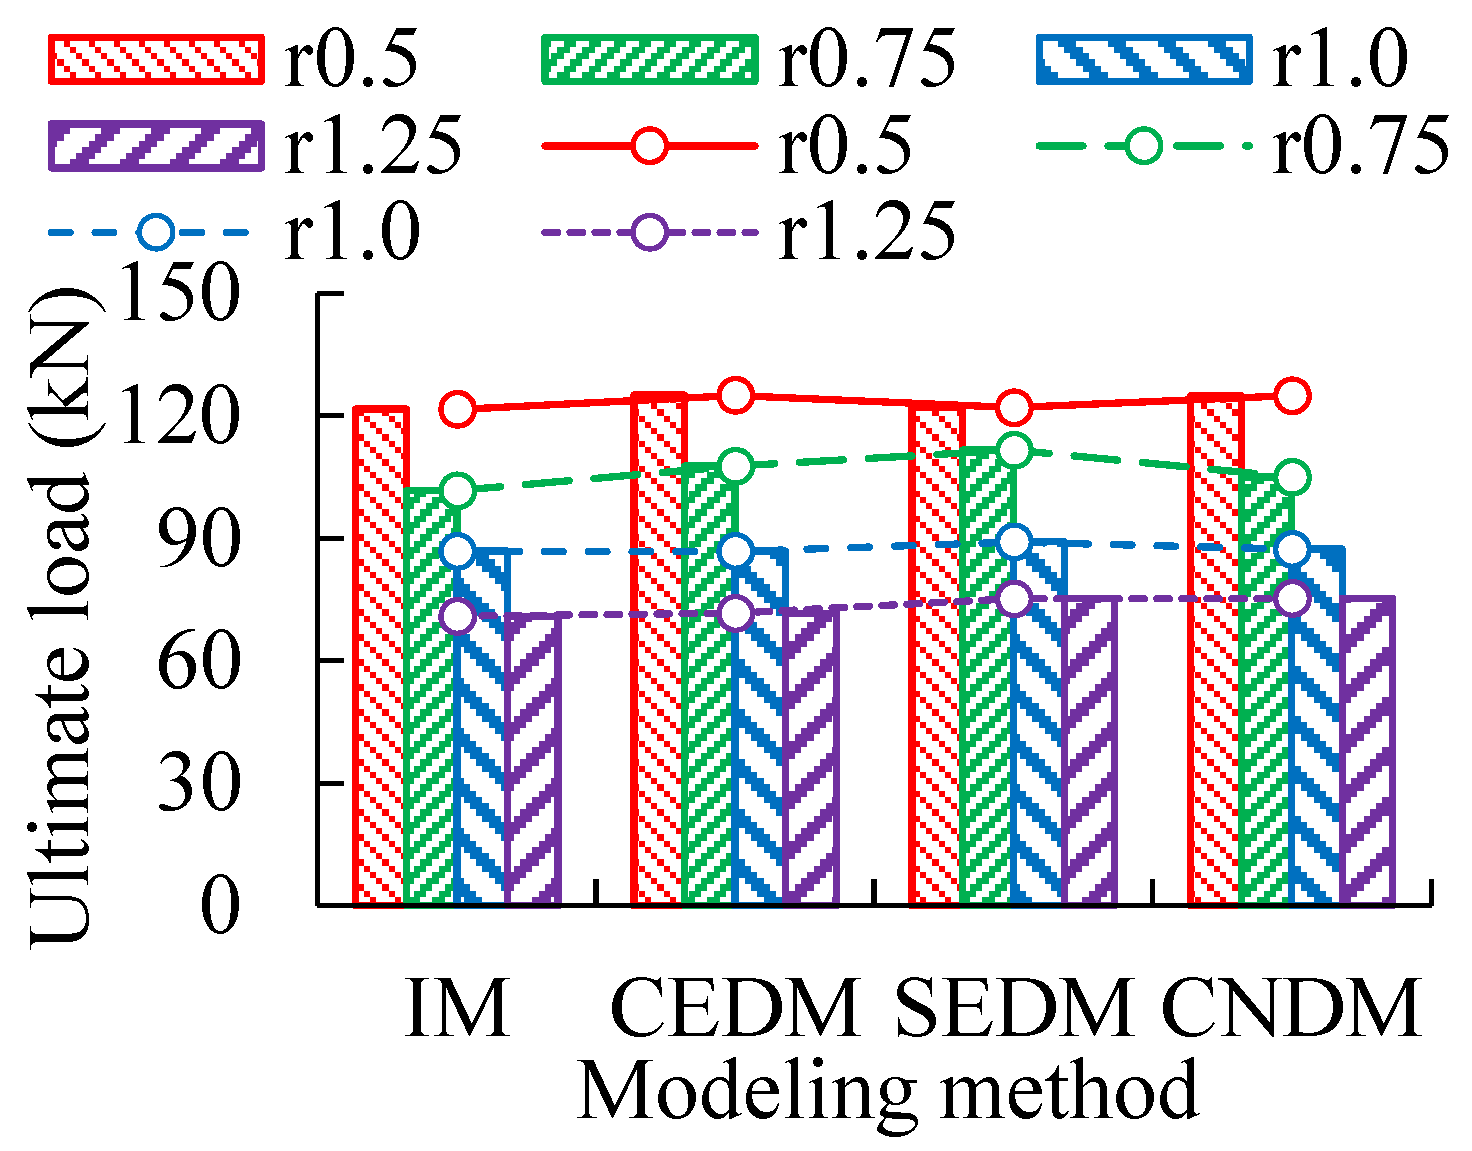
The load–displacement curves obtained from different modeling methods and aspect ratios models are shown in Figure 9, and the corresponding ultimate load results are presented in Figure 10. Based on the analysis of load–displacement curves and ultimate loads, it is observed that ultimate loads and their variation trends are generally similar across the four modeling methods. As the aspect ratios increase, the ultimate loads of UMWs gradually decrease, while the ultimate displacement progressively increases. Specifically, with an aspect ratio of 0.5 as the baseline, the ultimate loads of IM decrease by 16.4%, 28.6%, and 41.7% at aspect ratios of 0.75, 1.0, and 1.25, respectively. Corresponding decreases of 13.8%, 30.6%, and 42.7% are recorded for CEDM; 8.5%, 26.9%, and 38.4% for SEDM; and 16.1%, 30.1%, and 39.7% for CNDM. Overall, the rate of decrease in ultimate loads tends to slow down gradually as the aspect ratios increase. Among these, CNDM exhibits the most pronounced reduction.
Figure 9.
Load–displacement curves under varying aspect ratios and modeling methods.
Figure 10.
Ultimate loads under varying aspect ratios and modeling methods.
- (2)
- Stress analysis of UMWs under varying aspect ratios
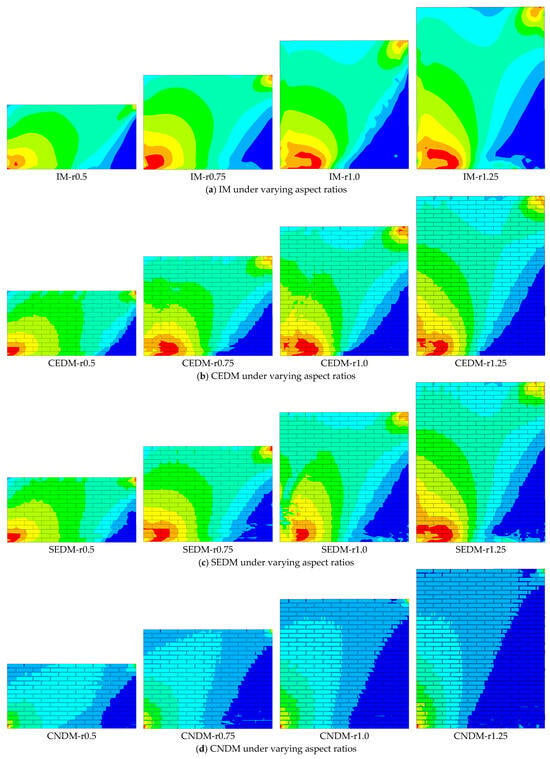
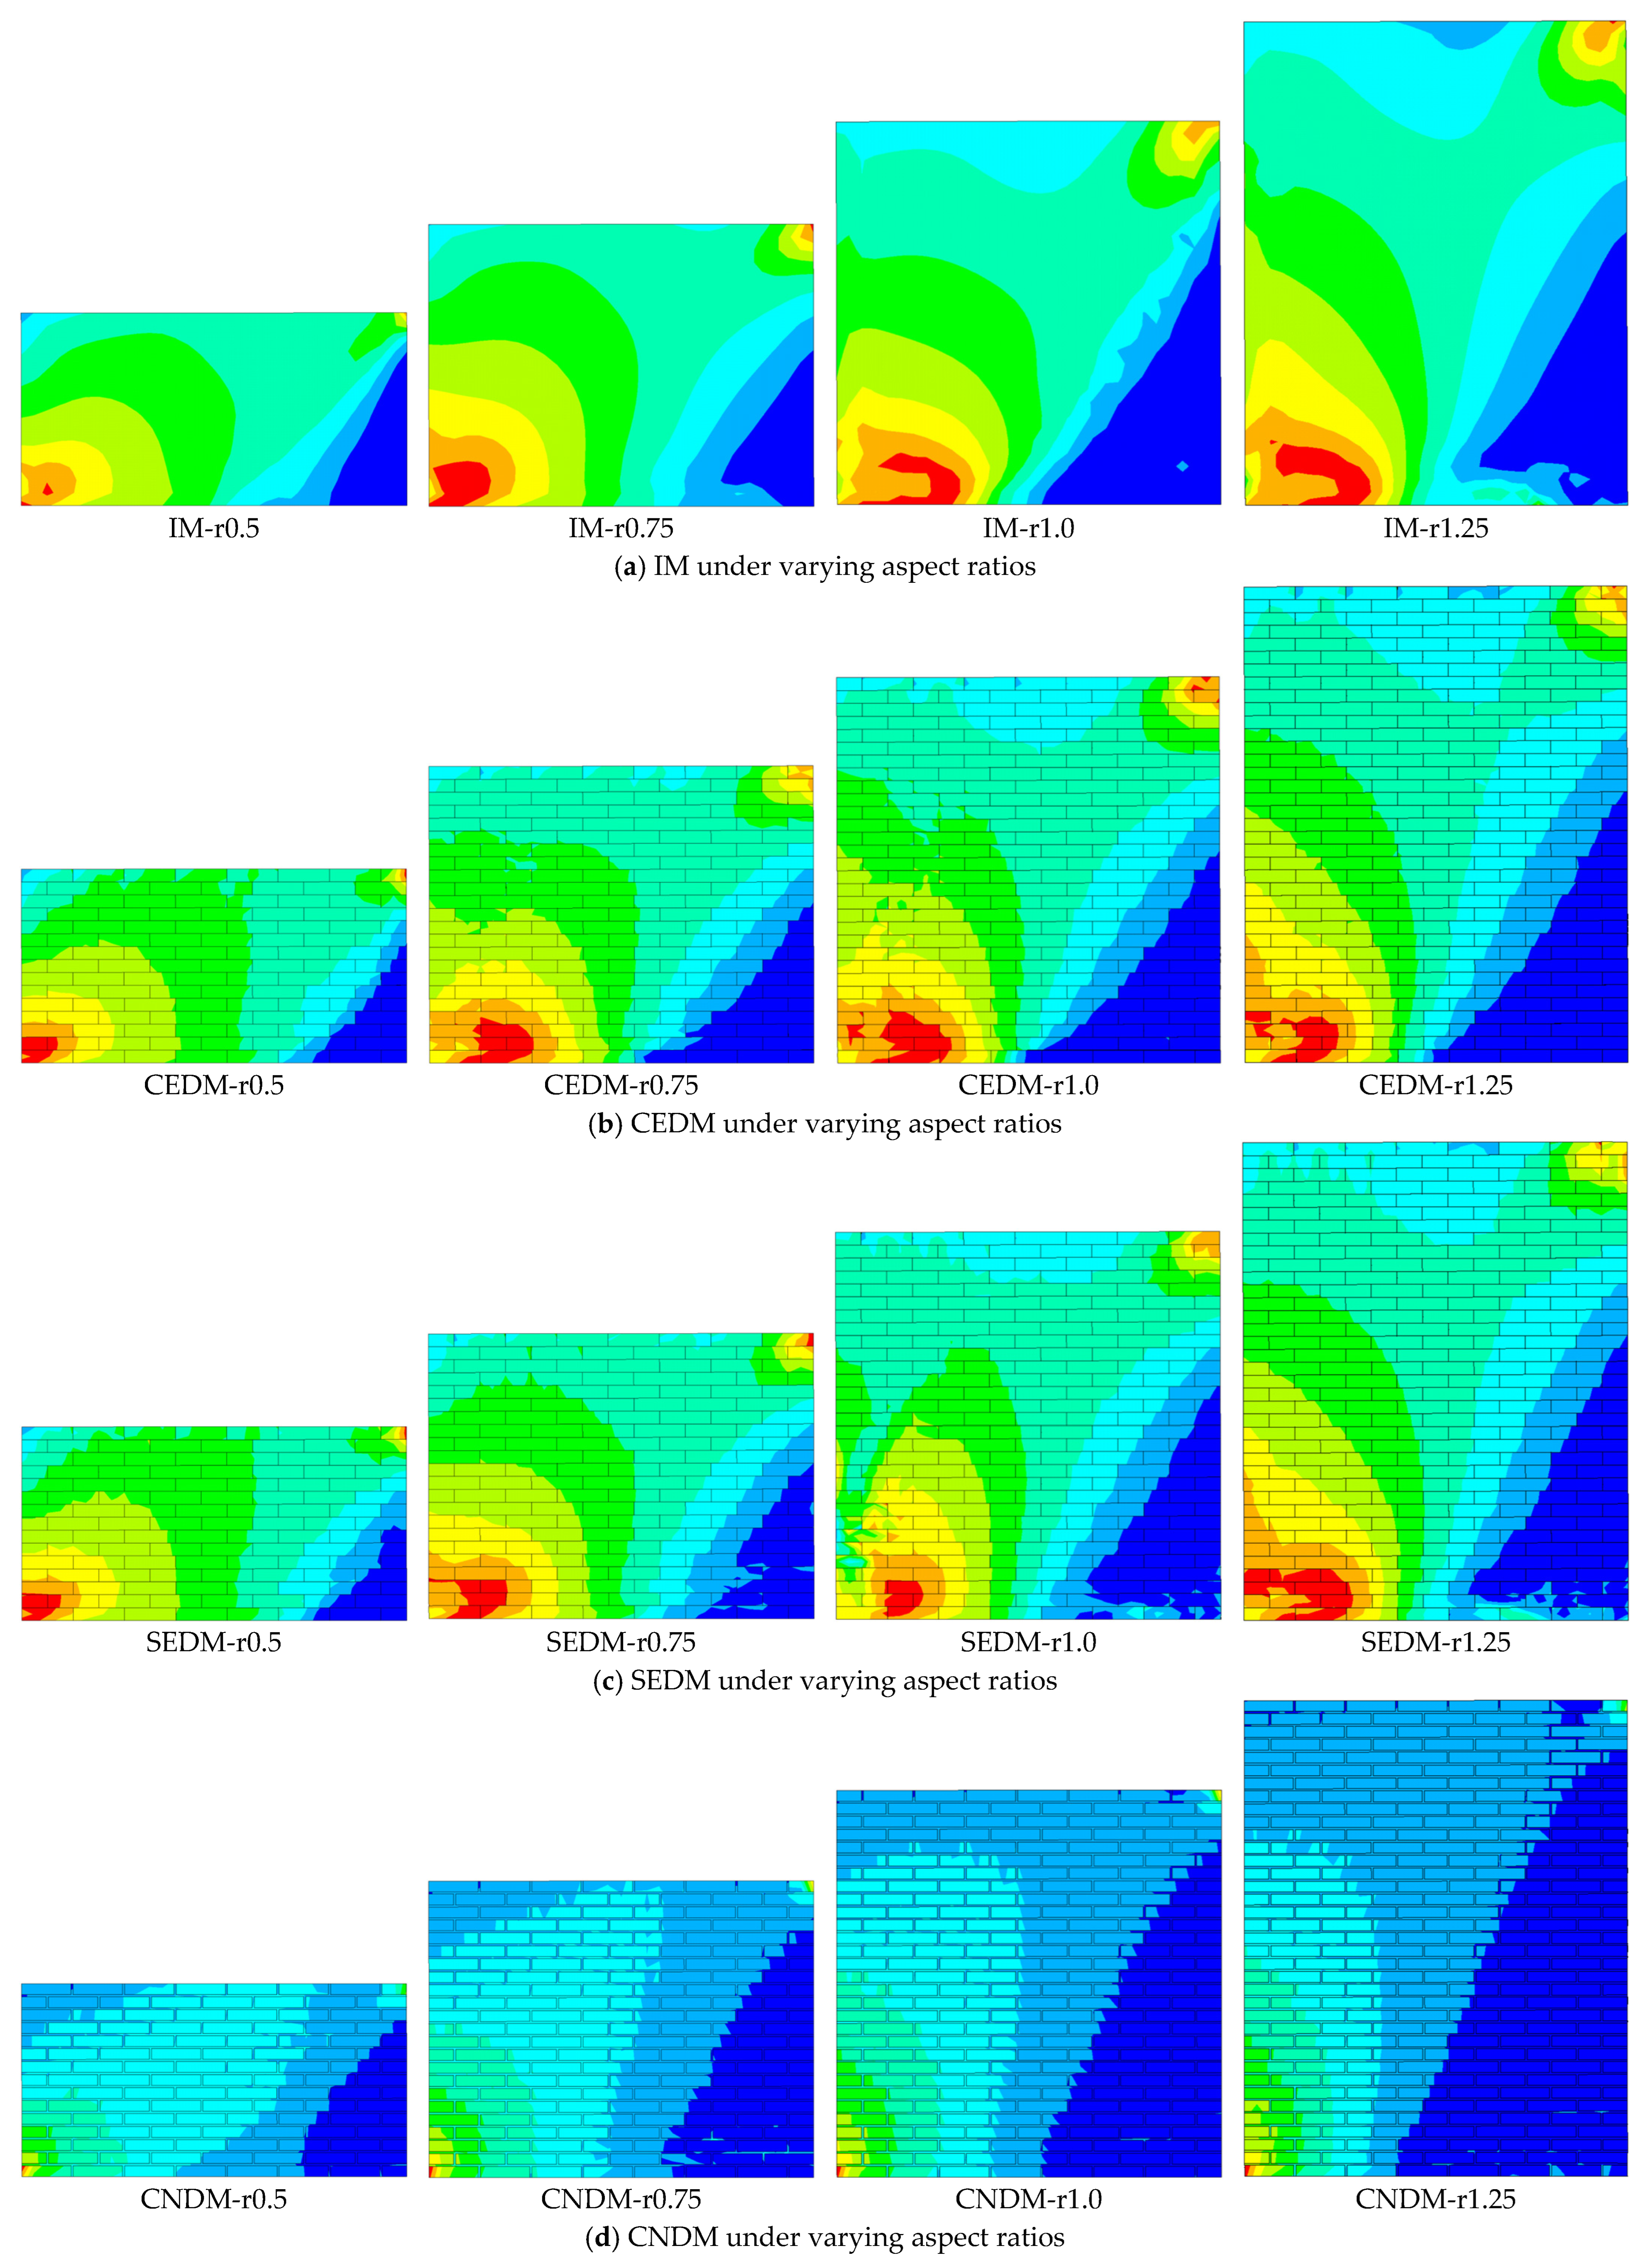
The stress cloud maps of UMWs under varying aspect ratios, obtained using four different modeling methods, are presented in Figure 11. From the stress cloud maps obtained using the four modeling methods, it is observed that at the onset of wall cracking, the region of maximum stress concentration is primarily distributed from the lower-left to the upper-right corner of UMWs and along the bottom edge. Crack propagation occurs mainly along the diagonal extending from the central region toward the lower-left and upper-right corners, forming a continuous primary diagonal crack, while horizontal cracks develop along the bottom region of UMW. As the aspect ratios increase from 0.5 to 1.25, the mechanical behavior of UMWs undergoes a transition. The stress concentration region progressively shifts from a diagonal to a horizontal distribution, and the dominant failure mode transitions from predominantly shear-controlled to predominantly flexural-controlled.
Figure 11.
Stress contours under varying aspect ratios and modeling methods.
- (3)
- Strength index analysis for UMWs under varying aspect ratios
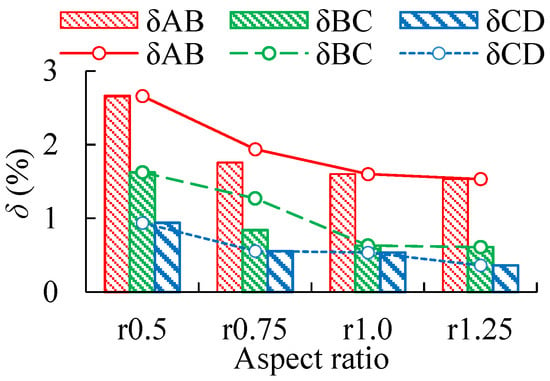
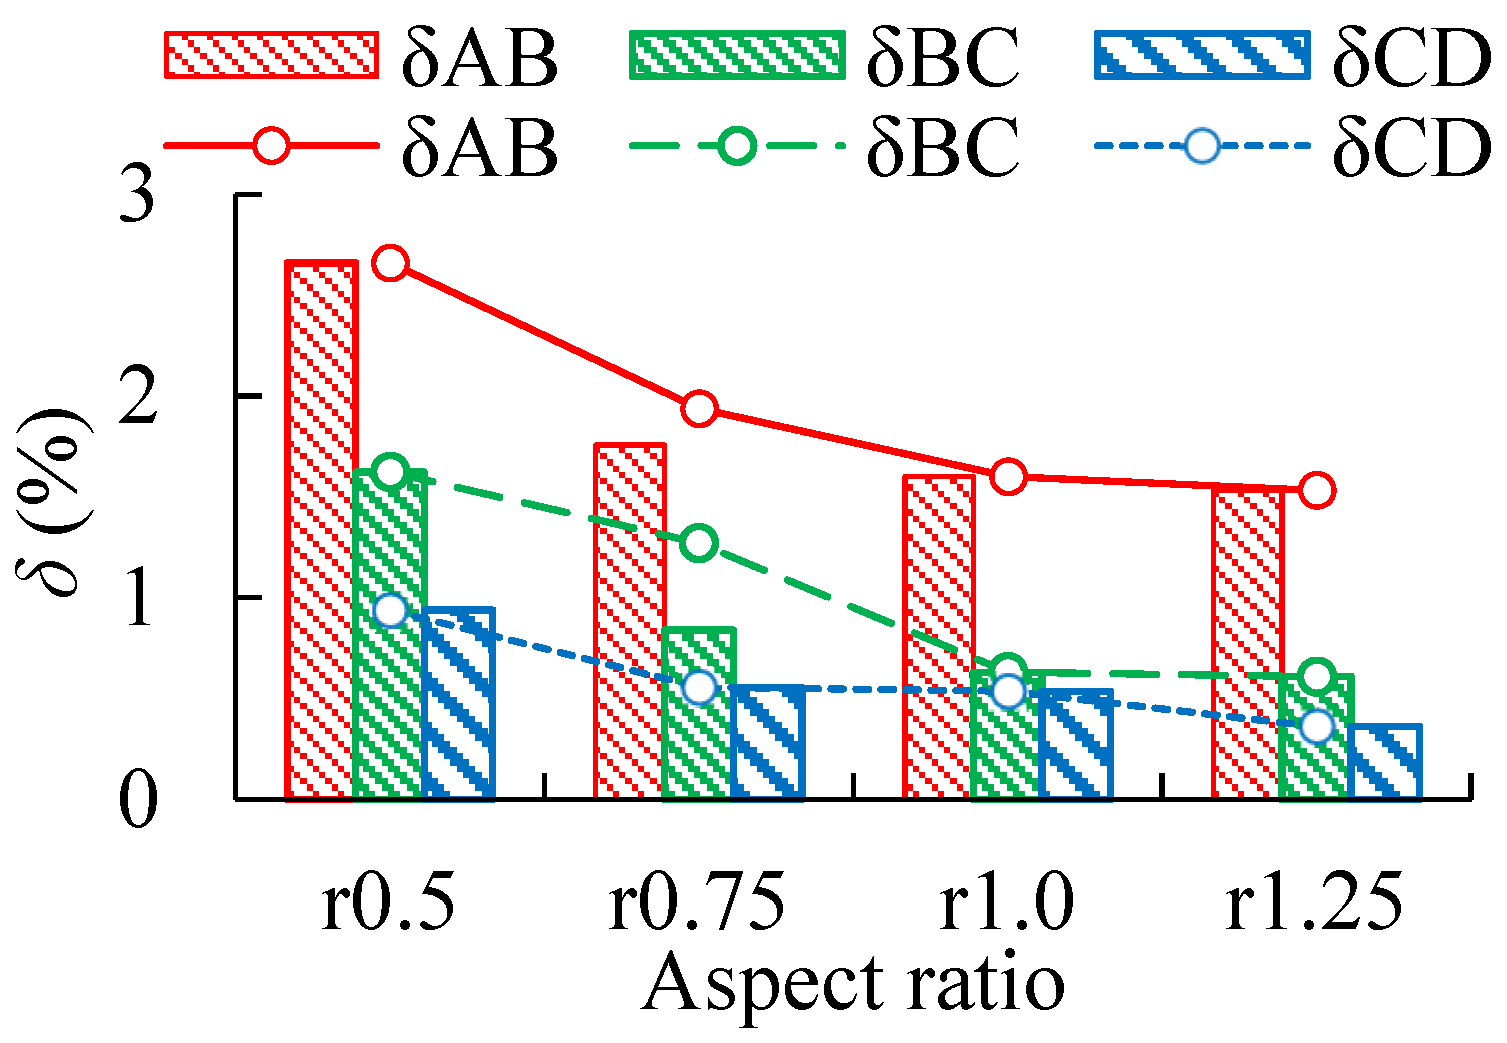
Taking CEDM as an example, the increase in δ of UMWs across four varying aspect ratios is compared. Based on the data in Table 4 and the development trend shown in Figure 12, it can be concluded that δ at four loading time points gradually decreases as the aspect ratios increase. This indicates that the dominant failure mode shifts progressively from shear-controlled to flexural-controlled as the aspect ratio of UMWs increases. An increase in the aspect ratio is found to enlarge the shear span-to-depth ratio of UMW, leading to a more uniform distribution of shear stress over the cross-section, with the flexural effect gradually becoming dominant. Consequently, the load-bearing capacity decreases, and the failure mode transitions from shear-dominated to flexure-dominated. This trend is consistent with the findings reported by Radnić et al. [38] and Sandoval et al. [39]. On this basis, the reduction in ultimate load for the four modeling methods is further quantified in this study, ranging from 38.4% to 42.7% when the aspect ratio increases from 0.5 to 1.25. Therefore, reasonable control of the aspect ratio is considered effective in improving the overall mechanical behavior of masonry walls, and an appropriate aspect ratio is suggested to enhance deformation capacity, shear strength, and overall seismic performance.
Table 4.
Increasing δ of UMWs under varying aspect ratios.
Figure 12.
Increasing δ under varying aspect ratios.
4.2. Axial Compression Ratios
To study the influence of axial compression ratios on the mechanical performance of UMWs, this section adopts UMWs with a mortar strength grade of M5 and a masonry block strength grade of MU10, for which the design value of compressive strength f is 1.5 MPa. According to the code for the design of masonry structures, the axial compression ratio of UMWs is generally controlled below 0.8 in practical engineering. Furthermore, when the axial compression ratio exceeds 0.8, the failure mode of UMW is brittle crushing. Therefore, the axial compression ratio in this study is limited to the range of 0.1–0.8. Monotonic pushover analyses are conducted on FE models of UMWs with axial compression ratios of 0.1, 0.3, 0.5, 0.7, and 0.8, respectively.
- (1)
- Mechanical performance analysis of UMWs under varying axial compression ratios
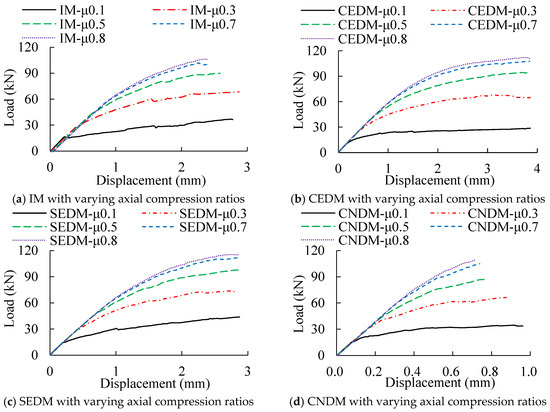
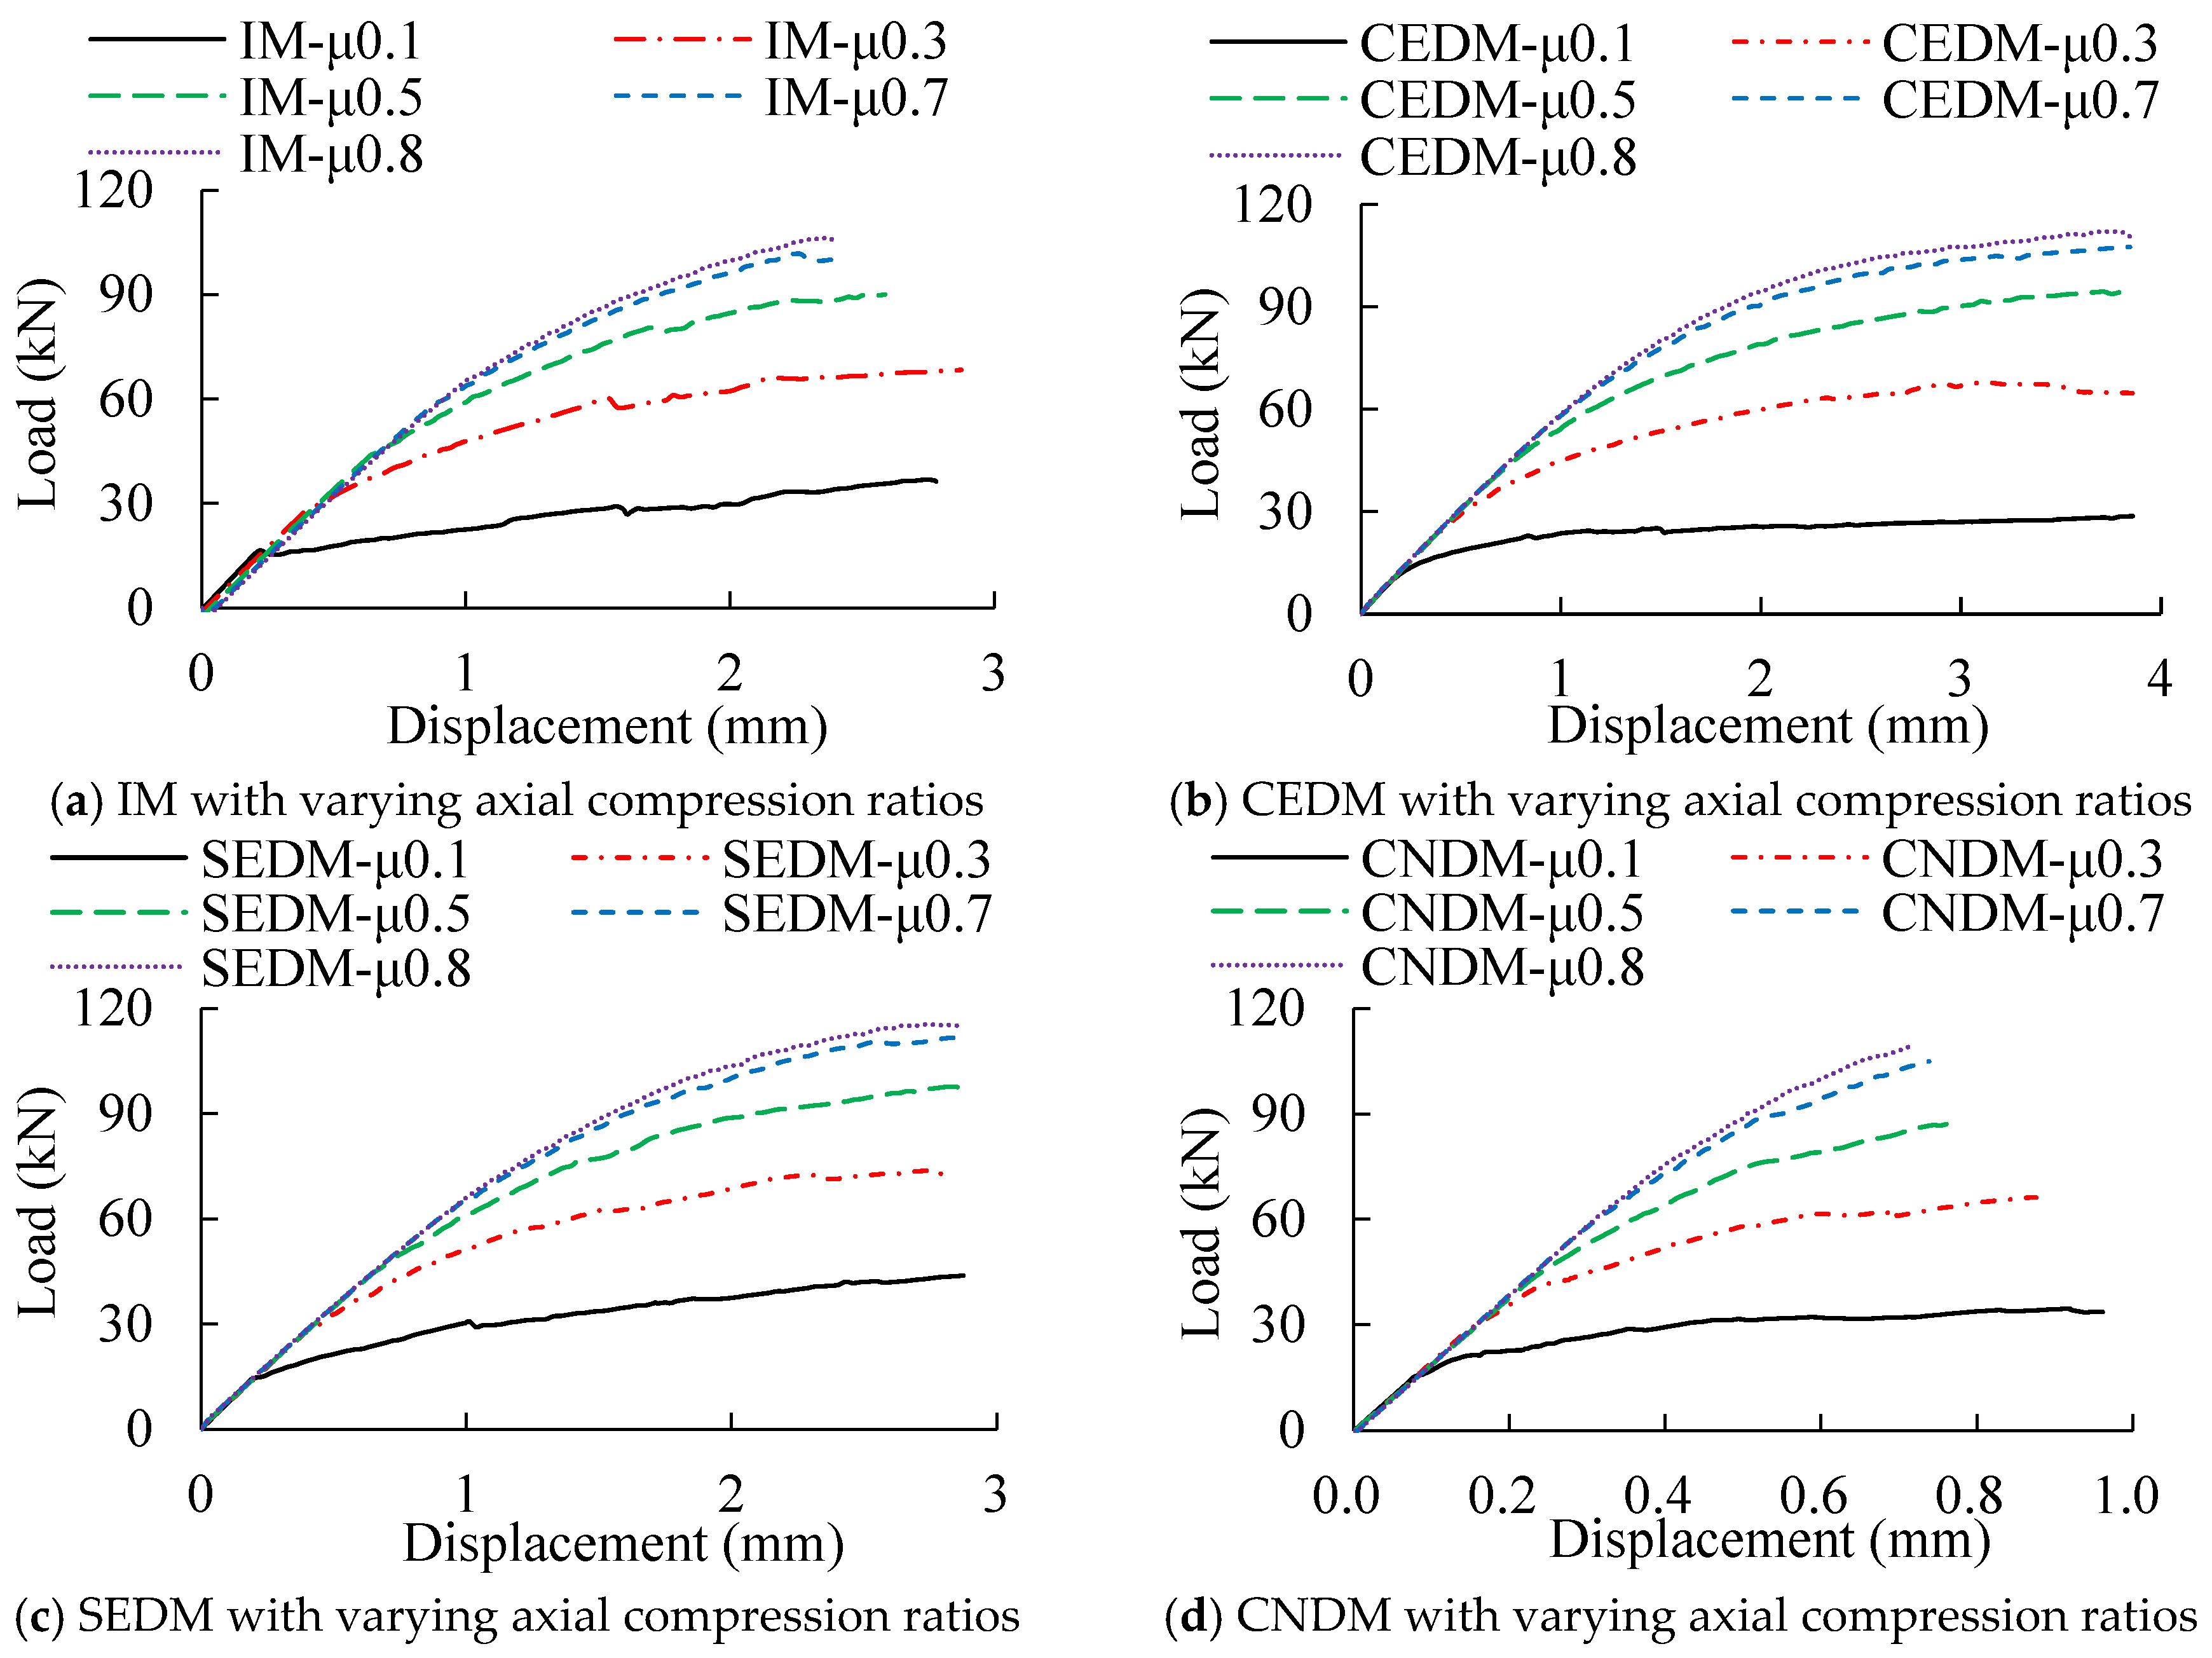
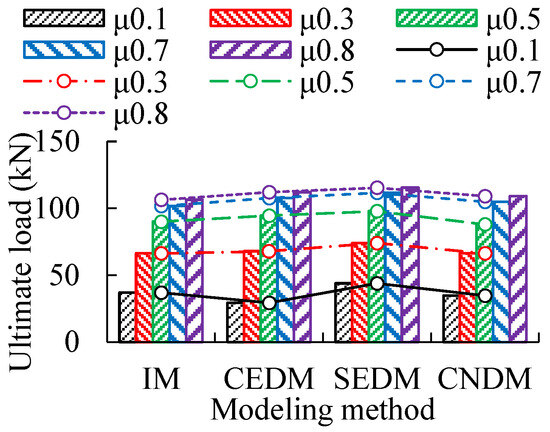
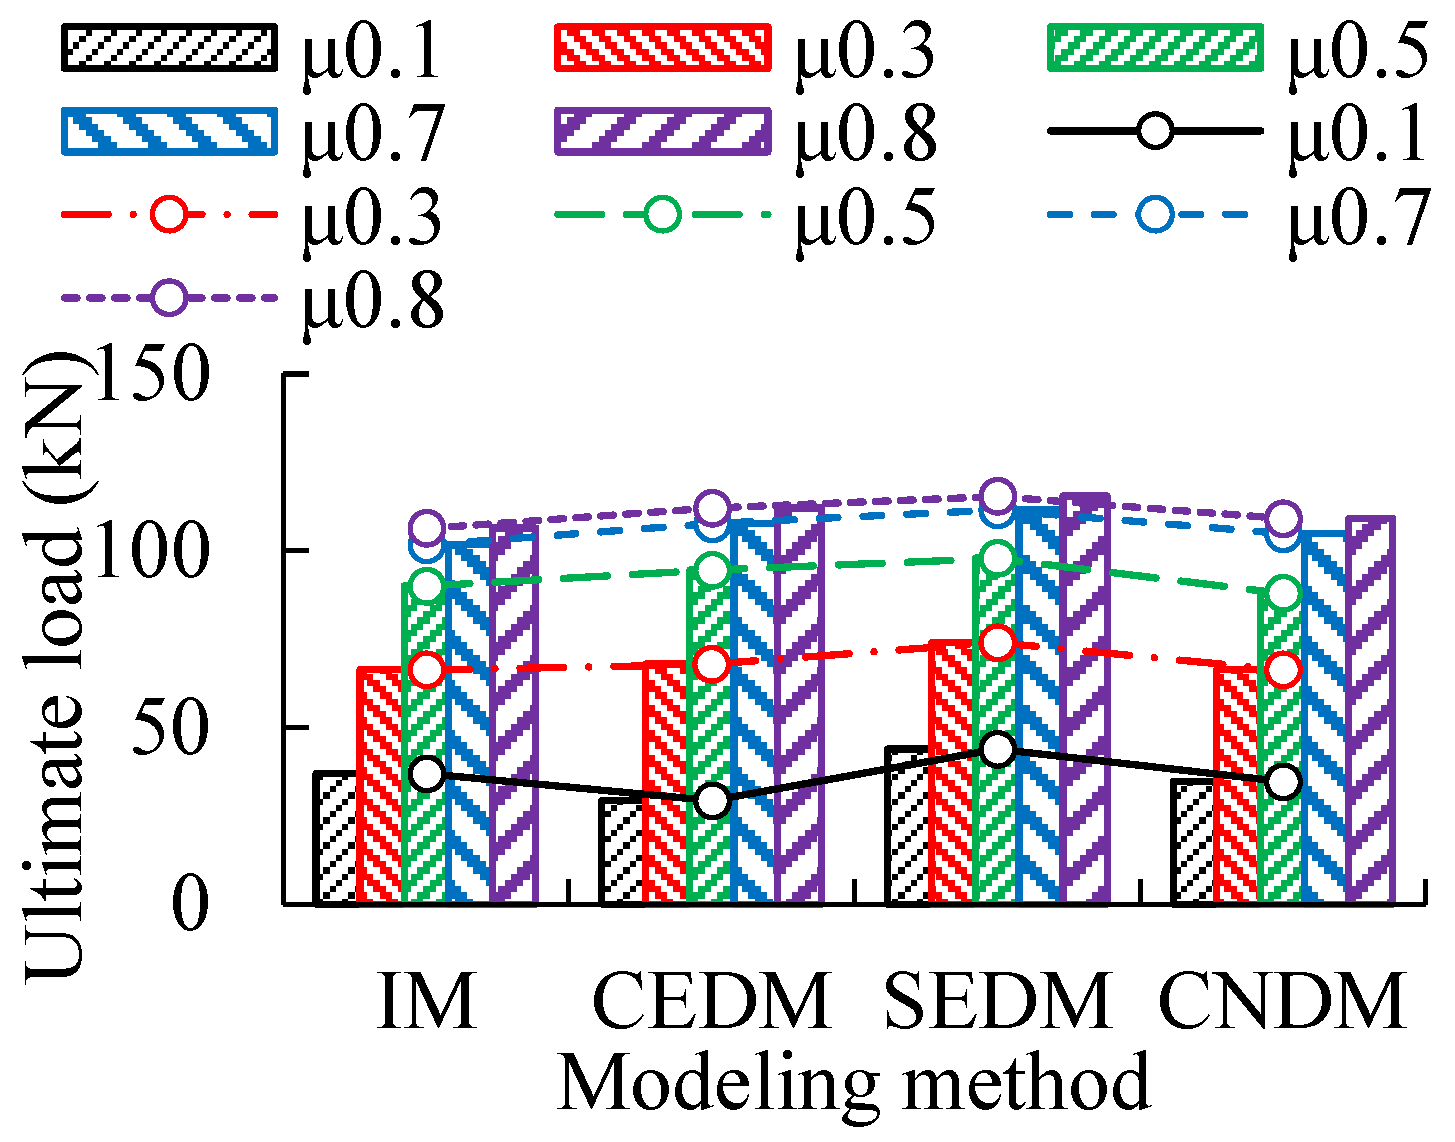
The load–displacement curves obtained from FE models of UMWs with varying axial compression ratios and modeling methods are shown in Figure 13, and the corresponding ultimate load results are presented in Figure 14. Based on the analysis of load–displacement curves and ultimate loads, it is observed that ultimate loads and their variation trends are generally similar across four modeling methods. As the axial compression ratios increase, the ultimate loads of UMWs are observed to gradually increase, while the ultimate displacement gradually decreases. Specifically, with an axial compression ratio of 0.1 as the baseline, the ultimate loads of IM increase by 79.7%, 143.9%, 175.6%, and 188.4% at axial compression ratios of 0.3, 0.5, 0.7, and 0.8, respectively. Corresponding increases of 131.7%, 222.5%, 267.6%, and 282.6% are recorded for CEDM; 68.6%, 123.1%, 154.2%, and 162.9% for SEDM; and 91.1%, 153.6%, 202.3%, and 214.4% for CNDM. Overall, the rate of increase in ultimate loads gradually slows as the axial compression ratios increase.
Figure 13.
Load–displacement curves under varying axial compression ratios and modeling methods.
Figure 14.
Ultimate loads under varying axial compression ratios and modeling methods.
- (2)
- Stress analysis of UMWs under varying axial compression ratios
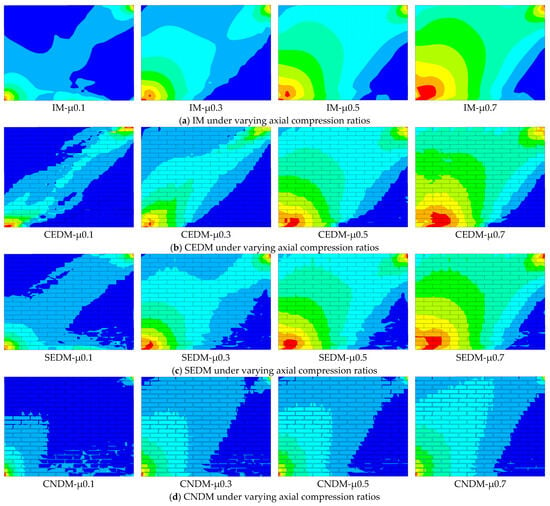
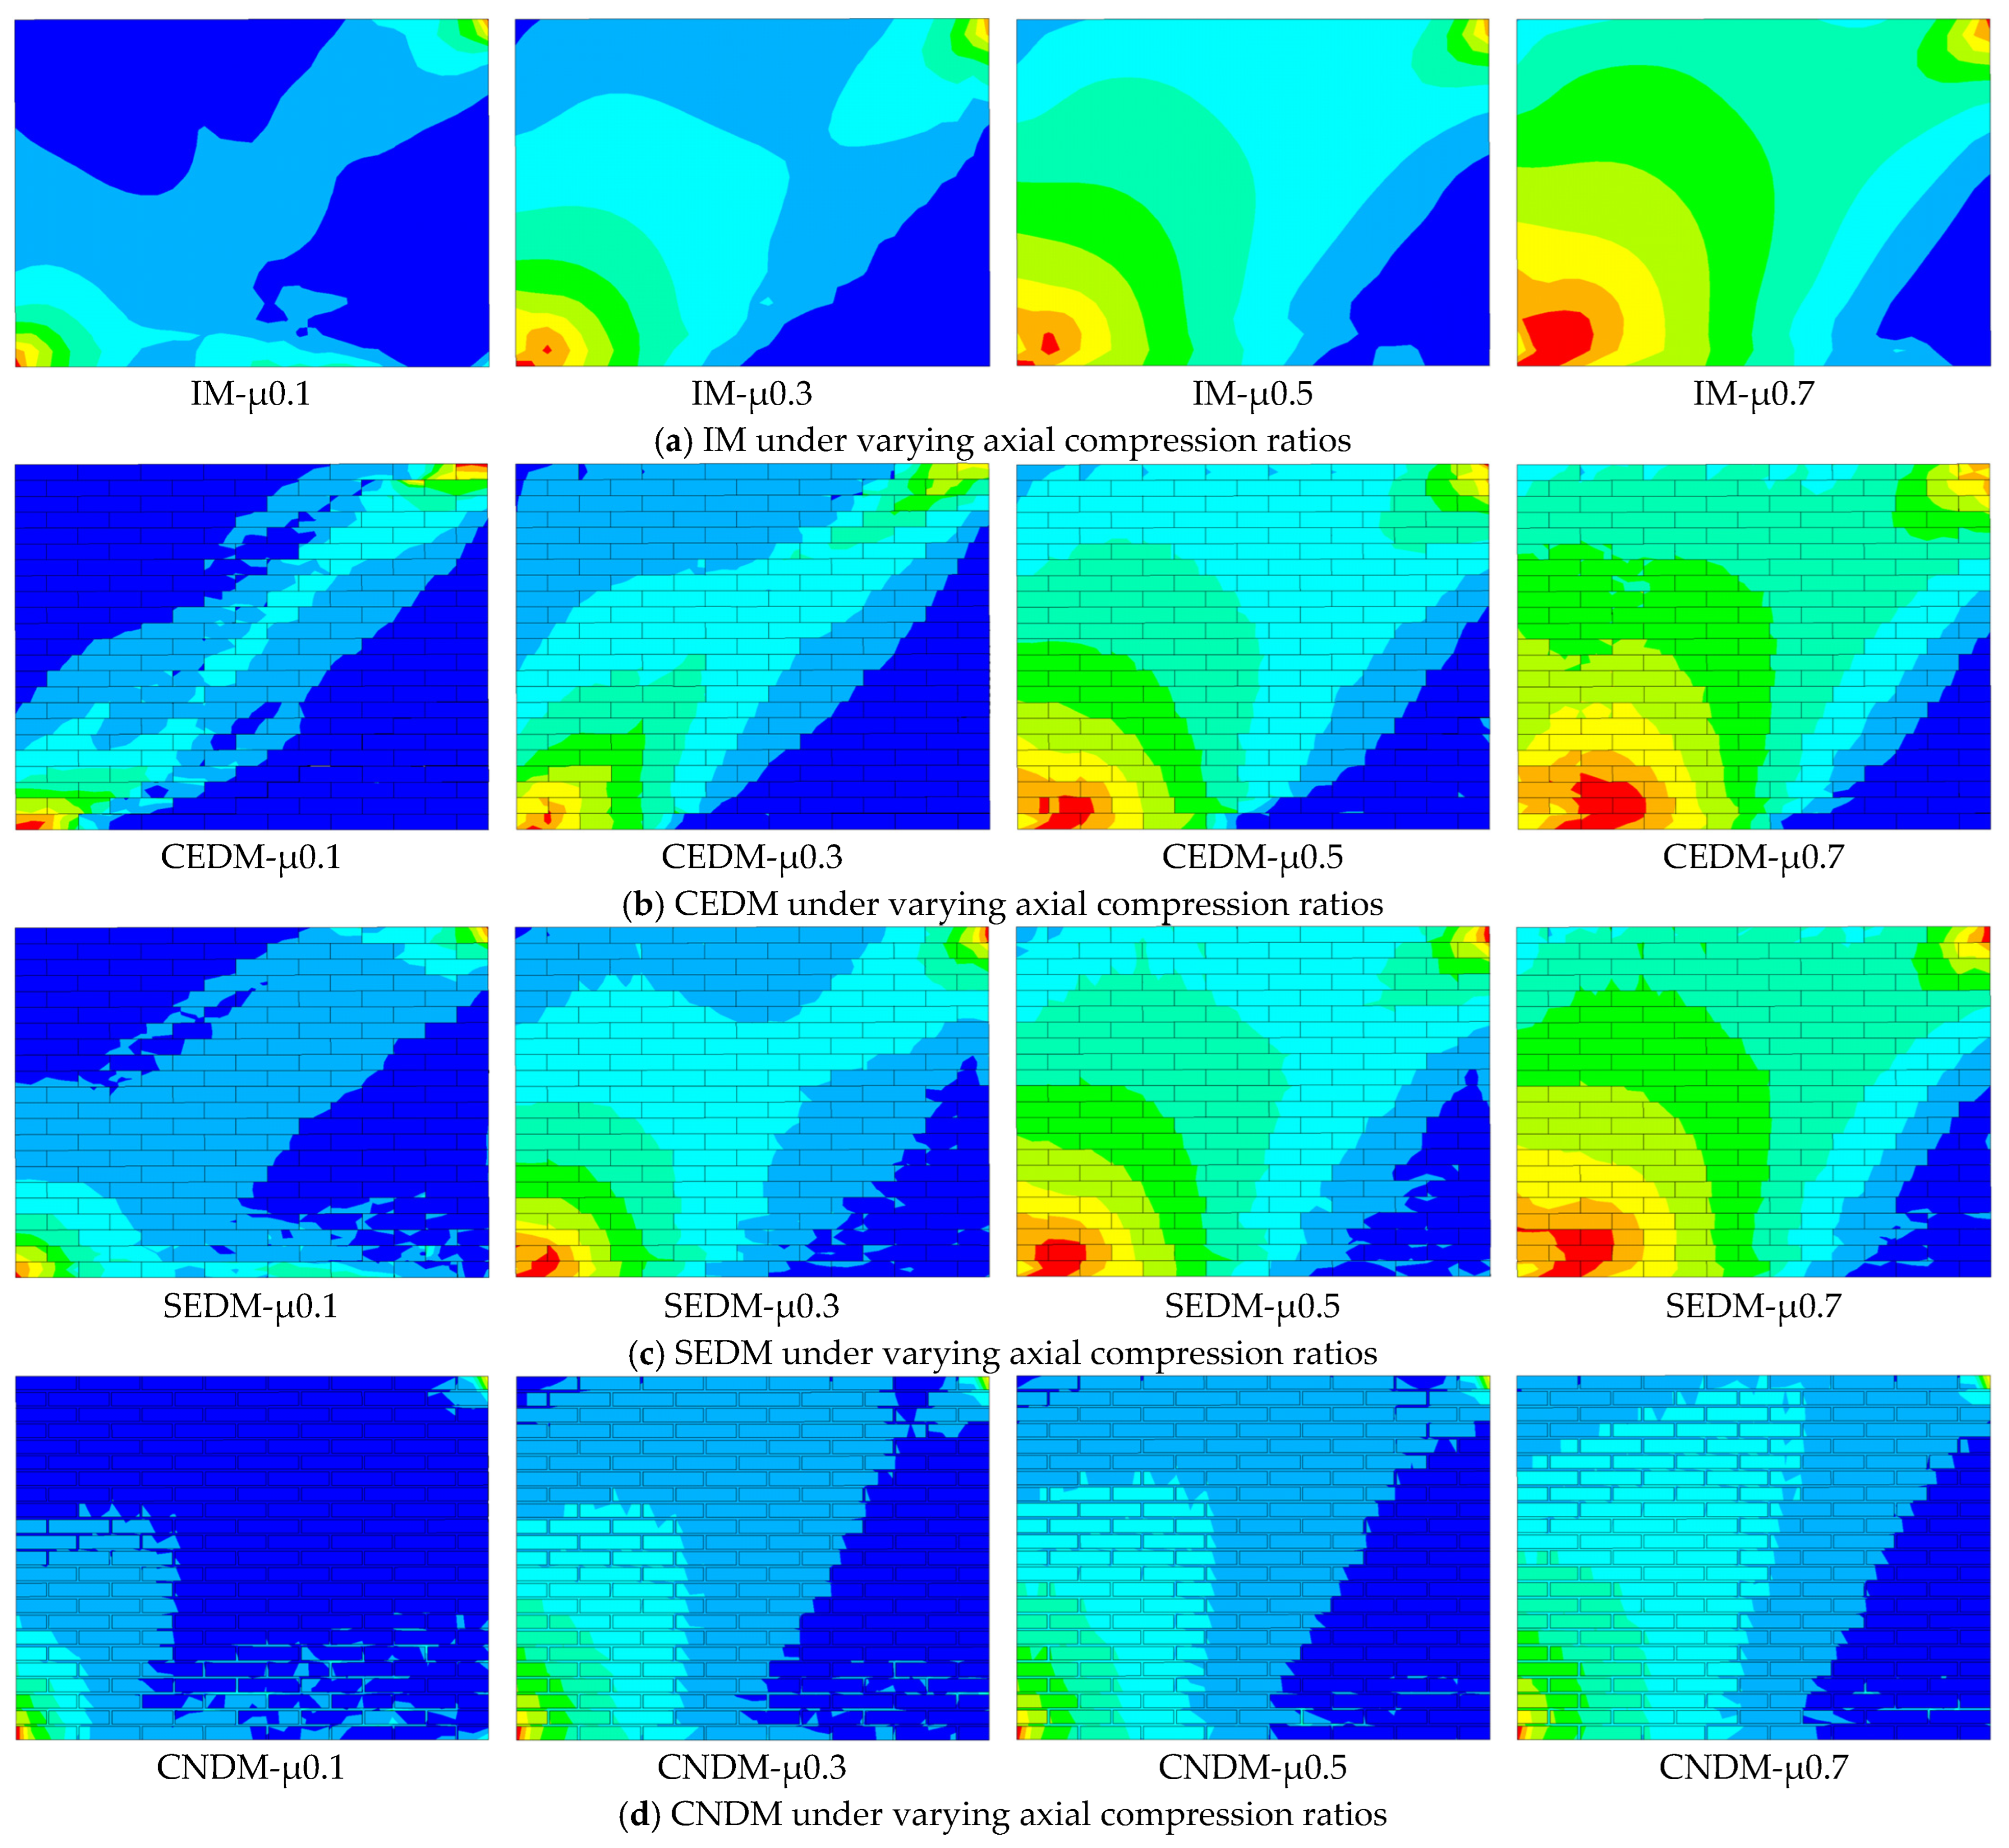
The stress cloud maps of UMW under varying axial compression ratios, obtained using four distinct modeling methods, are presented in Figure 15. From the stress cloud maps obtained using four modeling methods, it is observed that at the onset of UMW cracking, the region of maximum stress concentration is primarily distributed from the lower-left to the upper-right corner of the wall and along the bottom edge. Crack propagation occurs mainly along the diagonal extending from the central area toward the lower-left and upper-right corners, forming a continuous primary diagonal crack, while horizontal cracks develop along the bottom region of the wall. As the axial compression ratios increase from 0.1 to 0.7, the mechanical behavior of UMW undergoes a transition. The stress concentration zone gradually shifts from a predominantly horizontal distribution to a diagonal one, and the dominant failure mode transitions from flexure-controlled to shear-controlled.
Figure 15.
Stress contours under varying axial compression ratios and modeling methods.
- (3)
- Strength index analysis of UMWs under varying axial compression ratios
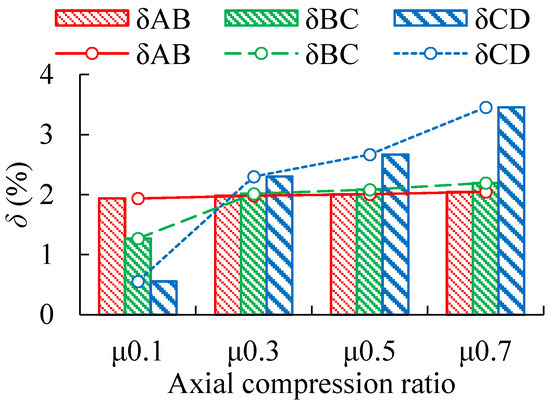
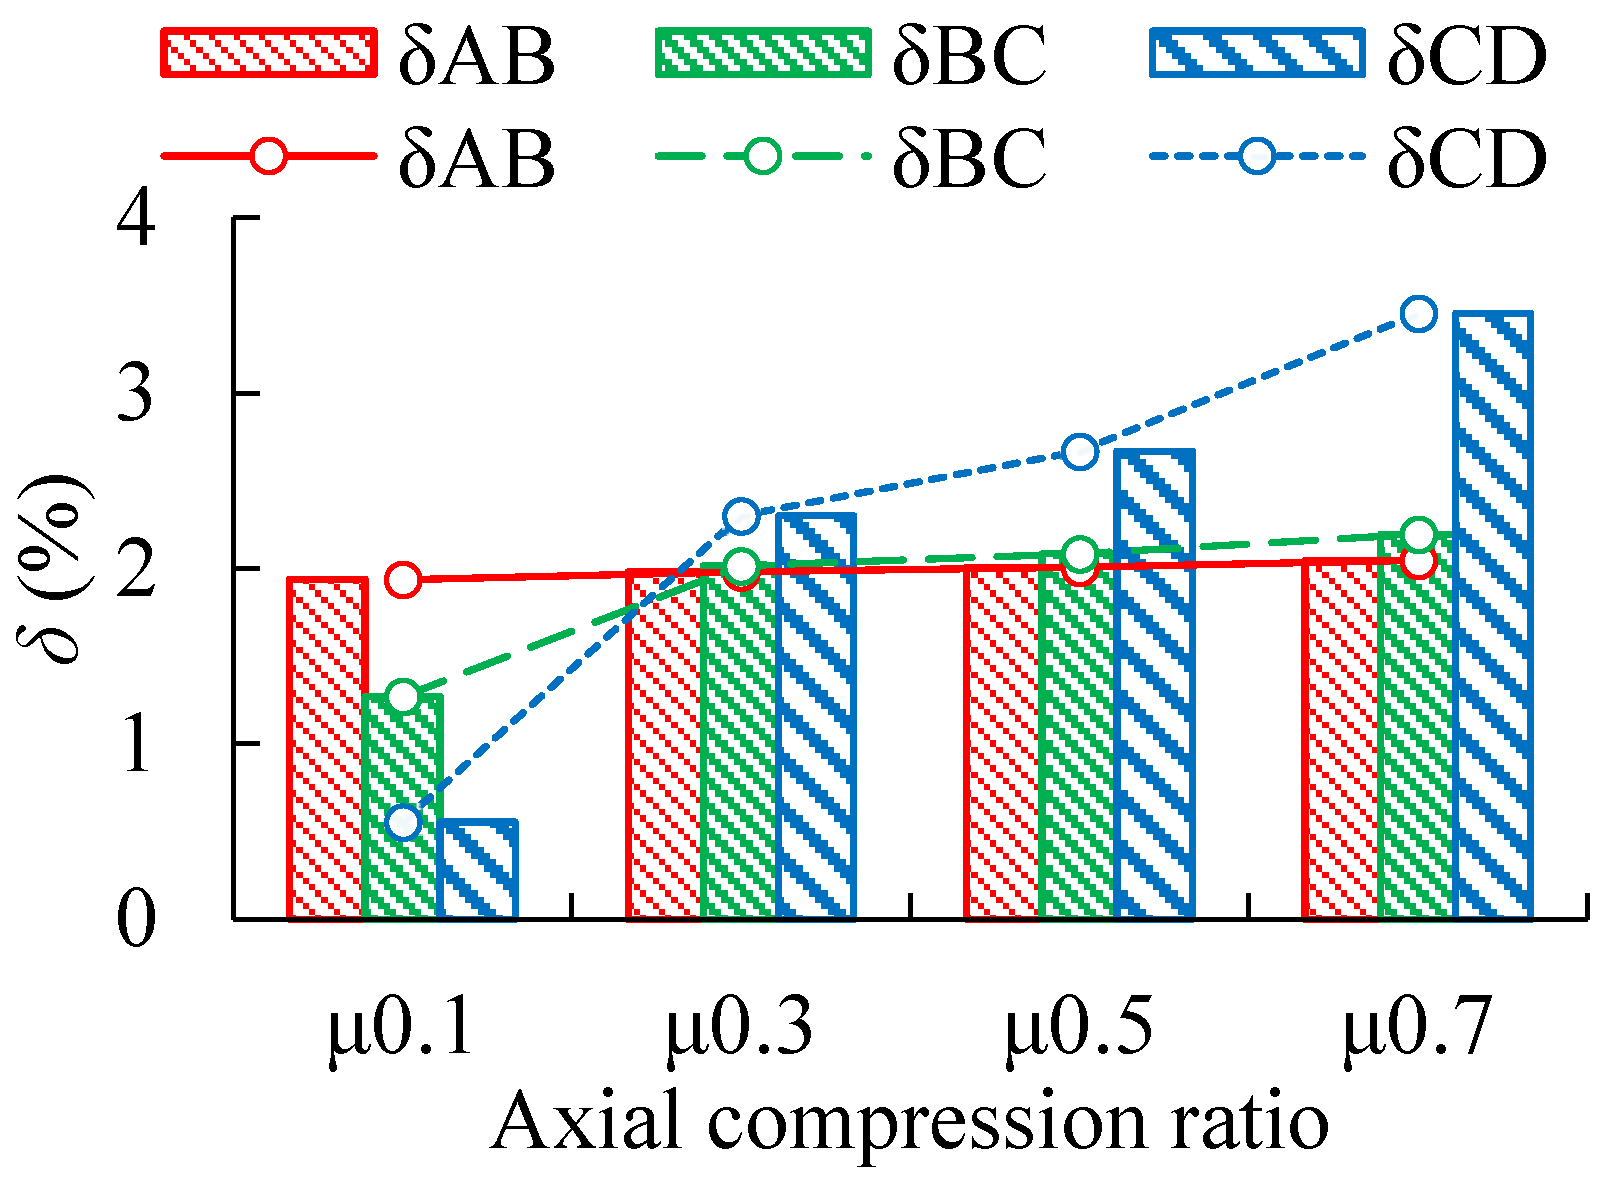
Taking CEDM as an example, the increase in δ of UMWs under four varying axial compression ratios is compared. Based on the data in Table 5 and the trend shown in Figure 16, it is concluded that as the axial compression ratios increase, δ gradually increases at four loading time points. This indicates that as the axial compression ratio increases, the dominant failure mode shifts progressively from flexure-controlled to shear-controlled. An increase in the axial compression ratio is found to raise the vertical compressive stress on the masonry cross-section, significantly enhancing the shear load-bearing capacity of the UMW under horizontal loading. As the axial compression ratio increases from 0.1 to 0.8, the maximum increase in ultimate load across the four modeling methods ranges from 162.9% to 282.6%. At the same time, the compressive stress is also observed to delay the appearance of flexural cracks, causing the failure mode to shift from flexure-dominated to shear-dominated. However, when the axial compression ratio becomes excessively high, the wall tends to undergo brittle crushing failure, with the increase in load-bearing capacity gradually diminishing and the risk of brittle behavior rising. This trend is consistent with the findings reported by Haach et al. [40]. Therefore, a reasonable control of the axial compression ratio is considered to effectively improve the overall mechanical behavior of shear-dominated walls, and an appropriate axial compression ratio is suggested to be selected so that the wall can be guided toward a more favorable shear-dominated failure mode, thereby enhancing deformation capacity, shear strength, and overall seismic performance.
Table 5.
Increasing δ of UMWs under varying axial compression ratios.
Figure 16.
Increasing δ under varying axial compression ratios.
4.3. Mortar Strengths
To investigate the influence of mortar strength on the mechanical performance of UMWs, monotonic pushover analyses are conducted on FE models of UMWs with mortar strength grades of M5, M7.5, and M10, respectively.
- (1)
- Mechanical performance analysis of UMWs under varying mortar strengths
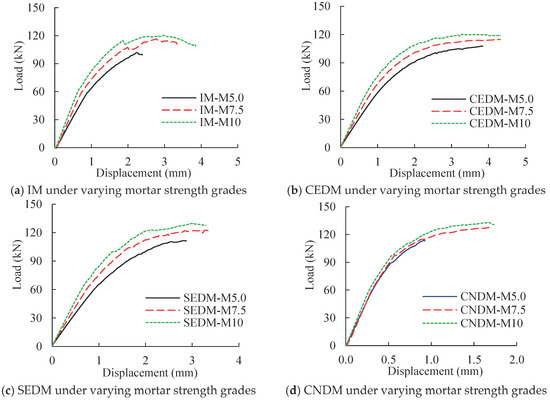
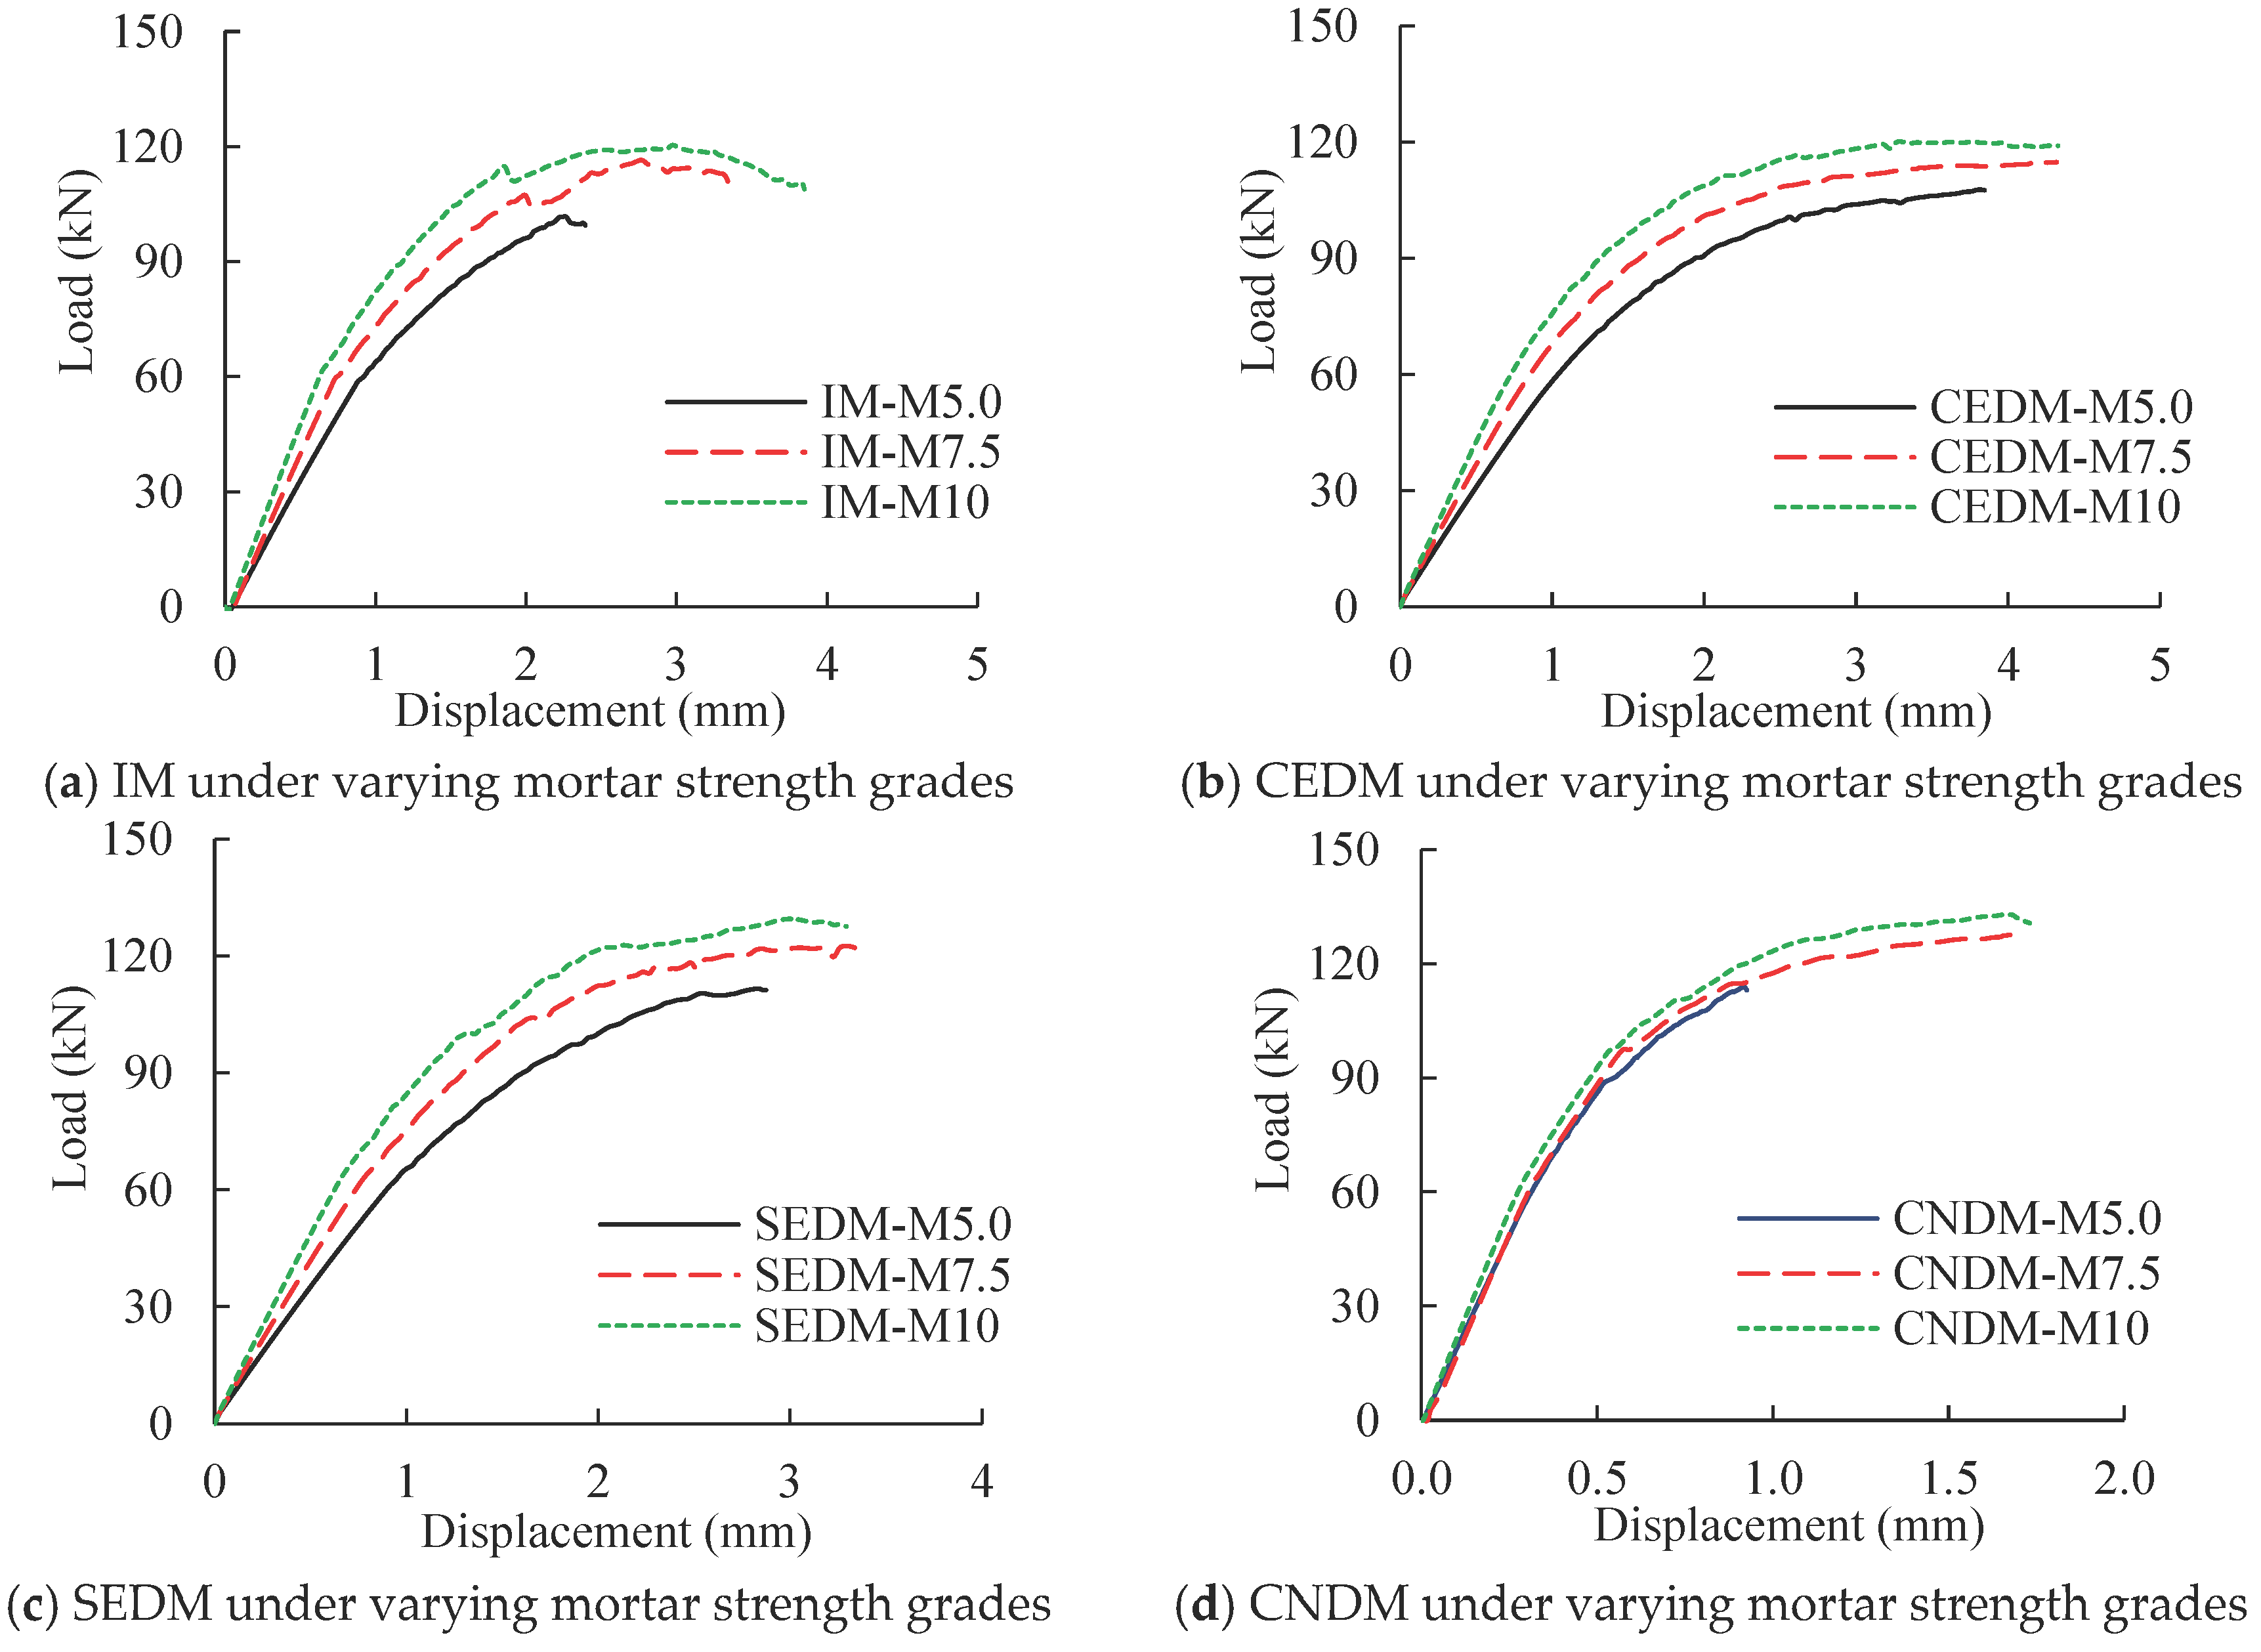
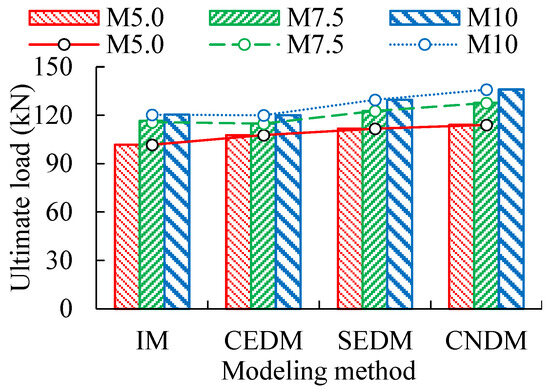
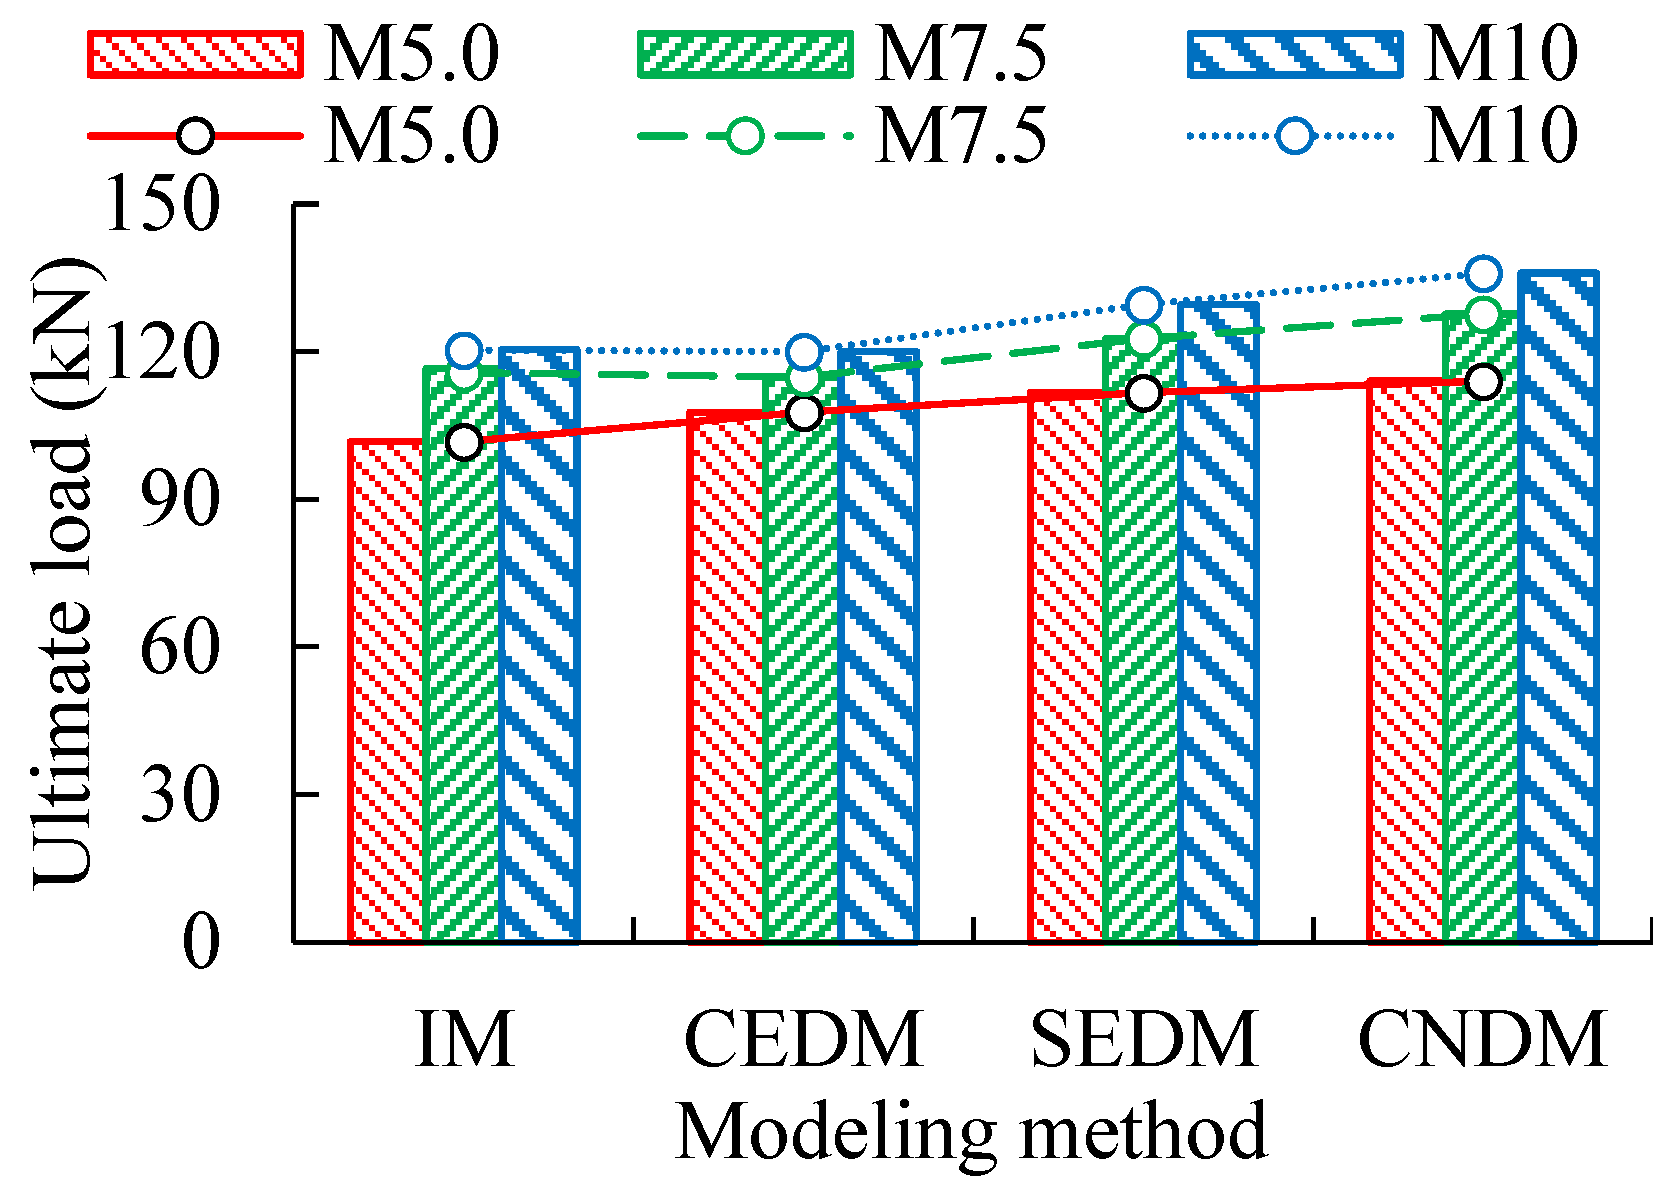
The load–displacement curves obtained from varying mortar strength models and modeling methods are shown in Figure 17, while the corresponding ultimate load results are presented in Figure 18. Based on the analysis of load–displacement curves and ultimate loads, it is observed that ultimate loads and their variation trends are generally similar across the four modeling methods. As mortar strength increases, the ultimate loads of UMWs are observed to gradually increase, while the ultimate displacement also gradually increases. Specifically, with mortar strength grade M5 as the baseline, ultimate loads of IM are increased by 14.6% and 18.4% for mortar strength grades M7.5 and M10, respectively. Corresponding increases of 6.6% and 11.4% are recorded for CEDM, 9.9% and 16.1% for SEDM, and 11.9% and 19.2% for CNDM.
Figure 17.
Load–displacement curves for UMWs under varying mortar strength grades and modeling methods.
Figure 18.
Ultimate loads for UMWs under varying mortar strength grades and modeling methods.
- (2)
- Stress analysis of UMWs under varying mortar strength grades
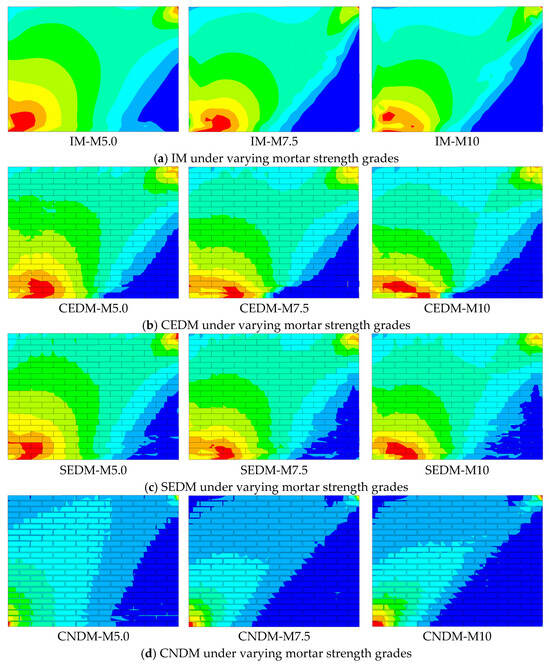
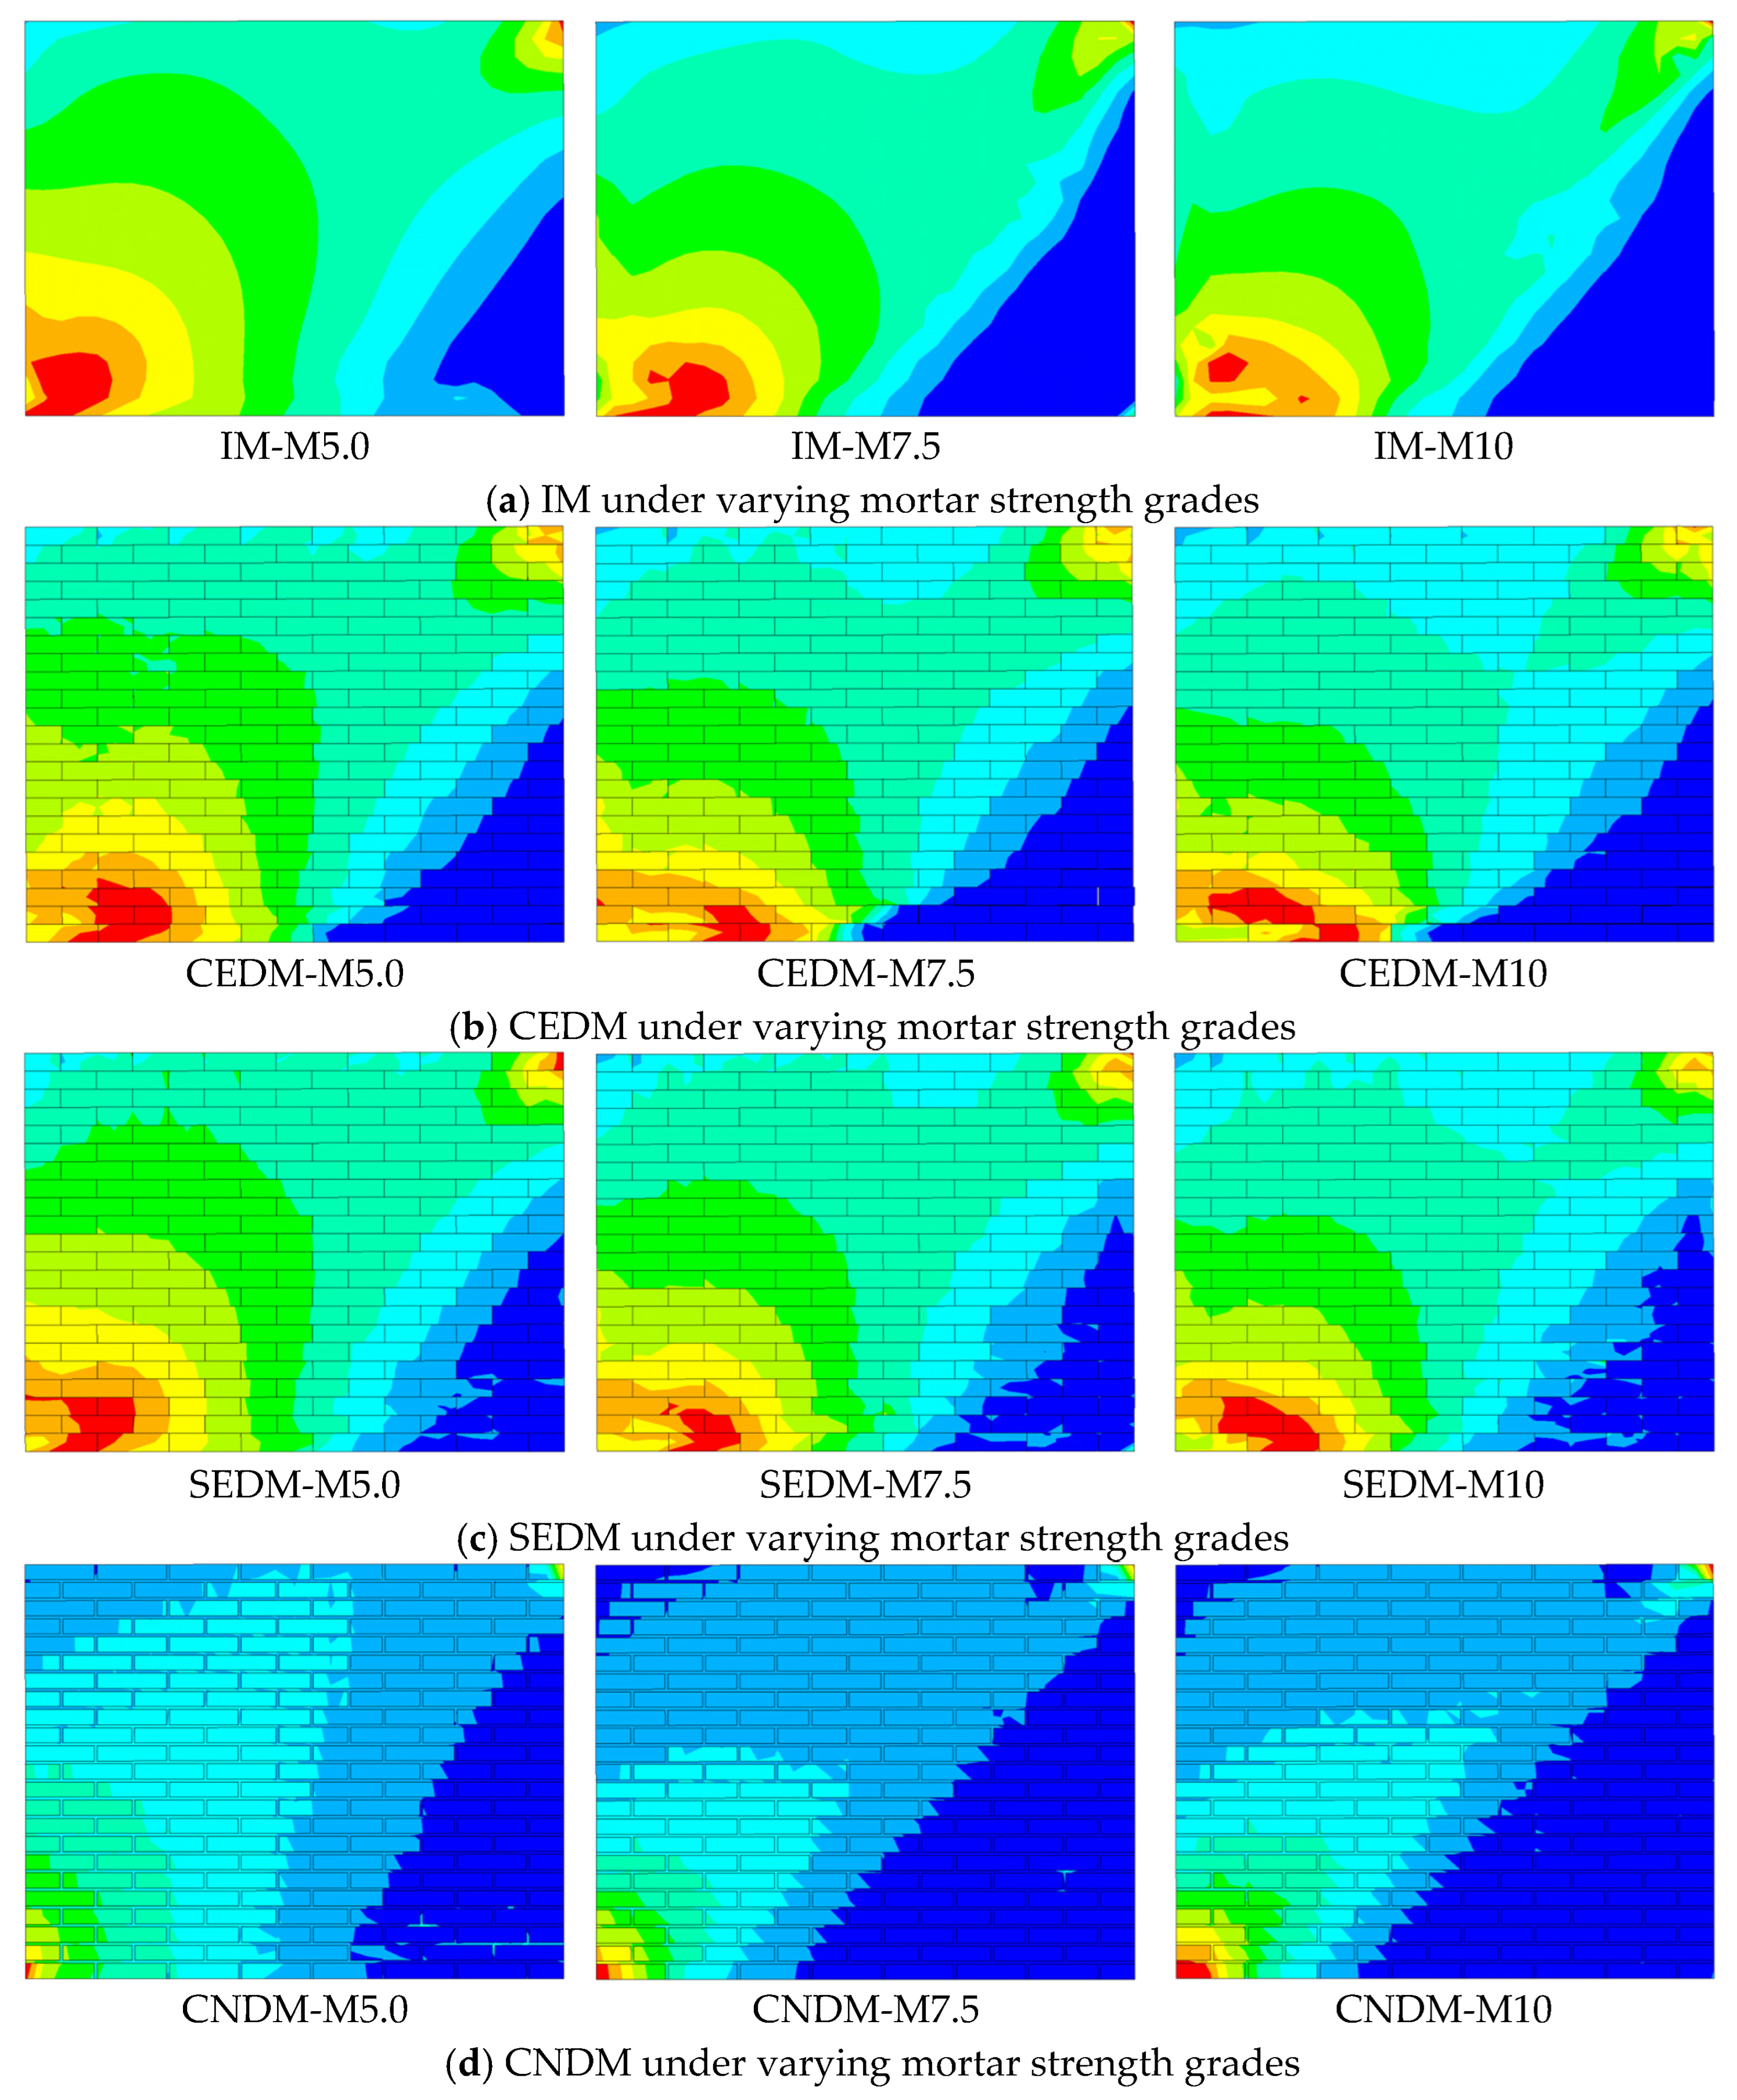
The stress cloud maps of UMW under varying mortar strengths, obtained using four different modeling methods, are presented in Figure 19. From the stress cloud maps obtained through four modeling methods, it is observed that at the onset of wall cracking, the region of maximum stress concentration is primarily distributed from the lower-left to the upper-right corner of UMW, as well as along the bottom horizontal direction. Crack propagation occurs mainly along the diagonal extending from the central region toward the lower-left and upper-right corners, forming a continuous primary diagonal crack, while horizontal cracks develop along the bottom region of UMW. As the mortar strength increases from M5 to M10, the mechanical behavior of UMWs undergoes a transition. The stress concentration region gradually shifts from a diagonal distribution to a predominantly horizontal one, and the dominant failure mode transitions from shear-controlled to flexural-controlled.
Figure 19.
Stress cloud maps under varying mortar strength grades and modeling methods.
- (3)
- Strength index analysis for UMWs under varying mortar strengths
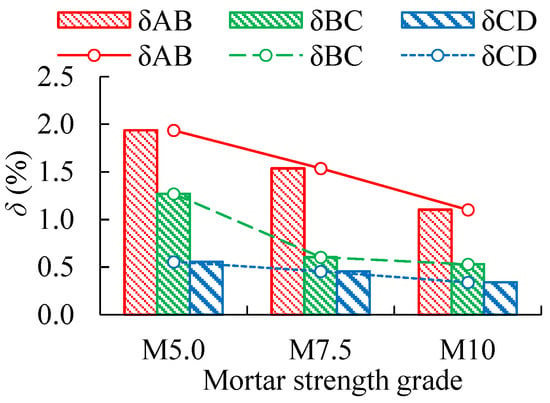
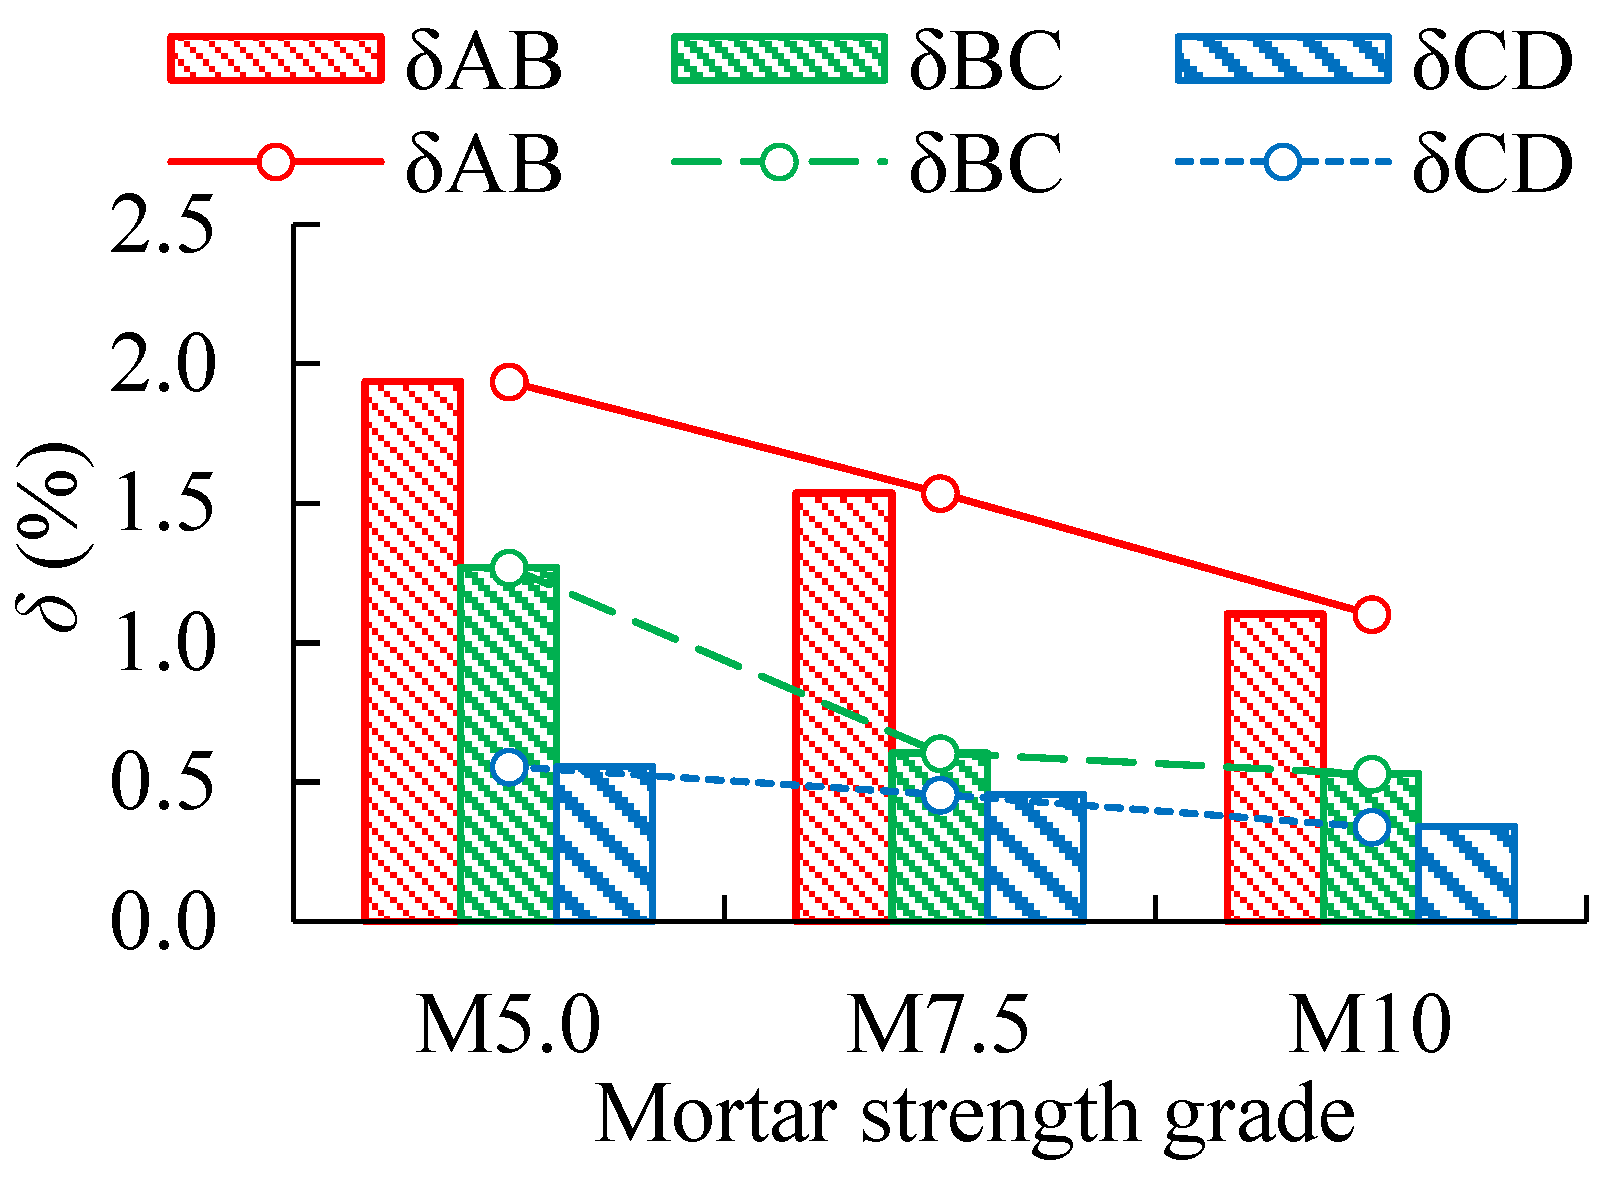
Using CEDM as an example, the increase in δ of UMWs across four mortar strengths is compared. Based on the data in Table 6 and the trend shown in Figure 20, it is concluded that as the mortar strength grades increase, δ at four loading time points gradually decreases. This indicates that as the mortar strength grade increases, the dominant failure mode shifts progressively from shear-controlled to flexural-controlled. An increase in mortar strength is found to enhance the bond strength at the masonry unit–mortar interface, thereby improving both the load-bearing capacity and the ultimate displacement of the masonry. When the mortar strength grade is increased from M5 to M10, the maximum improvement in ultimate load across the four modeling methods ranges from 11.4% to 18.4%. The failure mode gradually shifts from shear-dominated to flexure-dominated. This trend is consistent with the findings reported by Jiao et al. [45]. Therefore, a reasonable increase in the mortar strength grade is considered effective in improving the overall mechanical performance of UMWs, thereby enhancing deformation capacity, shear strength, and seismic performance.
Table 6.
Increasing δ of UMWs under varying mortar strengths.
Figure 20.
Increasing δ under varying mortar strength grades.
5. Conclusions
(1) Four FE modeling methods for UMWs are integrated: IM, CEDM, SEDM, and CNDM. A comparative analysis is conducted with the test results of UMW models from three existing studies. It is indicated by the analysis results that, when compared with the test results, the load–displacement curves obtained from four modeling methods show high consistency in terms of stiffness variation and ultimate load, thereby verifying the accuracy of FE modeling. Based on this, the applicable scope and a quantitative selection scheme for each modeling method are provided as follows: In terms of computational accuracy, the ranking from highest to lowest is CEDM, IM, SEDM, and CNDM. In terms of computational time, the ranking from shortest to longest is IM, CEDM, SEDM, and CNDM. In general, for macroscopic analyses such as risk assessment and the seismic retrofitting of UMWs, the use of IM is recommended as a priority. For the analysis of failure mechanisms and damage modes of UMWs, discrete models are considered more suitable. Researchers are advised to select the appropriate modeling method based on their specific conditions and analytical objectives.
(2) Through monotonic pushover analyses of UMW models under varying parameters such as aspect ratios, axial compression ratios, and mortar strength grades, the influence of these parameters on their mechanical performance is investigated. The results show that, compared with UMW at an aspect ratio of 0.5, the reduction in ultimate load is greatest at an aspect ratio of 1.25, with reductions ranging from 38.4% to 42.7%.
When the axial compression ratios increase from 0.1 to 0.8, the corresponding ultimate loads increase by up to 162.9–282.6% across four modeling methods. When mortar strength grades improve from M5 to M10, ultimate loads can increase by 11.4–18.4% across four modeling methods. In summary, when designing and assessing UMWs, the synergistic effects of geometric dimensions, stress states, and material properties should be considered comprehensively. The aspect ratio should be reasonably selected and kept below 0.75 to ensure the shear energy dissipation mechanism; when the aspect ratio exceeds 1.0, special attention should be paid to verifying flexural deformation. An appropriate axial compression ratio and mortar strength are selected, with the axial compression ratio preferably chosen within the range of 0.3–0.7 to balance load-bearing capacity and ductility; when the axial compression ratio exceeds 0.7, the increase in load-bearing capacity is found to diminish, and the risk of brittle failure is considered to increase. Mortar strength grade M7.5 is considered to offer optimal cost-effectiveness. This provides a reference for the seismic design and risk assessment of masonry structures.
(3) By integrating crack cloud maps, stress cloud maps, and the proposed strength index δ based on varying loading time points in the load–displacement curves, an in-depth discussion of the damage mechanism and failure modes of UMWs is conducted. The results show that flexural failure is characterized by the development of horizontal cracks at the bottom of UMW, while shear failure exhibits typical diagonal, penetrating, inclined cracks. The accuracy of crack simulation in UMWs is verified by comparing the theoretically calculated first principal stress σ1 with the masonry tensile strength f. From observations of stress contour plots and δ, the damage mechanism and failure modes of UMWs are revealed: a continuous high-stress band forms in the horizontal region at the wall base and along the diagonal, creating a stress failure surface that triggers cracking and reduces bearing capacity. Moreover, with increasing aspect ratios and mortar strengths and decreasing axial compression ratios, the stress concentration regions in the stress cloud maps gradually shift from an inclined to a horizontal distribution, while δ progressively decreases across four loading time points. Under these conditions, failure mode transitions from being initially dominated by shear failure, then by flexural–shear composite failure, and finally by flexural failure dominance. Conversely, the opposite trend leads to a gradual shift toward shear-dominated failure. Based on the relative magnitude of the strength index δ, the potential failure mode of UMW can be predicted at the design stage, and corresponding shear or flexural reinforcement strategies can be selected accordingly.
(4) The following limitations are noted in this study: FE models are mainly established for UMWs without openings, and walls with tie beams or constructional columns as well as walls with openings are not discussed; the quantitative judgment based on the strength index δ is conducted using the relative magnitude within the same parameter series, and a unified absolute threshold has not yet been established. In response to the above limitations, future research directions can be pursued from the following aspects: the validation database can be expanded to include more cases with different failure modes, walls with openings, and cyclic loading conditions; the quantitative system of the strength index δ can be further improved; and the applicability of this strength index to walls with tie beams, constructional columns, and openings can be further investigated so that its engineering application scope can be extended.
Author Contributions
Y.L. (Yonggang Liu): Investigation, Writing—Original Draft, Formal Analysis, Data Curation, and Validation; H.G.: Conceptualization, Formal Analysis, and Visualization; W.W.: Conceptualization, Formal Analysis, and Visualization; S.C.: Conceptualization, Formal Analysis, and Visualization; Y.L. (Yan Liu): Conceptualization and Formal Analysis. J.W.: Conceptualization, Investigation, Formal Analysis, Writing—Review and Editing, Visualization, Funding Acquisition, and Supervision. All authors have read and agreed to the published version of the manuscript.
Funding
This work is mainly supported by the Chunhui Plan Project of the Ministry of Education, China (Grant No. HZKY20220241).
Data Availability Statement
The data presented in this study are available on request from the corresponding author.
Conflicts of Interest
Authors Wenlong Wei and Shuo Chen were employed by the company Third Highway Engineering Co., Ltd., China Communications Construction Company Limited. The remaining authors declare that the research was conducted in the absence of any commercial or financial relationships that could be construed as a potential conflict of interest.
References
- Chourasia, A.; Singhal, S.; Parashar, J. Experimental investigation of seismic strengthening technique for confined masonry buildings. J. Build. Eng. 2019, 25, 100834. [Google Scholar] [CrossRef] [Scilit]
- Azizi-Bondarabadi, H.; Mendes, N.; Lourenço, P.B.; Sadeghi, N.H. Empirical seismic vulnerability analysis for masonry buildings based on school buildings survey in Iran. Bull. Earthq. Eng. 2016, 14, 3195–3229. [Google Scholar] [CrossRef] [Scilit]
- Fang, L.; Liang, J.G. Failure criterion for masonry under combined loads and shear strength of masonry wall. Eng. Mech. 2012, 29, 263–267. [Google Scholar] [CrossRef]
- Thomas, S.F.; Bennet, K. Nonlinear Finite Element Analysis of Unreinforced Masonry Walls. Appl. Mech. Mater. 2016, 857, 142–147. [Google Scholar] [CrossRef] [Scilit]
- Cundari, A.G.; Milani, G. Homogenized and Heterogeneous Limit Analysis Model for Pushover Analysis of Ancient Masonry Walls with Irregular Texture. Int. J. Archit. Herit. 2013, 7, 303–338. [Google Scholar] [CrossRef] [Scilit]
- Koksal, H.O.; Doran, B.; Kuruscu, A.O.; Kocak, A. Elastoplastic Finite Element Analysis of Masonry Shear Walls. KSCE J. Civ. Eng. 2016, 20, 784–791. [Google Scholar] [CrossRef] [Scilit]
- Macorini, L.; Izzuddin, B.A. A non-linear interface element for 3D mesoscale analysis of brick-masonry structures. Int. J. Numer. Methods Eng. 2011, 85, 1584–1608. [Google Scholar] [CrossRef] [Scilit]
- Milani, G. Simple homogenization model for the non-linear analysis of in-plane loaded masonry walls. Comput. Struct. 2011, 89, 1586–1601. [Google Scholar] [CrossRef] [Scilit]
- Zhang, S.; Yang, D.; Sheng, Y.; Garrity, S.W.; Xu, L. Numerical modelling of FRP-reinforced masonry walls under in-plane seismic loading. Constr. Build. Mater. 2017, 134, 649–663. [Google Scholar] [CrossRef] [Scilit]
- Brasile, S.; Casciaro, R.; Formica, G. Finite element formulation for nonlinear analysis of masonry walls. Comput. Struct. 2009, 88, 135–143. [Google Scholar] [CrossRef] [Scilit]
- Mohammadamin, N. An equivalent truss model for in-plane nonlinear analysis of unreinforced masonry walls. Civ. Eng. J. 2018, 4, 828–851. [Google Scholar] [CrossRef] [Scilit]
- Dolatshahi, K.M.; Aref, A.J. Two-dimensional computational framework of meso-scale rigid and line interface elements for masonry structures. Eng. Struct. 2011, 33, 3657–3667. [Google Scholar] [CrossRef] [Scilit]
- Wu, B.; Dai, J.; Huan, J.; Bai, W.; Chen, B. Numerical simulation on the seismic performance of retrofitted masonry walls based on the combined finite-discrete element method. Earthq. Eng. Eng. Vib. 2023, 22, 777–805. [Google Scholar] [CrossRef] [Scilit]
- Parisi, F.; Balestrieri, C.; Asprone, D. Nonlinear micromechanical model for tuff stone masonry: Experimental validation and performance limit states. Constr. Build. Mater. 2016, 105, 165–175. [Google Scholar] [CrossRef] [Scilit]
- Petracca, M.; Pelà, L.; Rossi, R.; Zaghi, S.; Camata, G.; Spacone, E. Micro-scale continuous and discrete numerical models for nonlinear analysis of masonry shear walls. Constr. Build. Mater. 2017, 149, 296–314. [Google Scholar] [CrossRef] [Scilit]
- Casalegno, C.; Cecchi, A.; Reccia, E.; Russo, S. Heterogeneous and continuous models: Comparative analysis of masonry wall subjected to differential settlements. Compos. Mech. Comput. Appl. Int. J. 2013, 4, 187–207. [Google Scholar] [CrossRef] [Scilit]
- Bomben, L.; Macorini, L.; Chisari, C.; Izzuddin, B.A. Mesoscale and macroscale modelling for nonlinear analysis of masonry wall structures under cyclic loading. Structures 2025, 82, 110209. [Google Scholar] [CrossRef] [Scilit]
- Akcan, S.O.; Kılıç, S.A.; Bal, I.E.; Yalçın, M.C. Comparison of numerical modeling methods for simulating failure in the in-plane response of unreinforced masonry walls. Eng. Fail. Anal. 2025, 182, 110156. [Google Scholar] [CrossRef] [Scilit]
- Khorami, N.; Nikkhoo, A.; Sadollah, A.; Permanoon, A.; Hejazi, F. Computational Time Reduction in Meso-Scale Masonry Structure Analysis by Nonlinear Topology Optimization Methods. Int. J. Civ. Eng. 2025, 23, 1263–1286. [Google Scholar] [CrossRef] [Scilit]
- Prosperi, A.; Longo, M.; Korswagen, P.A.; Giardina, G.; Rots, J.G. Comparative study of NLFE models for simulating settlement-induced damage in masonry façades: Macro- and simplified micro-models. Front. Built Environ. 2025, 11, 1618329. [Google Scholar] [CrossRef] [Scilit]
- Liu, G.Q.; Shi, Z.Y.; Liu, Y.L. Analyses of the elastic modulus values of masonry. J. Hunan Univ. (Nat. Sci. Ed.) 2008, 35, 29–32. Available online: http://dianda.cqvip.com/Qikan/Article/Detail?id=27004276 (accessed on 26 February 2026).
- Yang, W.Z. The constitutive relationship model of masonry in compression. Build. Struct. 2008, 38, 80–82. [Google Scholar] [CrossRef]
- Wu, B.Y.; Dai, J.W.; Wen, B.; Yang, Y.Q. Triaxial elastoplastic damage constitutive model of unreinforced clay brick masonry wall. Earthq. Eng. Eng. Vib. 2023, 22, 157–172. [Google Scholar] [CrossRef] [Scilit]
- Liu, W.; Ping, L.T.; Peng, X. Study of constitution relationship model for masonry under axial compression. Adv. Mater. Res. 2010, 168–170, 762–767. [Google Scholar] [CrossRef] [Scilit]
- Kumar, N.; Barbato, M. New constitutive model for interface elements in finite-element modeling of masonry. J. Eng. Mech. 2019, 145, 04019022. [Google Scholar] [CrossRef] [Scilit]
- Toti, J.; Gattulli, V.; Sacco, E. Nonlocal damage propagation in the dynamics of masonry elements. Comput. Struct. 2015, 152, 215–227. [Google Scholar] [CrossRef] [Scilit]
- Meftah, S.A.; Aldosari, S.M.; Tounsi, A.; Le, K.T.C.; Mohamed, K.; Alluqmani, A.E. Simplified homogenization technique for nonlinear finite element analysis of in-plane loaded masonry walls. Eng. Struct. 2024, 306, 117822. [Google Scholar] [CrossRef] [Scilit]
- Sacco, E. A nonlinear homogenization procedure for periodic masonry. Eur. J. Mech. A Solids 2008, 28, 209–222. [Google Scholar] [CrossRef] [Scilit]
- Amjad, J.; Kiarash, M.; Dolatshahi, M.K. A three-dimensional cyclic meso-scale numerical procedure for simulation of unreinforced masonry structures. Comput. Struct. 2013, 120, 9–23. [Google Scholar] [CrossRef] [Scilit]
- Xie, Z.; Sousa, M.; Messali, F.; Rots, J.G. A sub-stepping iterative constitutive model for cyclic cracking-crushing-shearing in masonry interface elements. Comput. Struct. 2021, 257, 106654. [Google Scholar] [CrossRef] [Scilit]
- Shen, J.; Ren, X.; Zhang, Y.; Chen, J. Slip-enhanced plastic-damage constitutive model for masonry structures. Eng. Struct. 2022, 254, 113792. [Google Scholar] [CrossRef] [Scilit]
- Yu, N.; Abdul, S.; Michael, G.; Visintin, P. A damage-plasticity based interface model for simulating in-plane/out-of-plane response of masonry structural panels. Comput. Struct. 2022, 260, 106721. [Google Scholar] [CrossRef] [Scilit]
- Kömürcü, S. A comprehensive numerical study on examining the failure mechanisms of masonry walls via continuous micro modeling. Eng. Fail. Anal. 2025, 177, 109680. [Google Scholar] [CrossRef] [Scilit]
- Baraldi, D.; Cecchi, A.; Tralli, A. Continuous and discrete models for masonry like material: A critical comparative study. Eur. J. Mech. A Solids 2015, 50, 39–58. [Google Scholar] [CrossRef] [Scilit]
- Yavartanoo, F.; Kang, J.; Kang, T.H.K. Numerical parametric study of dry-stack masonry walls with varied dimensional and loading configurations. Structures 2024, 61, 106050. [Google Scholar] [CrossRef] [Scilit]
- Chaimae, K.; Younes, R.E.; Ouadia, M.; Shamass, R. Finite element simulation of masonry wall behaviour: Exploring various brick bonds and load conditions. Structures 2025, 77, 109089. [Google Scholar] [CrossRef] [Scilit]
- Bilge, D.; Karslioglu, M.; Unsal, A.Z.; Vatansever, C. Experimental and numerical investigation of unreinforced masonry walls with and without opening. Int. J. Archit. Herit. 2023, 17, 1833–1854. [Google Scholar] [CrossRef] [Scilit]
- Radnić, J.; Smilović, M.; Sunara, M.; Buklijaš-Kobojević, D. Numerical study of the behaviour of masonry walls with different height-length ratio under static and seismic loads. Mater. Und Werkst. 2015, 46, 330–347. [Google Scholar] [CrossRef] [Scilit]
- Sandoval, C.; Roca, P.; Bernat, E.; Gil, L. Testing and numerical modelling of buckling failure of masonry walls. Constr. Build. Mater. 2011, 25, 4394–4402. [Google Scholar] [CrossRef] [Scilit]
- Haach, V.G.; Vasconcelos, G.; Lourenço, P.B. Parametrical study of masonry walls subjected to in-plane loading through numerical modeling. Eng. Struct. 2011, 33, 1377–1389. [Google Scholar] [CrossRef] [Scilit]
- Jing, D.H.; Ye, C.X.; Hu, S.G. Experimental research on the axial compressive performance of brick masonry walls strengthened with a steel plate frame considering initial load. Structures 2024, 70, 107724. [Google Scholar] [CrossRef] [Scilit]
- Blash, A.A.A.; Abu Bakar, B.H.; Udi, J.U.; Dabbour, B.S.A.; Jaafar, A.Y.; Li, Y.; Rashed, M. Performance of Unreinforced Masonry Walls in Compression: A Review of Design Provisions, Experimental Research, and Future Needs. Appl. Sci. 2023, 13, 132212306. [Google Scholar] [CrossRef] [Scilit]
- Tatheer, Z.; Thamboo, J.; Mohammad, A.; Song, M. Analytical stress-strain model of reinforced concrete masonry wallettes under axial compression. Structures 2021, 34, 2922–2935. [Google Scholar] [CrossRef] [Scilit]
- Pan, J.L.; Shen, Z.J.; Zhong, L.Z.; Xia, Y.; Li, X.D.; Zhang, Y.Q. Damage evolution and failure mechanism of masonry walls under in-plane cyclic loading. Eng. Fail. Anal. 2024, 161, 108240. [Google Scholar] [CrossRef] [Scilit]
- Jiao, Z.Z.; Wang, Y.; Zheng, W.Z.; Huang, W.X.; Zhao, Y.J. Bond properties of alkali-activated slag concrete hollow block masonry with different mortar strength grades. Constr. Build. Mater. 2019, 216, 149–165. [Google Scholar] [CrossRef] [Scilit]
- Ministry of Housing and Urban-Rural Development of the People’s Republic of China. Code for Design of Masonry Structures; China Architecture & Building Press: Beijing, China, 2011. [Google Scholar]
- Shi, C.X. Theory and Design of Masonry Structures; China Architecture & Building Press: Beijing, China, 2003. [Google Scholar]
- Guo, Z.H.; Shi, X.D. Principles and Analysis of Reinforced Concrete; Tsinghua University Press: Beijing, China, 2003. [Google Scholar]
- Shang, S.P.; Lei, M.; Feng, J.C.; Yue, X.Y. Experimental study on shear behavior and finite element analysis of row lock wall. Earthq. Eng. Eng. Dyn. 2013, 33, 88–96. [Google Scholar] [CrossRef]
- Li, X.Q.; Li, K.R.; Zhang, T.; Xu, W.; Liang, L.M. Experimental study on seismic performance of masonry wall strengthened with sprayed ECC. J. Vib. Shock 2025, 44, 251–258. [Google Scholar] [CrossRef]
- Zhou, X.J.; Kou, X.Y.; Cui, J.T.; Liu, Z.X. Seismic performance test and nonlinear finite element analysis of hollow block walls. J. Basic Sci. Eng. 2019, 27, 341–358. [Google Scholar] [CrossRef]
- Zhang, S.; Xu, L.H.; Hu, X.B. Seismic performance of masonry wall strengthened with BFRP. Eng. J. Wuhan Univ. 2015, 48, 294–299. [Google Scholar] [CrossRef]

Disclaimer/Publisher’s Note: The statements, opinions and data contained in all publications are solely those of the individual author(s) and contributor(s) and not of MDPI and/or the editor(s). MDPI and/or the editor(s) disclaim responsibility for any injury to people or property resulting from any ideas, methods, instructions or products referred to in the content. |
© 2026 by the authors. Licensee MDPI, Basel, Switzerland. This article is an open access article distributed under the terms and conditions of the Creative Commons Attribution (CC BY) license.