Skip to Content
BuildingsBuildings
  • Article
  • Open Access

3 April 2026

Status of Building Information Modelling (BIM) in a Developing Economy: A Case Study of Malawi

,
and
1
School of Engineering, Malawi University of Business and Applied Sciences, Private Bag 303, Chichiri, Blantyre 3, Malawi
2
School of Built Environment, Malawi University of Business and Applied Sciences, Blantyre 3, Malawi
*
Author to whom correspondence should be addressed.

Abstract

Building Information Modeling (BIM) has changed the landscape of the architectural, engineering, and construction (AEC) industry in recent decades. However, BIM is not well researched in most developing countries; in particular, few studies have addressed its adoption in Malawi. A non-probability, purposive sampling approach was adopted. A total of 143 questionnaires were completed. This research reveals that, while construction experts are aware of BIM, the level of uptake remains quite low. Architects in Malawi are the most knowledgeable, followed by land surveyors and then engineers. This research shows that most experts in Malawi are at level 1 of BIM usage, which is the first stage of BIM adoption and is characterized by the use of 3D models and output representation. Furthermore, the study results have shown that the Malawian AEC sector is currently succeeding at the modelling stage of maturity but is stalled by lack of collaborative frameworks, such as Integrated Project Delivery (IPD). Therefore, unless the industry shifts toward a unified Common Data Environment (CDE), advanced capabilities like clash detection will remain underutilized and disconnected from broader project success metrics. Statistical analysis has shown that the correlation analysis demonstrates a strong link (r = 0.75) between Integrated Project Delivery (IPD) and high BIM maturity, whereas traditional Design-Bid-Build methods show a critical misalignment with digital workflows. The study identifies high software costs and a lack of national standards as the primary barriers to adoption. Therefore, there is a need for robust sensitization to the benefits of BIM and training to improve its uptake in the context of Malawi’s construction industry. In order to advance Malawi’s BIM maturity, the research recommends a strategic shift toward integrated procurement models, the establishment of national BIM mandates, and the modernization of technical education to bridge the existing knowledge gap.

1. Introduction

The global development of Building Information Modeling (BIM) shows clear differences between developed and developing countries. Studies indicate that developed countries have made significant progress in adopting and institutionalizing BIM, while developing countries continue to lag behind in terms of maturity, standards, and integration into mainstream project delivery [1]. Research has revealed greater progress and achievements in the use of BIM in developed countries when compared to developing countries [2].
In developing countries like Malawi, Small- and medium-scale contractors (SMCs) contribute substantially to the construction industry in Malawi [3]. According to the Roads Authority, 1327 out of a total 1368 small- to medium-scale contracts were fulfilled by SMCs between the 2007/2008 and 2010/2011 fiscal years (FYs), representing 97% of the work undertaken during this period. However, these SMCs face several challenges. The most common are high lending interest levels offered by financial institutions, tough conditions to secure capital, fluctuations in currency, rigid requirements for buying bonds, and excessive taxes [3]. These challenges affect the capacity and inhibit the growth potential of these SMCs.
At the project implementation level, the construction industry faces many challenges too. Some of the major challenges are a lack of a project communication strategy, no participation of stakeholders, low project output, and many mistakes, which require reworking [4]. According to the Roads Authority, the major project implementation challenges are sub-standard work, time overruns, and poor bids [3]. According to Chagunda [5], the challenges faced by the Malawian roads sector include design errors, design changes, delayed site handovers, increased quantities, devaluation of the currency, abnormal rainfall, missing BOQ items, additional work, change of supervision consultant, delayed payment, limited payments, non-availability of fuel, breakdown of plant and vehicles, delayed approval of designs, delayed approval of addendum, non-availability of base gravel, delays in evaluating and agreeing on claims, tendering procedures, and contractor delays and variations. These result in overall poor project output and affect the intended project aims and objectives [6].
Another area of concern is the slow uptake of the use of sustainable construction practices (SCPs). The National Construction Industry Policy was produced in 2015, in line with the establishment of the NCIC Act. The objective of the policy was to ensure a rebranded, sustainable, and quality-based construction industry in Malawi. Therefore, the policy direction was to lay out the common guidelines for operationalizing sustainable practices in infrastructure projects in the country. However, the major challenge in the low adoption and implementation of the policy has been poor dissemination and awareness, which has impeded the proper implementation of sustainable-oriented infrastructure projects [7]. This low adoption and implementation of the policy has resulted in the construction of non-climate-resilient infrastructure in the country. This is exacerbated by the high poverty levels in the country, which drive locals to use cheap construction materials such as mud mortar instead of cement. This results in very weak houses that are prone to natural disasters [8]. This is a typical example of how policies are failing to meet the challenges on the ground. As stated by Malik et al. [9], the major challenges in implementing sustainable practices in Malawi are a lack of knowledge on the availability of sustainable building products, the high cost of products, and the high cost of the construction process when using the products.
Considering these challenges collectively, it is evident that a paradigm shift is required in Malawi’s construction industry to improve efficiency. Given that public resources are limited and project implementation faces numerous constraints, the need for innovative, robust, and effective project management systems in the construction sector cannot be overemphasized. Therefore, adopting tools such as Building Information Modeling (BIM) can help ensure the efficient use of the limited public resources available in the sector. Studies have shown that, in addition to increasing productivity, the use of BIM improves the quality of design outputs and enhances the implementation of construction activities [10]. According to McGraw-Hill Construction [11], architectural, engineering, and construction (AEC) experts have indicated the following long-term benefits of BIM use: reduced project costs, reduced project delays, and increased profits for construction companies. In other studies, most AEC professionals have described project cost reduction and reduced project implementation period (85% and 88%, respectively) as major benefits of using BIM in complex projects [10]. Additionally, several studies have found that using BIM improves project success rate and quality of output both at the task level and in terms of overall project deliverables [12].
BIM has been widely recognized internationally as a tool capable of improving design quality, reducing errors, minimizing rework, enhancing coordination, strengthening risk management, and lowering project costs and delays. Research from other contexts shows that BIM enhances productivity, supports better information management, improves stakeholder collaboration, and contributes to sustainable construction outcomes. At both corporate and project levels, BIM adoption has been associated with improved competitiveness, reduced claims and litigation, better scheduling (4D), accurate quantity take-offs, and enhanced facility management.
While BIM has received growing academic attention in the Malawian Construction Industry (MCI), a clear research gap remains: there is little empirical evidence on the actual state of BIM modelling practice in the country. Most existing studies have focused on identifying and ranking factors that influence BIM implementation, particularly technological infrastructure, organizational readiness, and process-related challenges [13,14,15]. Although these studies provide useful insights into perceived drivers and barriers, they are largely based on practitioners’ opinions about BIM rather than evidence of how BIM is practically used in projects. As a result, there is limited understanding of the maturity and depth of BIM modelling workflows in Malawi. For example, there is little documented evidence on whether firms are moving from 2D CAD drafting to 3D parametric modelling, whether Common Data Environments (CDEs) are being used for collaboration, or whether international standards such as ISO 19650 are being followed. In addition, BIM maturity levels (Level 0–3) and Level of Development (LOD) in local projects have not been systematically assessed. Without mapping these baseline modelling capabilities, discussions about implementation drivers and policy reforms risk being disconnected from the industry’s actual technical capacity. In other words, recommendations may be too advanced for an industry whose modelling competencies are not yet clearly understood. Therefore, a significant research gap exists in conducting an empirical, maturity-focused assessment of BIM modelling practice in Malawi. Thus, if this gap is addressed, the current study would provide a realistic foundation for policy development, training programs, and strategic BIM implementation in the MCI.
This study seeks to make several unique contributions to BIM literature in the Malawian context. First, it provides empirical quantification of BIM engagement levels using standardized indices of implementation depth, proficiency, and experience, addressing the gap left by previous readiness studies that primarily report moderate awareness but limited adoption. The limited research that has been carried out on BIM in Malawi covers the readiness of organizations to use BIM, critical factors for its implementation for public projects, challenges related to its implementation, and drivers of its implementation [13,14,15,16]. The available studies have indeed characterized the use of BIM as being in its evolving stage. While there are a few studies that have been implemented in the country, there is a dearth of literature that goes beyond awareness to capture the depth of practical operation of the BIM modelling. A study on this would bring a complete understanding of the status of the BIM capability.
Second, by linking proficiency and use patterns, the study analytically identifies critical skills gaps that constrain meaningful BIM uptake, an advancement over descriptive barrier lists. Since BIM adoption in Malawi is in its infancy stage [15], identifying factors that hinder the adoption would characterize the human capital domain necessary for enhancing the efficiency of the BIM. While previous studies have listed skills gaps as a barrier, this study analytically investigates the relationship between professional capabilities and actual BIM usage patterns, providing evidence into one of the most influential adoption determinants. Third, it contextualizes widely cited global BIM benefits within a low-adoption environment, showing where expected advantages may not yet materialize. A large body of literature has cited several benefits of BIM across the globe. Since the Malawian case is a scenario of infancy and low adoption, situating the Malawian case in the global context would be key in enhancing full implementation of the BIM and its associated benefits. Fourth, the research systematically categorizes local implementation challenges into integration-, workflow-, and technology-related components, offering clearer priorities for intervention. Finally, the study offers evidence-based recommendations for capacity building and policy support grounded in Malawian empirical data.

2. Literature Review

2.1. Building Information Modeling (BIM)

Building Information Modeling (BIM) has evolved significantly over the past decades. Early studies from the 1990s to the early 2000s suggested that BIM, although not clearly defined at the time, had the potential to transform the construction sector in the long term [14]. Over the past decade, BIM has developed rapidly and has had a profound impact on the architectural, engineering, and construction (AEC) industry. This rapid evolution was predicted by Miettinen and Paavola [17], who argued that BIM would progress quickly through research, knowledge development, and the establishment of systems, guidelines, standards, and complementary software [15]. Consequently, BIM adoption has expanded beyond the building sector into horizontal infrastructure and asset management [14].
A key concept in BIM literature is BIM maturity, which refers to the quality, repeatability, and level of excellence in implementing BIM-enabled services or products [16]. The United Kingdom adopted the Bew–Richards model as a standard framework for BIM maturity classification [17]. This model defines four maturity levels ranging from Level 0 (basic CAD drawings) to Level 3 (full integration of BIM into project management processes) [18,19]. The maturity framework is important because it conceptualizes BIM adoption as a gradual progression rather than a single technological shift, highlighting the importance of organizational processes, collaboration, and information integration.
  • BIM Adoption in Developed economies
BIM adoption varies across countries depending on technological capacity, regulatory frameworks, and construction industry maturity. However, empirical evidence consistently shows that developed countries demonstrate higher BIM adoption levels than developing economies due to stronger institutional support, better digital infrastructure, and more established regulatory environments [18,19].
Early adopters such as the United States, the United Kingdom, Finland, Norway, Denmark, Hong Kong, Australia, and Singapore demonstrate how national policies and industry readiness can accelerate technological diffusion in the construction sector [20]. In many of these countries, government mandates and digital transformation strategies played a central role in normalizing BIM usage in both public and private construction projects. This policy-driven adoption created incentives for firms to invest in BIM software, training, and collaborative workflows.
More recently, BIM adoption has expanded in large construction markets such as China, the United States, and India. According to Prinsloo and Bekker [20], these countries have institutionalized BIM in public infrastructure projects due to efficiency gains, improved project coordination, enhanced design accuracy, and cost savings associated with BIM usage. This suggests that BIM adoption is often driven by efficiency gains and policy mandates rather than purely technological innovation.
An important analytical distinction in the literature is between BIM adoption and BIM implementation. Although these terms are often used interchangeably, they represent different stages of technological integration [21,22]. BIM adoption refers to the willingness or ability of professionals and firms to use BIM tools through technical expertise and practical application, whereas BIM implementation refers to the institutionalization of BIM through legislation, regulatory frameworks, and policy mandates that require its use in project delivery processes. This distinction is important because high levels of professional adoption do not necessarily translate into industry-wide implementation.
In practice, BIM adoption often occurs more rapidly in the private sector, particularly among consultants and contractors who face competitive pressures to improve efficiency and reduce project costs [11]. However, widespread industry adoption typically depends on supportive policies, regulatory mandates, and standardized guidelines. Without such institutional frameworks, BIM adoption may remain fragmented and limited to isolated firms or projects.
  • BIM Adoption in Africa
Africa’s adoption and application of BIM remains relatively slow compared with that of developed economies, suggesting that the diffusion of digital construction technologies on the continent is still in an early stage. Evidence from the literature indicates that scholarly engagement with BIM in Africa only began to emerge around 2010 [2]. Although the number of annual publications increased to 28 by 2018, the global surge in BIM-related research, this growth primarily reflects rising academic interest rather than widespread industry implementation. This distinction is important, as the expansion of research output does not necessarily imply equivalent progress in practical adoption across the construction sector.
The spatial distribution of BIM-related research across Africa further illustrates the uneven nature of technological diffusion on the continent. North Africa accounts for the largest share of publications, with 52 studies originating mainly from Egypt, Morocco, and Algeria. West Africa follows with 26 publications, largely from Nigeria, Ghana, and Côte d’Ivoire, while Southern Africa contributes 13 publications from South Africa and Zambia. Central Africa remains significantly underrepresented, with only two publications from Cameroon and the Central African Republic [2]. This pattern suggests that BIM research activity tends to concentrate in countries with relatively larger construction markets, stronger research institutions, and more developed digital infrastructure. Consequently, the regional imbalance in publications may reflect broader structural differences in technological capacity and institutional support for digital innovation within the construction industry.
Moreover, the countries with the highest number of BIM publications—such as Egypt, Nigeria, and South Africa, also report relatively higher levels of professional awareness of the technology [2]. This relationship indicates a feedback mechanism in which research activity contributes to awareness creation, while increased awareness stimulates further academic and professional engagement with BIM.
Despite these improvements in awareness, the transition from knowledge to practical implementation remains limited across much of Africa. In sub-Saharan Africa, for example, a study conducted in Kenya in 2018 reported a BIM awareness level of 88.7% among construction professionals [23]. Similarly, in Nigeria, awareness increased significantly from 30% in 2015 to 84% in 2021 [24,25]. South Africa shows a comparable trend, with awareness rising from 44% in 2014 to 91% in 2024 [20]. While these figures indicate a rapid expansion in professional familiarity with BIM, they also highlight a persistent gap between awareness and actual adoption.
  • Empirical Approaches to BIM Adoption Studies in Malawi
Research on BIM adoption in developing countries employs different methodological approaches. Most studies rely on questionnaire surveys to collect professionals’ opinions on the benefits and challenges of BIM adoption [20,21,22]. Other studies use case studies or longitudinal approaches to examine how BIM is implemented within organizations over time [23,24]. More recent studies combine quantitative and qualitative methods to better understand organizational culture, leadership, and teamwork in BIM implementation, particularly in resource-limited countries.
Ndwandwe et al. [14] used a survey of 189 respondents combined with descriptive statistics, one-sample t-tests, and factor analysis to rank challenge factors influencing BIM implementation. The study identified barriers such as lack of expertise, high implementation costs, weak legislative frameworks, procurement inefficiencies, software integration challenges, and limited awareness. However, the study primarily focused on perceptual data and did not analyze structural factors such as national policy frameworks, educational curricula, or comparative positioning within developing economies, which are important for characterizing BIM adoption status.
In Malawi, the literature indicates that BIM adoption is still occurring mainly at the individual firm level and is not well coordinated across the industry. Although many professionals are aware of BIM benefits, actual use in projects remains low due to limited training opportunities, lack of practical experience, and poor integration of BIM into existing workflows [10,12,25]. Comparative studies suggest that BIM adoption improves when firms have strong knowledge management systems and leadership support to guide implementation [26,27].
Recent studies have also adopted mixed-methods approaches. For example, Olawumi and Chan [21] combined surveys with case studies of African construction firms and found that leadership support and knowledge management significantly improve BIM implementation. Similarly, Khosrowshahi and Arayici [22] used longitudinal studies of small and medium-sized enterprises and found that long-term studies help identify adoption patterns and the role of institutional support, software compatibility, and workforce preparedness. These studies suggest that relying only on surveys may not be sufficient to understand BIM adoption and that mixed-method approaches provide deeper insights into adoption dynamics.
  • Status of BIM Adoption and Organizational Maturity in Malawi
Malawi is still at an early stage when it comes to BIM adoption, and the level of use is not the same across all firms or projects. Some bigger companies have access to BIM software, but they mostly use it for design visualization and simple clash detection. Other important areas, such as project planning and cost management, are still done manually in many cases [13,14,15]. Small and medium-sized firms face even more challenges because they often do not have the required technology or clear internal processes to use BIM properly. Similarly, Ariono et al. [23] adopt a systematic literature review (SLR) to identify BIM drivers, followed by a purposive questionnaire survey and weighted-mean analysis to rank critical enablers. The study advances theoretical discourse by proposing a conceptual framework and outlining policy and industry strategies. However, its analytical focus is primarily technological and process-oriented, emphasizing software interoperability, standardized datasets, data-exchange protocols, and knowledge resources. Although valuable in identifying enablers, the analysis does not systematically synthesize institutional gaps across regulatory systems, organizational maturity structures, or educational ecosystems.
Saka and Chan [24] further reinforce the organizational maturity perspective through a survey of 189 construction professionals. Their findings reveal moderate awareness of BIM and availability of BIM-capable software within firms, yet low levels of technical proficiency among practitioners. This indicates that access to digital tools does not automatically translate into effective adoption. However, like the preceding studies, their analysis is largely confined to firm-level dynamics and does not interrogate macro-level policy structures or curriculum depth.
The level of organizational readiness for BIM is not the same across all firms. A few leading companies are trying to follow more structured BIM processes, but most firms still work without clear workflows, proper coordination between different disciplines, or regular internal training programs. This suggests that simply having access to BIM technology is not enough. Successful adoption also depends on factors such as organizational culture, active leadership involvement, and how well knowledge is shared within the firm [25].
  • Comparative Positioning within Developing Economies
When it comes to using BIM, Malawi is behind its neighbors. Countries like Zambia and Benin have set up step-by-step plans and national assessments to guide BIM adoption, giving the construction industry a clear path to grow and use it more widely [25,26]. In Malawi, most BIM use comes from individual companies doing their own thing, which makes it hard for knowledge to spread or for the industry to learn. Research shows that having clear policies, shared standards, and cooperation between all the players is key to catching up with other countries and making digital construction work in the long run.
Research has shown that many countries in the initial stage of BIM adoption tend to use basic software. This is because, once an organization starts using BIM, gradual acquisition of relevant software is carried out based on need. The first stage is to improve the data management from the traditional method to the 3D production of output. The other BIM stages are implemented during the technology use.
  • Analytical Research Gap
Despite the growing body of literature on Building Information Modeling (BIM) adoption, several important gaps remain, particularly in the context of developing countries such as Malawi. Much of the existing literature focuses primarily on BIM awareness, perceived benefits, and barriers to adoption, with limited attention given to organizational maturity and the progression of firms across BIM maturity levels. As a result, while awareness levels are relatively well documented, the extent to which organizations have developed structured BIM workflows, collaboration systems, and integrated project management processes remains insufficiently examined. Most studies analyze BIM adoption at the firm or professional level, often overlooking the broader institutional environment, including national policies, regulatory frameworks, procurement systems, and industry standards that influence industry-wide implementation. Although several studies exist on BIM adoption in Africa, very few studies position Malawi within the broader BIM adoption trajectory of developing economies, making it difficult to assess whether Malawi is progressing at a similar pace to comparable countries. Furthermore, the methodological approaches in many BIM adoption studies rely heavily on perception-based surveys, which identify barriers and enablers but do not fully explain organizational behavior, institutional constraints, and long-term adoption patterns.

2.2. The Conceptual Framework

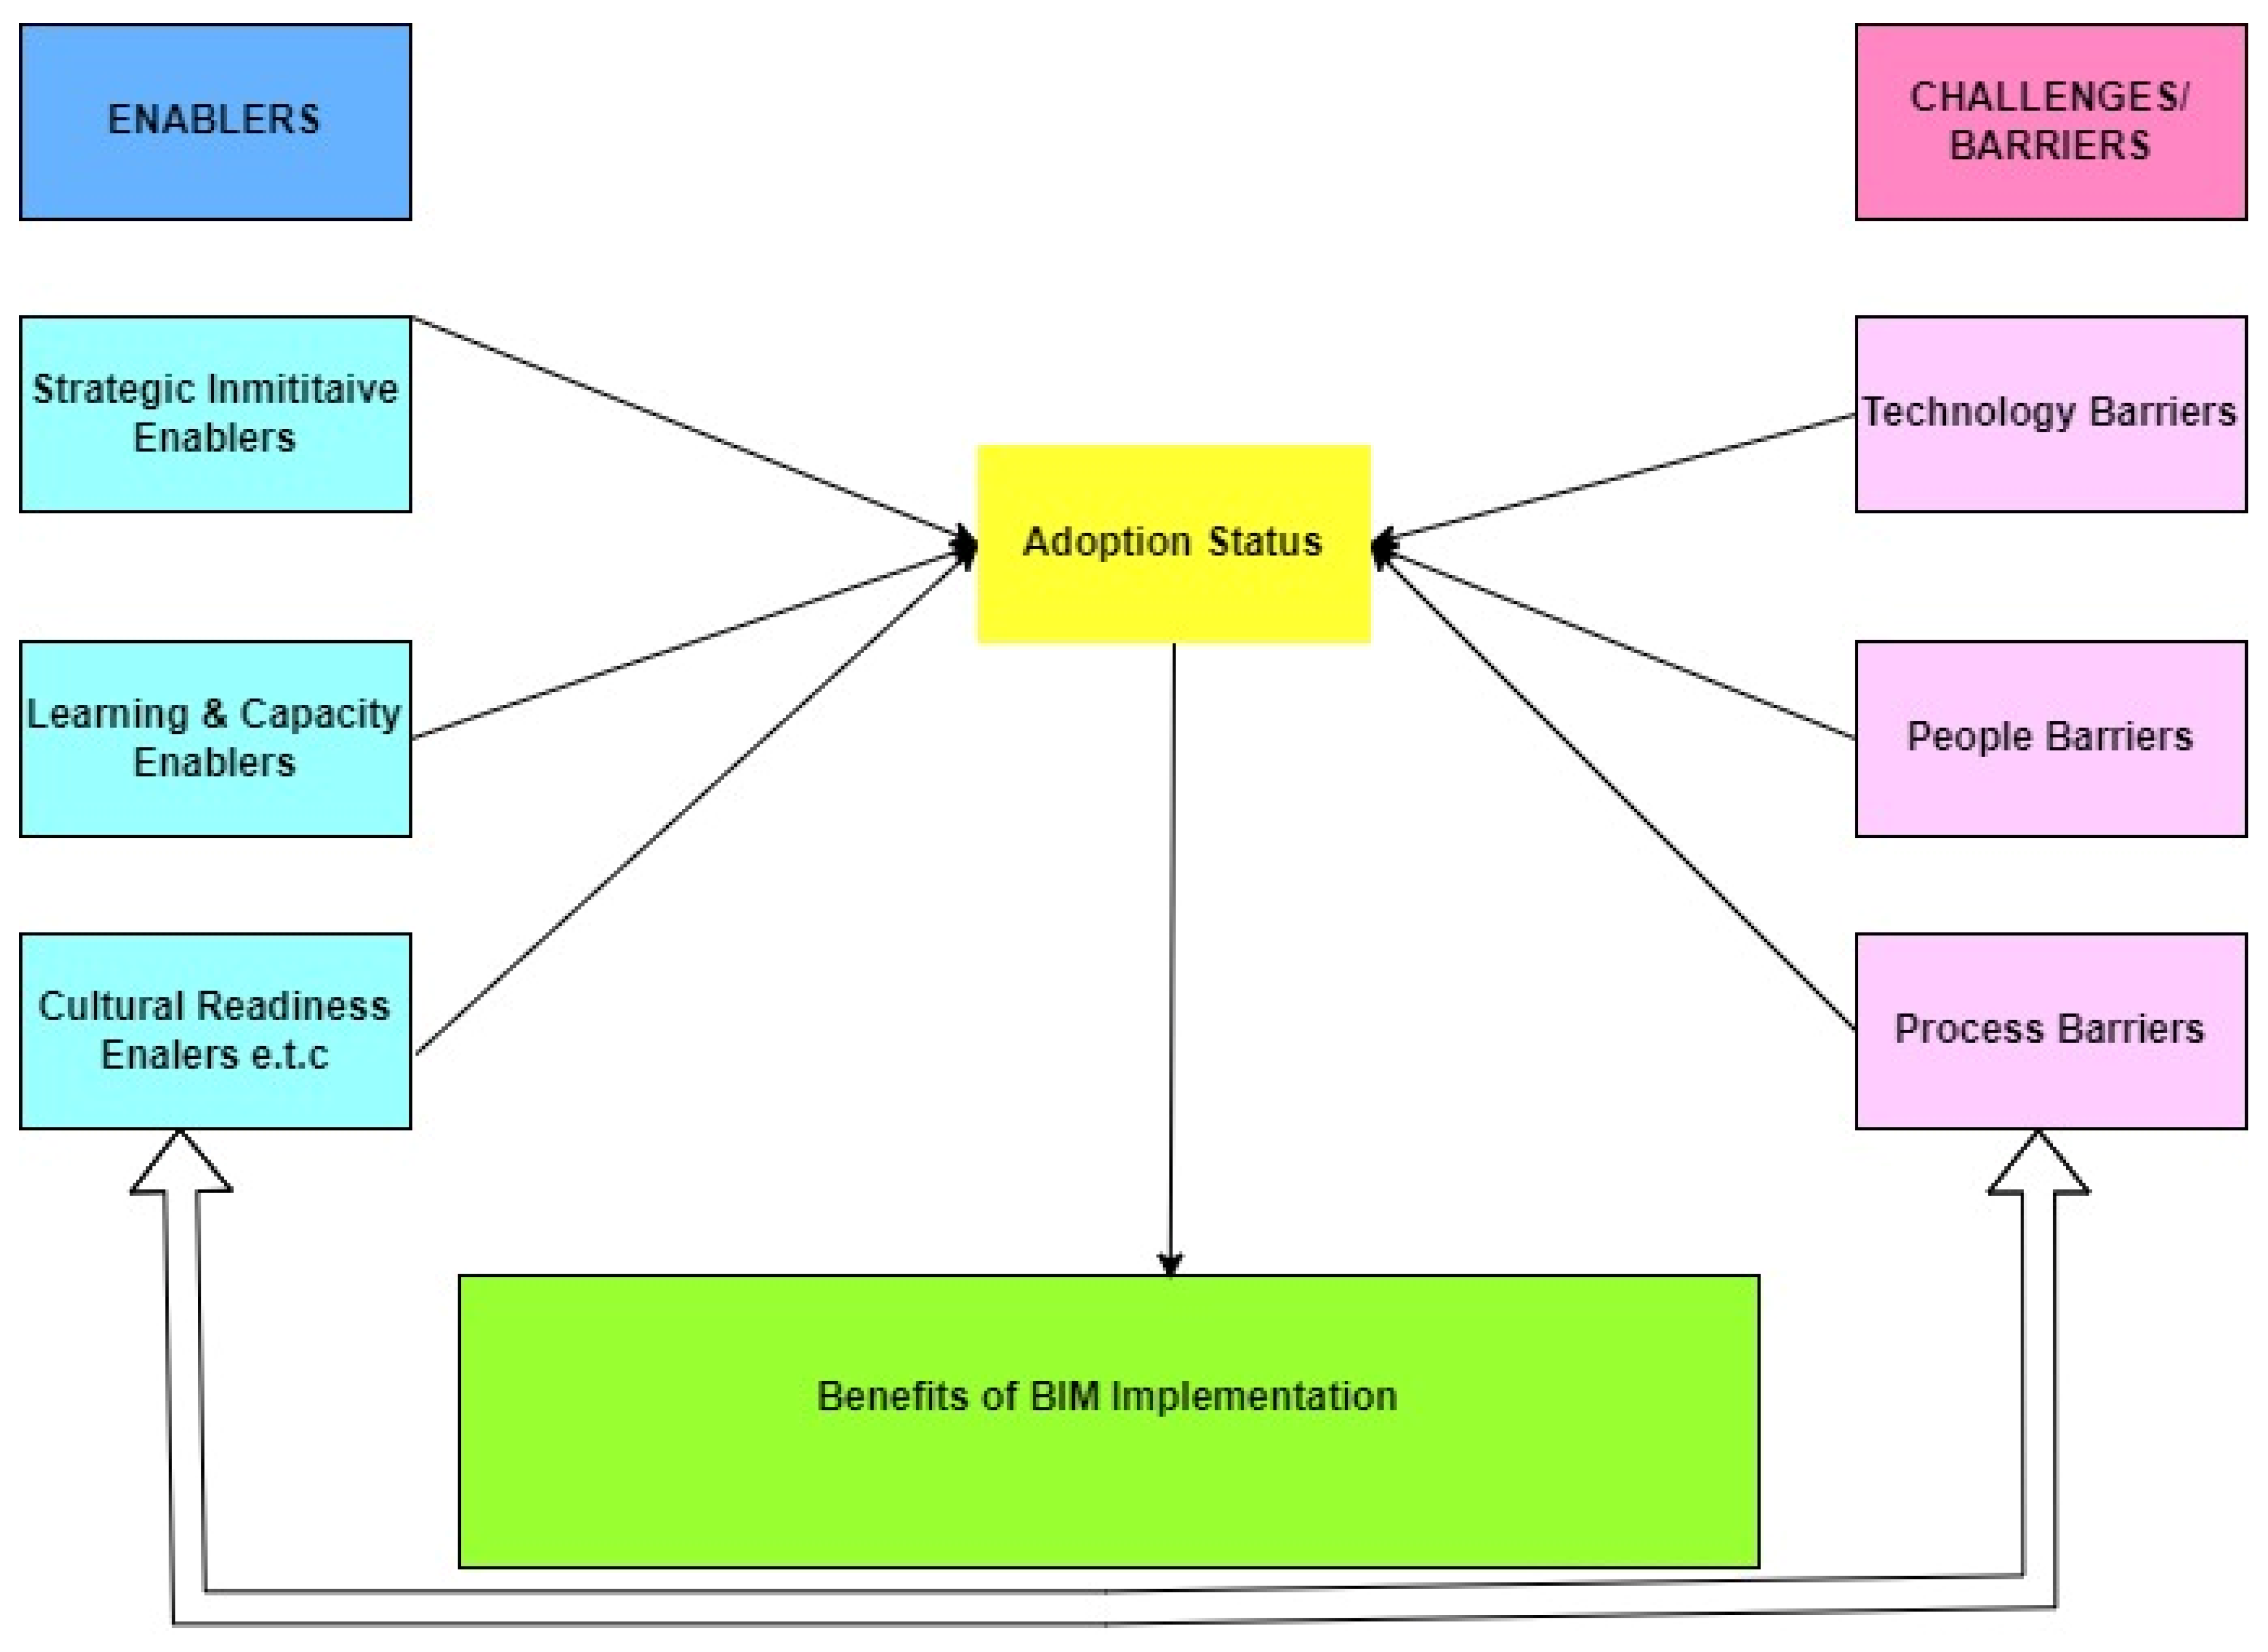
This conceptual framework presents the operationalization of BIM. As stated by Succar & Kassem [27], BIM implementation is basically an organizational innovation and is subject to the influence of the individual, institutional, and environmental setup of an organization. Additionally, this operationalization of BIM is affected by its enablers, challenges, and associated benefits [28,29,30]. Abbasnejad et al. [29] studied a list of 33 BIM implementation enablers. These were categorized into seven categories of strategic initiative enablers, learning capacity enablers, cultural readiness enablers, IT leveragability and knowledge, network relationship enablers, change management enablers, and process and performance management enablers [29]. On the other hand, Wong et al. [31] categorized BIM adoption challenges into three main groups of technology barriers, people barriers, and process barriers. Therefore, an understanding of the barriers to BIM adoption can facilitate finding solutions to BIM adoption on projects that will translate to a widespread BIM adoption at a continuous and consistent pace [32]. Similarly, the benefits of BIM adoption influence the adoption of technology. Conversely, a lack of awareness of BIM benefits can also be a barrier to BIM adoption [33,34]
  • BIM Enablers
Enablers are drivers of BIM uptake. The very first aspect relates to the IT leveragability and knowledge, which presents the prerequisites for BIM adoption. In developing countries like Malawi, the key enablers include the availability of BIM software, especially those supporting industry foundation classes, and the presence of basic digital infrastructure [16]. These are reliable high-speed internet and cloud-based data storage. Recent studies have emphasized that the effectiveness of these technologies depends on a conceptual shift from viewing BIM merely as a three-dimensional visualization tool to recognizing it as an integrated tool throughout the entire lifecycle [35].
In addition to software availability, digital infrastructure plays a critical role. Reliable broadband connectivity, cloud-based data storage systems, and adequate computing hardware are necessary for real-time model sharing, remote collaboration, and secure data management. However, in many low-income contexts, inconsistent internet access and limited ICT investment constrain the practical use of BIM, especially outside major urban centers [36]. Thus, establishing status is very important in scaling up its adoption.
  • Organizational Readiness and Challenges
The framework identifies organizational capacity as the most volatile component influencing BIM adoption. Although BIM offers substantial benefits, including improved clash detection and reduced material waste, many firms in developing regions, particularly Small and Medium Enterprises (SMEs), experience significant post-adoption barriers. These arise when the high costs of software licensing, hardware upgrades, and continuous training outweigh perceived short-term gains [37]. In addition, organizational maturity is often constrained by skilled labor migration and resistance to change, as employees tend to favor familiar two-dimensional workflows over the steep learning curve associated with BIM technologies [38,39].
  • Environmental and Regulatory Drivers
The environmental dimension of the framework highlights the influence of external institutional and policy pressures. In developing economies, government intervention remains the most significant driver of BIM diffusion, particularly through the introduction of mandatory BIM requirements in public infrastructure projects [24,40]. Such mandates generate a cascading effect that compels private-sector actors and supply chains to adopt digital practices. However, the absence of comprehensive national BIM standards continues to pose a major challenge. This regulatory gap often results in fragmented implementation, with stakeholders operating under incompatible data formats and operational protocols.
  • The Value Creation Loop
The final component of the framework focuses on implementation outcomes. Effective BIM adoption contributes to enhanced sustainability and cost-efficient construction through advanced functions such as predictive energy modeling, lifecycle analysis, and real-time site monitoring [41]. These performance improvements generate a self-reinforcing value creation loop: as project transparency, efficiency, and reliability increase, stakeholder confidence and institutional trust are strengthened. This, in turn, stimulates further investment in technological, organizational, and regulatory enablers, thereby sustaining long-term BIM integration [30,42]. Figure 1 shows the study concept framework based the value loop creation.

Figure 1. Study Concept Framework (Colours are depicting various grouped components of the framework).

3. Methodology

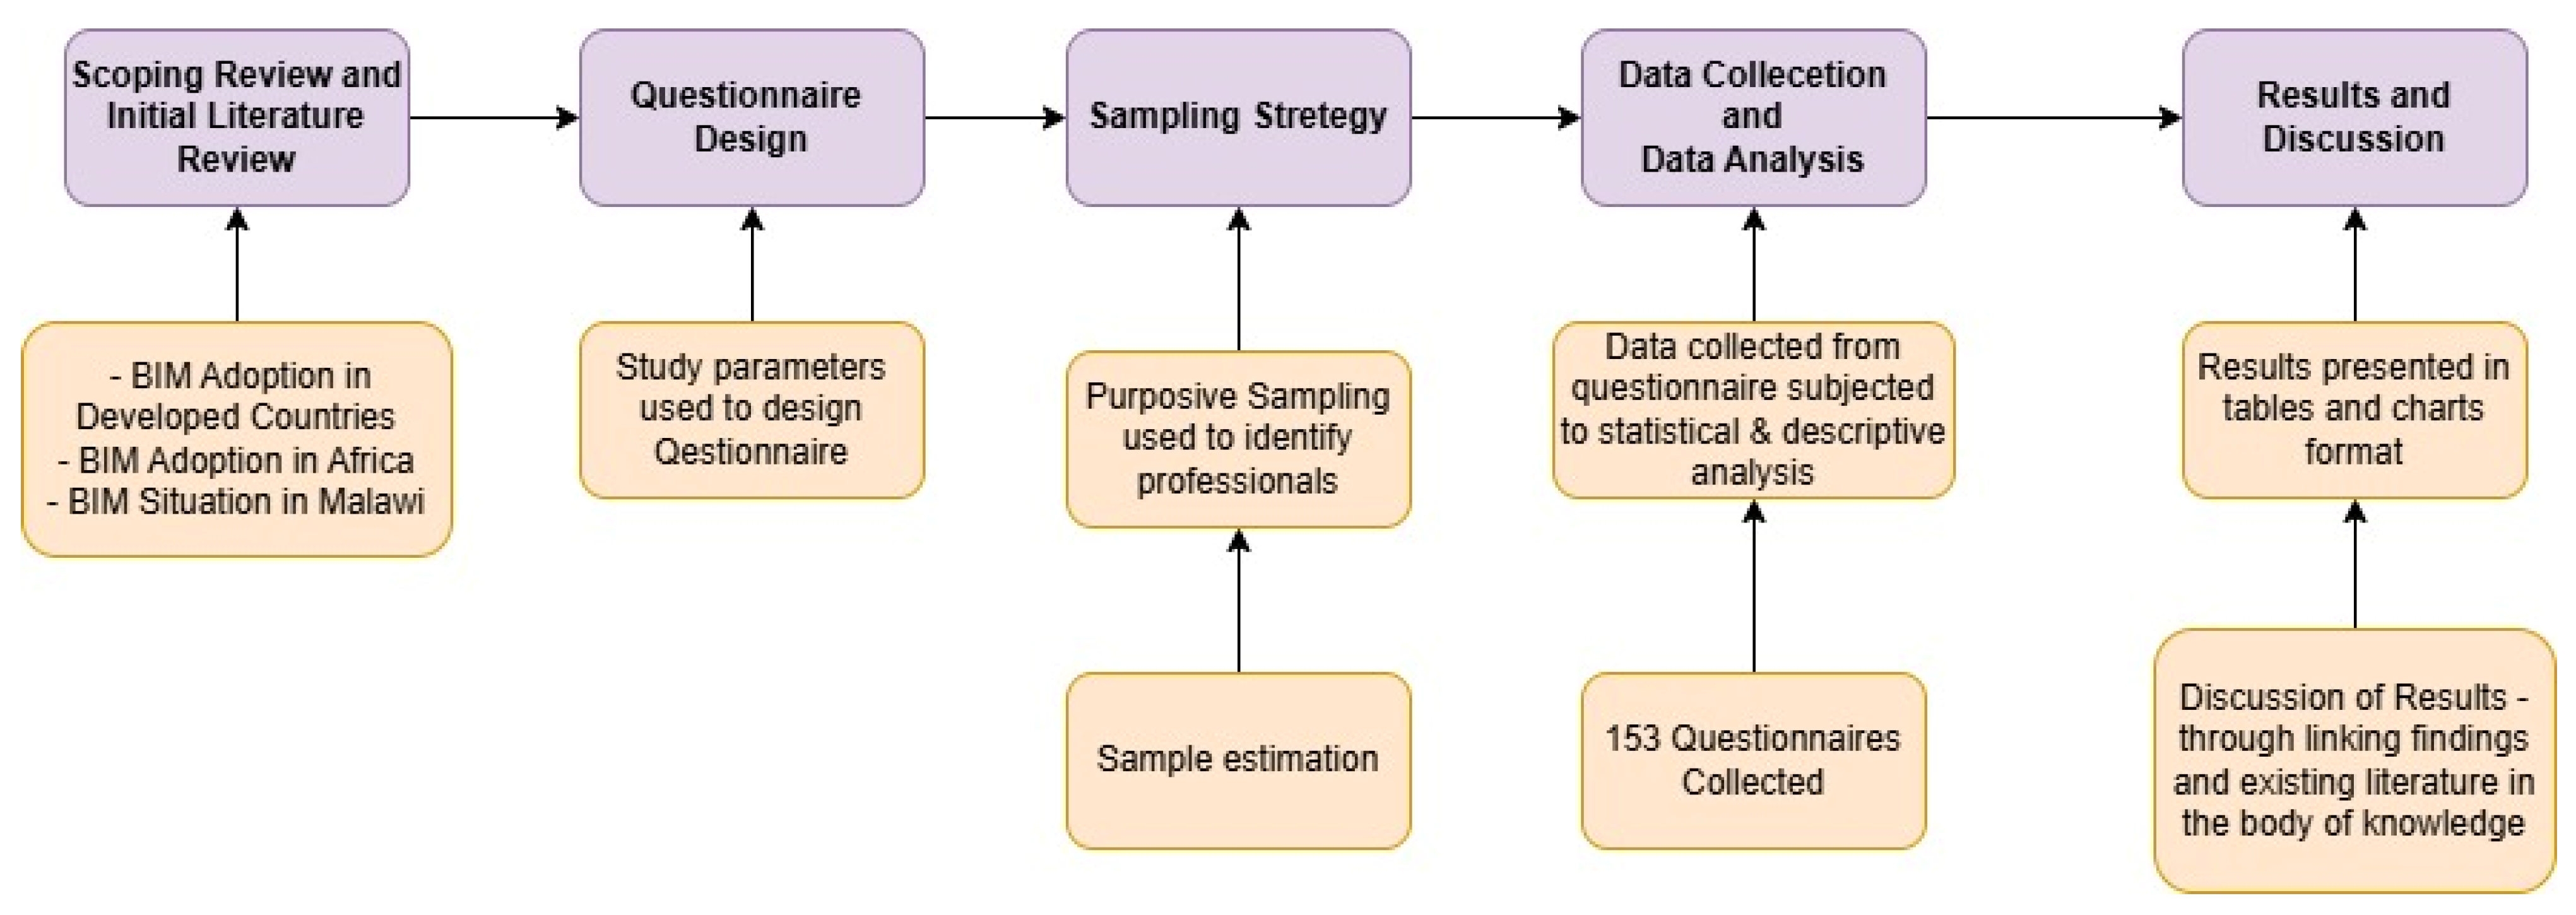
This study is a relativist pragmatic approach in philosophical leaning, exploratory quantitative, and deductive in approach was adopted in data interpretation. The process involved reviewing relevant literature on BIM adoption, developing a survey instrument, sampling participants, and using statistical tools such as descriptive analysis to analyze data. Then the results were presented in tables and charts. Figure 2 below illustrates the research methodology used in this study.
Figure 2. Research Process (The colours show different cluster groups in the process).
  • Sampling Technique
This study was carried out in Malawi, one of the developing economies in Africa. Data were gathered through a structured questionnaire. A non-probability sampling approach was adopted, and purposive sampling was considered more applicable to this study. In this case, Malawian construction industry professional stakeholders were earmarked for the survey. A list of potential informants was collated from the professional bodies of architects, quantity surveyors, land surveyors, and engineers. Non-probability purposive sampling was used because BIM adoption in Malawi is still emerging and concentrated within specific built environment professions. The study, therefore, deliberately targeted Architects, Engineers, Land Surveyors, and Quantity Surveyors, as these are the core registered technical professionals directly involved in design, modelling, costing, and project documentation. In the Malawian context, these groups are the primary actors in BIM-related processes, while managerial roles are often embedded within these professions rather than existing as distinct regulated categories. Given the relatively small and identifiable professional population, purposive sampling was appropriate for reaching knowledgeable respondents with relevant technical experience.
  • The e-questionnaire was used to facilitate data collection and management.
A total of 265 questionnaires were distributed to active construction professionals. The sample size was estimated using Equation 1 according to Yamane [43] to achieve a confidence level of 95%.
The study used a structured questionnaire because it allows standardized data collection across professional groups and enables quantitative comparisons of BIM awareness, software use, and capability levels. Questionnaires are widely used in construction management and BIM adoption studies, particularly where the objective is to assess perceptions, readiness, and practice patterns across multiple disciplines. This approach was appropriate for Malawi, where baseline empirical data on BIM remains limited and a broad professional snapshot was required.
Equation (1):
n = N 1 + N e 2 = 265 1 + 265 × 0.05 2 = 159
where n = sample size; N = population size; e = margin of error.
The optimal sample size for this study, based on the computation above, was 159 complete questionnaires. This aimed to achieve a fair representation of the population of active construction professionals in Malawi. A total of 143 questionnaires were completed, representing 90% response rate of the optimal sample size. Some respondents were unwilling to participate in the study.
Furthermore, it should be put into context that the survey achieved a satisfactory response rate, although approximately 10% of respondents did not answer BIM-specific questions. This pattern likely reflects limited exposure to BIM among a small segment of construction professionals, a form of non-response that can introduce systematic bias if not addressed [44]. This is consistent with the evolving stage of BIM diffusion, where many practitioners still operate at low maturity levels [45]. According to Azhar [45], the construction industry is historically slow to adopt new technologies, and many professionals still operate in isolated environments or at early maturity levels. This justifies the assertion that the 10% gap is likely reflecting the evolving stage of BIM diffusion. Consequently, the analysis focuses on respondents who provided informed views, resulting in a robust analytical sample. Furthermore, the BIM maturity levels reported are based on practitioner self-assessments, a standard approach in technology adoption research used to evaluate organizational capabilities against established benchmarks [46]. Hence, this validates the robustness of the sample use in this study and ensures the reliability and applicability of the results.
  • Study Population
The respondents were construction experts covering architects, engineers, land surveyors, and quantity surveyors. In percentage terms, 17% of the respondents were architects, 55% were engineers, 17% were land surveyors, and 12% were quantity surveyors. Table 1 shows the composition of respondents.
Table 1. Profile of respondents.
In this study, the focus was on four major actors in the construction industry for a number of reasons. The inclusion of Architects, Engineers, Land Surveyors, and Quantity.
Surveyors were selected because of the central role these professionals play in the construction industry and the emphasis that regulatory authorities in Malawi place on these professions. It should be noted that in Malawi, Architects, Engineers, Land Surveyors, and Quantity Surveyors constitute the legally recognized built environment professionals. These groups are directly responsible for design, documentation, cost control, measurement, and technical coordination of construction projects. Because BIM is primarily a design, modelling, coordination, and cost management tool, these professions represent the main technical users and decision-makers in BIM adoption.
It should further be emphasized that BIM implementation in Malawi is still largely concentrated at the design and pre-construction stages. Architects and Engineers are responsible for producing drawings and technical models, while Quantity Surveyors handle cost estimation and measurement, which are key BIM functions. Land Surveyors provide spatial and topographical data that support digital modelling. These roles are directly linked to BIM capabilities such as 3D modelling, clash detection, quantity take-off, and cost estimation.
Another reason for focusing on these professions is that the regulatory and professional framework in Malawi places strong emphasis on these four professions. They are formally registered, licensed, and represented by professional boards and councils. In contrast, roles such as project managers or construction managers are often not regulated as standalone professions in the same way. In many cases, project management functions are performed by Architects, Engineers, or Quantity Surveyors themselves.
  • Data analysis
After collecting the raw data of the questionnaires, the Statistical Package for the Social Sciences (SPSS) version 29.0 software was used to analyze the data. Before analysis, Microsoft Excel was used to clean and code the data. The respondents, using a 5-point Likert scale, assessed the significance of BIM benefits in construction projects based on their experience. The 5-point Likert scale was as follows: 1—least important, 2—small importance, 3—average importance, 4—moderate importance, 5—most important.
  • Empirical Model Results
The study utilized the multi-linear regression model below for conducting correlation and regression analyses for Building Information Modelling.
Equation (2):
Y = α + β_2 〖bx〗_1 + β_3 〖bx〗_2 + β_4 〖bx〗_3 + ε_t
where Y = Dependent variable (BIM Capabilities); X1 = Independent variable (Factors in contributing to the success of BIM); X2 = Independent variable (Benefits of BIM); X3 = Independent variable (Barriers of BIM implementation); X4 = Independent variable (Project Success); β = Slope/intercept/coefficient; α = the constant; e = Margin of error.
The operationalization of the regression model variables is directly grounded in the conceptual framework presented in Section 2.2. Specifically, the independent variable X1 (resource factors contributing to BIM success) corresponds to the framework’s BIM Enablers dimension, capturing IT leveragability, digital infrastructure, and organizational readiness. X2 (benefits of BIM) reflects the Value Creation Loop, representing the perceived performance gains that motivate adoption. X3 (barriers to BIM implementation) maps onto the Organizational Readiness and Challenges and Environmental and Regulatory Drivers components of the framework, which identify both internal capacity constraints and external institutional gaps. X4 (project success) serves as a contextual outcome variable. Together, these variables allow the regression analysis to empirically test the relationships theorized in the framework, linking conceptual constructs to measurable indicators of BIM capability within the Malawian context.
  • Multiple Linear Regression
  • Analysis procedure
In order to run the regression analysis, the scores for each statement of the dependent variable were averaged. Similarly, the scores for each statement for the independent variables were summed up and averaged. This transformed the Likert scale responses from categorical to continuous for linear regression. Later, a step-wise linear regression was conducted for each independent variable.
  • Test for Presence of Heteroscedasticity
A test for the presence of heteroscedasticity of the dependent variable (BIM Capabilities) was conducted. The Breusch-Pagan test is a crucial statistical tool employed to detect the presence of heteroscedasticity, which translates to unequal variance in the error in terms of a dataset. The test assumes that the presence of heteroscedasticity is revealed through the significance of F-statistics or t-statistics. The process involved running an auxiliary regression on the squared residuals. To do this, the initial regression was executed, and residuals were generated. Then the residuals were squared and formed the new dependent variable. Using the squared residuals as the new dependent variable and the original predictors as independent variables, the auxiliary regression was conducted.
  • Relative Importance Index (RII)
In order to further analyse independent variables such as those which influence BIM adoption, a descriptive statistical parameter known as the Relative Importance Index (RII) was used. The RII value range shows its importance among the factors behind the critical situation of the project. The greater RII value indicates a more critical factor that acts behind the critical condition.
Equation (3):
R I I = W A × N 0 i n d e x 1
where W is the weighting given to each element by the respondents; this is between 1 and 5, where 1 is the least significant impact and 5 is the most significant impact; A is the highest weight; and N is the total number of factors
  • Spearman Rank Correlation
Spearman’s rank correlation measures the strength and direction of association between two ranked variables [46]. This study used Spearman’s rank correlation to show the level of agreement between any two variables since the data is nonparametric but monotonic. The typical area where Spearman’s correlation was used is the relationship between project delivery methods and the use of BIM.
Equation (4):
rs = 1 − [6∑d2 ÷ (n3 − n)] (2)
where rs = Spearman’s rank correlation coefficient; d = the difference in ranking between any two parties; n = the number of factors
The correlation coefficient varies between +1 and −1, where +1 implies a perfect positive relationship (agreement), while −1 results from a perfect negative relationship (disagreement). Sample estimates of correlation close to unity in magnitude imply good correlation, while values near zero indicate little or no correlation [47].

4. Results and Discussion

4.1. Statistical Analysis

The first statistical analysis performed on the data was a regression diagnostic using the Breusch–Pagan test. Table 2 presents the F-statistic (4, 1.519) and its associated p-value (p > 0.206). In addition, Table 3, which shows the ANOVA results, indicates that the sum of squares values is less than 30. These results suggest that there is insufficient statistical evidence to conclude that heteroscedasticity is present in the original regression model. Therefore, the standard errors of the coefficient estimates derived from the primary regression are considered unbiased and reliable, which is a prerequisite for proceeding confidently with the interpretation of coefficient significance.
Table 2. Breusch-Pagan test for Heteroscedasticity.
Table 3. ANOVA for Breusch-Pagan test.
  • Test for Presence of Multicollinearity
Multicollinearity analysis was conducted to assess the degree of correlation among the independent variables. This was done by calculating the Variance Inflation Factor (VIF) for each predictor variable. When VIF values fall within acceptable limits, the model can be considered reliable; otherwise, model refinement strategies must be applied to address collinearity issues before interpreting the results.
Snee [48] suggests that a VIF value between 1 and 5 indicates a moderate level of correlation among independent variables, and most researchers accept models in which all VIF values fall below 5. According to Hair et al. [49]; however, interpretation of the Condition Index (CI) is equally important. CI values above 15 may indicate potential multicollinearity problems, while values above 30 are considered a strong indication of serious multicollinearity.
The CI values obtained from the collinearity diagnostics, as shown in Table 4, are all below 30 for the independent variables. This indicates that there is no serious multicollinearity in the model, allowing for confident interpretation of the regression results [50].
Table 4. Test for multicollinearity.
  • Multiple Linear Regression Model
The results in Table 5 show that the adjusted R-squared of the model is 0.754. This indicates that 75.4% of the variation observed in BIM capabilities can be explained by the predictor variables included in the model. These variables include resource-related factors, perceptions of the benefits of BIM, perceptions of barriers to BIM implementation, and project success factors. This suggests that the model provides a good fit to the data.
Table 5. Regression model Summary.
Furthermore, the ANOVA results presented in Table 6, in conjunction with Table 5, show that the F-statistic F ( 4,57.571 ) for the observed changes in the dependent variable is statistically significant (p < 0.0001) at the 95% confidence level. This indicates that the overall regression model is statistically significant and that the set of predictor variables jointly explains a significant portion of the variation in BIM capabilities.
Table 6. ANOVA table.
The coefficients for each predictor variable are presented in Table 7. The results indicate that resource-related factors, barriers to BIM implementation, and perceived benefits of BIM are significantly associated with BIM capabilities. In contrast, project success factors were not found to be significantly associated with BIM capabilities.
Table 7. Linear Regression Coefficient.
Specifically, the results show that a one-unit increase in resource-related factors [ β = 0.387   ( 0.187,0.587 ) ,   p < 0.0001 ] leads to a 0.387-unit increase in BIM capabilities. Similarly, a one-unit increase in the perceived benefits of BIM [ β = 0.281   ( 0.069,0.494 ) ,   p < 0.010 ] results in a 0.281-unit increase in BIM capabilities. In contrast, a one-unit increase in perceived barriers to BIM implementation [ β = 0.333   ( 0.510 , 0.157 ) ,   p < 0.0001 ] leads to a 0.333-unit decrease in BIM capabilities. Although project success factors show a positive coefficient [ β = 0.062   ( 0.152,0.275 ) ,   p = 0.562 ] , the relationship is not statistically significant. Therefore, the effect of project success factors on BIM capabilities cannot be reliably established in this study.
  • Statistical Analysis Conclusion
The statistical analysis results conclude that the benefits of BIM, barriers to implementing BIM, and resource factors are significantly associated with BIM capabilities. The model strongly predicts these factors, as 75.4% of the variations observed in BIM capabilities are attributed to these factors, while 24.6% of the variations are attributed to other factors. Therefore, this model is robust as it adequately predicts the factors associated with BIM capabilities.

4.2. Awareness of BIM

The results of the awareness level of the professionals about BIM technology are presented in Table 8.
Table 8. Awareness of Building Information Modeling (BIM).
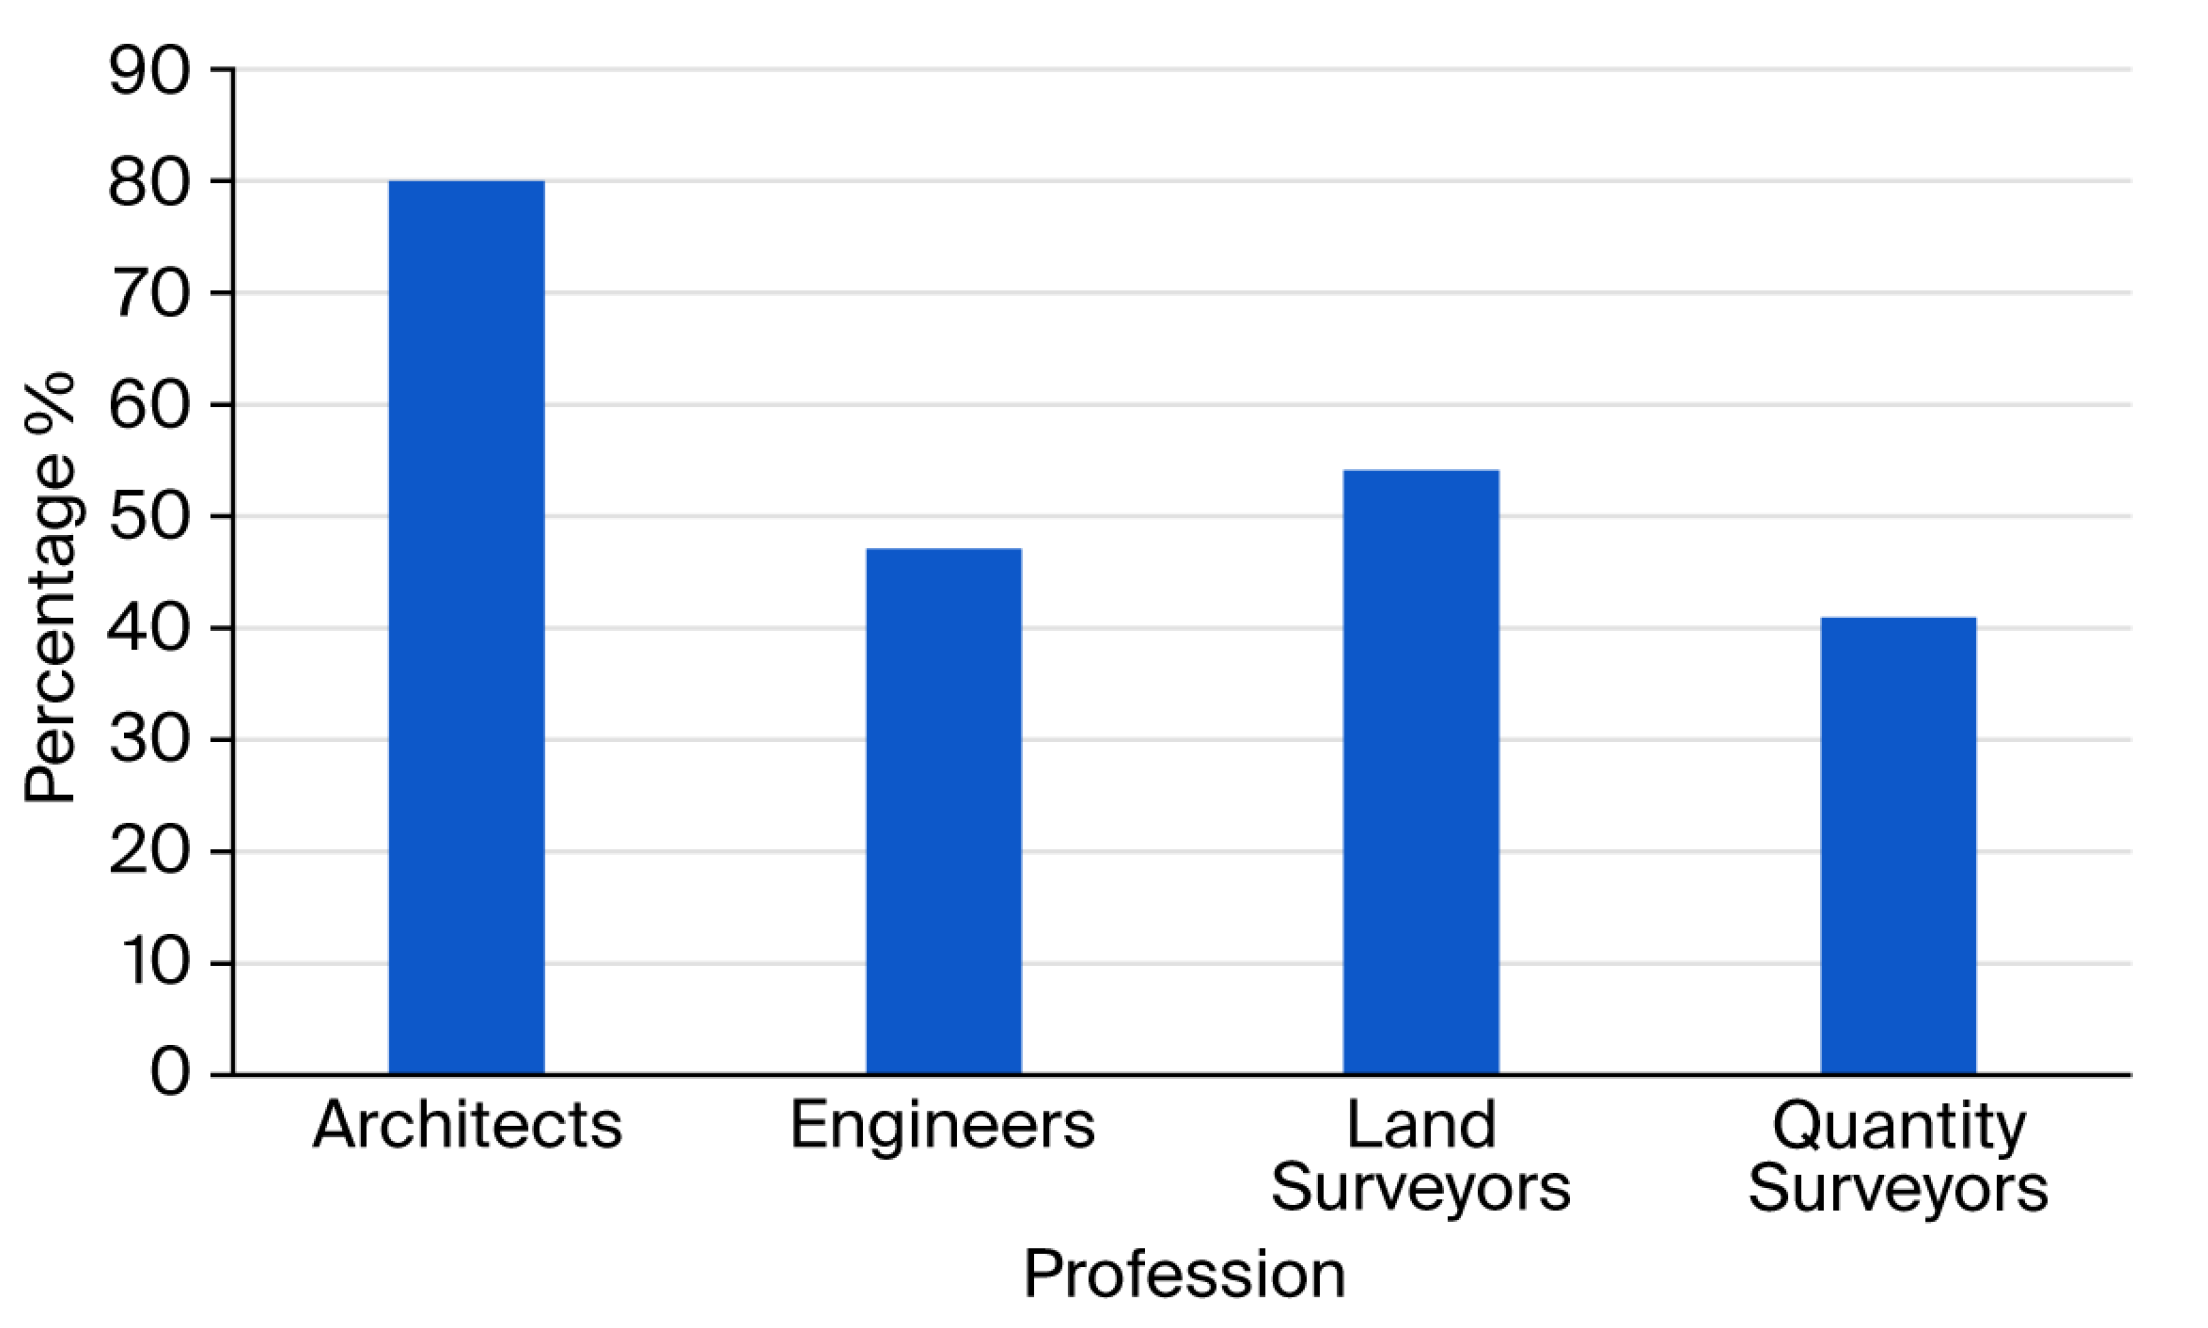
The results in Table 8 show that 52.4% of the respondents were aware of BIM. However, 47.6% were not aware of its existence. Therefore, the results were further segregated into the professional level. Among the professionals, about 80% of architects were aware of BIM, followed by land surveyors at 54%, engineers at 47%, and quantity surveyors at 41%. This may be because BIM was initially very prominent in the building sector before it was introduced to the other sectors [51,52]. Architects have been using BIM for a long time compared to other professional groups, resulting in a high awareness level in this professional group. Figure 3 shows the results according to professional groups of the respondents.
Figure 3. BIM awareness according to professional group.
Compared with other countries in the region, Kenya reports a relatively high level of BIM awareness, with 88.7% of construction professionals indicating familiarity with the technology [53]. In Nigeria, similar studies show a substantial increase in BIM awareness, rising to 84% in recent years [24], compared with 30% reported earlier [25]. South Africa has experienced a comparable trend, where BIM awareness increased significantly from 44% in 2014 to 91% in 2024 [20,51].
When these figures are considered alongside Malawi’s current BIM awareness level of 52.4%, it becomes evident that the country lags several other sub-Saharan African nations. This suggests that the diffusion of BIM knowledge among construction professionals in Malawi remains relatively limited compared with peers in the region. According to Gamil and Rahman [54], the development of clear implementation guidelines and the active promotion of BIM technologies play a critical role in enhancing awareness and facilitating industry-wide adoption. However, such institutional support mechanisms are largely absent in Malawi, where BIM has yet to be formally integrated into industry standards or regulatory frameworks. As a result, awareness and utilization of BIM largely depend on individual initiative rather than systematic institutional promotion.

4.3. Years of Use of BIM

Years of use of BIM is another variable for measuring BIM competency. Table 9 shows the survey results for this variable.
Table 9. Duration of BIM Usage.
The findings presented in Table 9 indicate that 45.3% of respondents have utilized BIM for less than two years, while 22.7% have between two and five years of experience. A smaller fraction of the sample represents long-term users: 10.7% have used BIM for six to eight years, 9.3% for nine to 12 years, and 12% for over 12 years. These results reveal that a significant majority of professionals (68%) possess five years of experience or less. This suggests that BIM adoption in Malawi is in its nascent stages. Consequently, targeted sensitization and strategic policy interventions are required to accelerate BIM uptake across the Malawian construction industry. However, it should be noted that these maturity levels are based on practitioner self-assessments, which, while standard in adoption research, may be subject to overestimation or social desirability bias [55].
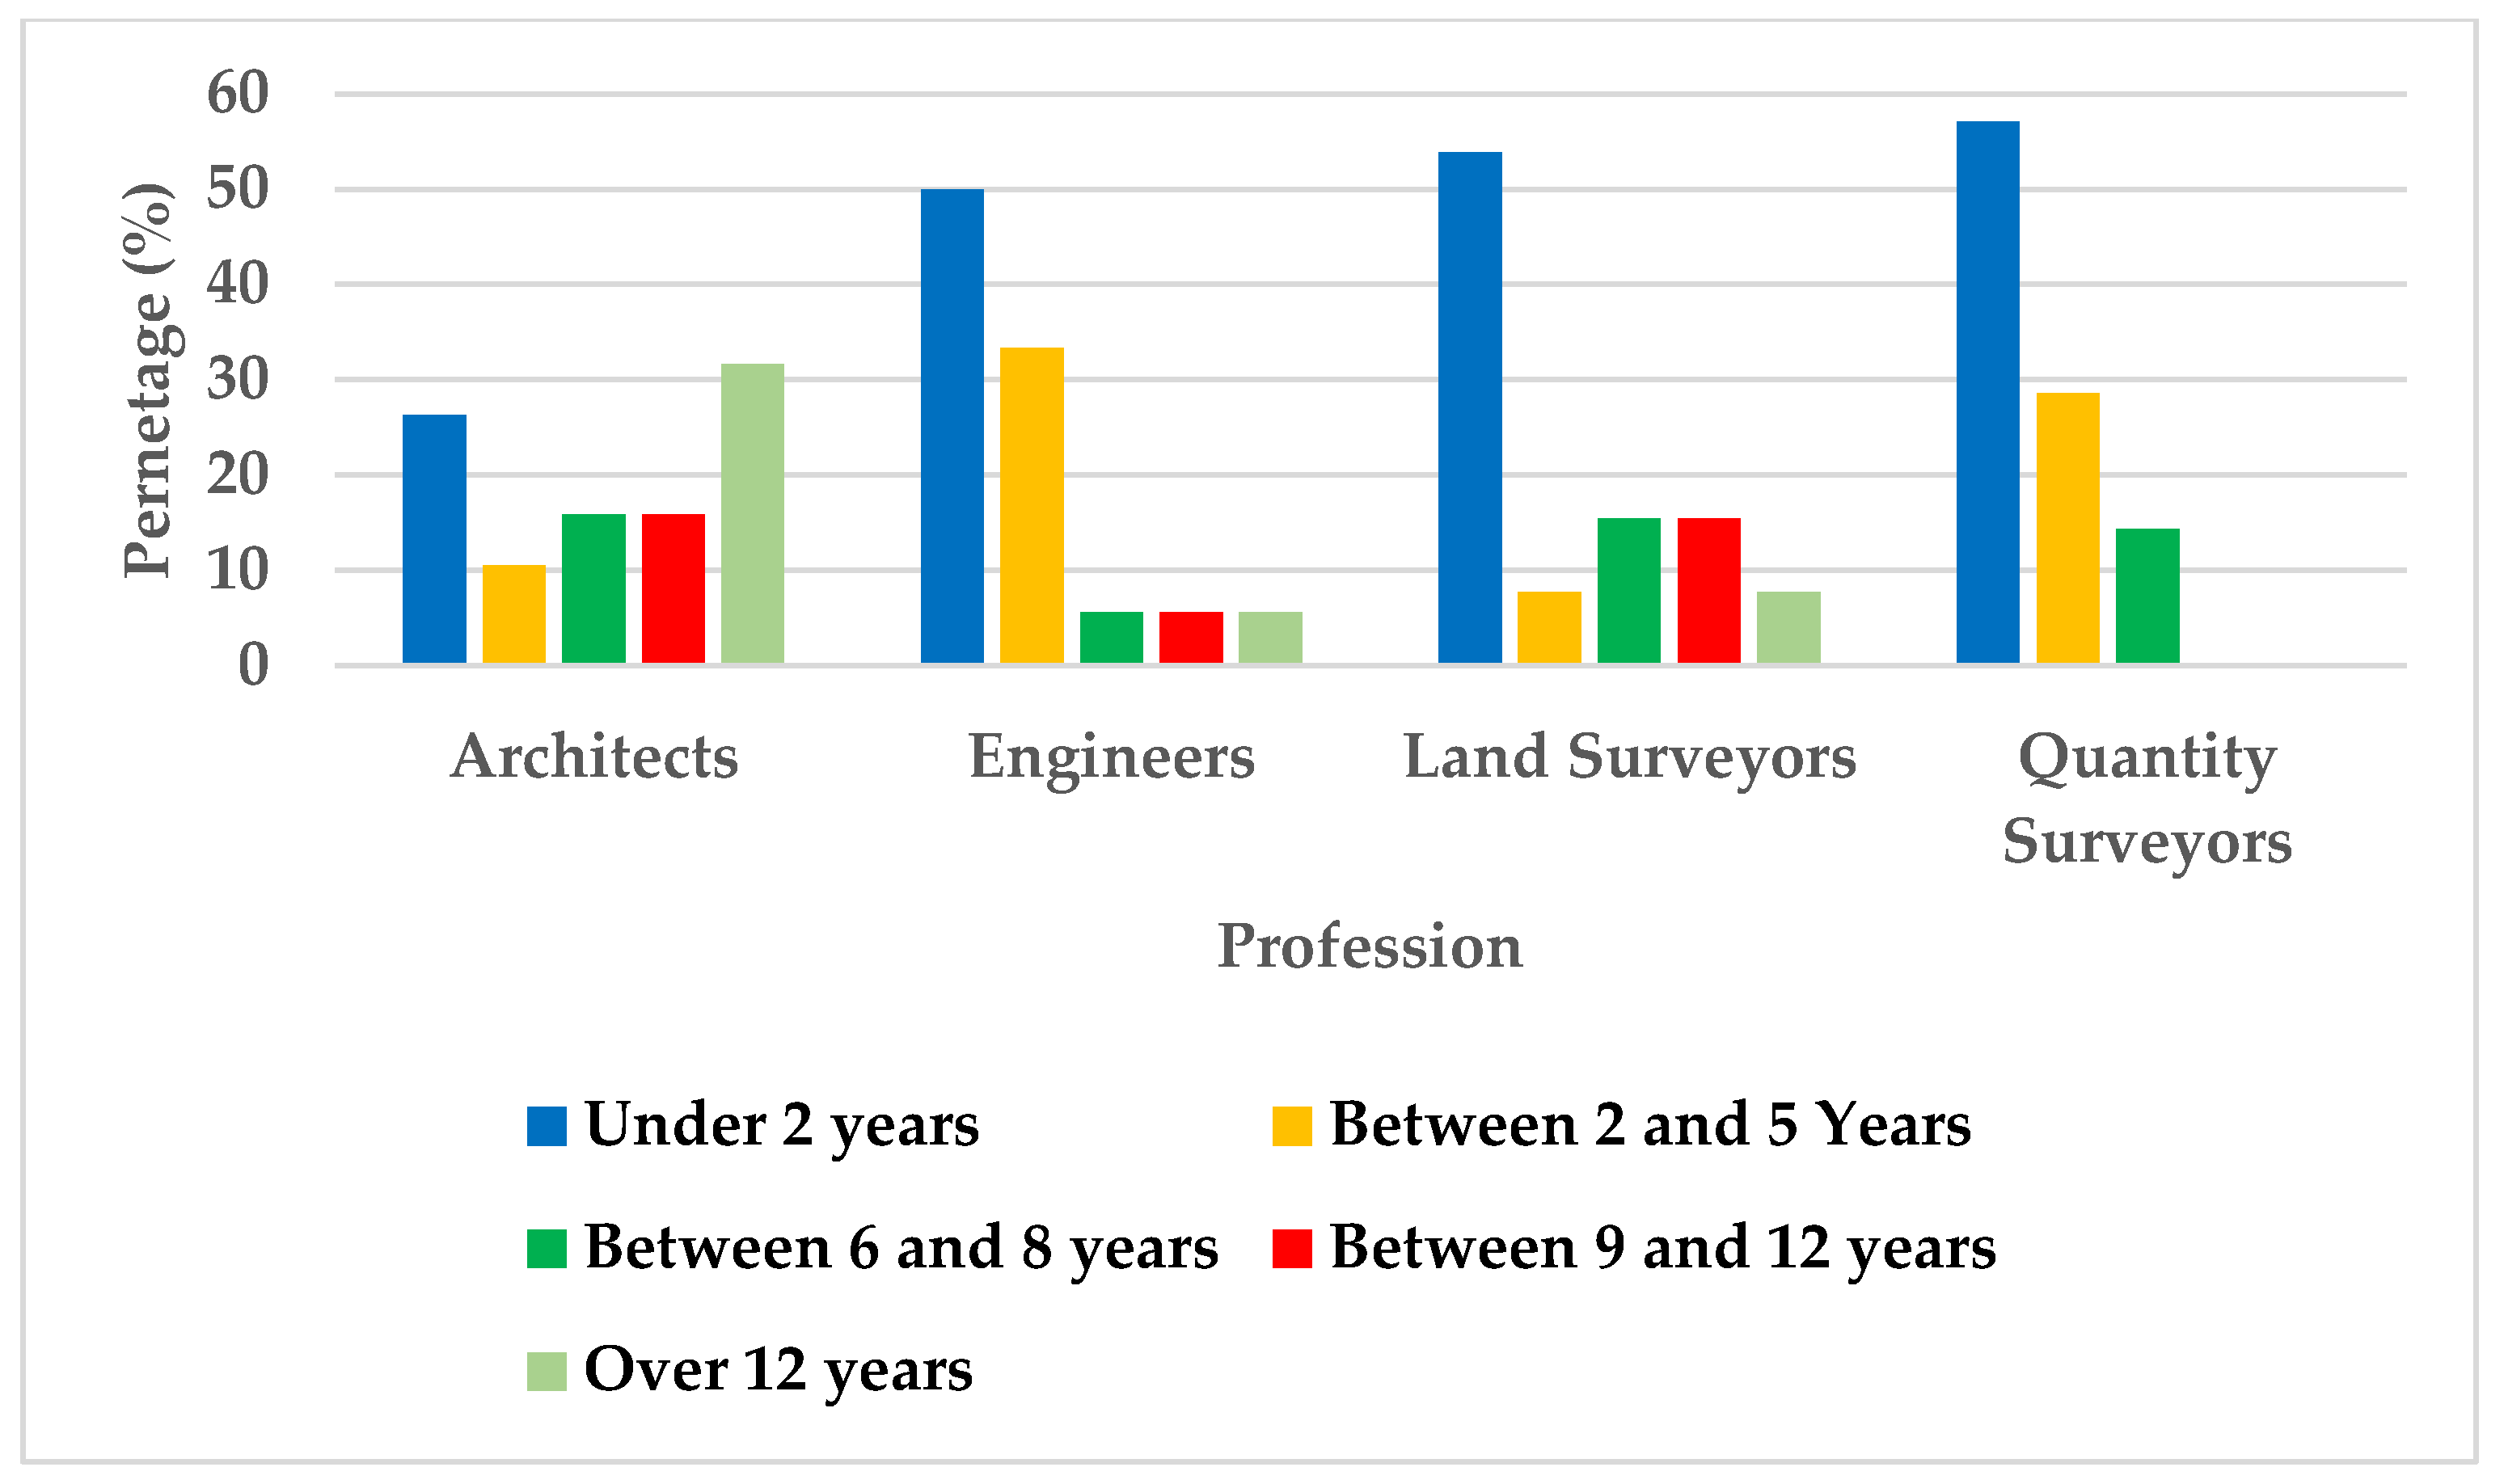
Further analysis of the results was conducted to segregate various professions, and Figure 4 shows the period of BIM usage based on various professions.
Figure 4. Duration of use of BIM according to profession.
As illustrated in Figure 3, architects reported the highest long-term BIM adoption, with 32% utilizing the technology for over 12 years. This is followed by land surveyors at 7%, engineers at 5%, and quantity surveyors at 0%. Quantity surveyors also represented the highest proportion of early-stage adopters (under 2 years) at 58%, followed by land surveyors (53%), engineers (50%), and architects (27%). These results indicate a strong correlation between awareness levels and the duration of BIM usage; specifically, higher awareness within a professional group corresponds to more extensive experience. Architects lead this trend, likely due to BIM’s historical origins in the building sector [52]. Furthermore, the low variance in usage duration among architects suggests a more consistent and established level of knowledge within the profession compared to other disciplines.

4.4. Number of Projects Undertaken Using BIM

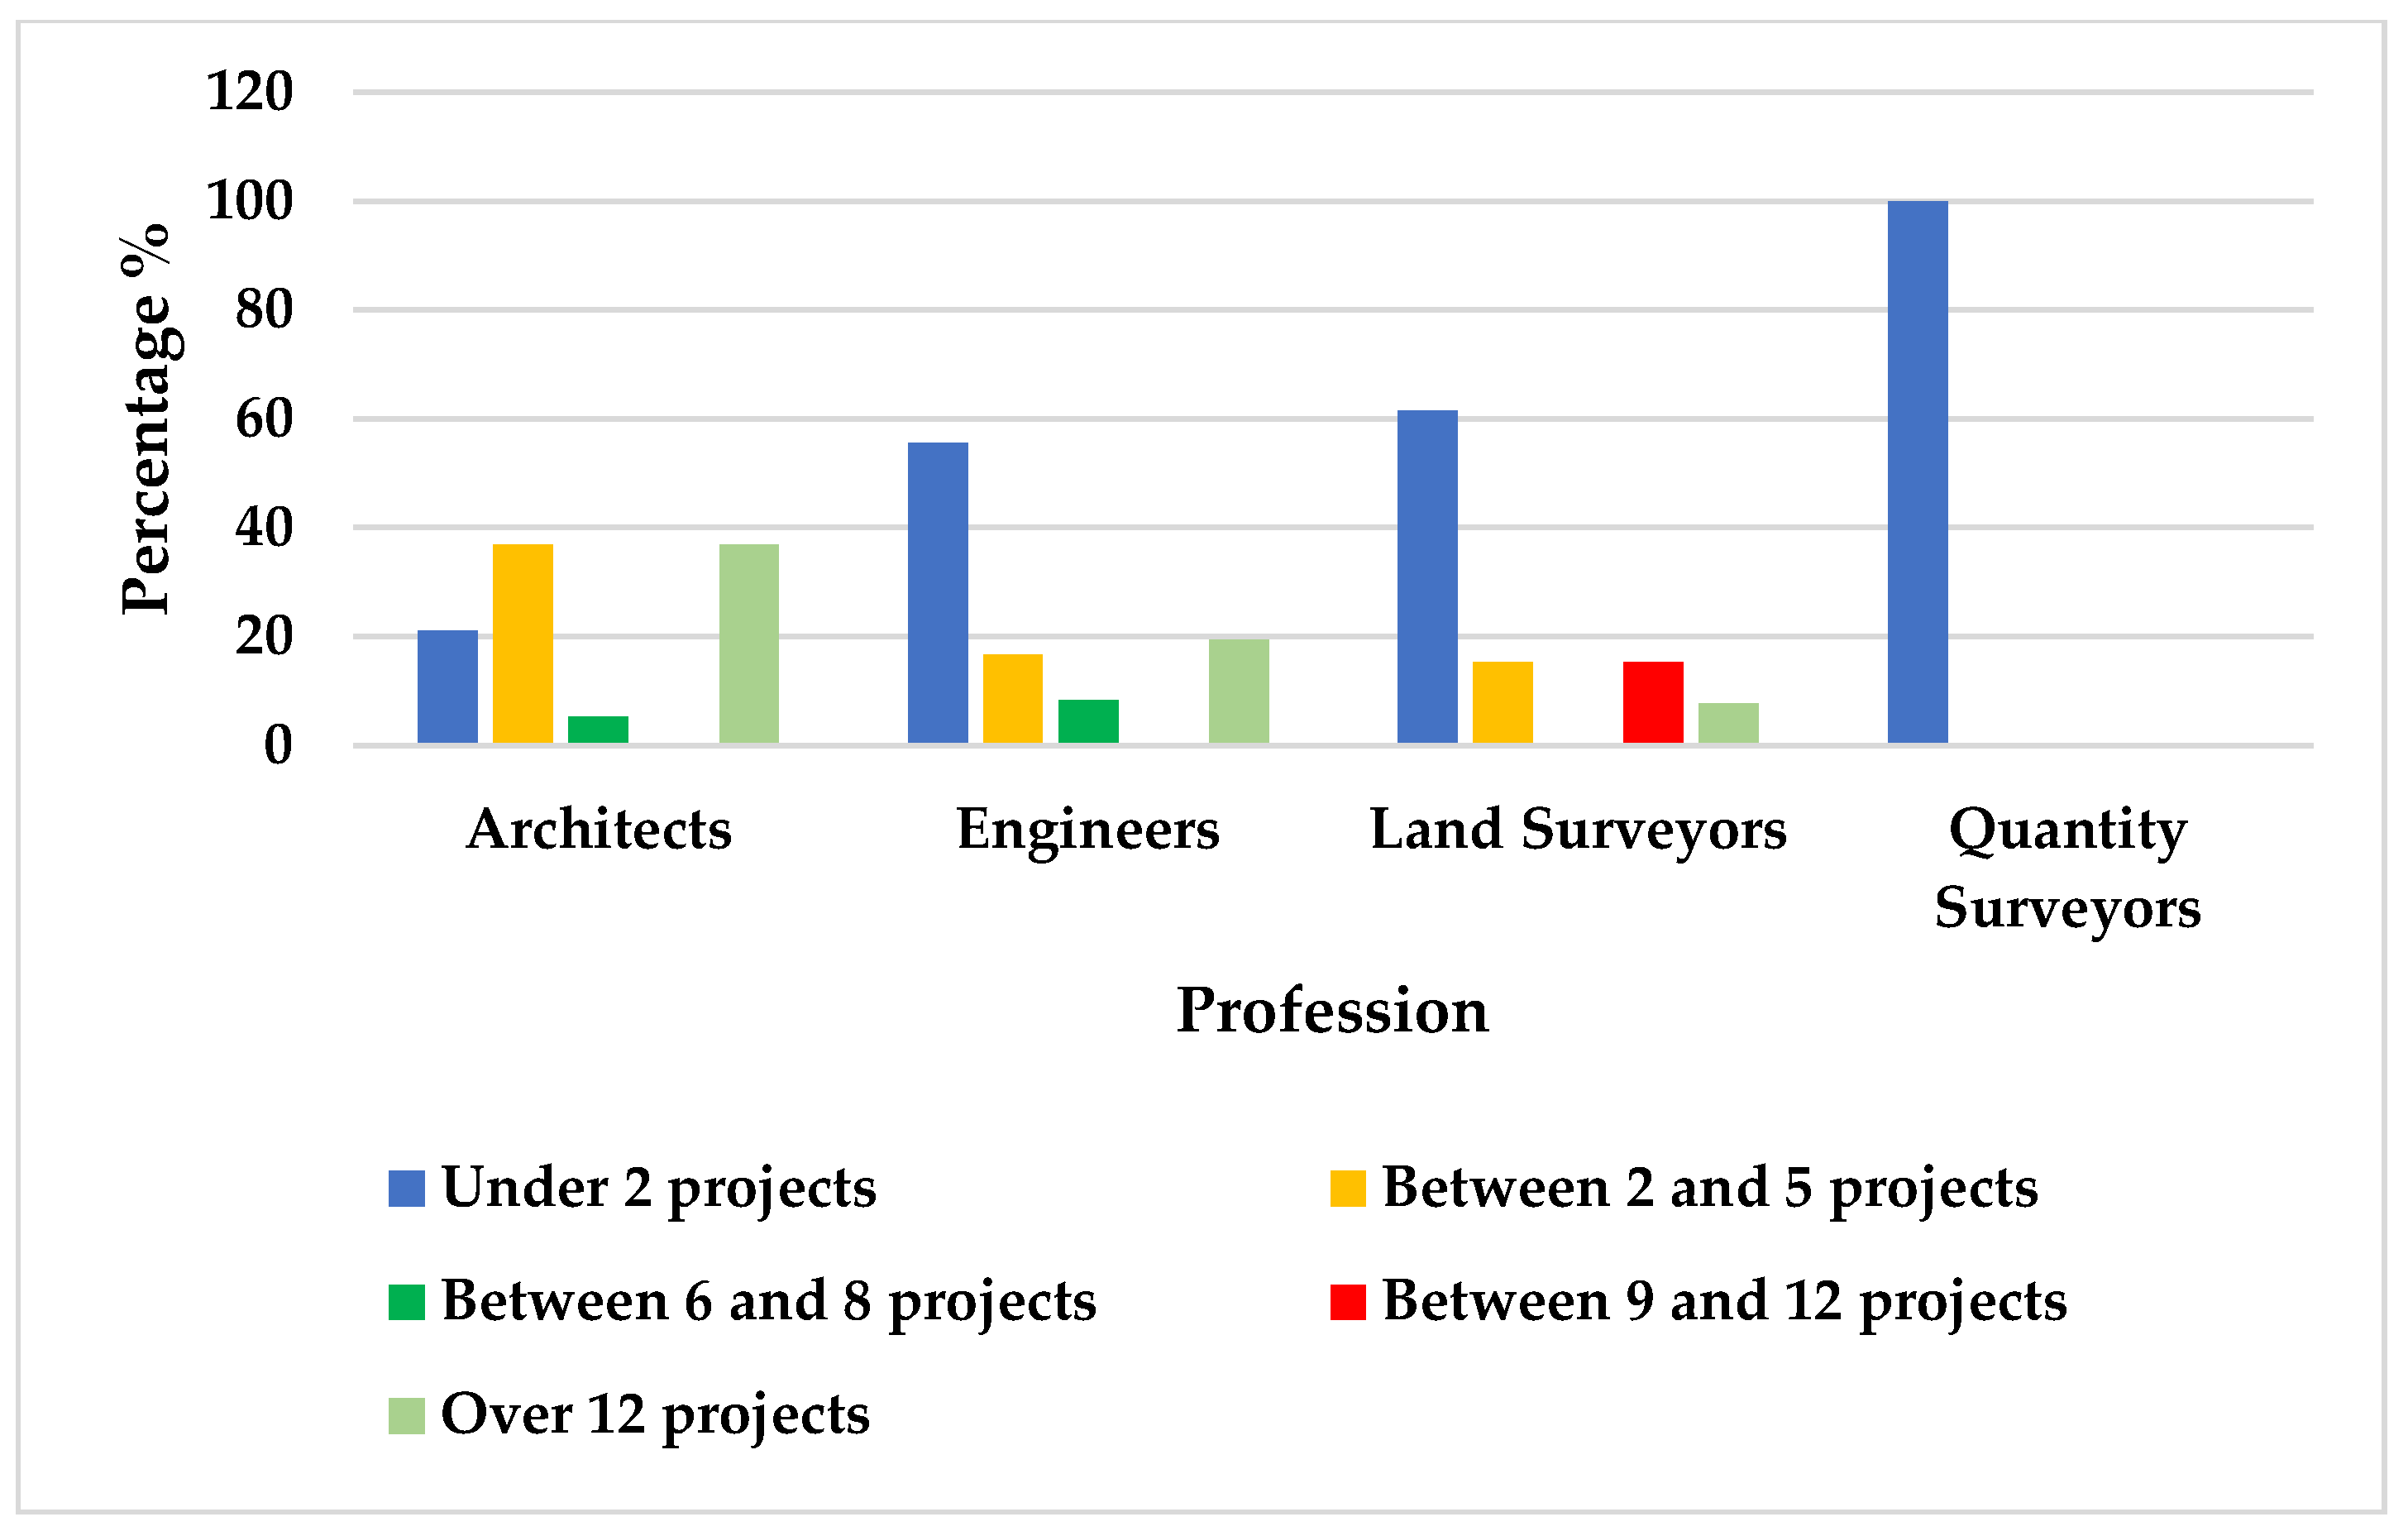
The number of projects undertaken using BIM is an indicator of the competency level of a user. Table 10 presents the results for the number of projects undertaken using BIM.
Table 10. Amount of projects undertaken using BIM.
  • Project-Based Competency and Regional Trends
Table 10 shows that 52% of the respondents had undertaken fewer than two projects using BIM, and 20% of respondents had undertaken between two and five projects. This shows that 70% of the respondents have undertaken fewer than five projects using BIM. This aligns with the number of years respondents have used BIM, as shown in Section 4.3 above. Furthermore, it was observed that 20% of the respondents had undertaken more than 12 projects. The finding that 72% of respondents have worked on five or fewer BIM projects indicates that BIM is still an emerging novelty in the local market rather than a standard operational requirement. In a broader African context, Adetoro et al. [15] highlight that in low-income countries like Malawi, technological and process factors such as the lack of standardized datasets and limited knowledge resources are primary drivers for this low project throughput. This mirrors findings by Olorunfemi et al. [56] in Nigeria, who argue that while awareness may be high, the actual implementation gap is affected by the high cost of software and a lack of government mandates that would otherwise force professionals to utilize BIM across a higher volume of projects.
  • Professional Disparity
The results were further analyzed by segregating respondents into professional groups. The results show that architects have carried out many projects in this category, with over 12 projects, at 38%, followed by engineers and land surveyors at 19% and 8%, respectively, and quantity surveyors at 0%. Figure 4 shows the segregated analysis of the results by profession. The observation that Architects lead with 38% in the high-competency category (over 12 projects) aligns with the global Architect-led adoption model. Architects are typically the primary drivers of BIM because the visual and spatial benefits of 3D modeling are immediately applicable to their core deliverables. According to Jung and Lee [57], architects often achieve higher maturity levels faster than other disciplines because their primary tools (like ArchiCAD or Revit) are built around the BIM core.
On the other hand, the significantly lower competency rates among Engineers (19%) and Land Surveyors (8%) in the study suggest a lag in multi-disciplinary integration. Ndwandwe et al. [13] note that in Malawi, land surveyors and civil engineers often remain tethered to Civil 3D for 2D-centric outputs, which limits their transition into the collaborative, data-rich environment required for higher project counts in BIM.
  • The Quantity Surveying Competency Gap
The 0% competency rate among Quantity Surveyors (QS) for high-volume BIM projects is a critical finding that highlights a major bottleneck in Malawi’s AEC sector. Academic research consistently identifies the QS profession as the slowest to adapt to BIM. Studies by Saka and Chan [24] and Ola-Ade Ajayi et al. [58] suggest that quantity surveyors are often hesitant to adopt BIM due to the complexity of 5D BIM (automated cost estimation). Research in neighboring South Africa by Nzangi et al. [59] indicates that many QS professionals fear BIM will make traditional taking-off skills redundant, leading to a cultural resistance to change. Furthermore, Siddiqui et al. [60] pointed out that without localized BIM measurement standards (the I in BIM), quantity surveyors find it difficult to trust the automated quantities generated by models, preferring traditional, manual 2D methods. Figure 5 shows the projects undertaken based on profession.
Figure 5. Projects undertaken based on profession.

4.5. Software Used for BIM

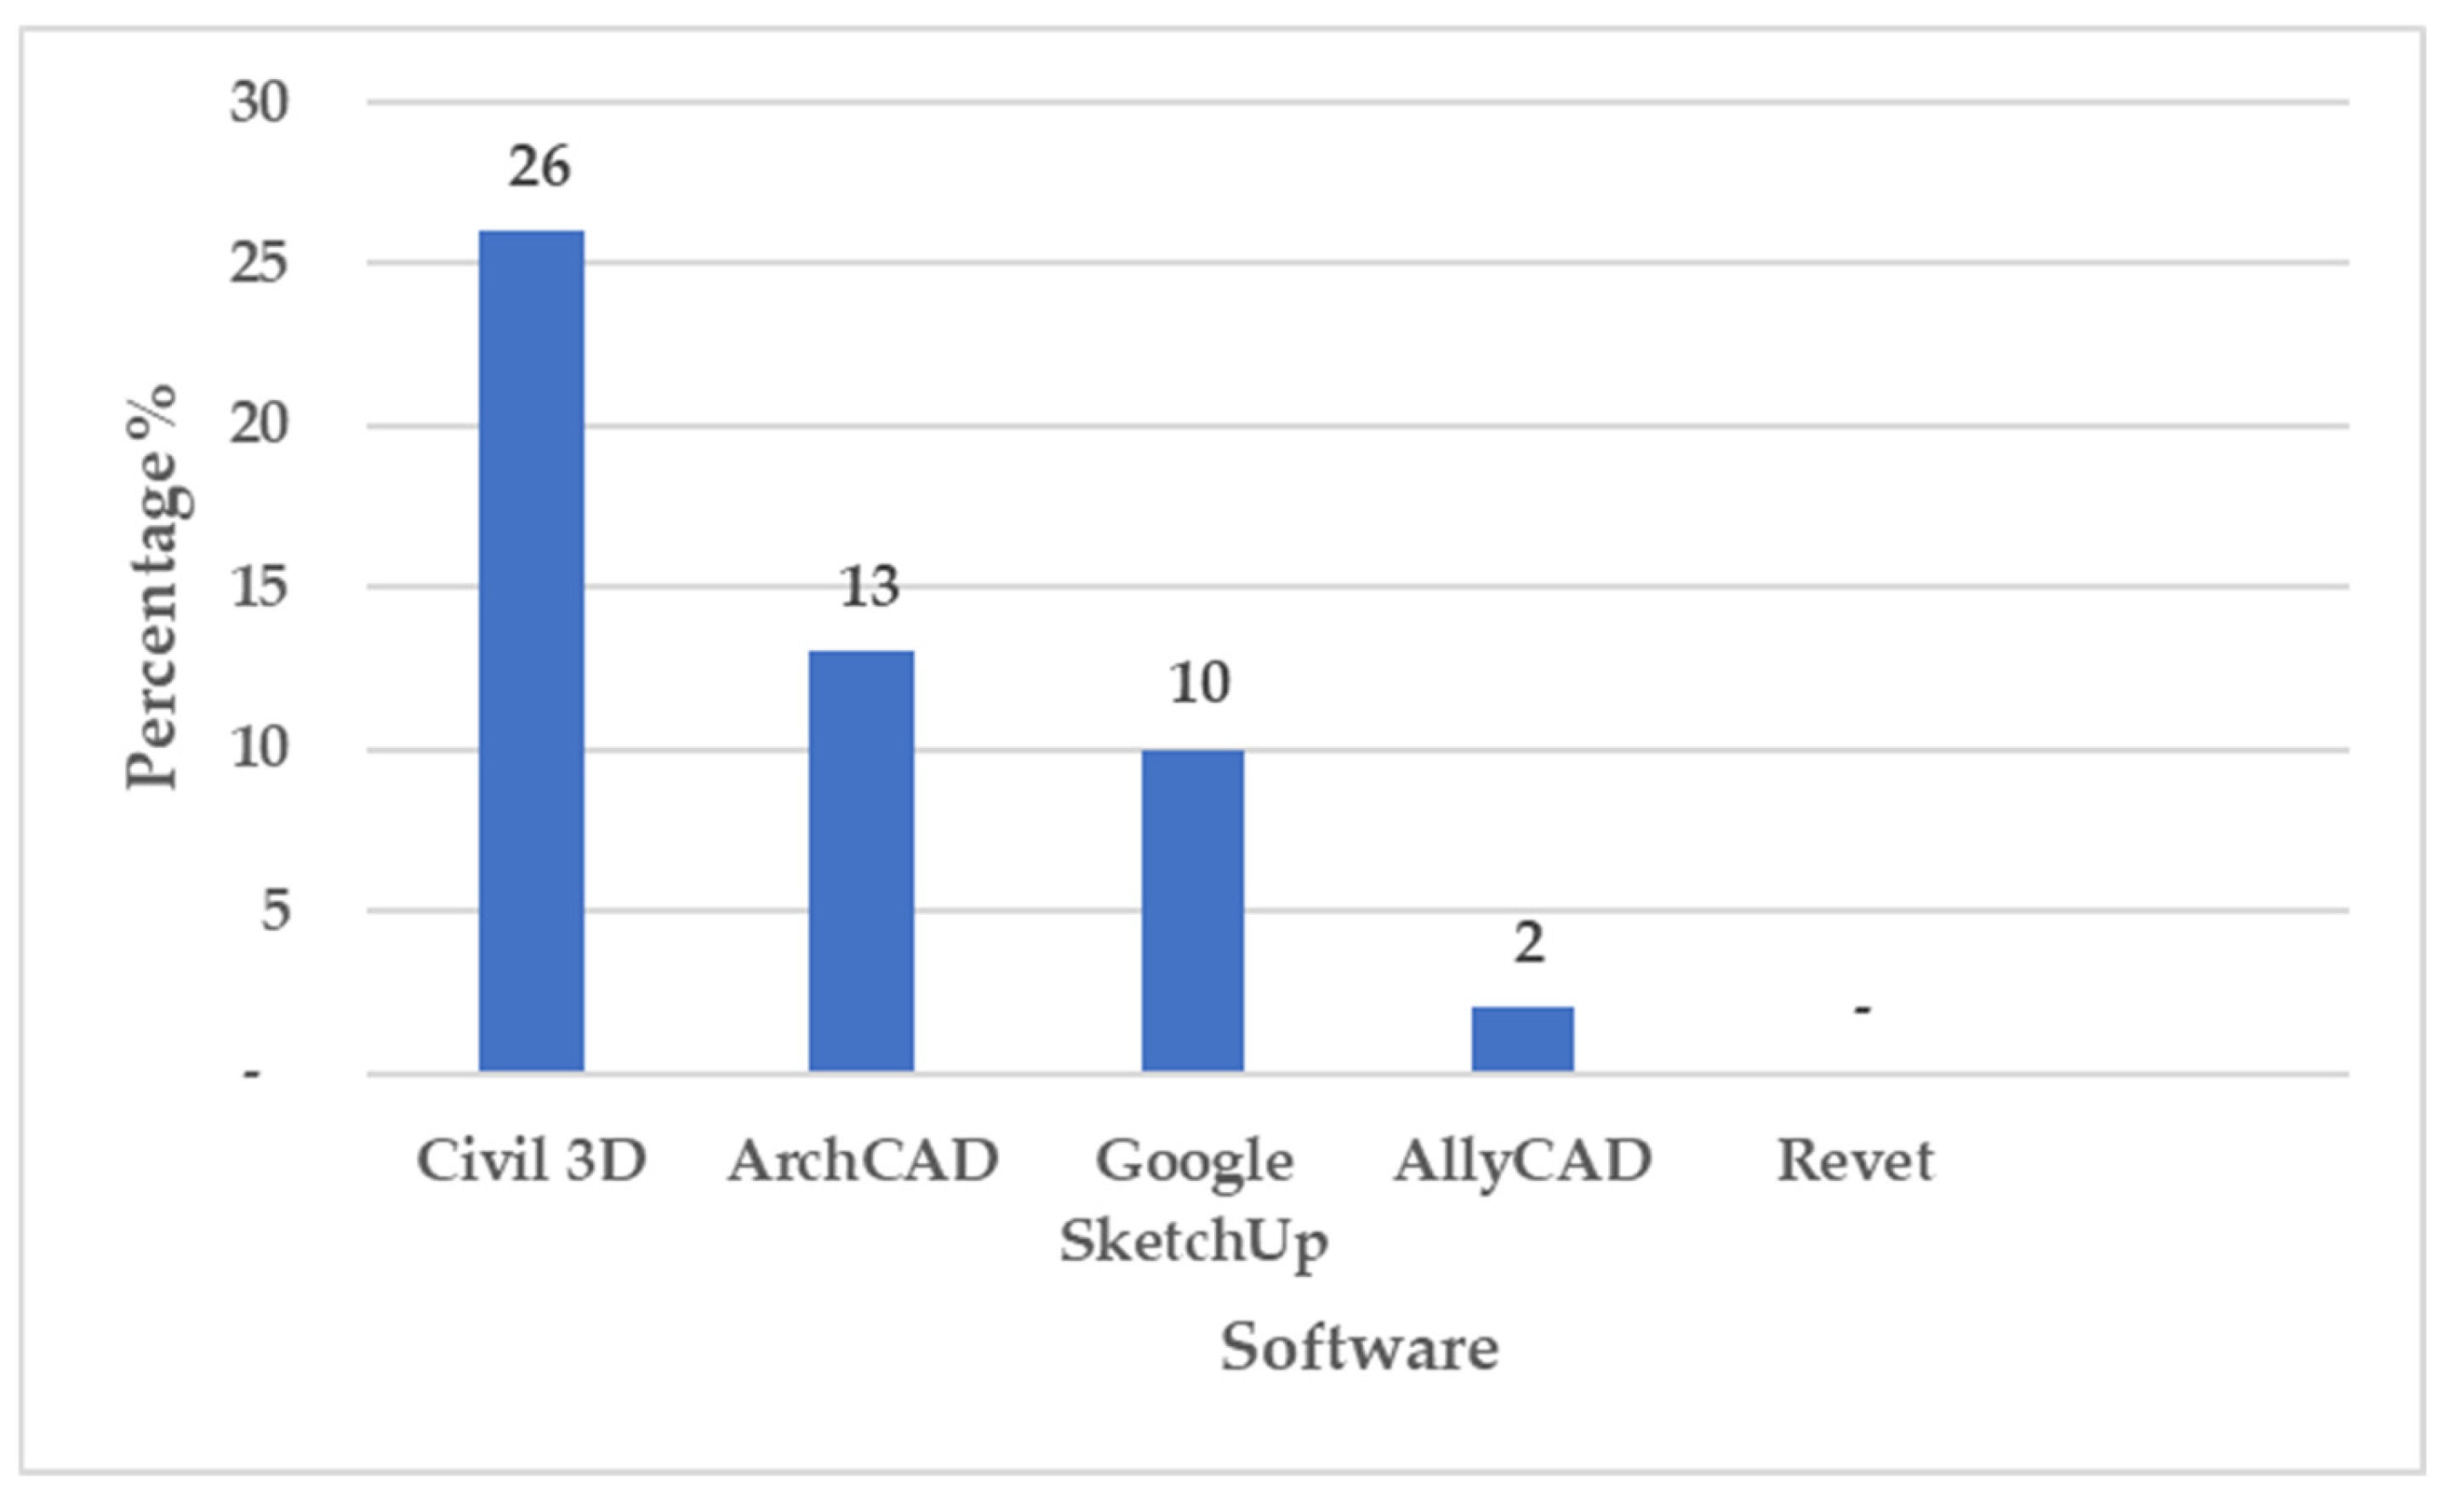
The selection of software hinges on exposure, interoperability, workability, and availability, among other factors. Hence, this study considered the most prevalent software utilized in the construction sector in Malawi, which is also commonly practiced in other countries that have just adopted BIM technology. Figure 6 shows the level of usage of software for BIM projects
Figure 6. Software used in BIM projects.
  • Incidence of Software Use for BIM in Malawi
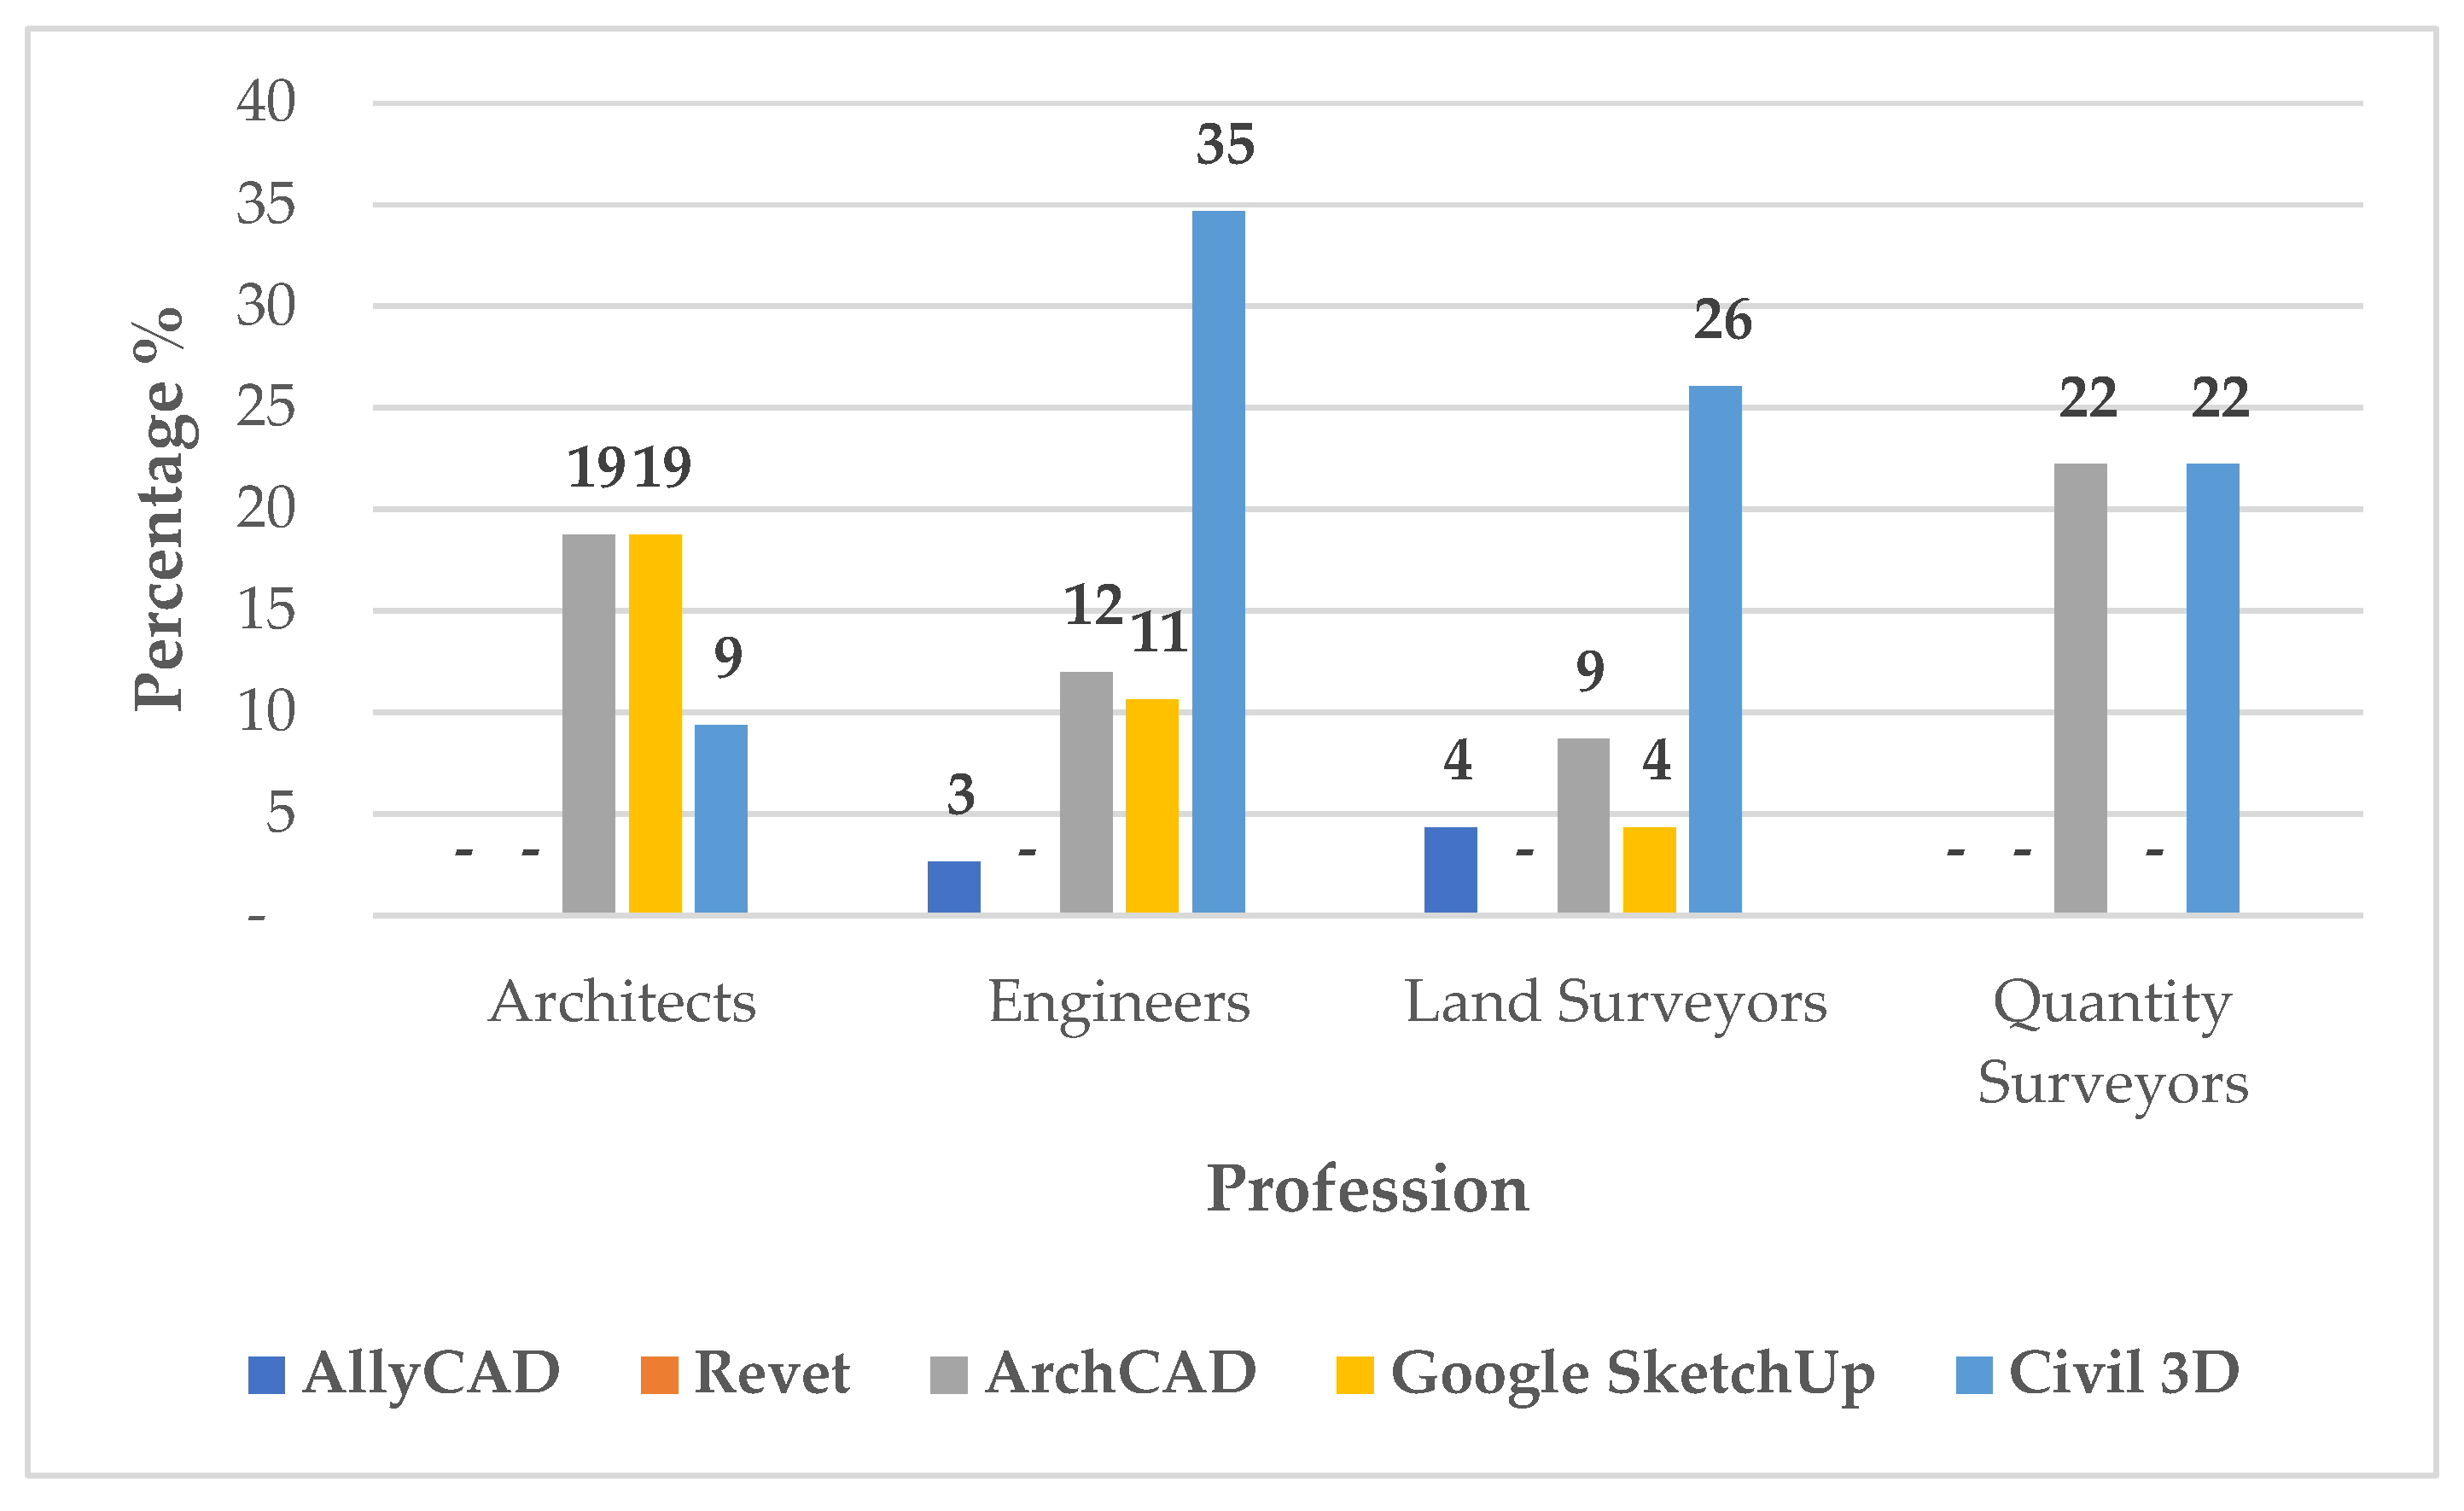
As illustrated in Figure 6, Civil 3D is the most prevalent software, with a 26% usage rate. Its adoption is concentrated among engineers, land surveyors, and quantity surveyors. ArchiCAD and Google SketchUp follow as the second most utilized tools, primarily favored by architects. Revit is among the least utilized, with only a marginal percentage of engineers and land surveyors reporting its use. These preferences serve as a significant indicator of BIM utilization within specific professional disciplines.
In the Malawian context, AllyCAD and Revit show the lowest overall adoption rates, at 2.2% and 0%, respectively. However, when examining software preference specifically among active BIM users (Figure 6), a distinct trend emerges: AllyCAD is highly favored by engineers (35%), land surveyors (26%), and quantity surveyors (22%), followed closely by ArchiCAD.
The results that Civil 3D remains the most used software across all professions are consistent with studies from developing construction markets. In many African countries and other emerging economies, traditional 2D drawing methods are still widely used. However, this situation is different from what is happening in North America and Europe. In those regions, Revit is largely used.
According to Biancardo et al. [61,62], Civil 3D is considered an industry standard for infrastructure modelling. Among architects, the results show a preference for ArchiCAD and SketchUp. This reflects the ongoing debate between design-focused and data-focused tools. While Revit is often required for large multidisciplinary projects, Sadiku et al. [63] note that ArchiCAD remains popular among smaller design firms because it is easier to use and supports open BIM workflows. Interestingly, this study’s results show that Revit is the least used software and is mainly used by engineers, as shown in Figure 7. This goes against global trends where Revit is usually the main tool for architects. According to Zhou [64], Revit is one of the leading architectural design tools worldwide. This suggests that this research study area may have a different market structure where ArchiCAD has a stronger presence than Revit.
Figure 7. Use of software based on profession.
While software adoption serves as a significant indicator of BIM utilization, its validity as a standalone metric remains a subject of academic debate. Some scholars argue that software proficiency is a primary driver of adoption; however, others advocate for a more comprehensive perspective. This broader view posits that the mere application of BIM-authoring tools, such as Revit or ArchiCAD, does not inherently constitute true BIM. Without standardized data exchange and interdisciplinary collaboration, professionals may continue to work in traditional silos. Therefore, while software usage is a vital component of BIM adoption, it fails to fully capture the depth of integration and collaborative synergy within the industry.

4.6. Level of Use of BIM

The level of use of BIM is based on the maturity level of use of BIM as described in Section 2.1. Figure 8 shows the results for the level of use of BIM.
Figure 8. Degree of BIM usage.
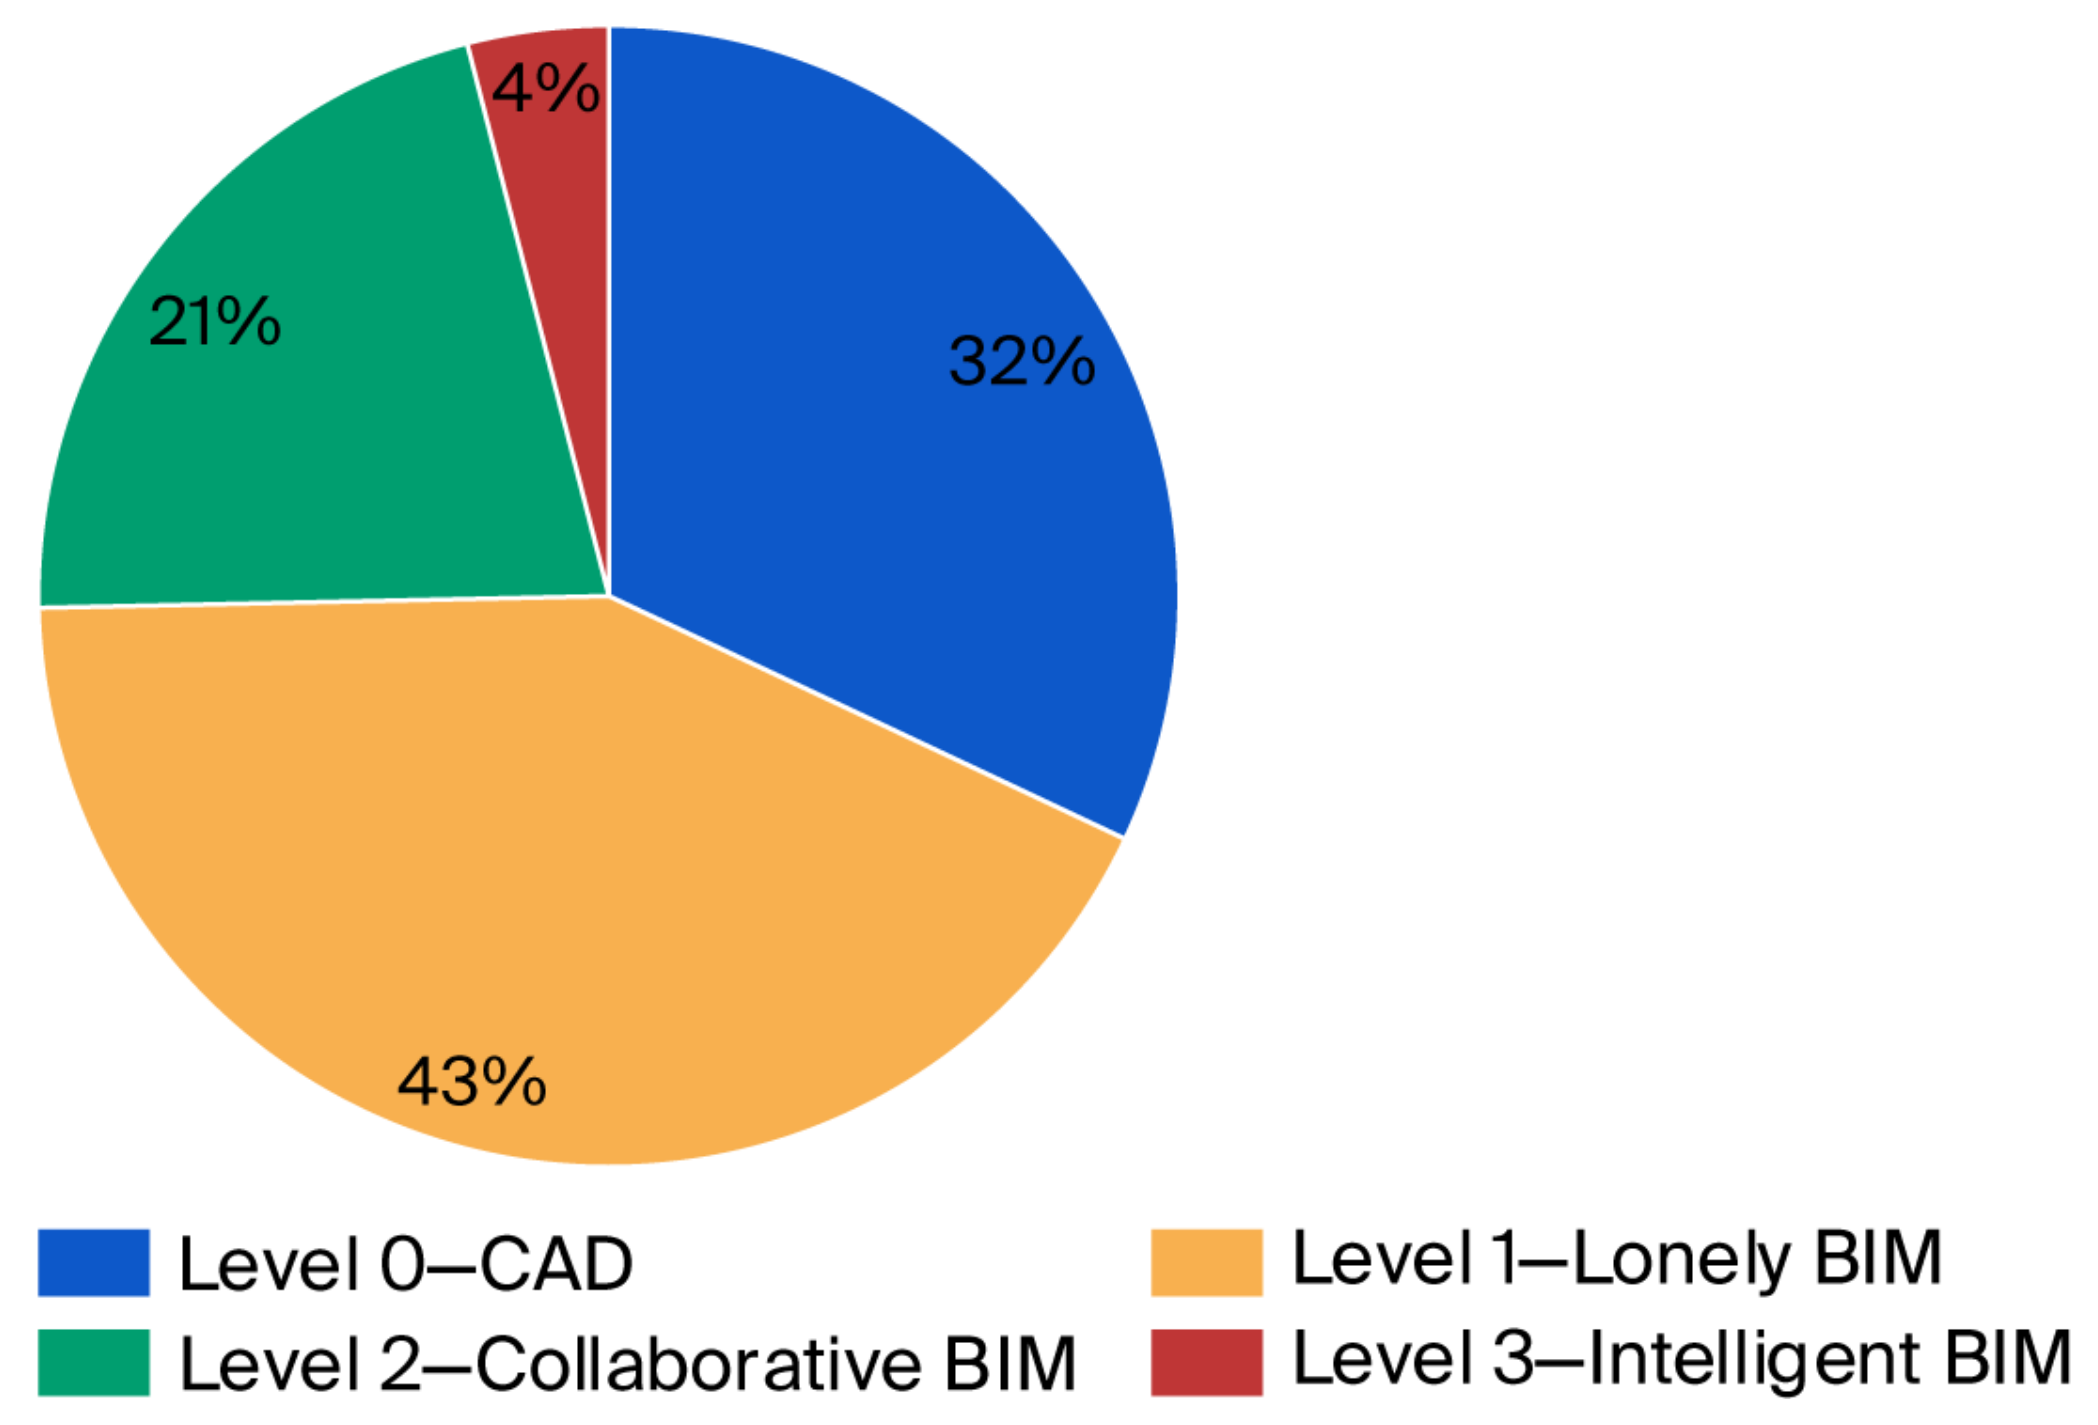
Figure 8 shows that 32% of the respondents stated they were at level 0 of BIM implementation, while 42.7% indicated they were at level 1, 21.3% indicated they were at level 2, and only 4% of those surveyed stated they were at level 3. Further analysis was performed by segregating the results into professional groups. Figure 9 shows the segregated results according to profession.
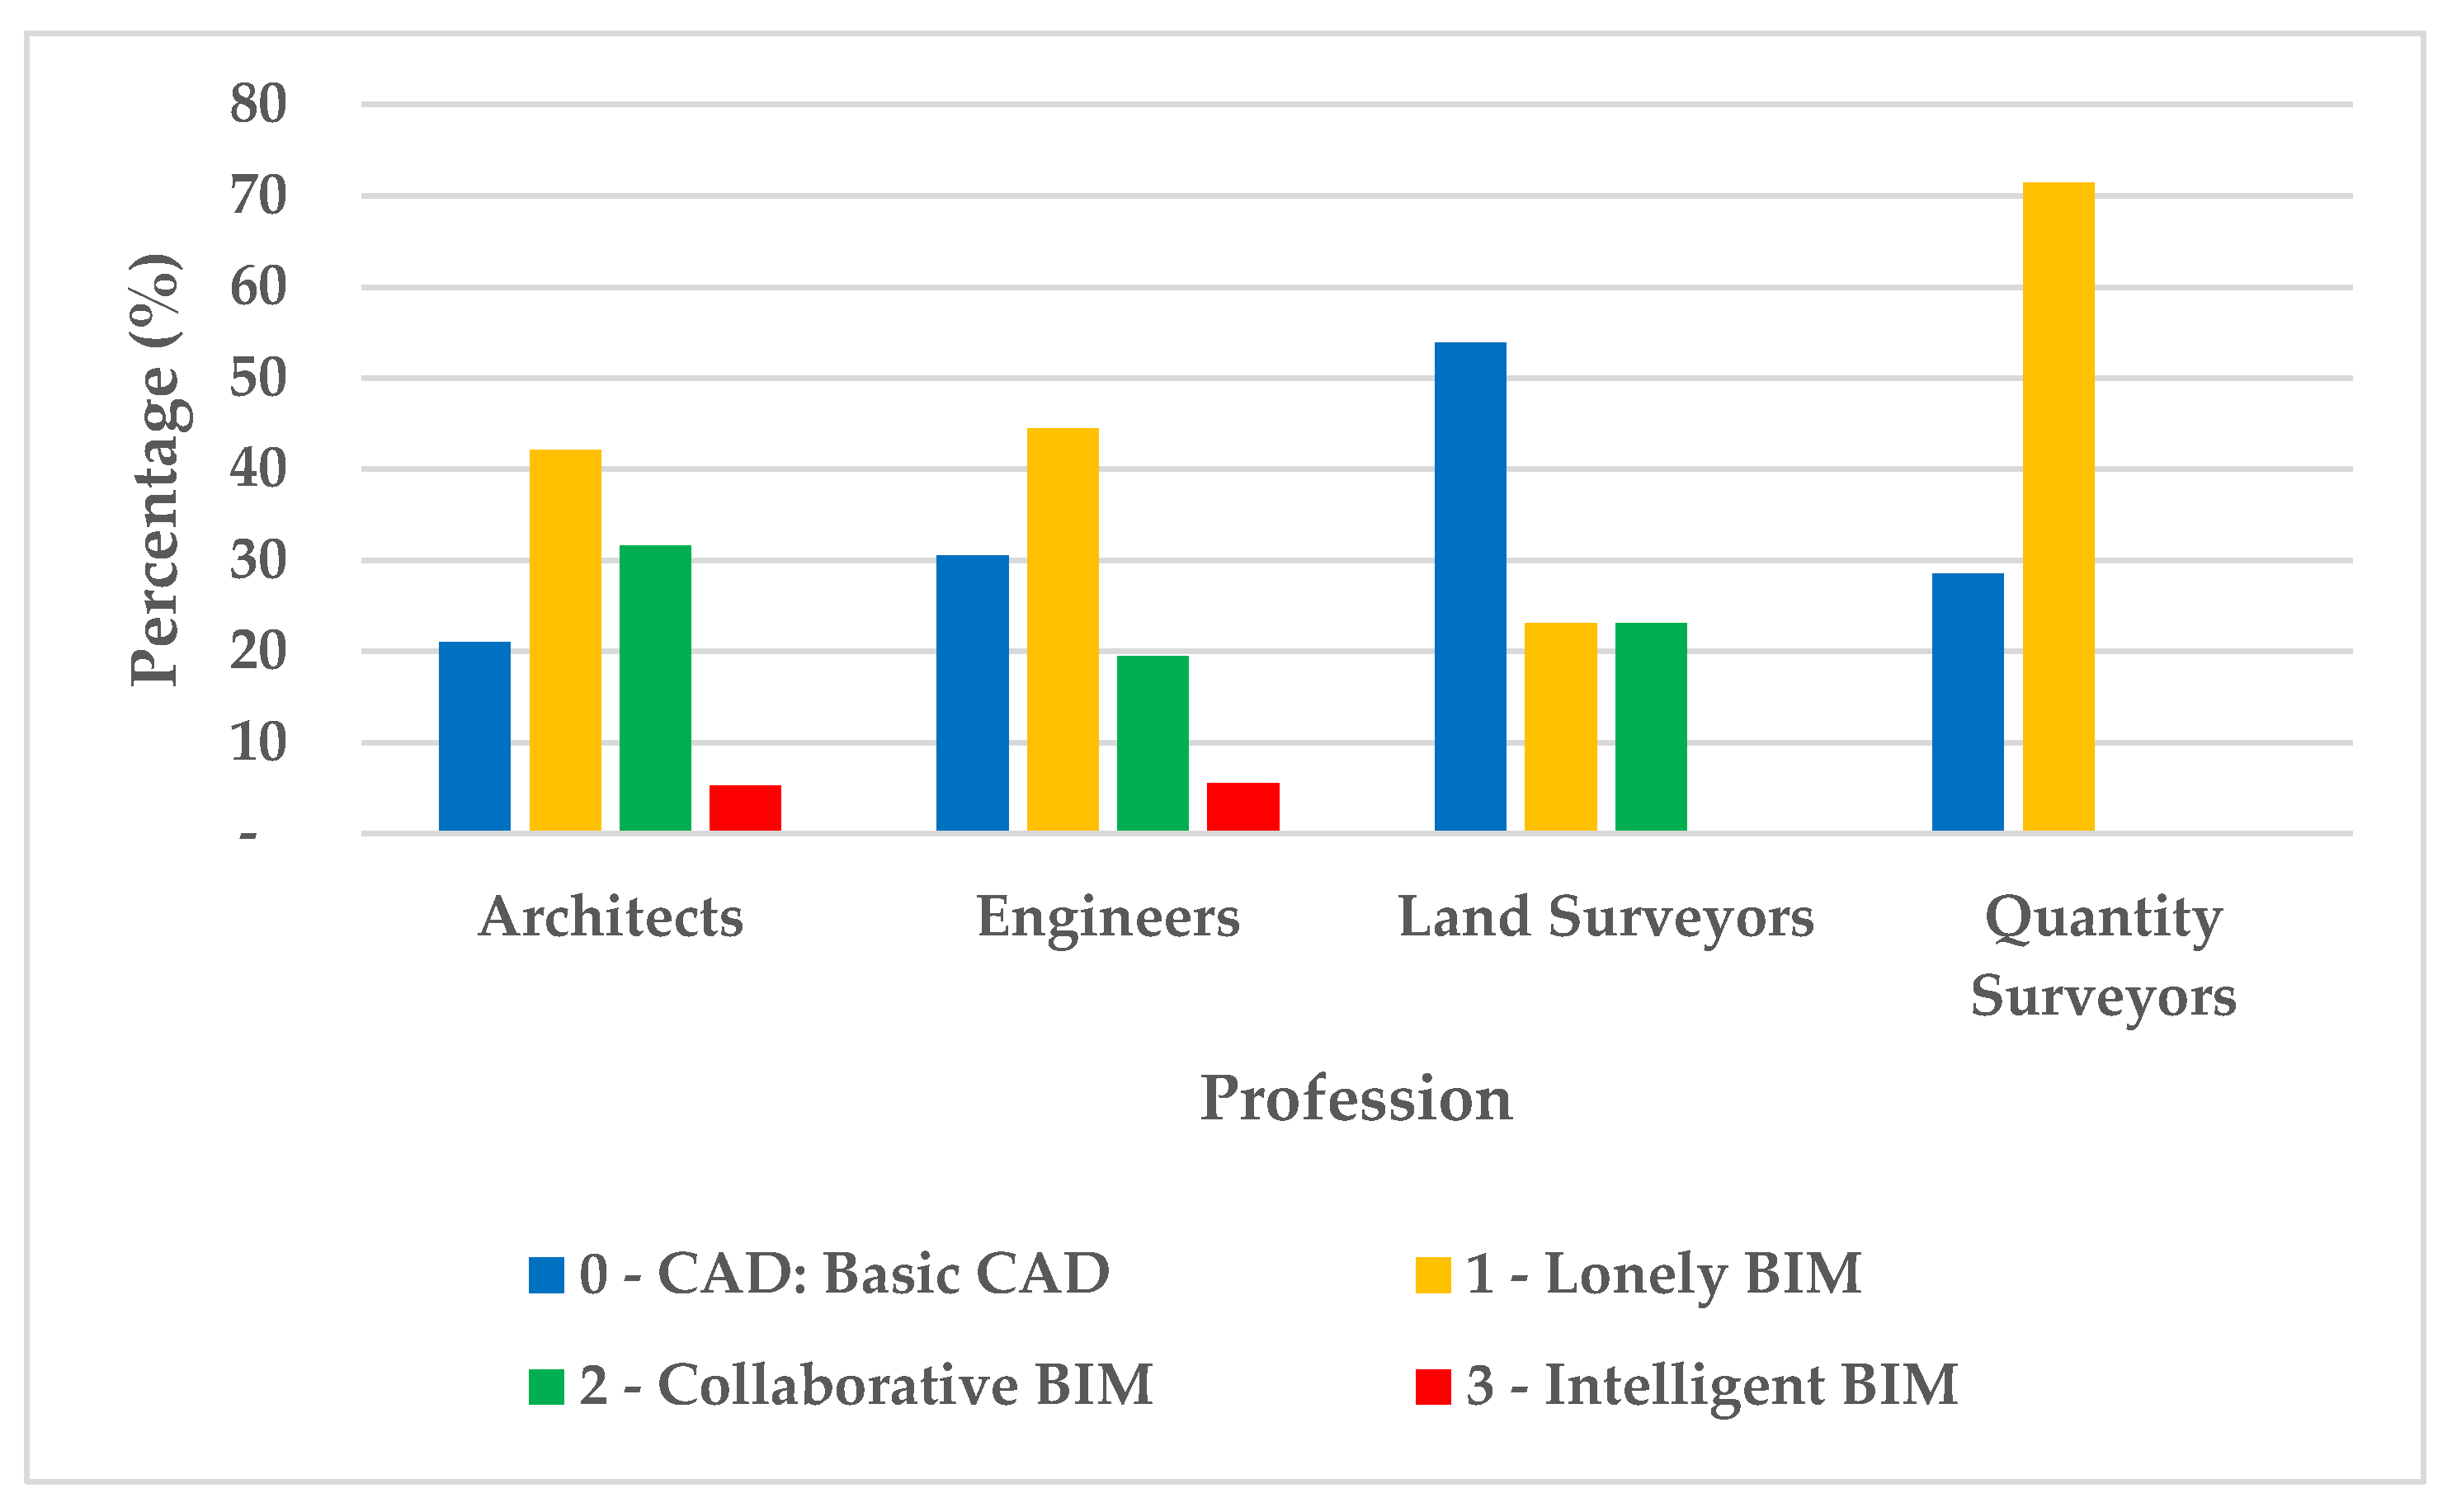
Figure 9. Level of BIM use according to profession.
Figure 9 indicates that the majority of architects, engineers, and quantity surveyors operate at BIM Level 1, whereas most land surveyors remain at Level 0. The distribution for architects appears relatively even across the levels, suggesting that this profession has been engaging with BIM technology for a longer period compared with the other professional groups. Engineers follow a similar but slightly less advanced pattern. The figure further shows that only two professional groups, architects and engineers, have respondents operating at Level 3.
These findings on BIM maturity correspond closely with the types of software used, as discussed in the preceding section. Level 1 represents isolated BIM, which incorporates limited three-dimensional (3D) modeling components and forms the foundational stage of BIM implementation. The results indicate that a combined 74.7% of respondents operate at either Level 0 or Level 1, suggesting that BIM adoption within the study area remains at an early stage. This stage is characterized primarily by fragmented two-dimensional (2D) drafting practices and localized 3D modeling rather than fully integrated digital collaboration.
This pattern is consistent with the findings of Olanrewaju et al. [65], who reported that many AEC industries in developing economies struggle to progress beyond Level 1 due to high software costs and the absence of standardized regulatory mandates—conditions that are also typical of Malawi. The substantial decline in adoption at Level 2 (21.3%) and Level 3 (4%) further reflects the global BIM maturity gap identified by Sacks et al. [66], where the transition to collaborative BIM environments and cloud-based integration (Level 3) is often achieved only by large firms with well-developed digital infrastructures.
Moreover, the disaggregation of results by profession is justified by Jung and Lee [57], who argue that BIM maturity tends to vary significantly across the project lifecycle. Architects generally lead in modeling maturity, while surveyors and smaller contractors often remain at Level 0. This variation highlights the importance of presenting professional-specific distributions, as illustrated in Figure 9.
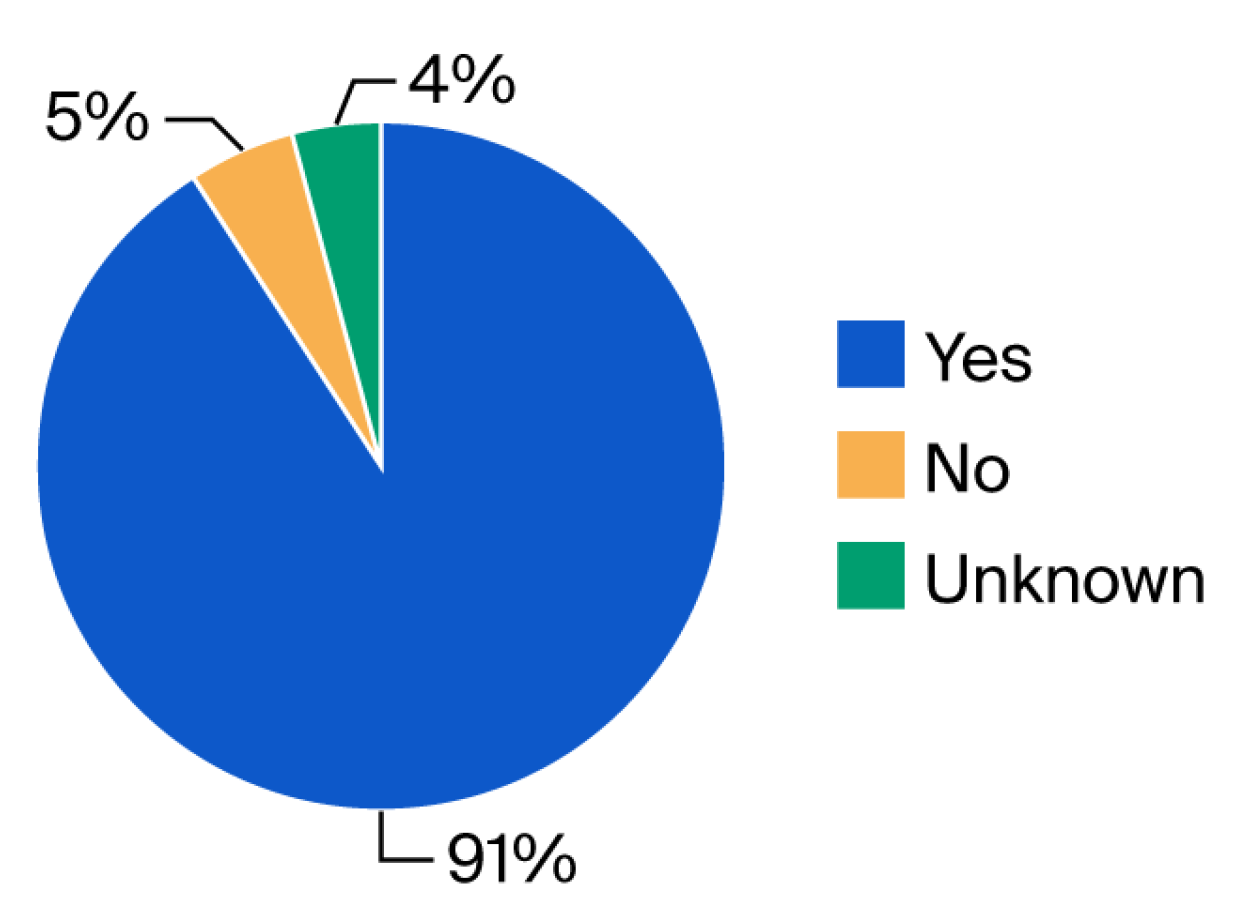
Figure 10 shows that 90.6% of those surveyed were aware of the BIM benefits and 5.3% were not aware, while the benefits were completely unknown to 4%. Considering the high percentage of awareness, this is a positive indication that BIM technology uptake can easily take place when promoted.
Figure 10. Awareness of BIM benefits.
The respondents then had to rate the importance of the 25 BIM benefit variables which were selected from the literature review. Table 11 displays the findings of the analysis of the rate of importance of the selected BIM benefits.
Table 11. Ranking of benefits of BIM.
  • Correlation Analysis of Project Delivery Methods
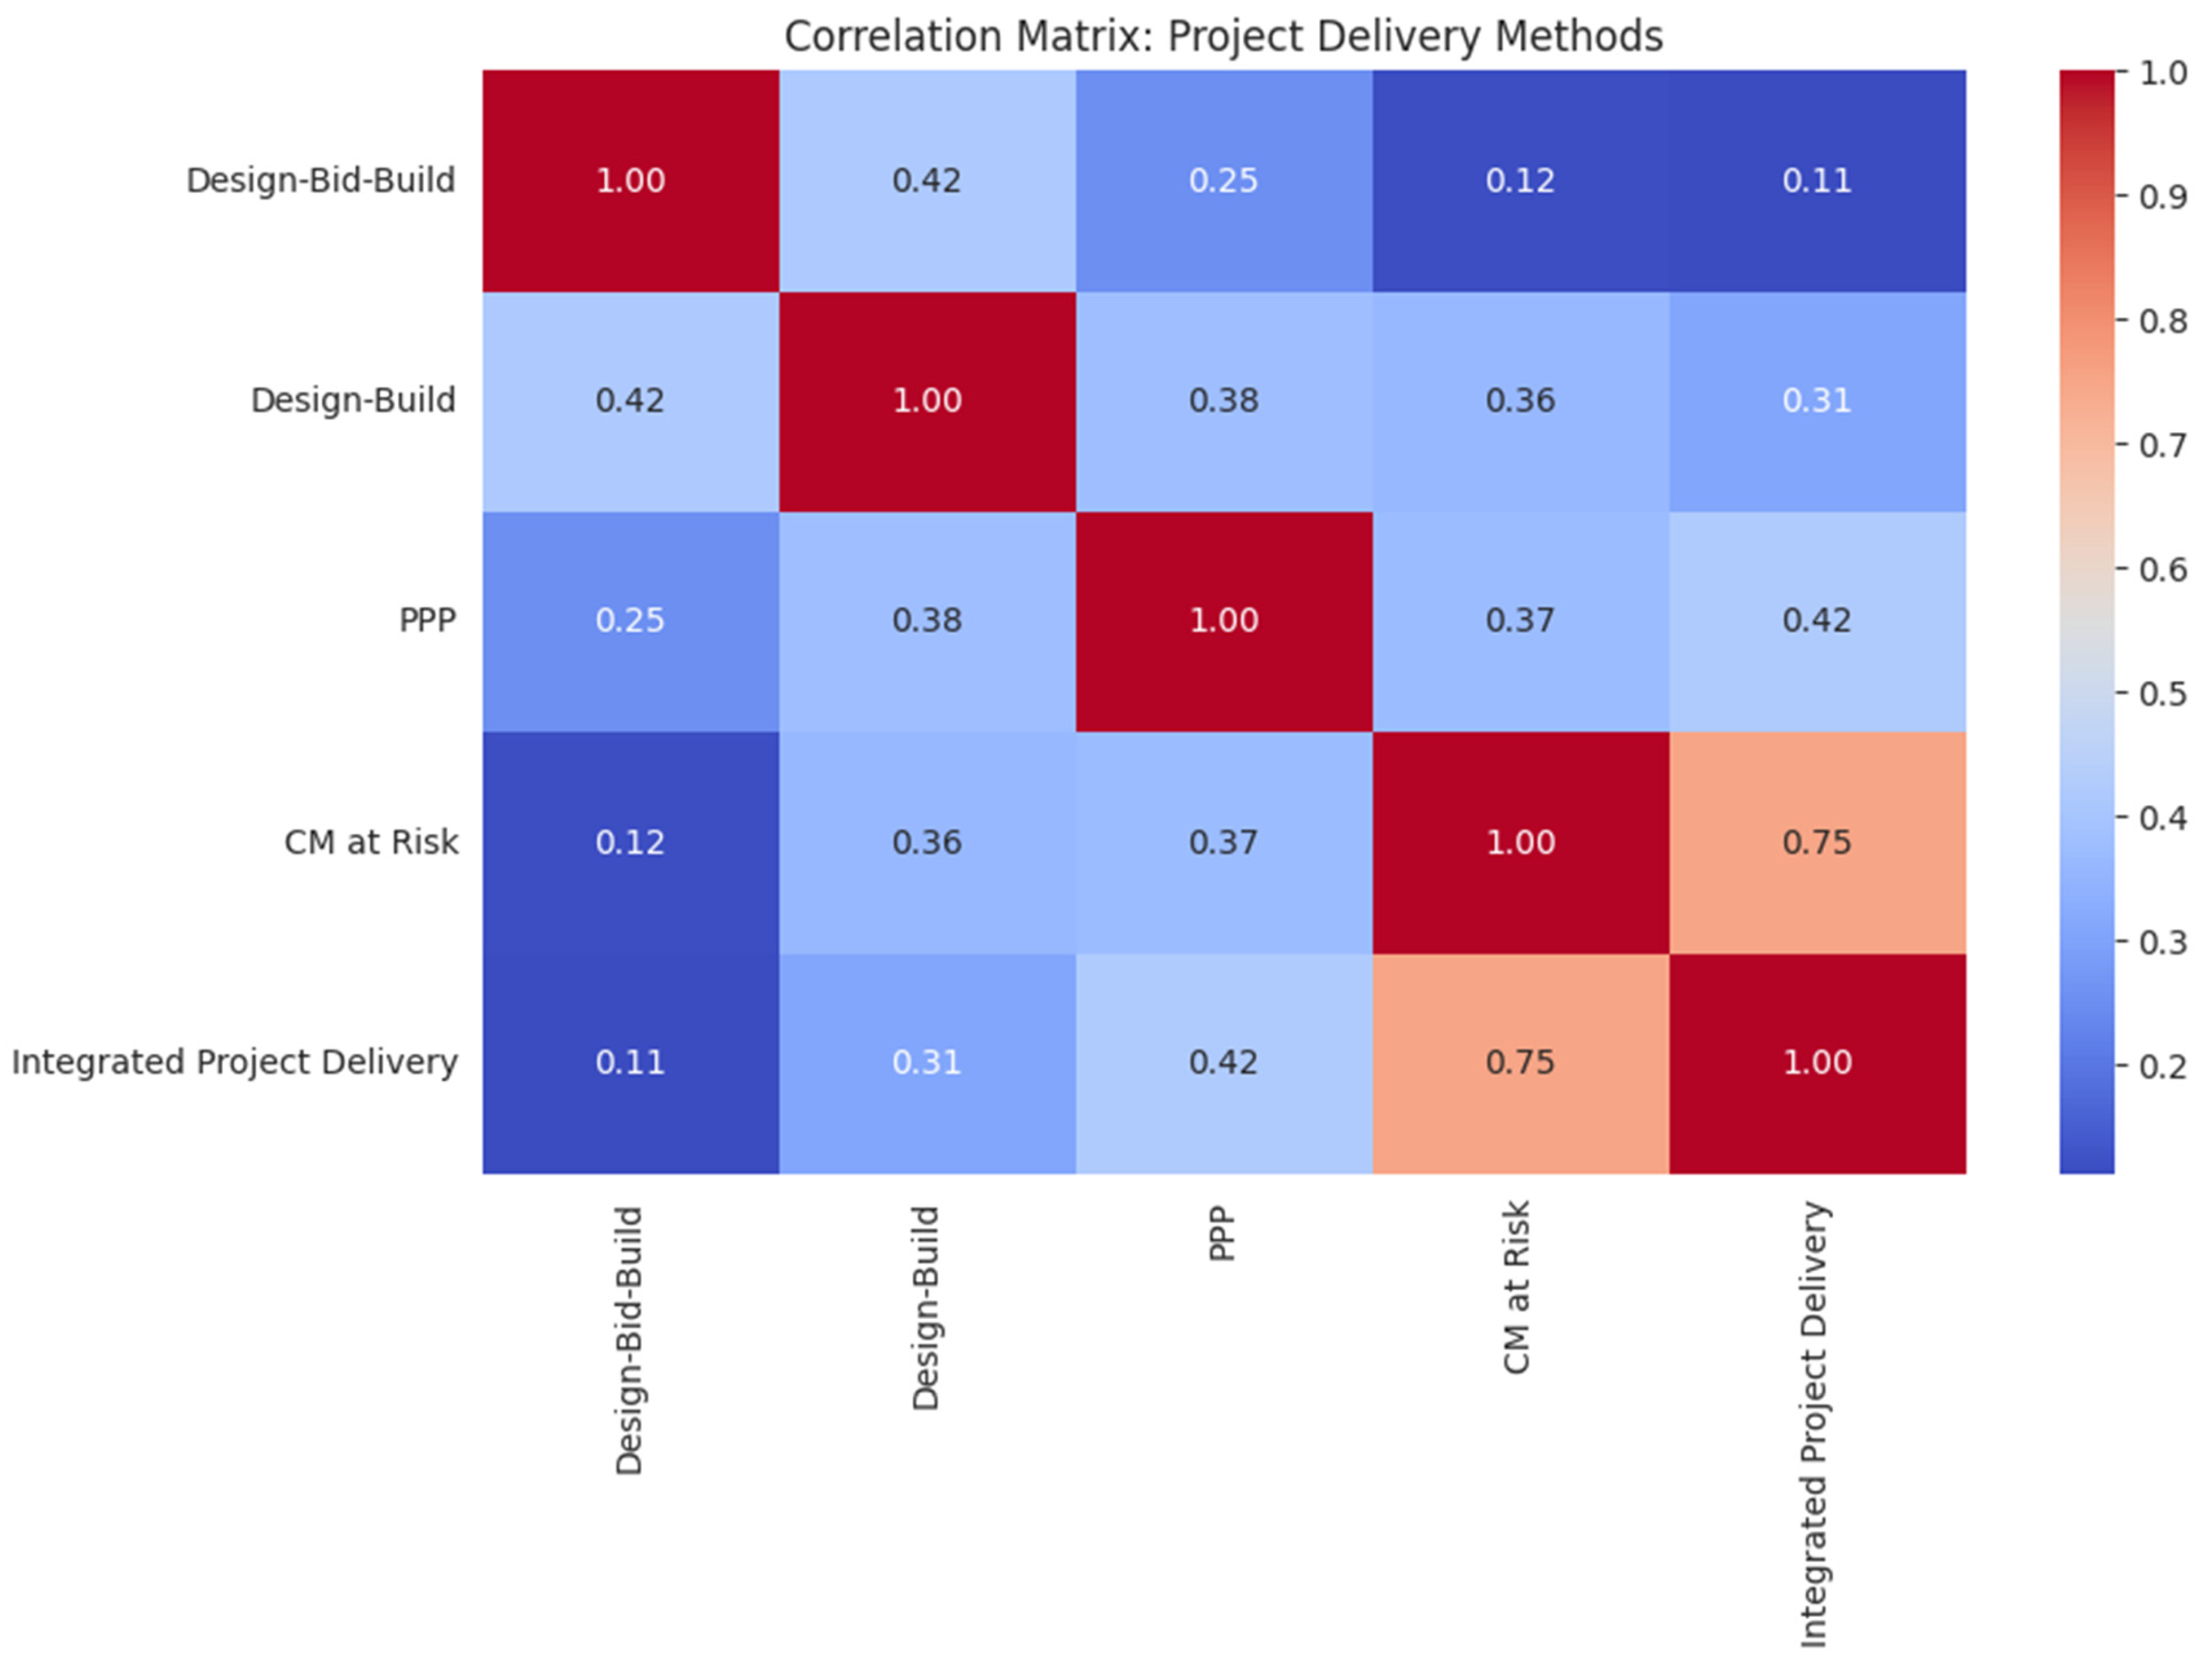
The findings from the correlation matrix illustrated in Figure 11 highlight a critical intersection between procurement strategy and digital transformation, where the strong relationship between CM at Risk and Integrated Project Delivery (IPD) (r = 0.75) depicts a significant shift toward collaborative frameworks necessary for BIM maturity. This observation aligns with the foundational theories of Succar [67] and Sacks et al. [66], who argue that BIM is not merely a technical tool but a collaborative process that thrives in environments where risk and reward are shared. Studies by Kent and Becerik-Gerber [68] similarly confirm that IPD and CM at Risk provide contractual fertile ground for BIM by facilitating early contractor involvement, which resolves the fragmented workflows typical of the AEC industry. In the Malawian context, this suggests that as projects move toward more complex delivery methods like Public–Private Partnerships (PPP), which showed moderate correlations with IPD (r = 0.42), the demand for BIM as a coordination mechanism naturally intensifies to manage the inherent risks of large-scale infrastructure [15].
Figure 11. Correlation analysis of project delivery methods.
The weak correlations between Design-Bid-Build (DBB) and integrated methods (r = 0.11 to 0.12) indicate a persistent structural silos problem that likely hinders BIM adoption in Malawi’s public sector. This implication is supported by Olanrewaju et al. [69], who note that traditional procurement remains a primary barrier to BIM because it legally separates design from construction, discouraging the real-time data exchange that BIM requires. The moderate correlation of Design-Build (r = 0.36 to 0.42) with both traditional and integrated methods suggest it serves as a transitional delivery model, capable of supporting BIM but often limited by the same adversarial relationships found in DBB [2]. Ultimately, these findings imply that for Malawi to achieve higher BIM maturity, there must be a policy shift away from fragmented traditional procurement toward integrated models that legally and financially incentivize the collaborative behaviors evidenced in the IPD and CM at Risk correlation.
  • BIM Maturity Rating
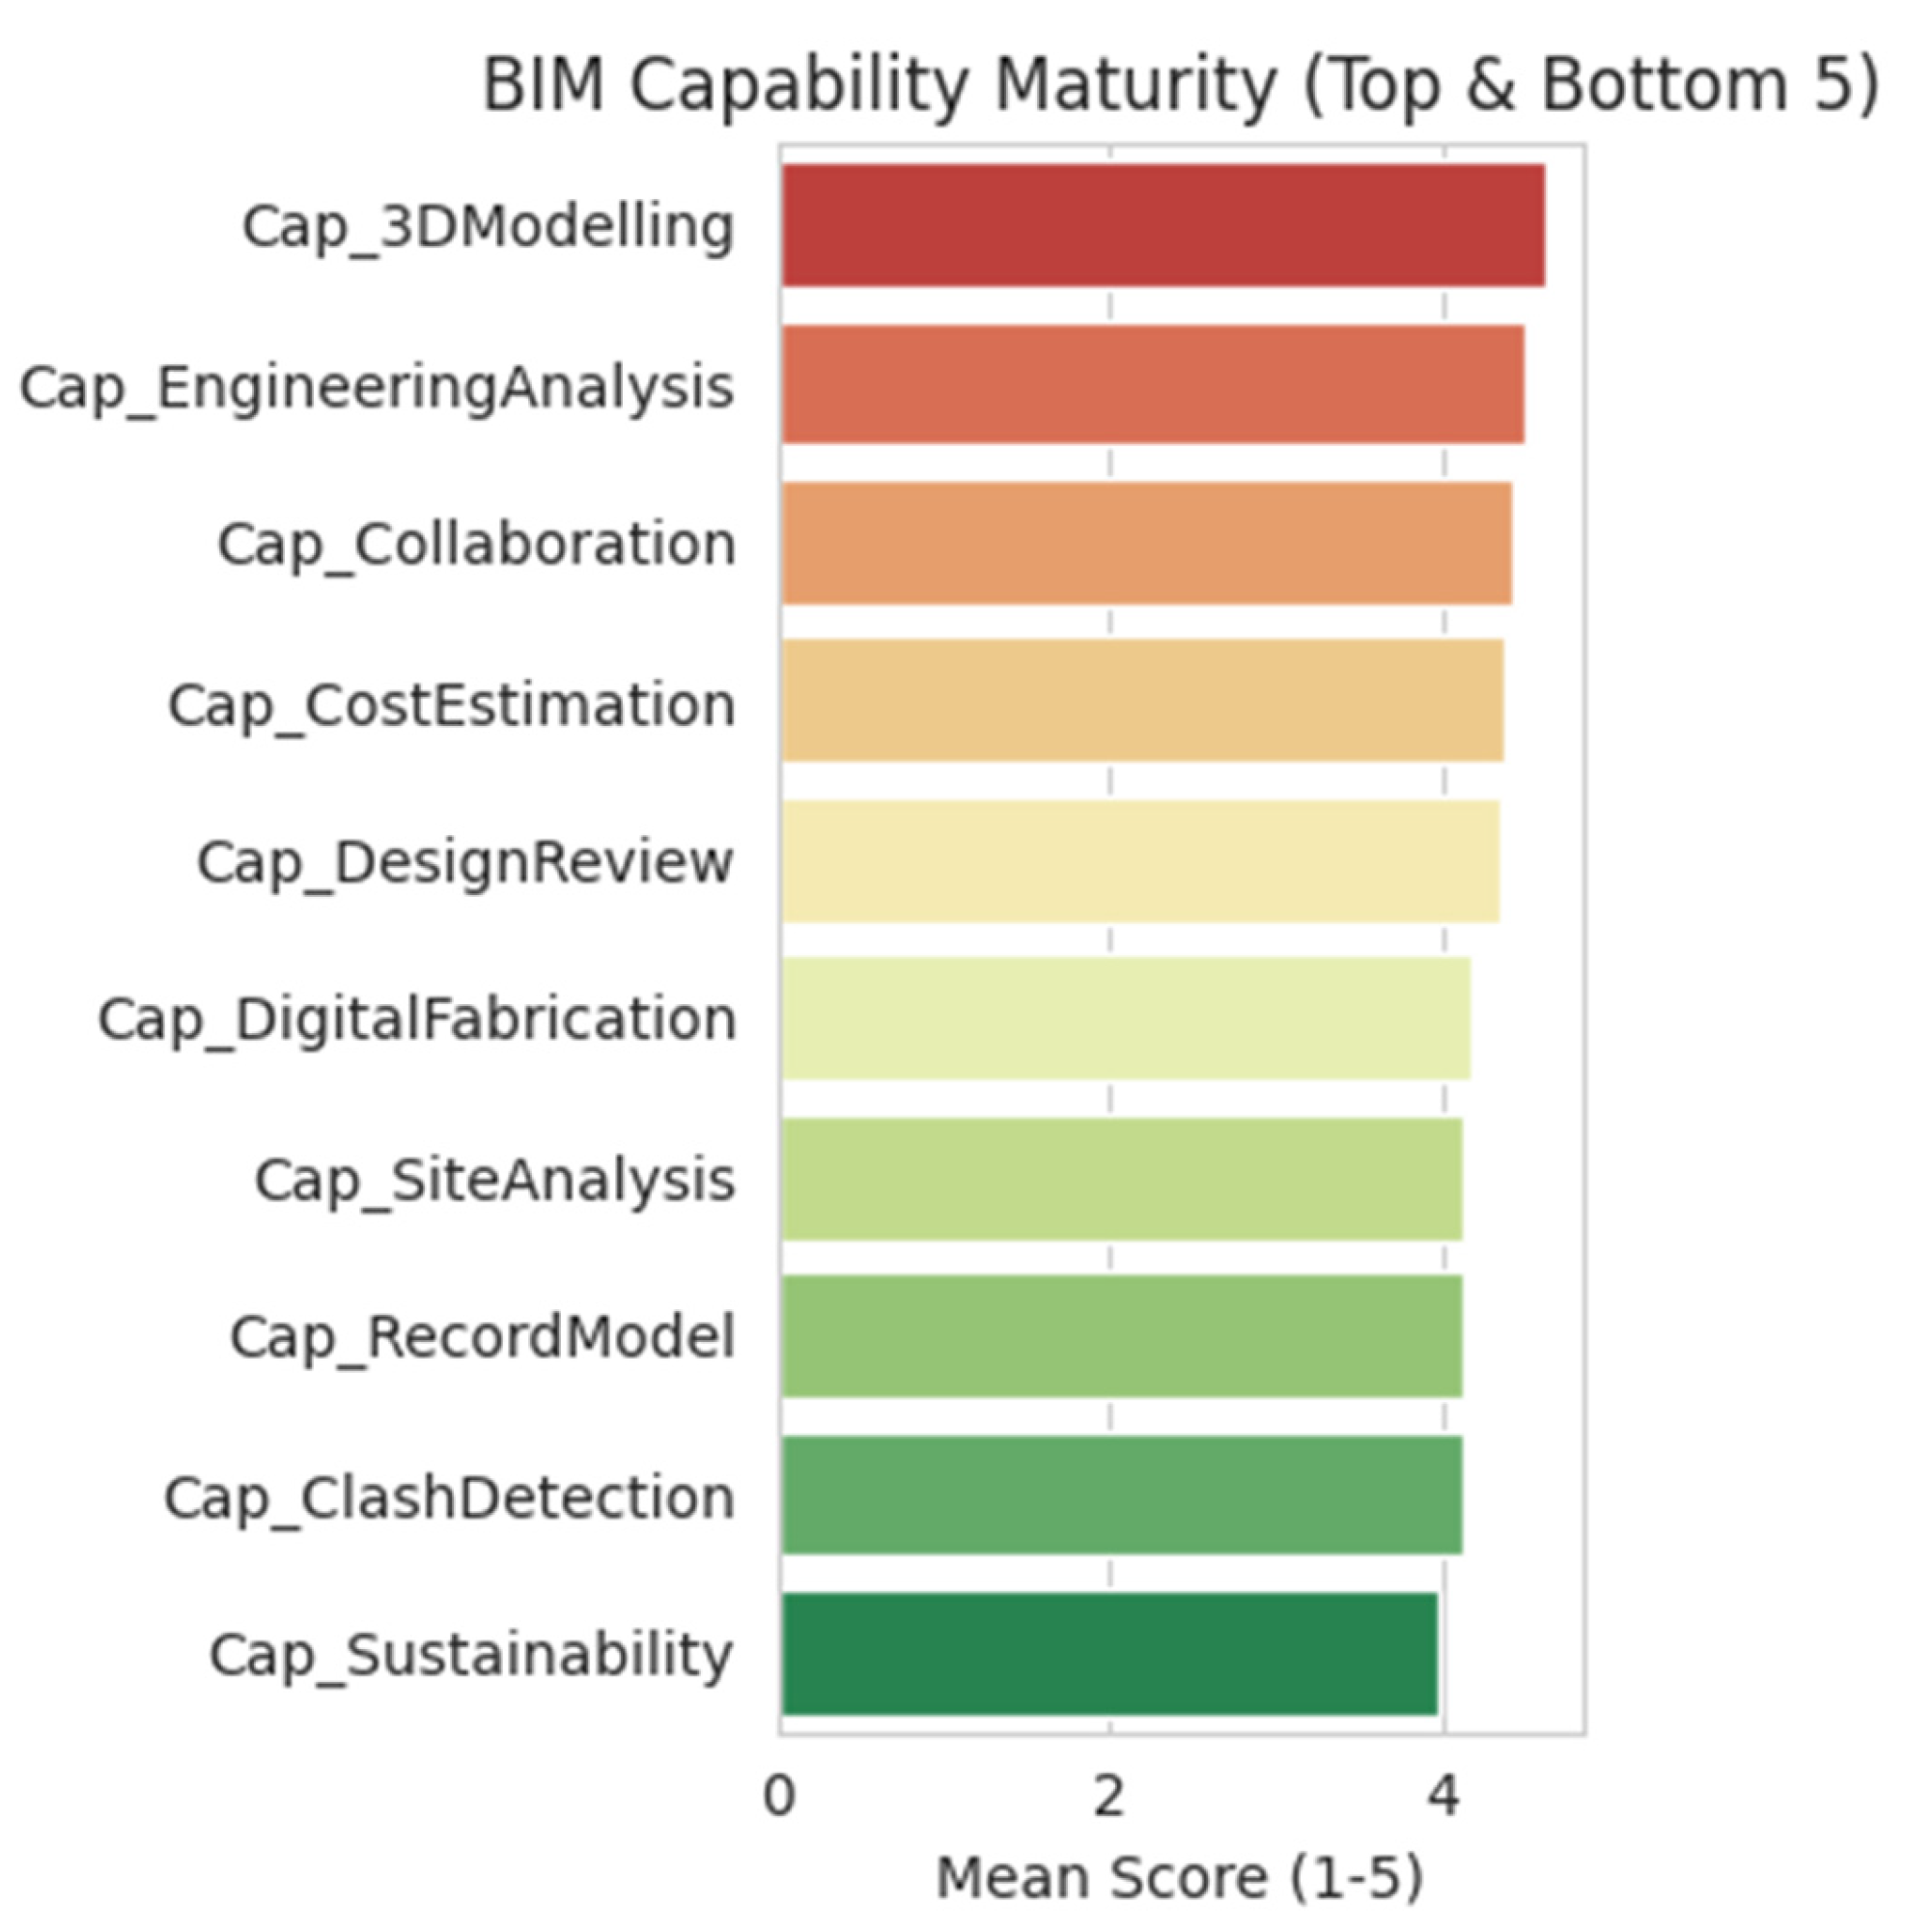
BIM adoption within the Malawian AEC industry is currently characterized by a paradoxical relationship between high perceived capability and severe structural barriers. The findings indicate that professionals rate their technical maturity highly in areas such as 3D Modelling and Engineering Analysis, both of which achieved mean scores above 4.0. However, these capabilities are effectively constrained by external systemic challenges (see Figure 12). This discrepancy aligns with the modeling-heavy, process-light trend identified by Succar [67], where technical proficiency in software does not necessarily translate into integrated BIM maturity if collaborative and informational pillars are weak. These results show that the most acute impediments are financial and educational, with Software Cost and Finance emerging as the barriers with the highest impact ratings. This mirrors regional observations by Adetoro et al. [15] and Olanrewaju et al. [65], who emphasize that the high capital investment required for BIM licensing and hardware often restricts advanced implementation to a small subset of the market, regardless of individual user skill levels.
Figure 12. Capability Maturity Analysis.
  • Capabilities and Project Success Indicators
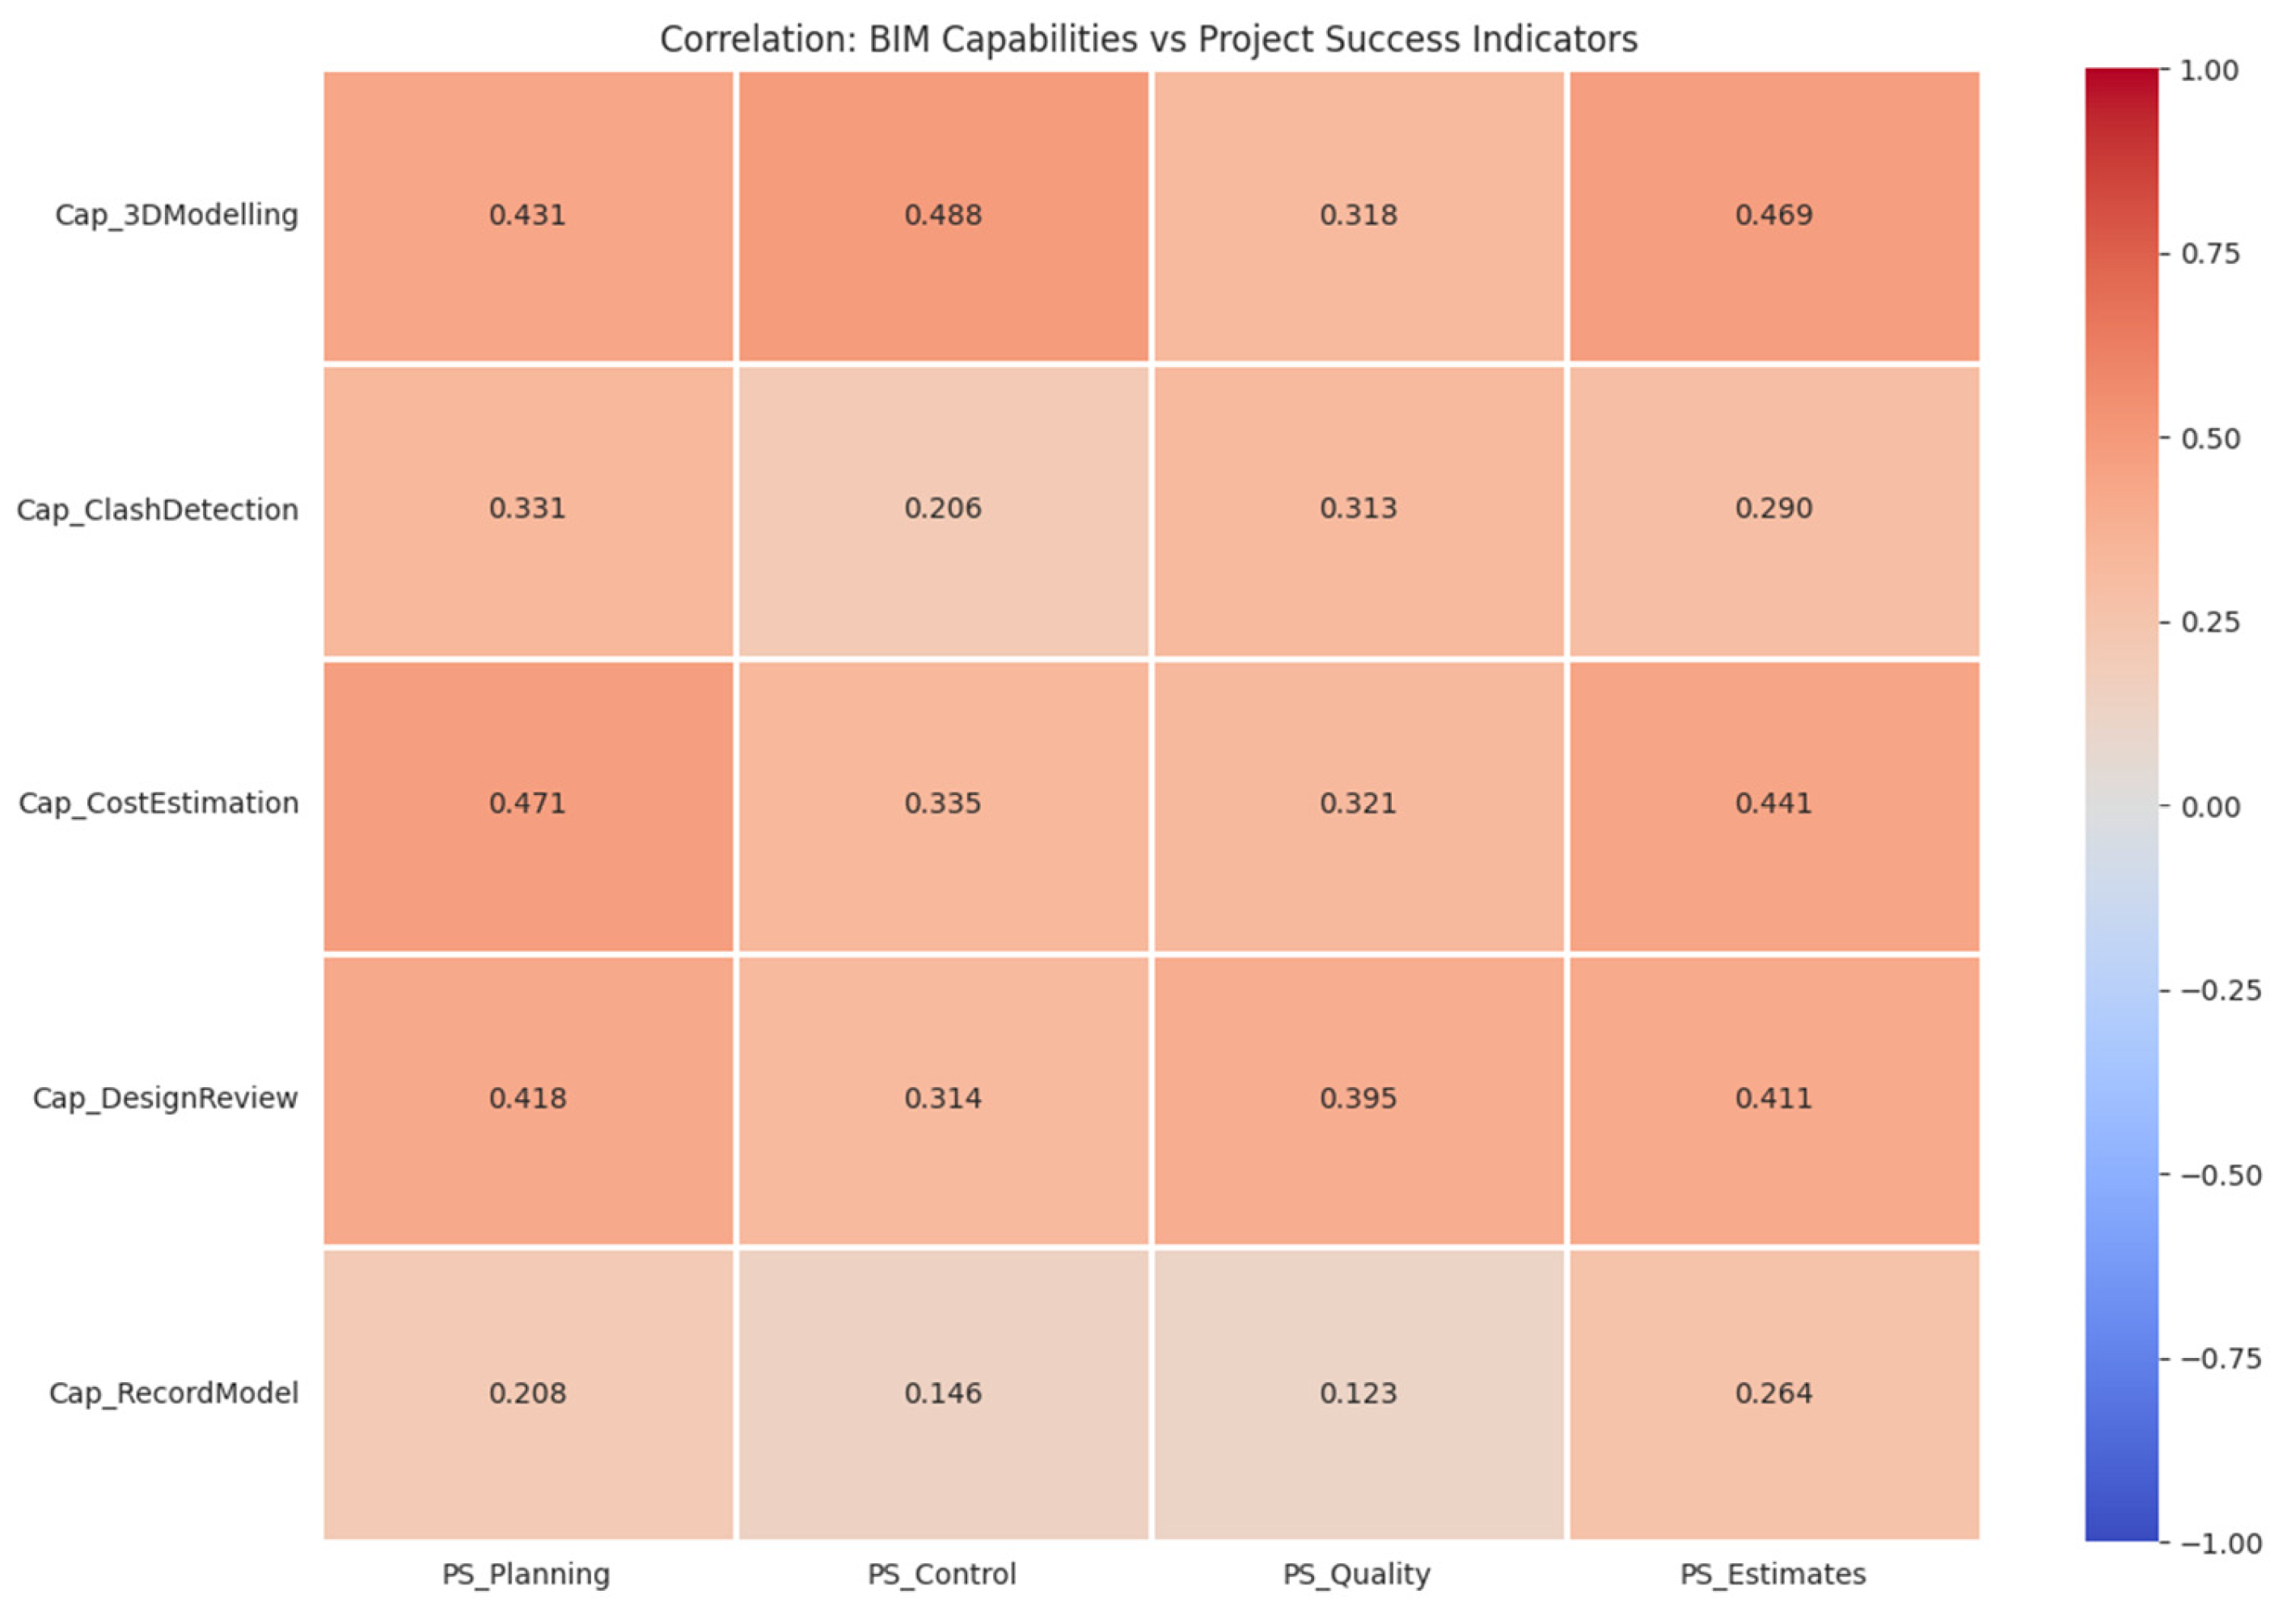
The correlation matrix in Figure 13 shows positive relationships between BIM capabilities and project success indicators. This means that stronger BIM capabilities are associated with better project outcomes. However, the strength of the relationships differs across capabilities and indicators.
Figure 13. Correlation Analysis of BIM Capabilities and Project Success Indicators.
Cap 3D Modelling shows moderate positive correlations with all the success indicators. It has a correlation of 0.431 with project planning, 0.488 with project control, 0.318 with project quality, and 0.469 with cost estimates. The strongest relationship is with project control, followed by cost estimates and planning. The relationship with quality is slightly lower but still moderate.
Cap Clash Detection shows weaker positive correlations compared to other capabilities. Its correlation is 0.331 with planning, 0.206 with control, 0.313 with quality, and 0.290 with estimates. The relationship with project control is the weakest among these, while planning and quality show slightly stronger but still modest associations.
Cap Cost Estimation has moderate positive correlations with all the success indicators. It has a correlation of 0.471 with planning, 0.335 with control, 0.321 with quality, and 0.441 with estimates. The strongest relationship is with planning, followed closely by estimates. The relationships with control and quality are moderate but lower.
Cap Design Review also shows moderate positive relationships. It has a correlation of 0.418 with planning, 0.314 with control, 0.395 with quality, and 0.411 with estimates. The strongest association is with planning, followed by estimates and quality. The relationship with control is slightly weaker but still moderate.
The Cap Record Model shows the weakest correlations overall. Its values are 0.208 with planning, 0.146 with control, 0.123 with quality, and 0.264 with estimates. These are low positive correlations, indicating a weaker association with the project success indicators compared to the other BIM capabilities.
Generally, the correlation analysis reveals that BIM capabilities in Malawi are most effective when applied to front-end tasks, such as 3D with Project Control and Cost Estimation with Planning. These moderate positive relationships suggest that digital visualization and automated quantity take-offs are currently the strongest drivers of project success, providing tangible improvements in site management and budget predictability. This aligns with research by Saka and Chan [21] and Adetoro et al. [15], who note that in developing AEC markets, the most immediate return on investment from BIM is found in reducing the uncertainty associated with manual drafting and traditional estimation methods.
The lifecycle and coordination-heavy capabilities, like clash detection with control and record modelling with quality, show significantly weaker associations with success indicators. This coordination gap implies that BIM is often used by single disciplines in isolation, failing to reach the multi-disciplinary integration required for effective error mitigation or long-term asset management. The implication is that the Malawian AEC sector is currently succeeding at the modelling stage of maturity but is stalled by a lack of collaborative frameworks, such as Integrated Project Delivery (IPD). As argued by Succar [68], unless the industry shifts toward a unified Common Data Environment (CDE), advanced capabilities like clash detection will remain underutilized and disconnected from broader project success metrics.

5. Conclusions

The primary goal of this study was to assess the status of BIM in Malawi. The results offer a thorough evaluation of the BIM scene in Malawi, showing an industry in the early stages of a significant digital shift. The heavy dependence on Civil3D across all fields indicates that the industry mainly operates at BIM Level 0 or 1, where 2D drafting and fragmented 3D modeling dominate over integrated data management. This is further supported by a noticeable skills gap between professions: while architects lead in project experience and advanced software use, quantity surveyors lack experience with high-volume BIM projects, highlighting a major obstacle to achieving 5D cost integration. The findings also reveal that Malawi’s AEC industry is behind in BIM maturity. Although many professionals can model in 3D, the industry still struggles with effective collaboration. Additionally, the strong link between Integrated Project Delivery (IPD) and BIM adoption confirms that traditional, fragmented procurement methods like Design-Bid-Build are inherently incompatible with the collaborative nature of digital construction.
For Malawi to realize the full benefits of BIM, the focus must shift from merely adopting software to reforming the processes that govern the construction sector. It is recommended that the government and professional bodies establish national BIM standards and mandates to provide a unified framework for the industry, ensuring seamless data sharing across disciplines. Finally, a policy shift away from fragmented traditional procurement toward integrated models, such as CM at Risk and IPD, is essential to legally and financially incentivize the collaborative behaviors required for high-maturity BIM implementation.
Beyond the Malawian context, the findings carry important implications for BIM adoption across developing economies more broadly. The study demonstrates that technical awareness and individual-level proficiency, while necessary, are insufficient conditions for meaningful BIM maturity without corresponding institutional scaffolding. In contexts characterized by limited public investment, fragmented regulatory environments, and nascent digital infrastructure, BIM adoption risks remaining confined to isolated pockets of practice unless governments and professional bodies take an active coordination role. The Malawian case illustrates that the gap between awareness and implementation is not primarily a knowledge problem but a structural one, shaped by the absence of national mandates, standardized data protocols, and formally integrated procurement frameworks. For other lower-income economies at similar stages of digital construction transition, these findings reinforce the importance of sequencing BIM policy interventions: establishing baseline capacity through technical education and curriculum reform, followed by institutional legitimation through regulatory mandates, and ultimately enabling industry-wide adoption through procurement reform that incentivizes collaborative delivery. Capacity building, in this sense, should be understood not merely as professional training but as the simultaneous development of organizational processes, regulatory frameworks, and educational ecosystems that together create the enabling conditions for sustained BIM diffusion.
A key methodological weakness of this study is the reliance on non-probability purposive sampling and self-reported measures, which might limit the objectivity of the findings. In addition, BIM maturity levels were derived from self-reported software use and capability indicators without independent technical verification, which introduces the possibility of overestimation or subjective bias. Some respondents did not answer BIM-related questions, likely due to limited exposure, and this non-response may affect the accuracy of the maturity assessment. Furthermore, while self-assessment is a commonly used approach to capturing industry perceptions, it is important to acknowledge the inherent risk of response bias. Respondents may inadvertently overestimate their organization’s BIM maturity due to a lack of objective benchmarks or a desire to appear more digitally advanced. Future research could mitigate this by pairing survey data with direct observation or document analysis of project models to verify reported maturity levels. These limitations might mean that the results should be interpreted as indicative of current trends among surveyed professionals rather than as definitive measures of national BIM adoption levels.

Author Contributions

Conceptualization, J.C. and I.K.; methodology and publication search, J.C. and W.K.; analysis, J.C.; writing—original draft preparation, J.C.; writing—review and editing, I.K. and W.K.; supervision—I.K. and W.K. All authors have read and agreed to the published version of the manuscript.

Funding

This research received no external funding.

Institutional Review Board Statement

Ethical review and approval were waived for this study due to the nature of the research which was about project systems not directly studying humans or animals.

Data Availability Statement

Data are available upon request.

Conflicts of Interest

The authors declare no conflicts of interest.

References

  1. Arellano, K.; Andrade, A.; Castillo, T.; Herrera, R.F. Assessment of BIM use in the early stages of implementation. Rev. Ing. Constr. 2021, 36, 311–321. [Google Scholar] [CrossRef] [Scilit]
  2. Saka, A.B.; Chan, D.W.M. A scientometric review and metasynthesis of building information modelling (BIM) research in Africa. Buildings 2019, 9, 85. [Google Scholar] [CrossRef] [Scilit]
  3. Kulemeka, P.J.; Kululanga, G.; Morton, D. Critical Factors Inhibiting Performance of Small- and Medium-Scale Contractors in Sub-Saharan Region: A Case for Malawi. J. Constr. Eng. 2015, 2015, 927614. [Google Scholar] [CrossRef] [Scilit]
  4. Chilipunde, R.L. Contraints and Challenges Faced by Small, Medium and Micro Enterprise Contractors in Malawi. Master’s Thesis, Nelson Mandela Metropolitan University, Port Elizabeth, South Africa, 2010. [Google Scholar]
  5. Chagunda, J.G. Main Challenges of Road Infrastructure Development Projects in Malawi: A Case Study of Six Road Projects. Master’s Thesis, University of Malawi, The Polytechnic, Blantyre, Malawi, 2017. [Google Scholar]
  6. Emuze, F.; Kadangwe, S. Diagnostic view of road projects in Malawi. Proc. Inst. Civ. Eng. Munic. Eng. 2014, 167, 44–55. [Google Scholar] [CrossRef] [Scilit]
  7. Hershey, R.; Kalina, M.; Kafodya, I.; Tilley, E. A sustainable alternative to traditional building materials: Assessing stabilised soil blocks for performance and cost in Malawi. Int. J. Sustain. Eng. 2023, 16, 155–165. [Google Scholar] [CrossRef] [Scilit]
  8. Kafodya, I.; Basuroy, D.; Marangu, J.M.; Kululanga, G.; Maddalena, R.; Novelli, V.I. Mechanical Performance and Physico-Chemical Properties of Limestone Calcined Clay Cement (LC3) in Malawi. Buildings 2023, 13, 740. [Google Scholar] [CrossRef] [Scilit]
  9. Malik, A.; Mbewe, P.B.K.; Kavishe, N.; Mkandawire, T.; Adetoro, P. Sustainable Construction Practices in Building Infrastructure Projects: The Extent of Implementation and Drivers in Malawi. Sustainability 2024, 16, 24. [Google Scholar] [CrossRef] [Scilit]
  10. Antwi-Afari, M.F.; Li, H.; Pärn, E.A.; Edwards, D.J. Critical success factors for implementing building information modelling (BIM): A longitudinal review. Autom. Constr. 2018, 91, 100–110. [Google Scholar] [CrossRef] [Scilit]
  11. McGraw Hill Construction. The Business Value of BIM in North America; McGraw Hill Construction: New York, NY, USA, 2012. [Google Scholar]
  12. Bryde, D.; Broquetas, M.; Volm, J.M. The project benefits of building information modelling (BIM). Int. J. Proj. Manag. 2013, 31, 971–980. [Google Scholar] [CrossRef] [Scilit]
  13. Ndwandwe, M.; Kuotcha, W.; Mkandawire, T. Building information modeling: Implementation challenges in the Malawian construction industry. Front. Built Environ. 2024, 10, 1474032. [Google Scholar] [CrossRef] [Scilit]
  14. Ndwandwe, M.; Kuotcha, W.; Mkandawire, T. Organizational Readiness for Building Information Modeling Implementation in Malawi: Awareness and Competence. Buildings 2024, 14, 2279. [Google Scholar] [CrossRef] [Scilit]
  15. Adetoro, P.; Kululanga, G.; Mkandawire, T.; Malik, A. A Critical Analysis of Factors Influencing BIM Implementation for Public Projects in Developing Countries: A Case Study of Malawi. Buildings 2025, 15, 502. [Google Scholar] [CrossRef] [Scilit]
  16. Chagunda, J.G.; Kuotcha, W.; Kafodya, I. Factors influencing Building Information (BIM) implementation in developing countries. In Building Smart, Resilient and Sustainable Infrastructure in Developing Countries; CRC Press: Boca Raton, FL, USA, 2023; pp. 273–280. [Google Scholar] [CrossRef] [Scilit]
  17. Miettinen, R.; Paavola, S. Beyond the BIM utopia: Approaches to the development and implementation of building information modeling. Autom. Constr. 2024, 43, 84–91. [Google Scholar] [CrossRef] [Scilit]
  18. McGraw Hill Construction. The Business Value of BIM for Owners; McGraw Hill Construction: New York, NY, USA, 2014. [Google Scholar]
  19. McGraw Hill Construction. The Business Value of BIM in Australia and New Zealand: How Building Information Modeling is Transforming the Design and Construction Industry. In Smartmarket Report; McGraw Hill Construction: New York, NY, USA, 2014. [Google Scholar]
  20. Prinsloo, D.; Bekker, M.C. BIM adoption & implementation trends in the South African AEC industry. Procedia Comput. Sci. 2025, 256, 1921–1928. [Google Scholar] [CrossRef] [Scilit]
  21. Olawumi, T.O.; Chan, D.W. Critical Success Factors (CSFs) for Amplifying the Integration of BIM and Sustainability Principles in Construction Projects: A Delphi Study. In Proceedings of the RICS COBRA Conference, London, UK, 23–24 April 2018. [Google Scholar]
  22. Khosrowshahi, F.; Arayici, Y. Roadmap for implementation of BIM in the UK construction industry. Eng. Constr. Archit. Manag. 2012, 19, 610–635. [Google Scholar] [CrossRef] [Scilit]
  23. Ariono, B.; Wasesa, M.; Dhewanto, W. The Drivers, Barriers, and Enablers of Building Information Modeling (BIM) Innovation in Developing Countries: Insights from Systematic Literature Review and Comparative Analysis. Buildings 2022, 12, 1912. [Google Scholar] [CrossRef] [Scilit]
  24. Saka, A.B.; Chan, D.W. Knowledge, skills and functionalities requirements for quantity surveyors in building information modelling (BIM) work environment: An international Delphi study. Archit. Eng. Des. Manag. 2020, 16, 227–246. [Google Scholar] [CrossRef] [Scilit]
  25. Vidalakis, C.; Abanda, F.H.; Oti, A.H. BIM adoption and implementation: Focusing on SMEs. Constr. Innov. 2020, 20, 128–147. [Google Scholar] [CrossRef] [Scilit]
  26. Mumba, S.; Mwiya, B. Development of a Framework for BIM Implementation in the Zambian AEC Industry. Eur. Mod. Stud. J. 2024, 8, 229–245. [Google Scholar] [CrossRef] [Scilit]
  27. Succar, B.; Kassem, M. Macro-BIM adoption: Conceptual structures. Autom. Constr. 2015, 57, 64–79. [Google Scholar] [CrossRef] [Scilit]
  28. Abbasnejad, B.; Nepal, M.P.; Mirhosseini, S.A.; Moud, H.I.; Ahankoob, A. Modelling the Key Enablers of Organizational Building Information Modelling (BIM) Implementation Interpretive Structural Modelling (ISM) Approach. J. Inf. Technol. Constr. 2021, 26, 974–1008. [Google Scholar] [CrossRef] [Scilit]
  29. Abbasnejad, B.; Nepal, M.P.; Ahankoob, A.; Nasirian, A.; Drogemuller, R. Building Information Modelling (BIM) adoption and implementation enablers in AEC firms: A systematic literature review. Archit. Eng. Des. Manag. 2020, 17, 411–433. [Google Scholar] [CrossRef] [Scilit]
  30. Toan, N.Q.; Van Tam, N.; Diep, T.N.; Anh, P.X. Adoption of Building Information Modeling in the Construction Project Life Cycle: Benefits for Stakeholders. Archit. Eng. 2022, 7, 56–71. [Google Scholar] [CrossRef] [Scilit]
  31. Wong, C.F.; Lau, S.H.; Tan, O.K.; Yap, J.B.H. Critical factors influencing the adoption of building information modelling (BIM) using technological adoption framework and structural equation modelling. Eng. Constr. Archit. Manag. 2025, 32, 967–986. [Google Scholar] [CrossRef] [Scilit]
  32. Olugboyega, O.; Windapo, A.O. Structural equation model of the barriers to preliminary and sustained BIM adoption in a developing country. Constr. Innov. 2022, 22, 849–869. [Google Scholar] [CrossRef] [Scilit]
  33. Ullah, K.; Lill, I.; Witt, E. An Overview of BIM Adoption in the Construction Industry: Benefits and Barriers; Emerald Reach Proceedings Series; Emerald Group Holdings Ltd.: Leeds, UK, 2019; Volume 2, pp. 297–303. [Google Scholar]
  34. Omar, H.; Dulaimi, M. Solutions for effective diffusion of BIM for BIM late adopters: Case study of UAE AEC industry. Int. J. Constr. Manag. 2023, 23, 1484–1493. [Google Scholar] [CrossRef] [Scilit]
  35. Chen, Y.; Gacheri, H.F.; Sun, G. Empirical investigation of building information modelling (BIM) staff’s impact on construction project performance: Evidence in Kenya. Front. Built Environ. 2024, 10, 1441604. [Google Scholar] [CrossRef] [Scilit]
  36. Galperin, H.; Fernanda Viecens, M. Connected for Development? Theory and evidence about the impact of Internet technologies on poverty alleviation. Dev. Policy Rev. 2017, 35, 315–336. [Google Scholar] [CrossRef] [Scilit]
  37. El-Hajj, M. Enhancing Communication Networks in the New Era with Artificial Intelligence: Techniques, Applications, and Future Directions. Network 2025, 5, 1. [Google Scholar] [CrossRef] [Scilit]
  38. Liao, L.; Teo, E.A.L.; Chang, R.; Zhao, X. Diffusion of building information modeling in building projects and firms in Singapore. Sustainability 2020, 12, 7762. [Google Scholar] [CrossRef] [Scilit]
  39. Elhendawi, A.; Omar, H.; Elbeltagi, E.; Smith, A. Practical approach for paving the way to motivate BIM non-users to adopt BIM. Int. J. BIM Eng. Sci. 2019, 2, 1–22. [Google Scholar] [CrossRef] [Scilit]
  40. Yuan, H.; Yang, Y. BIM Adoption under Government Subsidy: Technology Diffusion Perspective. J. Constr. Eng. Manag. 2020, 146, 04019089. [Google Scholar] [CrossRef] [Scilit]
  41. Najjar, M.K.; Tam, V.W.Y.; Di Gregorio, L.T.; Evangelista, A.C.J.; Hammad, A.W.A.; Haddad, A. Integrating parametric analysis with building information modeling to improve energy performance of construction projects. Energies 2019, 12, 1515. [Google Scholar] [CrossRef] [Scilit]
  42. Ghaffarianhoseini, A.; Tookey, J.; Ghaffarianhoseini, A.; Naismith, N.; Azhar, S.; Efimova, O.; Raahemifar, K. Building Information Modelling (BIM) uptake: Clear benefits, understanding its implementation, risks and challenges. Renew. Sustain. Energy Rev. 2017, 75, 1046–1053. [Google Scholar] [CrossRef] [Scilit]
  43. Yamane, T. Statistics: An Introductory Analysis; John Weatherhill, Inc.: Tokyo, Japan, 1973. [Google Scholar]
  44. Stratton, S.J. Assessing the Accuracy of Survey Research. Prehosp. Disaster Med. 2015, 30, 225–226. [Google Scholar] [CrossRef] [Scilit]
  45. Azhar, S. Building Information Modeling (BIM): Trends, Benefits, Risks, and Challenges for the AEC Industry. Leadersh. Manag. Eng. 2011, 11, 241–252. [Google Scholar] [CrossRef] [Scilit]
  46. Sun, C.; Chen, H.; Long, R.; Liao, R. Research on BIM Application Two-Dimensional Maturity Model. Buildings 2022, 12, 1960. [Google Scholar] [CrossRef] [Scilit]
  47. Field, A. Discovering Statistic Using IBM SPSS Statistic, 5th ed.; SAGE Publications Ltd.: London, UK, 2017; Volume 53. [Google Scholar]
  48. Snee, R.D. Using statistical engineering in pharmaceutical and biotech problem solving a case study. Qual. Eng. 2022, 34, 489–498. [Google Scholar] [CrossRef] [Scilit]
  49. Hair, J.F.; Black, W.C.; Babin, B.J.; Anderson, R.E. Multivariate Data Analysis, 8th ed.; Centage Learning: Hampshire, UK, 2019; Available online: www.cengage.com/highered (accessed on 25 March 2026).
  50. Leech, N.L.; Barrett, K.C.; Morgan, G.A. IBM SPSS for Intermediate Statistics: Use and Interpretation, 5th ed.; Routledge: New York, NY, USA, 2015. [Google Scholar]
  51. Bazán, Á.M.; Alberti, M.G.; Álvarez, A.A.; Trigueros, J.A. New perspectives for bim usage in transportation infrastructure projects. Appl. Sci. 2020, 10, 7072. [Google Scholar] [CrossRef] [Scilit]
  52. Chong, H.Y.; Lopez, R.; Wang, J.; Wang, X.; Zhao, Z. Comparative Analysis on the Adoption and Use of BIM in Road Infrastructure Projects. J. Manag. Eng. 2016, 32, 05016021. [Google Scholar] [CrossRef] [Scilit]
  53. Mutonyi, N.; Cloete, C. Adoption of Building Information Modelling in the construction industry in Kenya design quality is influenced by the number of. Acta Structilia 2018, 25, 1–38. [Google Scholar]
  54. Abdul Rahman, I.; Gamil, Y. Assessment of Cause and Effect Factors of Poor Communication in Construction Industry. IOP Conf. Ser. Mater. Sci. Eng. 2019, 601, 012014. [Google Scholar] [CrossRef] [Scilit]
  55. Althubaiti, A. Information bias in health research: Definition, pitfalls, and adjustment methods. J. Multidiscip. Healthc. 2016, 9, 211–217. [Google Scholar] [CrossRef] [Scilit] [PubMed]
  56. Olorunfemi, E.; Oyewobi, L.; Olanrewaju, O.; Olorunfemi, R. Competencies and the Penetration Status of Building Information Modelling Among Built Environment Professionals in Nigeria. In Proceedings of the FIG e-Working Week 2021, Virtual, 21–25 June 2021; Available online: https://www.researchgate.net/publication/352787164 (accessed on 25 March 2026).
  57. Jung, W.; Lee, G. The Status of BIM Adoption on Six Continents. Int. J. Civ. Environ. Eng. 2015, 9, 512–516. Available online: https://zenodo.org/records/1100430 (accessed on 25 March 2026).
  58. Ola-Ade, E.O.; Ajayi, M.O.; Onososen, A. Benefits & Challenges of 5D BIM Adoption: Perception of Quantity Surveyors; New Frontiers: Orlando, FL, USA, 2023; pp. 1–16, 28. [Google Scholar]
  59. Nzangi, Q.J.M.; Masu, P.Q.S.M.; Mbugua, D.Q.L.M. A Survey on the Current Status of Building Information Modelling (BIM) Adoption in Quantity Surveying Practice in Kenya. Int. J. Res. Sci. Innov. 2025, 12, 3259–3274. [Google Scholar] [CrossRef] [Scilit]
  60. Siddiqui, F. Barriers in Adoption of Building Information Modeling in Pakistan’s Construction Industry. Indian J. Sci. Technol. 2019, 12, 1–7. [Google Scholar] [CrossRef] [Scilit]
  61. Biancardo, S.A.; Russo, F.; Veropalumbo, R.; Vorobjovas, V.; Dell’Acqua, G. Modeling Roman Pavements Using Heritage-BIM: A Case Study in Pompeii. Balt. J. Road Bridge Eng. 2020, 15, 34–46. [Google Scholar] [CrossRef] [Scilit]
  62. Biancardo, S.A.; Capano, A.; de Oliveira, S.G.; Tibaut, A. Integration of BIM and procedural modeling tools for road design. Infrastructures 2020, 5, 37. [Google Scholar] [CrossRef] [Scilit]
  63. Sakidu, M.N.O.; Adekunte, P.A.; Sakidu, J.O. Building Information Modeling for Architecture. Int. J. Trend Sci. Reserach Dev. (IJTSRD) 2025, 9, 224–234. Available online: www.ijtsrd.com/papers/ijtsrd73841.pdf (accessed on 25 March 2026).
  64. Zhou, Z. An Intelligent Bridge Management and Maintenance Model Using BIM Technology. Mob. Inf. Syst. 2022, 2022, 7130546. [Google Scholar] [CrossRef] [Scilit]
  65. Olanrewaju, O.I.; Kineber, A.F.; Chileshe, N.; Edwards, D.J. Modelling the impact of building information modelling (Bim) implementation drivers and awareness on project lifecycle. Sustainability 2021, 13, 8887. [Google Scholar] [CrossRef] [Scilit]
  66. Sacks, R.; Eastman, C.; Lee, G.; Teicholz, P. A Guide to Building Information Modeling for Owners, Designers, Engineers, Contractors, and Facility Managers, 3rd ed.; Wiley: Hoboken, NJ, USA, 2018. [Google Scholar]
  67. Succar, B. Building information modelling framework: A research and delivery foundation for industry stakeholders. Autom. Constr. 2009, 18, 357–375. [Google Scholar] [CrossRef] [Scilit]
  68. Kent, D.C.; Becerik-Gerber, B. Understanding Construction Industry Experience and Attitudes toward Integrated Project Delivery. J. Constr. Eng. Manag. 2010, 136, 815–825. [Google Scholar] [CrossRef] [Scilit]
  69. Olanrewaju, O.I.; Babarinde, S.A.; Chileshe, N.; Sandanayake, M. Drivers for implementation of building information modeling (BIM) within the Nigerian construction industry. J. Financ. Manag. Prop. Constr. 2021, 26, 366–386. [Google Scholar] [CrossRef] [Scilit]
Disclaimer/Publisher’s Note: The statements, opinions and data contained in all publications are solely those of the individual author(s) and contributor(s) and not of MDPI and/or the editor(s). MDPI and/or the editor(s) disclaim responsibility for any injury to people or property resulting from any ideas, methods, instructions or products referred to in the content.

Article Metrics

Citations

Article Access Statistics

Multiple requests from the same IP address are counted as one view.