


Abstract
This study presents a hybrid approach that combines the Finite Element Method (FEM) and Artificial Neural Networks (ANNs) to predict the ultimate punching shear capacity of flat slabs supported by interior columns. FEM models were first developed and validated against experimental results to simulate slab behavior. These models were then used to generate a numerical dataset containing 1000 entries with varying geometric and mechanical parameters. Based on this dataset, 600 ANN architectures were trained and evaluated, from which three were selected for their high predictive performance (R2 > 0.99, MAE < 8 kN). A sensitivity analysis on network hyperparameters and dataset size revealed that 500–750 samples are sufficient for accurate ANN training. Finally, the selected ANN–FEM models were tested against 20 experimental cases and compared to predictions from ACI 318, Eurocode 2, and NBR 6118. While the design codes showed significant underestimations (up to 95%), the ANN and FEM models resulted in mean percentage errors of 11.6% and 10.1%, respectively. These findings demonstrate that the proposed hybrid approach provides an accurate, efficient, and practical alternative for predicting punching shear capacity in structural design.
1. Introduction
Driven by architectural flexibility and construction efficiency, flat slabs, slabs directly supported by columns, have become a common solution in modern structural systems. This type of system offers several advantages, including a reduced overall building height, which contributes to lower concrete consumption, reduced structural weight, and smaller foundation loads. It also simplifies reinforcement detailing and the concrete casting process. However, over the past decade, punching shear has attracted growing attention in structural engineering due to its brittle nature and potentially severe consequences, which, in extreme cases, can result in progressive collapse and the complete failure of the structure [1].
As highlighted by Elsayed et al. [2], the main design codes, including ACI 318 [3], Eurocode 2 [4], and the fib Model Code [5], provide design equations that tend to underestimate the ultimate punching shear strength of flat slabs. According to Elshafey et al. [6], this underestimation occurs because such formulations are empirical in nature, having been developed through statistical fitting of the experimental data available. As reported by Meisami et al. [7], for instance, the experimental ultimate punching load of prototype CS40-3 (a conventional flat slab) was 68% higher than the predicted value obtained using ACI 318 equations. Similar findings were reported by Inacio et al. [8], who observed a 28% difference, and by Elsayed et al. [2], whose results showed a discrepancy of 82%. Ferreira et al. [9], analyzing prototype S5 (also a conventional flat slab), found ultimate punching loads 30%, 20%, and 40% higher than those predicted by ACI 318 [3], Eurocode 2 [4], and fib Model Code [5], respectively. The results of these studies systematically highlight the conservative nature of current design code equations, which may significantly underestimate the actual punching shear capacity of flat slabs. Flat slabs with openings or shear reinforcement show even larger discrepancies between experimental and code-based predictions, further emphasizing the limitations of current design formulations [10,11].
Given these discrepancies, numerical strategies have emerged as effective alternatives for improving the accuracy of punching shear predictions. Among them, computational models based on the Finite Element Method (FEM) stand out due to their ability to simulate the non-linear behavior of flat slabs up to failure [1]. These models also allow for a more refined representation of stress distributions and failure mechanisms, accounting for a wide range of geometric and material parameters. On the other hand, despite their potential, developing representative computational models is often time-consuming. In addition, numerical analyses typically require in-depth knowledge of programming, constitutive material theories, and finite element concepts, which are often unfamiliar to many engineers. In this context, machine learning (ML) techniques have emerged as a promising alternative, as well-trained and validated ML models can be easily used by structural engineers. Once developed, such ML models require only the input parameters of the problem to instantly provide the corresponding output [12].
ML techniques emerged in the mid-20th century and experienced significant growth in the early 1990s, becoming one of the most prominent and successful branches of artificial intelligence [12]. Despite being limited in number, some studies have demonstrated the potential of ML techniques to predict the structural behavior of flat slabs subjected to punching shear. Mangalathu et al. [13], aiming to evaluate the efficiency of machine learning-based approaches in predicting the punching shear strength of flat slabs without transverse reinforcement, analyzed seven machine learning methods: ridge regression, support vector regression, decision tree, K-nearest neighbors, random forest, adaptive boosting, and extreme gradient boosting. To this end, a dataset comprising 380 experimental results collected from various sources in the literature was used. Among the methods tested, extreme gradient boosting achieved the best performance. Chetchotisak et al. [14] employed multiple linear regression (MLR) to predict the concentric punching shear strength of reinforced concrete slab-column connections. For this purpose, a database comprising 342 experimental results was used. The results indicated that the proposed MLR-based approach achieved adequate performance in predicting the punching shear strength. Nguyen et al. [15] used extreme gradient boosting (XGBoost) to predict the punching shear resistance of reinforced concrete (RC) interior slabs without shear reinforcement. Choi et al. [16] proposed a fuzzy logic-based model to predict the punching shear strength of interior slab-column connections under concentric loading, demonstrating more accurate results than conventional design codes. As in previous studies, the ML algorithm was trained and tested using experimental data collected from the literature. These studies demonstrate that it is possible to accurately predict the punching shear strength of RC flat slabs using ML algorithms. Among the various algorithms available, artificial neural networks (ANNs) have gained particular attention in recent years due to their strong predictive capabilities.
ANNs have been widely applied in various fields, including structural engineering, geomechanics, and hydrology [12,17,18,19,20,21,22]. Inspired by the architecture and functioning of the human brain, ANNs are capable of learning from data patterns to perform tasks such as prediction and decision-making. Although ANNs have been successfully applied in many engineering fields, their use in punching shear studies remains relatively scarce. Elshafey et al. [6] and Said et al. [23] were the first researchers to apply ANN models to predict the punching shear strength of flat slabs. In both studies, the input variables included concrete strength, column size, flexural reinforcement ratio, slab effective depth, and steel yield strength. Gandomi and Roke [24] also investigated the punching shear strength of RC slabs using ANN models, with a particular focus on identifying parameters that contribute to overfitting. More recently, Tran and Kim [25] carried out a similar study and proposed ANN-based equations for predicting punching shear strength. In all cases, the ANN models were developed based on experimental data obtained from tests conducted by other researchers, which may be one of the reasons for the limited number of studies related to the application of ANNs to punching shear in flat slabs.
In general, building datasets from experimental results is a challenging task. Such data are often difficult to collect and require a comprehensive review, as they may contain missing values or include parameters not typically considered in conventional punching shear evaluations. Moreover, some of these results may be derived from prototypes constructed with materials no longer allowed by current design standards, or from scaled-down tests whose results depend on uncertain scaling factors to approximate actual structural behavior.
In this context, hybrid methodologies based on artificial neural networks (ANNs) and the finite element method (FEM), which combine the physical modeling capabilities of FEM with the fast and adaptive learning capacity of ANN models, may provide accurate and computationally efficient solutions. Despite these advantages, only the studies by Ors et al. [26] and Asteris et al. [27] have explored the integration of ANN and FEM techniques. However, their objectives differ from the scope of the present work. Ors et al. [26] focused on predicting correction factors for design-code equations in PT-UHPC slabs, while Asteris et al. [27] employed predominantly experimental databases to estimate the axial capacity of CFST columns. In contrast, the present study develops a hybrid ANN–FEM framework in which a validated finite element model is used to generate a large numerical dataset for directly predicting punching shear capacity, while also systematically investigating the influence of ANN architecture and dataset size on predictive performance.
The objective of this study is to present a hybrid methodology based on ANN–FEM for predicting the punching shear capacity of flat slabs supported by interior columns. Additionally, the performance of the ANN model is investigated considering different network hyperparameters (number of hidden layers, number of neurons, batch size, and number of epochs) and the size of the dataset. Finally, using the validated ANN–FEM model, a comparative study is conducted among the ANN–FEM models and the design codes to demonstrate the effectiveness and applicability of neural network-based models as an alternative to traditional design approaches.
In general, the present study provides significant improvements in estimating punching shear resistance, and the ANN results have the potential to replace conservative design codes or contribute to improving the equations currently adopted by them. In addition to its predictive accuracy, the proposed hybrid approach offers greater computational efficiency and can be applied to a wide range of structural problems, especially those for which no design equations are available to assist engineers in the design process. Moreover, the proposed methodology enables the training of ANN models for geometries and conditions that have not been experimentally tested, thereby extending its applicability beyond the limitations of existing experimental data. These aspects highlight the originality and practical relevance of this research.
2. Methodological Framework
Unlike the previously presented studies, in which the datasets used to train the ML algorithms were obtained from experimental results, the hybrid ANN–FEM approach proposed in this study makes use of numerical results generated through finite element (FE) models to build the database. To achieve this, the methodological approach is structured into three main stages: (i) development and validation of the finite element (FE) modeling strategies; (ii) automatic dataset generation using FE models; (iii) training and validation of the artificial neural network. In the following section, each of these strategies is explored in depth.
3. Reference Test and FE Validation
The experimental tests used to validate the FE models developed in this study were conducted by Liberati et al. [28], Marques et al. [29], and Marques et al. [30]. The modeling strategies adopted to develop the FE models were based on the studies of Ramos et al. [31] and Ramos et al. [32]. A concise summary of the reference experimental tests, the FE modeling, and the validation results of the developed models are presented below.
3.1. Description of Experimental Reference Tests
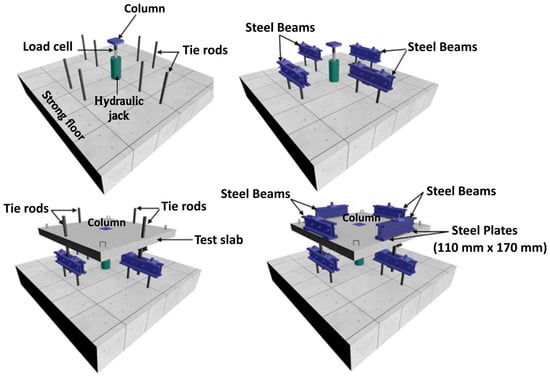
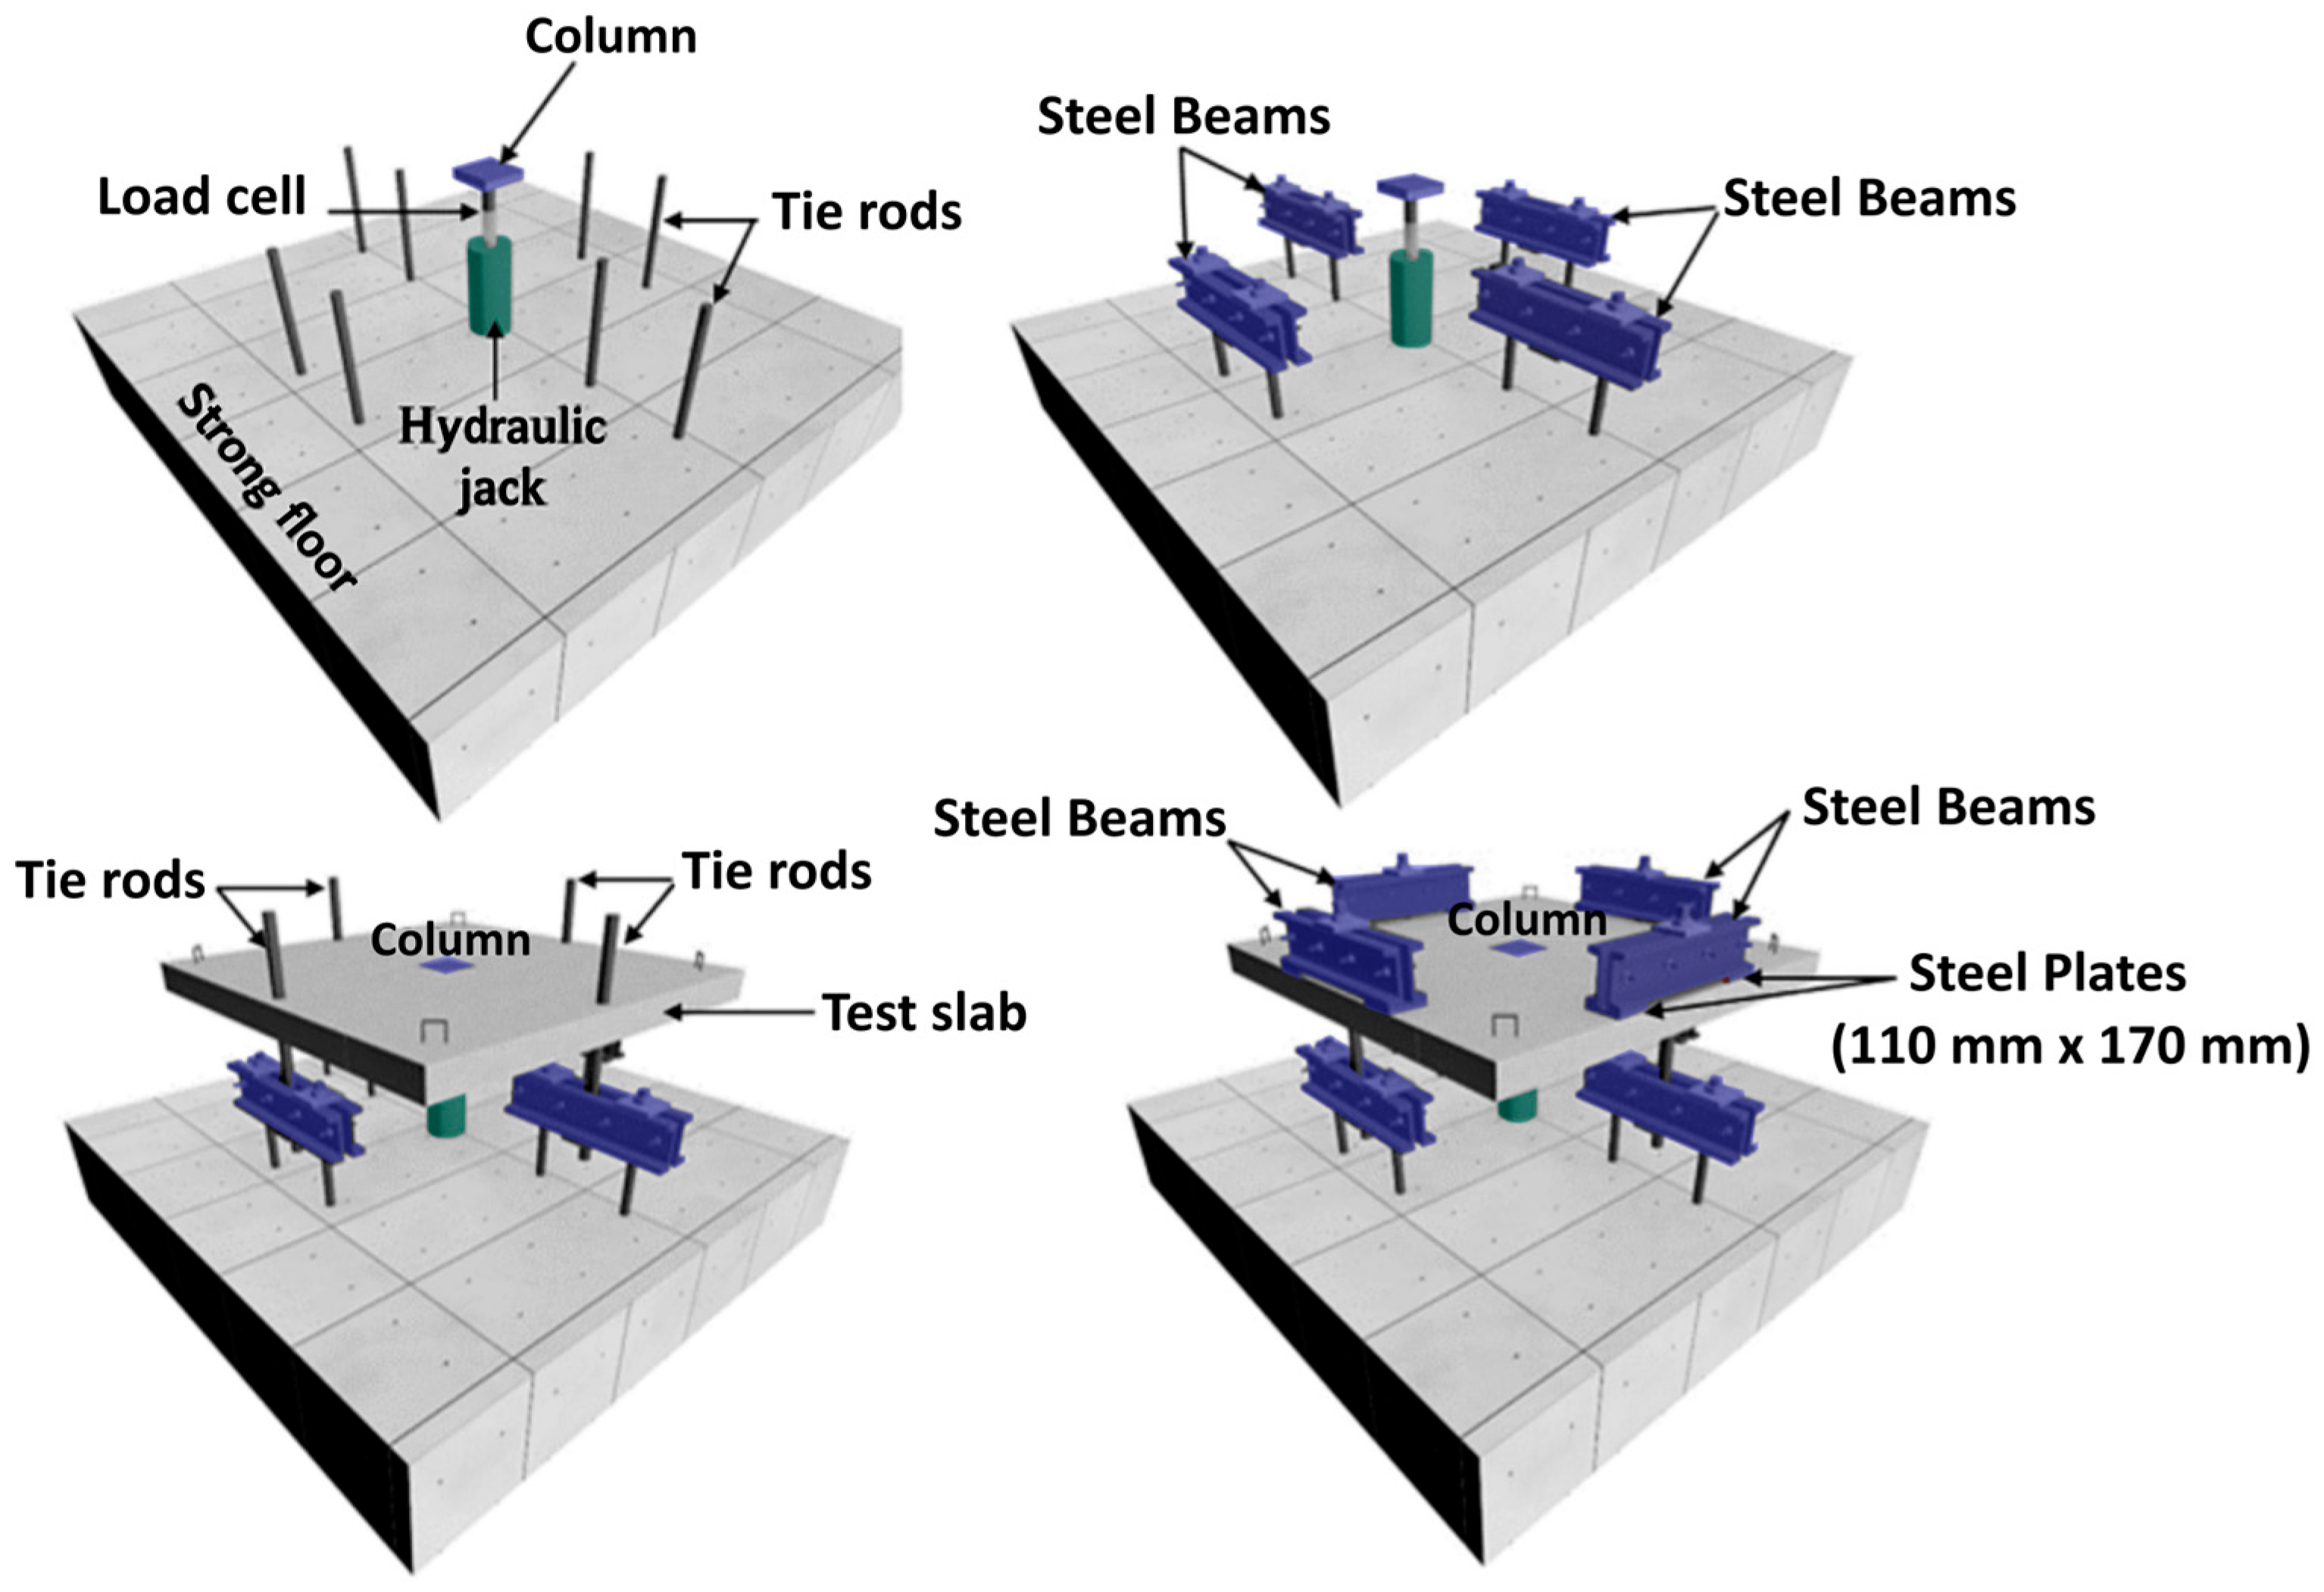
The prototype slabs, identified as LR slabs (i.e., without openings or shear connectors), measured 1800 mm in length and width, and 130 mm in thickness. Each slab was supported at its center by a 150 mm × 150 mm steel plate, through which the load was gradually applied using a hydraulic actuator manufactured by Enerpac (Niterói, Brazil). In order to transfer the applied load to the slab, a steel beam framework connected to a reaction slab was utilized. The system was supported by eight steel plates (110 mm × 170 mm × 20 mm), evenly spaced along a 900 mm radius circle. The experimental test setup is shown in Figure 1.
Figure 1.
Experimental setup adopted by Liberati et al. [28], Marques et al. [29], and Marques et al. [30] (Adapted from Liberati et al. [28]).
The mechanical, geometrical, and constructive properties of the LR-series prototypes used for validating the FE models are summarized in Table 1.
Table 1.
Displacement increments used in the computational analysis of the LS06 model.
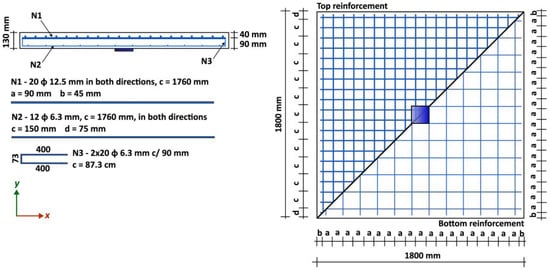
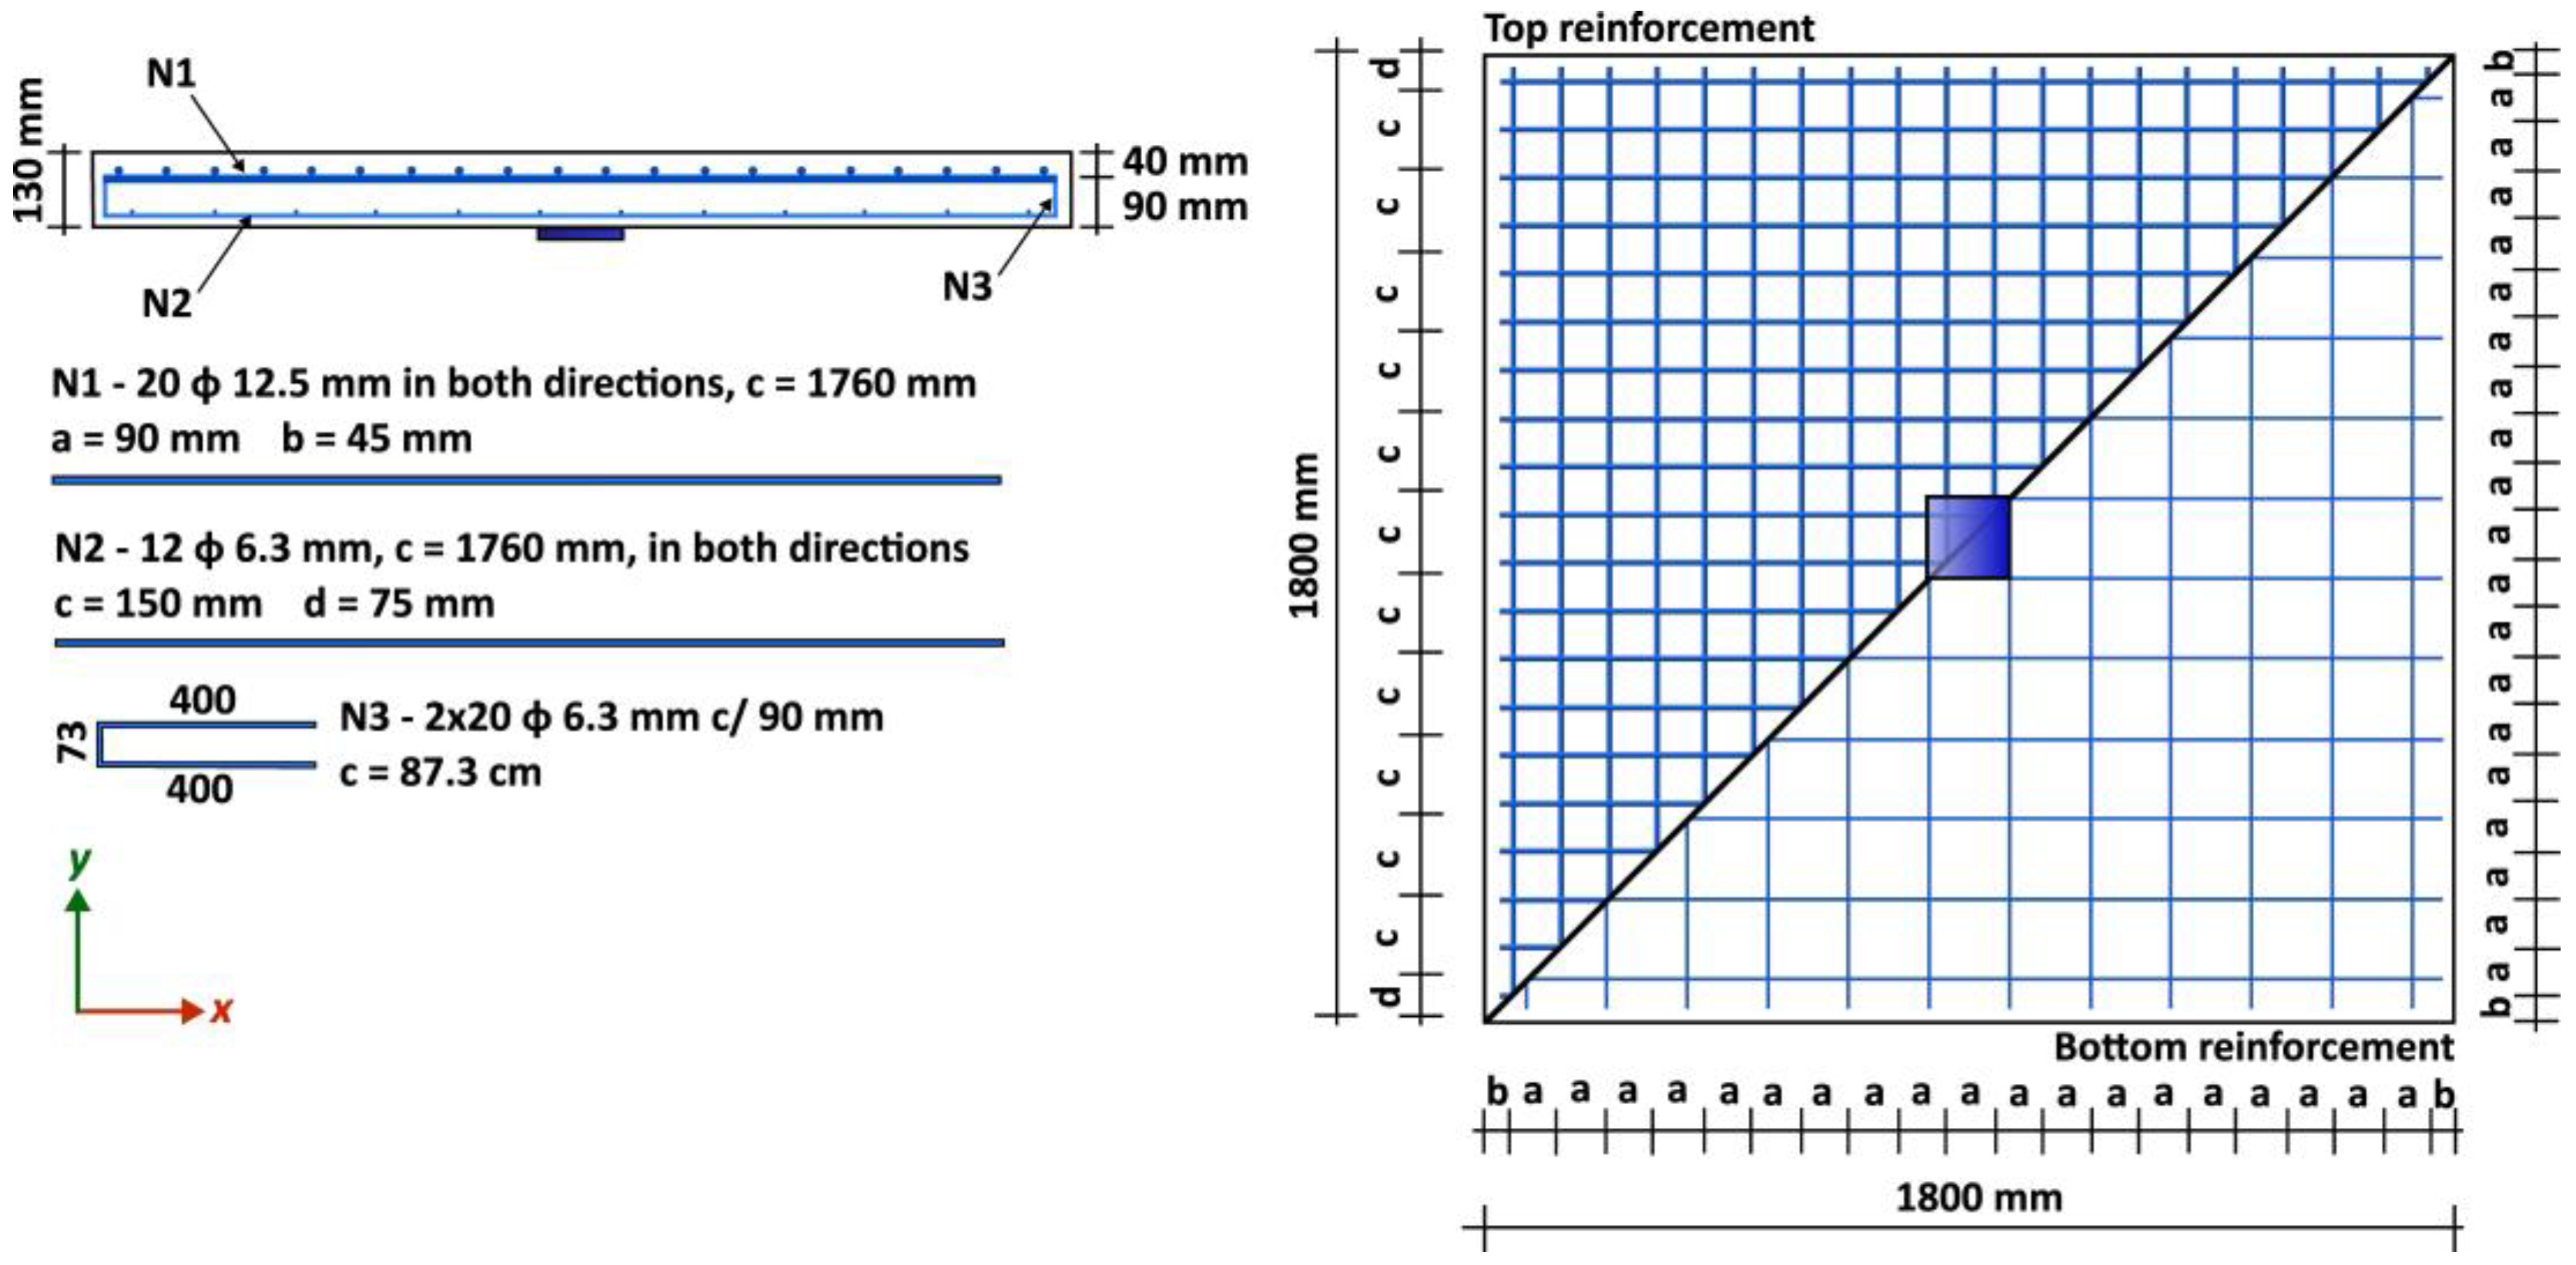
For all specimens, 12.5 mm diameter bars were used as flexural reinforcement, while 6.3 mm diameter bars were adopted as constructive reinforcement. The complete reinforcement layout is shown in Figure 2. The mechanical behavior of the steel bars was characterized experimentally, with the results shown in Table 2.
Figure 2.
Reinforcement layout of prototypes (Adapted from Ramos et al. [32]).
Table 2.
Mechanical properties of steel bars used in the LR-series prototypes.
3.2. Finite Element Modeling
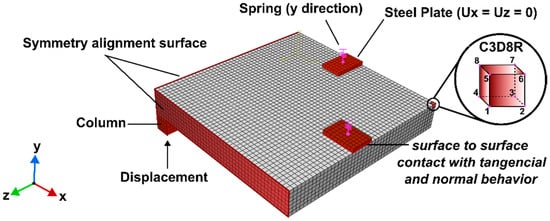
The FE modeling and structural analysis were performed using the commercial software ABAQUS [34]. For this purpose, the key components of the experimental setup, including the concrete slab, column, steel plates, and reinforcement bars, were represented in the FE models. In addition, due to the double symmetry of the problem and to reduce computational time, only one-quarter of the original geometry was modeled. As detailed by Ramos et al. [32], vertical linear springs were applied to the steel support plates to accurately represent the stiffness of the support system. As a result, a spring coefficient of 5500 N/mm was adopted in all FE models. It is important to note that these spring coefficients have no impact on the slab’s punching shear capacity and only influence the global stiffness of the slab–column connection. The developed FE model is detailed in Figure 3.
Figure 3.
Details of FE model developed.
As shown in Figure 3, the concrete and steel plate domains were discretized using eight-node hexahedral elements with linear interpolation (C3D8R). The reinforcement bars were modeled with two-node truss elements with linear interpolation (T3D2). Across the entire domain, the maximum element size was set to 20 mm, based on a mesh sensitivity analysis. The external load, applied through a hydraulic actuator, was simulated by prescribing a displacement in the column region.
The mechanical behavior of concrete and steel was simulated using an Elasticity model combined with Concrete Damaged Plasticity (CDP) for concrete, and with a Plasticity model for steel. The parameters used to define the plastic behavior of the CDP model were based on values previously tested by Ramos et al. [31]. These parameters are: (i) dilation angle ( = 50.0°); (ii) eccentricity (ϵ = 0.100); (iii) ratio of initial biaxial to uniaxial compressive strength of concrete ( = 1.160); (iv) shape factor for the yield surface ( = 0.667); (v) viscosity parameter ( = 0.00001). In addition to these plasticity-related parameters, the CDP model also requires the stress–strain curve for concrete under compression and the stress–crack opening relationship for concrete under tension. To define these relationships, several mathematical formulations were evaluated, with the models proposed by the fib Model Code [5] and Hordijk [35] providing results most consistent with the experimental data reported by the reference authors. The mechanical properties of the concrete adopted in the LR-series prototypes are summarized in Table 3.
Table 3.
Mechanical properties of concrete used in the LR-series prototypes.
3.3. Validation of the FE Approach
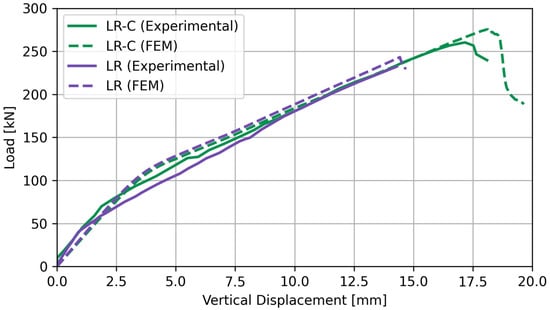
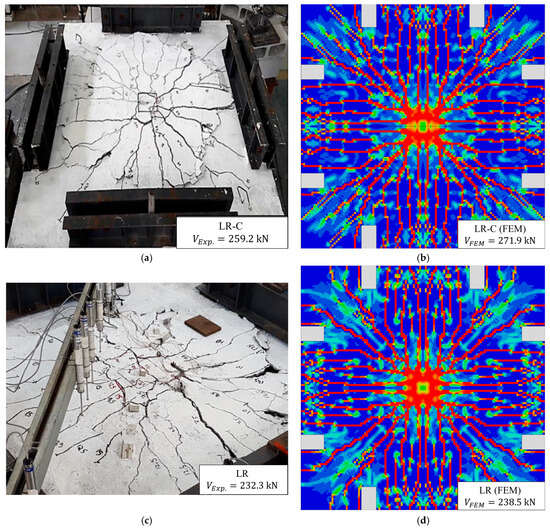
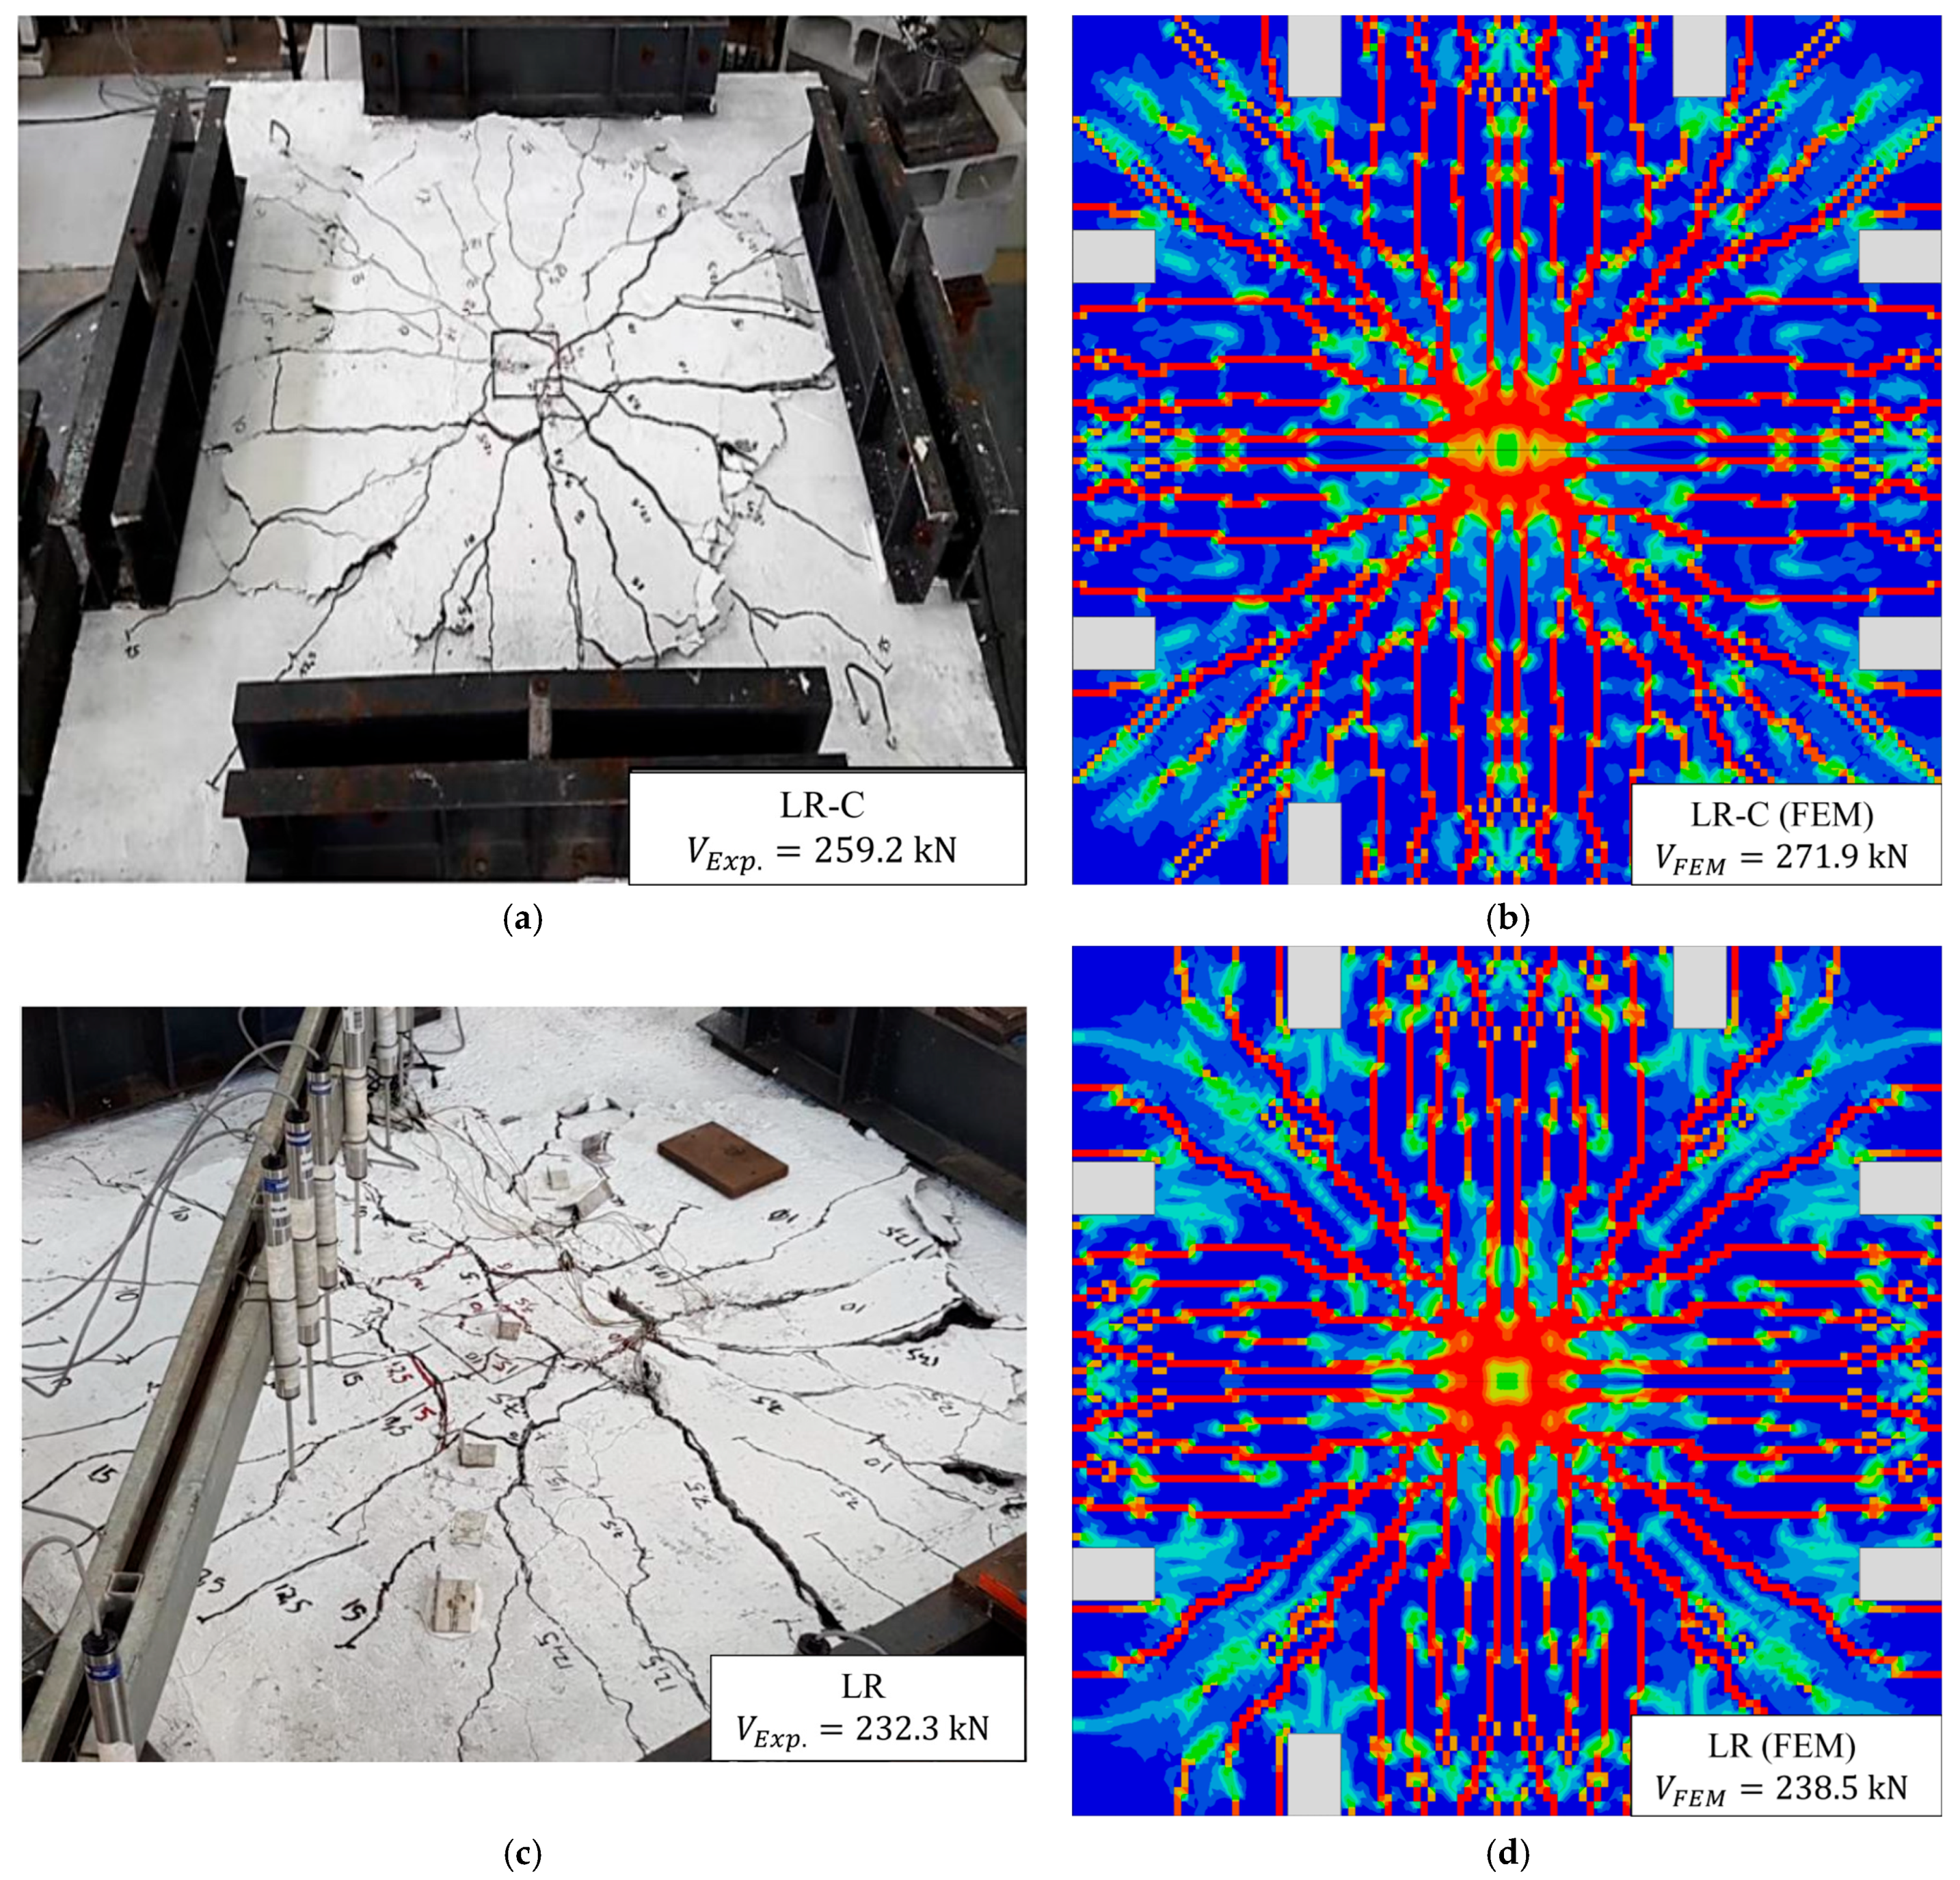
The load–displacement results at the center point of the slabs, obtained by the reference authors and by the FE models, are presented in Figure 4. In both evaluated cases, the results obtained from the FEM models showed good agreement with the experimental data reported by Liberati et al. [28] and Marques et al. [30]. For the LR-C prototype, the maximum experimental load was 259.2 kN, while the numerical result was 271.9 kN, representing an increase of 4.9%. Regarding the displacement corresponding to the maximum load, the experimental value was 16.87 mm, and the numerical value was 18.34 mm, a difference of +8.7%. For the LR prototype, the maximum experimental load was 232.3 kN, while the numerical result was 238.5 kN, corresponding to an increase of 2.6%. The displacements corresponding to the maximum load were 14.3 mm and 14.5 mm, respectively, indicating a difference of +1.3%.
Figure 4.
Comparison between the load–displacement results at the center of the slabs obtained from the experimental prototypes and the finite element (FE) models.
Qualitatively, the validity of the modeling approach can also be demonstrated by comparing the cracking patterns observed in the reference slabs with the tensile damage distribution predicted by the FE models. Figure 5 presents these results at the moment when both the physical prototypes and the numerical models reached their maximum load. Once again, good agreement is observed between the experimental data and the FEM results. Analyzing this figure reveals a concentration of cracks and tensile damage (in red) in the central region of the slab, corresponding to the column location, along with radial cracks extending from this region toward the slab edges. This crack pattern reflects the typical punching shear failure mode of flat slabs subjected to symmetric loading.
Figure 5.
Comparison between the experimental crack patterns (a,c) and the distribution of the tensile damage variable obtained from the finite element models (b,d). In (b,d), the red regions correspond to totally damaged zones, the blue regions to undamaged areas, and the remaining colors indicate intermediate damage levels.
The results presented demonstrate that the developed FE models are capable of accurately representing the mechanical behavior, including concrete cracking and crushing, as well as steel yielding, up to the point at which the flat slab reaches its punching shear capacity. Based on these findings, the modeling approach adopted is considered adequate and suitable for achieving the objectives proposed in this study. Furthermore, additional details on the validity of the adopted modeling methodology can be found in the study of Ramos et al. [32], in which it is employed to simulate the structural behavior of flat slabs with openings.
4. Dataset Based on FE Results
4.1. Methodology for Dataset Generation
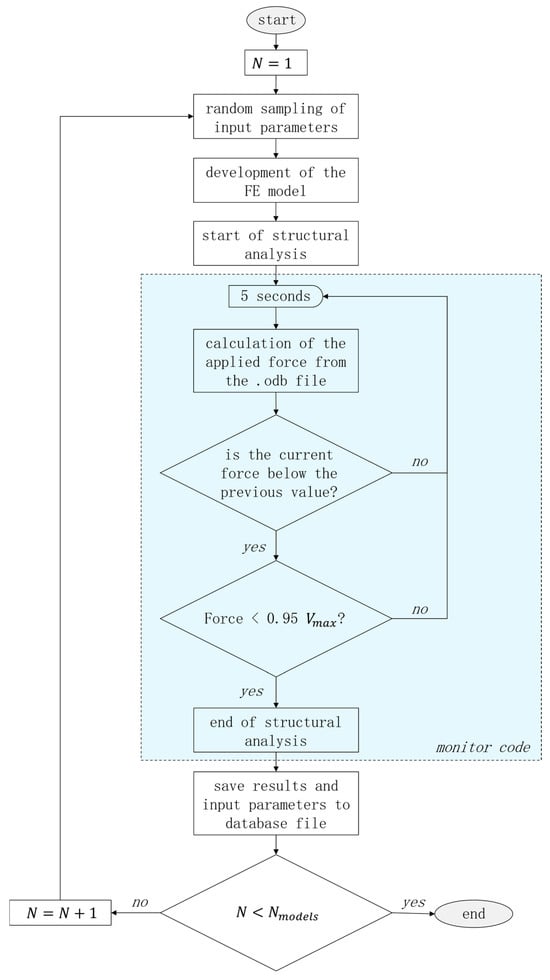
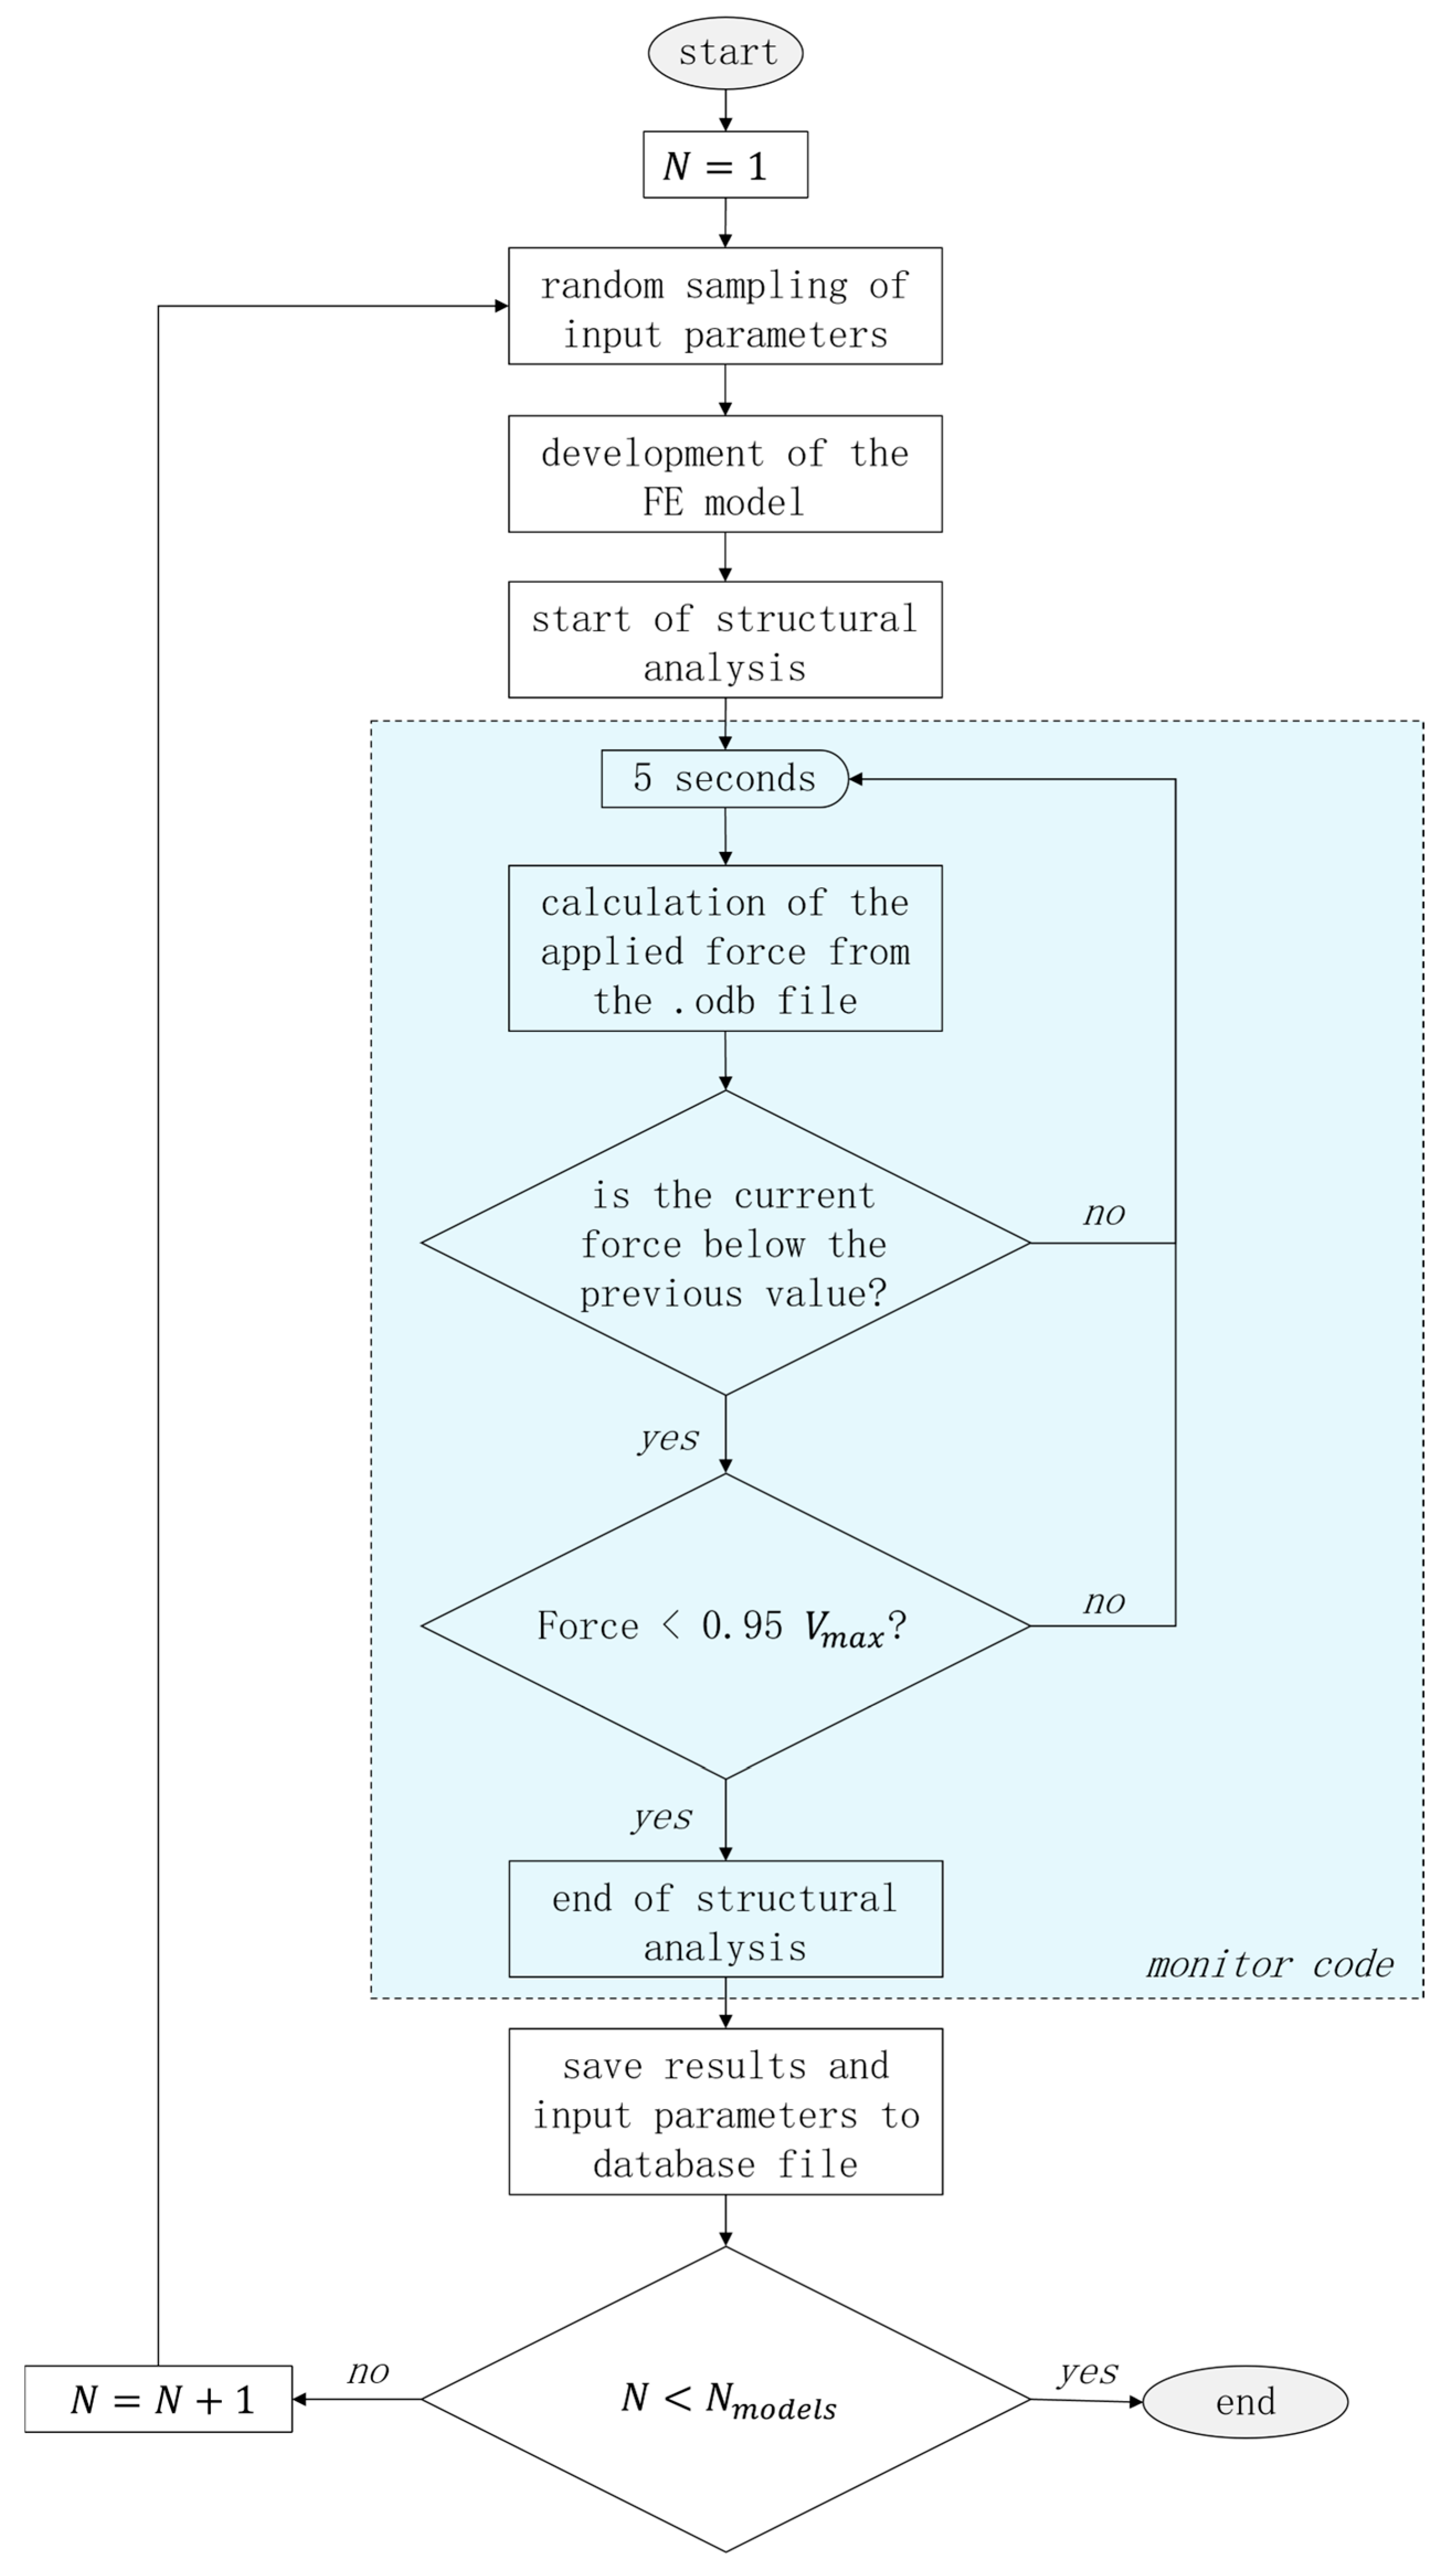
To create the database, the modeling methodology presented in the previous section was automated using scripts developed in Python v3.11.9. These scripts are responsible for generating the FE model based on predefined input data and subsequently initiating and terminating the analysis. The automated workflow is illustrated in the flowchart presented in Figure 6.
Figure 6.
Automated routine for database generation.
As illustrated in the flowchart (Figure 6), a monitoring code was used to automatically stop the analysis when the punching shear capacity was achieved. This feature proved necessary because, while employing the Static General algorithm with prescribed displacement in Abaqus, there is no standard functionality to terminate the structural analysis when the model reaches its maximum capacity. Moreover, this implementation helps avoid unnecessary processing, which reduces computational time. For all models, the structural analysis was finalized when the monitored force exhibited a 5% reduction relative to the maximum force.
Due to the lack of studies that clearly define the amount of data required for effective training of ANNs applied to structural problems, a database with 1000 results was constructed considering different combinations of input parameters. This approach was adopted because, in general, authors who have developed ANN-based studies for predicting structural behavior have not addressed this issue and have simply used all available data, which may or may not be sufficient. To address this gap, Section 5.4 presents an evaluation of the data volume required for the effective training of the ANN.
4.2. Mechanical and Geometrical Parameters
The database and FE models were created using the input parameters and intervals shown in Table 4. These parameters were selected based on the design equations provided by ACI 318 [3], Eurocode 2 [4], fib Model Code [5], and NBR 6118 [33]. In all cases, these parameters were randomly selected assuming they are probabilistically represented by a uniform probability density function.
Table 4.
Range of input variables.
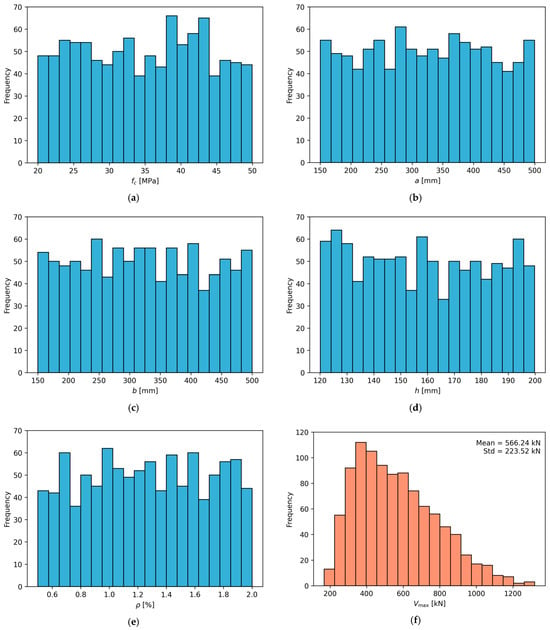
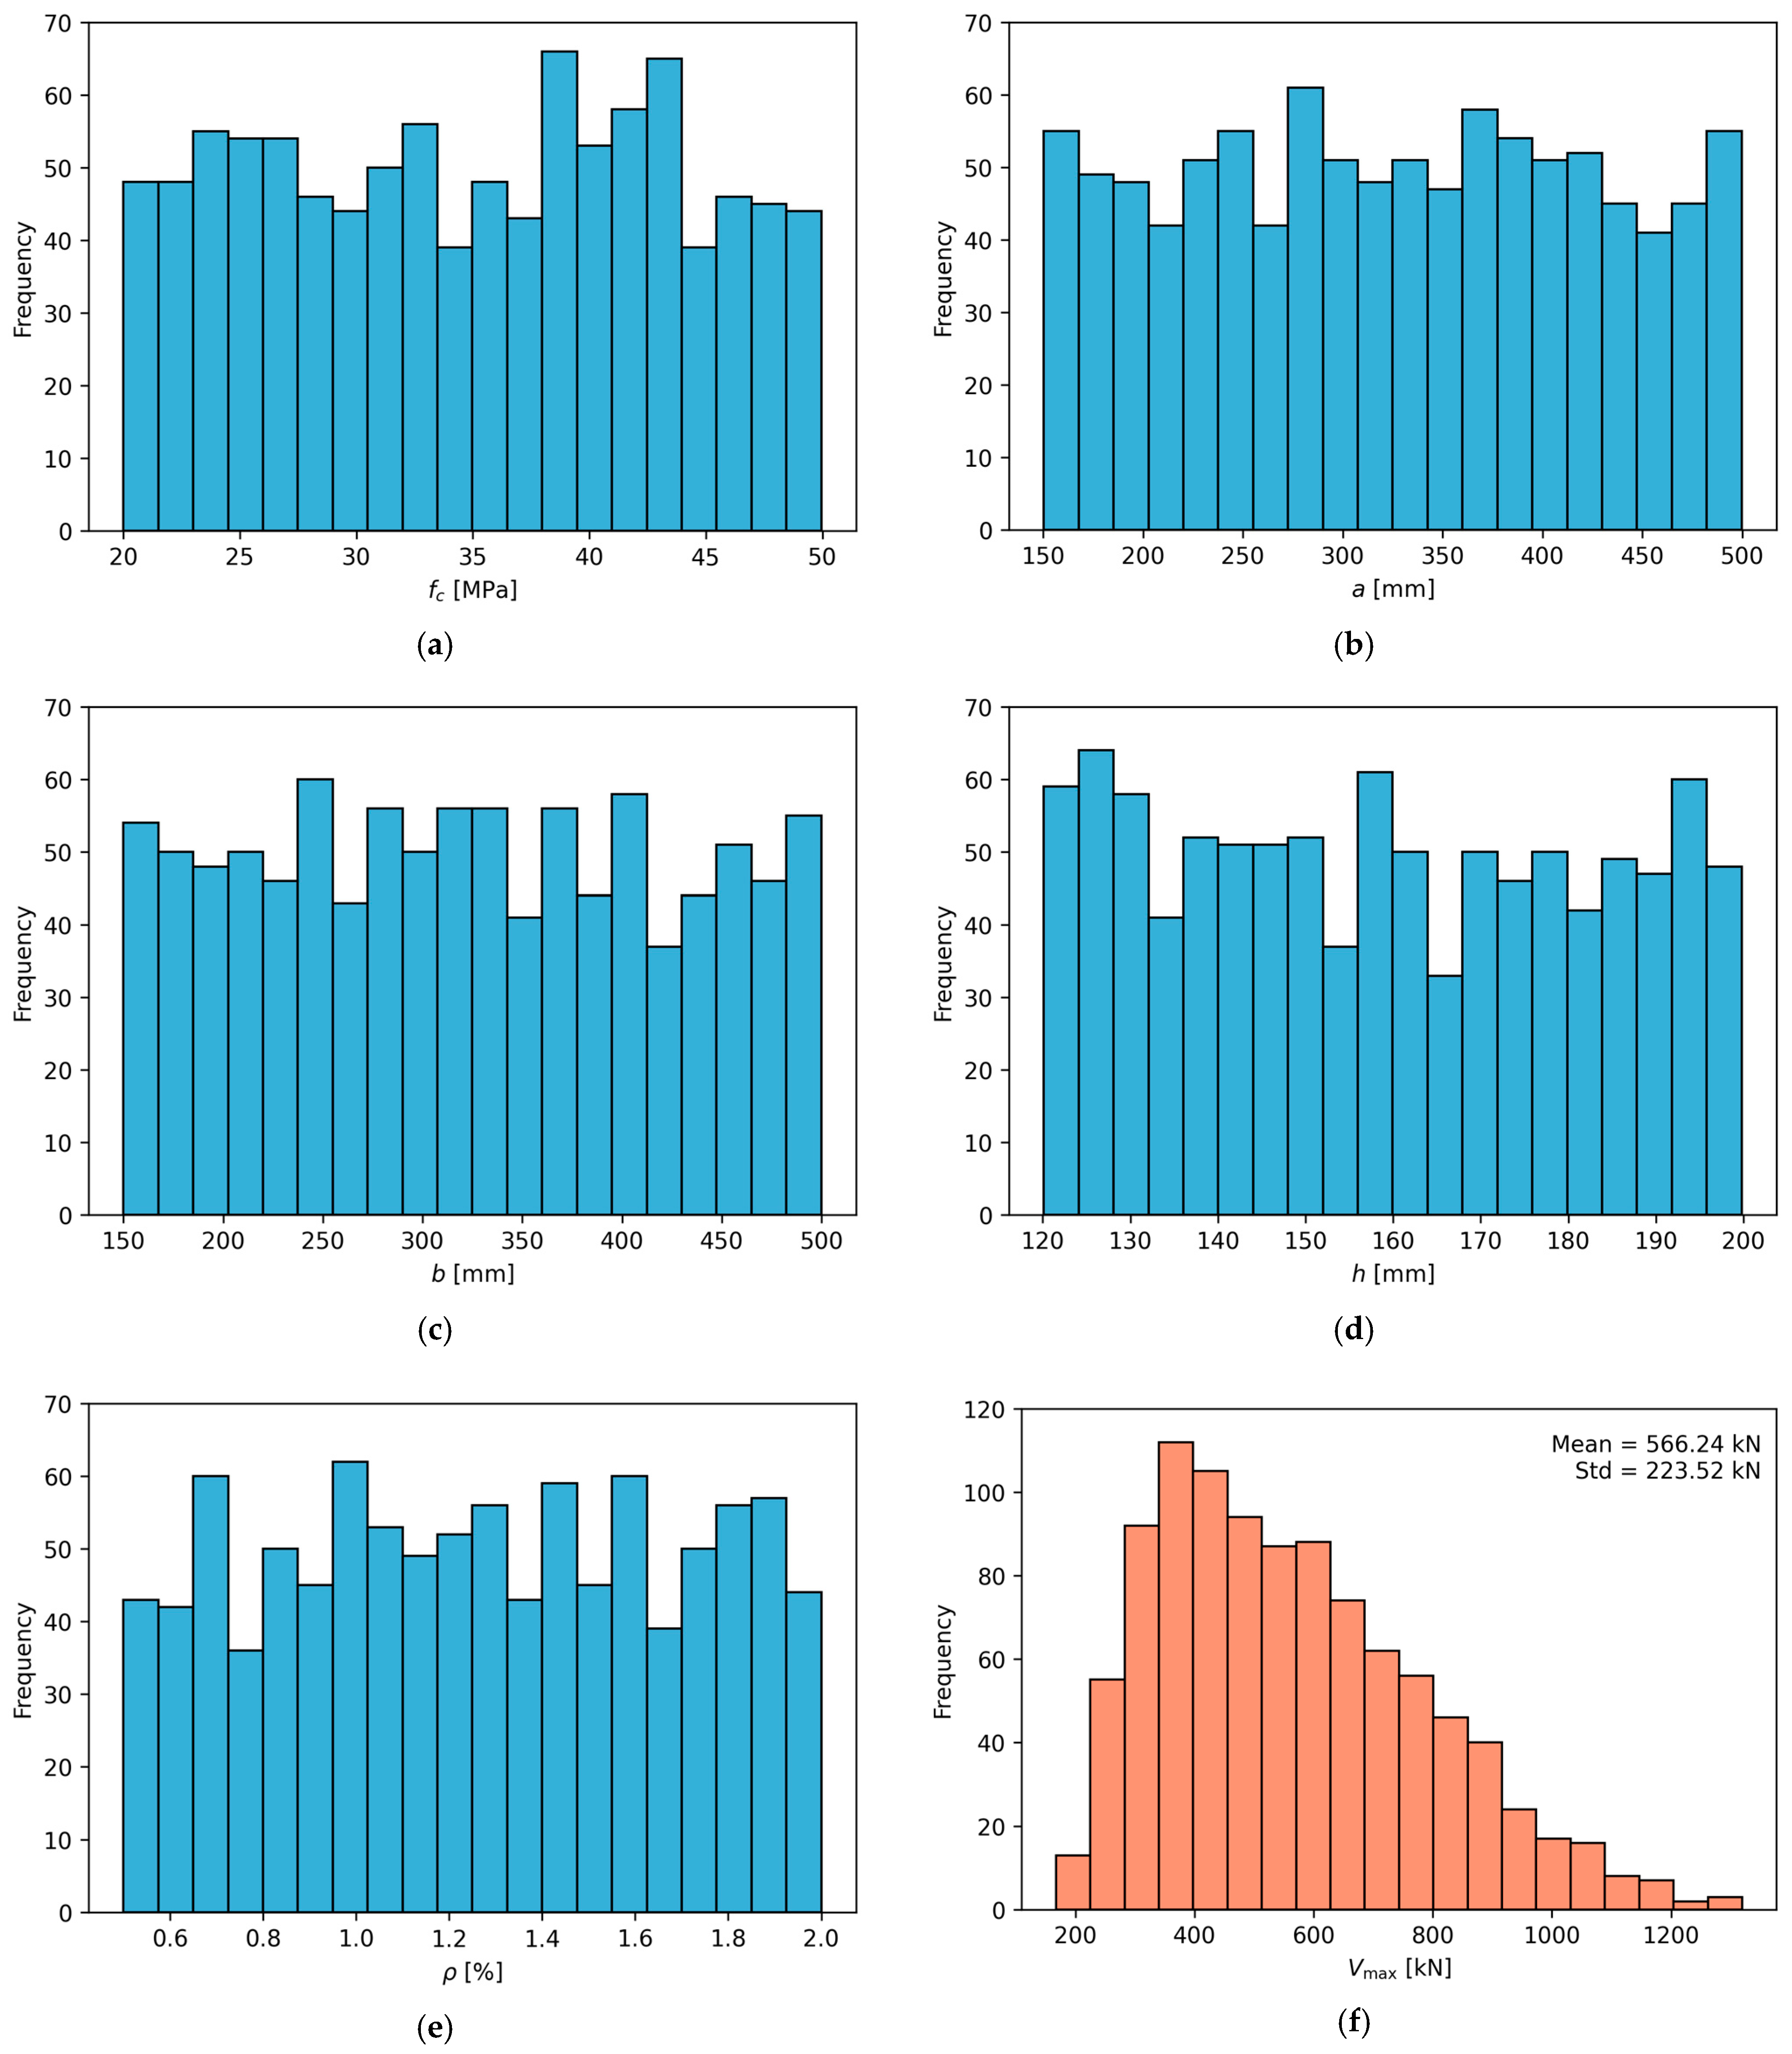
For each combination of parameters (, , , , and ) among the 1000 samples that comprise the database, the maximum punching shear force () of the corresponding flat slab configuration was determined via FE models. Based on these data, the database was structured as a matrix with 1000 rows and 6 columns. The randomly generated input values and the corresponding results obtained from the FE model are presented in the frequency distributions shown in Figure 7.
Figure 7.
Frequency distributions of the input and output variables: (a) concrete compressive strength (); (b) column dimension a; (c) column dimension b; (d) slab thickness ; (e) flexural reinforcement ratio (); (f) maximum punching shear force ().
As can be observed, the combination of five uniformly distributed random variables resulted in a random response characterized by a log-normal distribution. This behavior is well known in the field of statistics and can be explained by the central limit theorem, which states that the sum (or combination) of a large number of independent and identically distributed random variables tends to follow a normal distribution, regardless of the original distribution of the variables. When these variables are combined multiplicatively the resulting variable typically follows an approximately log-normal distribution [36,37].
The input parameters were generated using a uniform distribution within the predefined ranges in order to ensure a balanced coverage of the entire parameter space considered in the analysis. If a normal distribution were used, most of the generated samples would be concentrated around the mean values of the parameters, resulting in a lower representation of configurations near the boundaries of the defined intervals. Since the objective of the dataset generation was to systematically explore different combinations of structural parameters rather than reproduce a real-world statistical distribution, the uniform distribution was considered more appropriate for training the ANN models.
5. ANN Training and Validation
The ANN approach presented in this paper was developed using the Keras package, which is freely available in the Python environment. Keras, available at https://keras.io/ (accessed on 5 September 2025), is a user-friendly deep learning API that allows researchers and engineers to implement complex neural network models with minimal code.
5.1. Mathematical Background
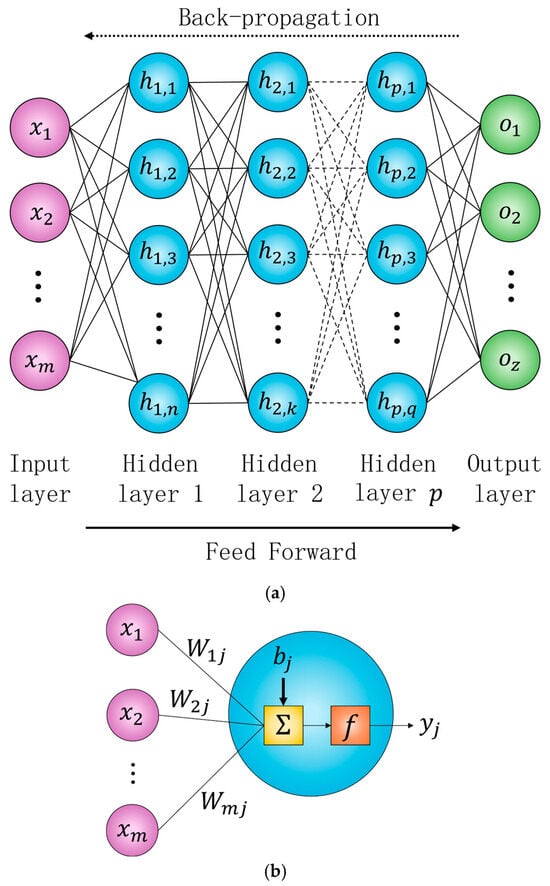
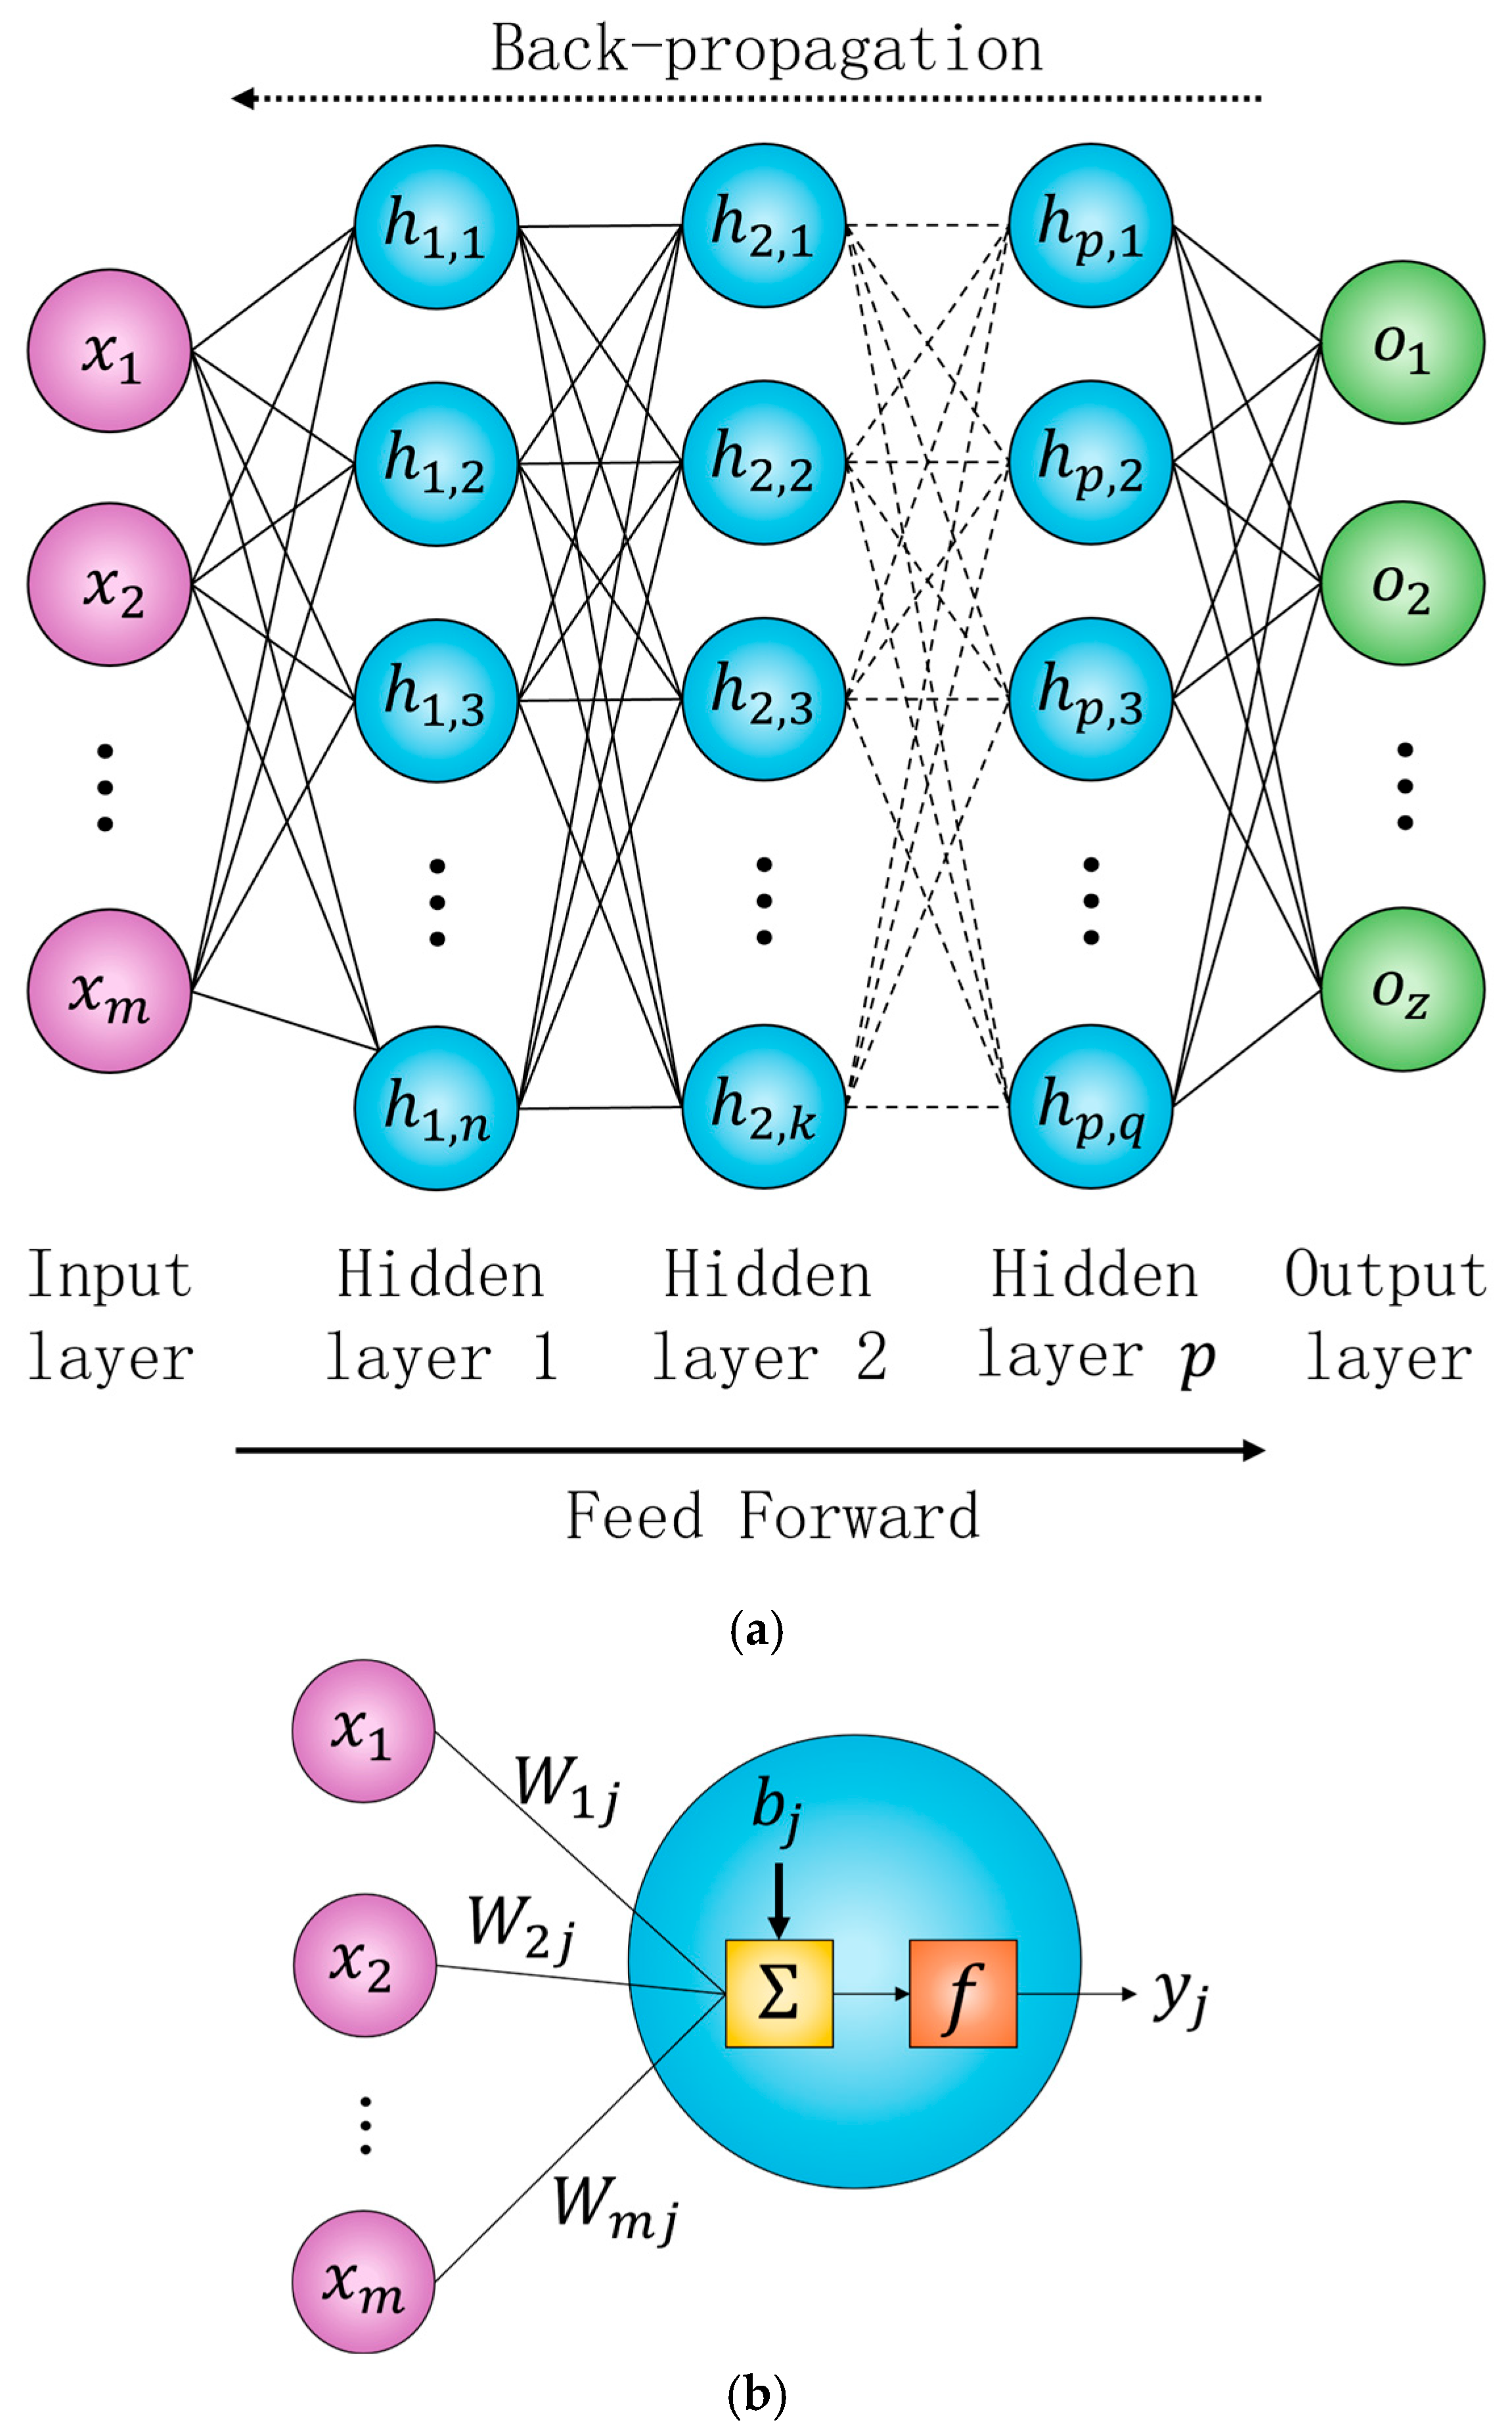
ANNs are computational structures based on the synaptic processes of the human brain. Essentially, they are composed of units called artificial neurons, which are organized into layers (Figure 8a). The response of each neuron is determined by the linear combination of its inputs, which is then processed by an activation function, as shown in Figure 8b. Mathematically, the output of a neuron in a hidden layer can be expressed by
where are the weights, are the inputs, and is the bias term. Each neuron is activated by a function , such as the Hyperbolic Tangent, ReLU, or Sigmoid, which is responsible for introducing nonlinearity into the model and enabling the network to learn complex patterns.
Figure 8.
(a) Schematic representation of a typical artificial neural network architecture; (b) functional principle of an artificial neuron.
The number of neurons in the input and output layers corresponds to the number of predictor and target variables, respectively. The predictor variables used to train the ANN were: concrete compressive strength (), column dimensions ( and ), slab thickness (), and flexural reinforcement ratio (). The target variable was the maximum punching shear force ().
During the training process, the weights and biases of the ANN are optimized to minimize the error between the predicted outputs and the actual values. This optimization is typically performed using iterative algorithms that combine the feedforward technique with backpropagation [38,39]. This algorithm consists of two main steps. In the forward pass, input information propagates through the network from the input layer to the output layer. In the backward pass, the errors between the ANN response and target responses are backpropagated through the network, allowing the weights to be updated in a way that reduces the error [40]. In this study, a feedforward neural network with backpropagation was implemented using the Keras library and trained with the ADAM optimizer [41].
The performance of an ANN model is typically evaluated using statistical metrics. Specifically, the mean squared error (MSE), Equation (2), and mean absolute error (MAE), Equation (3), were employed to quantify the magnitude of the error between the target values and the predicted outputs.
where is the number of samples, represents the target response, and denotes the predicted values obtained using the ANN model.
5.2. Data Normalization and Preprocessing
To improve the stability of the ANN training process, all input and output features were first subjected to Min-Max normalization, which mapped their values onto the interval [0, 1]. This normalization was necessary to improve the convergence of the training process and to mitigate the influence of features with larger numerical ranges on the learning process. The normalization process was independently applied to both the predictor (, , , , and and target () variables, using the following equation:
where represents each set of variables. In the ANN code, this preprocessing step was performed using the MinMaxScaler class from the scikit-learn library. The scalers were saved and reused to transform new inputs during the prediction stage, ensuring consistency throughout the workflow. Additionally, the dataset was randomly split into training and test sets using an 80/20 ratio. This split ensures that the test set remains unseen during training, enabling an impartial evaluation of the model’s generalization capability.
5.3. Network Architecture and Design Choices
The ANN architecture, i.e., the number of layers, the number of neurons in each hidden layer, the number of epochs, and the batch size, has a significant impact on ANN performance [42]. Considering this, a total of 600 ANN architectures were evaluated to determine the most effective configuration for predicting the punching shear strength of flat slabs supported by interior columns. The selection of ANN hyperparameters was performed through an exploratory procedure in which several network configurations were tested. Different numbers of hidden layers and neurons were evaluated to investigate their influence on the predictive performance of the models. The parameters used in this evaluation are listed in Table 5.
Table 5.
ANN architecture evaluated.
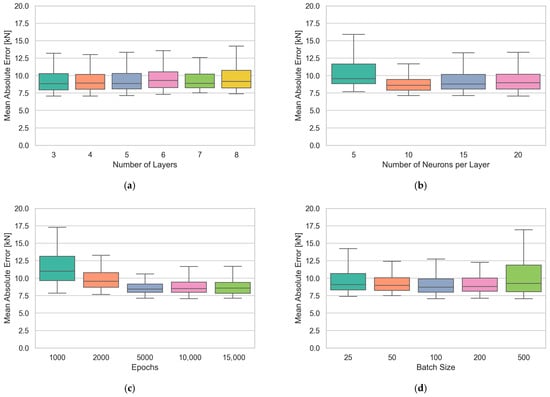
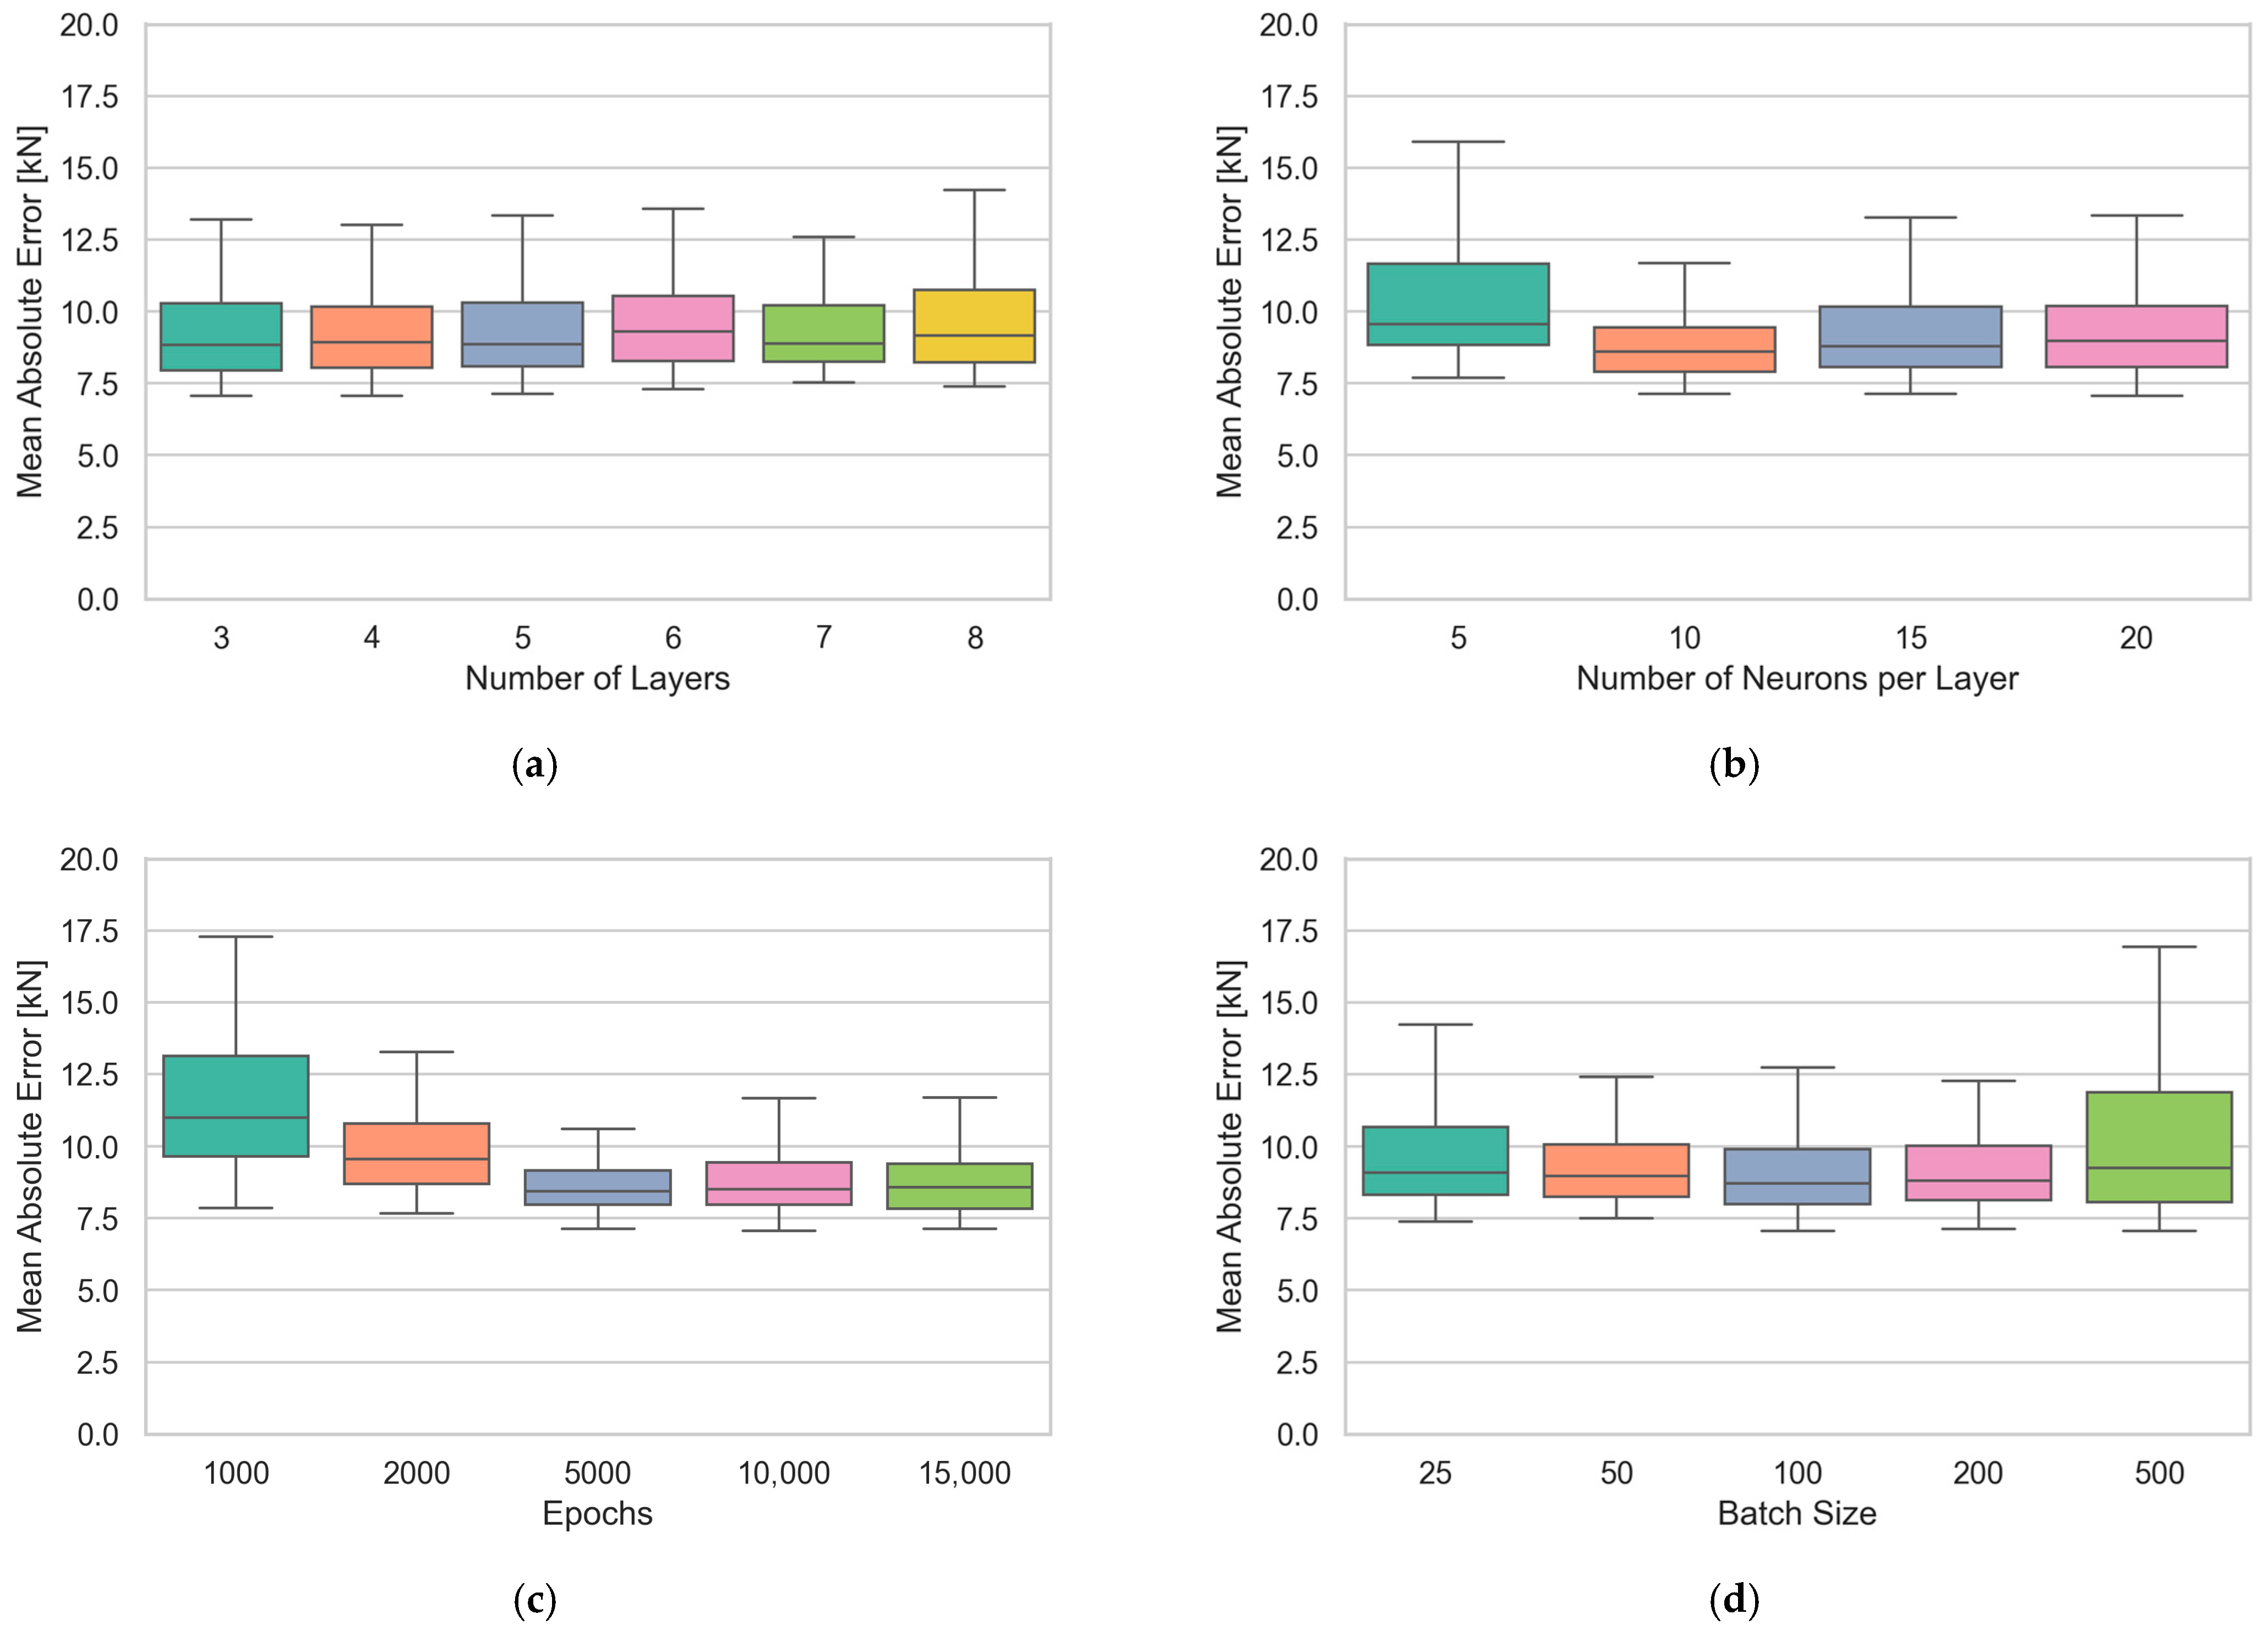
The impact of these hyperparameters on the ANN’s performance, measured by the mean absolute error (MAE), is presented in Figure 9.
Figure 9.
Influence of hyperparameters on the MAE of the neural network: (a) number of hidden layers, (b) number of neurons per layer, (c) number of epochs, (d) batch size.
Analysis of these results indicates that the number of layers had a limited influence on the model’s performance, as the average MAE values remained similar across the different tested levels. However, models with five hidden layers (seven layers) exhibited lower dispersion, which may suggest greater stability during training. In terms of the number of neurons per layer, a moderate trend of performance improvement is observed as this value increases. Models with fewer neurons tend to exhibit higher average errors and greater variability, suggesting a limitation in the model’s representational capacity and, consequently, a reduced ability to capture complex patterns present in the data. Similarly, higher numbers of epochs generally lead to lower MAE values. This can be explained by the greater number of weight updates in the network, which enhances the learning process and allows for more refined adjustments throughout training. Finally, the results indicate that batch size has a significant influence on the validation error. Models trained with small to moderate batch sizes tend to exhibit lower errors and reduced dispersion, whereas larger batch sizes (e.g., 500) are associated with poorer performance. This behavior can be attributed to the fact that smaller batches introduce greater variability in weight updates, which promotes better exploration of the solution space and can help avoid local minima, thereby contributing to more effective generalization. A similar behavior was observed when evaluating these hyperparameters in terms of mean squared error (MSE) and maximum error. Based on the error metrics and the evaluations shown in Figure 9, three architectures listed in Table 6 were selected for having achieved the lowest error values. These architectures were used in the applications described in the following sections.
Table 6.
ANN architecture selected.
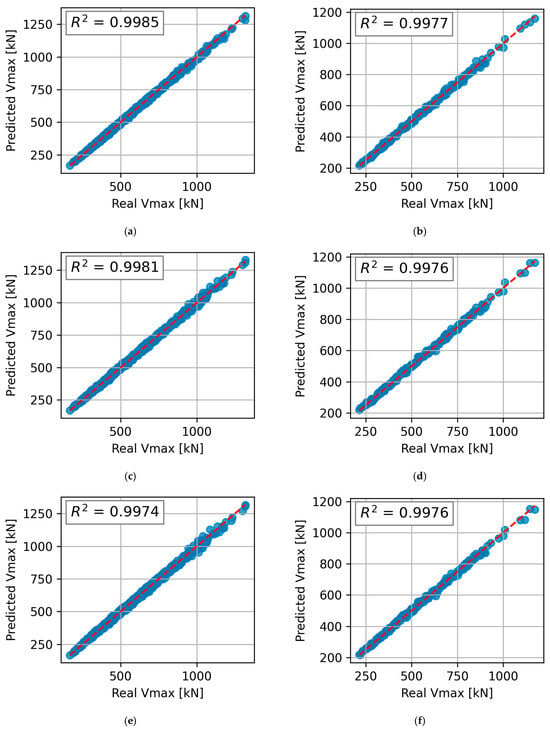
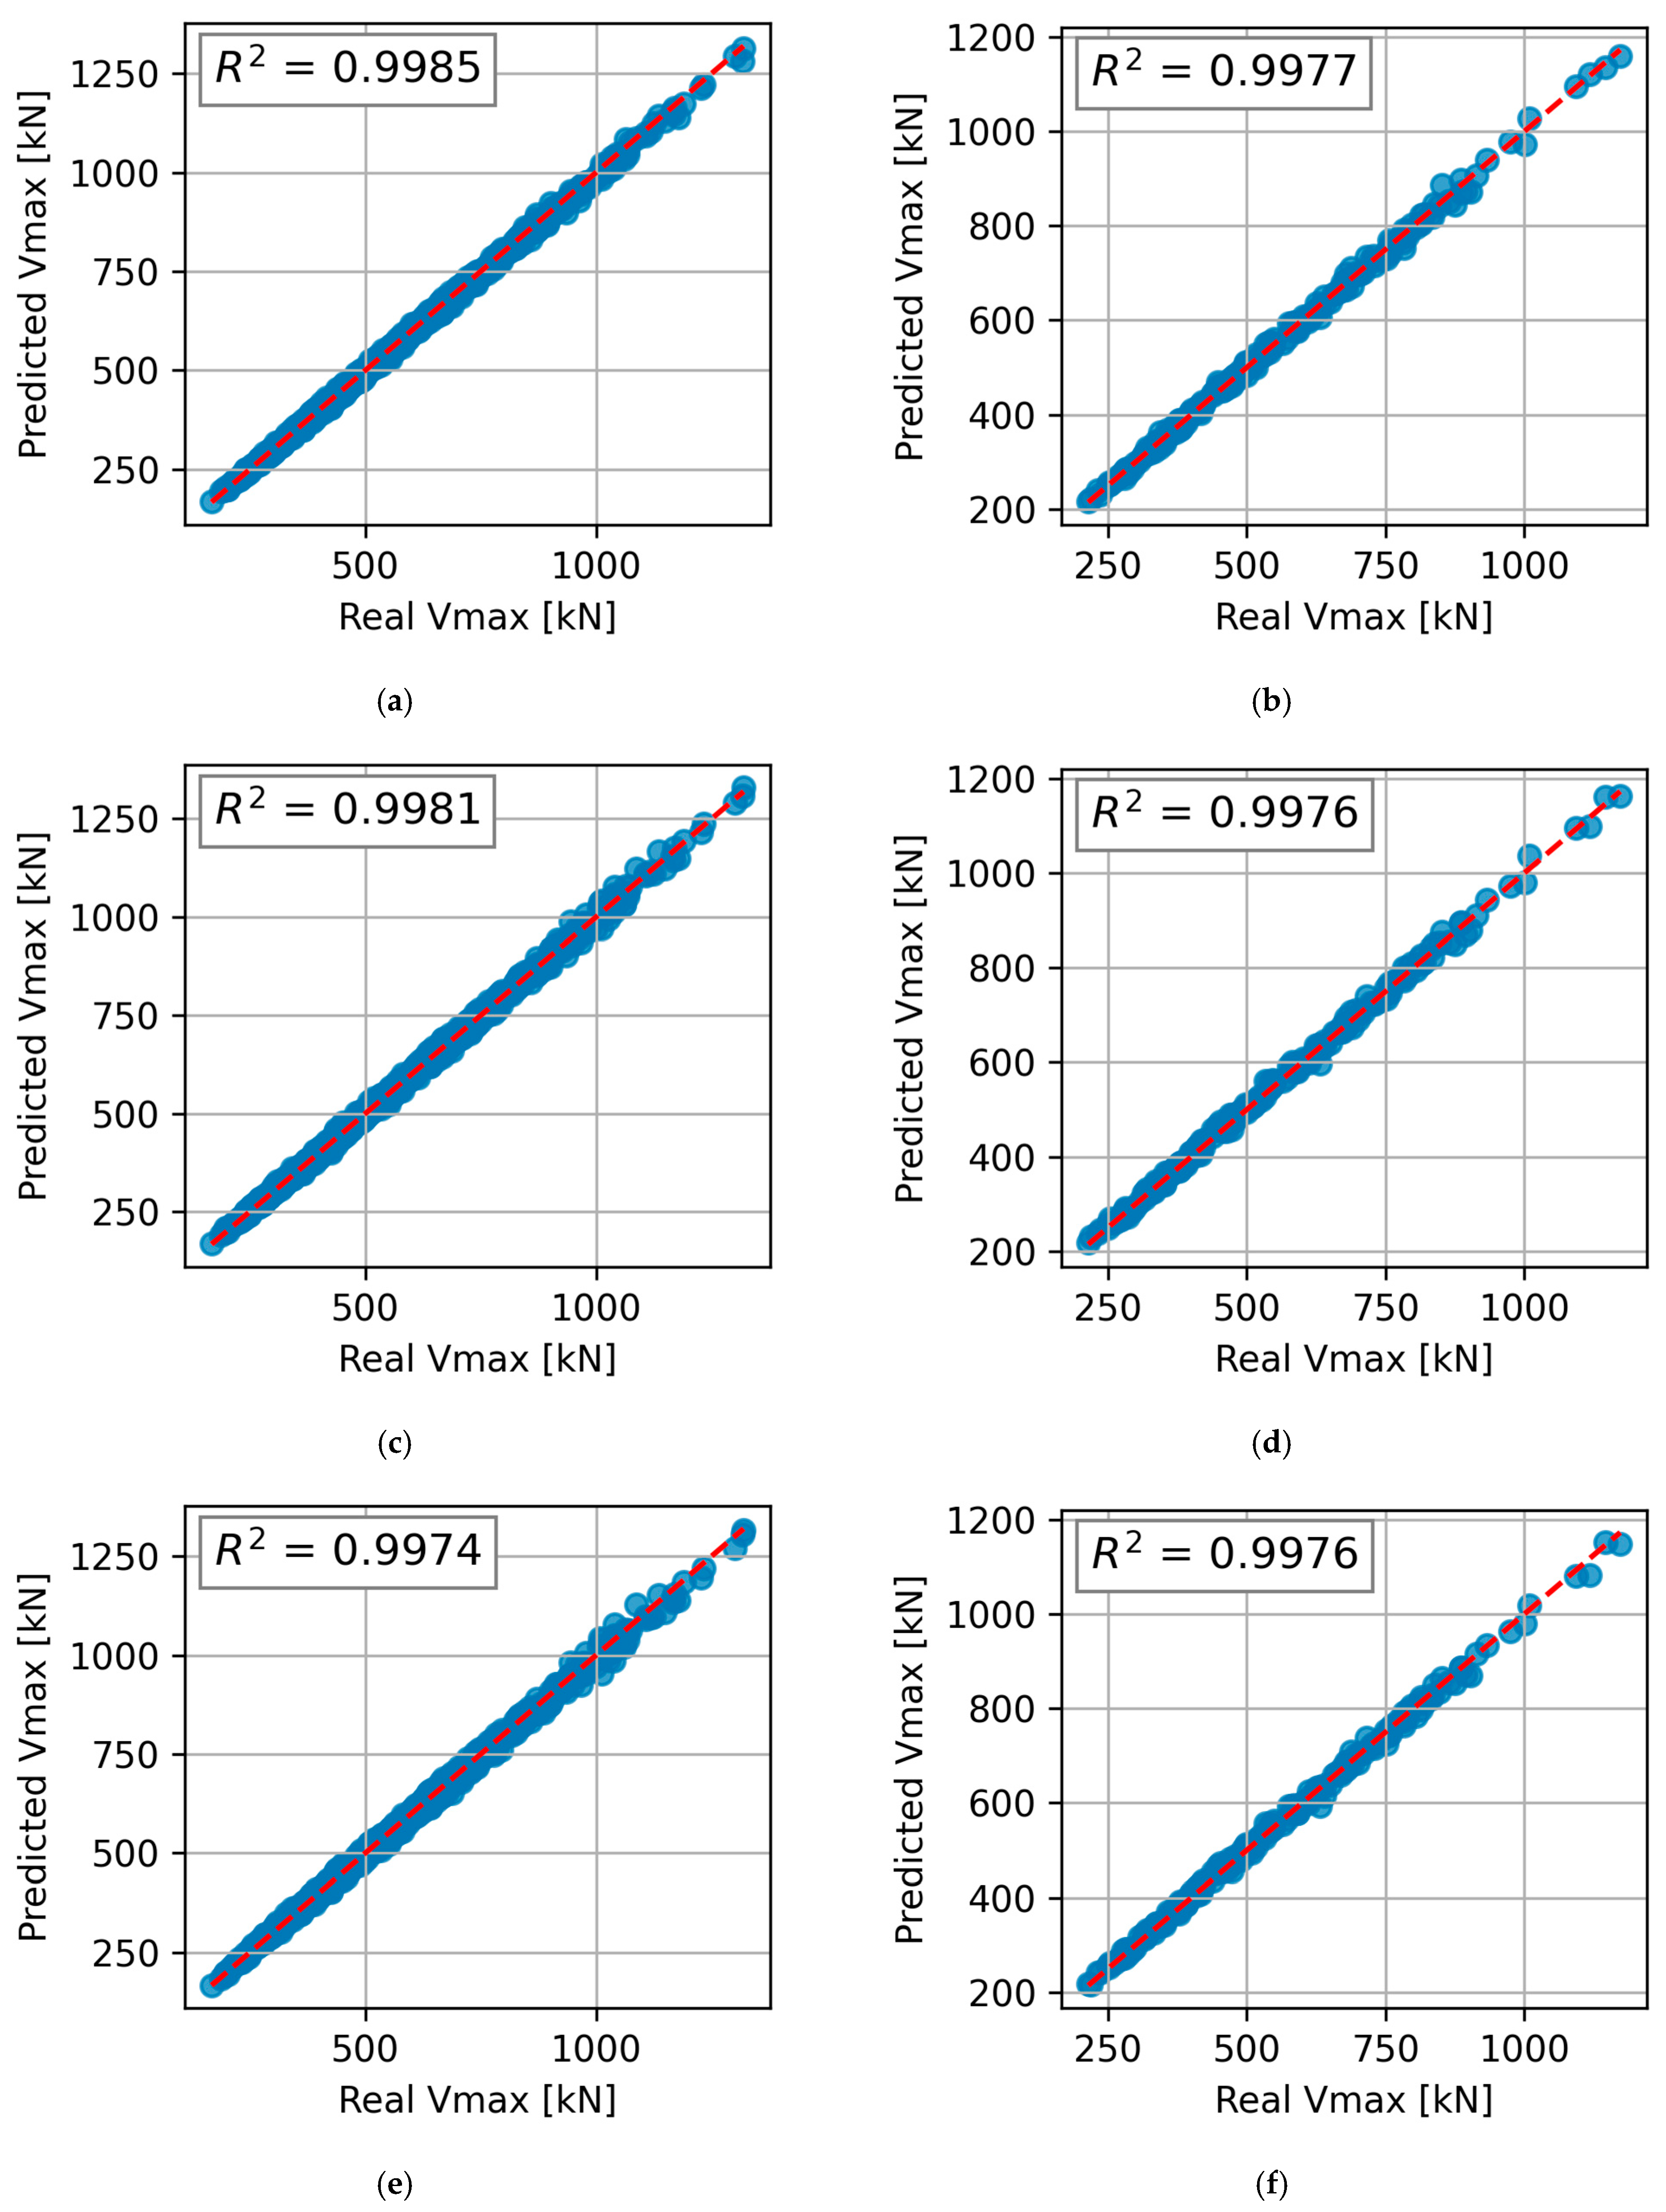
The accuracy of the selected architectures can be observed in Figure 10, both with respect to the training data (80%), used for adjusting the ANN parameters, and the test data (20%), which were not presented to the network during training and are used to assess its generalization capability.
Figure 10.
Predicted vs. actual results obtained from ANN-A (a,b), ANN-B (c,d), and ANN-C (e,f). The plots on the left correspond to the training phase, while those on the right correspond to the test phase.
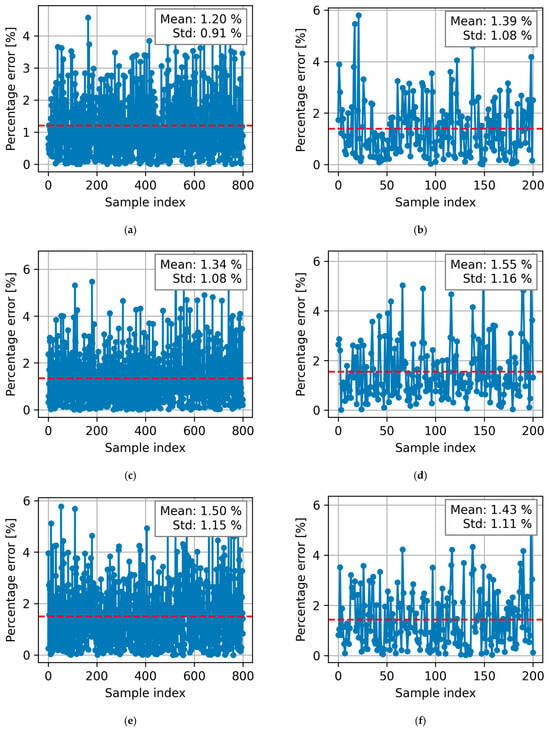
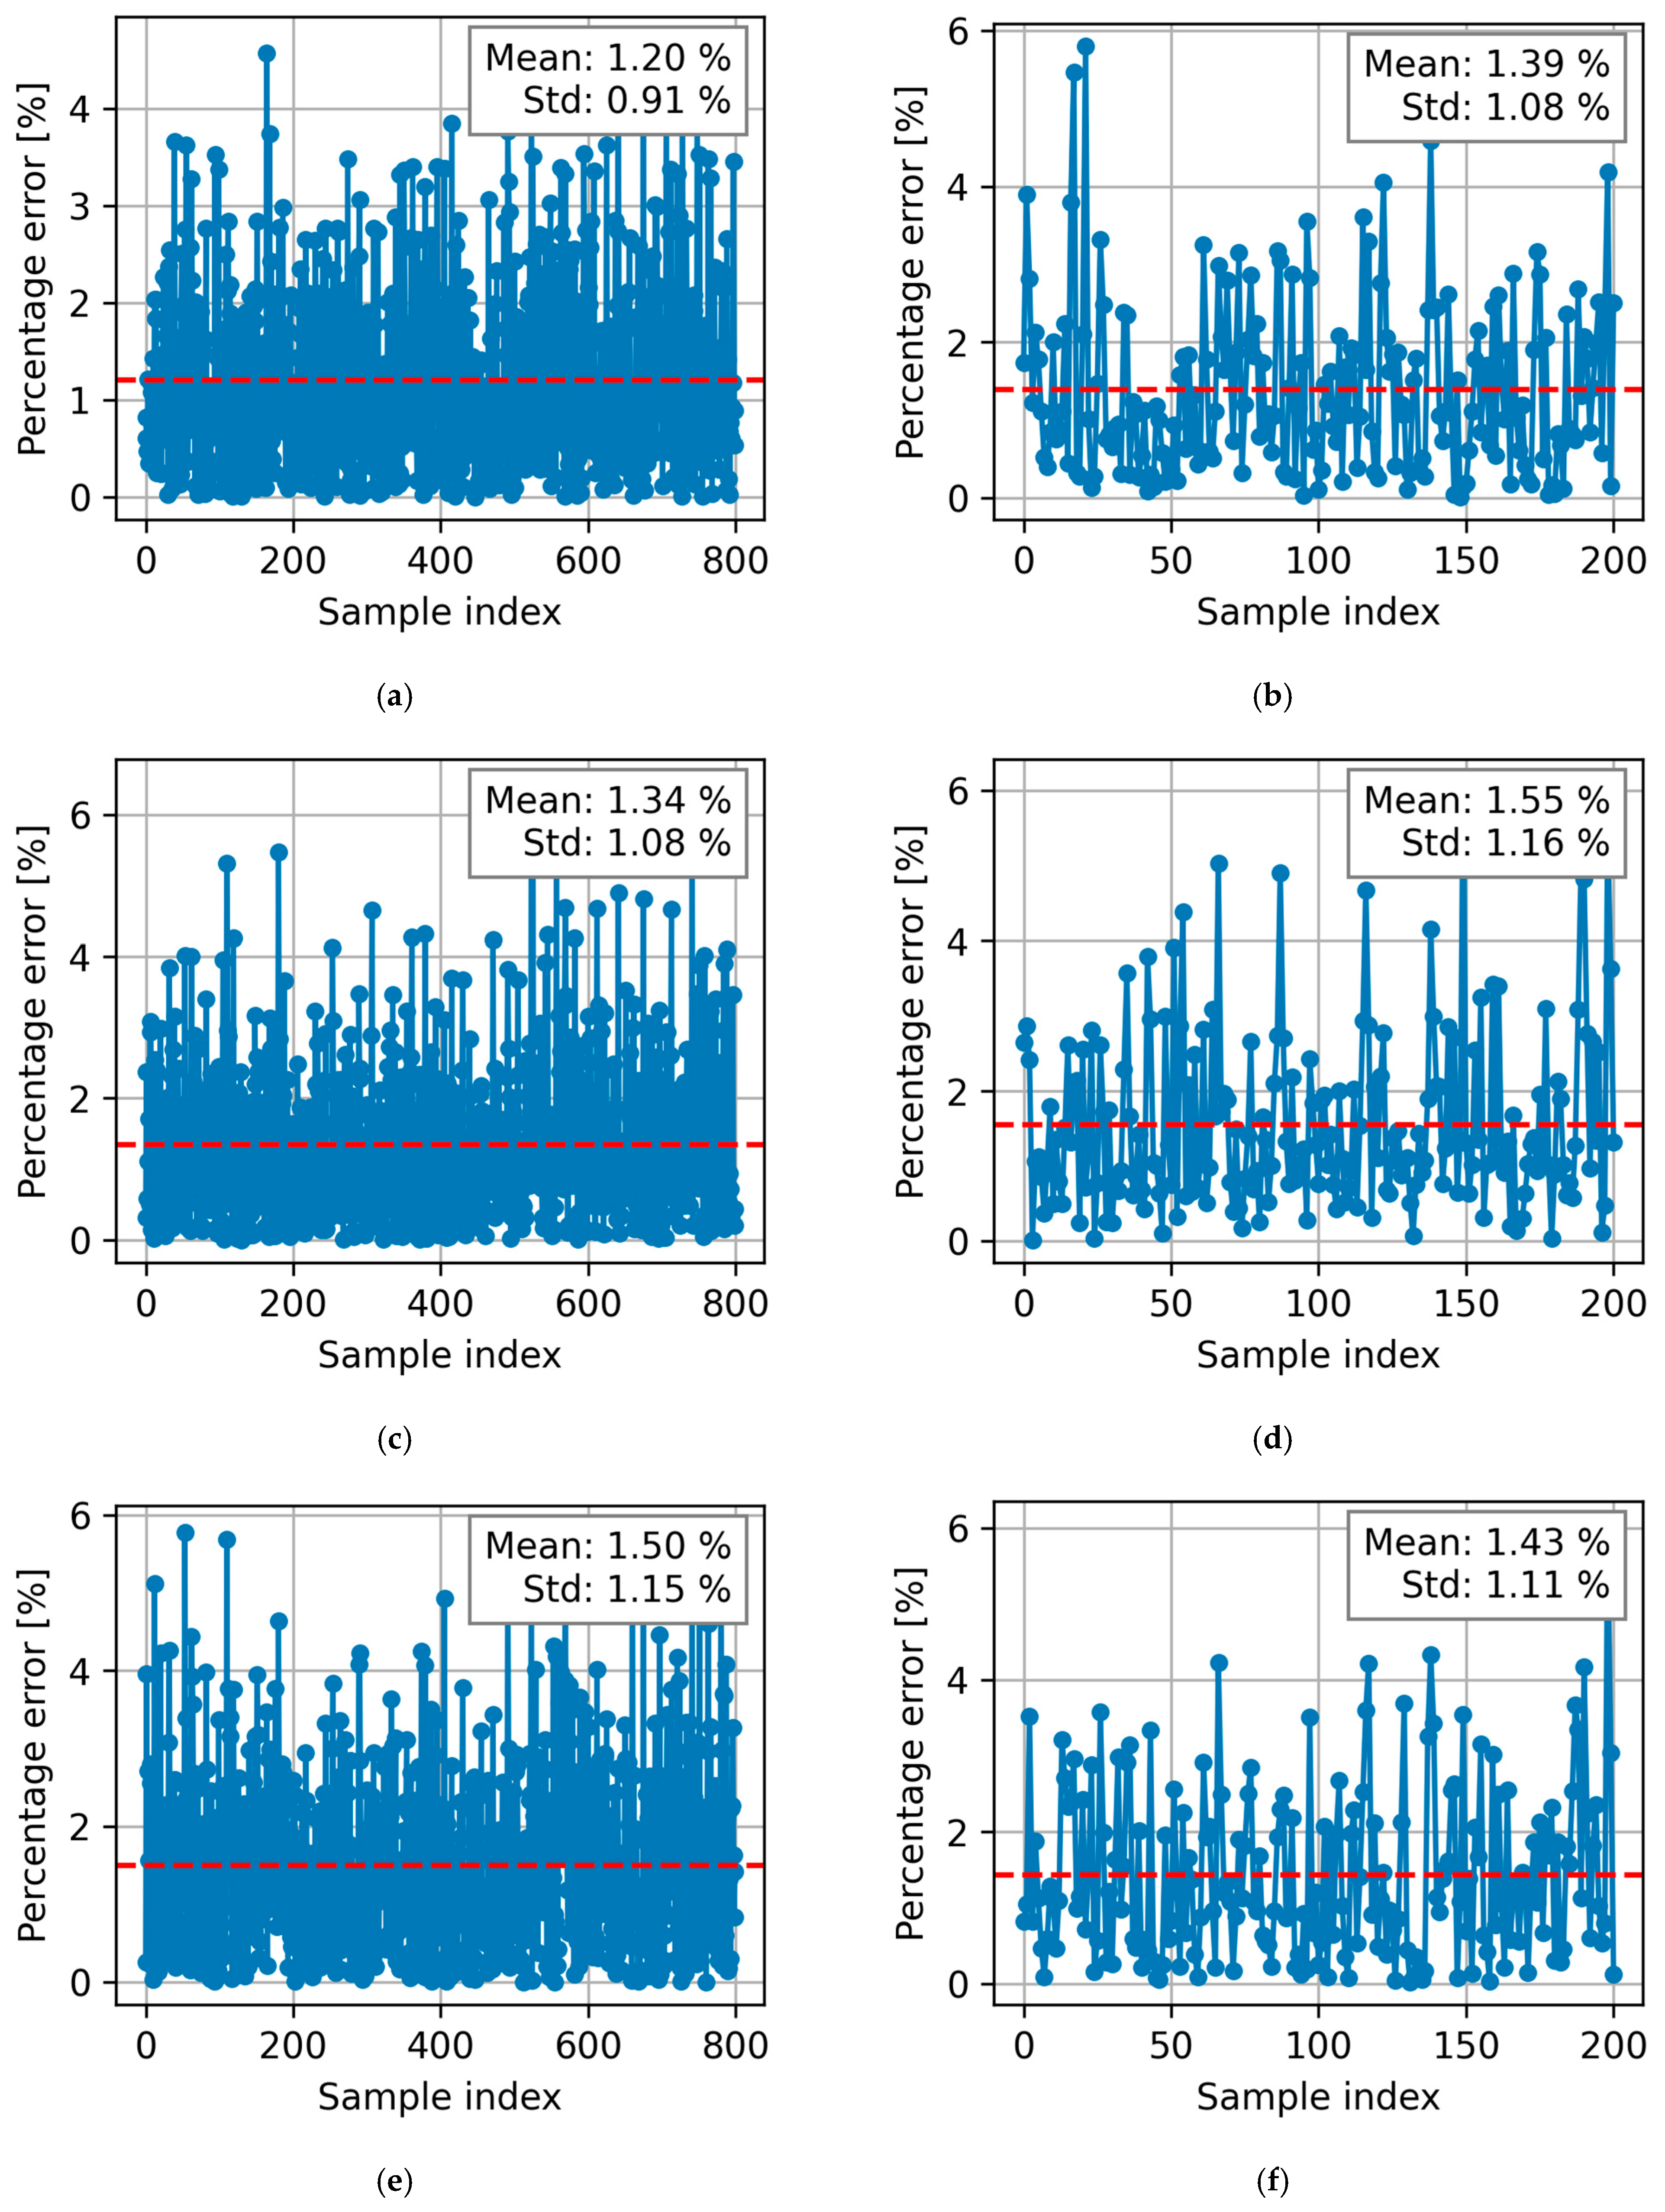
Figure 11 presents the individual percentage error obtained for each sample in the training set (left) and test set (right), enabling a detailed evaluation of error distribution and the predictive consistency of the ANN.
Figure 11.
Percentage error obtained from ANN-A (a,b), ANN-B (c,d), and ANN-C (e,f). The plots on the left correspond to the training phase, while those on the right correspond to the test phase.
As can be seen in Figure 10, all three architectures provide satisfactory results, with R2 values exceeding 0.99 for both the training and test data. This suggests that the architectures were effective in modeling the intrinsic relationships within the training data and in transferring this learning to the test set, thereby ensuring a robust performance. The similarity between the results obtained for the training and test datasets indicates that the developed ANN models achieved good generalization capability, indicating a low risk of overfitting. Figure 11 shows that the mean errors in the testing phase remained below 1.6%, with the highest individual error reaching 6.0% for ANN-A. Furthermore, all values remained below 15%, the limit considered acceptable by ACI 318 [3]. Overall, these results demonstrate the efficiency and capability of ANN in modeling the analyzed structural behavior and in providing accurate predictions within the established parameter ranges.
5.4. Effect of Dataset Size on ANN Model Performance
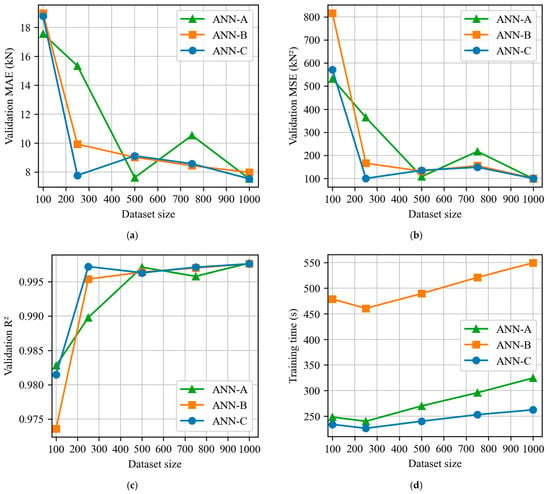
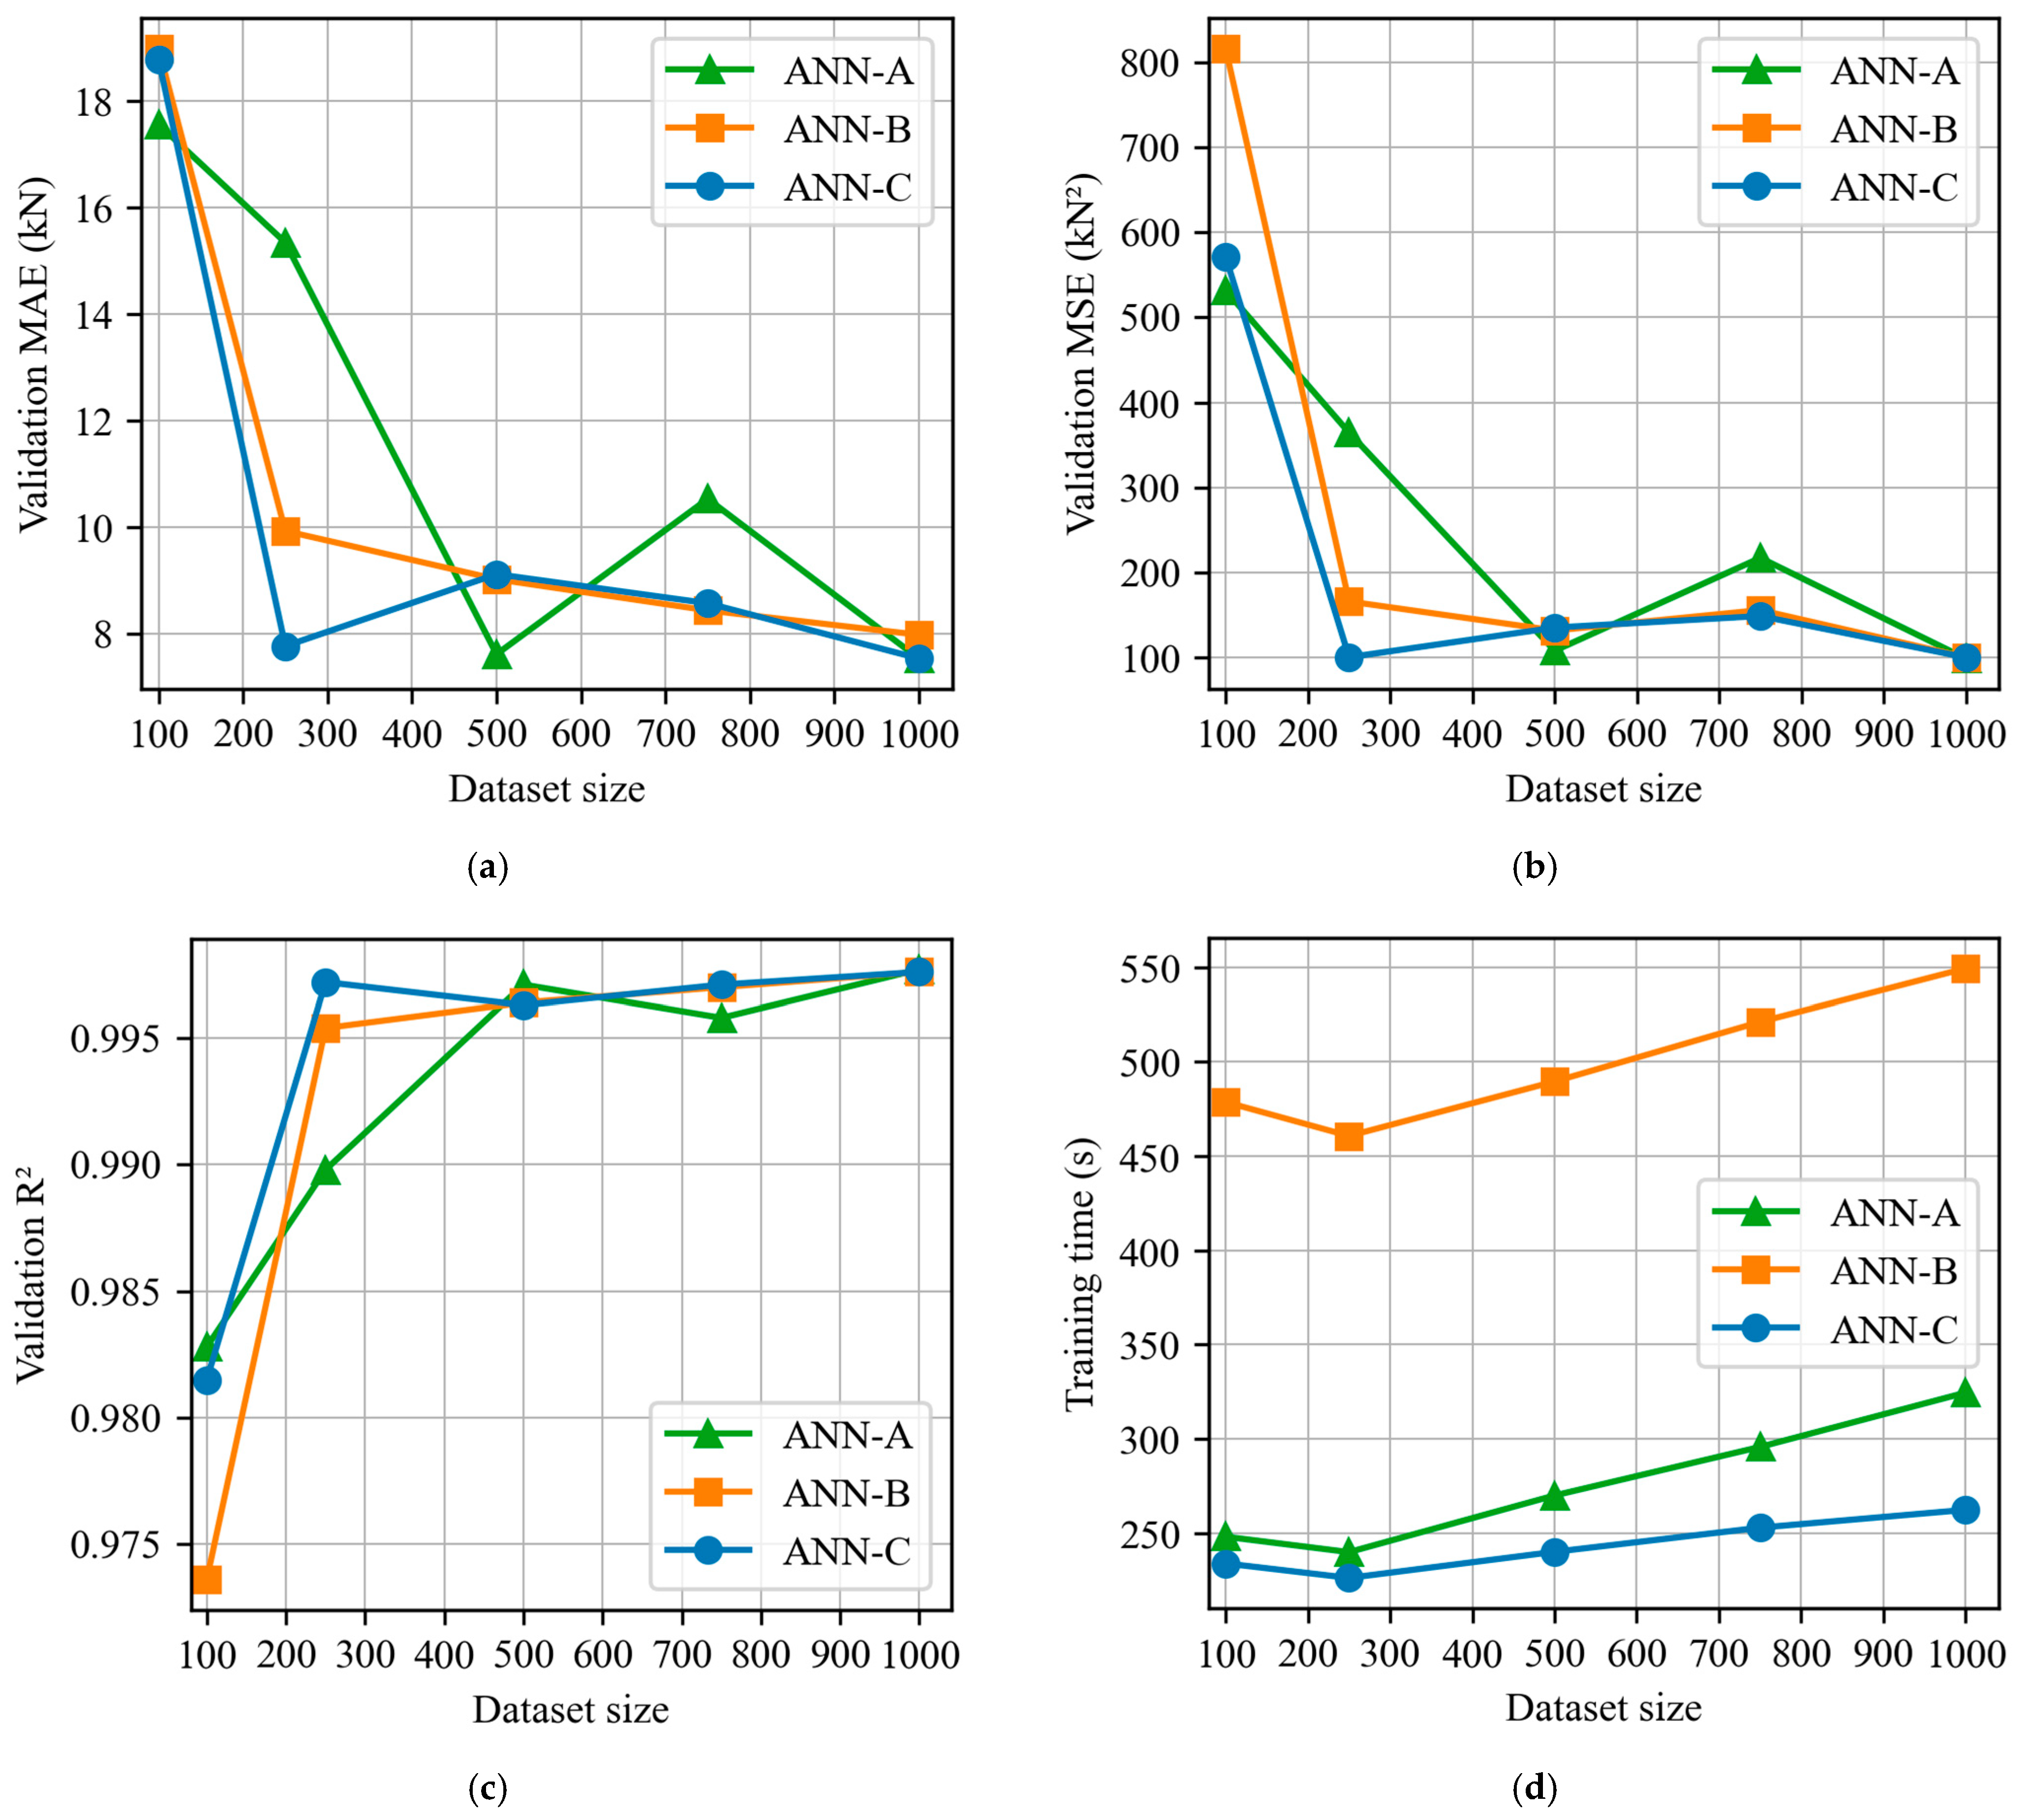
Figure 12 depicts how dataset size affects the performance metrics MAE, MSE, and R2 in the validation dataset. Although ANNs are increasingly applied in structural engineering, there is still a lack of studies that systematically examine how the quantity of available data affects model accuracy. In general, most studies use all available experimental data without investigating the potential impact of dataset size on predictive performance.
Figure 12.
Effect of dataset size on the performance of the trained neural networks: (a) variation of the validation MAE with dataset size, (b) variation of the validation MSE with dataset size, (c) variation of the validation with dataset size, (d) training time as a function of dataset size for the different ANN architectures.
In the present study, the dataset was generated through FE simulations, which involve a high computational cost. The dataset size of 1000 samples was therefore selected to ensure adequate coverage of the parameter space considered in this study while maintaining a reasonable computational effort. Since each dataset entry requires a nonlinear FEM analysis, increasing the dataset size significantly increases the total computational time. To illustrate this computational demand, the generation of the full dataset required approximately 502 h (21 days) on a workstation equipped with an Intel Core i9-10850K processor and 64 GB of RAM.
The results obtained for varying dataset sizes provide valuable insights into the performance of the three ANN architectures analyzed. A consistent reduction in validation errors (MAE and MSE) is observed as the dataset size increases from 100 to 500, followed by a plateau with only marginal variations beyond this point. This trend suggests the existence of a saturation point, after which adding more data results in no significant improvement in the accuracy of the ANN models. For the ANN-A model, the lowest MAE value was recorded with 500 data points. With respect to the ANN-B and ANN-C networks, only slight variations were observed within the range of 500 to 1000 examples, suggesting that although increasing the dataset size may still offer marginal improvements, its effect on predictive performance becomes progressively less significant. The determination coefficients (R2) also support this pattern. While lower R2 values were observed with 100 data points, all ANNs reached values above 0.99 from 500 data points and above, showing minimal variation in the correlation between predicted and reference values. These findings strengthen the conclusion that, beyond this point, the models can learn the main patterns in the input data.
It is important to note that the conclusion regarding the ideal dataset size is directly linked to the range of variations in the input variables adopted in this study. As the models were developed using parameters selected within well-defined ranges, the number of examples needed to capture the problem’s patterns tends to be lower than in scenarios characterized by greater variability. Nevertheless, the results suggest that datasets with 500 to 750 examples constitute an appropriate choice, offering reliable prediction results. Although larger datasets may provide marginal gains, their adoption should be carefully evaluated, considering the computational costs associated with both the training of neural networks and the construction of the database through numerical simulations. Despite the results being influenced by the parameters and ranges adopted in this study, they provide an important reference for future investigations.
6. Comparison of ANN-FEM Predictions with Current Design Codes
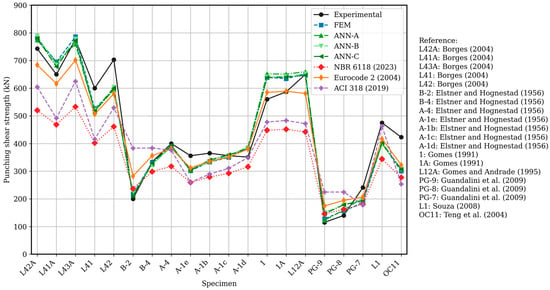
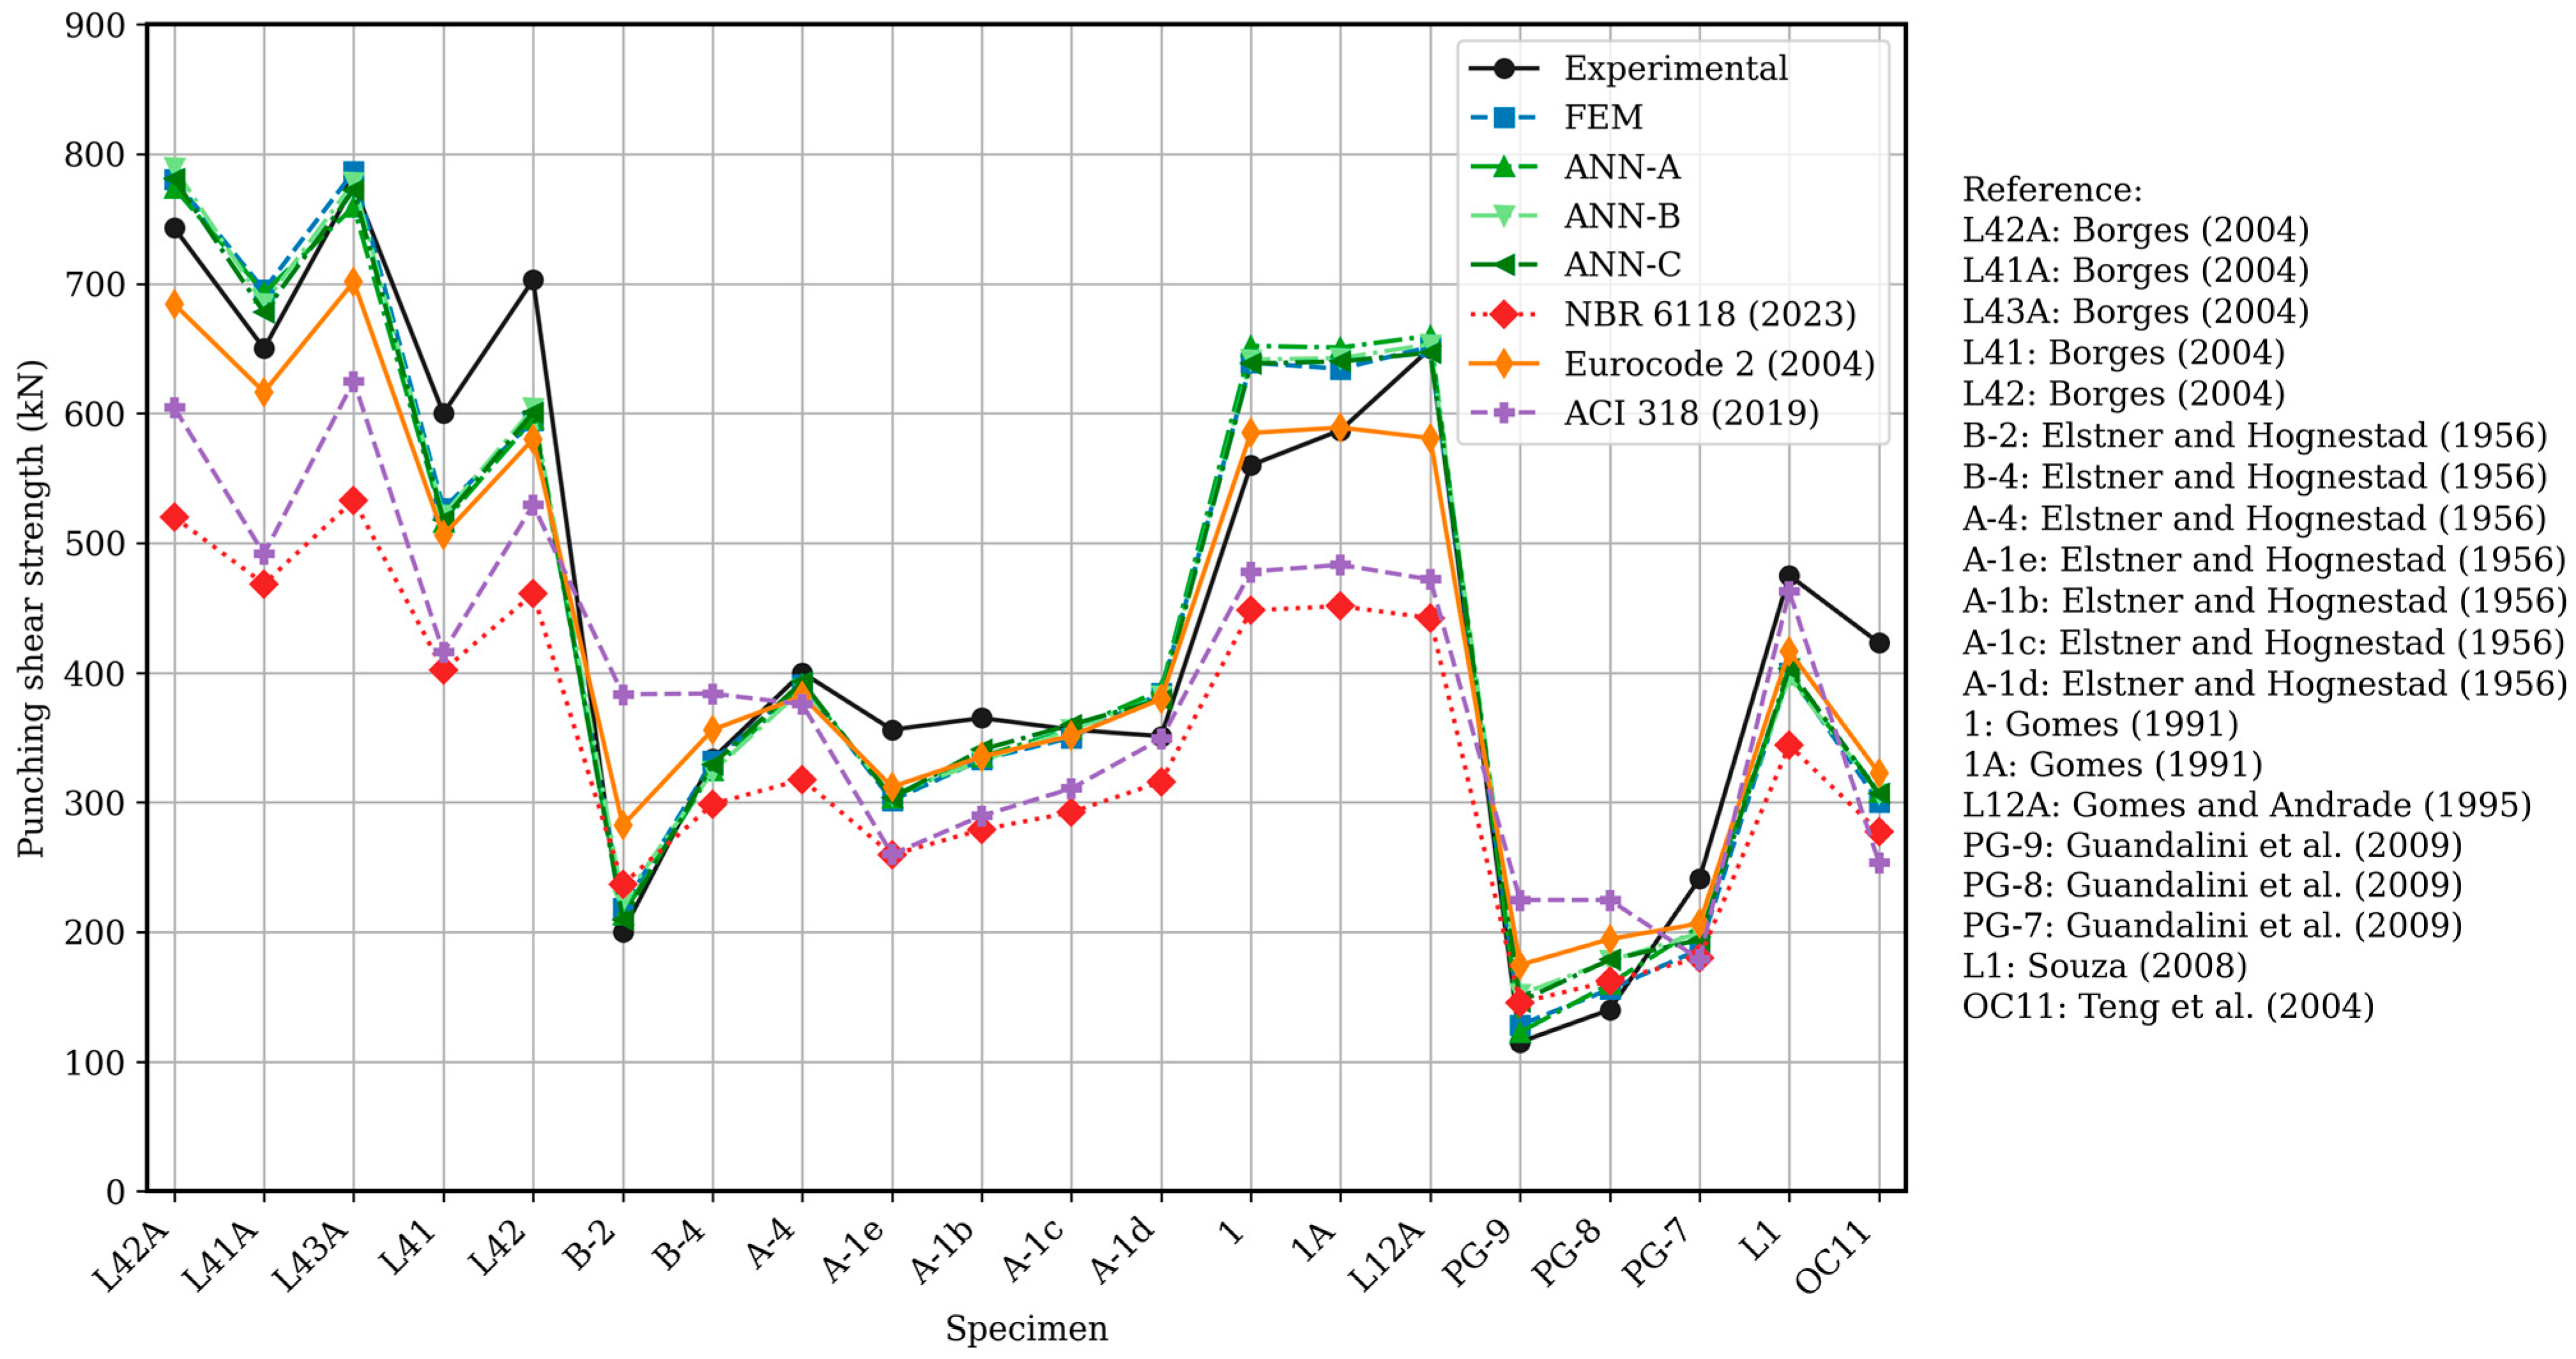
For the purpose of evaluating the predictive capability of the selected ANN architectures (ANN-A, ANN-B, and ANN-C), this section presents a comparison between the results provided by the networks and the punching shear capacity of 20 flat slabs available in the literature (Figure 13). The input parameters of all selected models (, , , , and ) are within the ranges specified in Table 4. At the same time, the experimental prototypes are also evaluated using the design equations from the main current codes, NBR 6118 [33] (Brazil), Eurocode 2 [4] (Europe), and ACI 318 [3] (United States), which present well-established approaches. By comparing the results obtained from the ANNs with those predicted by design codes, this study aims not only to highlight the accuracy of the hybrid ANN-FEM approach but also to demonstrate their applicability as a complementary or alternative tool to traditional design methods. This comparison provides valuable evidence for the consolidation of machine learning-based methodologies within the context of structural engineering.
Figure 13.
Comparison between the experimental results available in the literature [43,44,45,46,47,48,49], the estimates obtained using a numerical model based on the Finite Element Method (FEM), three distinct artificial neural network architectures (ANN-A, ANN-B, and ANN-C), and the design provisions of the NBR 6118 [33], Eurocode 2 [4], and ACI 318 [3] codes.
Figure 13 reveals that the ANN and FEM model results generally agree well with the experimental data from the literature. For these data, the mean percentage errors obtained were 11.60% and 10.05%, respectively. On the other hand, the maximum loads estimated using the equations prescribed by the design codes showed more significant deviations. NBR 6118 [33] and ACI 318 [3] demonstrated a pronounced tendency to underestimate, with mean errors of 24.47% and 28.78%, respectively. In comparison, Eurocode 2 [4] showed intermediate performance, with a mean percentage error of 14.73%.
When examining the experimental models individually, these differences become even more evident. For prototype L41A, for example, while FEM and ANN provided estimates approximately 7% higher than the experimental value (650 kN), ACI 318 [3] and NBR 6118 [33] underestimated the resistance by 24% and 28%, respectively. A similar situation occurs with prototype L42, for which NBR 6118 [33] underestimated the experimental load (703 kN) by more than 34%, whereas the ANN and FEMs maintained errors around −14%. In models with higher resistance, such as L42A (743 kN), the differences between methods also remain significant: while ANN and FEM predictions were between 5% and 7% above the experimental value, NBR 6118 [33] underestimated it by 30%, and ACI 318 [3] by 18%. In models with lower resistance, such as PG-9, the estimates provided by FEM and ANN remained close to the experimental value (115 kN), with overestimations of 11.6% and 6.6%, respectively. In contrast, the design codes exhibited more significant deviations: NBR 6118 [33] overestimated by 26.5%, Eurocode 2 [4] by 51.8%, and ACI 318 [3] nearly doubled the experimental load, with a difference of 95.4%.
Overall, the results presented in this section highlight the potential of artificial intelligence-based approaches as an effective alternative for predicting punching shear resistance in flat slabs, particularly in view of the accuracy limitations observed in code provisions.
7. Conclusions and Remarks
This study presented a hybrid methodology based on ANN–FEM for predicting the punching shear capacity of conventional flat slabs. Using this methodology, the performance of the ANN models was investigated and evaluated considering different network hyperparameters (number of hidden layers, number of neurons, batch size, and number of epochs) and the dataset size. Finally, using the validated ANN–FEM model, a comparative study was conducted to demonstrate the applicability of neural network-based models in comparison to the equations prescribed by the main design codes: NBR 6118 [33], Eurocode 2 [4], and ACI 318 [3]. In this context, the main conclusions obtained are summarized as follows:
- The ANN models trained using FEM results data achieved high predictive accuracy, with determination coefficients (R2) exceeding 0.99 and mean absolute errors (MAE) below 8 kN in the validation sets. When compared with experimental reference results, ANN and FEM predictions exhibited mean percentage errors of 11.60% and 10.05%, respectively, values substantially lower than those found for the design codes, which ranged from 14.73% to 95.4%.
- The validated ANN–FEM model consistently outperformed traditional design code equations (NBR 6118 [33], Eurocode 2 [4], and ACI 318 [3]) in both global and individual evaluations. The design codes, especially ACI 318 [3] and NBR 6118 [33], showed a pronounced tendency to underestimate or overestimate the punching shear capacity, highlighting the conservative nature and limited generalization of their empirical formulations.
- The proposed methodology combines the power of FEM with the computational efficiency of ANN. Once trained, ANN models can provide rapid predictions with minimal computational cost, making them especially useful for preliminary design, parametric studies, or as a support tool for practicing engineers.
- A sensitivity study on dataset size revealed that, in this study, 500 to 750 samples are sufficient to achieve accurate predictions. Increasing the dataset beyond this range results in marginal performance gains. Although specific to the present study, this range provides a useful reference for researchers working with ANN models in structural engineering, especially considering that previous studies have not clearly defined the amount of data required for efficient model training.
- The present study is limited to conventional flat slabs subjected to concentric loading, with input parameters confined to predefined ranges (Table 4). Future research can explore the generalization of the hybrid ANN–FEM approach to flat slabs with openings or eccentric loads, where design equations are highly complex or not available. Additional efforts can include sensitivity analyses of the input variables, uncertainty quantification and statistical evaluation of punching shear resistance, and development of structural-design software based on ANN models.
Author Contributions
L.C.M.: Conceptualization, methodology, software, validation, formal analysis, investigation, data curation, writing—original draft preparation. M.G.M.: Conceptualization, methodology, formal analysis, investigation, writing—review and editing, supervision. M.T.M.: Conceptualization, formal analysis, investigation, data curation, writing—review and editing, supervision. E.P.L.: Conceptualization, software, validation, formal analysis, investigation, writing—review and editing. V.D.R.R.: Conceptualization, methodology, software, validation, formal analysis, writing—review and editing, visualization. All authors have read and agreed to the published version of the manuscript.
Funding
This research received no external funding.
Data Availability Statement
Some or all data, models, and codes that support the findings of this study are available from the corresponding author upon reasonable request. The materials that may be provided include the database, finite element models, and Python codes.
Conflicts of Interest
The authors declare that they have no known competing financial interests or personal relationships that could have appeared to influence the work reported in this paper.
References
- Schimanowski, E.R.Z.; Tamayo, J.P.; Lazzari, P.M.; Campos Filho, A. State-of-the-Art Review of Numerical Simulation of Punching Shear in Slabs; Springer: Dordrecht, The Netherlands, 2025; ISBN 0123456789. [Google Scholar]
- Elsayed, M.; Tayeh, B.A.; Mohamed, M.; Elymany, M.; Mansi, A.H. Punching Shear Behaviour of RC Flat Slabs Incorporating Recycled Coarse Aggregates and Crumb Rubber. J. Build. Eng. 2021, 44, 103363. [Google Scholar] [CrossRef] [Scilit]
- ACI 318-19; Building Code Requirements for Structural Concrete. American Concrete Institute: Farmington Hills, MI, USA, 2019.
- BS EN 1992-1-1:2023; Eurocode 2-Design of Concrete Structures. European Committee for Standardization: Brussels, Belgium, 2023; Volume 1.
- Fédération Internationale du Béton. Model Code 2010; Fib Bulletins; Fib; The International Federation for Structural Concrete: Lausanne, Switzerland, 2010. [Google Scholar]
- Elshafey, A.A.; Rizk, E.; Marzouk, H.; Haddara, M.R. Prediction of Punching Shear Strength of Two-Way Slabs. Eng. Struct. 2011, 33, 1742–1753. [Google Scholar] [CrossRef] [Scilit]
- Meisami, M.H.; Mostofinejad, D.; Nakamura, H. Strengthening of Flat Slabs with FRP Fan for Punching Shear. Compos. Struct. 2014, 119, 305–314. [Google Scholar] [CrossRef] [Scilit]
- Inácio, M.M.G.; Almeida, A.F.O.; Faria, D.M.V.; Lúcio, V.J.G.; Ramos, A.P. Punching of High Strength Concrete Flat Slabs without Shear Reinforcement. Eng. Struct. 2015, 103, 275–284. [Google Scholar] [CrossRef] [Scilit]
- Ferreira, M.d.P.; Oliveira, M.H.; Melo, G.S.S.A. Tests on the Punching Resistance of Flat Slabs with Unbalanced Moments. Eng. Struct. 2019, 196, 109311. [Google Scholar] [CrossRef] [Scilit]
- Said, M.; Adam, M.A.; Arafa, A.E.; Moatasem, A. Improvement of Punching Shear Strength of Reinforced Lightweight Concrete Flat Slab Using Different Strengthening Techniques. J. Build. Eng. 2020, 32, 101749. [Google Scholar] [CrossRef] [Scilit]
- Mendes, R.P.; Mesquita, L.C.; Ferreira, M.P.; Trautwein, L.M.; Marvila, M.T.; Marques, M.G. Numerical Evaluation of the Punching Shear Strength of Flat Slabs Subjected to Balanced and Unbalanced Moments. Buildings 2024, 14, 985. [Google Scholar] [CrossRef] [Scilit]
- Thai, H.T. Machine Learning for Structural Engineering: A State-of-the-Art Review. Structures 2022, 38, 448–491. [Google Scholar] [CrossRef] [Scilit]
- Mangalathu, S.; Shin, H.; Choi, E.; Jeon, J.S. Explainable Machine Learning Models for Punching Shear Strength Estimation of Flat Slabs without Transverse Reinforcement. J. Build. Eng. 2021, 39, 102300. [Google Scholar] [CrossRef] [Scilit]
- Chetchotisak, P.; Ruengpim, P.; Chetchotsak, D.; Yindeesuk, S. Punching Shear Strengths of RC Slab-Column Connections: Prediction and Reliability. KSCE J. Civ. Eng. 2018, 22, 3066–3076. [Google Scholar] [CrossRef] [Scilit]
- Nguyen, H.D.; Truong, G.T.; Shin, M. Development of Extreme Gradient Boosting Model for Prediction of Punching Shear Resistance of r/c Interior Slabs. Eng. Struct. 2021, 235, 112067. [Google Scholar] [CrossRef] [Scilit]
- Choi, K.K.; Reda Taha, M.M.; Sherif, A.G. Simplified Punching Shear Design Method for Slab-Column Connections Using Fuzzy Learning. ACI Struct. J. 2007, 104, 438–447. [Google Scholar] [CrossRef] [Scilit]
- Yaseen, Z.M.; Tran, M.T.; Kim, S.; Bakhshpoori, T.; Deo, R.C. Shear Strength Prediction of Steel Fiber Reinforced Concrete Beam Using Hybrid Intelligence Models: A New Approach. Eng. Struct. 2018, 177, 244–255. [Google Scholar] [CrossRef] [Scilit]
- Spencer, B.F.; Hoskere, V.; Narazaki, Y. Advances in Computer Vision-Based Civil Infrastructure Inspection and Monitoring. Engineering 2019, 5, 199–222. [Google Scholar] [CrossRef] [Scilit]
- Sun, H.; Burton, H.V.; Huang, H. Machine Learning Applications for Building Structural Design and Performance Assessment: State-of-the-Art Review. J. Build. Eng. 2021, 33, 101816. [Google Scholar] [CrossRef] [Scilit]
- Peres, M.L.; Sotelino, E.D.; Mesquita, L.C. Intelligent Element: Coupling Green Function Approach and Artificial Intelligence to Reduce Discretization Effort. Int. J. Numer. Anal. Methods Geomech. 2023, 47, 1051–1072. [Google Scholar] [CrossRef] [Scilit]
- Brandão, A.R.A.; Schwamback, D.; de Menezes Filho, F.C.M.; Oliveira, P.T.S.; Fava, M.C. Artificial Neural Networks for Flood Prediction in Current and CMIP6 Climate Change Scenarios. J. Flood Risk Manag. 2025, 18. [Google Scholar] [CrossRef] [Scilit]
- Babiker, A.; Abbas, Y.M.; Khan, M.I.; Masmoudi, R. Enhancing Design and Behavioral Understanding of Steel Fiber-Reinforced Concrete Flat Slabs through a Robust Machine Learning Framework. J. Build. Eng. 2025, 111, 113133. [Google Scholar] [CrossRef] [Scilit]
- Said, A.M.; Tian, Y.; Hussein, A. Evaluating Punching Shear Strength of Slabs without Shear Reinforcement Using Artificial Neural Networks. Am. Concr. Inst. ACI Spec. Publ. 2011, 107–124. [Google Scholar] [CrossRef] [Scilit]
- Gandomi, A.H.; Roke, D.A. Assessment of Artificial Neural Network and Genetic Programming as Predictive Tools. Adv. Eng. Softw. 2015, 88, 63–72. [Google Scholar] [CrossRef] [Scilit]
- Tran, V.L.; Kim, S.E. A Practical ANN Model for Predicting the PSS of Two-Way Reinforced Concrete Slabs. Eng. Comput. 2021, 37, 2303–2327. [Google Scholar] [CrossRef] [Scilit]
- Ors, D.M.; Ramadan, M.; Maree, A.M.F.; Zaher, A.H.; Afifi, A.; Ebid, A.M. Machine Learning Base Models to Predict the Punching Shear Capacity of Posttensioned UHPC Flat Slabs. Sci. Rep. 2024, 14, 3969. [Google Scholar] [CrossRef] [Scilit] [PubMed]
- Asteris, P.G.; Tsavdaridis, K.D.; Lemonis, M.E.; Ferreira, F.P.V.; Le, T.T.; Gantes, C.J.; Formisano, A. AI-Powered GUI for Prediction of Axial Compression Capacity in Concrete-Filled Steel Tube Columns; Springer: London, UK, 2024; Volume 36. [Google Scholar]
- Liberati, E.A.P.; Marques, M.G.; Leonel, E.D.; Almeida, L.C.; Trautwein, L.M. Failure Analysis of Punching in Reinforced Concrete Flat Slabs with Openings Adjacent to the Column. Eng. Struct. 2019, 182, 331–343. [Google Scholar] [CrossRef] [Scilit]
- Marques, M.G.; Liberati, E.A.P.; Gomes, R.B.; Almeida, L.C.; Trautwein, L.M. Study of Failure Mode of Reinforced Concrete Flat Slabs with Openings and Studs. ACI Struct. J. 2020, 117, 39–48. [Google Scholar] [CrossRef] [Scilit]
- Marques, M.G.; Liberati, E.A.P.; Pimentel, M.J.; de Souza, R.A.; Trautwein, L.M. Nonlinear Finite Element Analysis (NLFEA) of Reinforced Concrete Flat Slabs with Holes. Structures 2020, 27, 1–11. [Google Scholar] [CrossRef] [Scilit]
- D’Almeida Rodrigues Ramos, V.; Liberati, E.A.P.; Trautwein, L.M. Calibração Dos Parâmetros De Plasticidade Danificada Do Concreto Para Lajes Lisas No Abaqus. Rev. Tecnológica 2024, 33, 141–150. [Google Scholar] [CrossRef] [Scilit]
- Ramos, V.D.A.R.; Liberati, E.A.P.; Trautwein, L.M. Numerical Analysis of the Corrosion Impact on the Punching Shear Capacity of Flat Slabs with Openings. Struct. Concr. 2025, 26, 5106–5124. [Google Scholar] [CrossRef] [Scilit]
- ABNT NBR 6118; Projeto de Estruturas de Concreto. Associação Brasileira de Normas Técnicas: Rio de Janeiro, Brazil, 2023.
- Dassault Systèmes Abaqus, version 2021. SIMULIA User Assistance 2021. Dassault Systèmes: Vélizy-Villacoublay, France, 2020.
- Hordijik, D.A. Tensile and Tensile Fatigue Behaviour of Concrete: Experiments, Modelling and Analyses. Heron 1992, 37. Available online: http://heronjournal.nl/37-1/1.pdf (accessed on 11 March 2026).
- Ang, A.H.; Tang, W.H. Probability Concepts in Engineering: Emphasis on Applications in Civil & Environmental Engineering; John Wiley Sons Inc.: Hoboken, NJ, USA, 2015; Volume 27, pp. 1–419. [Google Scholar]
- Ashkar, F.; Aucoin, F. Discriminating between the Lognormal and the Log-Logistic Distributions for Hydrological Frequency Analysis. J. Hydrol. Eng. 2012, 17, 160–167. [Google Scholar] [CrossRef] [Scilit]
- Haykin, S. Neural Networks and Learning Machines, 3rd ed.; Pearson: London, UK, 2018. [Google Scholar]
- Dazzi, S.; Vacondio, R.; Mignosa, P. Flood Stage Forecasting Using Machine-Learning Methods: A Case Study on the Parma River (Italy). Water 2021, 13, 1612. [Google Scholar] [CrossRef] [Scilit]
- Basheer, I.A.; Hajmeer, M. Artificial Neural Networks: Fundamentals, Computing, Design, and Application. J. Microbiol. Methods 2000, 43, 3–31. [Google Scholar] [CrossRef] [Scilit]
- Kingma, D.P.; Ba, J.L. Adam: A Method for Stochastic Optimization. In Proceedings of the 3rd International Conference on Learning Representations, ICLR 2015-Conference Track Proceedings, San Diego, CA, USA, 7–9 May 2015; pp. 1–15. [Google Scholar]
- Abiodun, O.I.; Jantan, A.; Omolara, A.E.; Dada, K.V.; Mohamed, N.A.E.; Arshad, H. State-of-the-Art in Artificial Neural Network Applications: A Survey. Heliyon 2018, 4, e00938. [Google Scholar] [CrossRef] [Scilit]
- de Borges, L.L.J. Comportamento Ao Puncionamento de Lajes Cogumelo de Concreto Armado Com Pilares Retangulares e Furos de Grandes Dimensões. Ph.D. Thesis, Universidade de Brasília, Brasilia, Brazil, 2004. [Google Scholar]
- Elstner, R.C.; Hognestad, E. Shearing Strength of Reinforced Concrete Slabs. ACI J. Proc. 1956, 53, 29–58. [Google Scholar] [CrossRef] [Scilit]
- Gomes, R.B. Punching Resistance of Reinforced Concrete Flat Slabs with Shear Reinforcement. Ph.D. Thesis, Polytechnic of Central London, London, UK, 1991. [Google Scholar]
- Gomes, R.B.; Andrade, M.A.S. Punching in Reinforced Concrete Flat Slabs with Holes. In Proceedings of the Developments in Computer Aided Design and Modeling for Structural Engenineering, Cambridge, UK, 28–30 August 1995; pp. 185–193. [Google Scholar]
- Guandalini, S.; Burdet, O.L.; Muttoni, A. Punching Tests of Slabs with Low Reinforcement Ratios. ACI Struct. J. 2009, 106, 87–95. [Google Scholar] [CrossRef] [Scilit]
- Souza, R.M. Punção Em Lajes Lisas de Concreto Armado Com Furos Adjacentes Ao Pilar e Transferência de Momento. Master’s Thesis, Universidade de Brasília, Brasilia, Brazil, 2008. Volume 1. [Google Scholar]
- Susanto Teng, H.K.; Cheong, K.L.; Kuang, J.Z.G. Punching Shear Strength of Slabs with Openings and Supported on Rectangular Columns. ACI Struct. J. 2004, 101, 678–687. [Google Scholar] [CrossRef] [Scilit]

Disclaimer/Publisher’s Note: The statements, opinions and data contained in all publications are solely those of the individual author(s) and contributor(s) and not of MDPI and/or the editor(s). MDPI and/or the editor(s) disclaim responsibility for any injury to people or property resulting from any ideas, methods, instructions or products referred to in the content. |
© 2026 by the authors. Licensee MDPI, Basel, Switzerland. This article is an open access article distributed under the terms and conditions of the Creative Commons Attribution (CC BY) license.