Article

Parameter-Efficient Adaptation of Generative-Foundation (Flux, Qwen) vs. Zero-Shot (Gemini, SAM3) Models for Aerial Image Segmentation

1
School of Architecture & Built Environment, Faculty of Engineering, Queensland University of Technology, Brisbane, QLD 4000, Australia
2
School of Electrical Engineering & Robotics, Faculty of Engineering, Queensland University of Technology, Brisbane, QLD 4000, Australia
3
College of Architecture & Design, Prince Sultan University, Riyadh 11586, Saudi Arabia
4
YBA Architects, Riyadh 11461, Saudi Arabia
*
Author to whom correspondence should be addressed.
Buildings 2026, 16(7), 1369; https://doi.org/10.3390/buildings16071369
Submission received: 10 February 2026 / Revised: 12 March 2026 / Accepted: 18 March 2026 / Published: 30 March 2026
(This article belongs to the Topic Application of Smart Technologies in Buildings)

Abstract

Accurate rooftop segmentation from aerial imagery is essential for large-scale urban analysis, including applications such as solar potential assessment and urban monitoring. However, it remains constrained by the high cost of dense annotation and the limited generalisation of supervised models across heterogeneous urban morphologies. This study investigates binary rooftop segmentation for fine-tuning large image-editing foundation models using parameter-efficient Low-Rank Adaptation (LoRA). Using parts of Brisbane metropolitan dataset (split 80/20 into 97 training and 24 testing tiles), three paradigms were evaluated under a unified protocol: zero-shot image-editing models (including Gemini 3 Pro), a segmentation-first baseline (Segment Anything Model 3, SAM3), and LoRA-adapted diffusion models (FLUX.1 Kontext, FLUX.2, and Qwen Image Edit 2509) fine-tuned each 250 steps up to 5000 steps. Evaluated under zero-shot conditions, the generative models demonstrated varying levels of boundary fidelity. The Gemini model achieved a strong zero-shot baseline with [IoU, Dice] scores of [85%, 91%], followed by the SAM3 baseline, which also achieved a stable [84%, 91%] but exhibited increased false negatives in visually complex scenes. The tested diffusion models (FLUX.1 Kontext, FLUX.2, and Qwen) showed more limited initial spatial overlap, scoring [45%, 55%], [67%, 78%], and [33%, 46%], respectively. Following LoRA adaptation, the FLUX and Qwen models showed substantial improvements, with their respective [IoU, Dice] metrics increasing to [89%, 94%], [82%, 90%], and [87%, 93%]. FLUX.1 Kontext achieved the strongest overall performance at step 4250, yielding a mean IoU of 89% (SD = 3.16%) and a pixel accuracy exceeding 96%. These results demonstrate that parameter-efficient fine-tuning, combined with rigorous evaluation under class-imbalanced conditions, can transform general-purpose generative models into competitive, scalable spatial analysis tools that match or exceed both dedicated segmentation baselines and strong zero-shot multimodal models.

1. Introduction

Accurate rooftop segmentation from high-resolution aerial imagery is a fundamental requirement for a wide range of urban-scale applications, including solar potential assessment, building stock analysis, and infrastructure monitoring [1,2,3]. Reliable rooftop delineation enables quantitative estimation of usable roof areas and supports downstream analyses that depend on precise building geometry. Despite substantial progress in semantic segmentation for remote sensing, achieving scalable and transferable rooftop extraction across heterogeneous urban environments remains a persistent challenge [2,4,5].
Most existing rooftop segmentation pipelines rely on supervised deep learning architectures trained on densely annotated datasets. While such models can achieve high accuracy on curated benchmarks, their practical deployment at the city scale is constrained by two key limitations. First, the generation of pixel-accurate rooftop annotations is labour-intensive and costly, particularly for large metropolitan areas [6]. Second, models trained on specific geographic regions or acquisition conditions often exhibit reduced robustness when applied to cities with differing architectural typologies, materials, or environmental characteristics [2]. Variations in roof geometry, vegetation occlusion, shadows, and imaging conditions frequently lead to performance degradation under domain shift.
Recent advances in large vision foundation models offer a potential alternative to conventional segmentation-first pipelines [7]. Promptable segmentation models have demonstrated strong zero-shot performance across diverse image domains, including remote sensing, by leveraging representations learned from large-scale pretraining. However, their conservative prediction behaviour often prioritises precision over completeness, resulting in missed rooftop structures in visually complex or occluded scenes. In parallel, large image-editing diffusion models encode rich semantic and structural priors and exhibit strong spatial coherence during image manipulation tasks [8]. Although these models are not explicitly designed for dense prediction, their latent representations suggest potential for geometric delineation when appropriately constrained. However, in [zero-shot settings, diffusion-based editing models typically lack the geometric discipline required for accurate rooftop segmentation, producing fragmented masks or confusion with spectrally similar urban surfaces [9,10].
A promising strategy for bridging this gap lies in parameter-efficient adaptation. Low-Rank Adaptation (LoRA) provides a practical route for adapting large pretrained models under constrained compute and limited labelled data [10]. Despite its growing use, the effectiveness of LoRA for adapting image-editing diffusion models to analytical remote-sensing tasks, such as rooftop segmentation, has not yet been systematically evaluated.
This study investigates whether binary rooftop segmentation can be reformulated as a constrained image-editing task using parameter-efficient adaptation. Using a curated city-scale dataset covering the Brisbane metropolitan area, we evaluate three modelling paradigms under a unified experimental protocol: (1) zero-shot image-editing diffusion models, including the segmentation-first foundation model baseline, and (2) LoRA-adapted diffusion models. Quantitative and qualitative comparisons are conducted using standard segmentation metrics to assess spatial accuracy, error characteristics, and performance stability across heterogeneous urban scenes.
The main contributions of this work are threefold. First, we provide a systematic comparison between segmentation-first and editing-based foundation models for rooftop extraction under consistent evaluation conditions. Second, we demonstrate that parameter-efficient LoRA adaptation can effectively transform general-purpose image-editing diffusion models into competitive rooftop segmentation tools, achieving accuracy comparable to or exceeding dedicated segmentation baselines. Third, we introduce and analyse a polarity-aware evaluation protocol that reveals metric inflation effects in class-imbalanced urban imagery, enabling more reliable assessment of segmentation performance. Together, these contributions highlight a scalable alternative to conventional rooftop segmentation pipelines and open new directions for applying generative-foundation models to urban remote-sensing analysis.

2. Related Work

Rooftop segmentation from aerial imagery has been widely investigated within the remote sensing community, with methods evolving from rule-based image processing techniques to supervised deep learning and, more recently, to foundation model-based frameworks. This section synthesises related work across three interconnected strands that motivate the present study: supervised rooftop and building extraction methods and their benchmarking practice, the emergence of foundation and image-editing models for dense prediction tasks, and parameter-efficient adaptation strategies that support scalable model specialisation under constrained supervision.

2.1. Conventional and Machine Learning Approaches for Roof Segmentation

Early rooftop extraction methods relied on rule-based image processing and photogrammetric techniques that combined spectral thresholding, edge detection, and geometric heuristics to distinguish buildings from surrounding surfaces. While effective under controlled conditions, these approaches were sensitive to illumination changes, roof material variability, shadows, and vegetation occlusion, and their dependence on handcrafted features limited scalability across heterogeneous urban environments [5,11]. The introduction of deep learning marked a substantial shift, enabling end-to-end learning of spatial representations directly from aerial imagery through convolutional encoder–decoder architectures. By leveraging multiscale context, these methods improved rooftop delineation across a wide range of urban morphologies, and subsequent refinements further enhanced performance in complex scenes [12,13].
Progress in supervised rooftop and building segmentation has been accelerated by public benchmark datasets that support systematic evaluation under standardised protocols. Datasets such as ISPRS Potsdam and Vaihingen, the Inria Aerial Image Labelling dataset, SpaceNet, and DeepGlobe have enabled comparative assessment of convolutional segmentation pipelines and hybrid multi-scale frameworks under controlled acquisition settings [14,15,16,17].
However, reliable deployment at a metropolitan scale remains challenging due to the intrinsic heterogeneity of urban form and the prevalence of visual ambiguity. Rooftops vary substantially in geometry, size, orientation, and material composition within and across cities, ranging from small, irregular residential roofs to large, reflective industrial structures, which increases the likelihood of fragmented or incomplete segmentation in diverse neighbourhood contexts [4,18]. In dense urban scenes, vegetation cover, cast shadows, rooftop-mounted equipment, and closely spaced buildings further obscure roof boundaries and introduce confusion with spectrally similar surfaces such as paved areas and courtyards, increasing both false negatives and false positives [18]. Imaging variability introduces additional constraints on transferability. Differences in spatial resolution, sensor characteristics, seasonal effects, and illumination can alter rooftop appearance and context, contributing to performance degradation when models trained under specific acquisition conditions are applied to new regions or imagery sources [11]. These transfer limitations are compounded by the reliance of supervised approaches on large volumes of pixel-accurate annotations. Producing city-scale labels is time- and labour-intensive and often inconsistent at roof boundaries and complex building interfaces, which can introduce noise and complicate reproducible benchmarking across studies. These limitations have motivated growing interest in approaches that reduce dependence on dense supervision while improving generalisation across heterogeneous urban contexts.

2.2. Foundation and Editing Models in Computer Vision

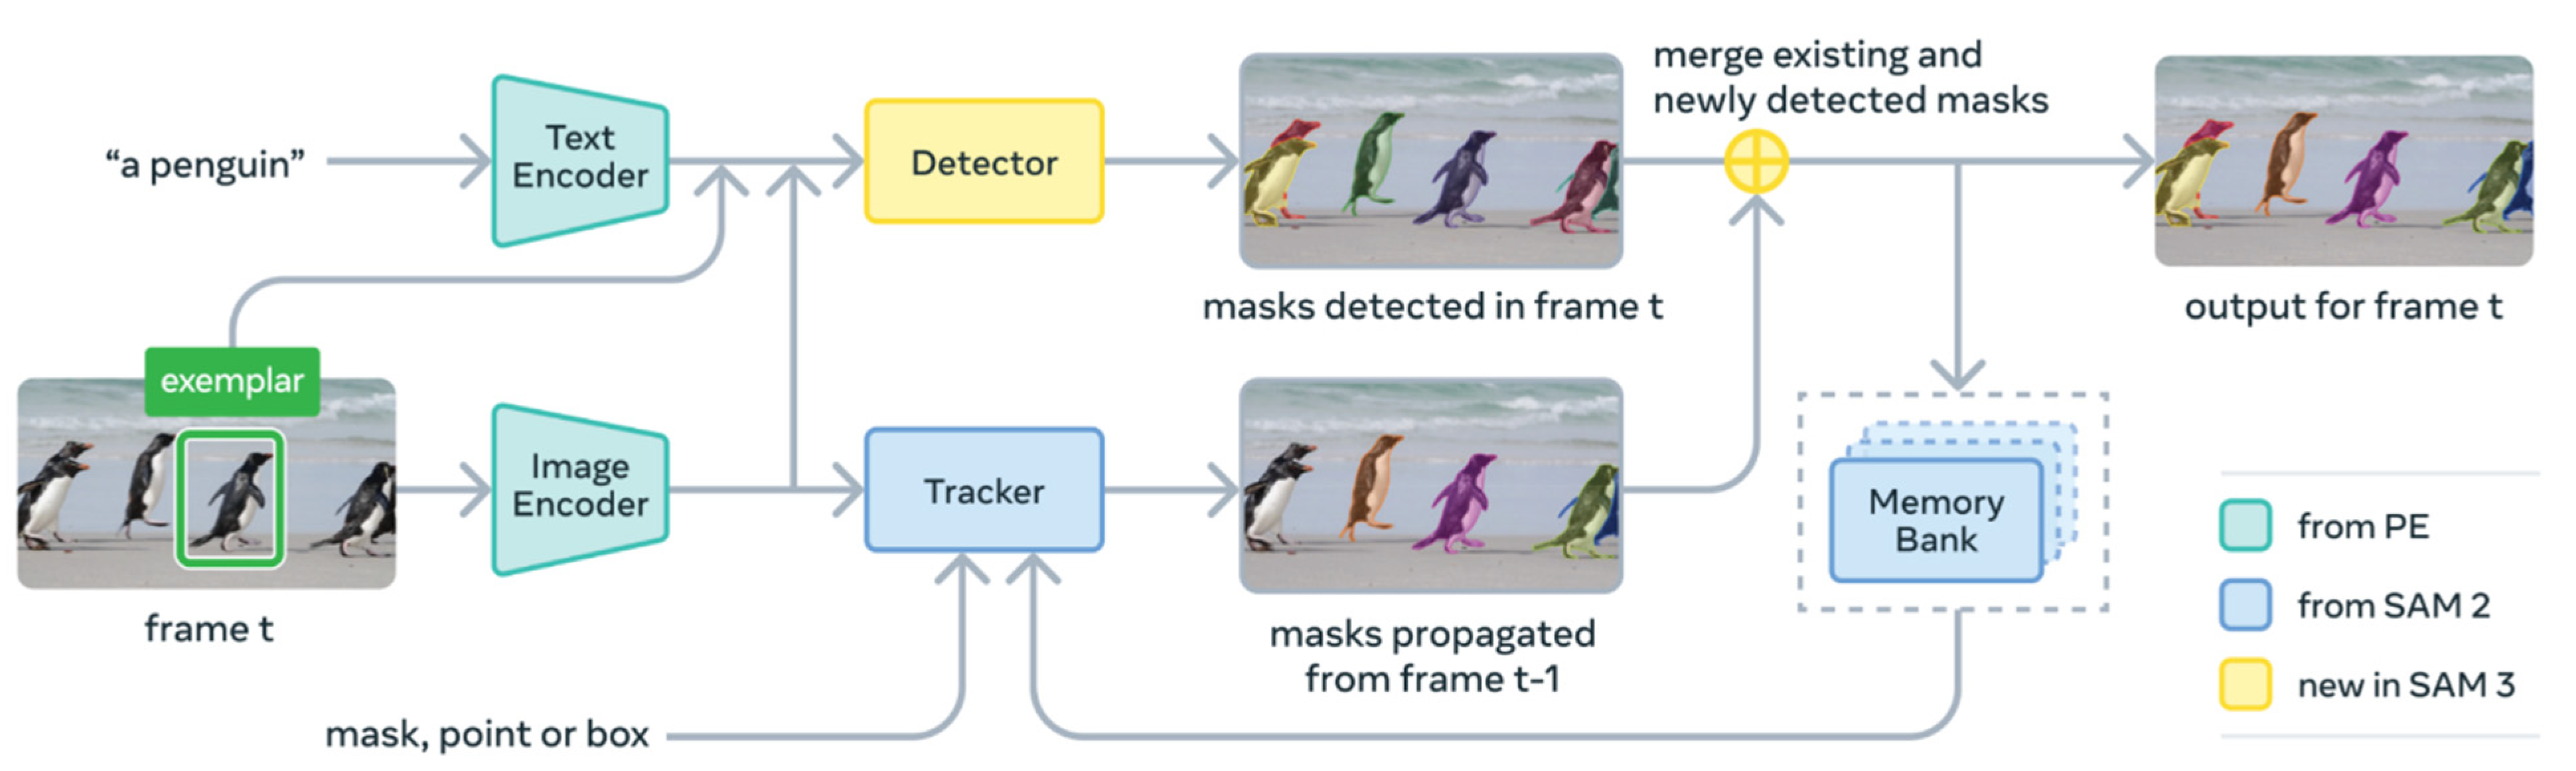
Foundation models pretrained on large-scale image or image–text corpora have recently emerged as a new paradigm in computer vision, enabling transfer across tasks and domains with limited task-specific retraining. In segmentation, promptable foundation models have demonstrated strong generalisation capacity by leveraging pretrained semantic and structural priors, making them attractive candidates for remote-sensing workflows where dense labels are costly. The Segment Anything Model (SAM) exemplifies this direction by introducing a prompt-driven segmentation formulation that supports zero-shot transfer across image distributions through interactive prompts such as points, boxes, or masks, Figure 1 [19,20,21,22,23,24,25]. SAM has therefore been increasingly adopted as a reference baseline for building and rooftop extraction, particularly in settings where prompt engineering or lightweight preprocessing is available [19]. However, SAM-style predictions remain sensitive to prompt formulation and can exhibit conservative mask completion in cluttered urban scenes, where shadows, vegetation occlusion, and tightly spaced structures complicate boundary inference [4,26]. These behaviours indicate that, while promptable segmentation provides a strong transferable prior, additional task conditioning or adaptation is often required to achieve pixel-accurate rooftop delineation at scale [24,27].
Beyond segmentation-first architectures, large image-editing models have demonstrated strong capabilities in preserving spatial coherence while performing context-aware transformations. Although such models are primarily trained for generative editing rather than deterministic labelling, their latent representations encode fine-grained texture and geometry that can, in principle, be redirected toward dense prediction when appropriate constraints are introduced [4]. Recent work has explicitly explored diffusion models as priors for generalisable dense prediction, highlighting both the promise of pretrained generative priors and the inherent mismatch between stochastic generation objectives and deterministic per-pixel tasks [28]. In rooftop segmentation, this mismatch can manifest as fragmented masks, boundary drift, or confusion with spectrally similar urban surfaces in zero-shot configurations, reflecting the absence of an explicit objective enforcing geometric fidelity at roof edges.
Recent multimodal editing models provide further motivation for investigating editing-based paradigms under task-specific adaptation. FLUX.1 Kontext, released as a suite of flow-matching image generation and editing models, is designed to preserve spatial consistency during in-context editing, suggesting a potentially favourable inductive bias for structure-preserving transformations [29,30]. Similarly, Qwen Image Edit 2509 extends a large-scale multimodal backbone using a dual-encoding design that separately represents semantic control and appearance reconstruction through parallel vision–language and VAE pathways, supporting localised edits while maintaining global visual fidelity [31]. However, despite their strong editing consistency, these models are not explicitly optimised for boundary-accurate binary segmentation, and their generative objectives do not guarantee mask completeness or strict pixel-level adherence to rooftop geometry. This motivates the integration of parameter-efficient adaptation strategies to preserve pretrained priors while enforcing the deterministic geometric constraints required for rooftop extraction.

2.3. Parameter-Efficient Fine-Tuning Techniques

Adapting large pretrained models to domain-specific remote-sensing tasks presents practical challenges related to computational cost, memory requirements, and data availability. Parameter-efficient fine-tuning addresses these constraints by enabling task adaptation without updating the full set of backbone parameters, thereby reducing training overhead while preserving pretrained priors. Among these methods, Low-Rank Adaptation (LoRA) has emerged as an effective strategy for large-scale models, particularly those relying on attention-style projection layers [9,10,32,33].
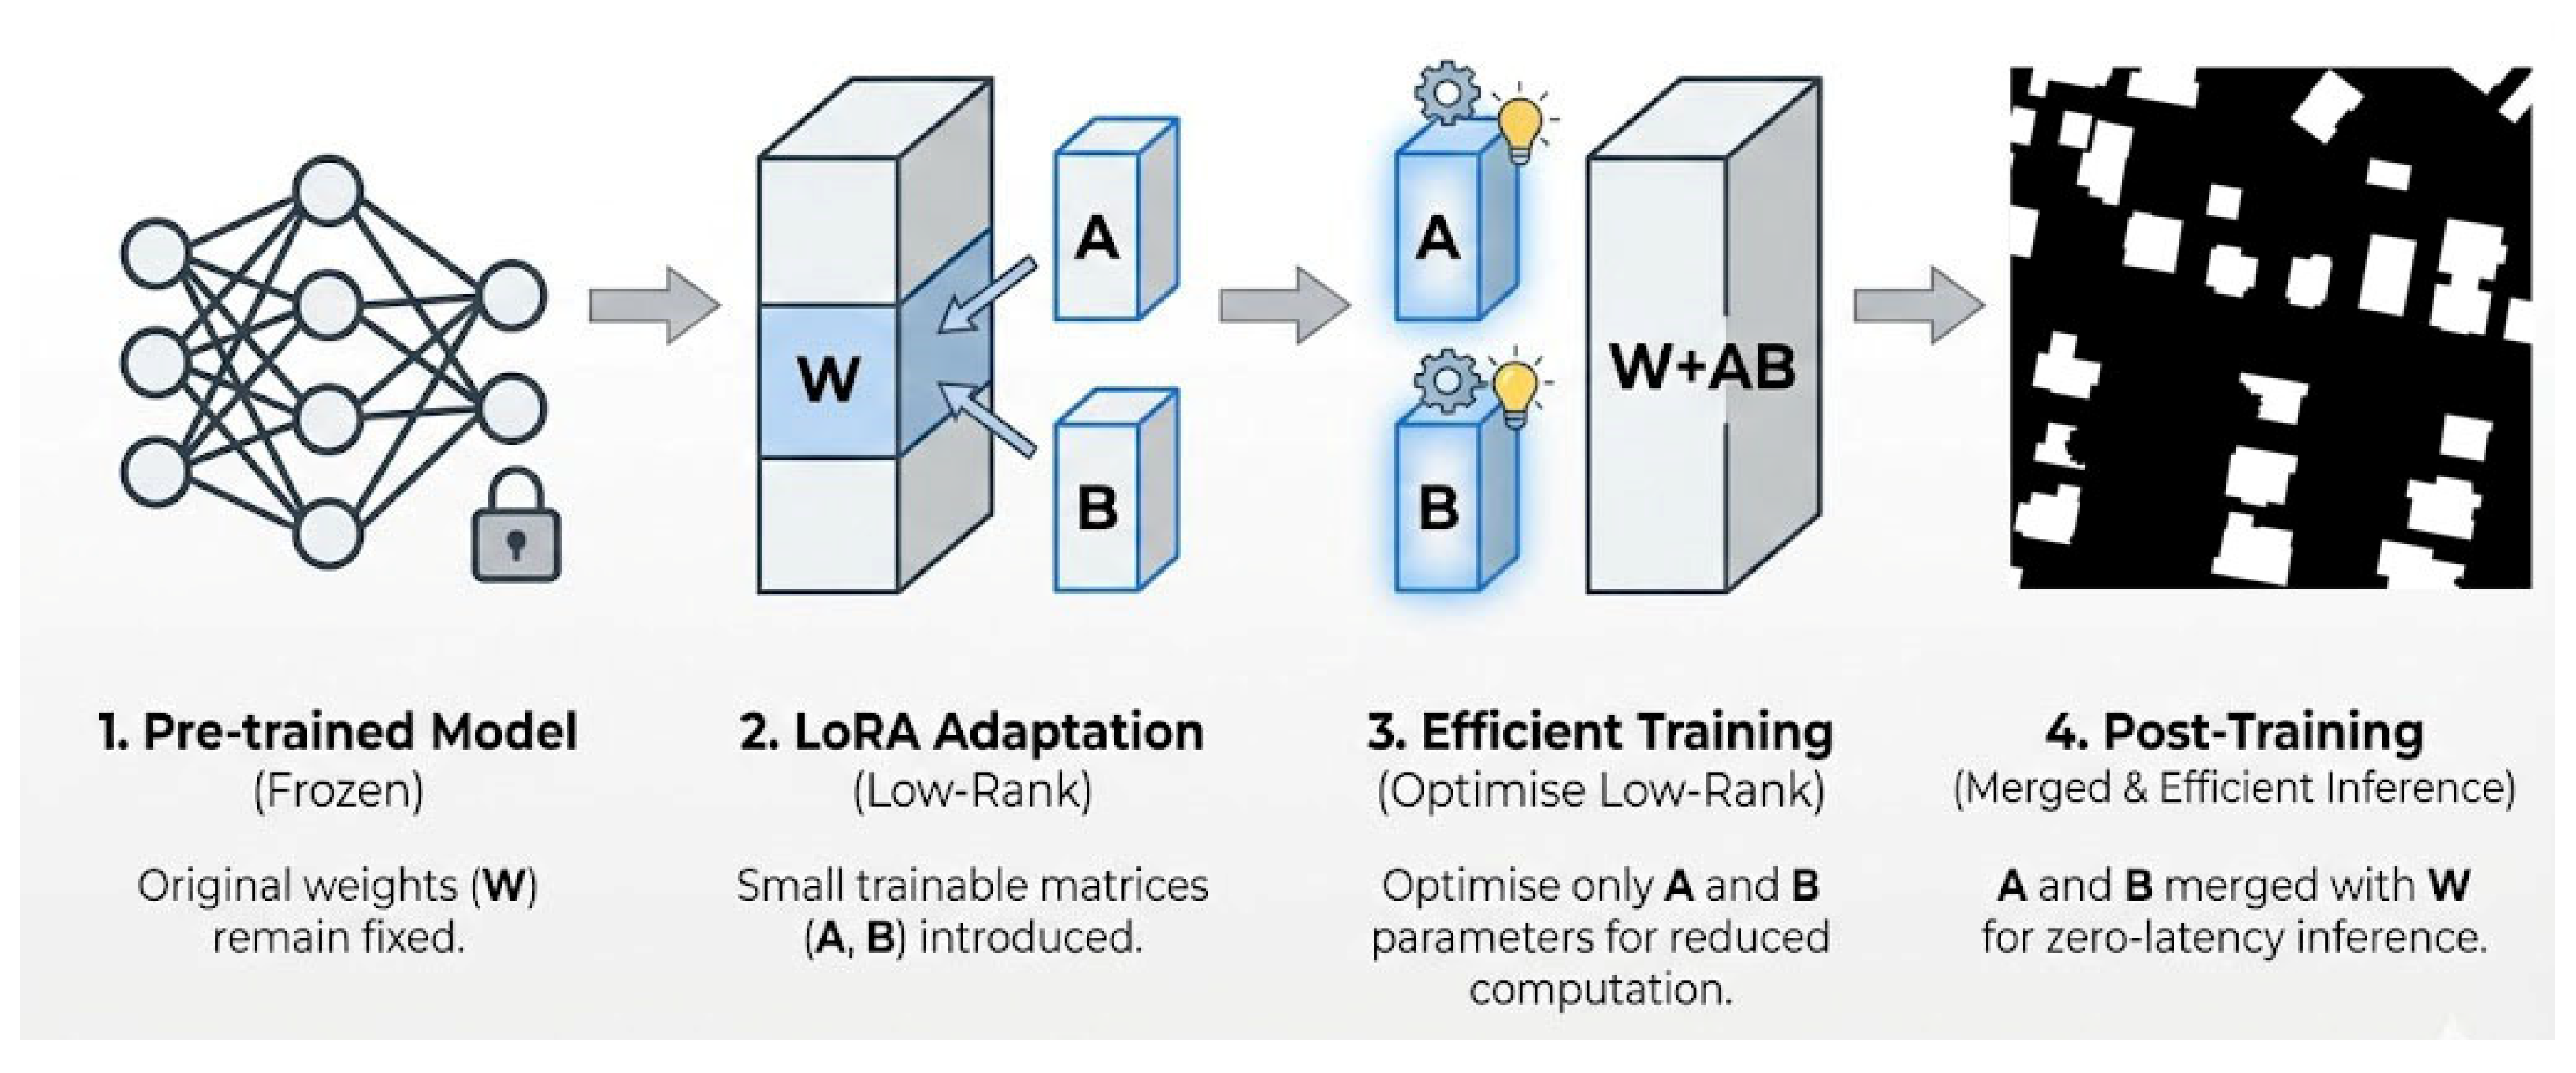
LoRA introduces additional trainable low-rank matrices that are injected into selected weight updates (commonly within attention or projection modules), while the original pretrained weights remain frozen. By constraining optimisation to these lightweight low-rank components, LoRA substantially reduces the number of trainable parameters and associated memory footprint compared with full fine-tuning, making it suitable for scenarios with limited annotated data and constrained compute. This design has enabled broad adoption in large language models and generative image models, and it has increasingly been explored for vision adaptation settings where the target task differs from the pretraining objective [9].
In remote sensing, parameter-efficient adaptation is particularly relevant because labelled datasets are often expensive to generate at pixel-level precision and exhibit strong geographic heterogeneity. Foundation and editing models pretrained on large multimodal corpora encode transferable semantic and structural priors, yet their default objectives do not explicitly enforce the deterministic boundary fidelity required for rooftop segmentation, as shown in Figure 2 [9,10,33,34]. Therefore, lightweight adaptation provides a practical pathway to redirect pretrained priors toward binary rooftop delineation without the prohibitive cost of retraining full backbones [10]. Accordingly, this study positions conventional supervised segmentation approaches as benchmarking references, while evaluating whether promptable segmentation and editing-based foundation models can be specialised for rooftop extraction through parameter-efficient fine-tuning.

3. Methodology

A structured methodological framework was developed to evaluate rooftop segmentation using foundation models under realistic data and computational constraints. The workflow is designed to enable a controlled and reproducible comparison between the models using a unified dataset, inference configuration, and evaluation protocol.

3.1. Dataset Development

The dataset development process was executed in sequential phases to ensure both morphological representativeness and scalability. The workflow produced two primary components: a large-scale unlabelled aerial imagery corpus for potential large-scale inference, and a high-fidelity ground-truth subset for model training and validation.

3.1.1. Primary Aerial-Imagery Dataset

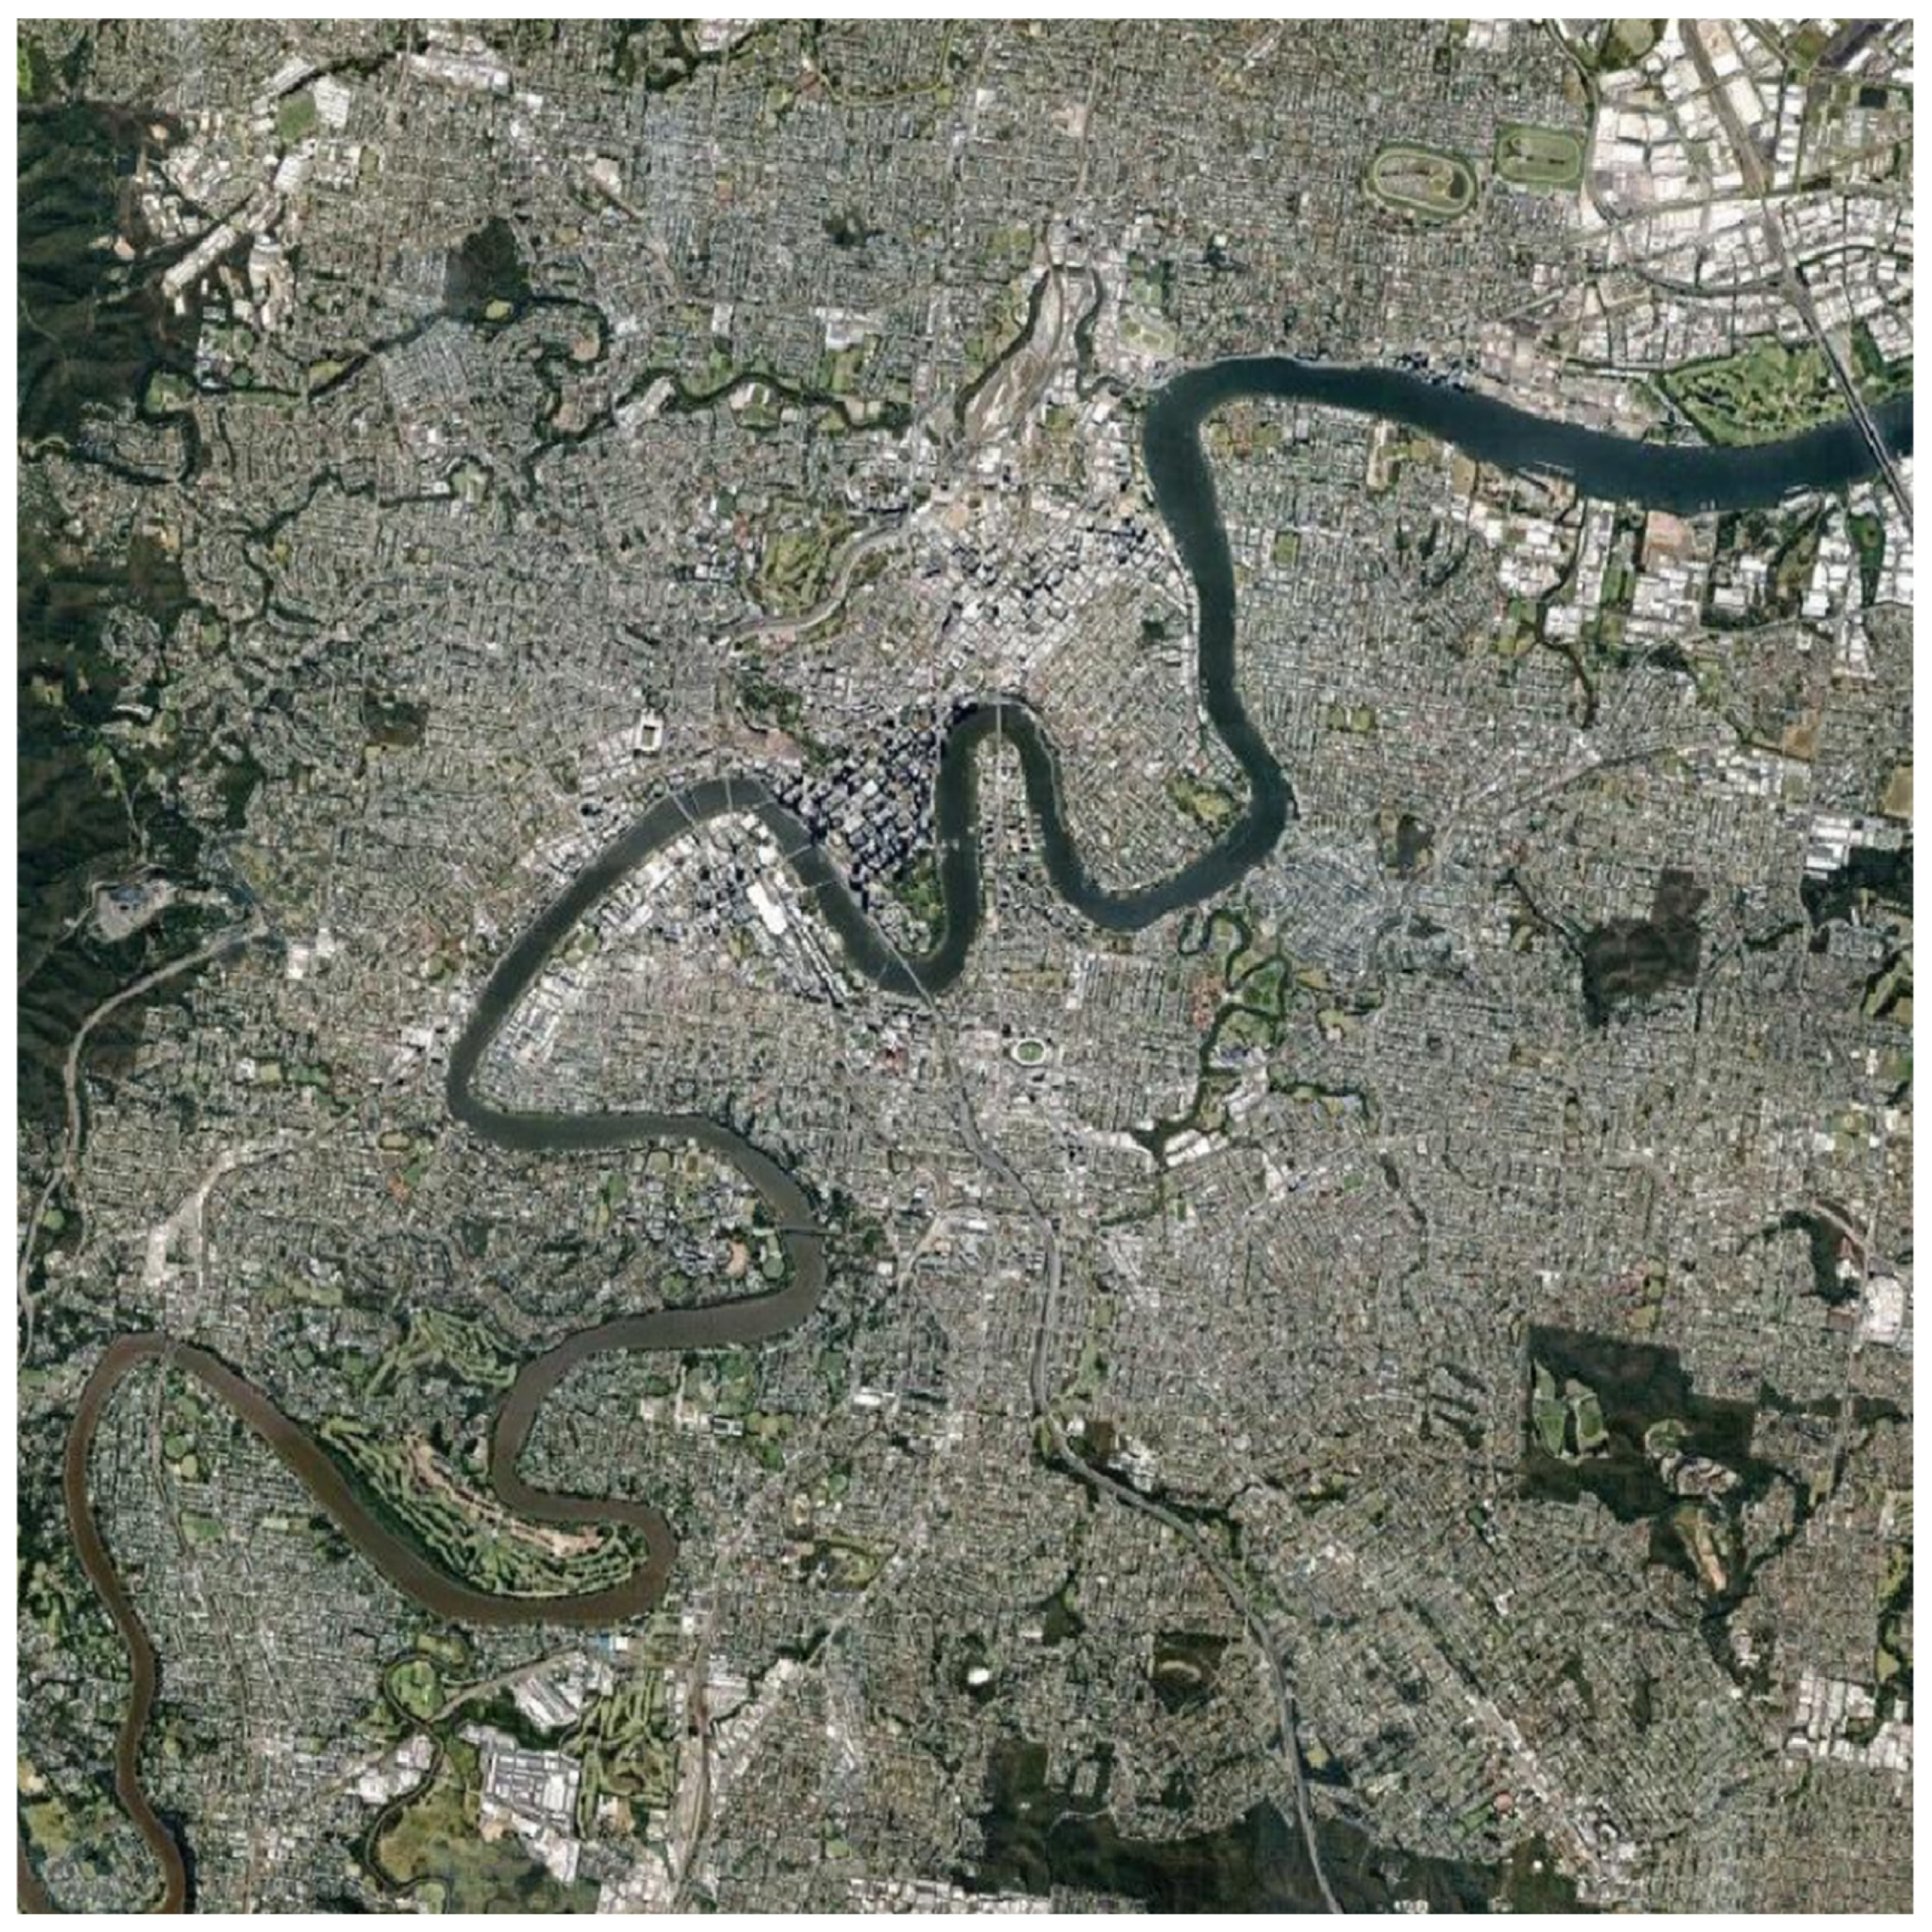
The study area covered the Brisbane metropolitan region, Queensland, Australia, as shown in Figure 3. To ensure the dataset captured the heterogeneity of urban forms, sampling was stratified across diverse urban fabrics, ranging from the high-density commercial structures of the Central Business District (CBD) to the low-density residential zones of East Brisbane. This strategy ensured the inclusion of varied roof typologies (e.g., hip, gable, flat) and a wide spectral variance in roofing materials (e.g., terra-cotta tile, concrete, grey metal), which is critical for evaluating model robustness against chromatic bias [11,35].
Aerial imagery was collected from Google Maps using the QTiles plug-in in QGIS 3.32, configured to access XYZ tile services at zoom level 18. The resulting dataset comprises 9797 image tiles stored in PNG format at 1024 × 1024 px. The dataset exhibits variation in scene complexity, with building instance density ranging from 1 to 50 structures per tile, depending on the urbanisation level. Ground-truth building masks were generated using a combined workflow to ensure consistency and boundary accuracy.

3.1.2. Ground-Truth Dataset Generation

To generate pixel-accurate binary masks, a ground-truth dataset was developed to provide accurate binary rooftop masks corresponding to a representative subset of the aerial imagery. Prior research in semantic segmentation indicates that segmentation performance is influenced by the degree of foreground–background separability, where a higher visual contrast between object and background is generally associated with reduced false positives and improved boundary delineation in deep learning models. This consideration informed the annotation strategy adopted in this study, particularly in ensuring clear and consistent rooftop–background separation in the generated masks [36].
A structured annotation protocol was implemented to ensure geometric fidelity and consistent rooftop–background separation across heterogeneous urban scenes. A representative subset of 121 aerial image tiles was selected from the Brisbane metropolitan dataset, capturing diverse suburban morphologies, complex roof geometries, variable shadow intensities, and vegetation occlusions.
To balance annotation efficiency with boundary precision, a semi-automated initialisation process was employed to delineate preliminary rooftop regions. However, all masks were subsequently subjected to full manual refinement and verification at native spatial resolution (1024 × 1024 px). Preliminary masks were manually refined at native resolution (1024 × 1024 px) in Adobe Photoshop 2024 to ensure precise alignment with rooftop boundaries and the removal of false positives from vegetation and shadows.
Manual correction was performed systematically for every tile. Missing rooftop segments were traced using polygonal selection tools, while false activations over vegetation, paved surfaces, shadows, or non-roof planar elements were removed. Boundary refinement ensured crisp edge delineation, topological closure, and strict binary encoding consistency across all rooftop instances. Attention was given to adjacent roof structures, roof overhangs, and partially occluded geometries to minimise fragmentation and boundary ambiguity.
All corrected masks were exported in PNG files while preserving the original file naming convention and directory hierarchy to maintain strict pairing with the corresponding aerial imagery, and the masks were subsequently subjected to full manual refinement and verification. A second verification pass was conducted to confirm rooftop completeness, boundary alignment, and the removal of residual artefacts. A single 80/20 train test split was employed, corresponding to 97 training samples and 24 test samples that cover a mixture of detached houses, townhouses, and denser street blocks. The final datasets for each of the workflow phases are summarised in Table 1.

3.1.3. Mask Polarity and Preprocessing Considerations

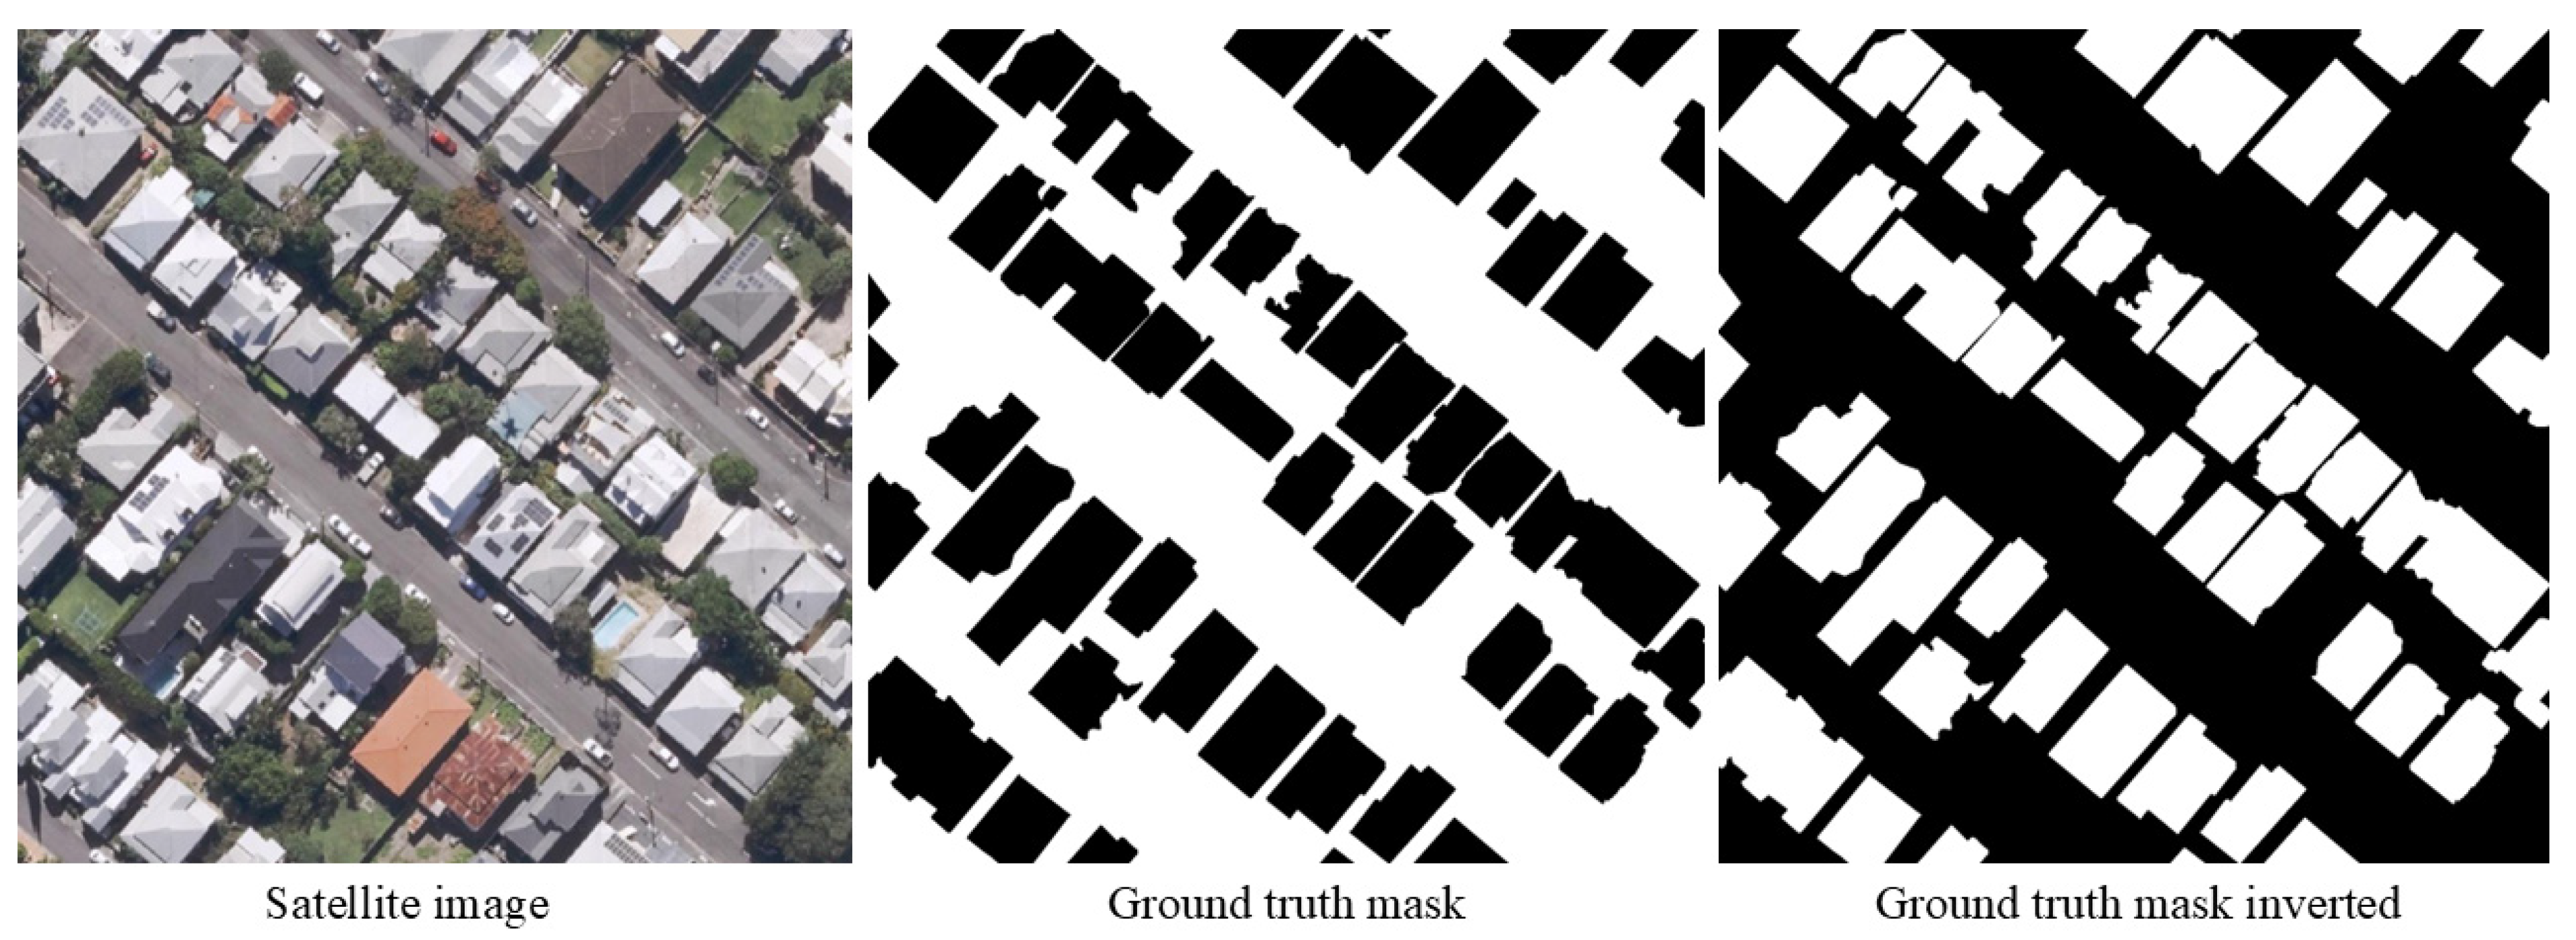
Following the generation of the initial ground-truth masks, preliminary preprocessing experiments were conducted during the dataset generation stage to assess the effect of mask polarity on mask production using diffusion-based image-editing models. These experiments indicated that the behaviour of FLUX.1 Kontext during mask generation is sensitive to the foreground–background encoding used in binary representations. In particular, when conventional binary masks with white foregrounds and black backgrounds were employed, the generated outputs exhibited reduced geometric consistency and less stable rooftop delineation.
Based on these observations, rooftop masks were inverted prior to fine-tuning, such that rooftops were encoded as black (pixel value 0) and the background as white (pixel value 255). This polarity configuration was applied consistently during the training of all diffusion-based models evaluated in this study. For evaluation and comparison purposes, predicted masks were subsequently inverted back to the standard convention, with rooftops treated as the positive class.

3.2. Editing-Based Models and LoRA Adaptation

To benchmark performance across different architectural paradigms, we configured three distinct pipelines: zero-shot image-editing foundation models, the segmentation-first baseline (SAM3), and LoRA-adapted image-editing models.

3.2.1. Zero-Shot Editing-Based Models

Foundation Models
We evaluated the intrinsic segmentation capabilities of pre-trained foundation models without task-specific weight updates. To guide these generative models toward discriminative tasks, we employed a strict prompting strategy. Each model was prompted with the instruction: “Binary segmentation mask: rooftops = solid black, all other areas = solid white; no shadows, vegetation, cars, or other artefacts.” This baseline established the extent to which geometric fidelity is inherent in pre-trained priors versus acquired through adaptation. To assess the impact of architecture on segmentation stability, we evaluated four models from three distinct model families:
  • FLUX.1 Kontext: A rectified flow transformer model known for high semantic adherence, serving as the primary baseline for stable LoRA adaptation (accessed 18 December 2025) [29].
  • FLUX.2: A newer iteration of the FLUX family, selected to investigate whether aggressive optimisation for aesthetic generation compromises geometric stability in discriminative tasks (accessed 17 December 2025) [37].
  • Qwen Image Edit 2509: A diffusion-based image-editing model included as a representative editing-based baseline within the comparative evaluation framework (accessed 17 December 2025) [31].
  • Gemini 3 Pro image preview: A multimodal large language model (LMM) utilised as a zero-shot baseline to benchmark the performance of fine-tuned adapters against state-of-the-art promptable systems (accessed 31 December 2025).
Segmentation-First Baseline
The Segment Anything Model 3 (SAM3) was adopted as the primary segmentation-first baseline, representing the state-of-the-art in promptable vision models (accessed 18 December 2025). The model was integrated into a ComfyUI-based workflow, utilising the official public checkpoint. The model was evaluated as a frozen segmentation-first baseline within the comparative framework. Unlike the diffusion-based models, those were adapted using Low-Rank Adaptation (LoRA); SAM3 was used in its publicly released configuration without parameter updates. Although recent studies have demonstrated the feasibility of adapting SAM-style models using lightweight adapters or decoupled decoders, fine-tuning the full multimodal vision-language backbone of SAM3 remains computationally demanding and falls outside the parameter-efficient scope of this study [26,38,39,40,41]. Accordingly, SAM3 was evaluated using zero-shot and geometric prompt configurations to provide a consistent reference for off-the-shelf segmentation performance. This setup enables a controlled comparison between standard segmentation-first inference and the effects of parameter-efficient adaptation applied to image-editing diffusion models.
Since SAM3 is designed for standard positive-class segmentation, the “Black Building” dataset used for diffusion models was inverted during the inference pipeline (converting buildings to White/1) to ensure compatibility with SAM’s detection logic. Each Brisbane tile from the 24 testing images (1024 × 1024 pixels) was loaded by a ComfyUI image input node and passed to the SAM3 model loader, which retrieves the selected SAM3 checkpoint and prepares it for GPU inference. The loaded model and image tensor were then forwarded to the SAM3 segmentation node, configured to produce rooftop masks in a positive-only segmentation mode. The main configuration parameters of this node are summarised in Table 2.
The segmentation node outputs a combined full-image mask together with internal SEGS structures and optional visual overlays. In this workflow, the combined mask was converted to a single-channel image and saved as a 24-bit PNG, with rooftops encoded as foreground and non-rooftop areas encoded as background. Simple post-processing options provided by the node were enabled to suppress very small regions and to fill internal holes, which yields more coherent rooftop masks for downstream analysis. The exported SAM3 masks preserve the original tile resolution and naming convention and were used as input to the validation pipeline described in Section 5.5. SAM3 achieved inference in approximately 30 s per image.

3.2.2. LoRA Fine-Tuning Configuration

To enable task-specific adaptation of large diffusion models for rooftop segmentation, a Low-Rank Adaptation (LoRA) strategy was adopted. LoRA was used as described in Section 2.3, updating only lightweight adapter parameters while keeping the backbone frozen.
Three diffusion backbones were adapted for fine-tuning in this study: FLUX Kontext, FLUX.2, and Qwen Image Edit 2509. A consistent rank configuration was used across all models to maintain methodological consistency, as shown in Table 3. All models were trained using an identical hyperparameter configuration, using the same rooftop dataset and input resolutions (Training Ground truth dataset). Model checkpoints were saved at regular intervals during training to preserve intermediate states for subsequent analysis, as summarised in Table 4. Computational overhead for the 5000-step optimisation and subsequent testing varied significantly across the evaluated architectures. Utilising the NVIDIA RTX PRO 6000 hardware, Core GPU (96 GB GDDR7), utilising the Ostris AI-Toolkit v1.2. The complete fine-tuning and validation cycle for FLUX.1 Kontext required 4 h and 17 min. The Qwen Image Edit pipeline demanded 6 h and 6 min, while FLUX.2 required a substantially higher temporal investment of 16 h and 24 min for the same optimisation routine. These differences reflect the varying architectural complexities and parameter densities of the respective backbones.
The LoRA-enhanced model was evaluated to determine its effectiveness in generating binary rooftop segmentation masks. Evaluation was conducted across three resolution buckets used during training, which were introduced to promote multiscale model robustness during training away from the fixed zoom level of 18, where the original dataset was collected. The predicted binary masks were then evaluated against the ground-truth test data.
The trained LoRA was imported into the ComfyUI environment for model testing, where each generated LoRA (the twenty adapted models stored in safetensors format) was integrated into the model’s workflow to perform segmentation. The pipeline consists of three stages: (1) loading the pretrained backbone, text encoder, VAE, and all LoRA adapters; (2) importing the validation image set and preprocessing it through the FLUX Kontext image-scaling module; and (3) applying prompt-based conditioning to guide the diffusion model toward binary rooftop mask generation. The prompt used was the same as used previously for FLUX, “Generate a binary segmentation mask: rooftops = solid black, all other areas = solid white. Do not add shadows, trees, cars, or extra details. Only rooftops as black polygons”. The workflow outputs segmentation masks in PNG format, with rooftops rendered as solid black polygons and the background as white. Twenty LoRA adapters were obtained by saving checkpoints every 250 optimisation steps, from step 250 to step 5000. All adapters share the same architecture (rank 32 for linear layers and 16 for convolution layers) and were trained on the same rooftop dataset; they differ only in the training step at which the weights were saved.

3.3. Validation Metrics and Evaluation Protocol

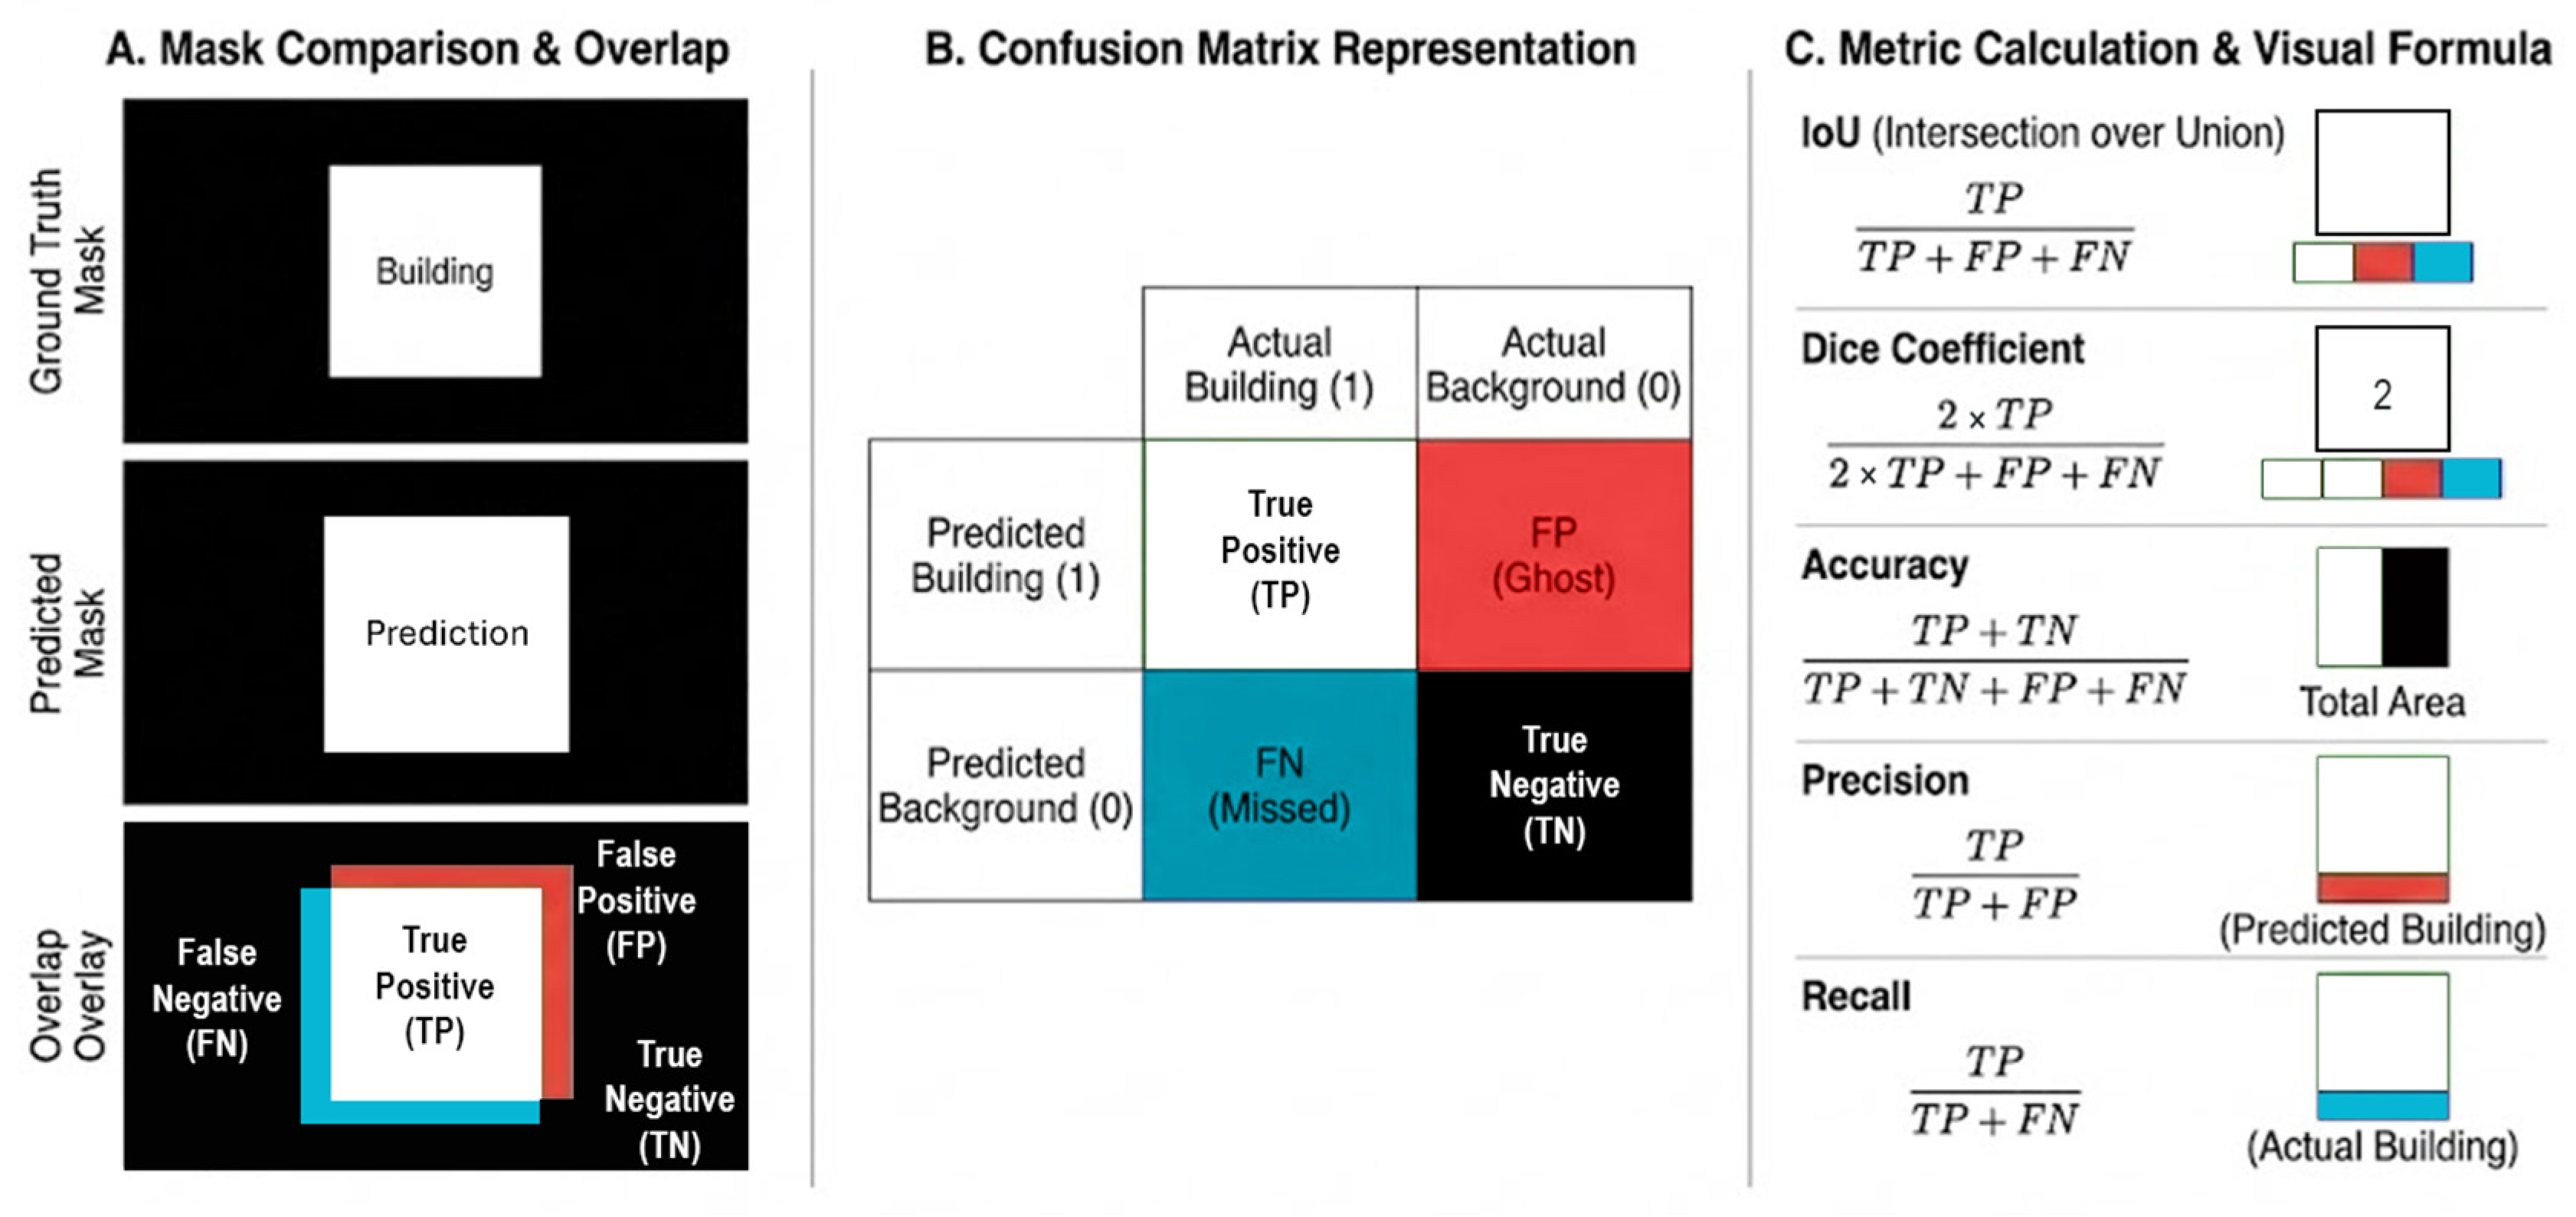
A quantitative evaluation was conducted on the annotated Brisbane rooftop validation subset. For each model, predicted masks were spatially aligned with the corresponding ground-truth annotations before metric computation. To mitigate metric inflation caused by class imbalance in urban scenes, a polarity-aware protocol was adopted. Rooftop masks were inverted (rooftops as black) during fine-tuning to improve diffusion stability, then reverted for evaluation to maintain positive-class consistency with the SAM3 baseline, as described in Section 3.1.3. Specifically, predicted masks were inverted before metric computation so that rooftops were treated as the positive class, matching the convention used by the SAM3 segmentation-first baseline, as shown in Figure 4. This standardisation ensures that Intersection over Union (IoU) and Dice Coefficient values reflect rooftop overlap rather than background agreement.
Evaluation metrics were computed exclusively on the rooftop class. This protocol reduces metric inflation associated with background dominance and provides a consistent basis for cross-model comparison under class-imbalanced conditions. The resulting evaluation framework enables direct and fair assessment of segmentation performance across zero-shot, fine-tuned, and segmentation-first models.
The primary accuracy metric, the Intersection over Union (IoU), also known as the Jaccard index, measures the overlap between the predicted segmentation and the ground truth and is commonly used in building footprint extraction and land cover segmentation benchmarks [42]. In addition to IoU, we also consider pixel-wise precision, which calculates the number of actual roof pixels predicted from all the roof pixels the model claimed to find [43]. Recall finds how many roof pixels the model found out of the total number of actual roof pixels [44]. The Dice Coefficient (F1-score) is similar to IoU, but gives more weight to true positives and is less sensitive to background size than accuracy [45]. The F1 score is the harmonic mean of precision and recall. The pixel accuracy is defined as the proportion of correctly classified pixels over the entire image, including both rooftop and non-rooftop classes [6]. False Positive Rate (FPR) and False Negative Rate (FNR) quantify complementary types of classification errors. Whereas the False Positive Rate (FPR) measures the proportion of background pixels that are incorrectly classified as rooftop [46,47], and the False Negative Rate (FNR) measures the proportion of rooftop pixels that are incorrectly classified as background [48]. Lastly, the Mean Absolute Error (MAE), which quantifies the average absolute difference between the predicted mask and the ground truth mask on a per-pixel basis [45]. It indicates the proportion of misclassified pixels in the whole image.
I o U = T P T P + F P + F N
P r e c i s i o n = T P T P + F P
R e c a l l = T P T P + F N
D i c e = 2 T P 2 T P + F P + F N
A c c u r a c y = T P + T N T P + T N + F P + F N
M A E = F P + F N T P + T N + F P + F N
F P R = F P T N + F P
F N R = F N F N + T P
In the above definitions, TP represents rooftop pixels correctly predicted as rooftop, TN represents the number of correctly predicted background pixels, FP represents background pixels incorrectly predicted as rooftop, and FN denotes rooftop pixels incorrectly predicted as background [49]. To evaluate the generalisation robustness of the fine-tuned architectures, we reported the sample standard deviation across the testing ensemble. In accordance with algorithmic stability principles, the standard deviation (SD) serves as a quantitative measure of the model’s performance consistency across varying urban topographies. This dual-metric approach (mean, SD) ensures that the reported results reflect the model’s reliable operational performance rather than an isolated peak accuracy, as shown in Figure 5.

4. Results

Performance was quantified across the testing dataset representing diverse urban morphologies. Utilising the standardised protocol detailed in Section 3.3, the analysis provides a comparative assessment of intrinsic zero-shot capabilities, the segmentation-first SAM3 baseline, and the performance gains attained through parameter-efficient LoRA adaptation. Representative segmentation outcomes are displayed in Figure 6; The full dataset and experimental results are publicly available on Zenodo (https://doi.org/10.5281/zenodo.18571111) [50].

4.1. Zero-Shot Performance of Editing-Based Models

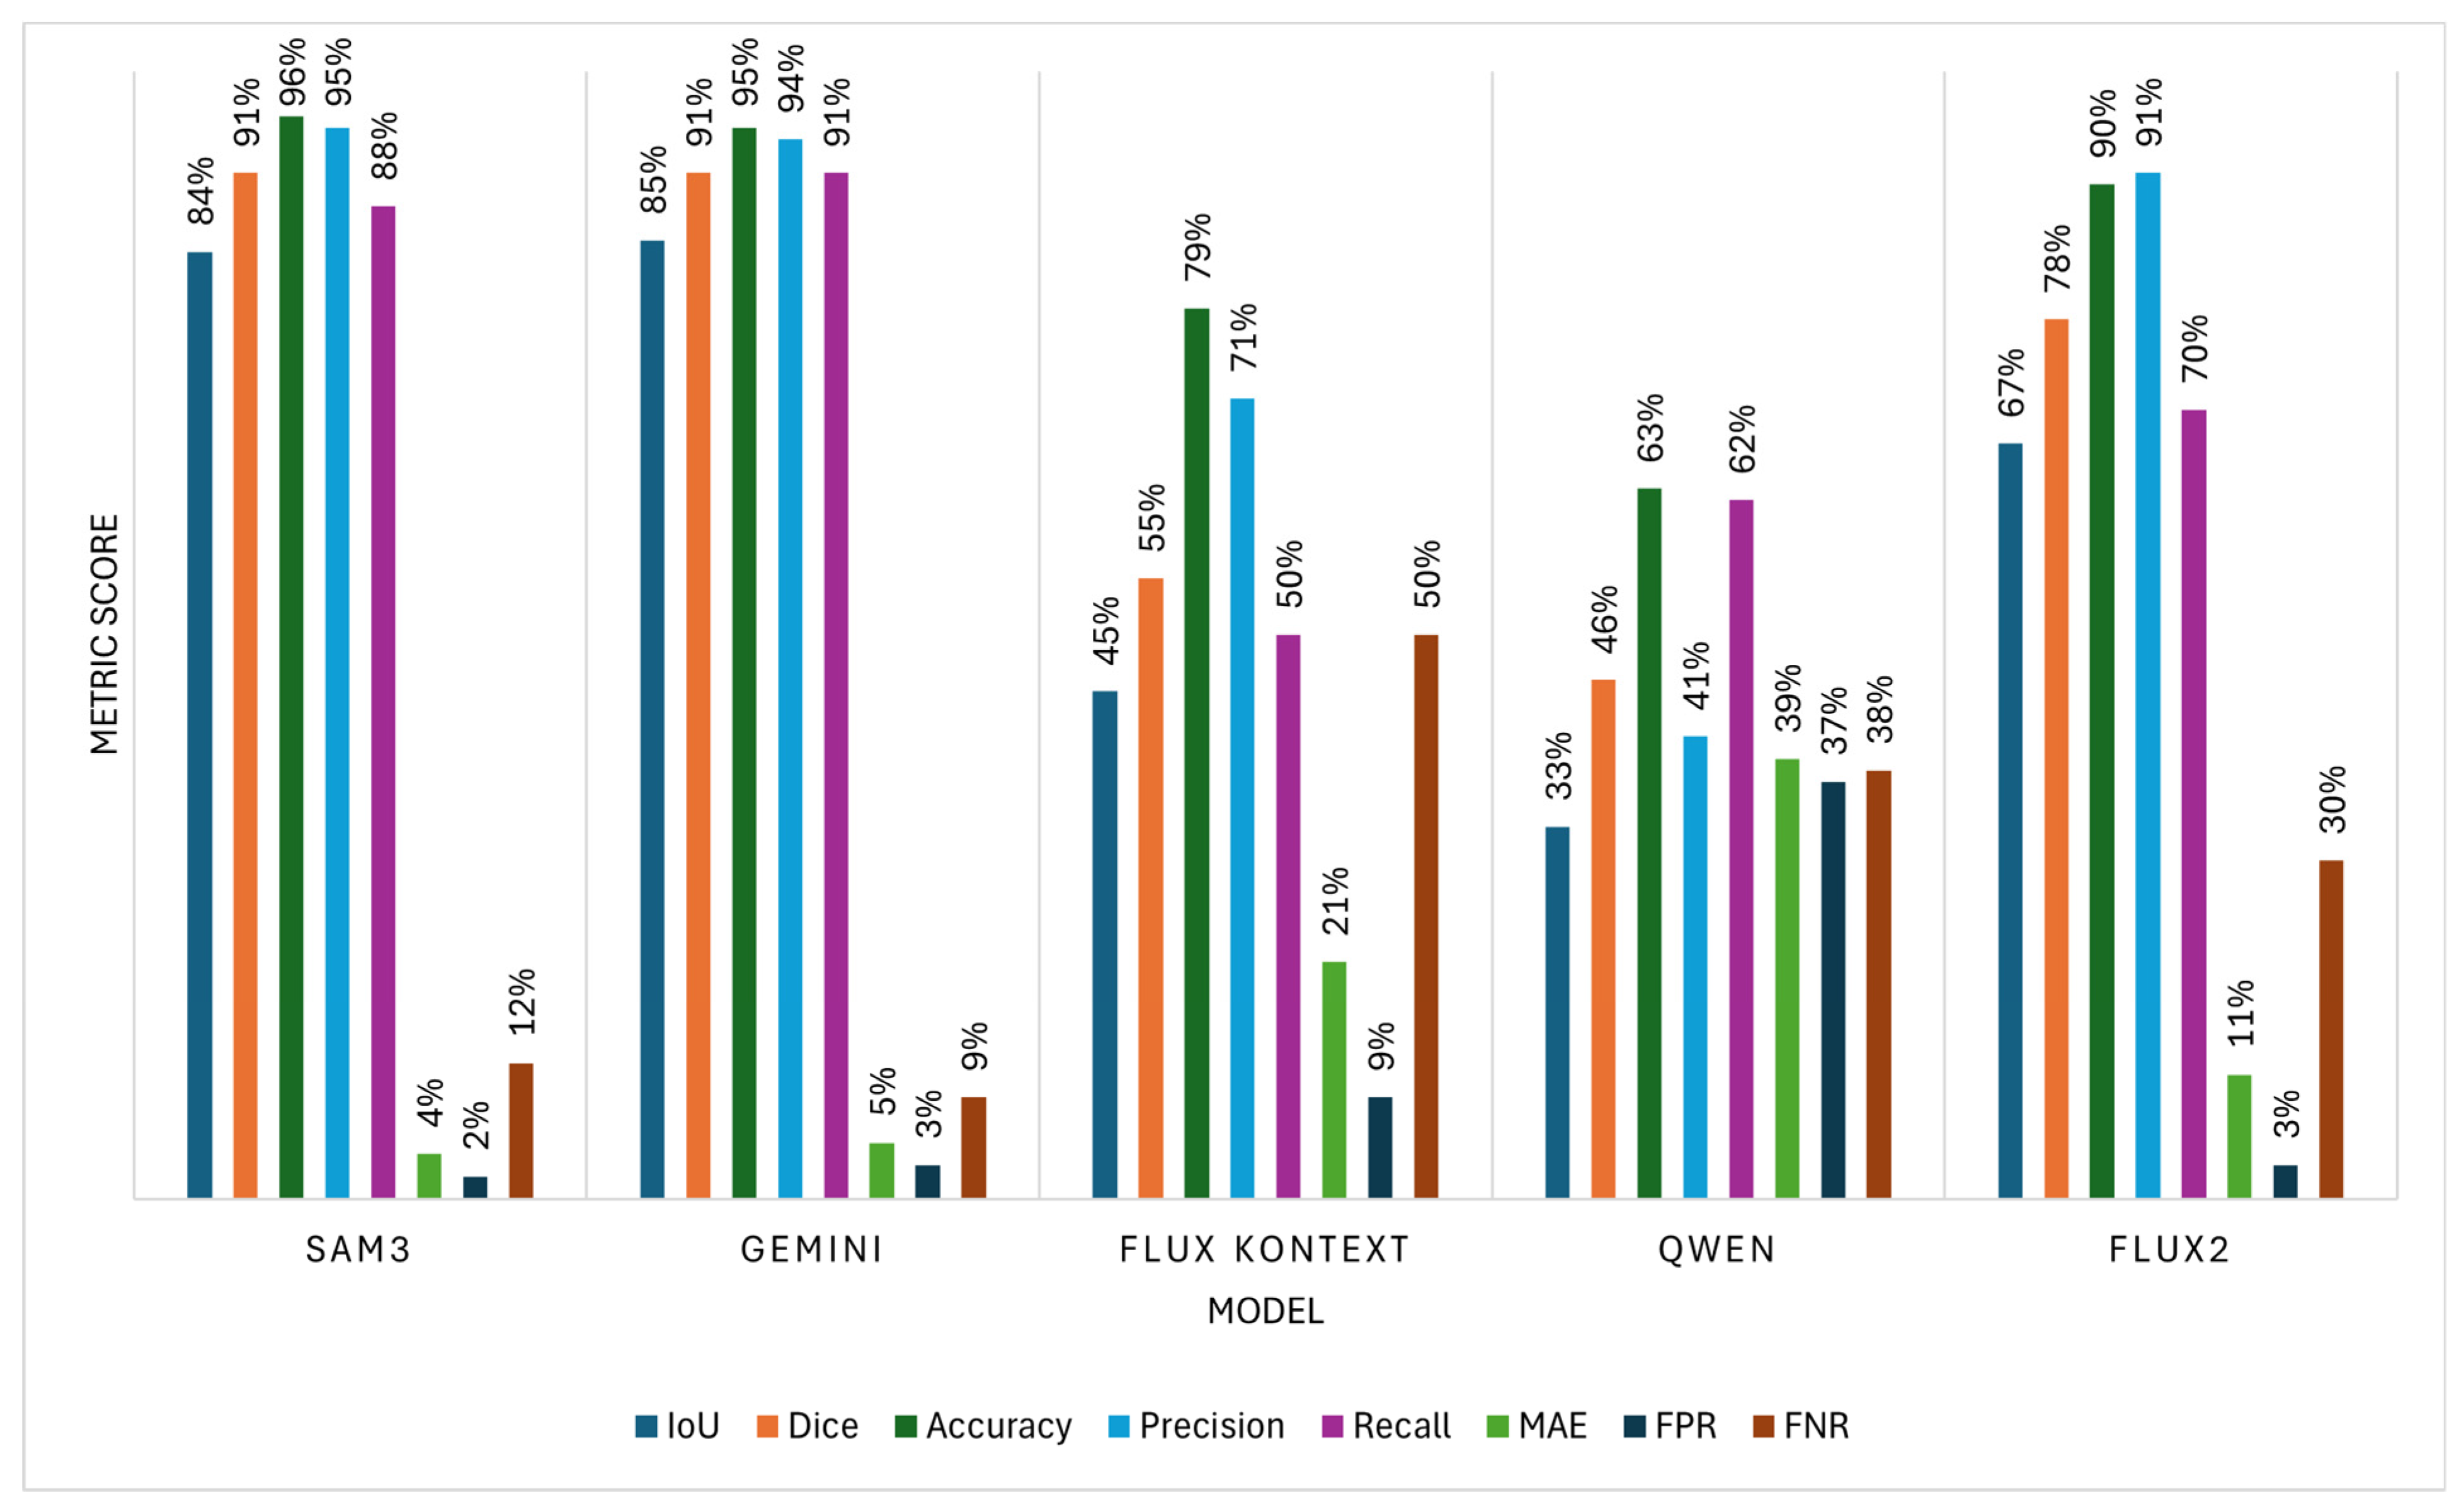
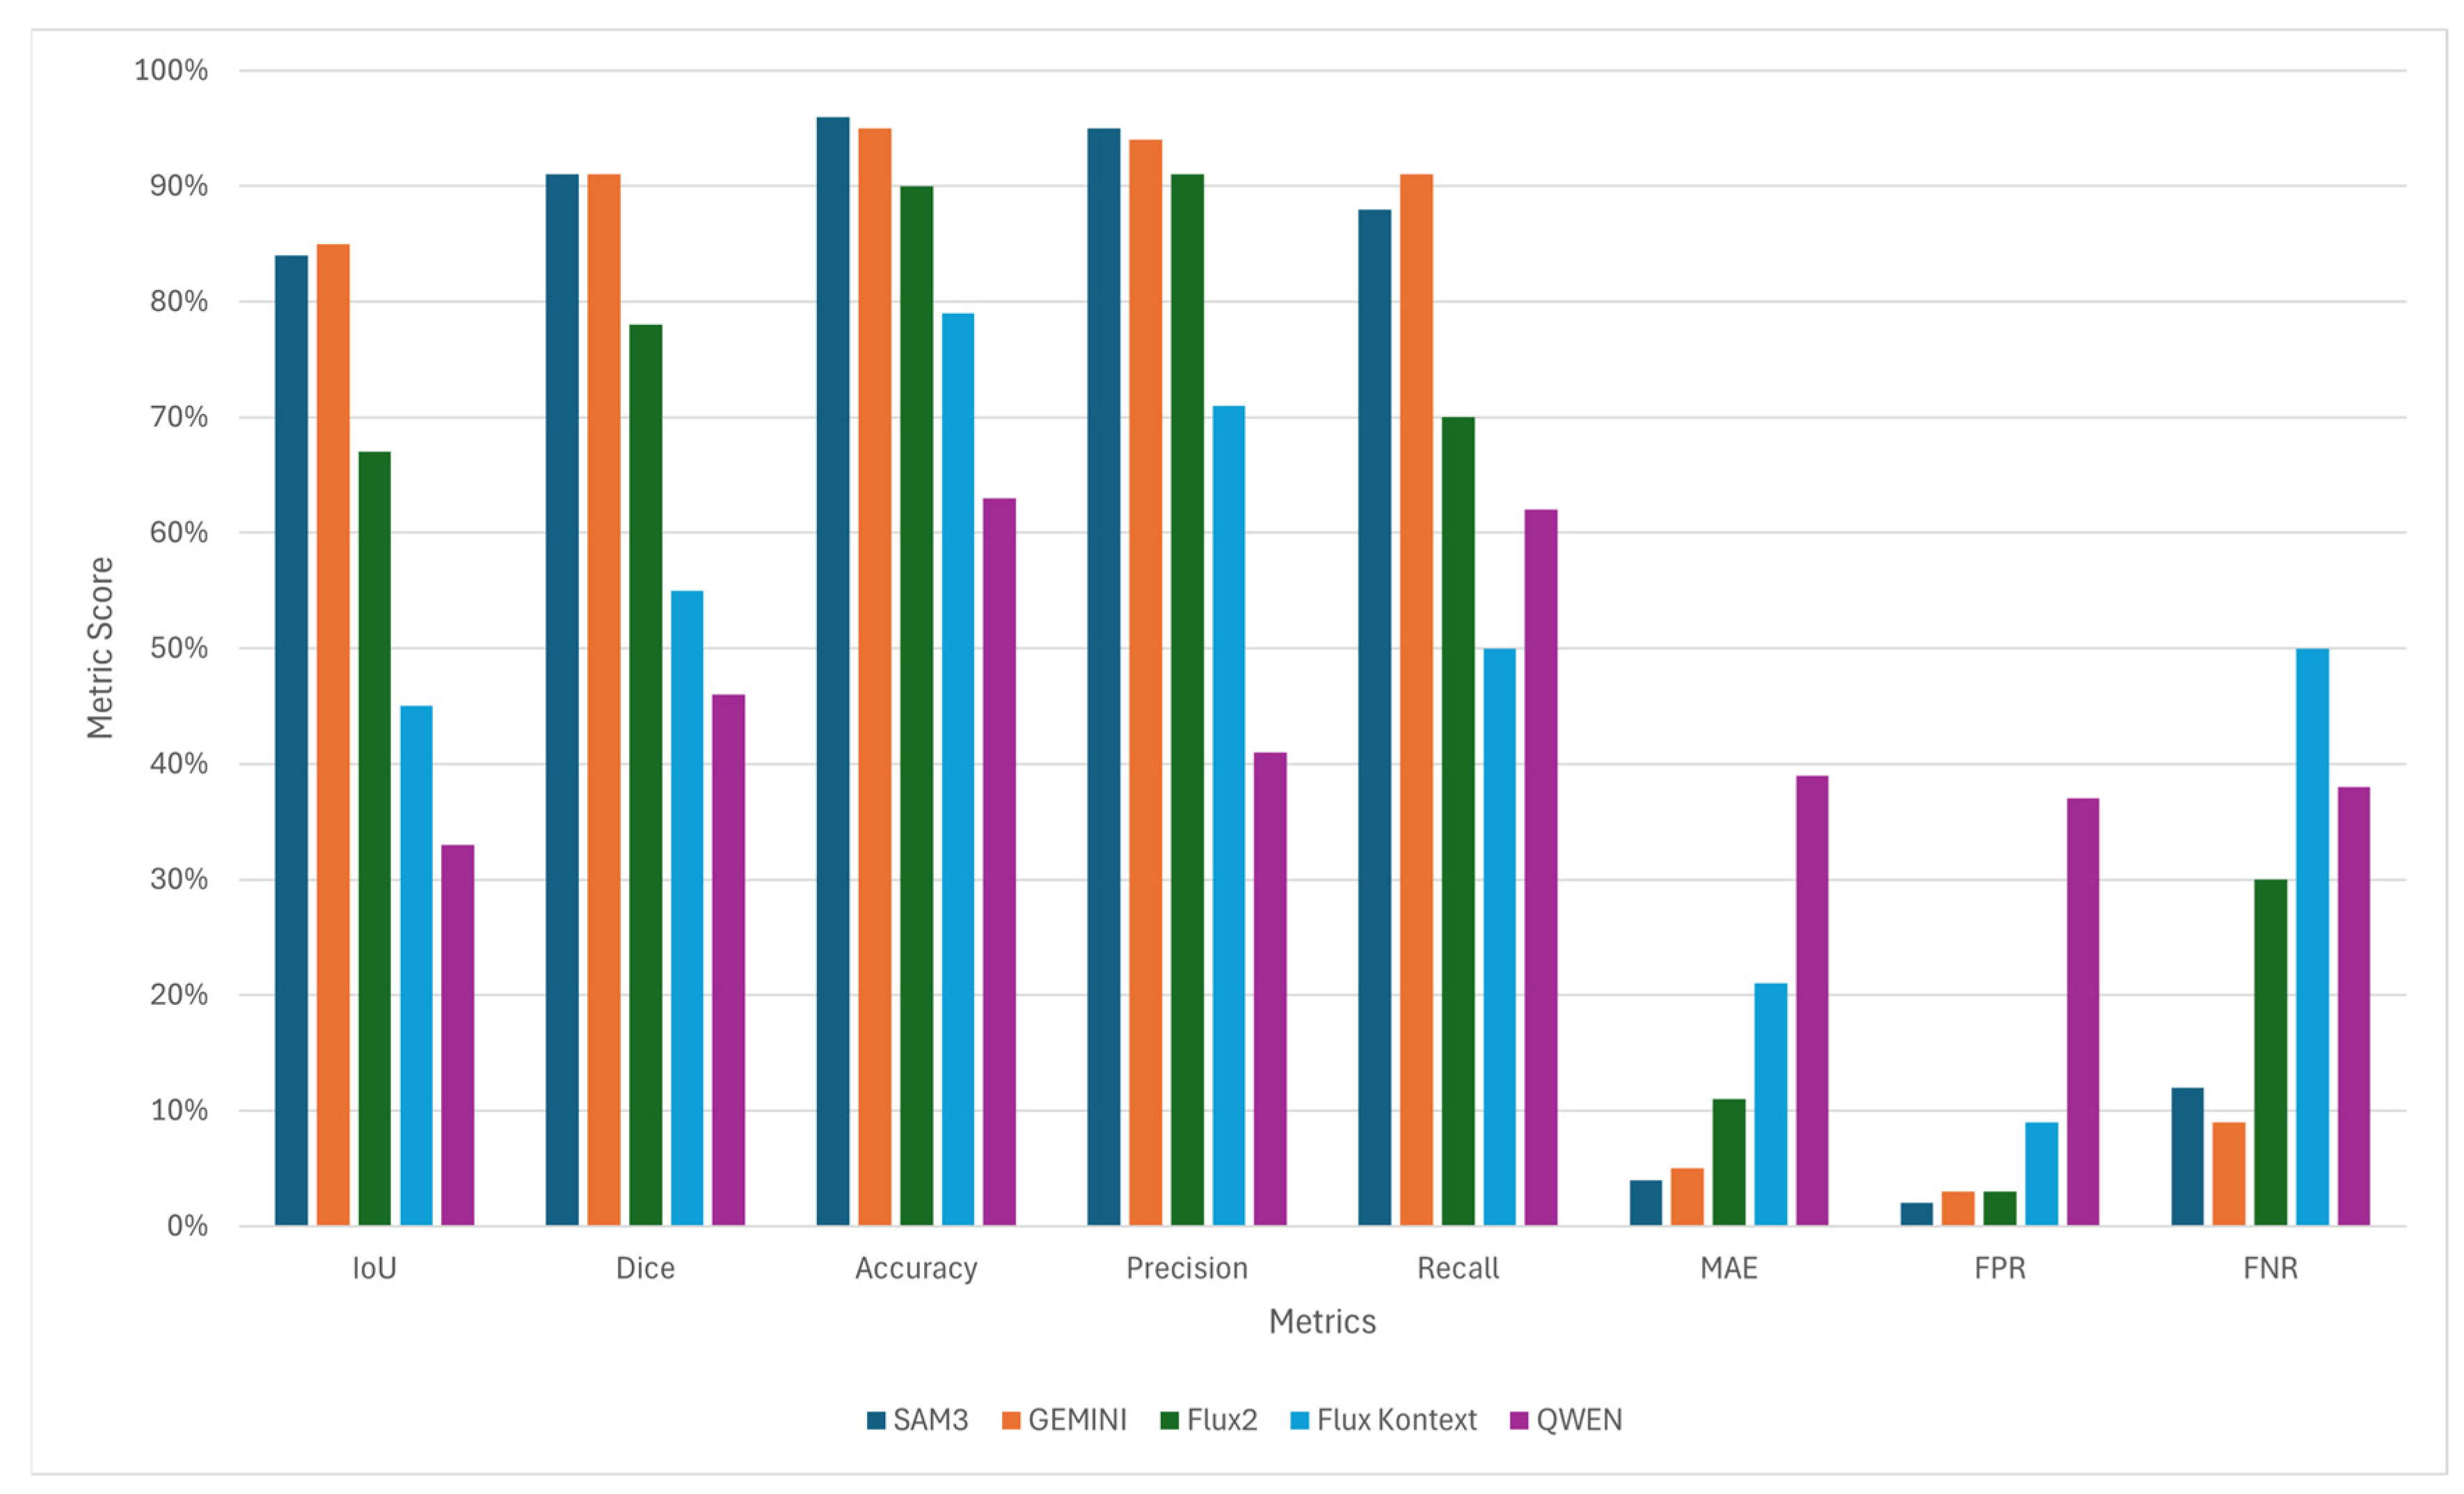
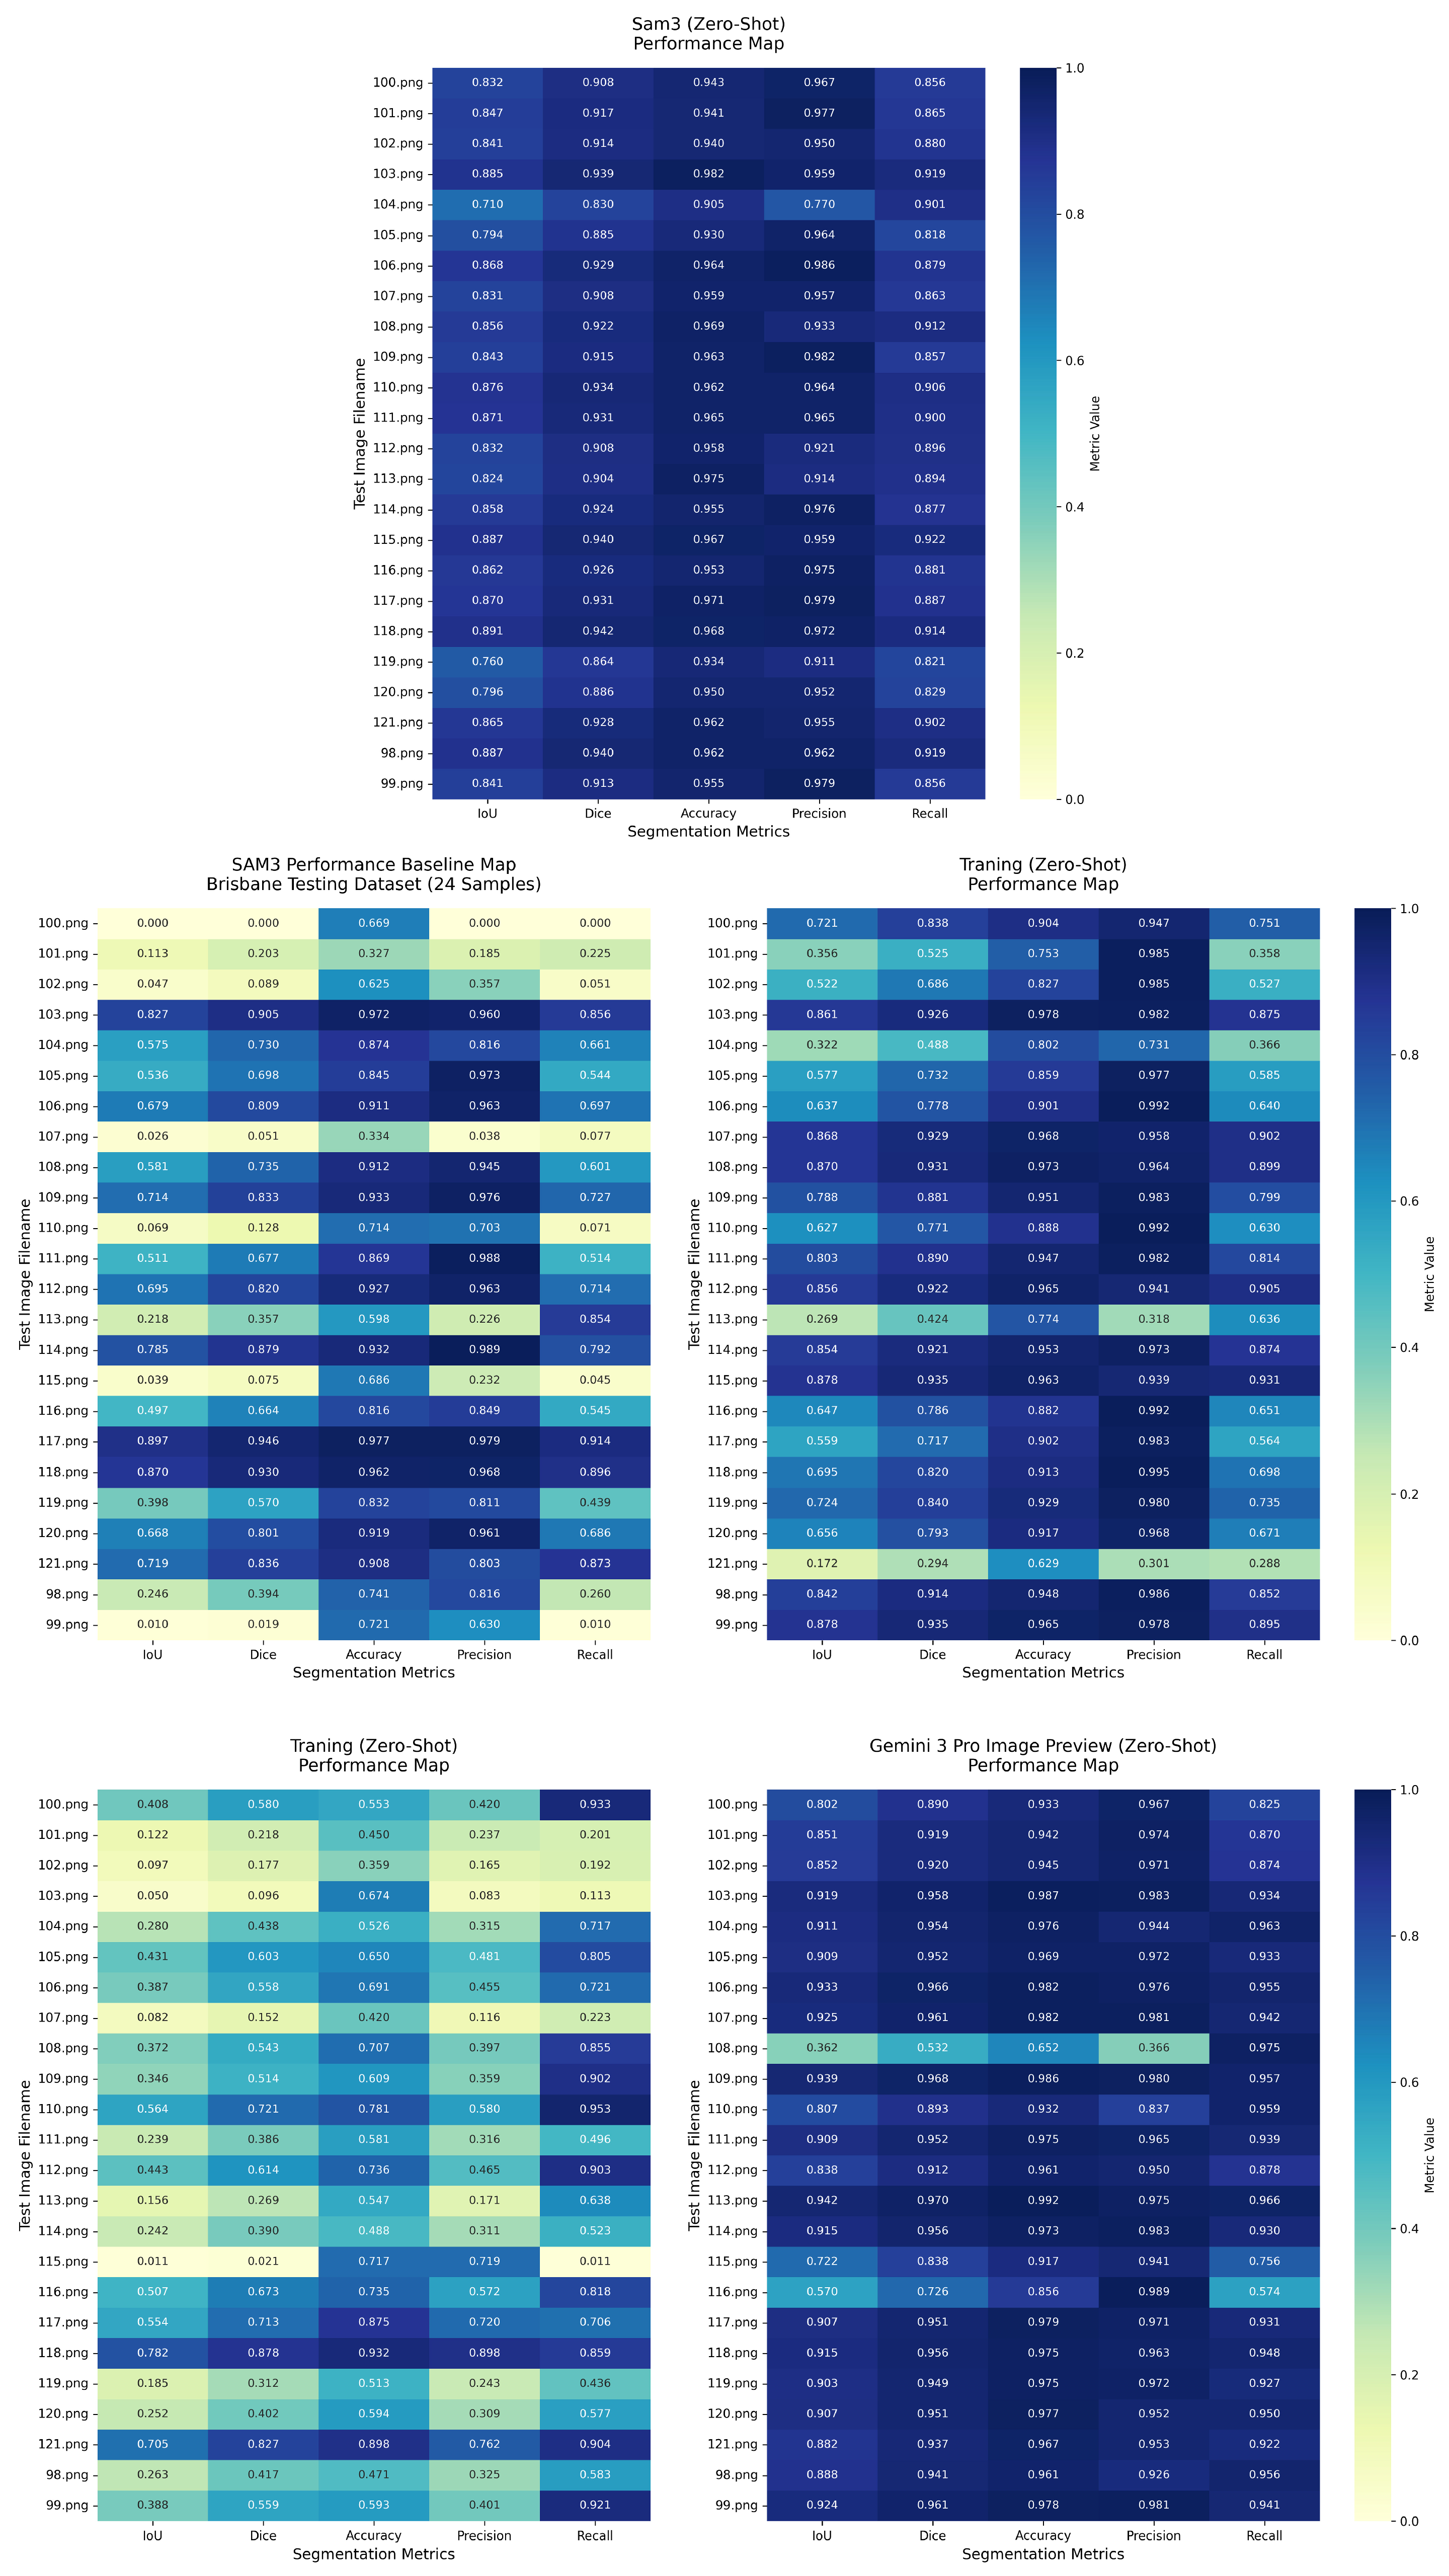
All zero-shot models were evaluated without task-specific fine-tuning or adaptation. The mean segmentation metrics across the validation set for the models (Gemini 3 Pro image preview, FLUX.1 Kontext, FLUX.2, and Qwen Image Edit 2509), together with the segmentation-first baseline SAM3, are shown in Figure 7.

4.1.1. Foundation Models’ Performance

Among all zero-shot models, Gemini 3 Pro image preview achieved the highest overall segmentation accuracy, with a mean Intersection-over-Union (IoU) of 85% with a standard deviation of 13% across the test dataset, and a Dice coefficient of 91%. This was accompanied by high precision (94%) and recall (91%), indicating balanced detection of rooftop regions and background suppression. Pixel accuracy reached 95%, while the Mean Absolute Error (MAE) remained limited to 5%.
Within the FLUX family, FLUX.2 outperformed FLUX.1 Kontext in zero-shot mode. FLUX.2 achieved an IoU of 67% and a Dice score of 78%, with high precision (91%) and moderate recall (70%). Pixel accuracy reached 90%, while the MAE was 11%. In contrast, FLUX.1 Kontext recorded a lower IoU of 45% and a Dice score of 55%, with a precision of 71% and a recall of 50%, indicating reduced rooftop coverage under zero-shot conditions.
Qwen Image Edit 2509 demonstrated the weakest zero-shot segmentation performance among the evaluated models. The model achieved an IoU of 33% and a Dice coefficient of 46%, with low precision (41%) and moderate recall (62%). The elevated MAE (39%) and high FPR (37%) indicate substantial pixel-level disagreement with the ground truth. Overall, the Gemini 3 Pro image preview stands out with higher overall scores (more dark blue cells) compared to the other three models, visually confirming its status as the strongest zero-shot baseline.

4.1.2. Segmentation-First Baseline Performance (SAM3)

For each tile, the SAM3 prediction was compared with the binary rooftop ground truth using the metrics defined in Section 3.3. Across this subset, SAM3 consistently demonstrates strong segmentation performance, achieving an IoU of 84% with an SD of 4.3% across the test dataset and a Dice score of 91%. SAM3 produced the highest precision (95%) among all evaluated models, with a pixel accuracy of 96%. Recall was slightly lower at 88%, reflected in a False Negative Rate (FNR) of 12%. The MAE remained low at 4%, and the False Positive Rate (FPR) was limited to 2%.
At the image level, SAM3 exhibits stable performance across the dataset, with IoU values ranging between 0.80 and 0.89, and Dice scores consistently exceeding 0.90 for the majority of samples. This limited dispersion is further reflected in the balanced distribution of true positive and true negative pixel counts, indicating uniform segmentation behaviour across different rooftop typologies and spatial configurations.
The Mean Absolute Error (MAE) across individual images varied between 0.023 and 0.070, corresponding to a low proportion of misclassified pixels relative to the full image area. False Positive Rates (FPR) were consistently low, ranging from 0.0048 to 0.0339, while False Negative Rates (FNR) ranged from 0.0808 to 0.1820 across the dataset.
At the pixel-count level, the number of true positive (TP) rooftop pixels per image varied from approximately 122,600 to 354,200, reflecting differences in building density and rooftop coverage across tiles. False positive (FP) counts remained comparatively low, generally below 18,000 pixels per image, while true negative (TN) counts consistently exceeded 690,000 pixels, confirming strong background classification performance.
Across all zero-shot models, false negative (FN) counts varied substantially, with FLUX.1 Kontext and FLUX.2 zero-shot exhibiting markedly higher FN values than Gemini Pro and SAM3, as shown in Figure 8. These differences are reflected in the corresponding recall and FNR metrics and indicate varying degrees of rooftop coverage across zero-shot approaches. Pixel-level analysis further highlights this variability, as Gemini 3 Pro image preview and SAM3 produced the highest true positive (TP) pixel counts per tile while maintaining relatively low false positive (FP) rates. In contrast, Qwen Image Edit 2509 generated a larger number of false positives, consistent with its elevated FPR.
While the segmentation-first SAM3 and Gemini 3 Pro image preview baselines demonstrated strong and stable performance under the applied evaluation protocol, the observed variability across editing-based zero-shot models motivates further investigation into whether Low-Rank Adaptation can improve the segmentation capability of diffusion-based architectures.

4.2. Effect of LoRA Fine-Tuning on Editing-Based Models

To address the performance variability observed in zero-shot editing-based diffusion models, a quantitative evaluation is conducted to assess the impact of LoRA-based adaptation on segmentation performance. All adapted models are evaluated using the same validation dataset and pixel-level metrics employed in the preceding experiments, ensuring direct comparability with both zero-shot diffusion models, Gemini 3 Pro image preview, and the segmentation-first SAM3 baseline.
Rather than reporting results from a single final model state, performance is analysed across 20 training checkpoints for each architecture. This enables systematic examination of adaptation behaviour throughout training and facilitates the identification of the checkpoint achieving the highest segmentation accuracy for each model.

4.2.1. Performance of FLUX Kontext LoRA Pipeline

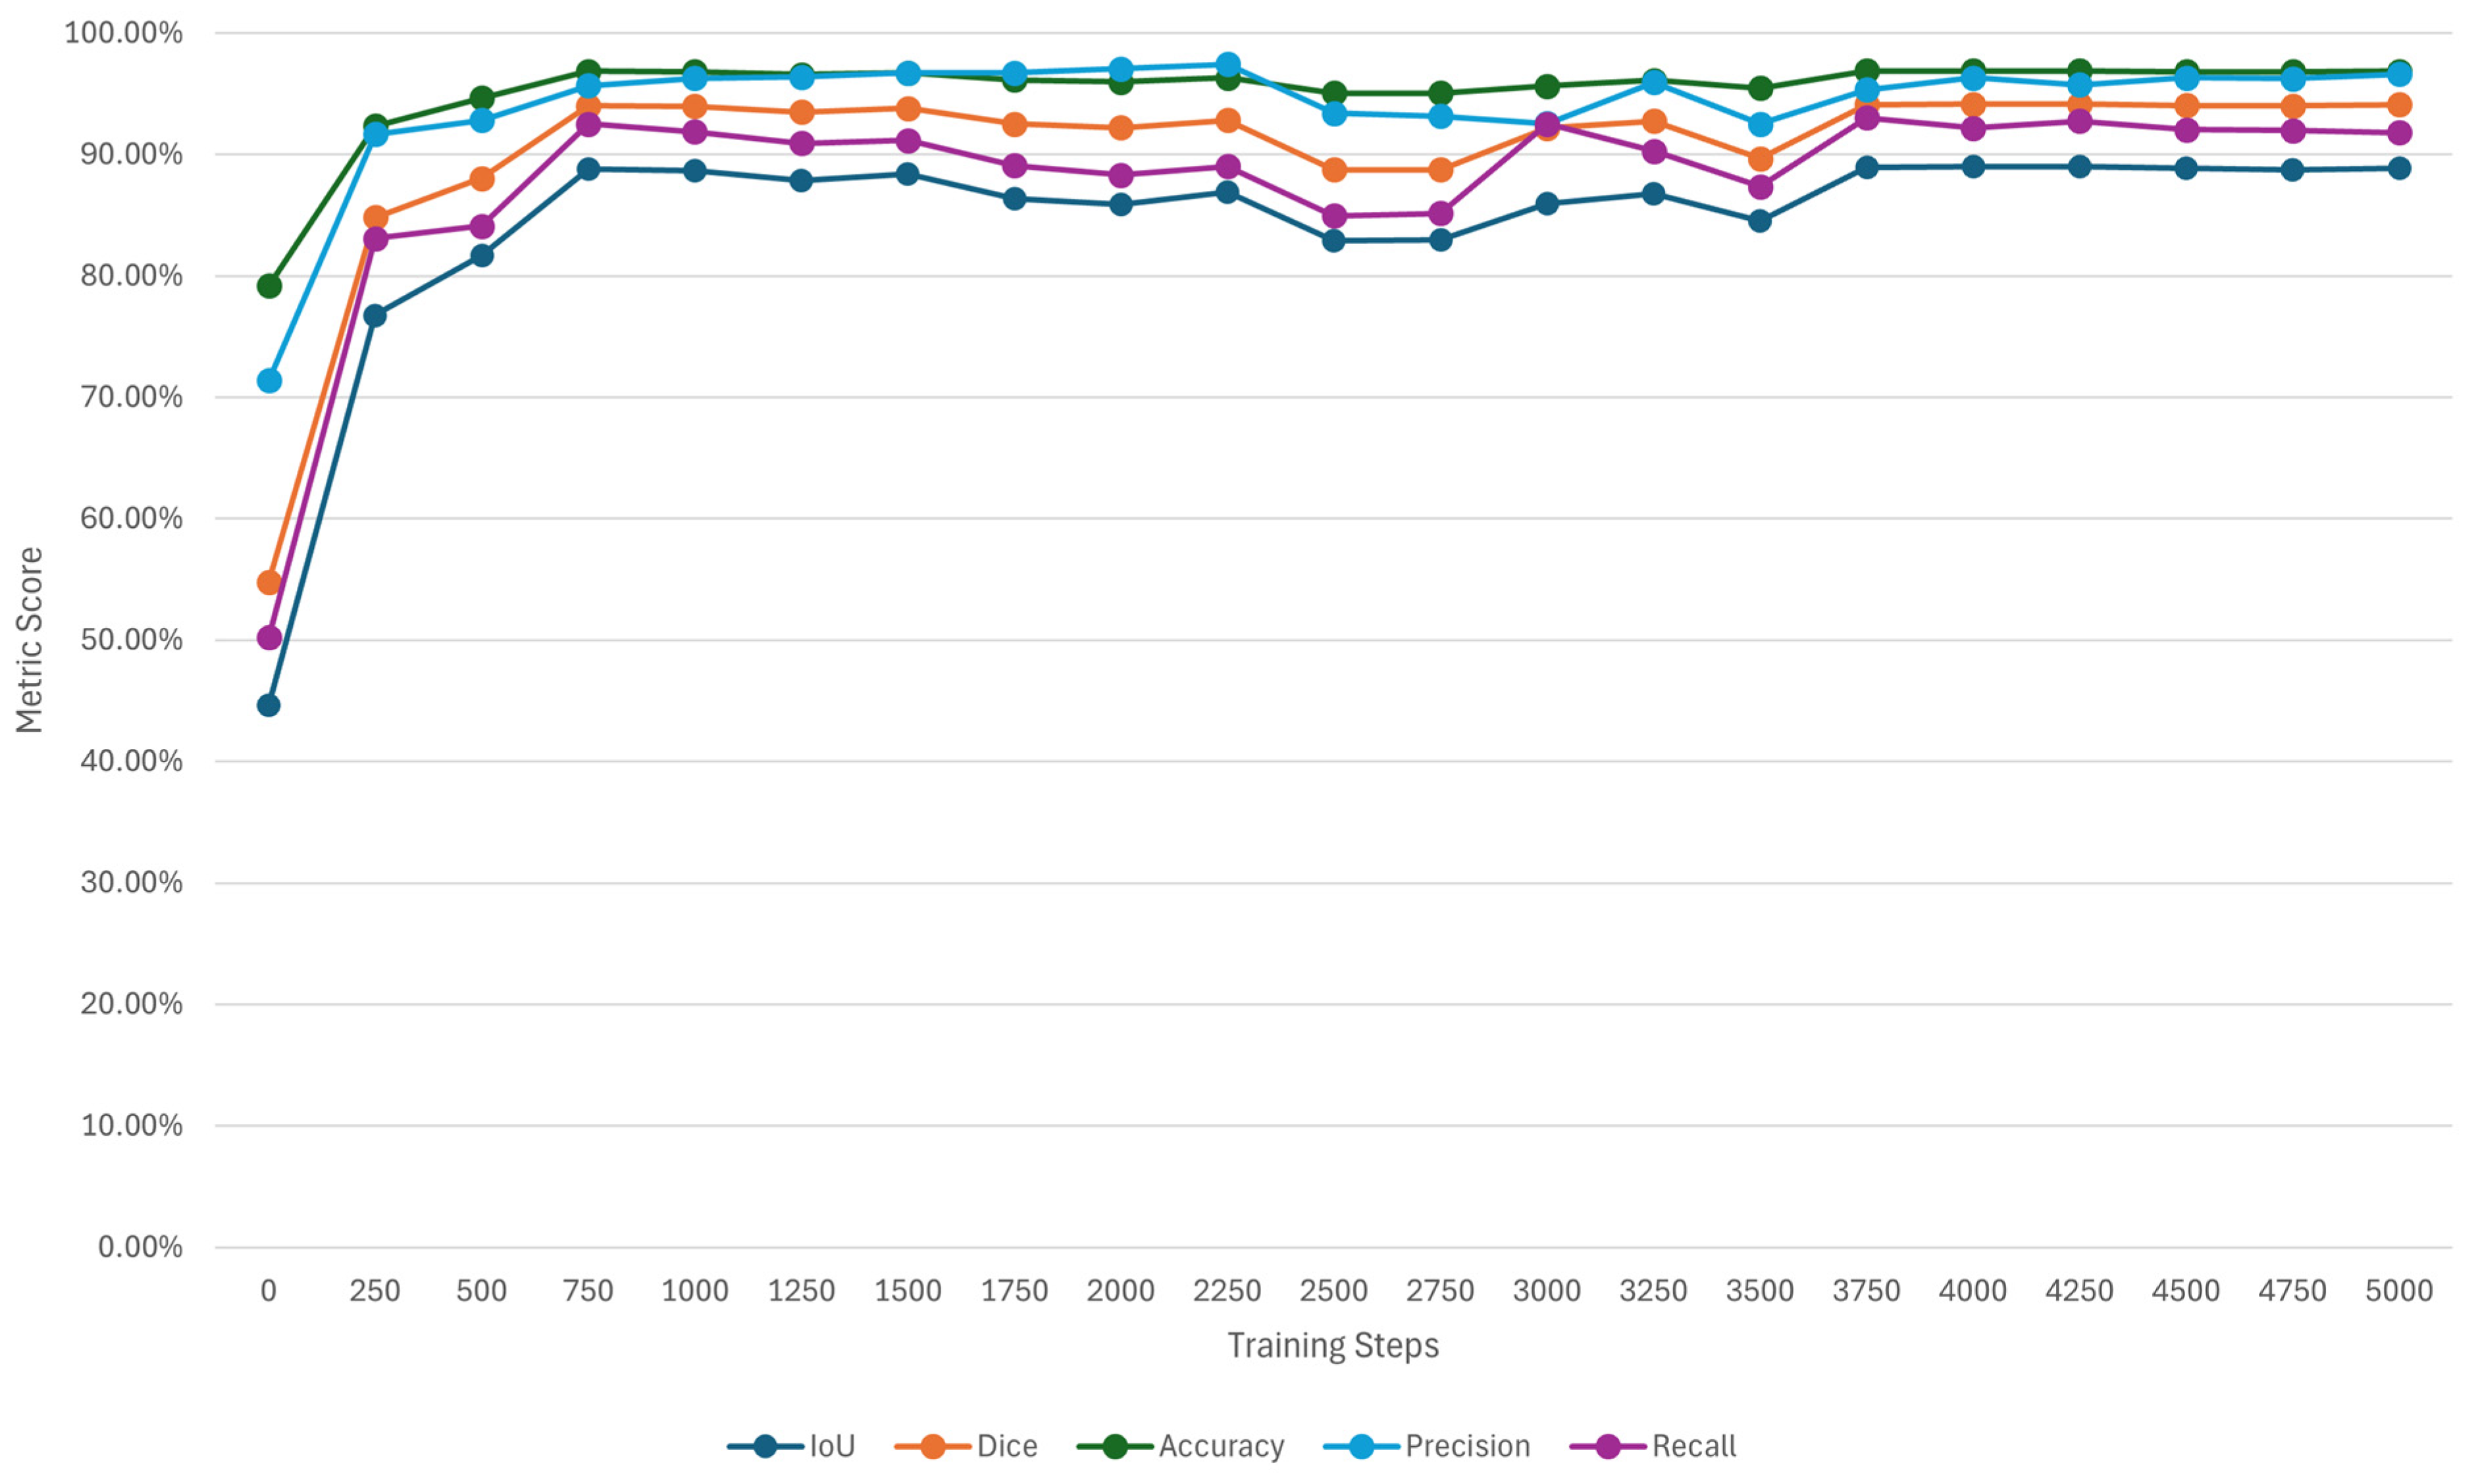
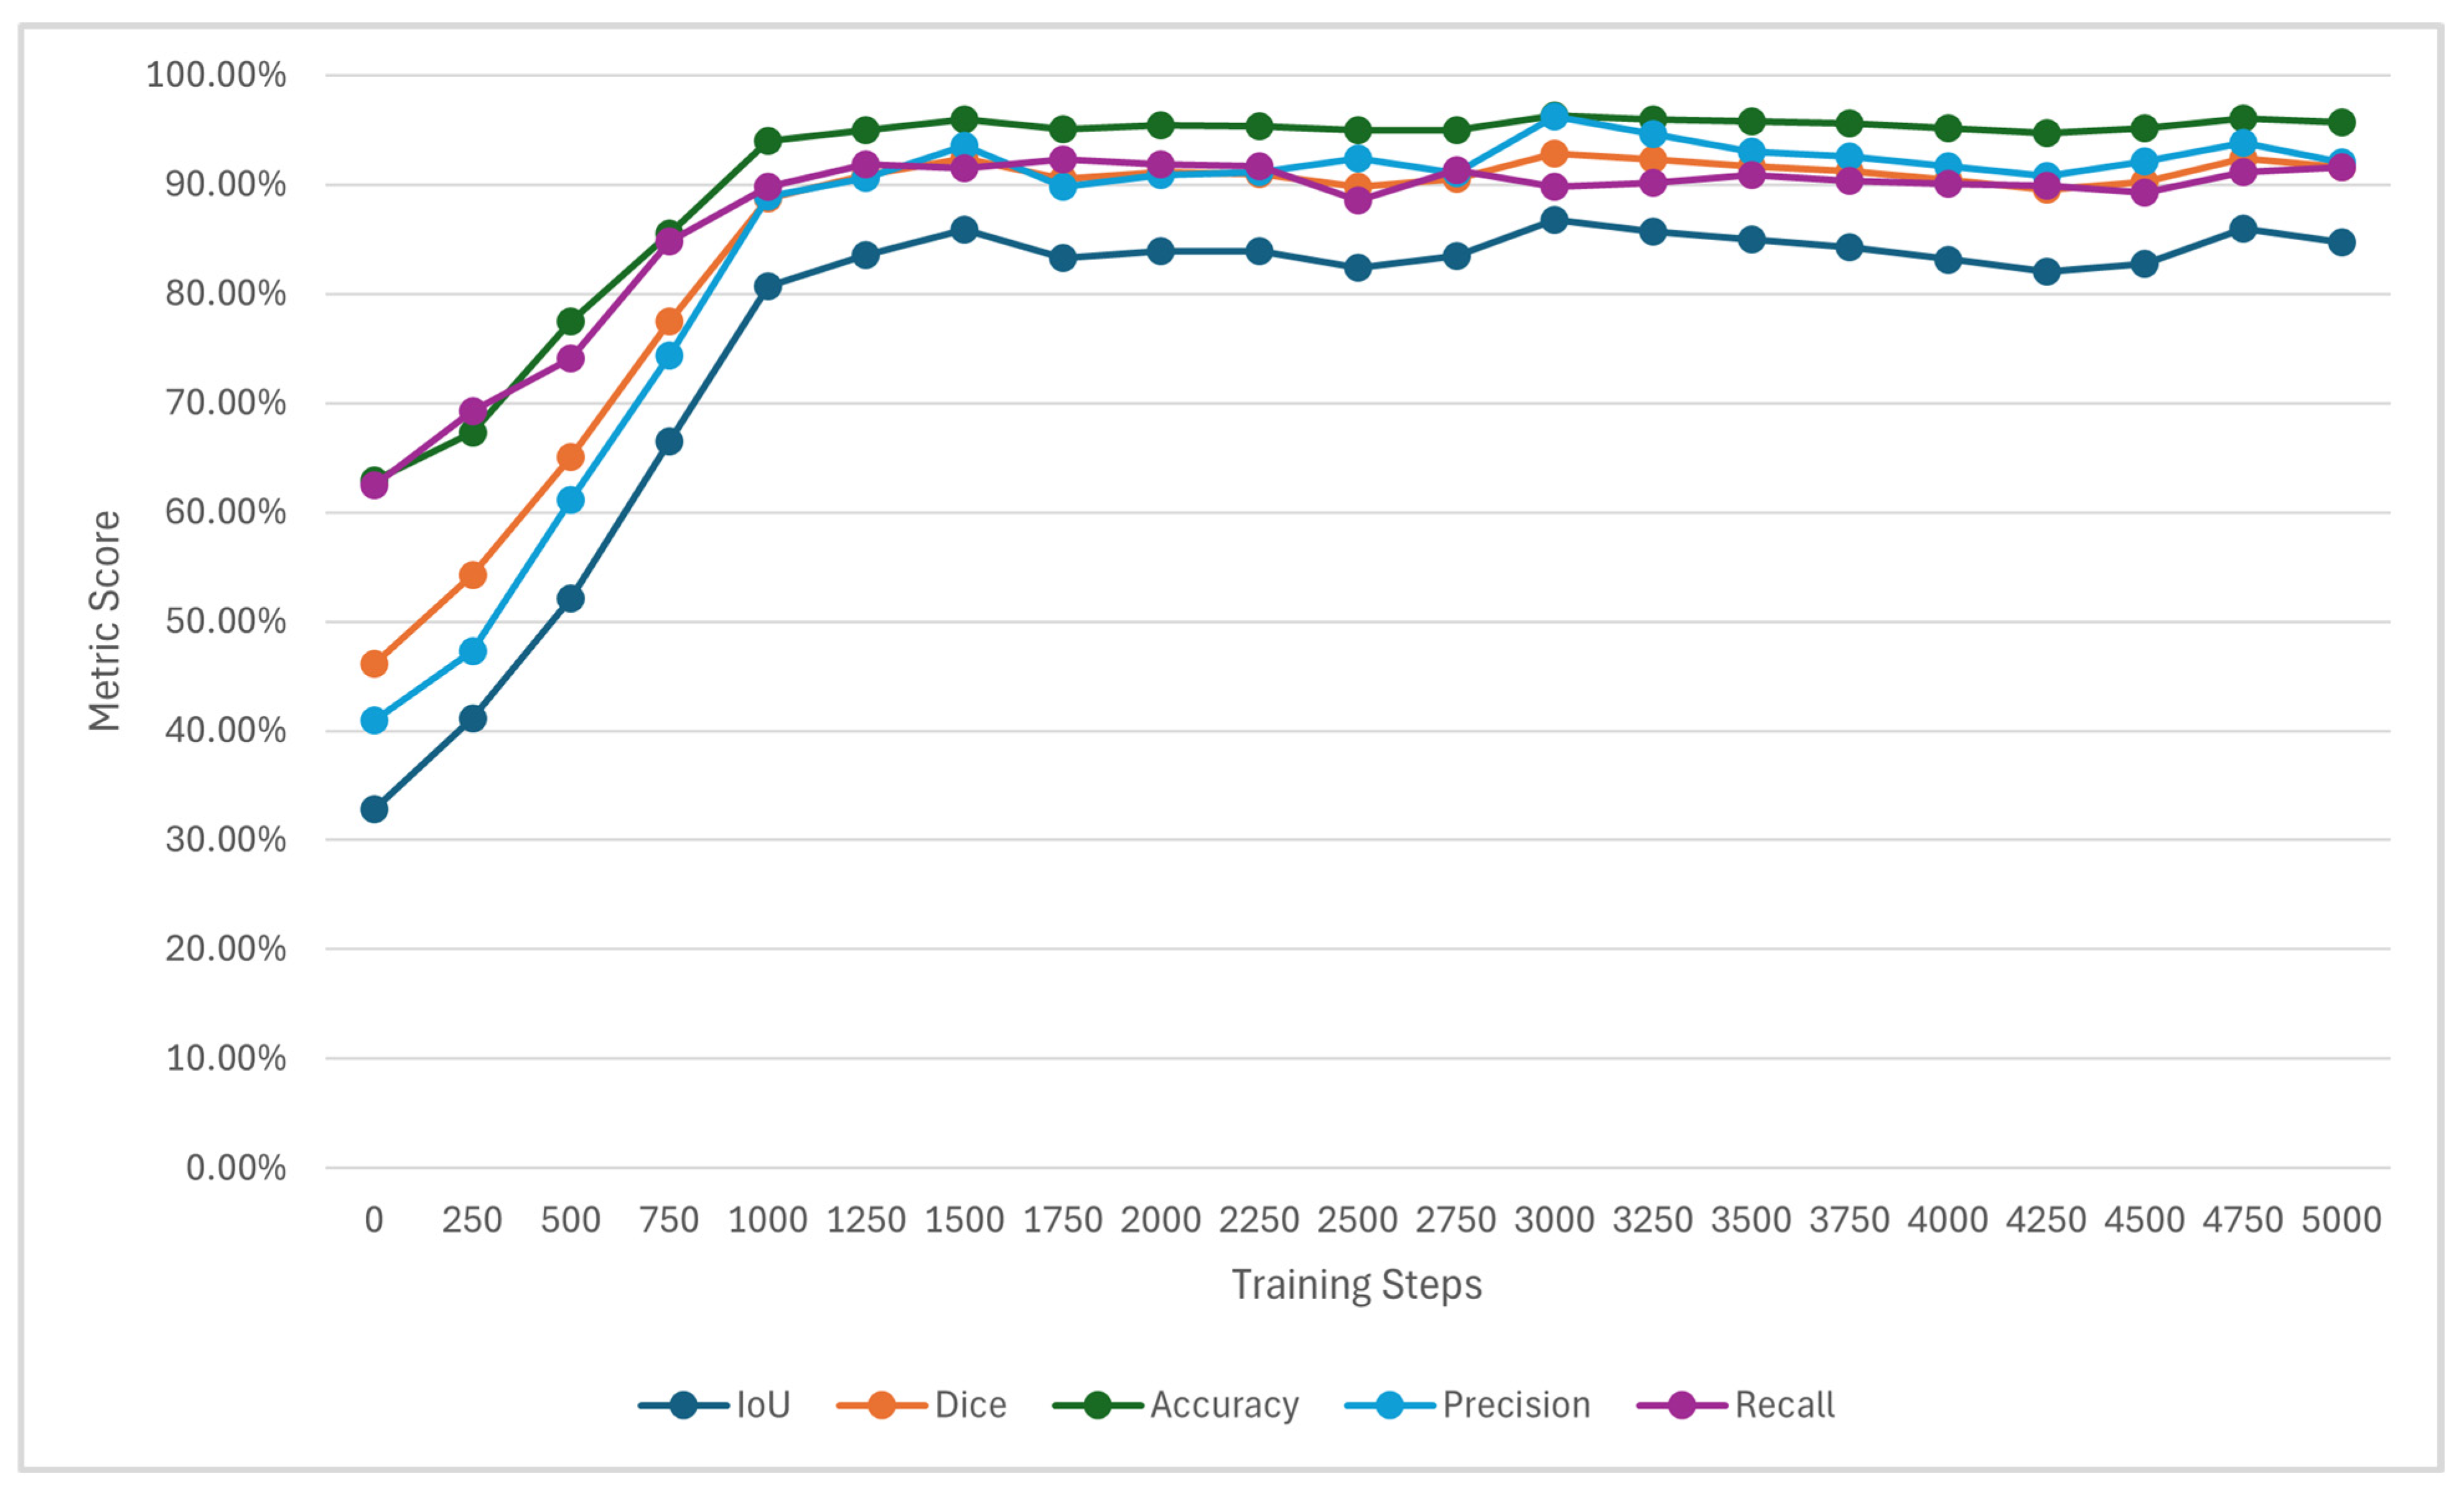
FLUX Kontext LoRA exhibits a rapid improvement in segmentation accuracy during early training stages. At 250 optimisation steps, IoU increases from 45% (initial state) to 77%, with the Dice coefficient rising from 55 to 85%. Further gains are observed up to 750 steps, where IoU reaches 89%, and Dice exceeds 94%. From 1000 steps onward, FLUX Kontext LoRA maintains consistently high performance. IoU values remain within a narrow range of 86% to 89%, while Dice coefficients stabilise around 94% to 95% across subsequent checkpoints. Pixel accuracy exceeds 96% for most checkpoints beyond this stage. Precision remains high throughout later training, typically above 95%, while recall stabilises around 92% to 93%, as shown in Figure 9.
Pixel-level error metrics also stabilise in later checkpoints. Mean Absolute Error (MAE) decreases from 0.21 at step 0 to approximately 0.03–0.04 after 750 steps. False Positive Rate (FPR) remains consistently low, typically below 0.02, while False Negative Rate (FNR) remains below 0.10 across the high-performing checkpoints.
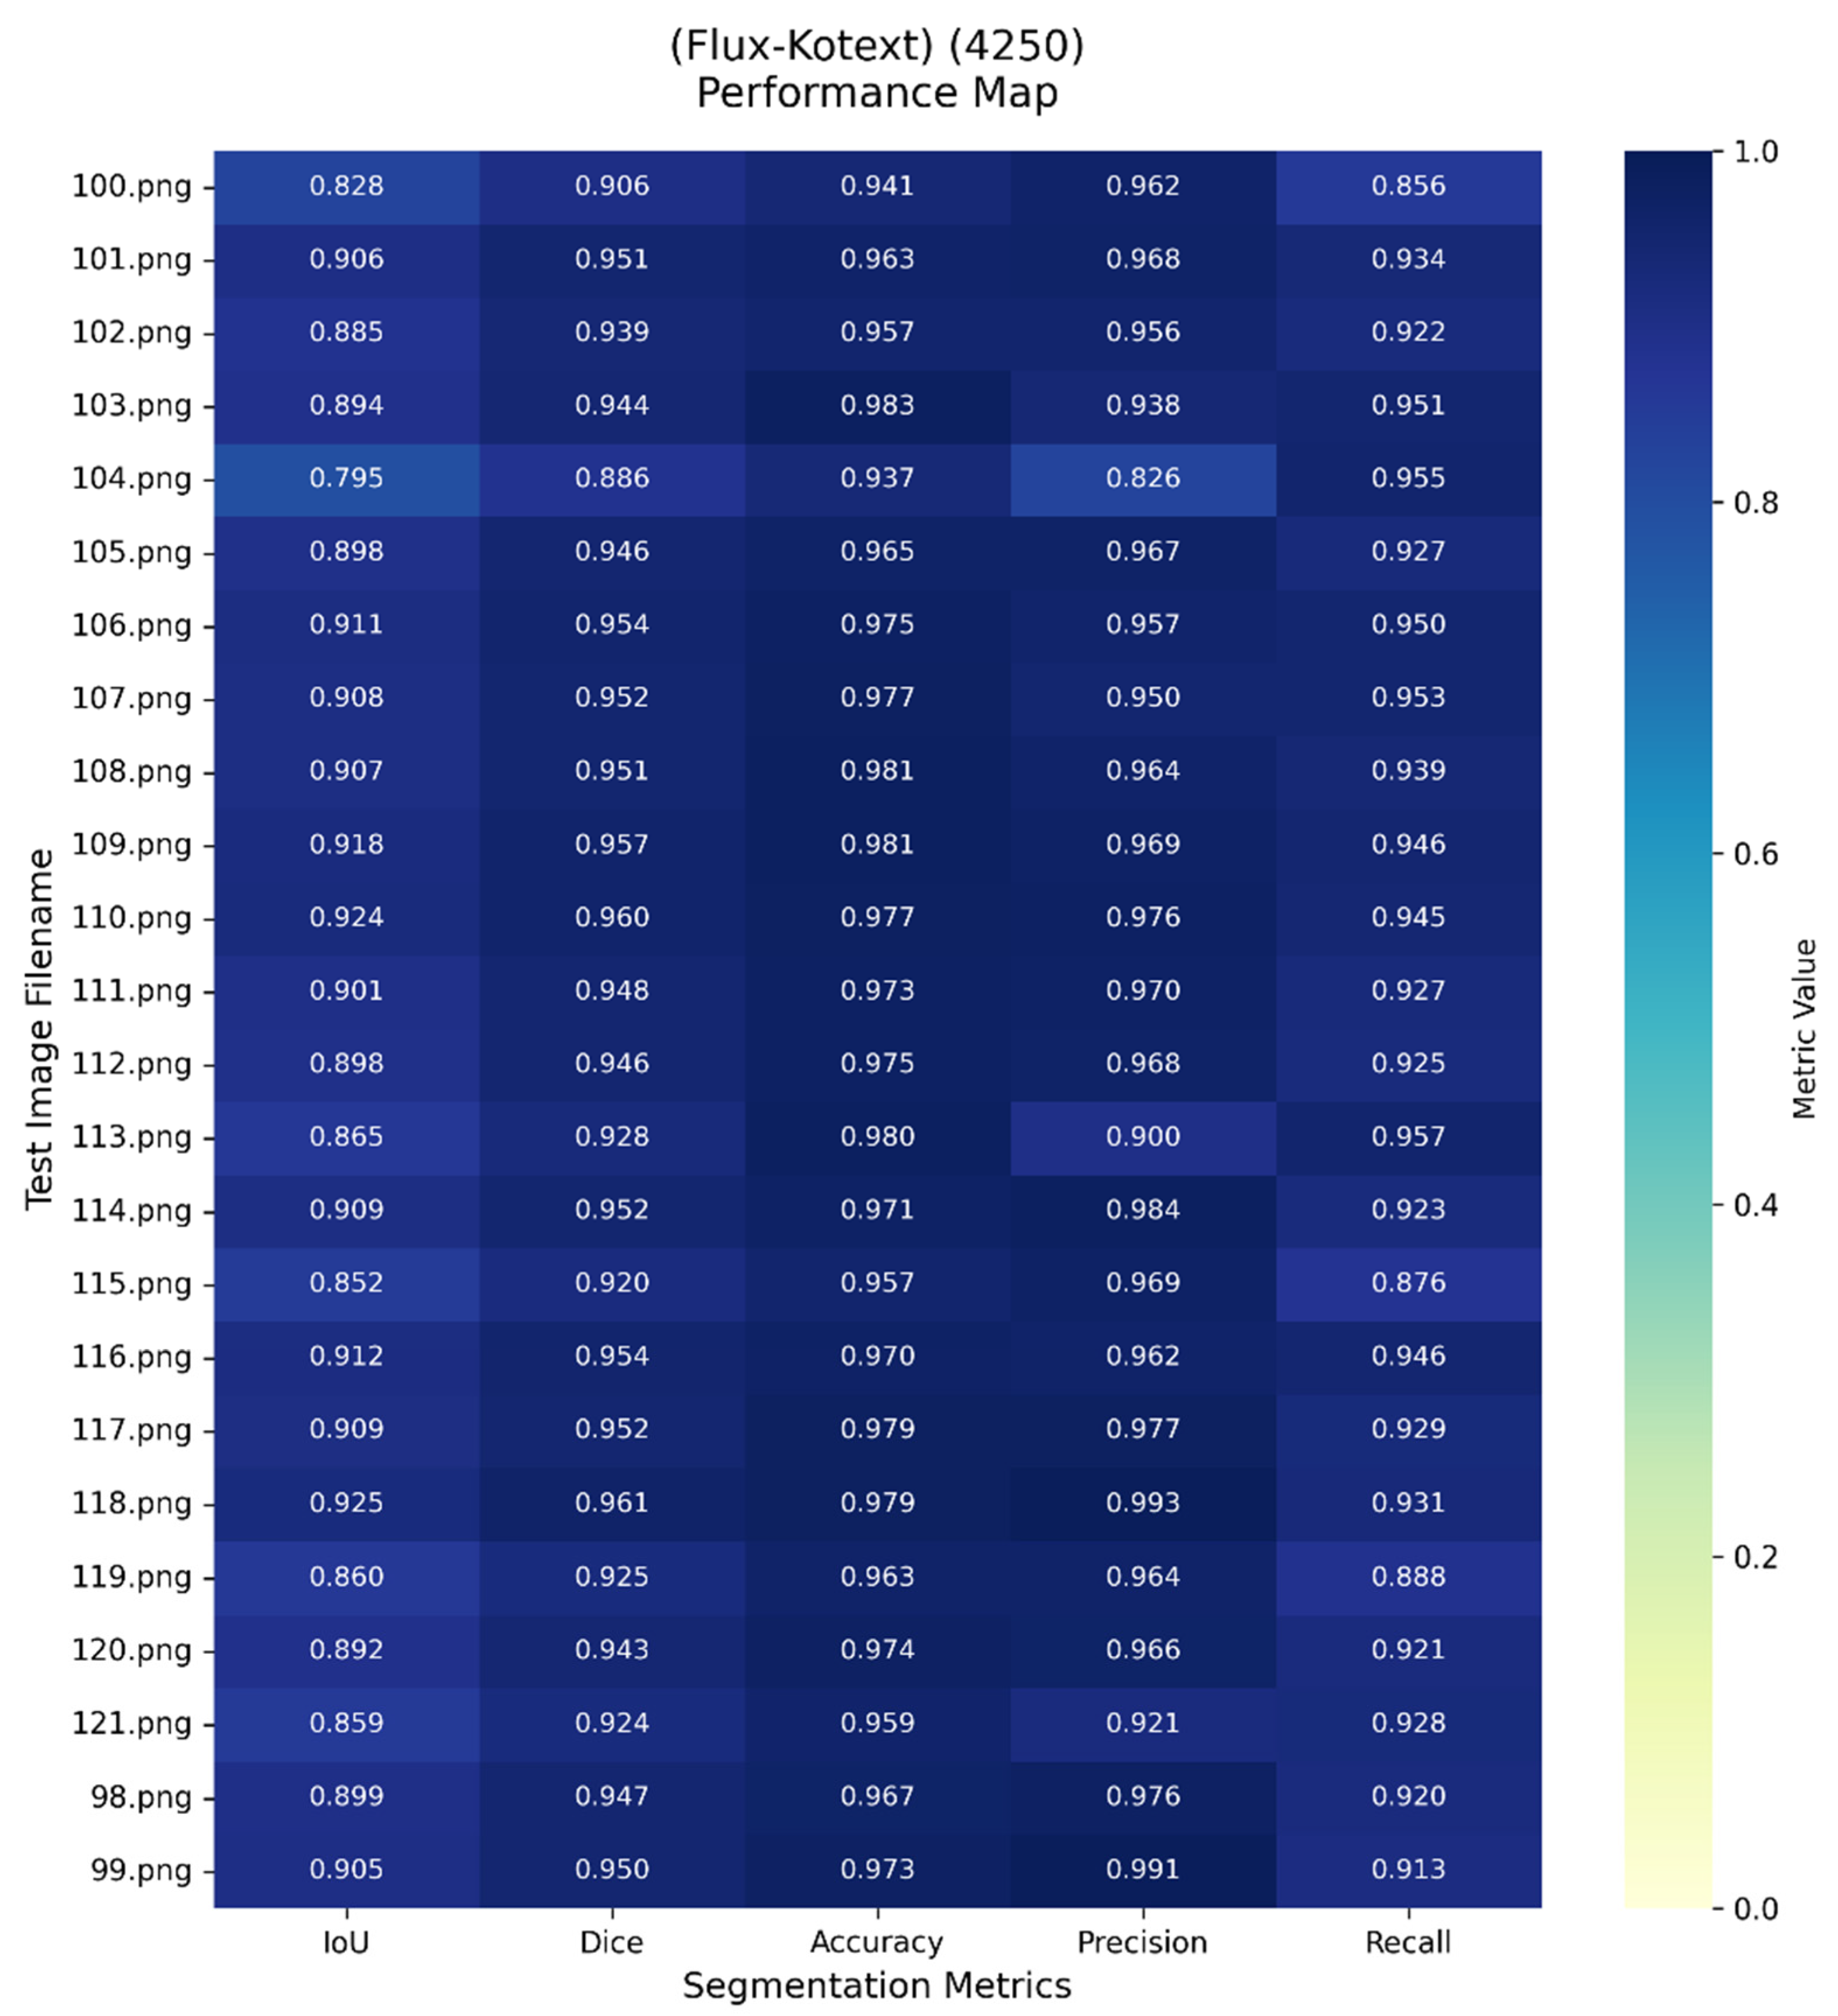
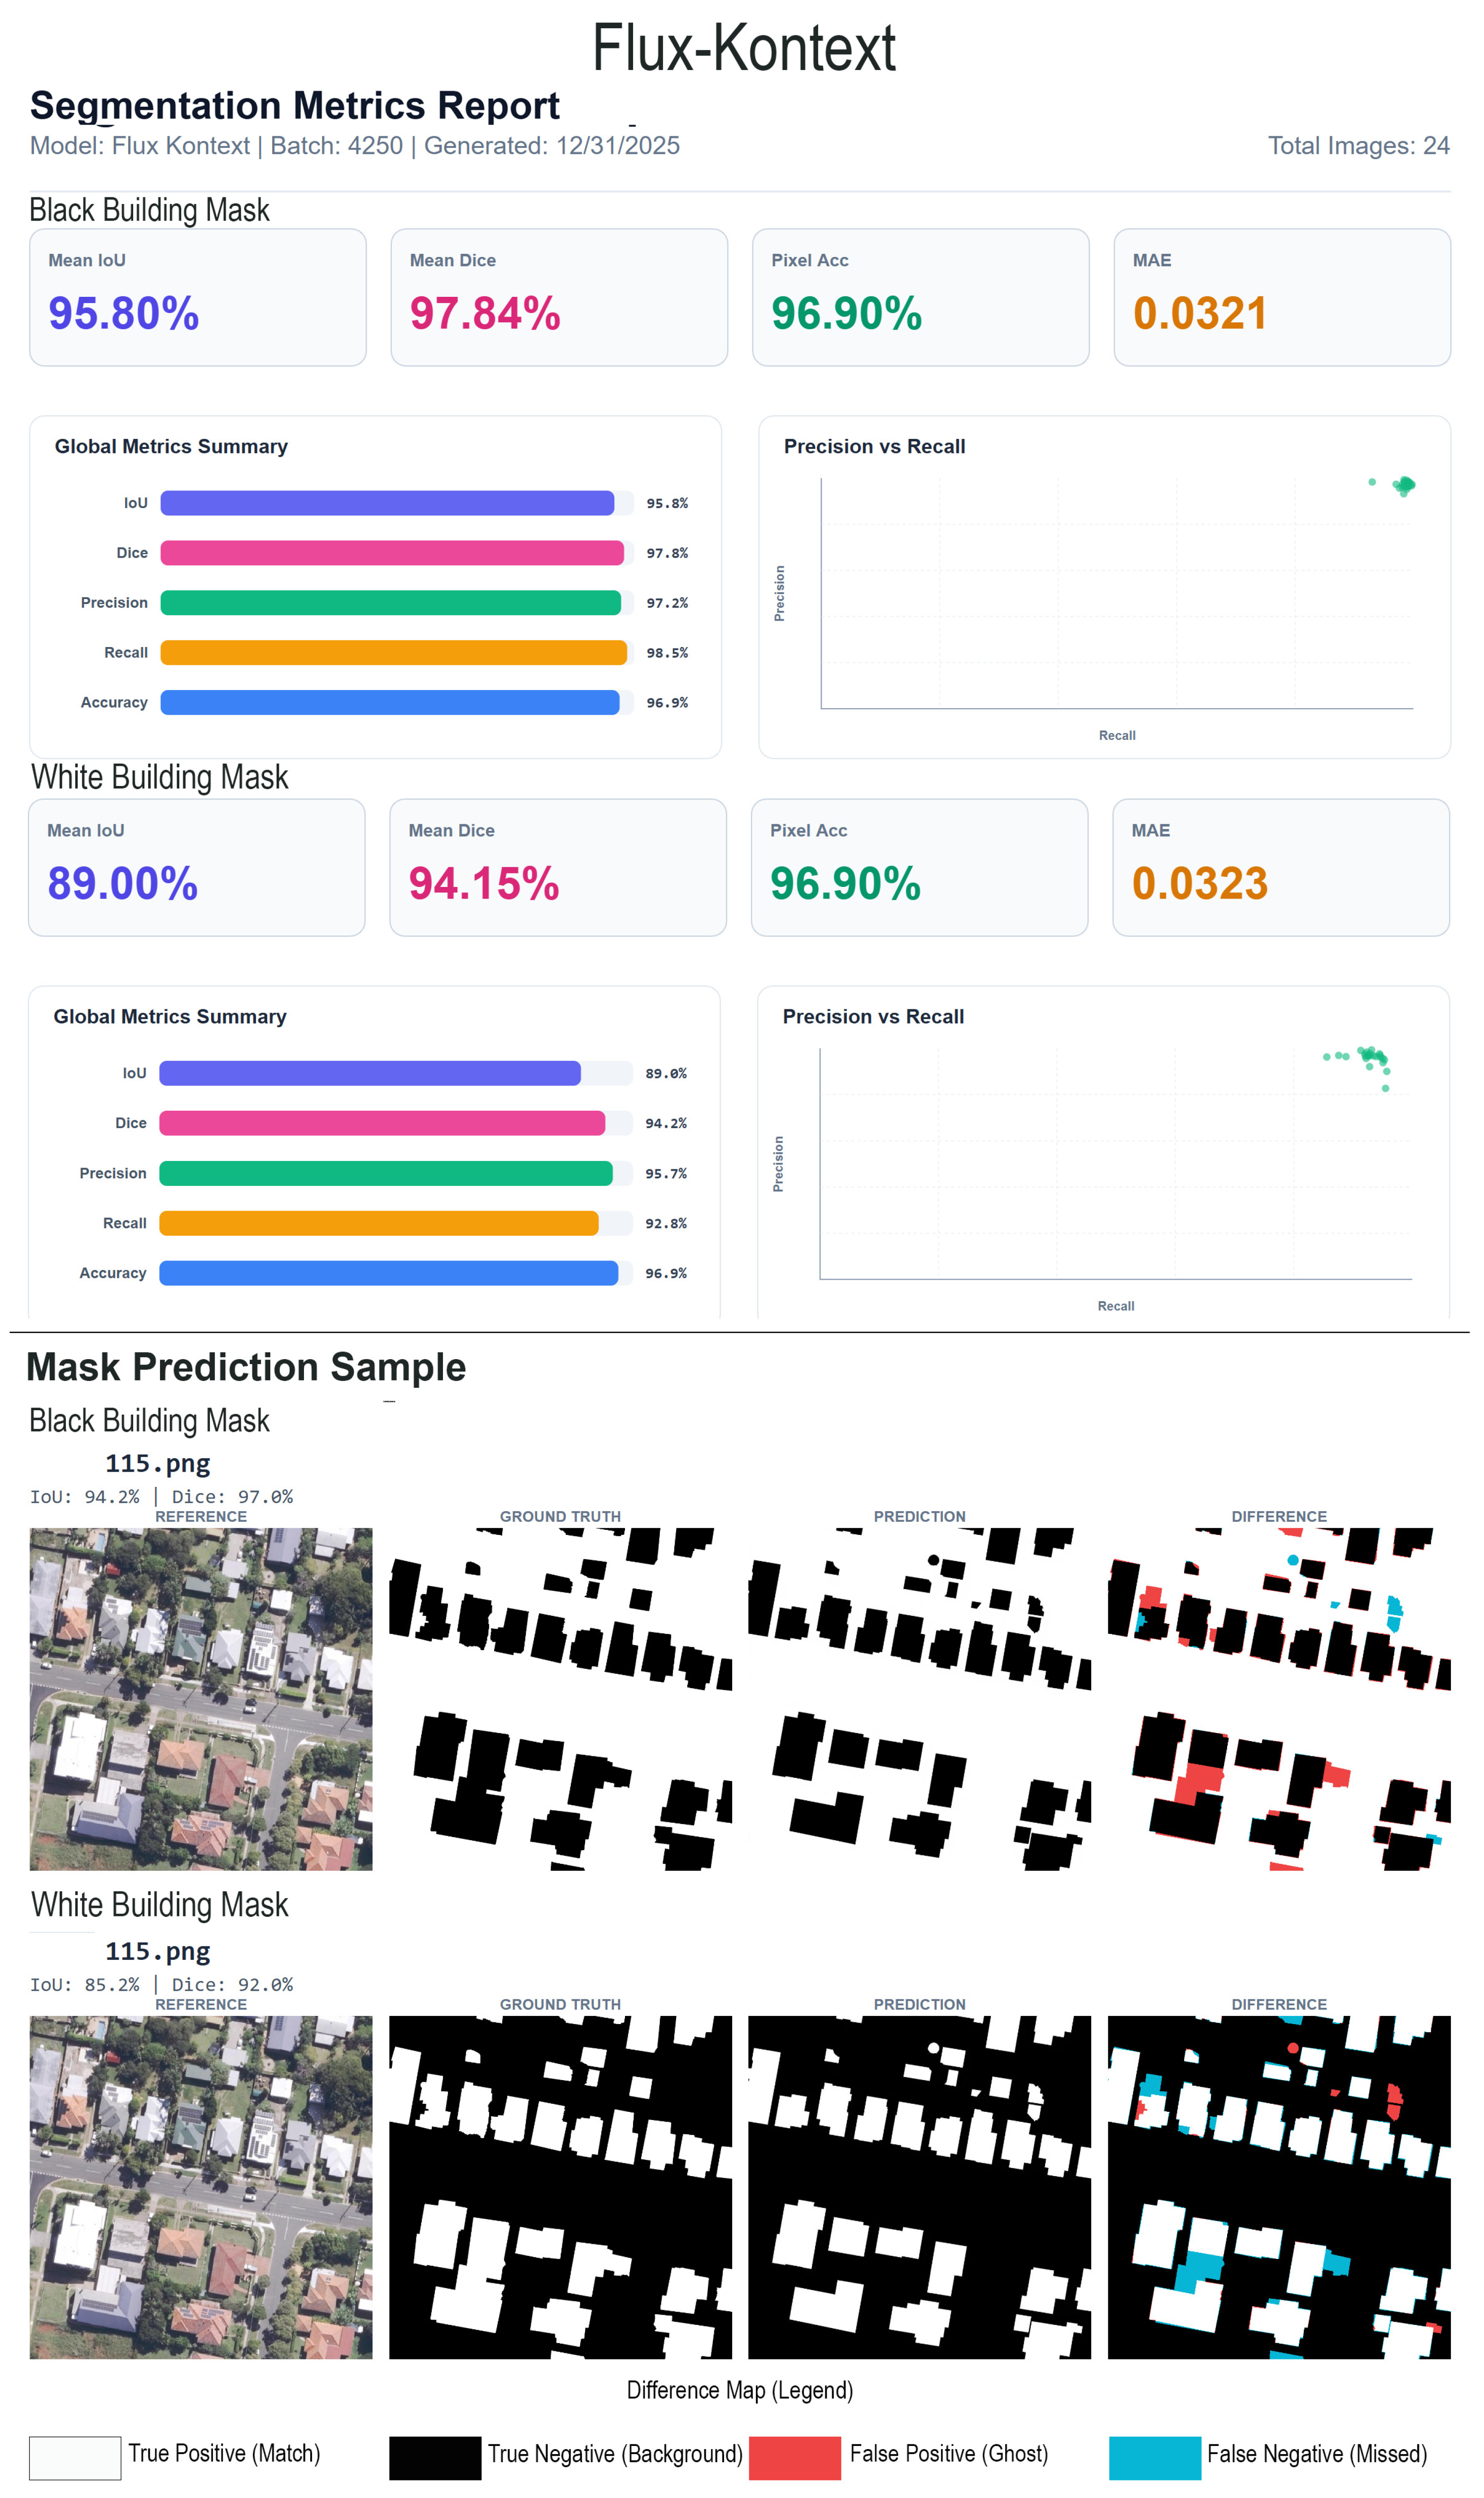
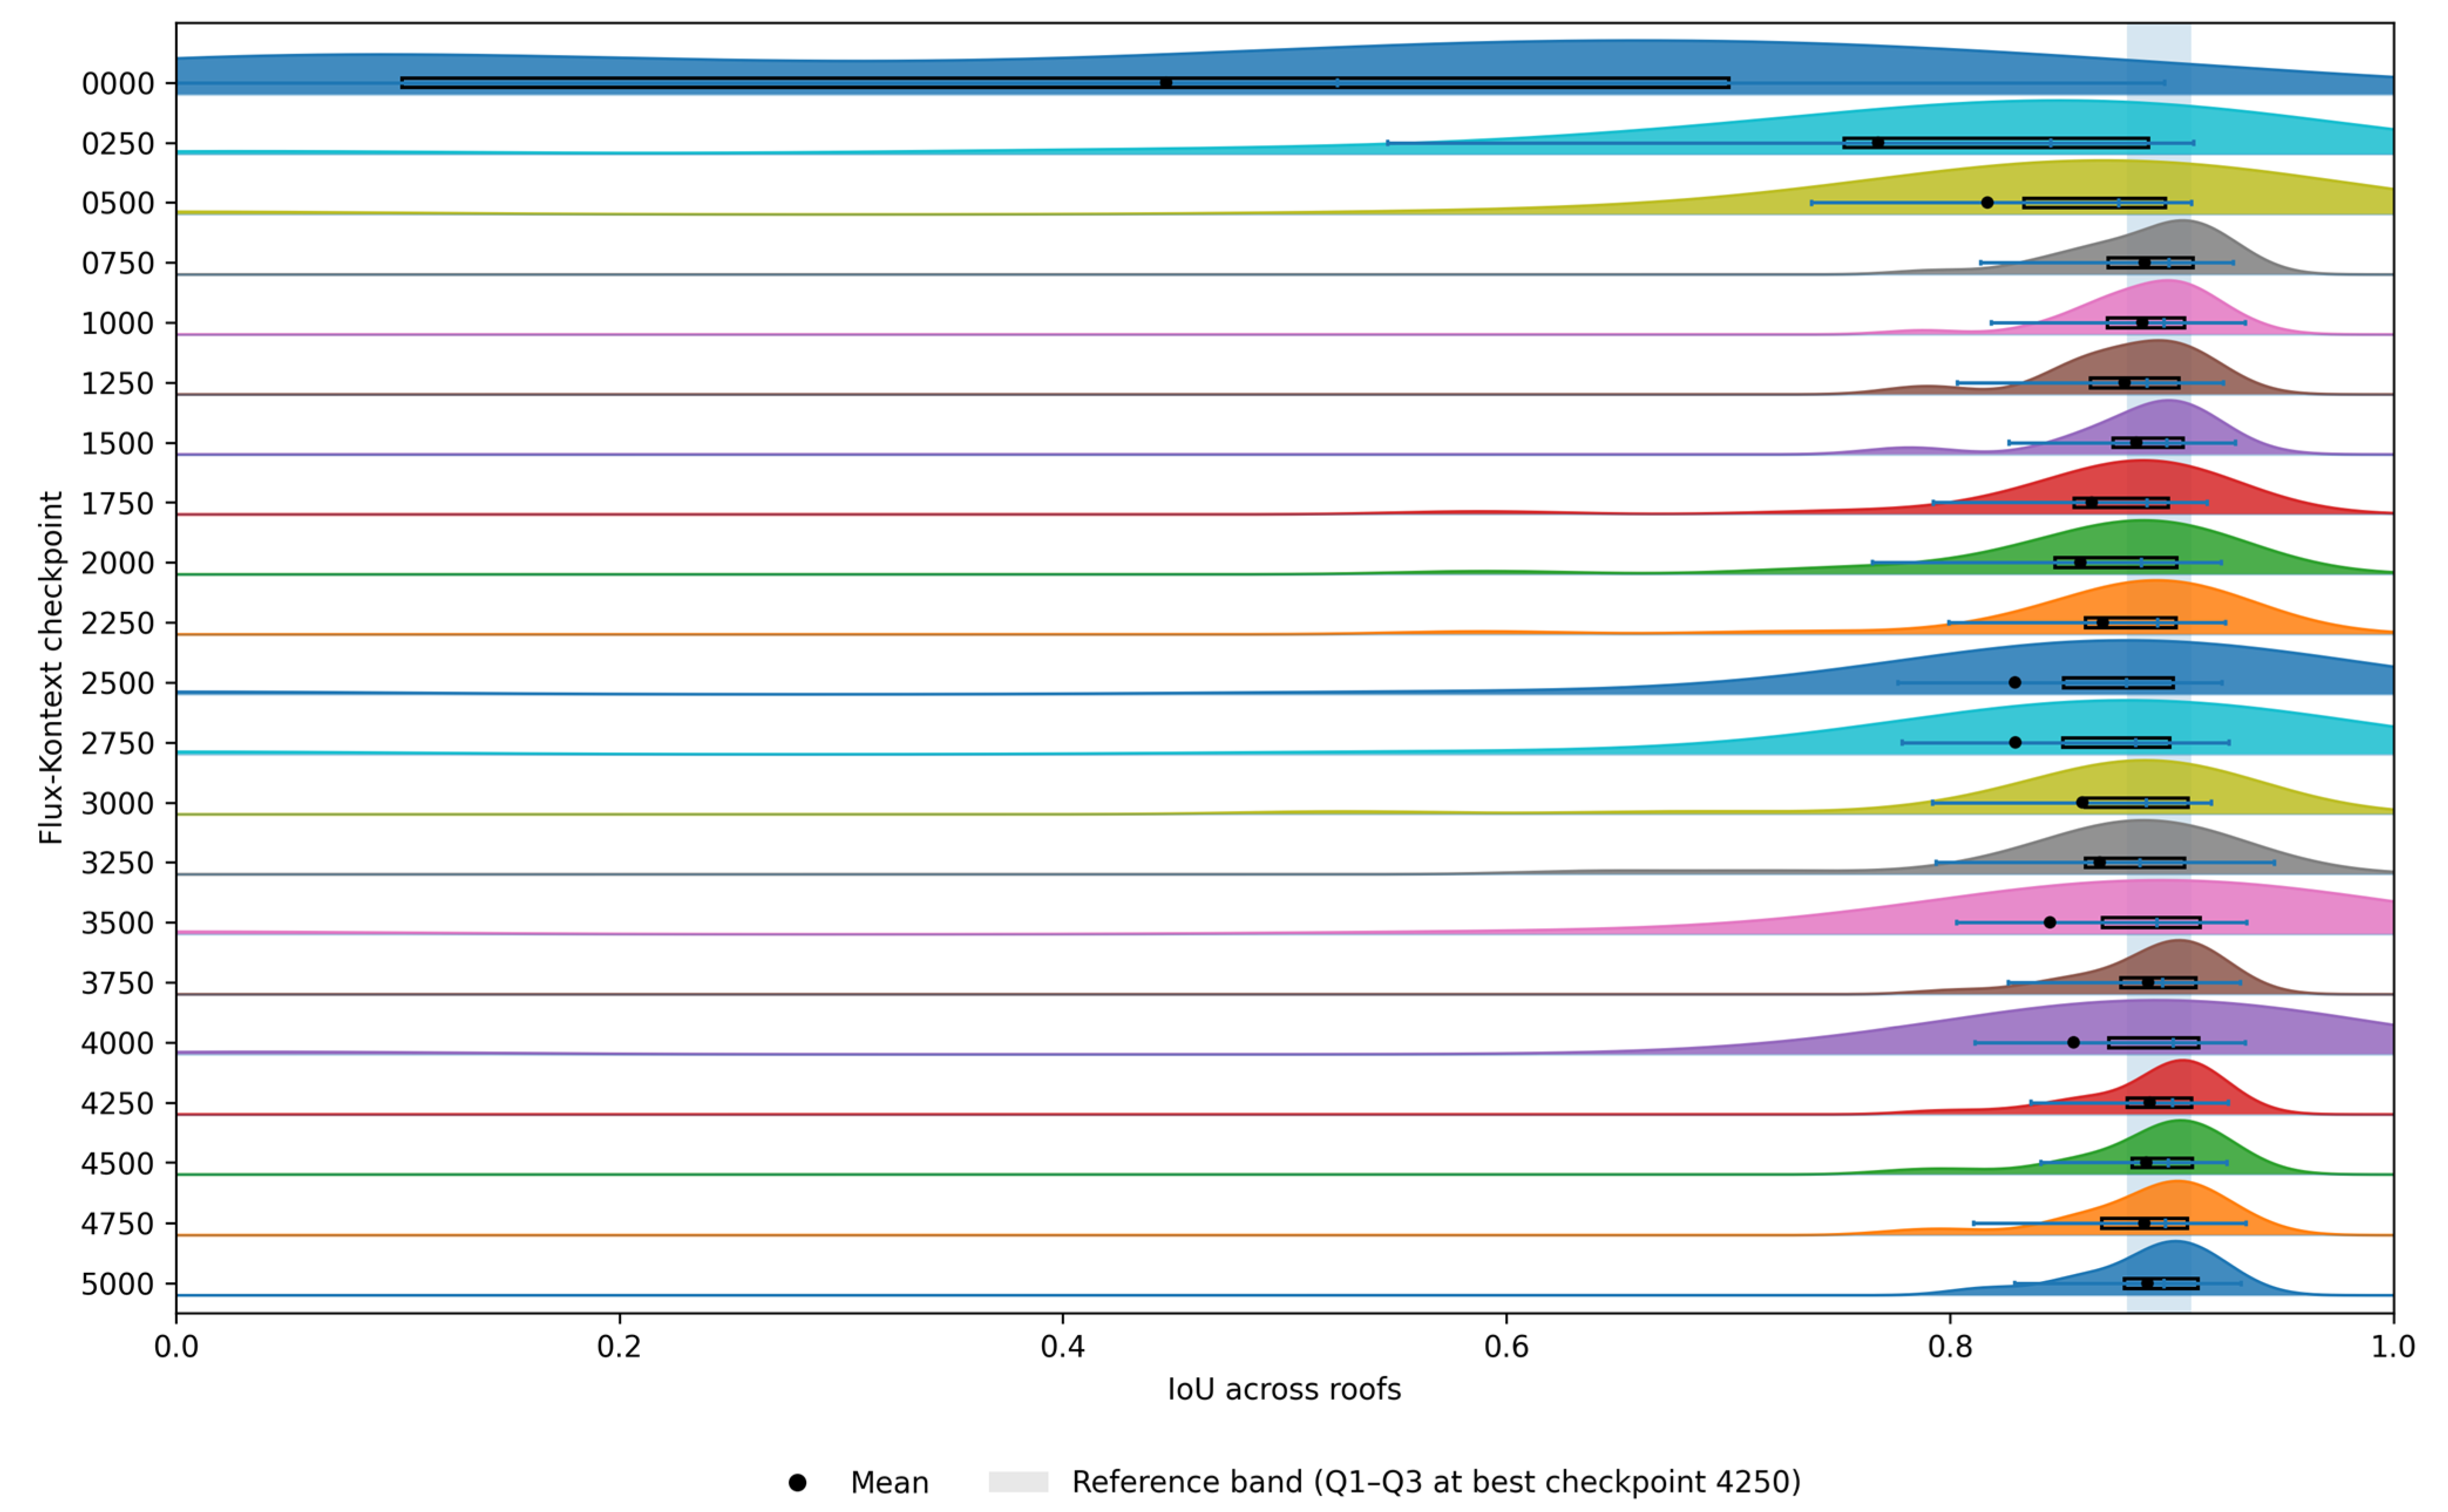
As training progressed, the model reached its optimal performance checkpoint at step 4250, where it achieved a maximum IoU of 89% with an SD of 3.16% across the test dataset, and a Dice coefficient of 94.15%, as shown in Figure 10. At this checkpoint, pixel accuracy reached 96.90%, with precision and recall values of 95.73% and 92.75%, respectively. The Mean Absolute Error (MAE) was reduced to 0.0323, while false positive and false negative rates remained low and balanced, indicating accurate rooftop boundary delineation.
Figure 11 complements the checkpoint mean curves by reporting per-roof IoU distributions across FLUX Kontext training checkpoints, including the mean marker and interquartile range. This distribution-level in FLUX Kontext progressively concentrates toward high overlap values during fine-tuning, indicating improved stability and reduced variance across rooftops at later checkpoints, which is consistent with the strong mean performance reported at the optimal checkpoint.
Beyond the optimal checkpoint, the FLUX Kontext LoRA model maintained stable performance, with only minor metric fluctuations across subsequent steps. IoU values consistently remained above 88%, and Dice scores exceeded 94%, suggesting effective convergence without evident overfitting. Based on these results, the checkpoint at step 4250 was selected as the best-performing FLUX Kontext LoRA model for comparative evaluation.

4.2.2. Performance of FLUX.2 Pipeline

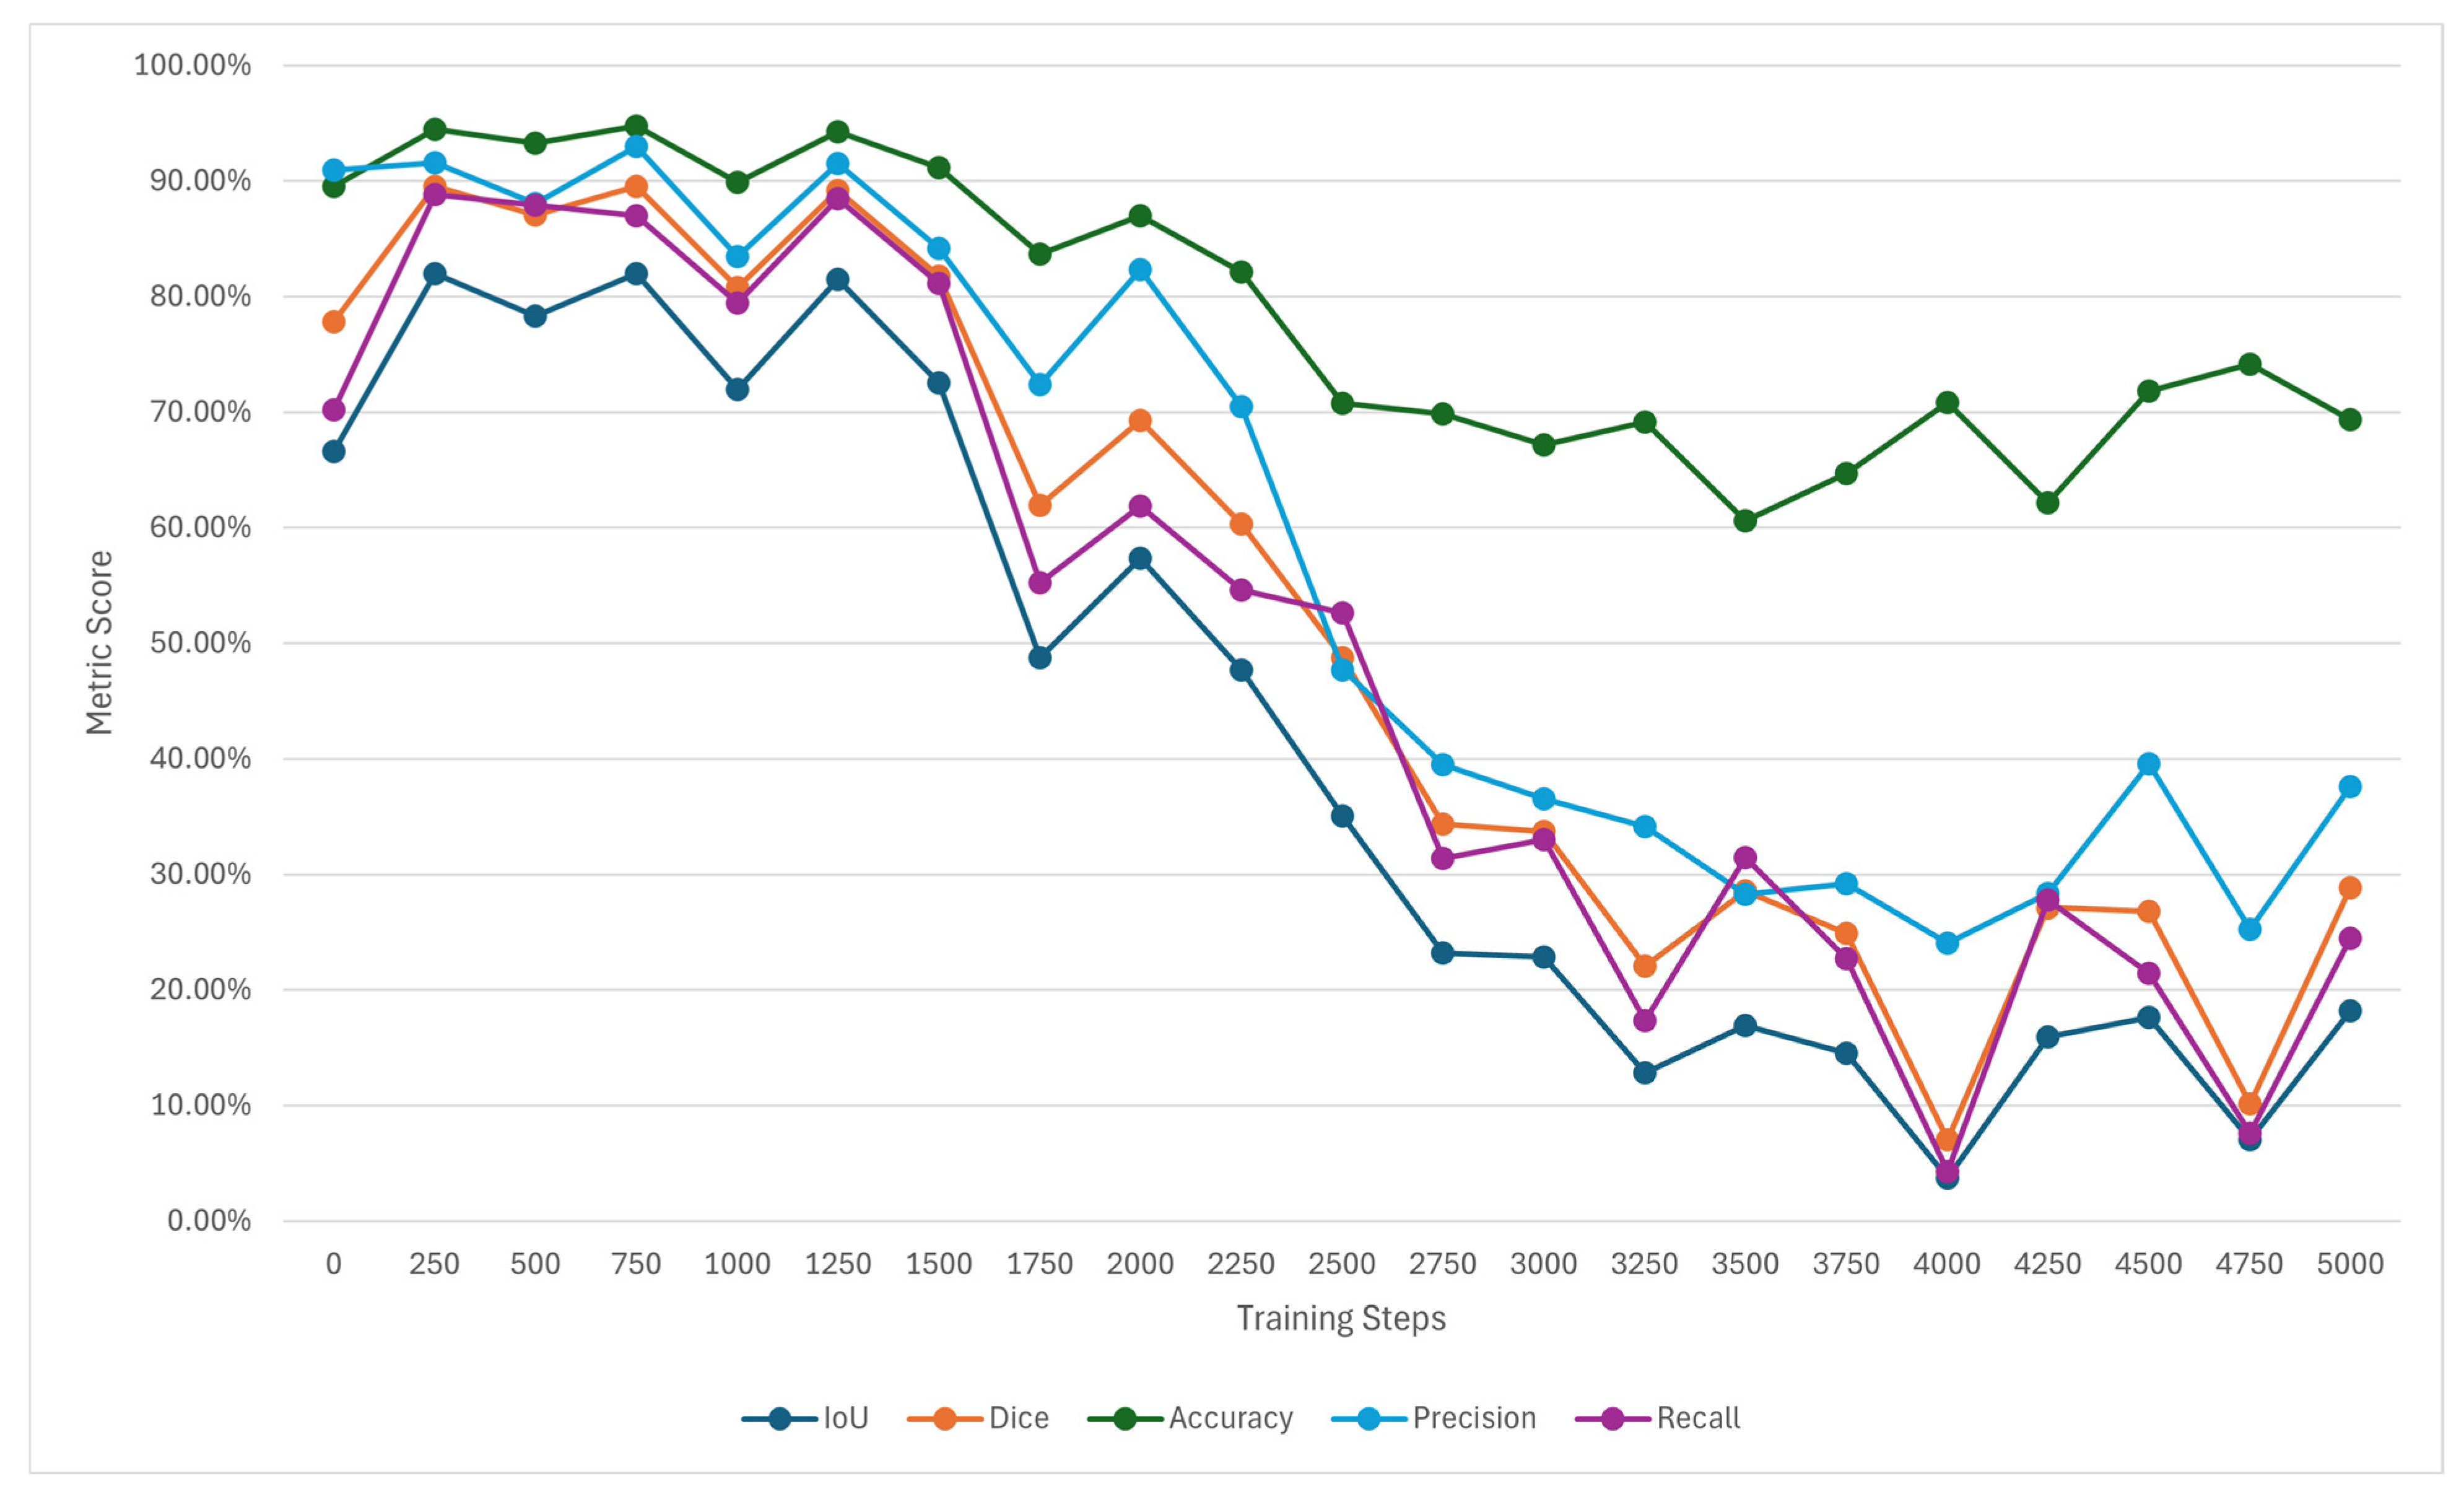
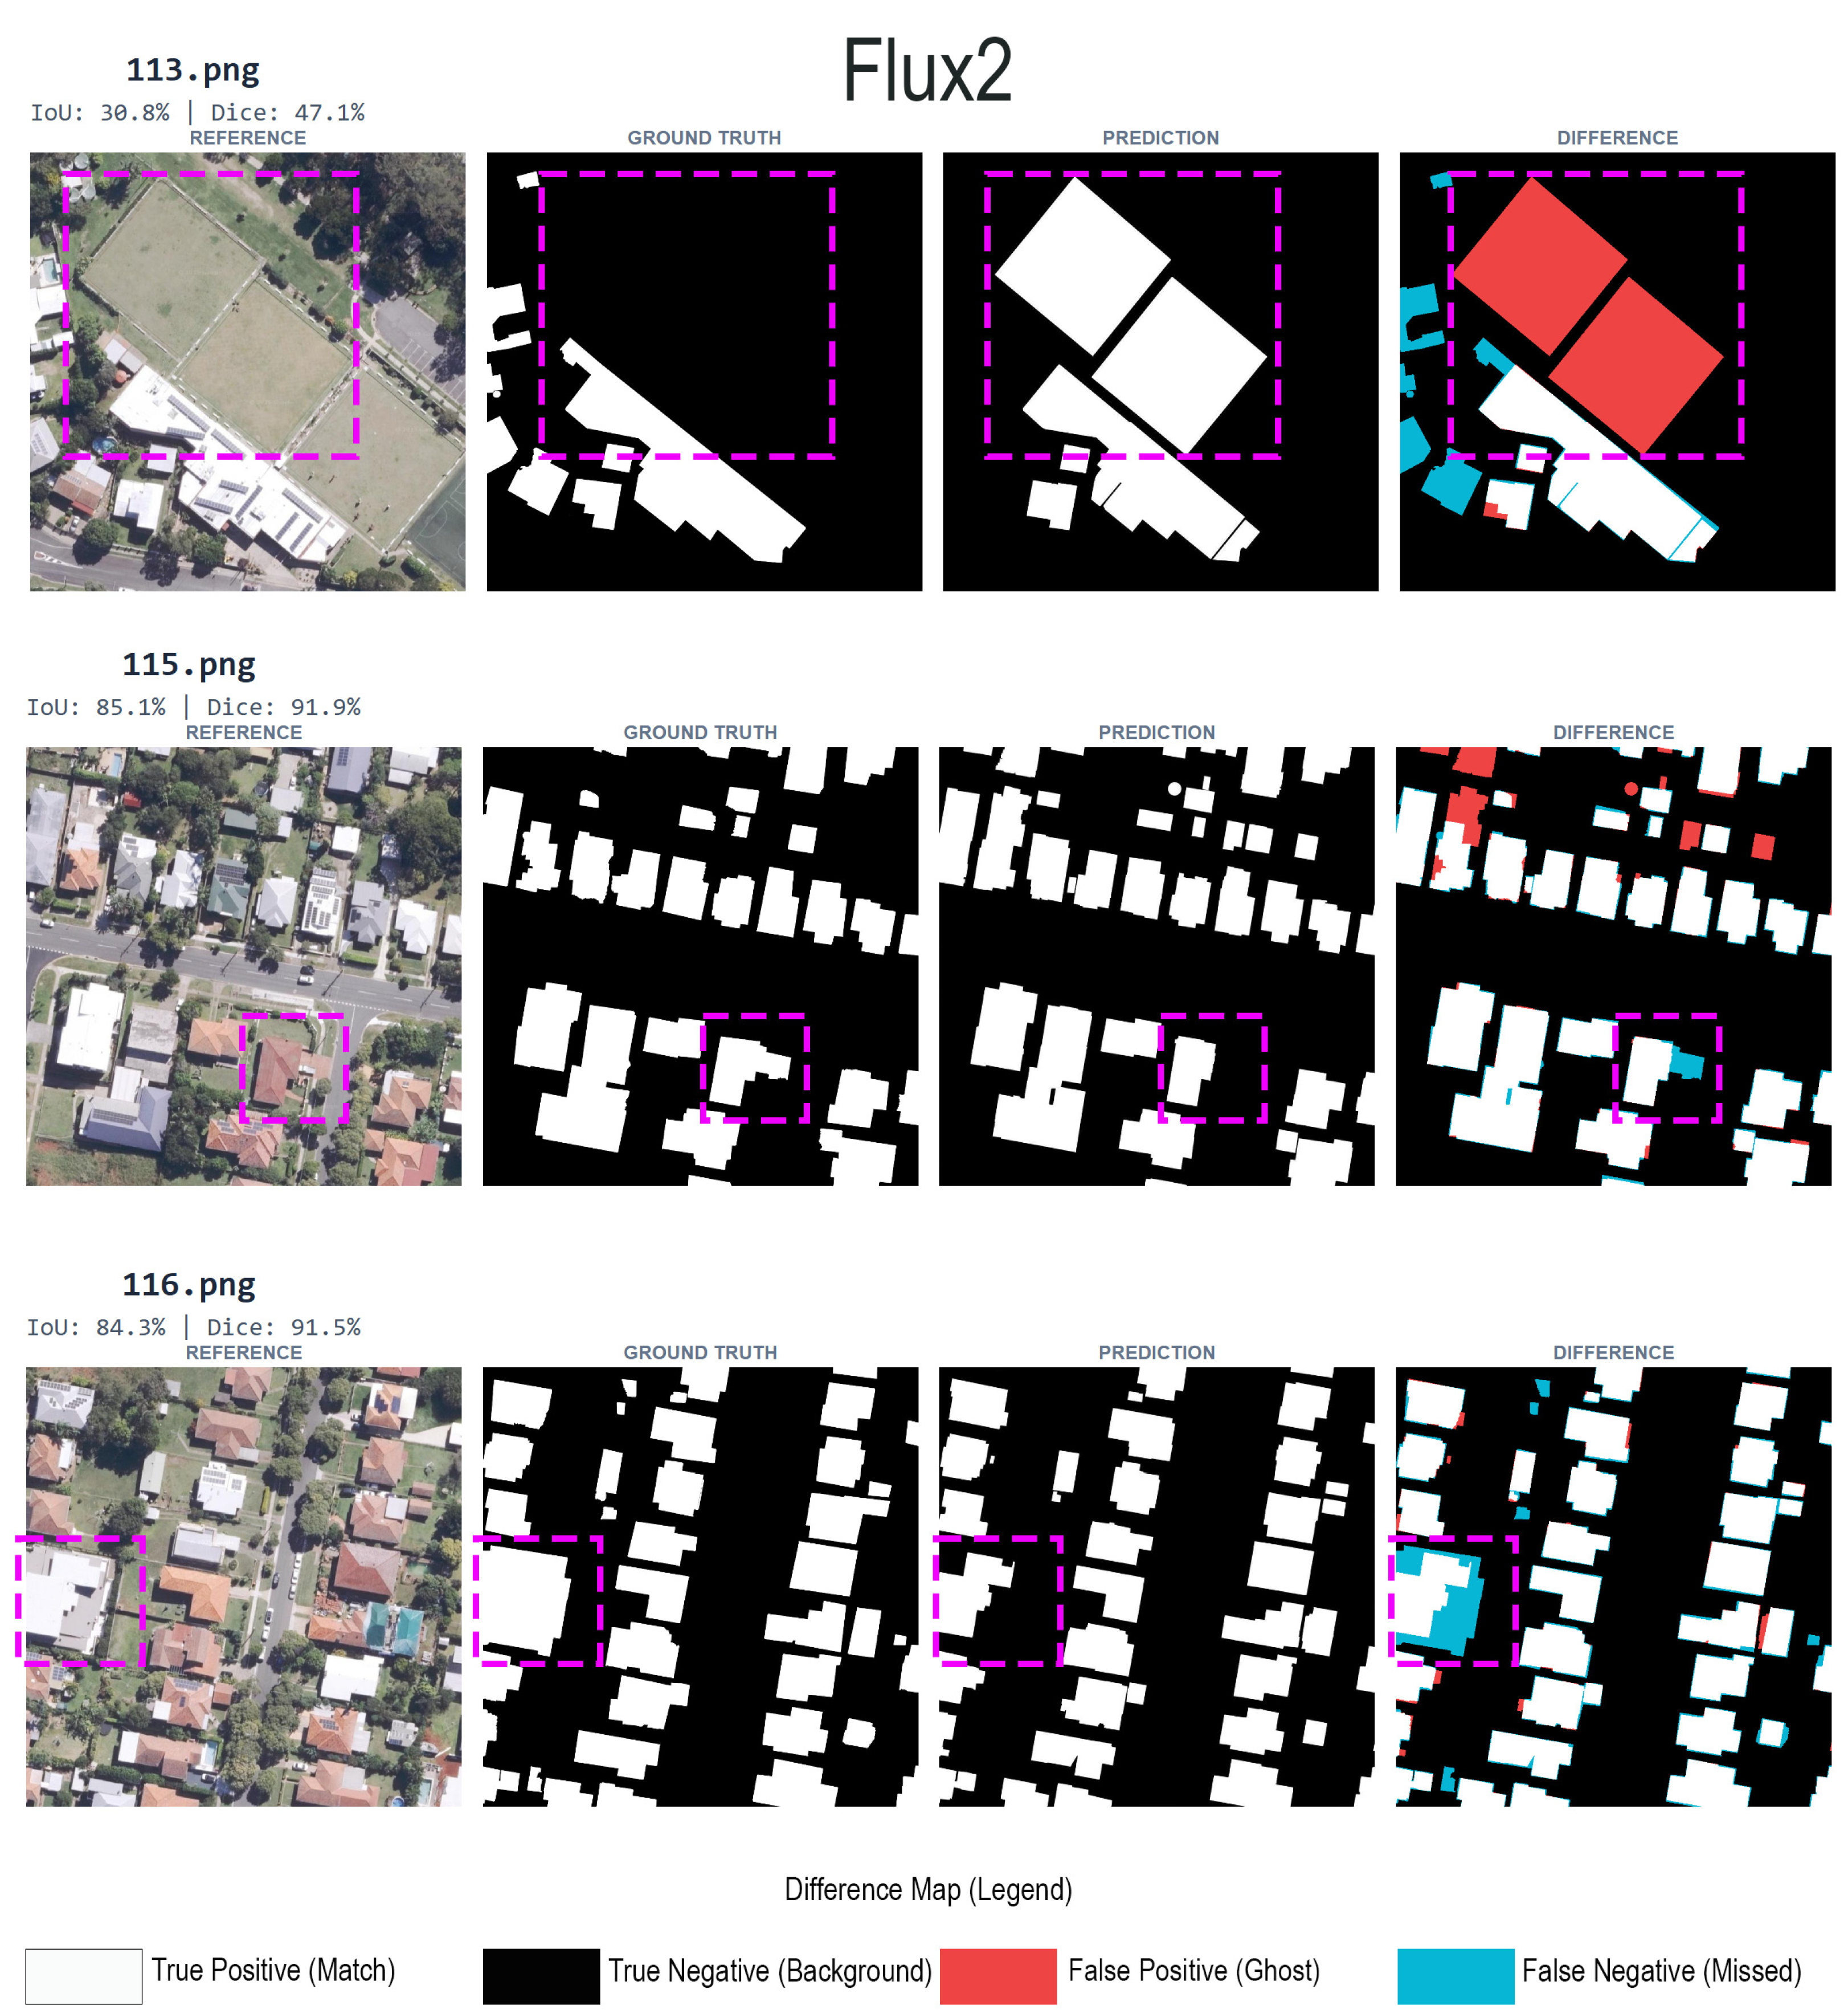
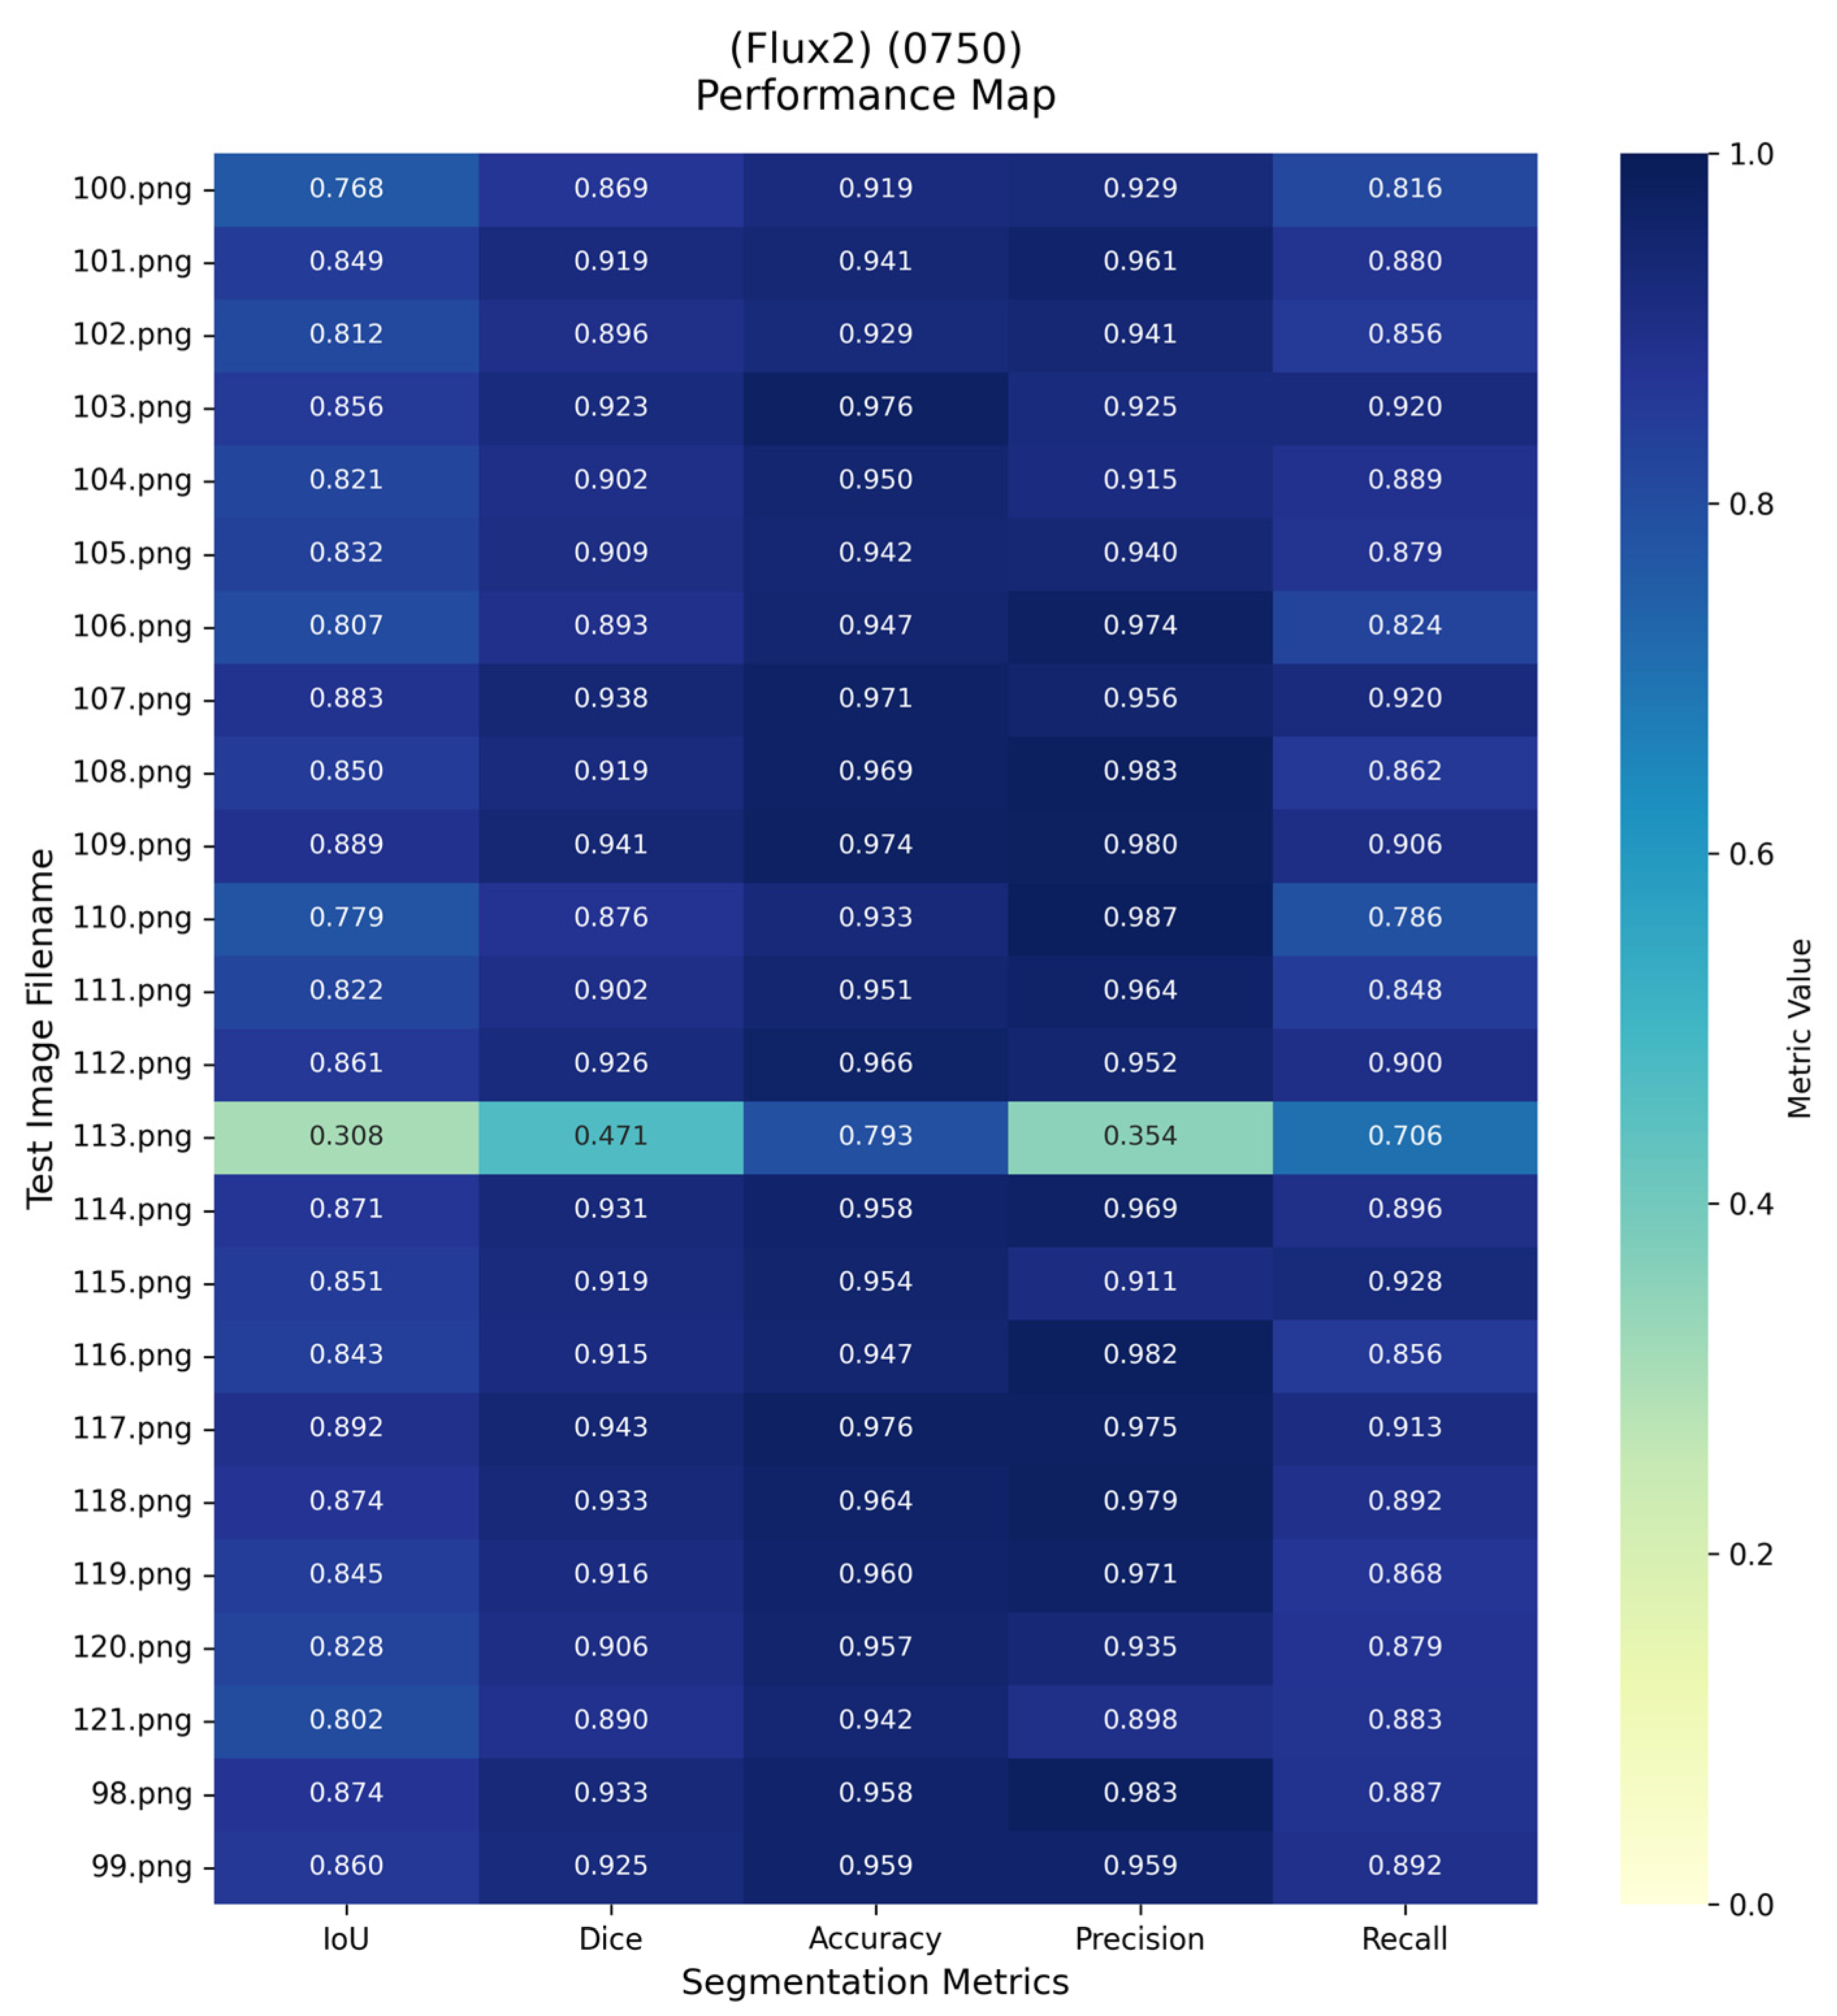
The performance of the FLUX.2 LoRA-adapted model was evaluated across several checkpoints. At the initial checkpoint, the model achieved an IoU of 66.60% and a Dice coefficient of 77.82%, reflecting moderate baseline segmentation performance prior to effective LoRA adaptation. Early training steps led to noticeable improvements, with IoU increasing to 81.99% and Dice to 89.55%, accompanied by improved precision 91.55%, and recall 88.86%. This phase indicates successful short-term adaptation of the diffusion backbone to rooftop segmentation Figure 12. Performance degradation after step 750 is attributed to catastrophic forgetting in the low-rank matrices; an early stopping at step 750 was therefore adopted.
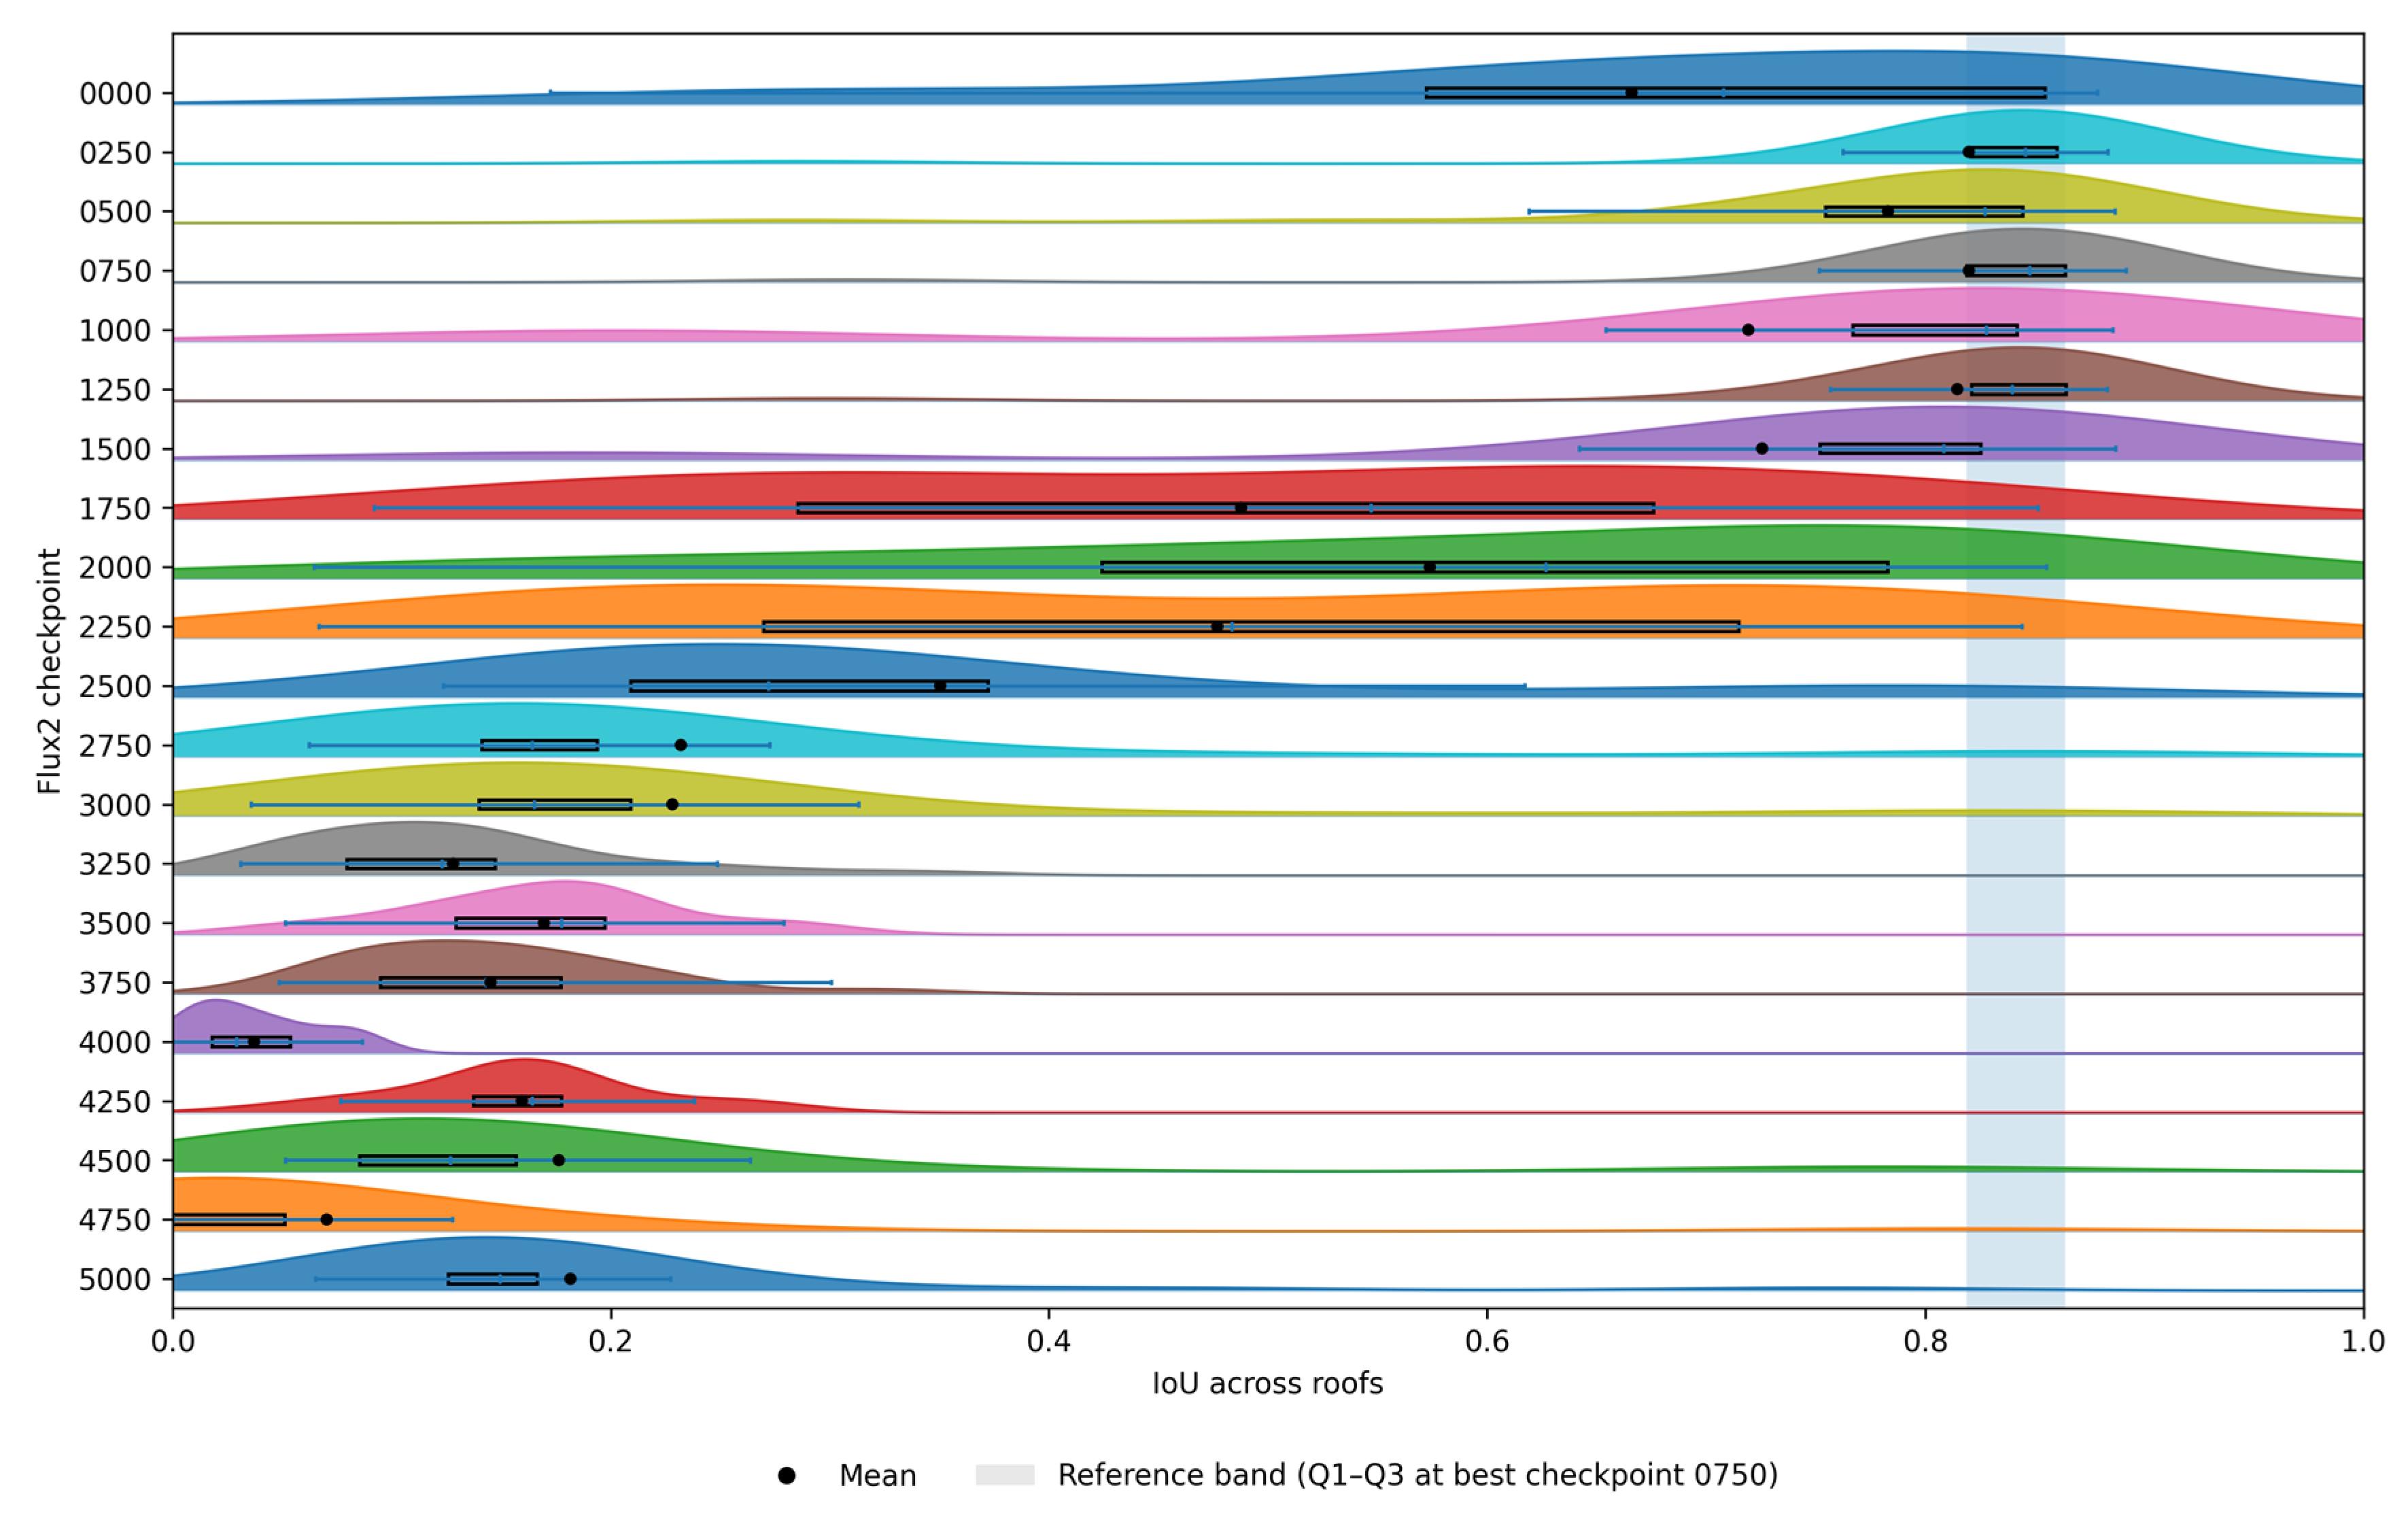
The optimal performance checkpoint was reached at step 750, where the model achieved a mean IoU of 81.99% with an SD = 11.38% and a Dice score of 89.55% across the test dataset Figure 13. At this checkpoint, pixel accuracy was 94.73%, with precision and recall values of 93.02% and 87.02%, respectively. The corresponding MAE was 0.0534, and false positive and false negative rates remained balanced. By the final training stage, IoU dropped below 20%, indicating instability and reduced generalisation under prolonged training.
The confusion matrix statistics further confirm this trend. While true positive (TP) counts peaked early in training, false negatives (FN) increased at later checkpoints, reflecting the model’s inability to retain learned rooftop representations as training progressed. Precision remained moderate in some late checkpoints, but this was accompanied by critically low recall, resulting in poor overlap-based metrics, which will be discussed further in the discussion Section 5.
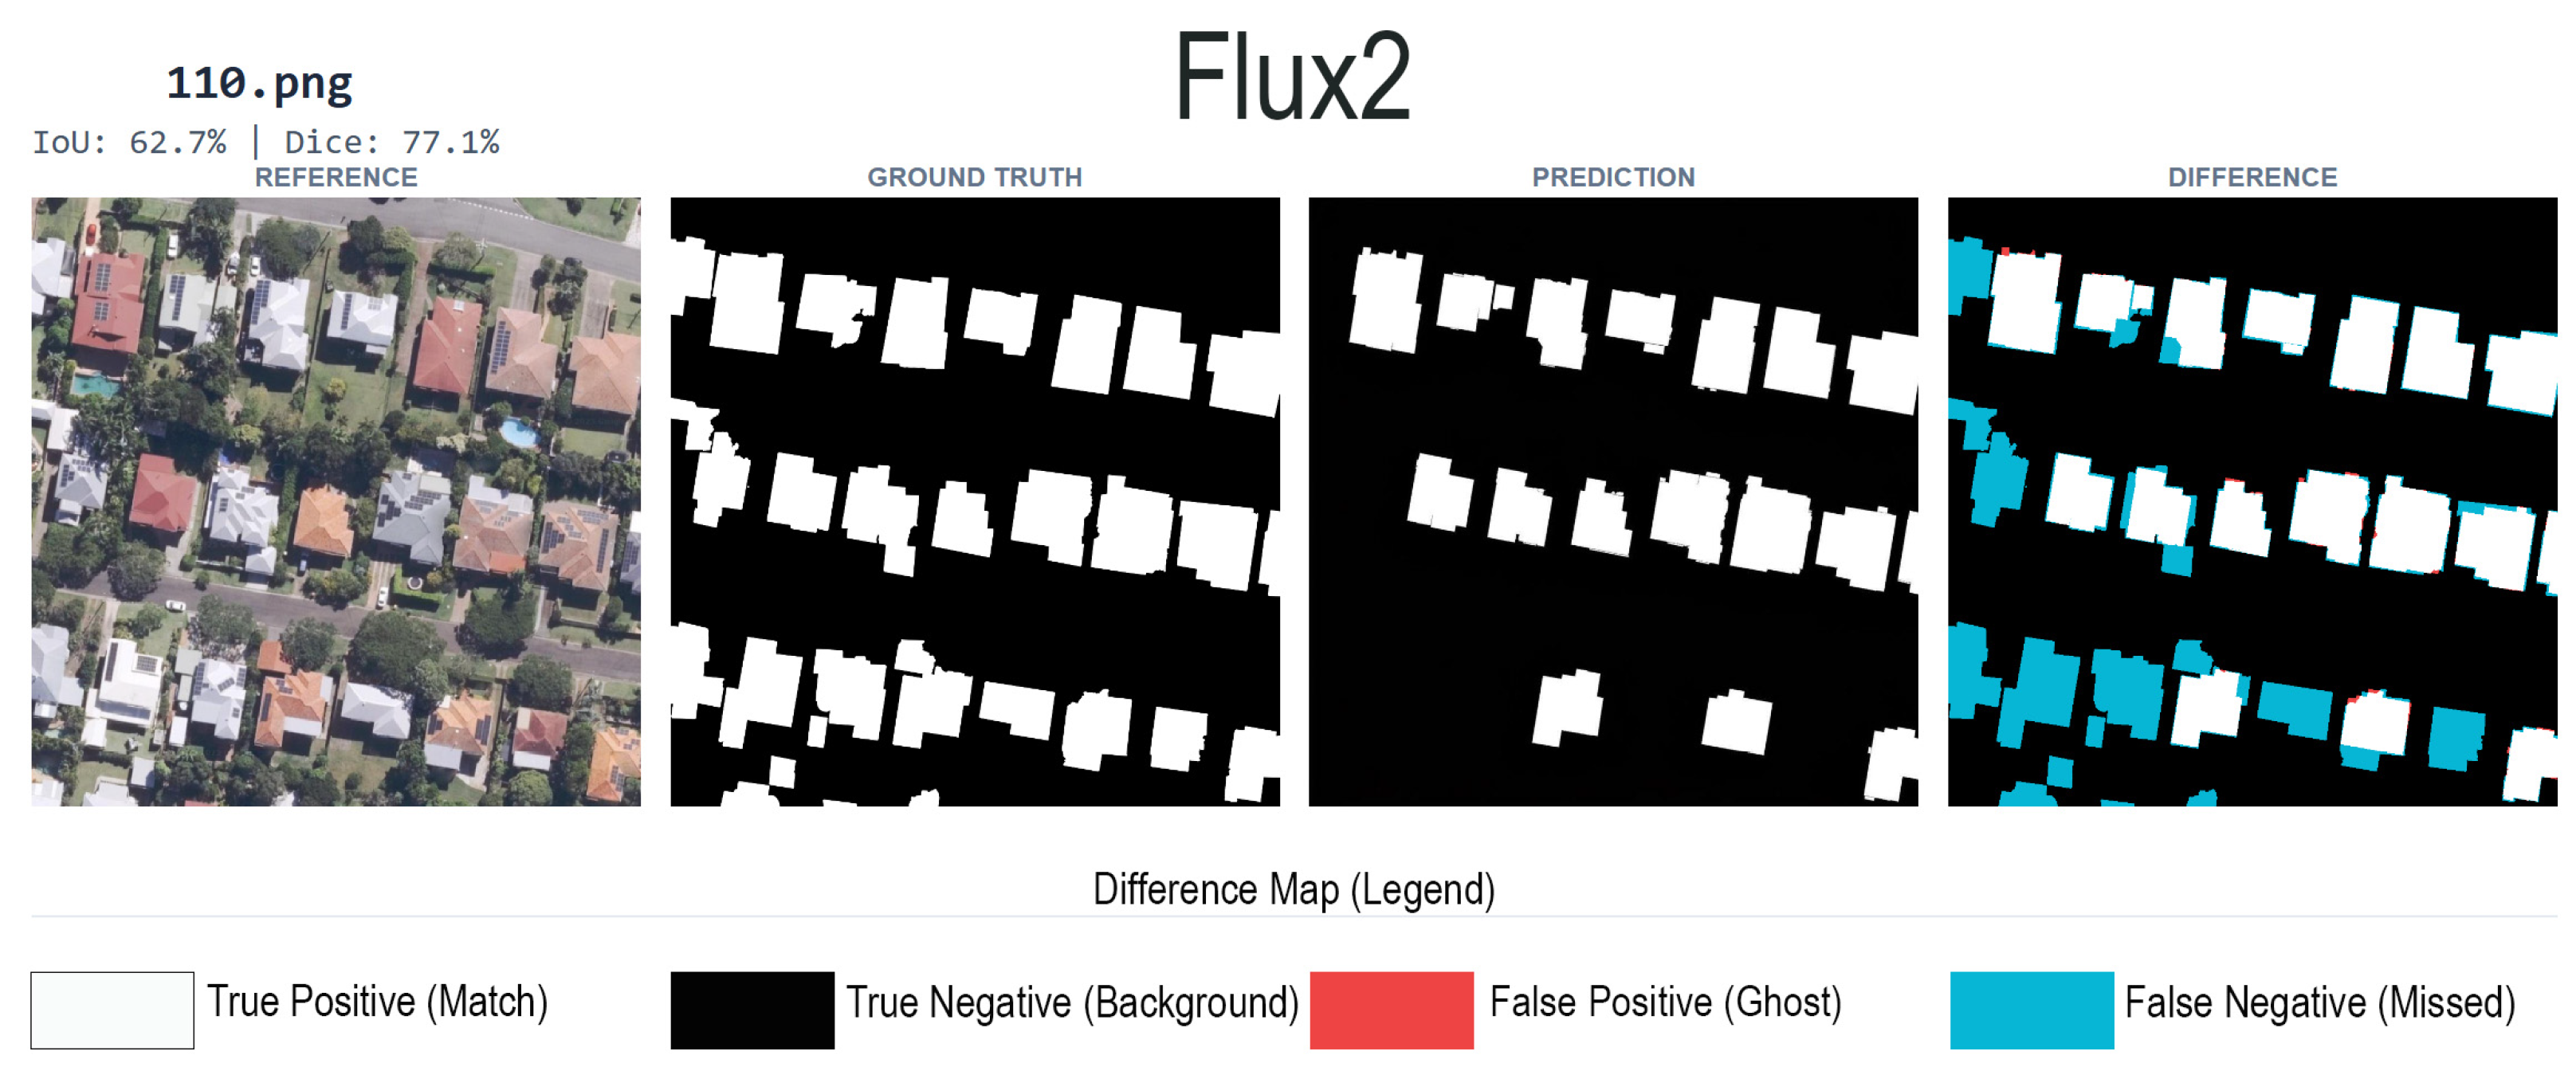
Also, Figure 14 complements the checkpoint mean curves by reporting per-roof IoU distributions across FLUX.2 training checkpoints, including the mean marker and interquartile range. This distribution-level view indicates whether apparent gains reflect consistent improvements across rooftops or are driven by a subset of instances. In FLUX.2, dispersion increases and a longer low-IoU tail emerges at later checkpoints, which is consistent with the observed reduction in overlap-based metrics under prolonged training and motivates selecting an early stopping point for comparative evaluation.

4.2.3. Performance of Qwen Image Edit 2509 Pipeline

The performance of the Qwen LoRA-adapted model demonstrated a structured learning trajectory consisting of an initial adaptation phase, rapid performance improvement, and stable convergence, which is summarised in Figure 15.
At the initial training stage, the model exhibited limited segmentation capability, reflecting weak spatial agreement between predicted rooftop masks and the ground-truth annotations. This behaviour is consistent with an unadapted diffusion backbone prior to task-specific fine-tuning. However, substantial gains were observed during the early-to-mid training phase, where IoU increased to 66.45% and Dice to 77.43%, accompanied by simultaneous improvements to 74.39% precision and 84.78% recall. These results indicate that the LoRA adaptation enabled the model to learn dominant rooftop structures and boundaries rapidly.
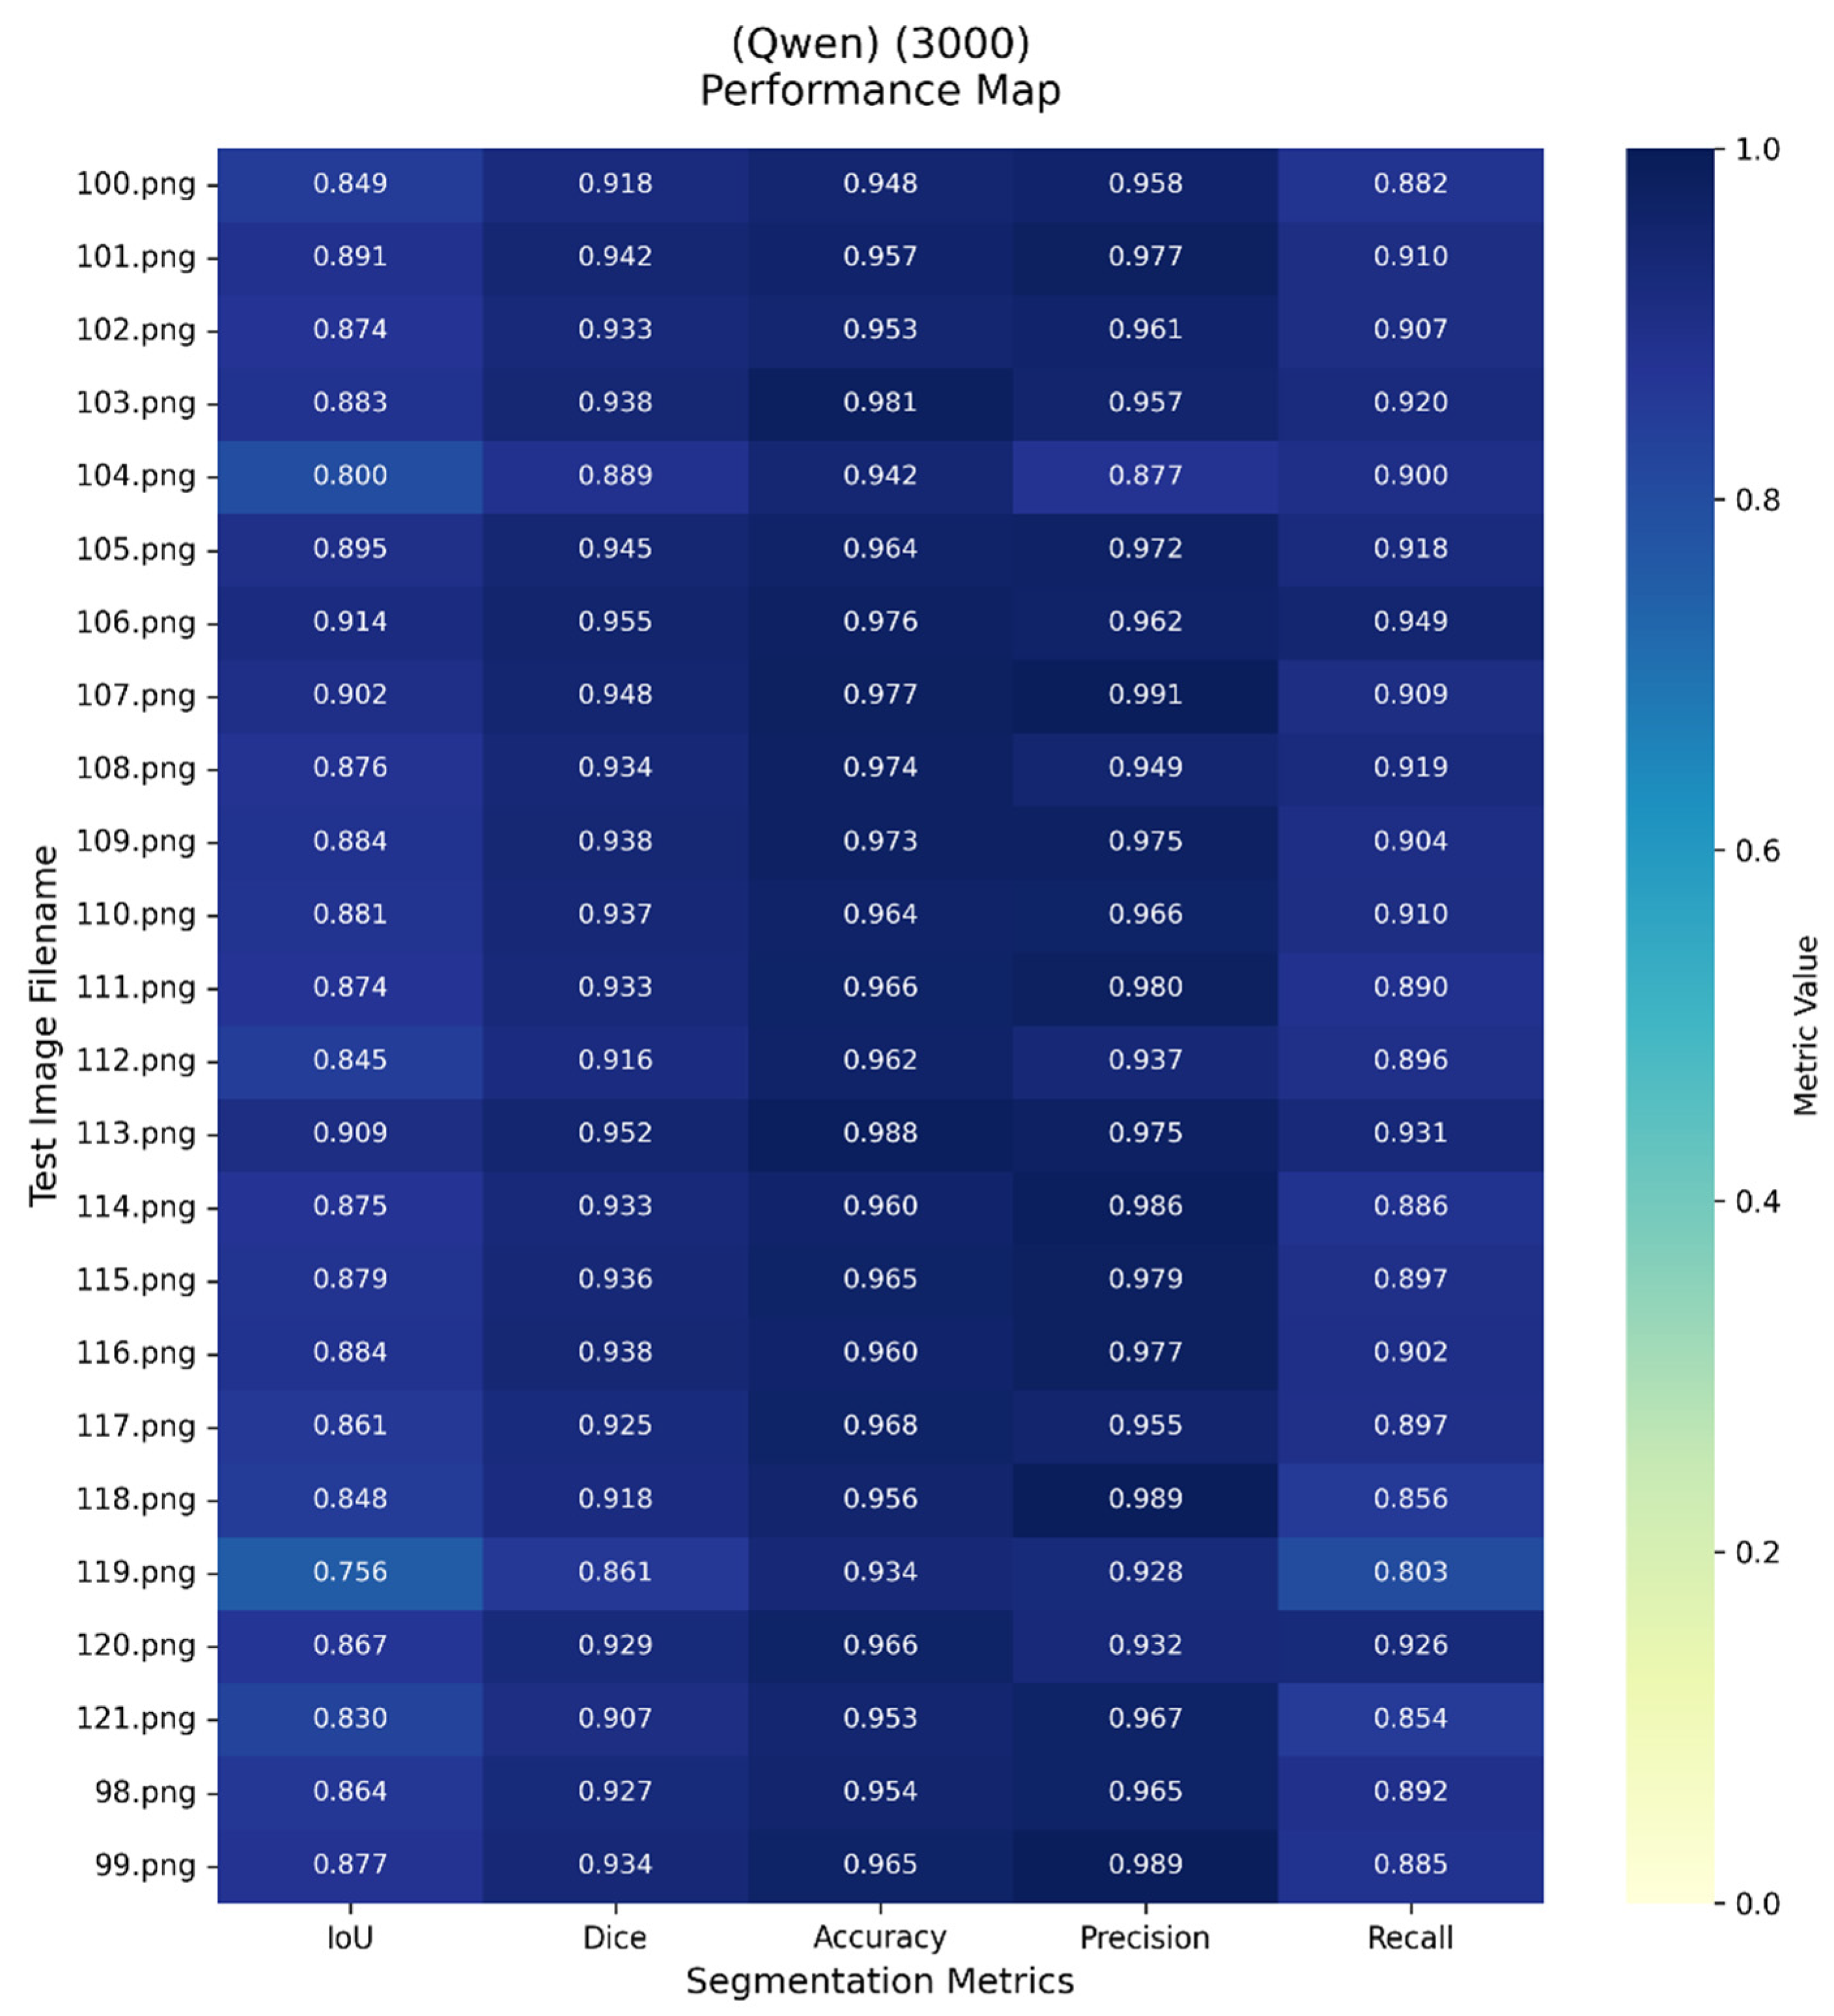
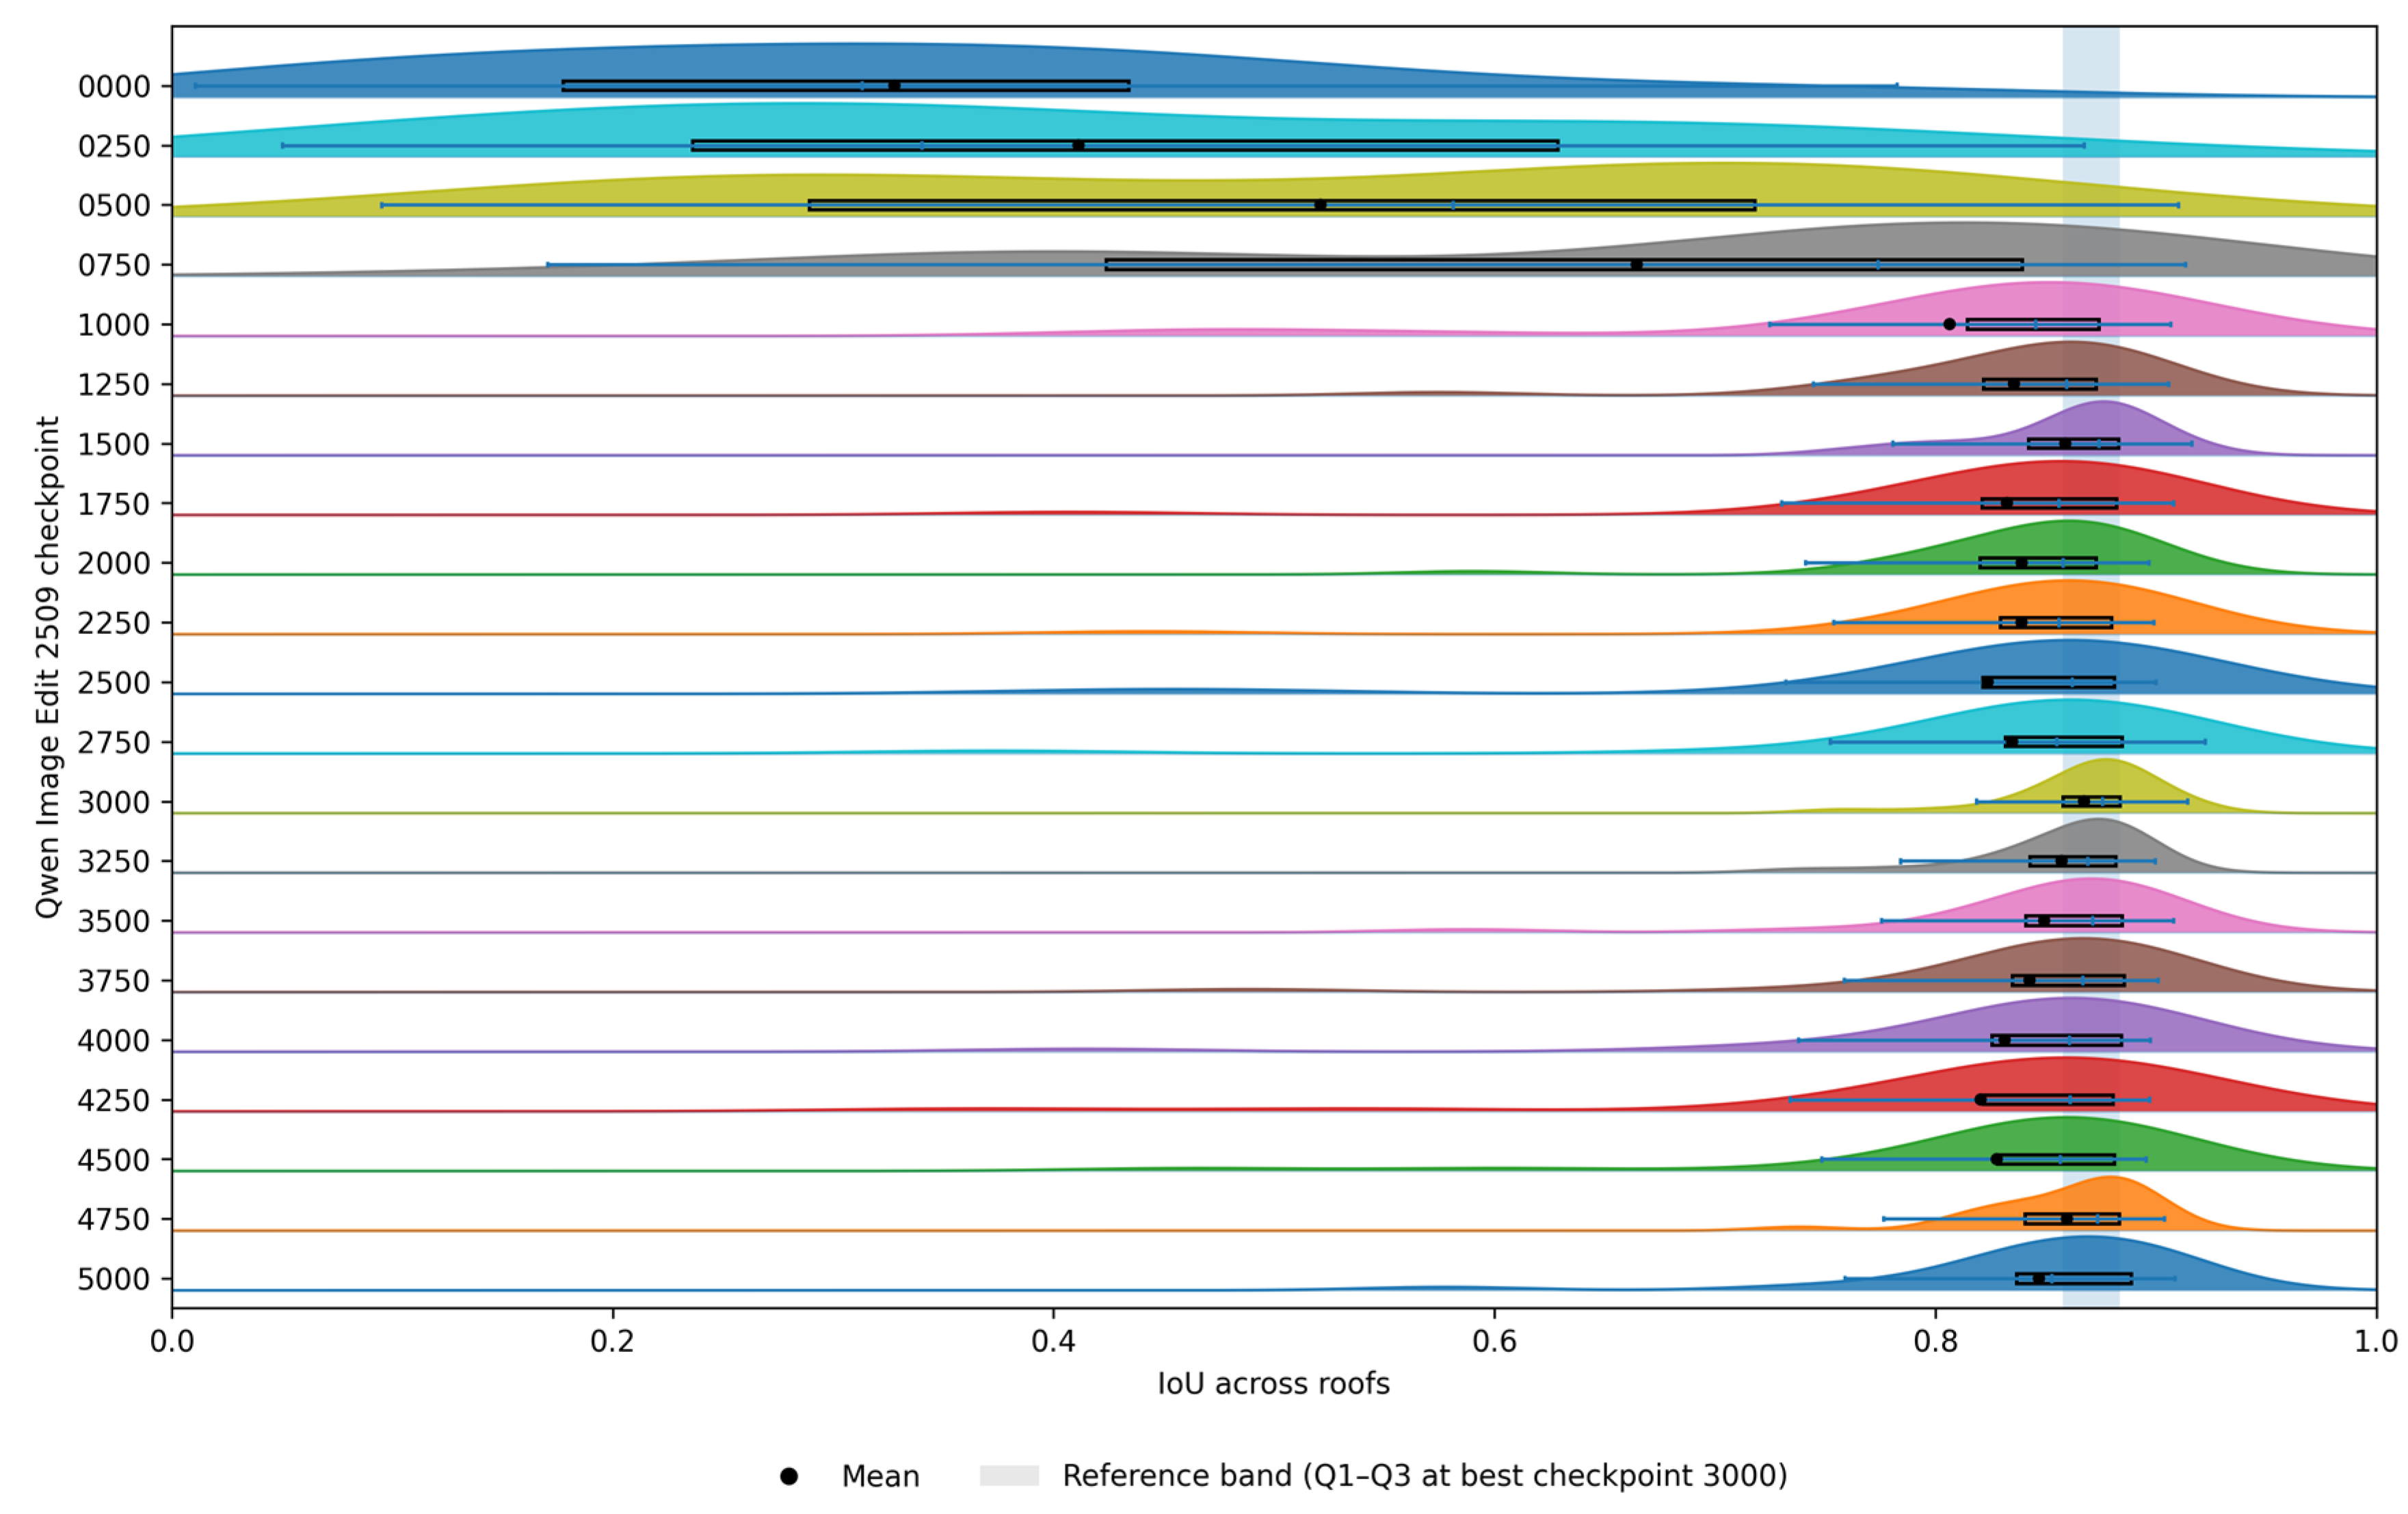
The Qwen Image Edit LoRA model reached its highest segmentation accuracy at an intermediate checkpoint of 3000 steps. At this stage, the model achieved a mean IoU of 86.74% with a standard deviation of 3.46% across the test dataset, and a Dice coefficient of 92.86%, with a pixel accuracy of 96.28%. Precision and recall were 96.26% and 89.76%, respectively, while MAE was 3.78%, with low false positive and false negative rates (Figure 16).
Figure 17 provides a distribution-level stability analysis for Qwen Image Edit 2509 by summarising per-roof IoU densities across fine-tuning checkpoints. Across training, the distributions shift towards higher overlap values and become more concentrated at later checkpoints, supporting the selection of the optimal checkpoint at step 3000 and indicating improved consistency across rooftops under LoRA adaptation.
Beyond the optimal checkpoint, performance remained relatively stable, with only minor fluctuations across subsequent training steps. IoU values consistently exceeded 82%, Dice scores remained close to or above 90%, and MAE values stayed below 0.05, suggesting that the model maintained segmentation quality without evident overfitting. False positive and false negative rates also remained balanced during this phase, supporting consistent rooftop delineation across diverse urban scenes. The Qwen LoRA model demonstrates a training behaviour similar in structure to FLUX Kontext but with slightly lower peak accuracy, while clearly outperforming FLUX.2 in terms of convergence stability and sustained performance.

4.3. Cross-Model Performance Comparison

This comparison consolidates the quantitative results obtained from all evaluated segmentation approaches, including zero-shot editing-based diffusion models, the segmentation-first baseline (SAM3), and LoRA-adapted diffusion models. By bringing these results together under a unified evaluation protocol, the section provides a direct performance comparison across modelling paradigms.

4.3.1. The Impact of Mask Polarity on Metric Reliability

To quantify the effect of class polarity on segmentation evaluation, all models were assessed under two conditions: (A) background as positive (black buildings) and (B) rooftop as positive (white buildings). Table 5 reports the resulting IoU scores for both configurations, together with the absolute performance difference between them.
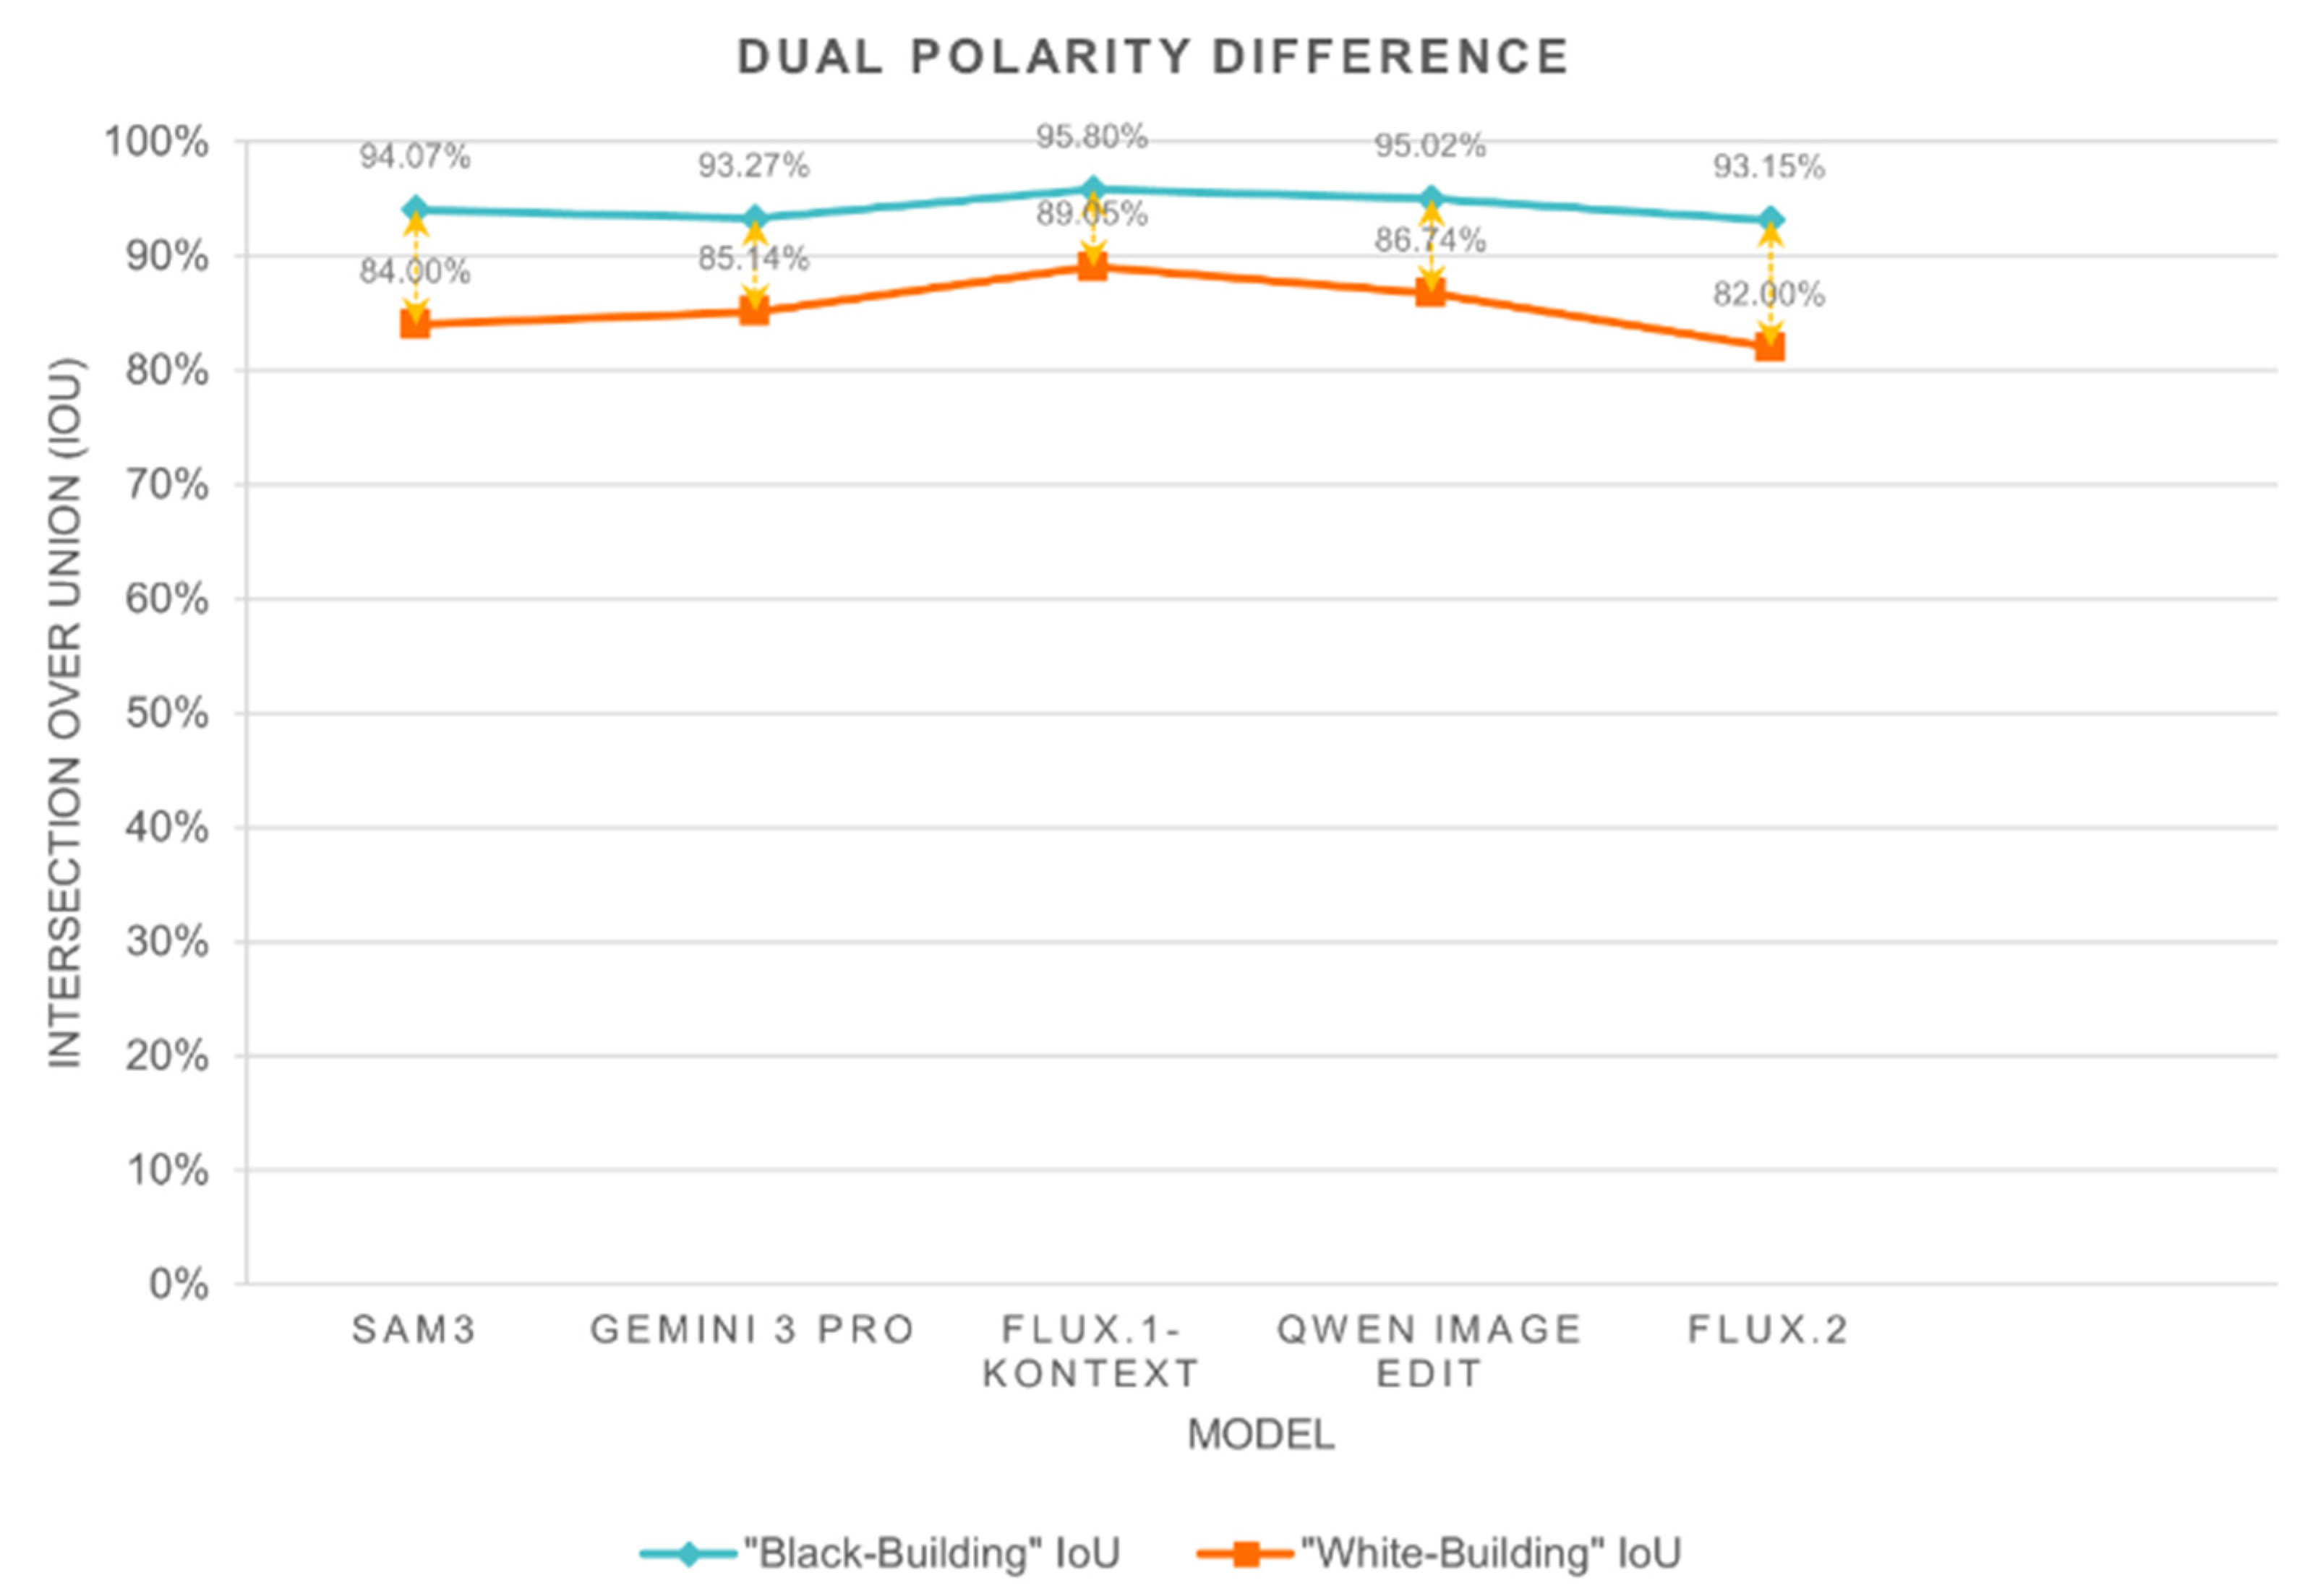
Across all evaluated architectures, treating the background as the positive class led to systematically higher IoU values. The observed increase ranged from 6.7% to 11.6%, depending on the model. For example, Qwen Image Edit achieved an IoU of 95.02% under the raw evaluation condition, while the corrected rooftop-positive evaluation yielded an IoU of 86.74%. Similar performance gaps were observed for all other models included in the comparison.
Figure 18 illustrates the comparative IoU trends between the Black-Building and White-Building evaluation configurations across the evaluated architectures. While absolute IoU values varied between models, the polarity-dependent performance gap remained consistent, indicating that metric outcomes are sensitive to the foreground–background encoding used during evaluation.
These results demonstrate that conventional evaluation protocols can yield different quantitative outcomes depending on class polarity, particularly in class-imbalanced urban imagery. Further analysis of the implications of this effect for model comparison and validation is provided in Section 5.

4.3.2. Quantitative Cross-Model Comparison

Across the evaluated metrics, clear performance differences are observed between zero-shot diffusion models, the segmentation-first baseline, and LoRA-adapted diffusion architectures. Zero-shot diffusion models generally exhibited lower spatial overlap with ground-truth rooftop masks, as reflected in reduced IoU and Dice scores and higher false negative rates Figure 19. LoRA-adapted models, by contrast, achieved higher overlap accuracy, improved recall, and lower pixel-level error across the validation set.
Within the LoRA-adapted group, FLUX Kontext achieved the highest segmentation performance, recording the strongest IoU and Dice scores alongside balanced precision and recall, low Mean Absolute Error, and the lowest standard deviation. The Qwen-based LoRA model followed closely, exhibiting competitive overlap metrics and stable error characteristics. The FLUX.2 LoRA model showed clear improvement relative to its zero-shot counterpart but reached a lower peak performance compared with FLUX Kontext and Qwen, particularly in terms of spatial overlap and false negative reduction. Table 6 summarises the best-checkpoint quantitative performance across all evaluated models, including zero-shot diffusion baselines, the segmentation-first SAM3 pipeline, and LoRA-adapted diffusion architectures, where cell colours are normalised independently for each metric column to highlight relative performance differences within the same metric.
When compared with the segmentation-first baseline, SAM3 demonstrated strong and consistent performance, particularly in terms of recall and boundary completeness. However, the best-performing LoRA-adapted diffusion models achieved comparable or higher overlap accuracy, indicating that editing-based diffusion architectures, when appropriately adapted, can match or exceed dedicated segmentation pipelines under the same evaluation protocol.
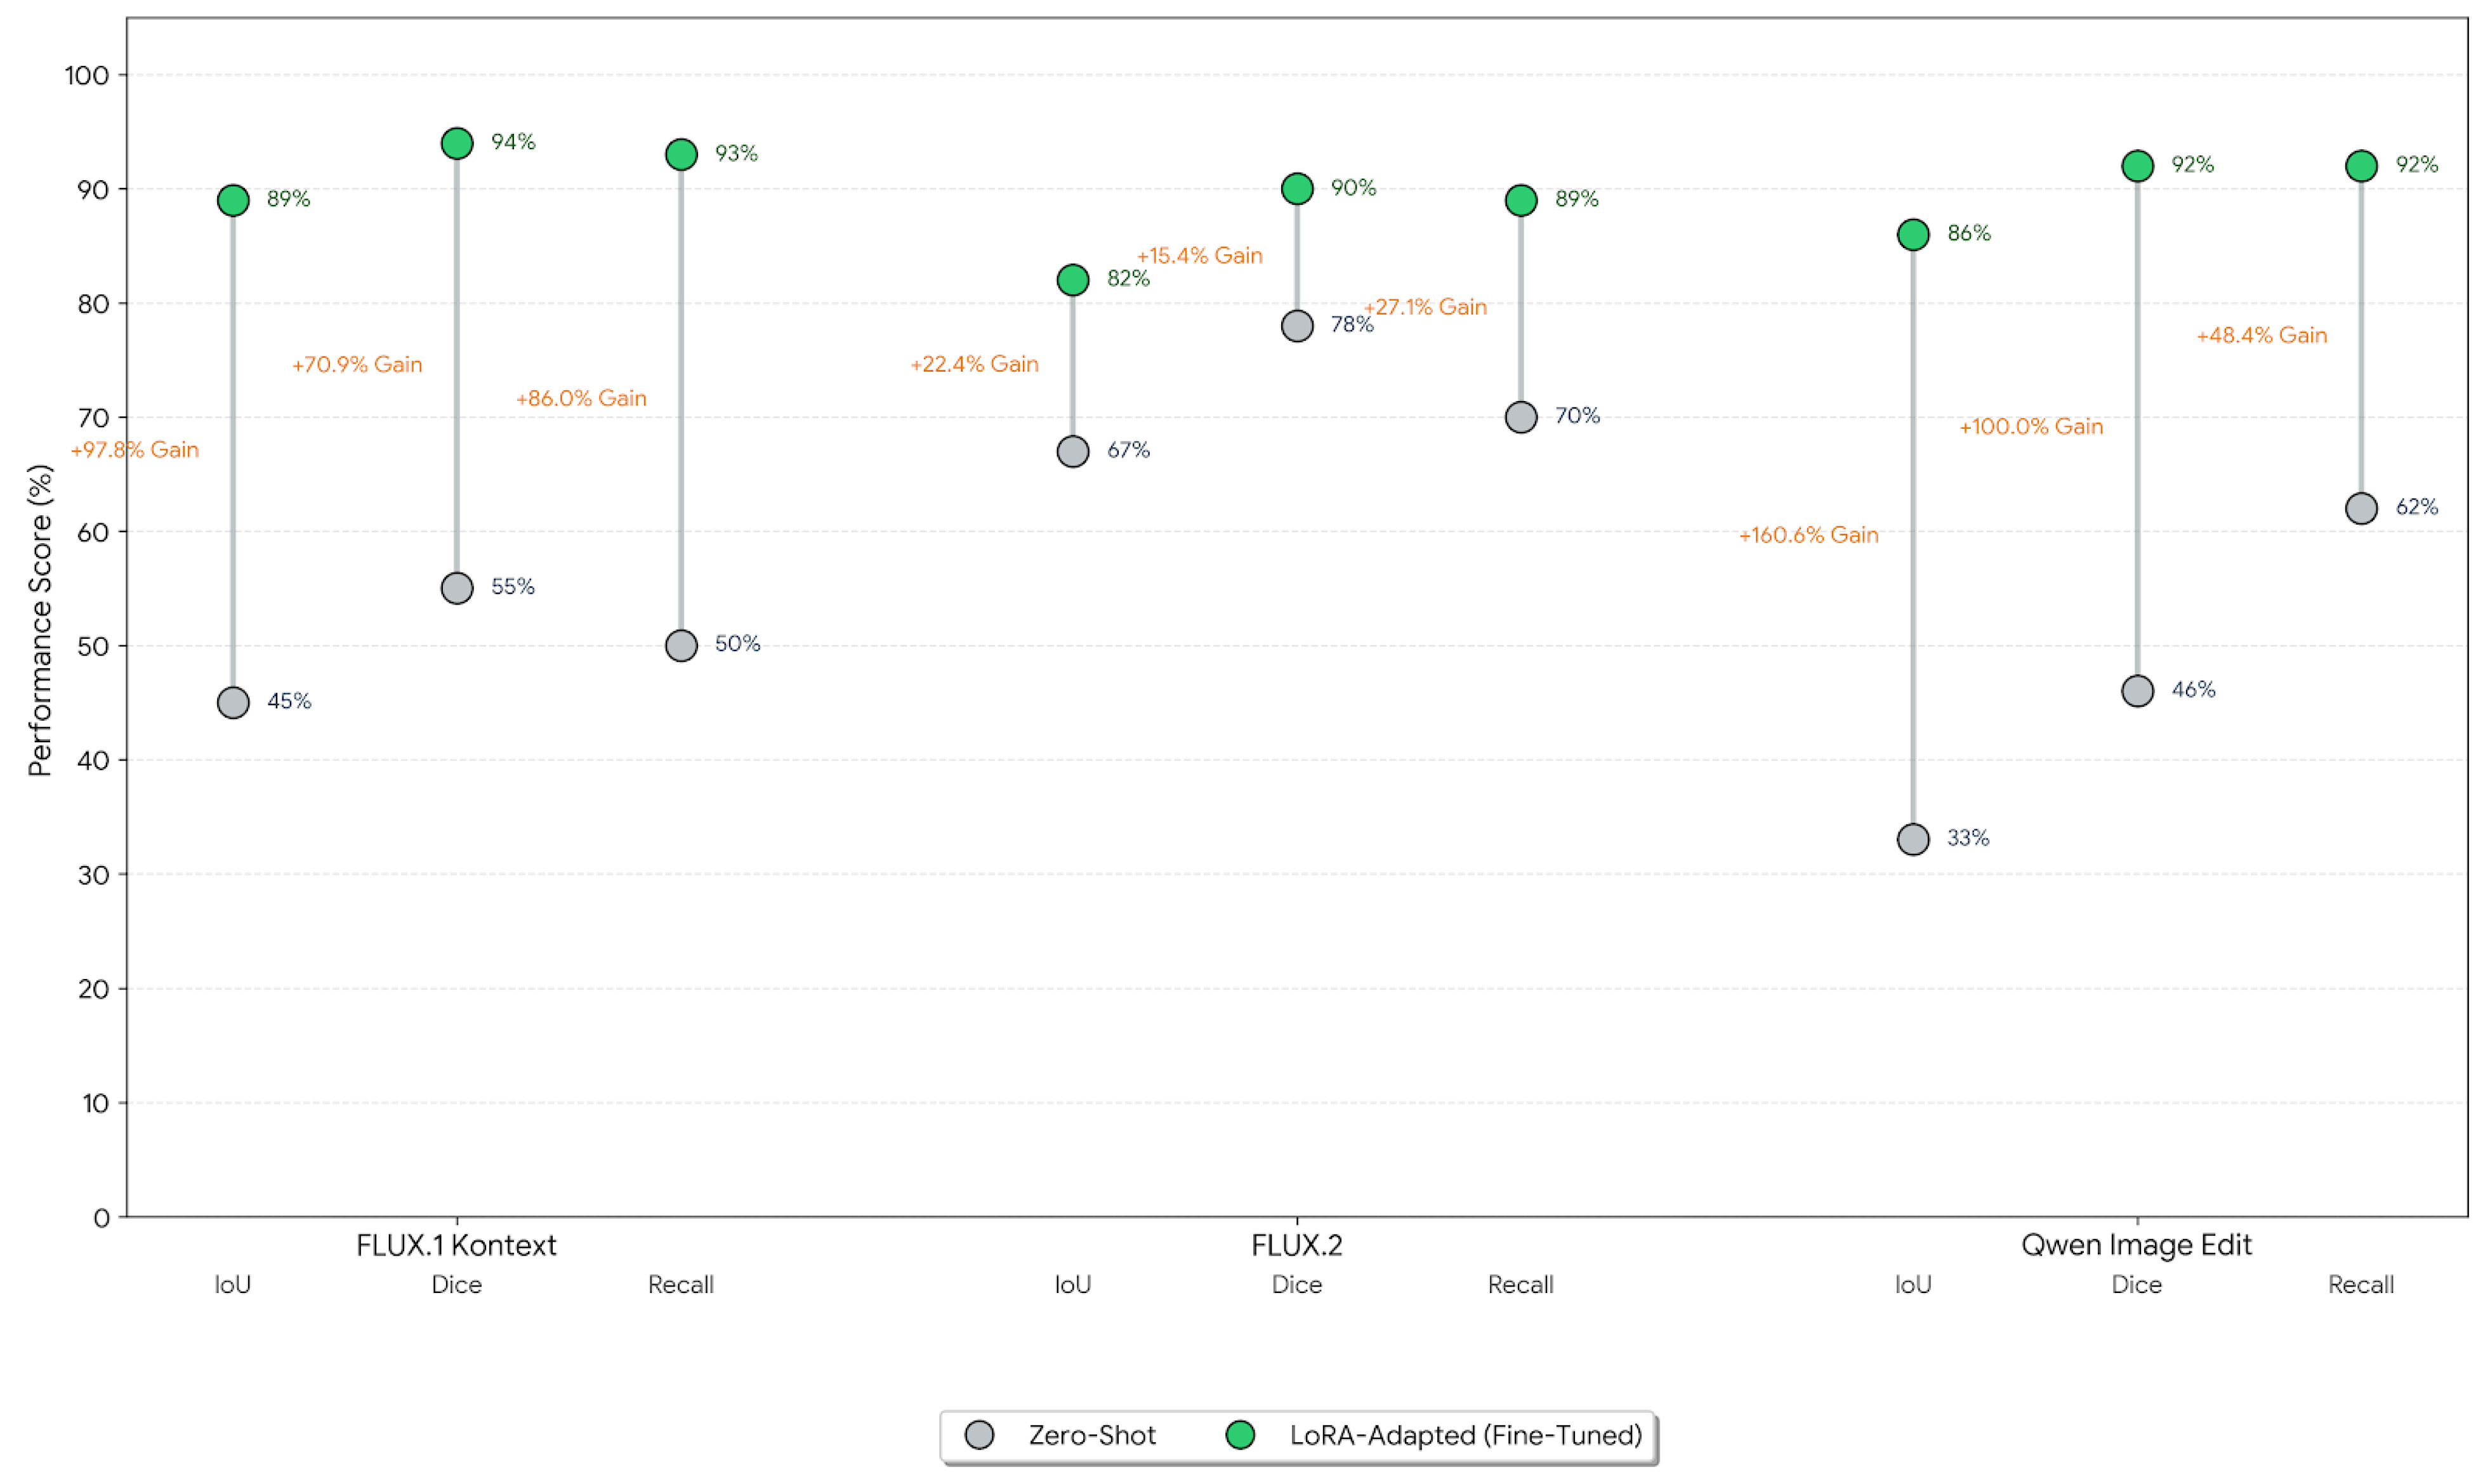
The quantitative results indicate a clear performance hierarchy across model categories, with zero-shot diffusion models exhibiting the weakest performance, followed by FLUX.2 LoRA, Qwen LoRA, and FLUX Kontext LoRA at the upper end. When comparing the Zero-Shot models with the LoRA Fine-Tuned models, there is a noticeable improvement in prediction performance. The Relative performance gains were computed with respect to the zero-shot baseline for each model, as illustrated in Figure 20. This improvement is further illustrated in the next section through representative segmentation examples.

4.3.3. Qualitative Visual Comparison

To qualitatively compare the rooftop segmentation outputs, a representative sample was selected from the validation set to illustrate differences in boundary accuracy, rooftop completeness, and robustness to scene complexity.
Outputs produced by zero-shot diffusion models showed substantial variability across scenes. In many cases, rooftop regions were only partially delineated, with fragmented mask structures and visible activations extending into non-roof areas such as vegetation, roads, and surrounding urban fabric. These characteristics were more pronounced in scenes with dense building arrangements or complex roof geometries.
The segmentation-first SAM3 baseline generated more spatially continuous rooftop masks. Visual inspection indicated broader rooftop coverage with fewer isolated artefacts compared to zero-shot diffusion outputs. However, in some instances, boundary delineation appeared less precise along roof edges adjacent to shadows or neighbouring structures, and minor over-segmentation was observed.
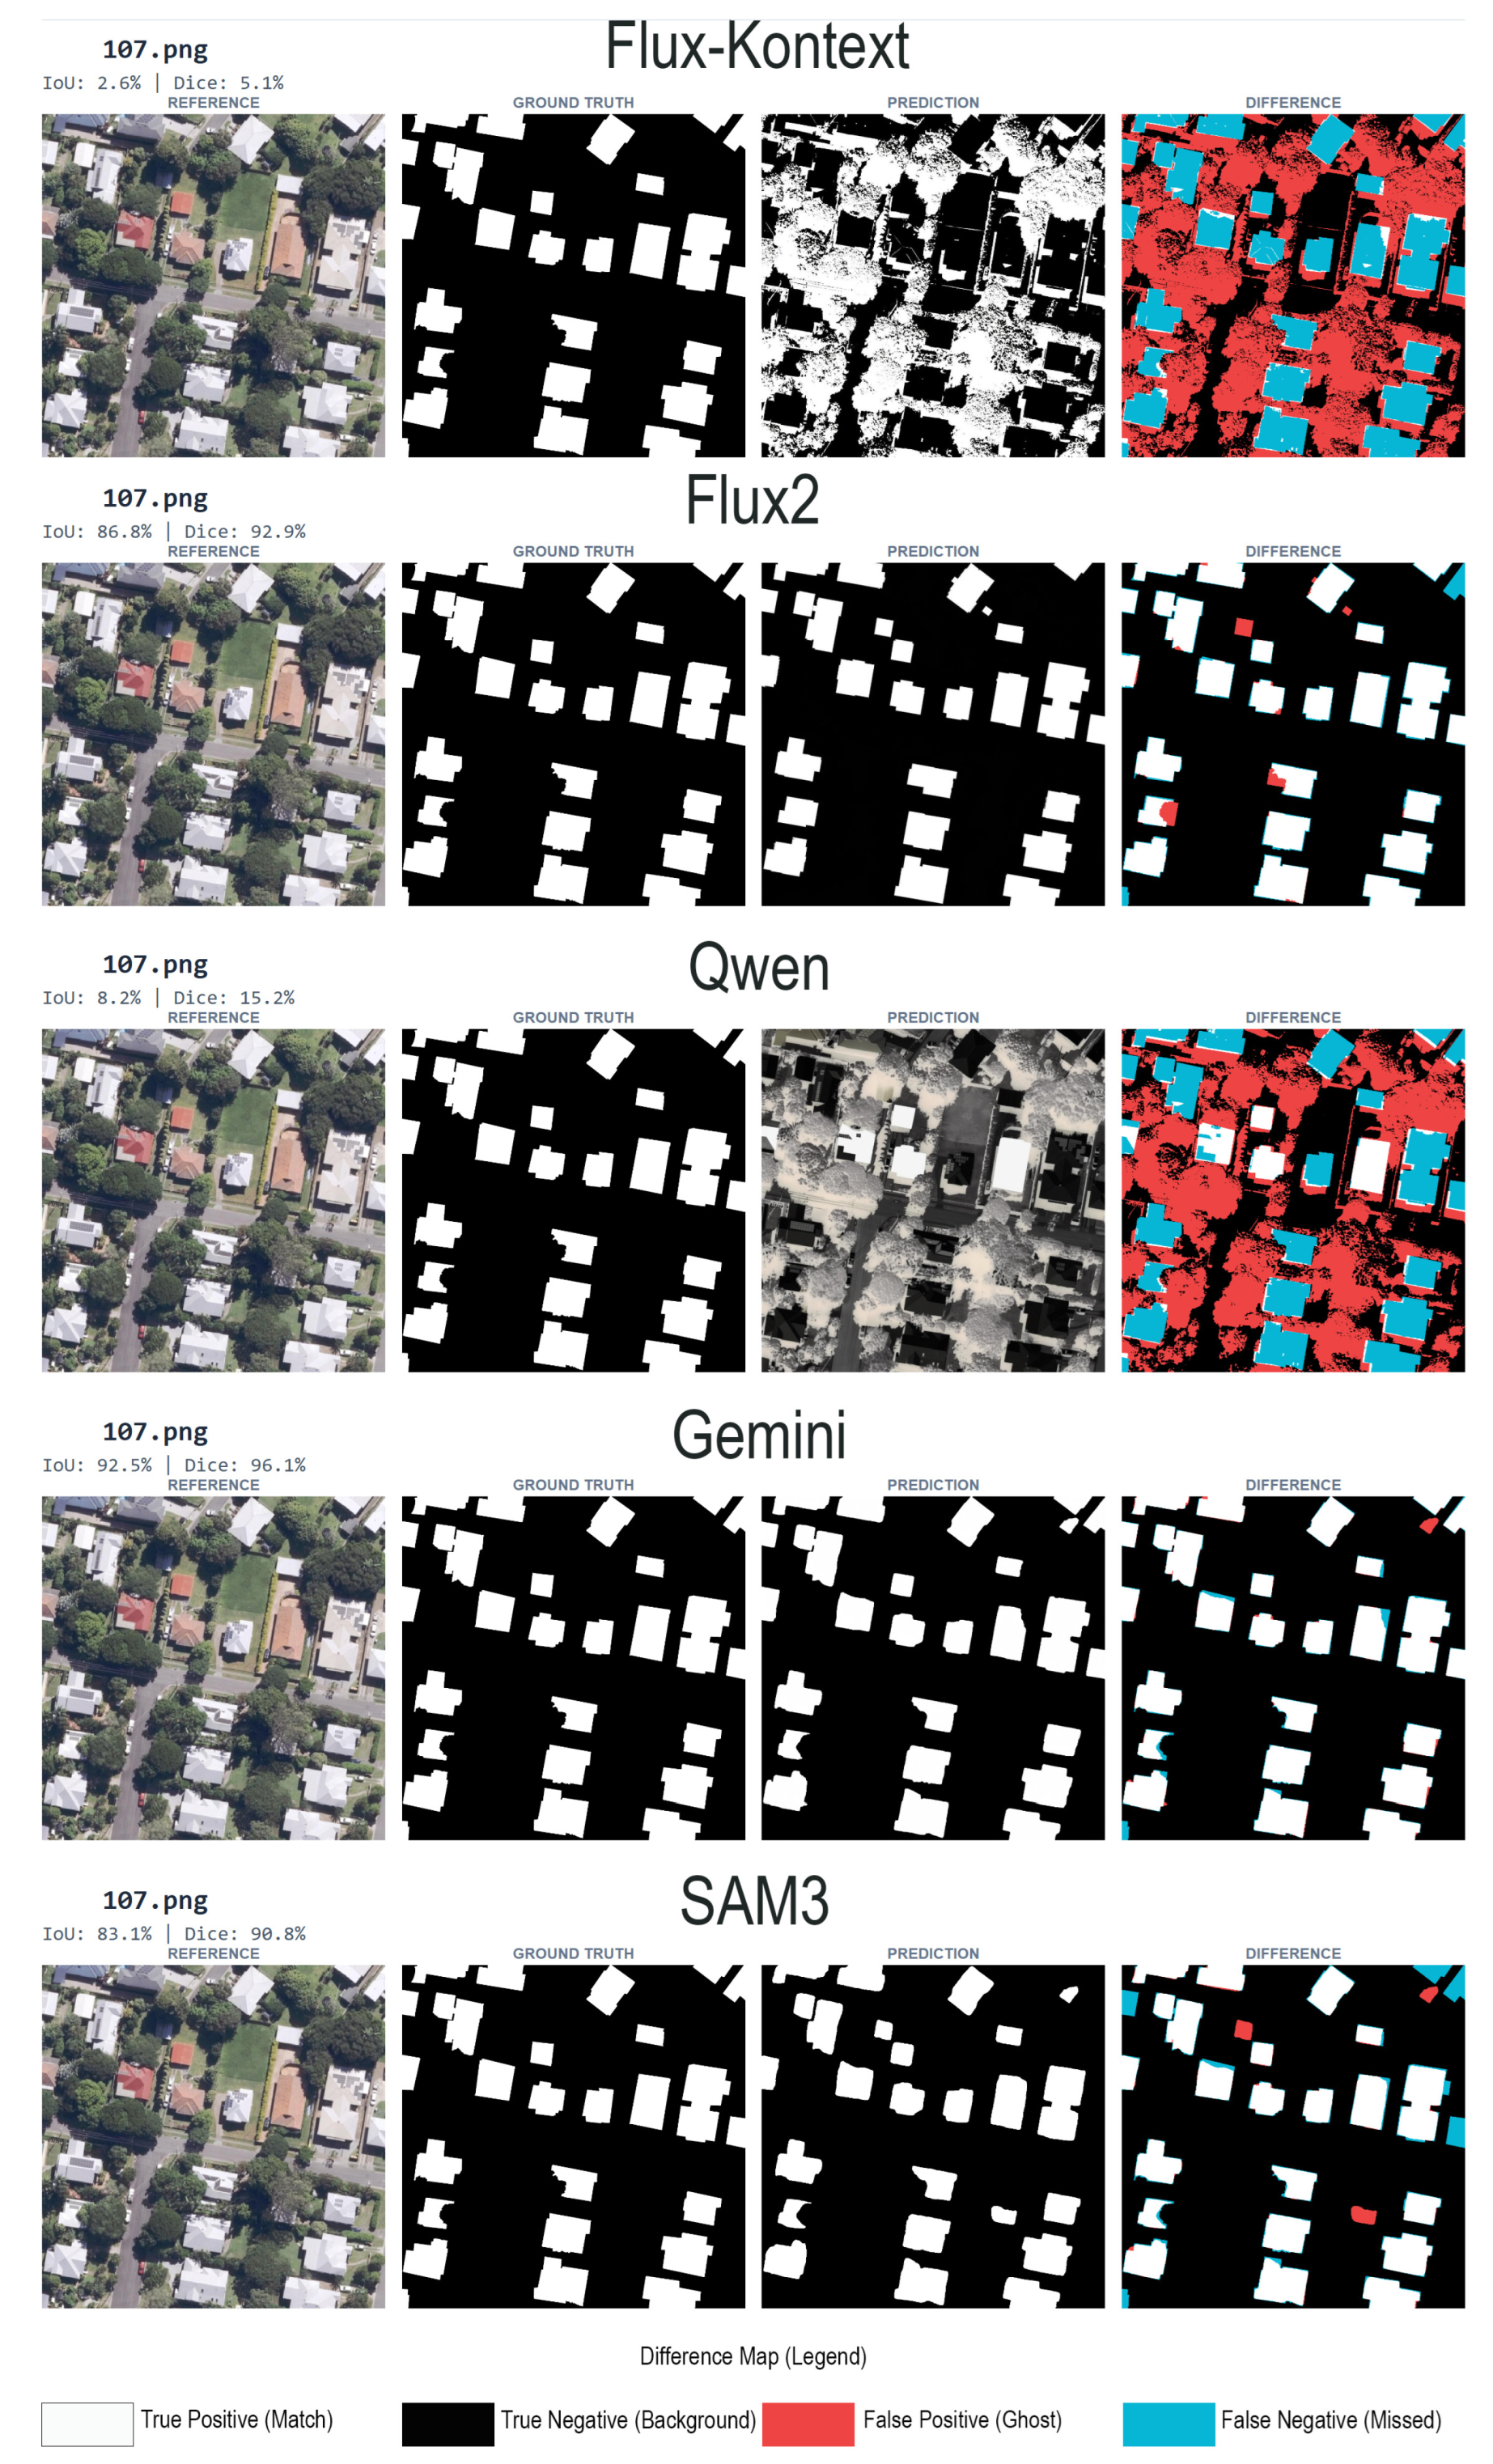
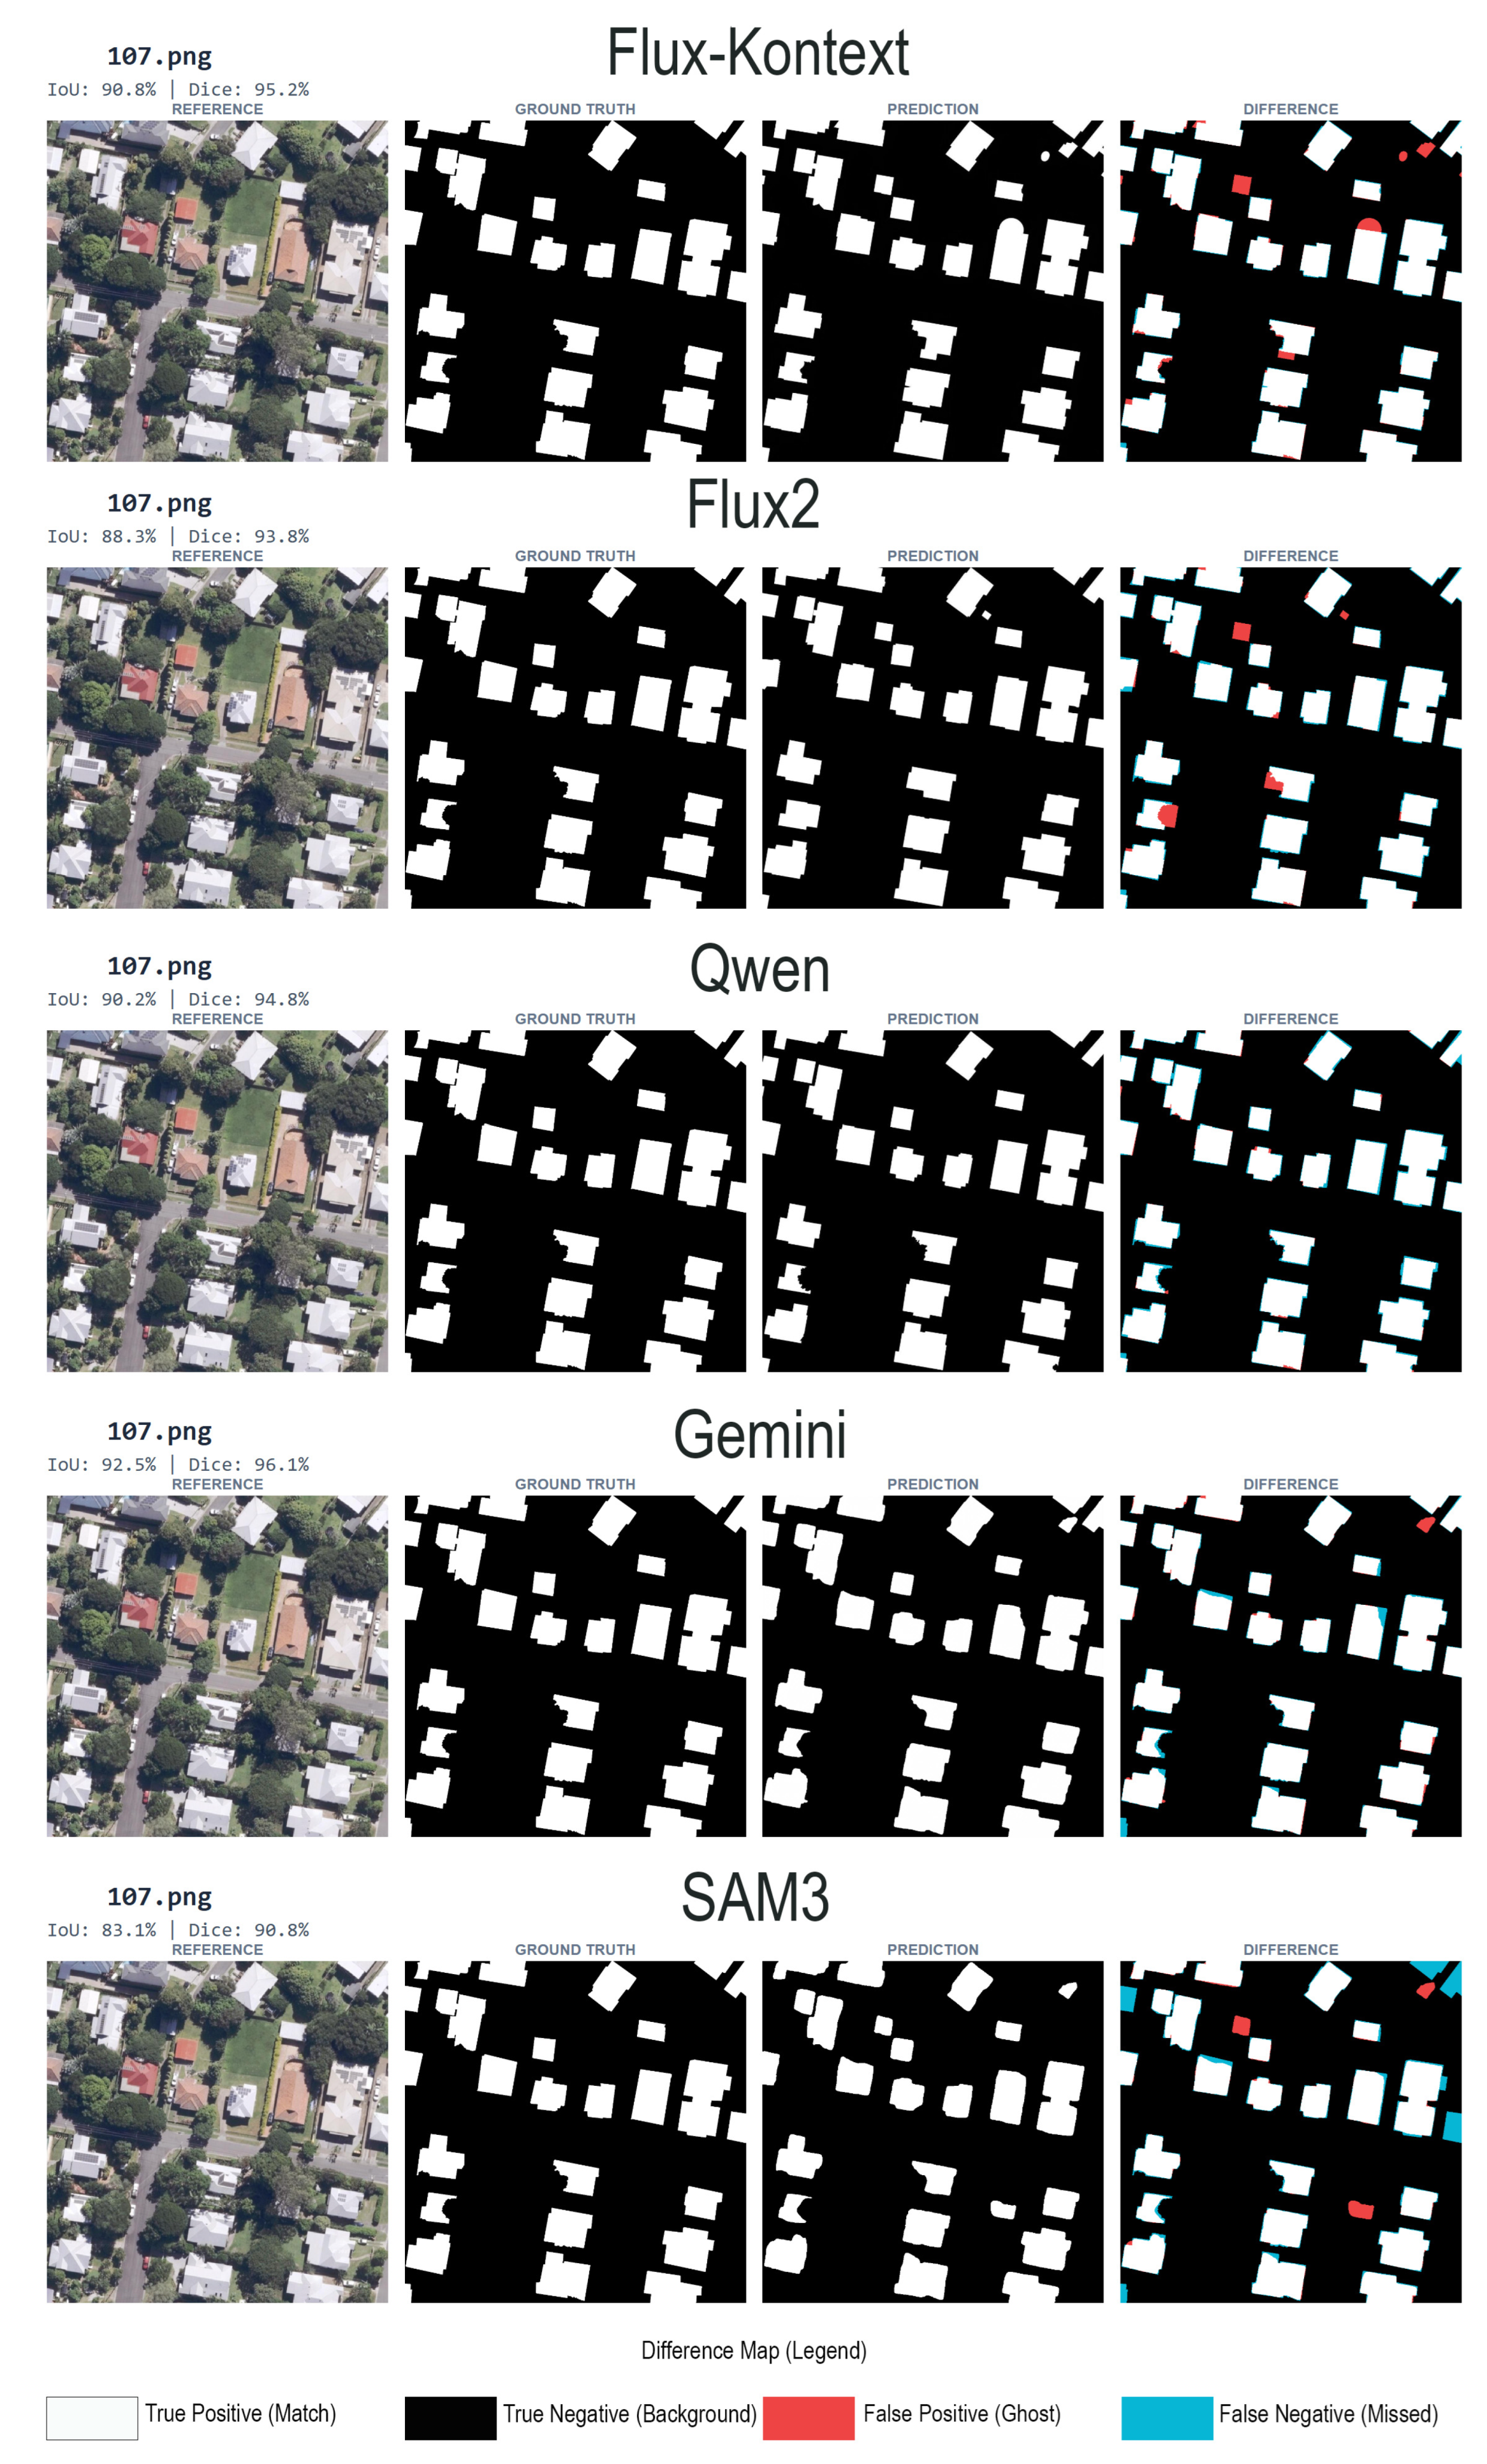
To present a compelling visual comparison, a case study of image 107 from the testing sample was selected to visually show the prediction performance across the Zero-shot models and SAM3. The FLUX Kontext and Qwen panels clearly show significant “fragmented mask structures” and large-scale false positives (red areas), Figure 21. For Qwen, the “difference” map is dominated by red, visually confirming its failure on this specific sample with a low IoU of 8.5%. In contrast, the FLUX.2 and Gemini 3 Pro image preview panels exhibit a high degree of “structural coherence.” Their difference maps are largely black (True Positive match), with only minor red and cyan slivers, visually validating Gemini’s high IoU of 92.5%. Meanwhile, the SAM3 panel shows a “spatially continuous” mask but with noticeable boundary noise. The presence of thin red and cyan outlines along the roof edges highlights the “less precise delineation” compared to the sharper boundaries of the Gemini 3 Pro image preview and FLUX.2.
LoRA-adapted diffusion models produced visually cleaner segmentation outputs across the examined samples. Predicted masks exhibited improved continuity, clearer separation between rooftops and background regions, and closer alignment with rooftop boundaries Figure 22. Among these models, FLUX Kontext LoRA generated consistently well-defined rooftop contours across different urban contexts. Qwen LoRA outputs showed similar structural coherence, while FLUX.2 LoRA predictions demonstrated improved mask quality relative to its zero-shot counterpart, with occasional incomplete rooftop coverage in dense scenes. The implications of these cross-model differences were discussed in the next Section.

5. Discussion

This discussion interprets the reported results within the context of rooftop segmentation using foundation models, focusing on the impact of Low-Rank Adaptation (LoRA), differences in model stability, and trade-offs between editing-based diffusion architectures and segmentation-first approaches.

5.1. The Zero-Shot Editing Models

The zero-shot performance of editing-based diffusion models reveals a clear distinction between semantic recognition and geometric precision. Models such as Gemini 3 Pro image preview and FLUX.2 demonstrate strong semantic understanding. They accurately identified rooftop regions at the pixel level, as reflected by their high precision and overall pixel accuracy, with values of 95% for Gemini and 90% for FLUX.2. However, their comparatively lower IoU and Dice scores indicate that, while these models correctly identify rooftops, they struggle to delineate them accurately (Figure 23).
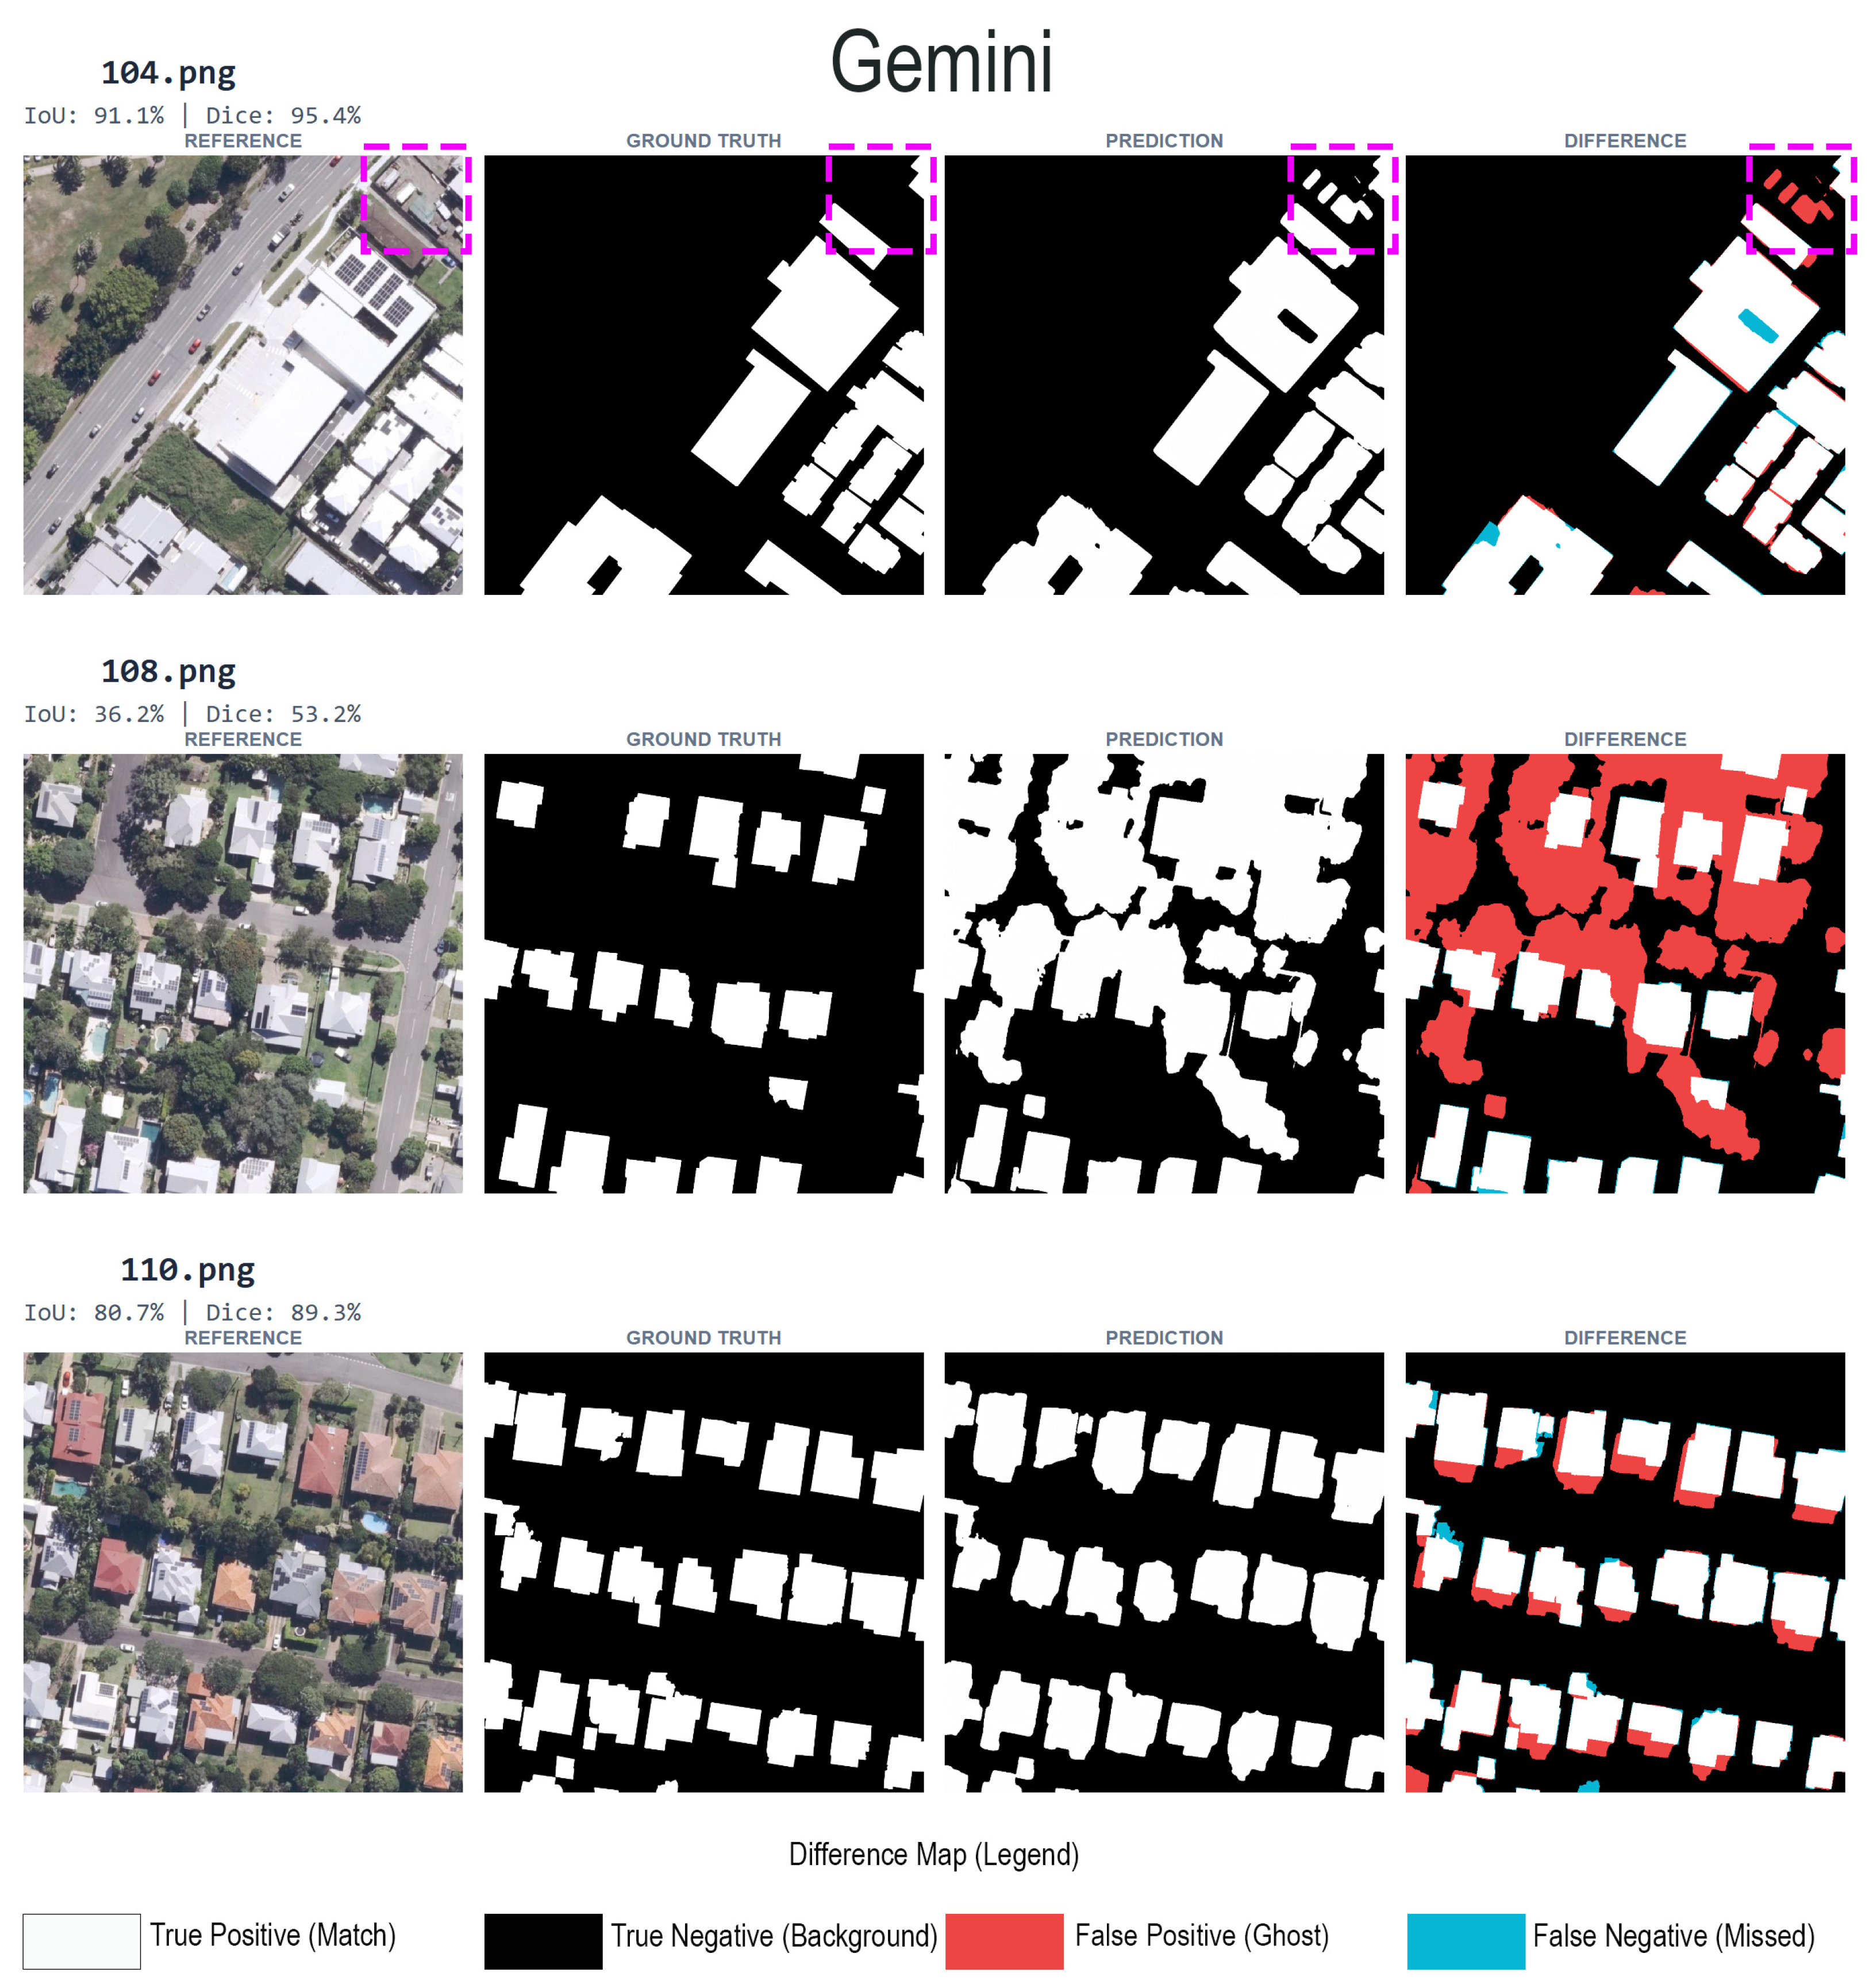
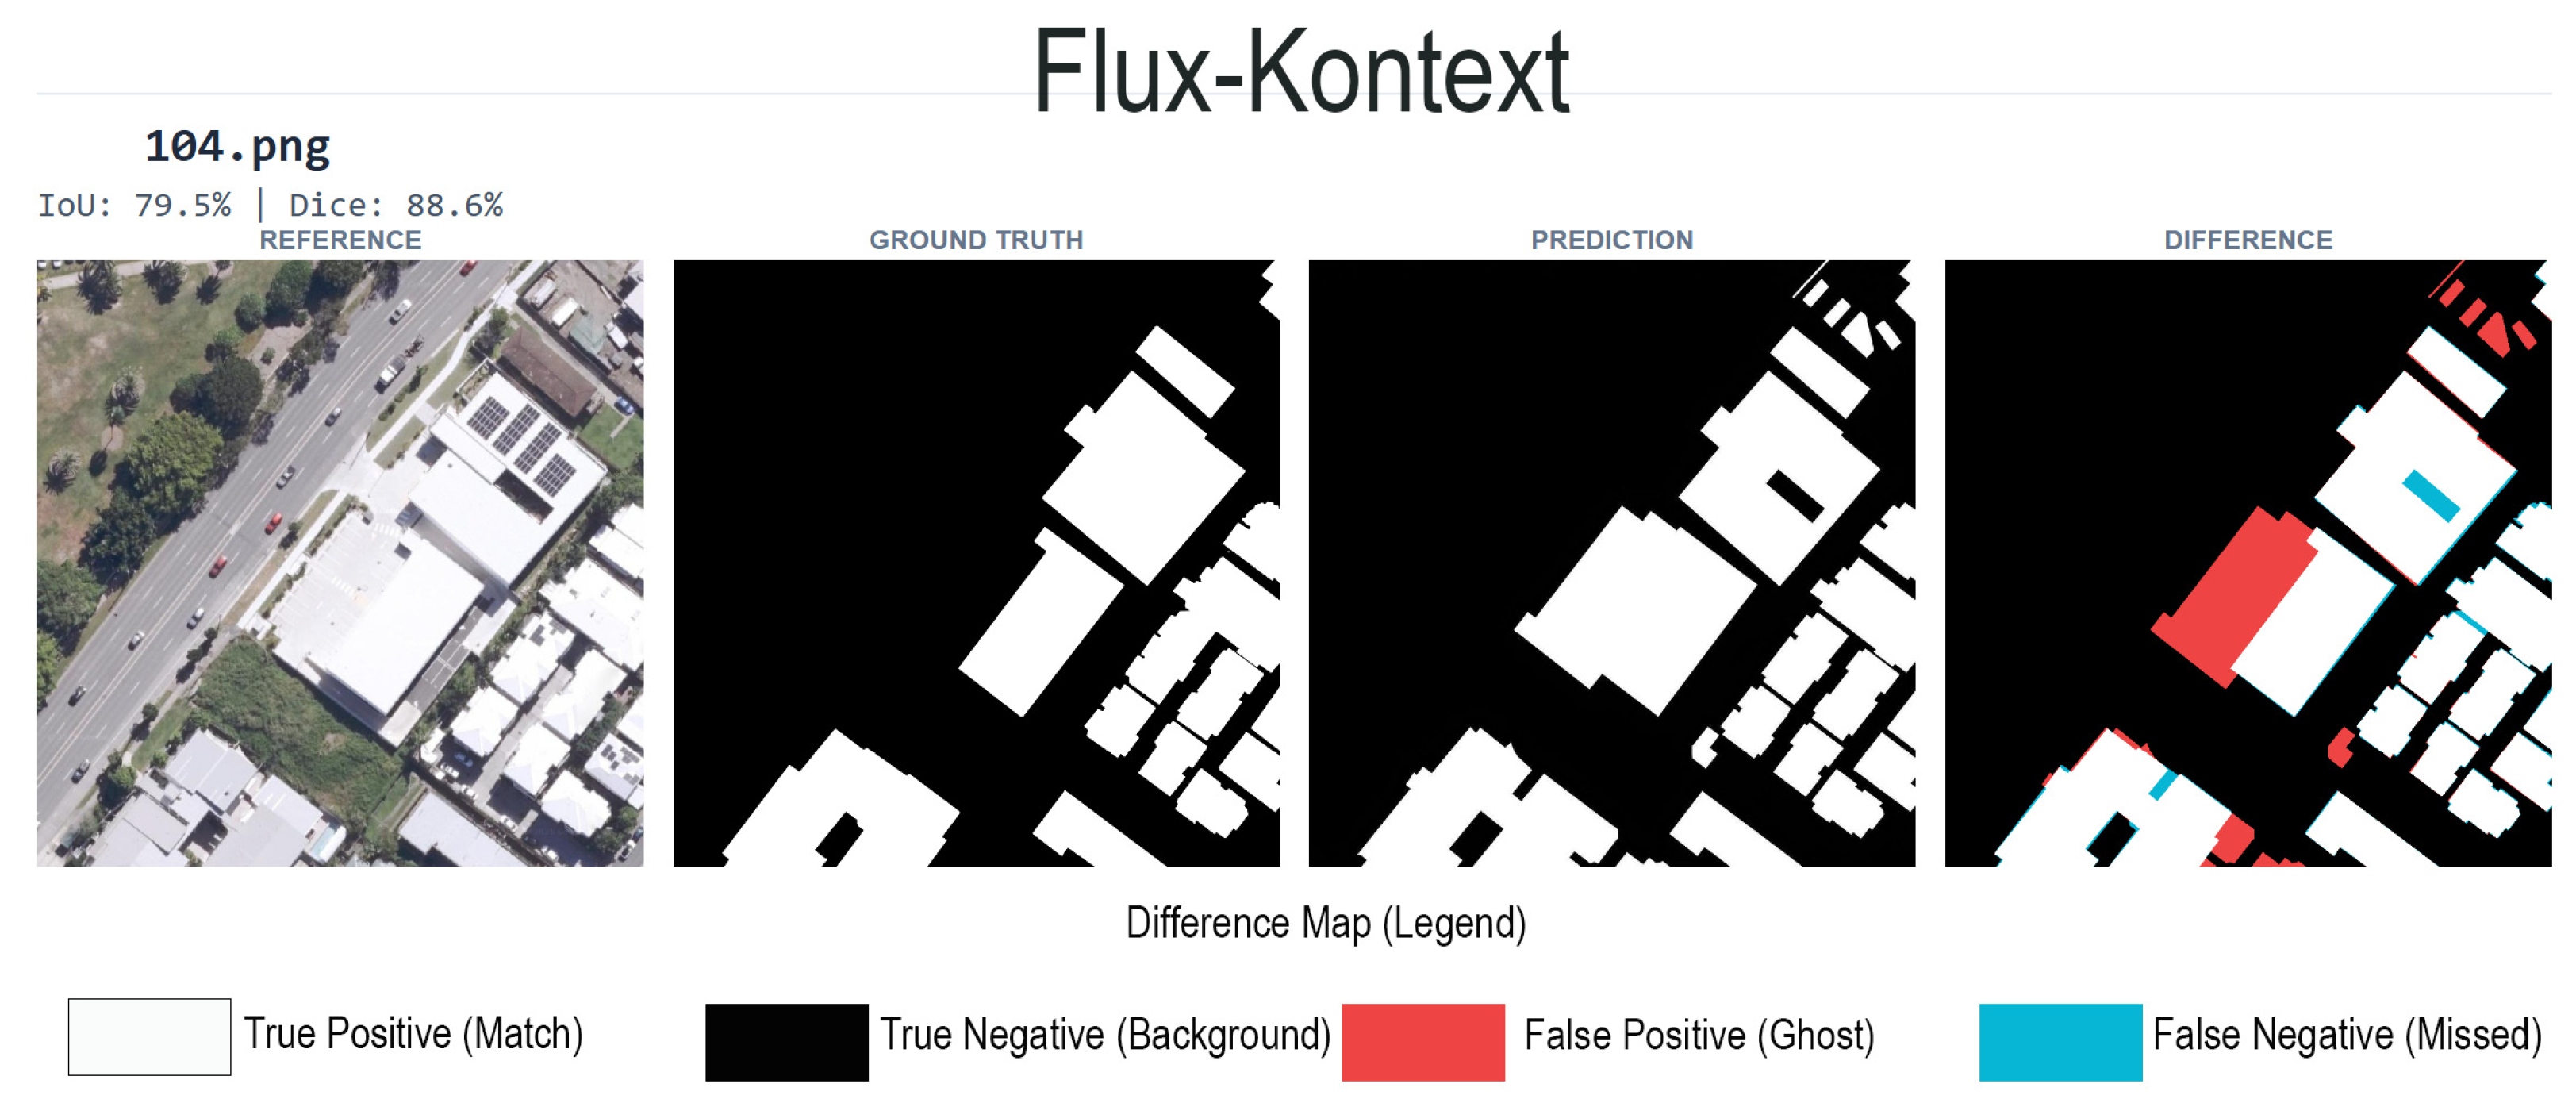
Gemini 3 Pro image preview exhibits the strongest zero-shot semantic understanding of rooftops among the editing-based models, with a high precision of 94%. It performs reliably in scenarios where rooftops are adjacent to visually similar surfaces such as parking areas or paved open spaces, maintaining consistent rooftop identification. However, the Gemini 3 Pro image preview scored an SD of 13%, indicating low reliability in prediction across the dataset. In the example shown in Figure 24 (tile 104.png), Gemini predicted non-roof rectilinear objects (shipping containers) within the industrial yard as rooftop pixels, yielding FN = 9976, FP = 15,403 pixels, and an overall false-positive rate of 1.98%. This behaviour reflects a reliance on semantic appearance rather than strict geometric constraints. As a result, Gemini 3 Pro image preview achieves high precision and pixel accuracy but lower spatial overlap metrics, indicating that semantic recognition alone is insufficient for precise rooftop delineation in complex urban scenes.
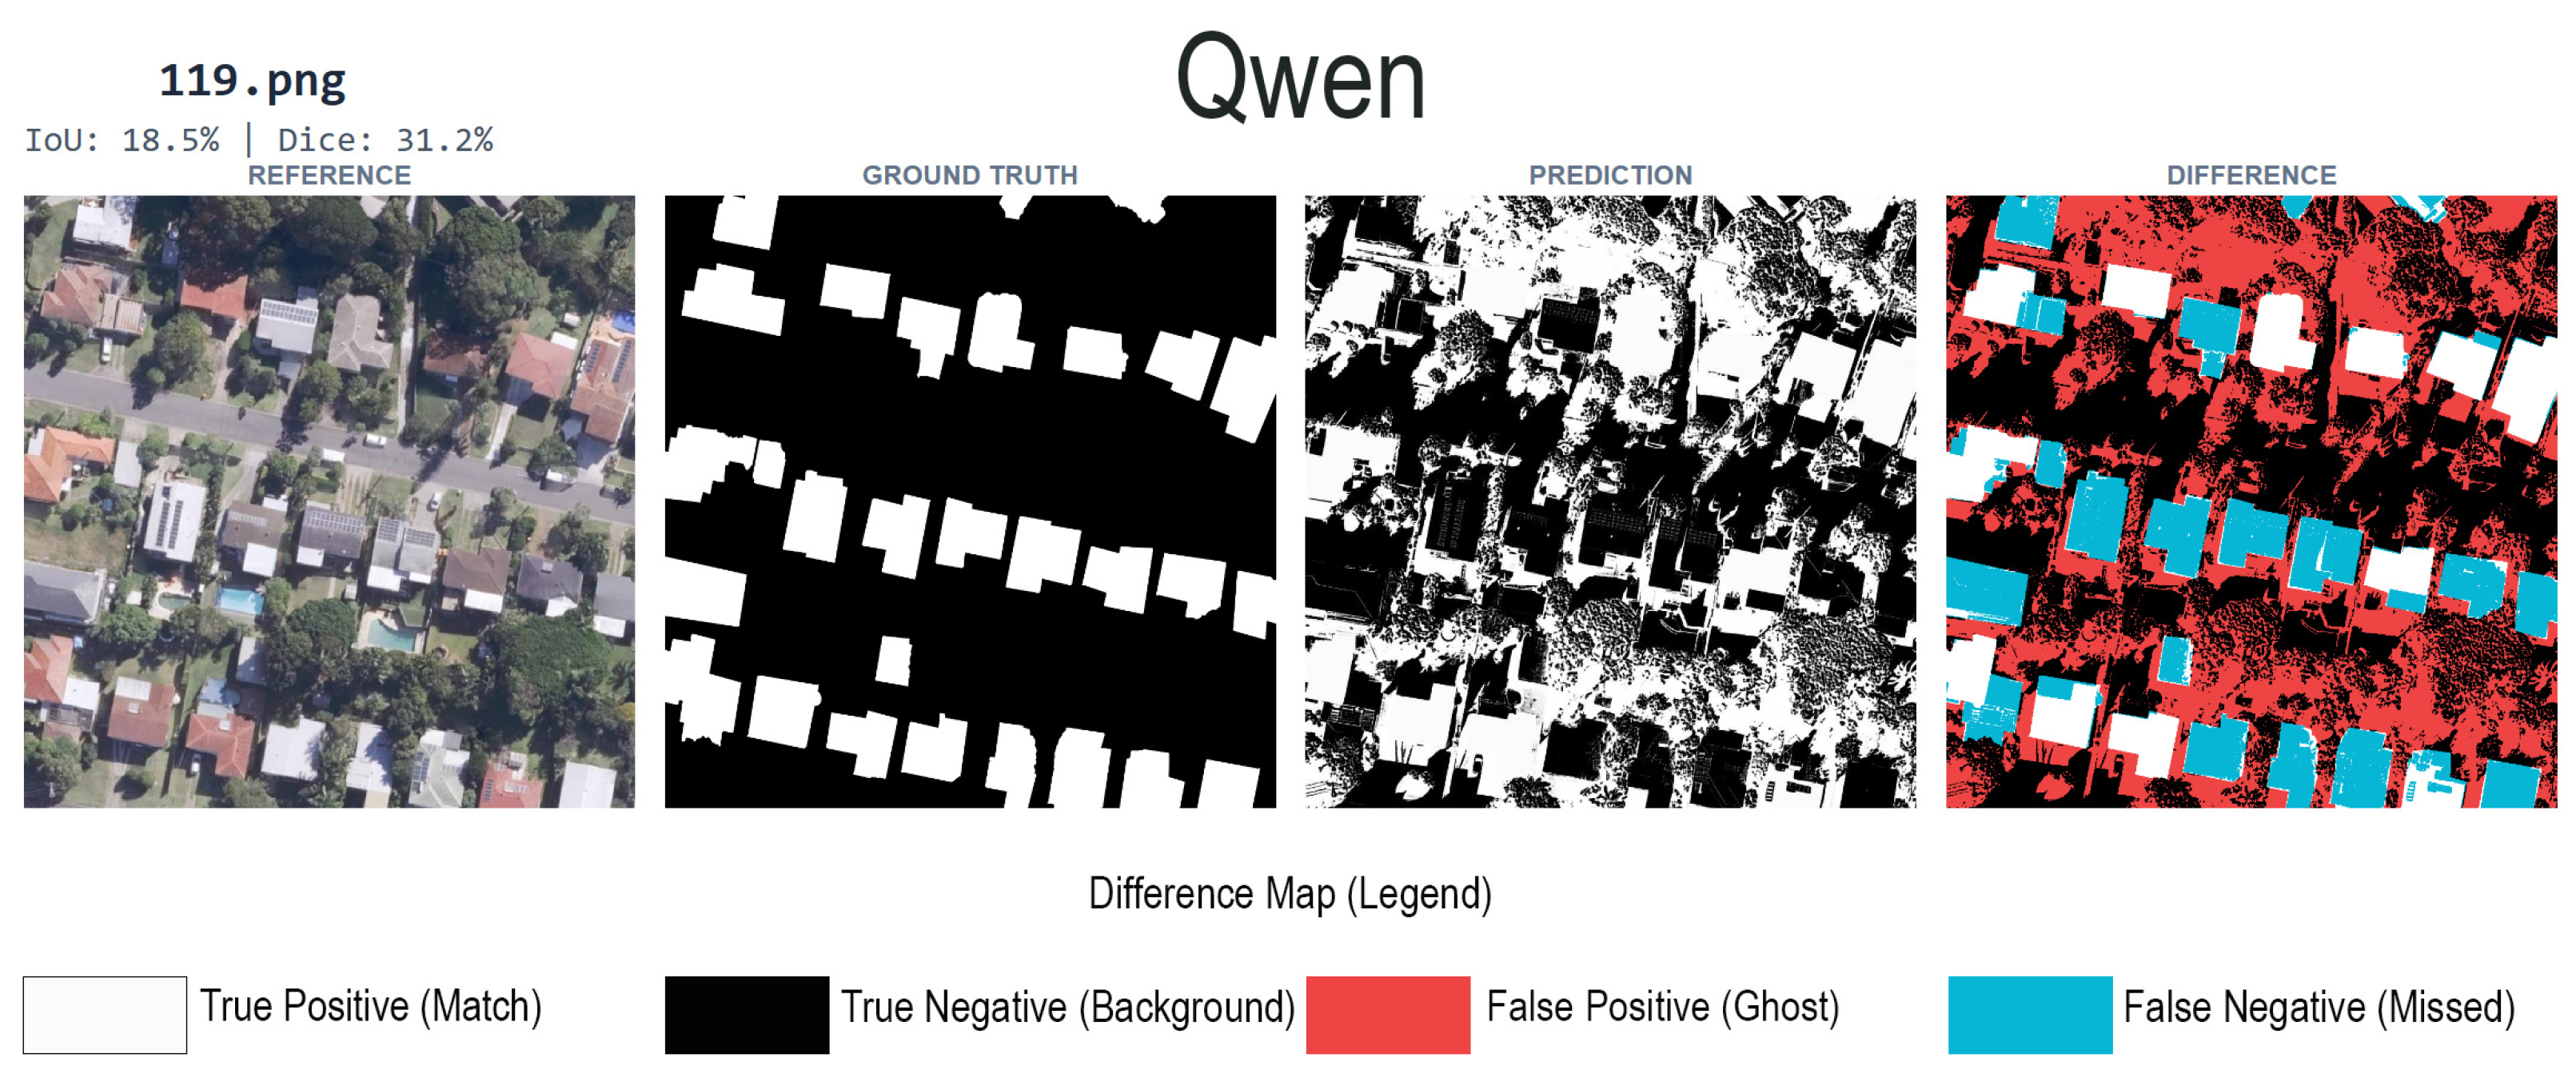
This performance is consistent with the generative training objective of diffusion models, which prioritises visual plausibility and contextual coherence rather than binary mask fidelity. Without task-specific adaptation, these models tend to blur rooftop boundaries, merge adjacent structures, or activate on visually similar surfaces such as pavements and courtyards. The elevated false negative and false positive rates observed in weaker zero-shot models, particularly Qwen Image Edit, reflect this lack of structural constraint rather than a failure of semantic recognition (Figure 25).
These findings align with recent literature suggesting that foundation models trained for open-ended image manipulation require explicit adaptation to perform dense prediction tasks reliably in remote sensing contexts. Therefore, zero-shot editing models serve as a useful diagnostic baseline, revealing the extent of intrinsic rooftop knowledge embedded in the pre-trained priors, but they are insufficient for operational rooftop delineation without further guidance.

5.2. Analysis of Mask Polarity and Metric Sensitivity

A key methodological finding of this study is the influence of mask polarity on the reliability and interpretability of segmentation metrics. Comparative evaluation across polarity configurations shows that the Black-Building/White-Background encoding provides more stable and discriminative performance assessment than the conventional alternative. This indicates that mask polarity plays a decisive role in how the segmentation task is operationalised and evaluated, particularly for foundation models applied to class-imbalanced urban imagery. The observed behaviour is attributed to differences in how foreground and background regions are represented during training and subsequently weighted during metric computation.
Under the standard evaluation protocol, the discriminative SAM3 baseline appeared highly competitive, achieving an IoU of 94.07% in the Black-Building configuration and remaining statistically close to the generative models. However, when evaluated using the corrected White-Building protocol, SAM3’s performance declined sharply to 84.00%, revealing a discrepancy of 10.07%. This drop demonstrates that standard segmentation metrics can disproportionately reward correct background classification in urban scenes, where background pixels such as roads, vegetation, and open surfaces dominate the image area. As a result, apparent performance gains may reflect background resolution rather than accurate delineation of rooftop structures.
In contrast, FLUX.1 Kontext exhibited the highest robustness to polarity-induced metric variation, Figure 26. Although a performance reduction was observed under the more stringent White-Building protocol, consistent with the increased difficulty of foreground-focused evaluation, the model retained a state-of-the-art IoU of 89%, maintaining a margin of approximately 5% over SAM3. This result supports the central hypothesis of this work: generative, editing-based models are less dependent on background dominance for metric optimisation and demonstrate stronger consistency in capturing rooftop geometry under polarity-sensitive evaluation.
The importance of the proposed dual-polarity evaluation protocol is further reinforced by results from additional architectures. For example, Qwen Image Edit exhibited a performance decrease from 95.02% IoU under the Black-Building configuration to 86.74% under the White-Building protocol. Similar trends were observed across other models, confirming that conventional evaluation practices, when applied without polarity correction, can systematically overestimate model readiness by approximately 7–12%. These findings highlight the necessity of polarity-aware validation when assessing foundation models for rooftop segmentation, ensuring that reported metrics accurately reflect foreground extraction performance rather than background dominance.
In addition to the influence of mask polarity, resolution and scale are important boundary conditions for interpreting these results. While evaluation in this study was conducted under a fixed imagery resolution and zoom level 18, the Brisbane dataset was intentionally stratified across diverse urban fabrics and roof typologies, ranging from low-density residential areas to high-density commercial zones. This introduces substantial variation in object scale and scene complexity, with building density ranging from 1 to 50 structures per tile. Accordingly, the reported model’s behaviour should be interpreted as conditional on the evaluated resolution, and explicit multi-resolution evaluation is proposed for future work.

5.3. SAM3 as a Segmentation-First Baseline

The segmentation-first SAM3 pipeline demonstrates the advantages of architectures explicitly optimised for mask generation. Its consistently high precision and low false positive rate indicate strong boundary discipline and efficient background suppression. Unlike diffusion-based models, SAM3 enforces discrete region separation through its segmentation objective, which explains its stable performance across heterogeneous urban scenes.
However, the observed False Negative Rate (FNR) of 12% in SAM3 reveals a limitation. Prompt-based segmentation models prioritise confident detections and may omit ambiguous or partially occluded rooftops, particularly in dense residential areas with shadows, vegetation cover, or complex roof intersections. This conservative performance favours precision over completeness, which is desirable in some applications but may undercount rooftop availability in solar potential or disaster-response scenarios [27].
Importantly, SAM3 was evaluated without any domain-specific fine-tuning, reflecting realistic deployment constraints. In this context, its strong baseline performance confirms that segmentation-first foundation models remain highly competitive for rooftop extraction, especially when rapid, zero-configuration inference is required.

5.4. Impact of LoRA Fine-Tuning

The introduced insight from this study is the effect of LoRA adaptation on editing-based diffusion models. Across all adapted architectures, LoRA consistently improved spatial overlap metrics, reduced pixel-level error, and stabilised recall, indicating that the adaptation process effectively reorients the generative prior toward binary segmentation behaviour.
Rather than learning rooftops from scratch, the LoRA adapters appear to function as structural regulators, constraining the pretrained latent space to respect rooftop boundaries and suppress irrelevant activations. This is particularly evident in the FLUX Kontext LoRA pipeline, where early training stages yield rapid gains, followed by a plateau of stable high performance. The reduction in false negatives suggests that the adapted model prioritises rooftop completeness, an attribute inherited from the generative tendency to fill plausible structures, as shown earlier in Figure 9.
The results support the hypothesis that parameter-efficient fine-tuning is sufficient to convert generalist image-editing models into specialist segmentation tools, without the computational burden of full retraining. This finding extends recent work on LoRA in vision tasks by demonstrating its effectiveness in high-resolution aerial imagery and dense urban environments.
Differences in convergence performance across LoRA-adapted models reveal important architectural sensitivities. FLUX Kontext exhibits the most stable adaptation trajectory, maintaining high IoU and Dice scores across a wide range of checkpoints, Figure 27. This stability likely reflects the model’s in-context editing design, which preserves spatial coherence during modification tasks.
By contrast, FLUX.2 exhibits an unstable adaptation trajectory, characterised by early performance gains followed by degradation at later training stages, indicating over-adaptation and a loss of generalisation. This performance is further supported by its relatively high-performance variability across the validation set (standard deviation of approximately 11%), suggesting that while the model can achieve strong segmentation on selected images, it fails to generalise consistently across diverse urban contexts (Figure 28). These findings indicate that not all diffusion backbones respond uniformly to prolonged LoRA fine-tuning, emphasising the importance of careful checkpoint selection rather than reliance on final training states. Also, the early performance gain suggests that if FLUX.2 LoRA training parameters are adjusted to a lower learning rate and steps, which could reach a higher segmentation accuracy.
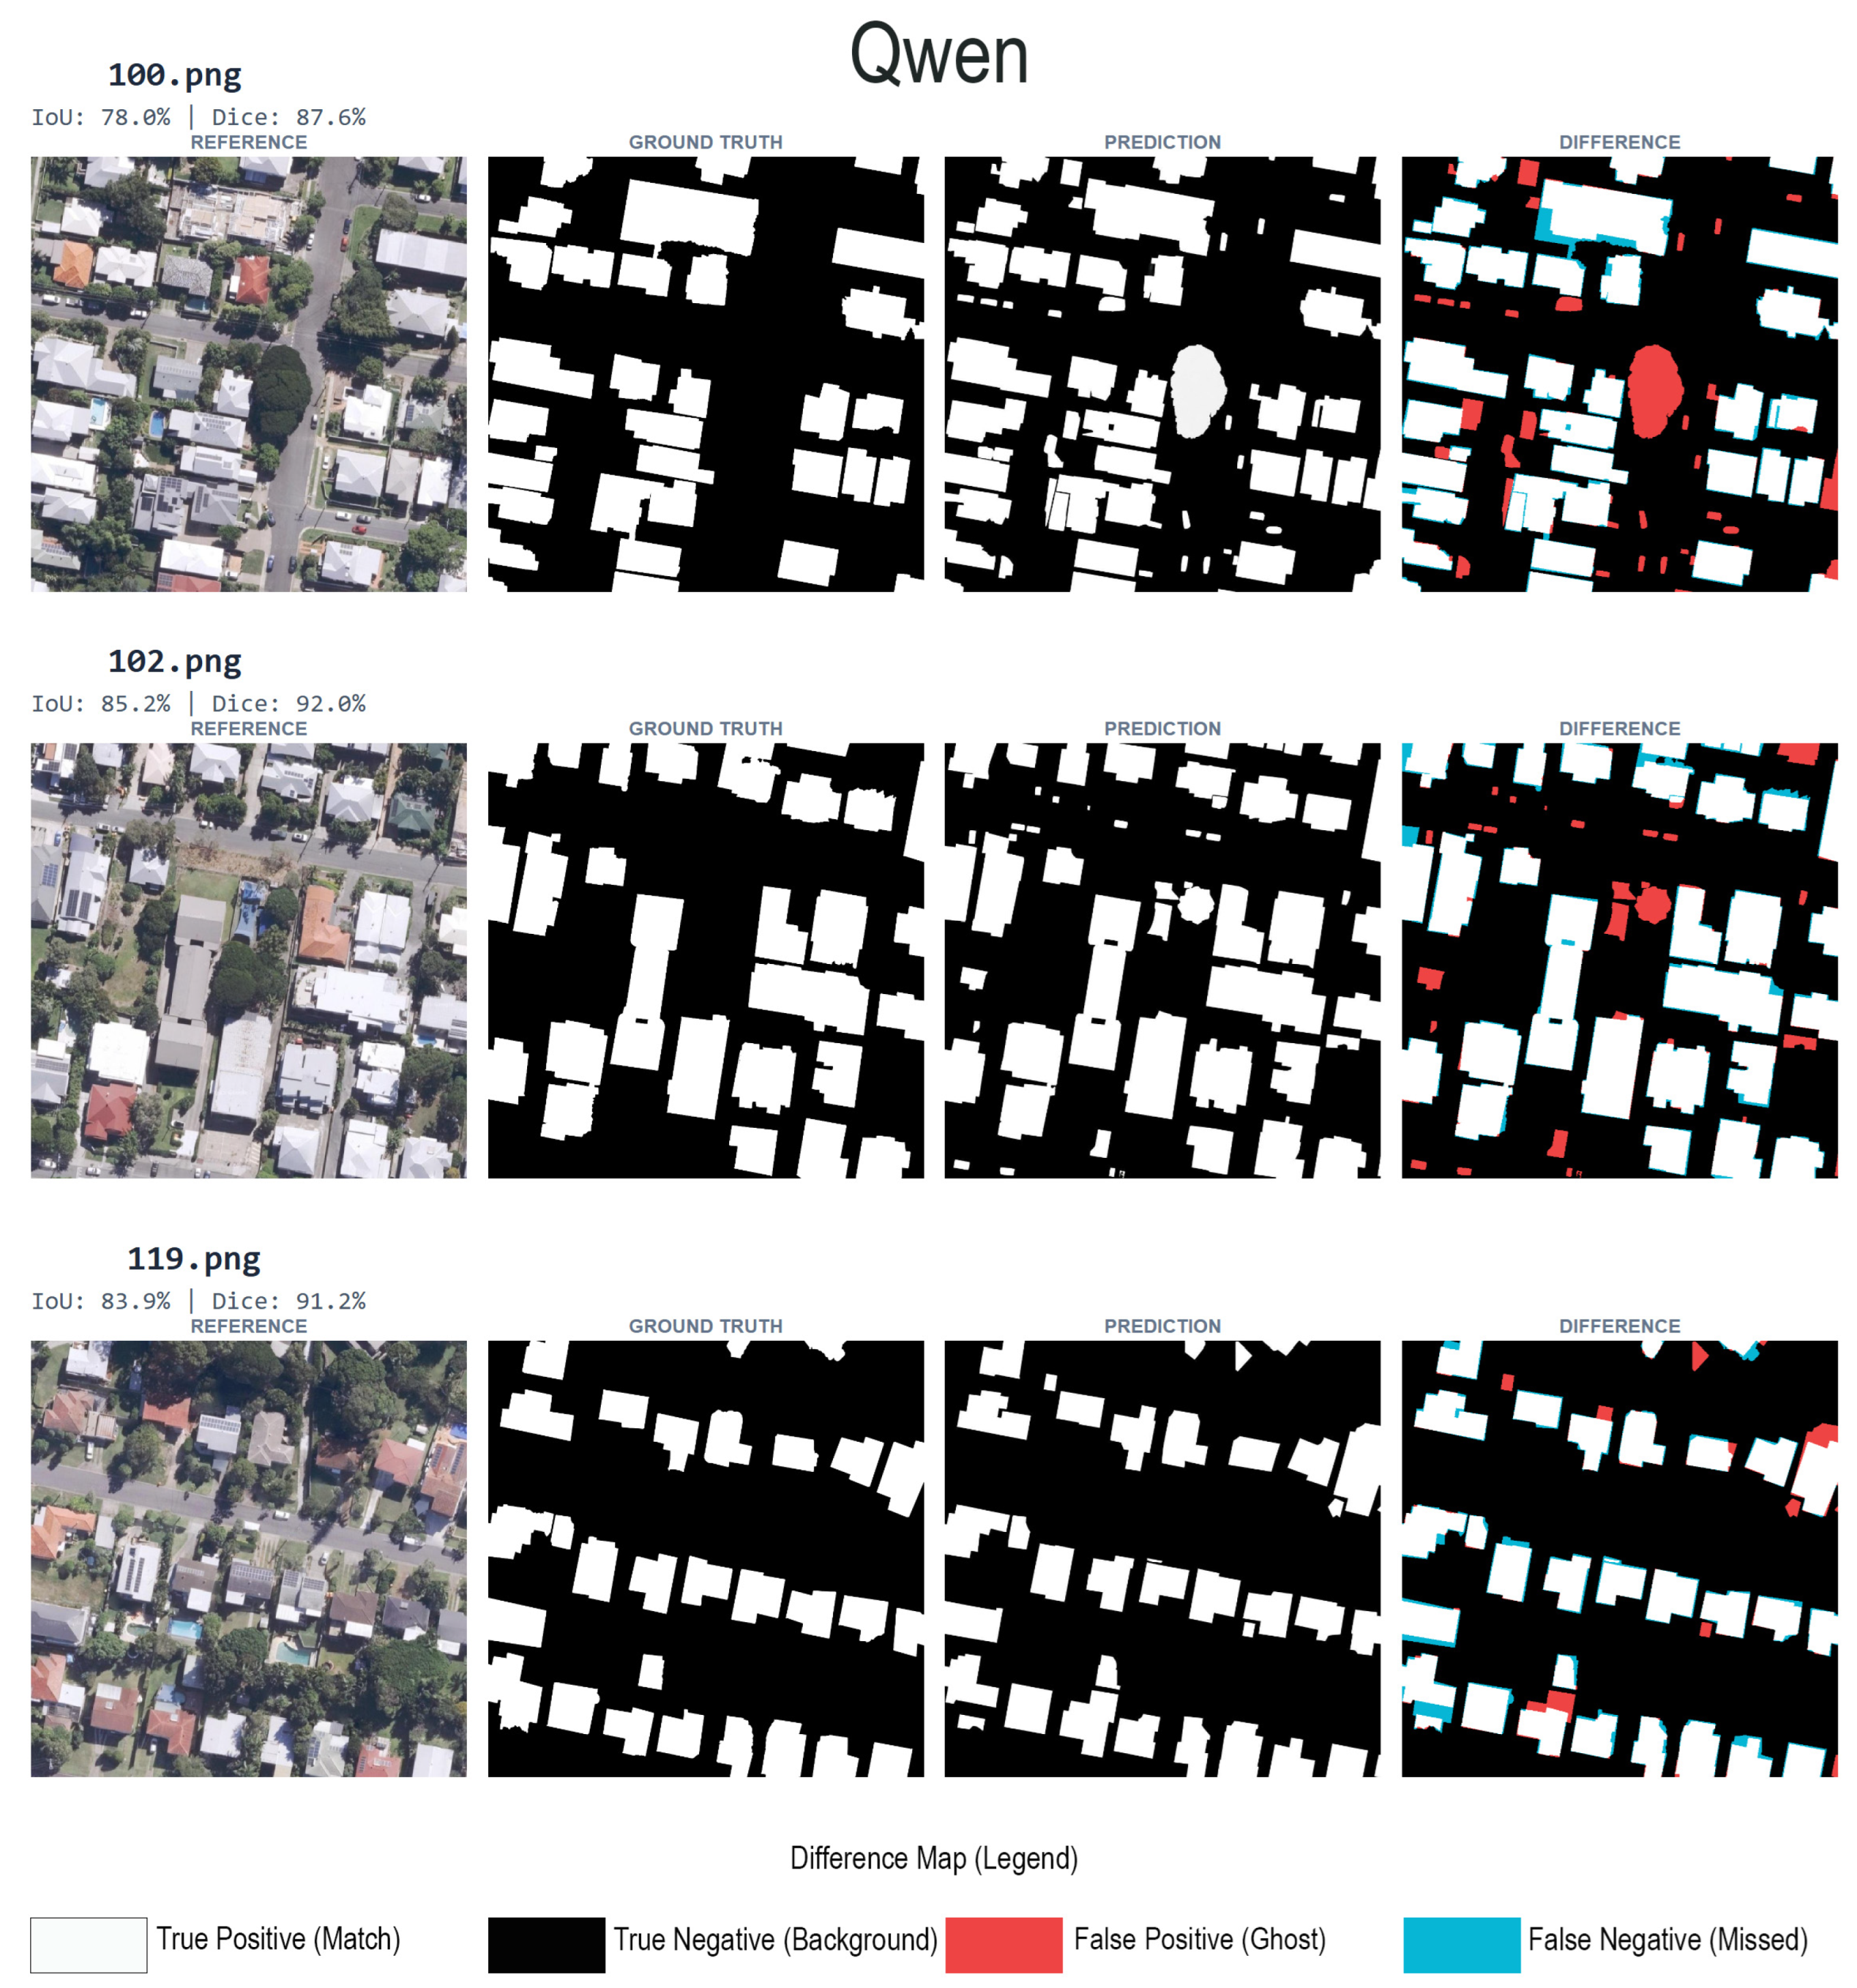
As for the Qwen Image Edit model, it demonstrated an intermediate adaptation pattern, achieving strong peak performance with moderate stability but remaining susceptible to omission errors in visually complex scenes. Although LoRA fine-tuning improves its overall segmentation capability, certain samples continue to yield low spatial overlap. For example, in Figure 29, Qwen records its lowest IoU despite overall performance improvements at the selected checkpoint. Visual inspection reveals confusion between rooftops and spectrally similar elements such as cars, driveways, and red-toned surfaces, as well as partial mixing of buildings with adjacent vegetation. These errors highlight persistent limitations in geometric discrimination when semantic cues dominate the prediction process.
These observations underscore that LoRA adaptation is not generally applicable and must be calibrated to each backbone’s representational capacity and training dynamics. Identifying the optimal stopping point is therefore as important as selecting the adaptation method itself, including learning steps.

5.5. Cross-Model Trade-Offs

The results of this study highlight a fundamental trade-off in applying foundation models to remote sensing: the conflict between semantic interpretability and geometric precision. By systematically comparing zero-shot generation, segmentation-first architectures, and LoRA-adapted diffusion, we identified distinct behavioural characteristics that govern their applicability to urban mapping.
When comparing LoRA-adapted diffusion models with SAM3, a clear trade-off emerges between segmentation completeness and geometric conservatism. The LoRA-adapted models, led by FLUX Kontext, followed by Qwen, demonstrate a clear preference for high recall and a reduction in false negatives. Specifically, FLUX Kontext achieved the highest peak performance with a mean IoU of 88.9% and SD of 3.16%, indicating superior generalisation across diverse urban morphologies.
When benchmarked against recent supervised deep learning architectures, the LoRA-adapted foundation model paradigm demonstrates a significant advantage in data efficiency. Recent works utilise complex CNN and Transformer-based architectures, such as those discussed by Saadaoui, Farah Saadaoui, Farah [1] and Hussain, Congshi Hussain, Congshi [6], which typically require thousands of densely annotated samples to achieve high accuracy in urban imaging. In contrast, our approach achieves a competitive IoU of 89% and a Dice score of 94% using a restricted training set of only 97 training tiles. This performance matches or exceeds several recent supervised benchmarks, such as the material-classification CNNs discussed by Kim, Bae Kim, Bae [2] or the transfer-learning pipelines applied to metropolitan datasets by Neupane, Aryal Neupane, Aryal [13], both of which rely on larger volumes of ground-truth data for convergence.
SAM3, in contrast, exhibits a more conservative segmentation profile with a mean IoU of 84%. While it offers a strong precision-centric output, its 4.3% higher standard deviation in IoU, relative to FLUX.1 Kontext, suggests greater volatility when encountering complex roof geometries. However, SAM3 maintains a substantial computational advantage through its single forward-pass architecture, enabling rapid large-scale deployment. In our test, SAM3 achieved inference in approximately 30 s per image.
In comparison, Zero-shot models like Gemini 3 Pro exhibit significantly higher latency, requiring approximately 45 s per image. However, we mitigated this limitation through the parallel processing capabilities of utilising an online app [51], which enables the concurrent processing of 24 images within the same 45 s interval. This effectively reduces the operational bottleneck for multimodal large language models (LMMs), making them more viable for high-throughput metropolitan analysis.
On the other hand, diffusion-based pipelines still incur higher latency due to the iterative sampling process, and the cumulative time required for fine-tuning and validation varied significantly across the backbones. These differences in overhead, combined with the high statistical variance observed in Gemini 3 Pro (SD: 13%) and FLUX.2 (SD: 11.38%), indicate that model choice should be guided by a balance of absolute accuracy, operational speed, and output stability.
Ultimately, the ability to fine-tune foundation models using a small, annotated subset while maintaining high statistical consistency addresses a critical opportunity in remote sensing workflows. By reframing segmentation as a constrained editing problem, this work demonstrates that generative models can achieve equivalence and, in cases such as FLUX.1 Kontext, it exceeds both the segmentation first baselines and traditional supervised state-of-the-art models under the evaluated conditions.

5.6. Analysis of Research Uncertainty and Reliability

The reliability of the research findings is directly connected to how we quantify predictive uncertainty across Brisbane’s diverse urban morphologies. We observed statistical stability primarily through the SD of IoU metrics, which serves as a core indicator of whether a model is ready for operational use. The LoRA adapted FLUX.1 Kontext model proved to be the most certain in its predictions by maintaining a standard deviation of 3.16%. This suggests that the adaptation process successfully constrained the generative prior into a stable analytical tool. On the other hand, the high variance seen in zero-shot models like Gemini 3 Pro (SD of 13%) and FLUX.2 (SD of 11.38%) highlights a sensitivity to image-specific characteristics where performance fluctuates based on the complexity of the urban scene rather than a consistent understanding of geometric boundaries. Such unpredictability in automated workflows would necessitate manual intervention to ensure accuracy across heterogeneous metropolitan environments.
Systematic uncertainty also branches from the inherent conflict between semantic appearance and strict geometric constraints. Our evaluation revealed varying error profiles across the paradigms, where omission and commission errors reflect specific model biases. For instance, the SAM3 baseline exhibited a systematic conservative bias with a 12% False Negative Rate. Conversely, the generative architectures showed a tendency for semantic confusion, occasionally misclassifying rectilinear non-roof structures like industrial shipping containers or green recreational courts as rooftop segments. These patterns of over-segmentation and boundary drift emphasise that while generative models possess robust semantic awareness, their geometric reliability depends heavily on the presence of localised structural regulators.
Essentially, the methodological uncertainty we identified through the inflation gap reveals that conventional evaluation protocols can overestimate model readiness by as much as 11.6%. When the background is treated as a positive class in class-imbalanced urban imagery, there is a substantial risk of rewarding background resolution rather than true rooftop extraction. To quantify this, we performed a dual-stage evaluation: first assessing models against the ‘black building’ training polarity, and subsequently over inverted masks where rooftops represented the positive class. This polarity-aware protocol effectively mitigated background bias, ensuring that our reported gains, such as the 89% mean IoU result, were from genuine architectural adaptation rather than accidental background agreement.
The geographic and spatial constraints of the Brisbane dataset introduce a final part of residual uncertainty regarding global generalisation. While our data provides a representative sample of subtropical urban forms, the spectral and contextual cues identified by the adapters may vary across different architectural regimes. Acknowledging these limitations is essential for ensuring that the transition from generative priors to analytical tools is conducted with a clear understanding of the spatial boundaries of the model’s limits.

6. Conclusions and Future Work

The findings of this study demonstrate that parameter-efficient adaptation, specifically through Low-Rank Adaptation (LoRA), enables generative-foundation models to function as high-precision analytical tools for aerial image segmentation. By reformulating segmentation as a constrained editing problem, this framework aligns the broad semantic awareness of diffusion models with the deterministic pixel-level accuracy required for building footprint extraction. Our results confirm that fine-tuned generative models not only perform comparably to dedicated segmentation first baselines like SAM3, but also exhibit higher recall in complex urban environments where traditional models often exhibit conservative bias. This methodological approach provides a scalable and resource-efficient solution for urban monitoring, particularly in scenarios where the cost of dense annotation prohibits the training of large-scale discriminative models from scratch.
The identification of a metric inflation gap represents a key methodological finding, emphasising that conventional evaluation protocols frequently lead to an overestimation of model reliability due to background-class dominance. By standardising a white building evaluation protocol, this research establishes a robust and objective benchmark that ensures metrics accurately reflect foreground delineation fidelity. This distinction is essential to the operational deployment of AI in urban planning, where the accuracy of rooftop footprints directly impacts the validity of energy models and urban density analyses.
Looking forward, the comparative analysis of adaptation trajectories suggests that architectural design significantly influences the stability of the fine-tuning process. While models such as FLUX.1 Kontext demonstrated exceptional operational discipline; others were susceptible to catastrophic forgetting during later training stages. Future research will focus on expanding the geographic and statistical robustness of these findings through a larger training dataset to mitigate sample-related uncertainty. Furthermore, spatial cross-validation will be integrated into the workflow to better characterise model generalisation under conditions of spatial autocorrelation.
Additionally, investigating the sensitivity of these adapters to multi-resolution datasets and diverse urban morphologies will help establish a global reliability baseline. Measuring random errors caused by data noise directly within the model also presents a promising avenue for providing real-time confidence heatmaps. This would further enhance the utility of generative geospatial intelligence for autonomous urban analysis.

Author Contributions

Conceptualization, D.S.; methodology, D.S.; software, D.S. and A.W.; validation, D.S.; formal analysis, D.S.; investigation, D.S.; data curation, D.S.; writing—original draft preparation, D.S.; writing—review and editing, D.S., S.D., S.O., R.D., H.A. and A.W.; visualization, D.S.; supervision, S.D., S.O., R.D. and H.A. All authors have read and agreed to the published version of the manuscript.

Funding

This research was funded by the Queensland University of Technology (QUT), Faculty of Engineering APC funding.

Data Availability Statement

The original data presented in the study, including trained LoRA weights (safetensors) and ComfyUI workflow JSON files, are available in Zenodo at https://doi.org/10.5281/zenodo.18571111 [50].

Acknowledgments

This research is supported by Queensland University of Technology (QUT) and the Australian Government Research Training Program (RTP) Stipend (Domestic) Scholarship.

Conflicts of Interest

The authors declare no conflicts of interest.

References

  1. Saadaoui, H.; Farah, S.; Lechgar, H.; Ghennioui, A.; Rhinane, H. Advancing Urban Roof Segmentation: Transformative Deep Learning Models from CNNs to Transformers for Scalable and Accurate Urban Imaging Solutions—A Case Study in Ben Guerir City, Morocco. Technologies 2025, 13, 452. [Google Scholar] [CrossRef]
  2. Kim, J.; Bae, H.; Kang, H.; Lee, S.G. CNN Algorithm for Roof Detection and Material Classification in Satellite Images. Electronics 2021, 10, 1592. [Google Scholar] [CrossRef]
  3. Cai, Y.; He, H.; Yang, K.; Fatholahi, S.N.; Ma, L.; Xu, L.; Li, J. A Comparative Study of Deep Learning Approaches to Rooftop Detection in Aerial Images. Can. J. Remote Sens. 2021, 47, 413–431. [Google Scholar] [CrossRef]
  4. Awais, M.; Naseer, M.; Khan, S.; Anwer, R.M.; Cholakkal, H.; Shah, M.; Yang, M.H.; Khan, F.S. Foundation Models Defining a New Era in Vision: A Survey and Outlook. IEEE Trans. Pattern Anal. Mach. Intell. 2025, 47, 2245–2264. [Google Scholar] [CrossRef] [PubMed]
  5. Asif, M.; Sharieff, R.; Olawale, M.; Khan, M.I. Unlocking the potential of unregulated rooftops for solar PV on residential buildings: Identifying and addressing key challenges. Energy Nexus 2025, 18, 100447. [Google Scholar] [CrossRef]
  6. Hussain, Z.k.; Congshi, J.; Adrees, M.; Chaudhary, H.; Shafqat, R. A Novel Architecture for building rooftop extraction using remote sensing and deep learning. Remote Sens. Appl. Soc. Environ. 2025, 38, 101551. [Google Scholar] [CrossRef]
  7. Li, Y.; Wu, Y.; Lai, Y.; Hu, M.; Yang, X. MedDINOv3: How to adapt vision foundation models for medical image segmentation? arXiv 2025, arXiv:2509.02379. [Google Scholar] [CrossRef]
  8. Pei, J.; Zhou, Z.; Zhang, T. Evaluation study on SAM 2 for class-agnostic instance-level segmentation. CAAI Artif. Intell. Res. 2025, 4, 9150055. [Google Scholar] [CrossRef]
  9. Hu, E.J.; Shen, Y.; Wallis, P.; Allen-Zhu, Z.; Li, Y.; Wang, S.; Wang, L.; Chen, W. Lora: Low-rank adaptation of large language models. ICLR 2022, 1, 3. [Google Scholar]
  10. Yang, M.; Chen, J.; Zhang, Y.; Liu, J.; Zhang, J.; Ma, Q.; Verma, H.; Zhang, Q.; Zhou, M.; King, I. Low-rank adaptation for foundation models: A comprehensive review. arXiv 2025, arXiv:2501.00365. [Google Scholar]
  11. Shata, D.; Omrani, S.; Drogemuller, R.; Denman, S.; Wagdy, A. Unlocking solar potential through machine learning techniques for roof geometry prediction—A review. Sol. Energy 2025, 302, 113994. [Google Scholar] [CrossRef]
  12. Song, S.; Tang, Y.; Qin, R. Synthetic Data Matters: Retraining With Geo-Typical Synthetic Labels for Building Detection. IEEE Trans. Geosci. Remote Sens. 2025, 63, 1–13. [Google Scholar] [CrossRef]
  13. Neupane, B.; Aryal, J.; Rajabifard, A. Building Footprint Segmentation Using Transfer Learning: A Case Study of the City of Melbourne. ISPRS Ann. Photogramm. Remote Sens. Spatial Inf. Sci. 2022, X-4/W3-2022, 173–179. [Google Scholar] [CrossRef]
  14. Demir, I.; Koperski, K.; Lindenbaum, D.; Pang, G.; Huang, J.; Basu, S.; Hughes, F.; Tuia, D.; Raskar, R. Deepglobe 2018: A challenge to parse the earth through satellite images. In Proceedings of the IEEE Conference on Computer Vision and Pattern Recognition Workshops, Salt Lake City, UT, USA, 18–22 June 2018. [Google Scholar]
  15. Maggiori, E.; Tarabalka, Y.; Charpiat, G.; Alliez, P. Can semantic labeling methods generalize to any city? The inria aerial image labeling benchmark. In Proceedings of the 2017 IEEE International Geoscience and Remote Sensing Symposium (IGARSS), Fort Worth, TX, USA, 23–28 July 2017. [Google Scholar]
  16. Van Etten, A.; Lindenbaum, D.; Bacastow, T.M. Spacenet: A remote sensing dataset and challenge series. arXiv 2018, arXiv:1807.01232. [Google Scholar]
  17. Rottensteiner, F.; Sohn, G.; Gerke, M.; Wegner, J.D.; Breitkopf, U.; Jung, J. Results of the ISPRS benchmark on urban object detection and 3D building reconstruction. ISPRS J. Photogramm. Remote Sens. 2014, 93, 256–271. [Google Scholar] [CrossRef]
  18. Chen, T.; Zhu, L.; Ding, C.; Cao, R.; Zhang, S.; Wang, Y.; Li, Z.; Sun, L.; Mao, P.; Zang, Y. Sam fails to segment anything?–Sam-adapter: Adapting sam in underperformed scenes: Camouflage, shadow, and more. arXiv 2023, arXiv:2304.09148. [Google Scholar]
  19. Zhou, T.; Xia, W.; Zhang, F.; Chang, B.; Wang, W.; Yuan, Y.; Konukoglu, E.; Cremers, D. Image segmentation in foundation model era: A survey. arXiv 2024, arXiv:2408.12957. [Google Scholar] [CrossRef]
  20. Carion, N.; Gustafson, L.; Hu, Y.-T.; Debnath, S.; Hu, R.; Suris, D.; Ryali, C.; Alwala, K.V.; Khedr, H.; Huang, A. SAM 3: Segment Anything with Concepts. arXiv 2025, arXiv:2511.16719. [Google Scholar] [CrossRef]
  21. Wang, H.; Vasu, P.K.A.; Faghri, F.; Vemulapalli, R.; Farajtabar, M.; Mehta, S.; Rastegari, M.; Tuzel, O.; Pouransari, H. Sam-clip: Merging vision foundation models towards semantic and spatial understanding. In Proceedings of the IEEE/CVF Conference on Computer Vision and Pattern Recognition, Seattle, WA, USA, 16–22 June 2024. [Google Scholar]
  22. Ji, W.; Li, J.; Bi, Q.; Liu, T.; Li, W.; Cheng, L. Segment Anything Is Not Always Perfect: An Investigation of Sam on Different Real-World Applications; Springer: Berlin/Heidelberg, Germany, 2024. [Google Scholar]
  23. Isensee, F.; Rokuss, M.; Krämer, L.; Dinkelacker, S.; Ravindran, A.; Stritzke, F.; Hamm, B.; Wald, T.; Langenberg, M.; Ulrich, C. nninteractive: Redefining 3d promptable segmentation. arXiv 2025, arXiv:2503.08373. [Google Scholar] [CrossRef]
  24. Kirillov, A.; Mintun, E.; Ravi, N.; Mao, H.; Rolland, C.; Gustafson, L.; Xiao, T.; Whitehead, S.; Berg, A.C.; Lo, W.-Y. Segment anything. In Proceedings of the IEEE/CVF International Conference on Computer Vision, Paris, France, 1–6 October 2023. [Google Scholar]
  25. Khatua, A.; Bhattacharya, A.; Goswami, A.K.; Aithal, B.H. Developing approaches in building classification and extraction with synergy of YOLOV8 and SAM models. Spat. Inf. Res. 2024, 32, 511–530. [Google Scholar] [CrossRef]
  26. Li, J.; Feng, Y.; Guo, Y.; Huang, J.; Piao, Y.; Bi, Q.; Zhang, M.; Zhao, X.; Chen, Q.; Zou, S. SAM3-I: Segment Anything with Instructions. arXiv 2025, arXiv:2512.04585. [Google Scholar] [CrossRef]
  27. Li, J.; Wang, Z.; Sun, X.; Xu, N.; You, Z.; Huang, D. AutoSAM: Auto-Prompting Mamba-Based Vision Foundation Model for Multimodal Remote Sensing Semantic Segmentation. IEEE Trans. Geosci. Remote Sens. 2026, 64, 5612421. [Google Scholar] [CrossRef]
  28. Du, X.; Kolkin, N.; Shakhnarovich, G.; Bhattad, A. Generative models: What do they know? Do they know things? Let’s find out! arXiv 2023, arXiv:2311.17137. [Google Scholar]
  29. Labs, B.F.; Batifol, S.; Blattmann, A.; Boesel, F.; Consul, S.; Diagne, C.; Dockhorn, T.; English, J.; English, Z.; Esser, P. FLUX. 1 Kontext: Flow Matching for In-Context Image Generation and Editing in Latent Space. arXiv 2025, arXiv:2506.15742. [Google Scholar]
  30. Yang, C.; Liu, C.; Deng, X.; Kim, D.; Mei, X.; Shen, X.; Chen, L.-C. 1.58-bit FLUX. arXiv 2024, arXiv:2412.18653. [Google Scholar]
  31. Wu, C.; Li, J.; Zhou, J.; Lin, J.; Gao, K.; Yan, K.; Yin, S.-m.; Bai, S.; Xu, X.; Chen, Y. Qwen-image technical report. arXiv 2025, arXiv:2508.02324. [Google Scholar] [CrossRef]
  32. Hayou, S.; Ghosh, N.; Yu, B. Lora+: Efficient low rank adaptation of large models. arXiv 2024, arXiv:2402.12354. [Google Scholar]
  33. Wang, Z.; Ma, H.; Zhai, J. Low-rank adaptation for edge AI. Sci. Rep. 2025, 15, 33109. [Google Scholar] [CrossRef]
  34. Akbulut, Z.; Özdemir, S.; Karslı, F. Comparative Analysis of Vision Foundation Models for Building Segmentation in Aerial Imagery. Int. Arch. Photogramm. Remote Sens. Spatial Inf. Sci. 2025, XLVIII-M-6-2025, 23–29. [Google Scholar] [CrossRef]
  35. Council, B.C. Our City’s Housing and Homelessness Strategy; Brisbane City Council: Brisbane, QLD, Australia, 2023; p. 32.
  36. Şimşek, E.; Negin, F.; Özyer, G.T.; Özyer, B. Leveraging foreground–background cues for semantically-driven, training-free moving object detection. Eng. Appl. Artif. Intell. 2024, 136, 108873. [Google Scholar] [CrossRef]
  37. Labs, B.F. FLUX.2: Frontier Visual Intelligence; Black Forest Labs: Freiburg, Germany, 2025; Available online: https://bfl.ai/blog/flux-2 (accessed on 31 December 2025).
  38. Chen, T.; Cao, R.; Yu, X.; Zhu, L.; Ding, C.; Ji, D.; Chen, C.; Zhu, Q.; Xu, C.; Mao, P. SAM3-Adapter: Efficient Adaptation of Segment Anything 3 for Camouflage Object Segmentation, Shadow Detection, and Medical Image Segmentation. arXiv 2025, arXiv:2511.19425. [Google Scholar] [CrossRef]
  39. Xiong, X.; Wu, Z.; Lu, L.; Xia, Y. SAM3-UNet: Simplified Adaptation of Segment Anything Model 3. arXiv 2025, arXiv:2512.01789. [Google Scholar] [CrossRef]
  40. Dong, W.; Yu, J.; Huang, Y.; Wang, H.; Zhu, L.; Chung, A.; Ren, H.; Bai, L. More than Segmentation: Benchmarking SAM 3 for Segmentation, 3D Perception, and Reconstruction in Robotic Surgery. arXiv 2025, arXiv:2512.07596. [Google Scholar] [CrossRef]
  41. Han, J.; Yoon, S.; Kang, M.; Kim, T. Approach to Enhancing Panoramic Segmentation in Indoor Construction Sites Based on a Perspective Image Segmentation Foundation Model. Appl. Sci. 2025, 15, 4875. [Google Scholar] [CrossRef]
  42. Krizhevsky, A.; Sutskever, I.; Hinton, G.E. ImageNet classification with deep convolutional neural networks. Commun. ACM 2017, 60, 84–90. [Google Scholar] [CrossRef]
  43. Tournaire, O.; Brédif, M.; Boldo, D.; Durupt, M. An efficient stochastic approach for building footprint extraction from digital elevation models. ISPRS J. Photogramm. Remote Sens. 2010, 65, 317–327. [Google Scholar] [CrossRef]
  44. Sirmacek, B.; Unsalan, C. Urban-Area and Building Detection Using SIFT Keypoints and Graph Theory. IEEE Trans. Geosci. Remote Sens. 2009, 47, 1156–1167. [Google Scholar] [CrossRef]
  45. Argyridis, A.; Argialas, D.P. Building change detection through multi-scale GEOBIA approach by integrating deep belief networks with fuzzy ontologies. Int. J. Image Data Fusion 2016, 7, 148–171. [Google Scholar] [CrossRef]
  46. Powers, D.M. Evaluation: From precision, recall and F-measure to ROC, informedness, markedness and correlation. arXiv 2020, arXiv:2010.16061. [Google Scholar] [CrossRef]
  47. Osco, L.P.; Wu, Q.; de Lemos, E.L.; Gonçalves, W.N.; Ramos, A.P.M.; Li, J.; Marcato, J. The Segment Anything Model (SAM) for remote sensing applications: From zero to one shot. Int. J. Appl. Earth Obs. Geoinf. 2023, 124, 103540. [Google Scholar] [CrossRef]
  48. Benchabana, A.; Kholladi, M.-K.; Bensaci, R.; Khaldi, B. Building detection in high-resolution remote sensing images by enhancing superpixel segmentation and classification using deep learning approaches. Buildings 2023, 13, 1649. [Google Scholar] [CrossRef]
  49. Yin, J.; Wu, F.; Qiu, Y.; Li, A.; Liu, C.; Gong, X. A Multiscale and Multitask Deep Learning Framework for Automatic Building Extraction. Remote Sens. 2022, 14, 4744. [Google Scholar] [CrossRef]
  50. Shata, D.; Denman, S.; Omrani, S.; Drogemuller, R.; Ali, H.; Wagdy, A. Parameter-Efficient Adaptation of Generative-Foundation (Flux, Qwen) vs. Zero-Shot (Gemini, SAM3) Models for Aerial Image Segmentation [Data Set]. Zenodo. 2026. Available online: https://zenodo.org/records/18571111 (accessed on 31 December 2025).
  51. Art Pixels. Pixels-Art.com. Available online: https://www.pixels-art.com (accessed on 31 December 2025).
Figure 1. An example of the SAM 3 architecture segmentation process for an image [20].
Buildings 16 01369 g001
Figure 2. Schematic of the Low-Rank Adaptation (LoRA) framework within foundation models. Note: W represents frozen pretrained weights, while A and B denote the trainable low-rank matrices introduced during adaptation. Diagram generated via Google Gemini (2025) using a prompt to visualise core parameter-efficient techniques, training, and merging processes.
Buildings 16 01369 g002
Figure 3. An overview of the study area of the Brisbane Metropolitan City, latitude: 27.4705° S, longitude: 153.0260° E (aerial images adapted from Google Maps).
Buildings 16 01369 g003
Figure 4. The ground truth masks for the subset dataset (used during the model’s training) and the inverted mask (aerial images adapted from Google Maps).
Buildings 16 01369 g004
Figure 5. Visual summary of segmentation metrics and confusion matrix components derived from pixel-level mask overlap. Notes: TP, FP, FN, and TN represent True Positive, False Positive, False Negative, and True Negative pixels, respectively. These components are used to calculate primary performance metrics, including IoU, Dice coefficient, accuracy, precision, and recall. (A) Spatial Overlap Analysis: A schematic comparison between the Ground Truth (GT) and the Predicted Mask; (B) Pixel-Level Confusion Matrix: A categorical breakdown of classification outcomes; (C) Derivation of Performance Indicators: Graphical representation of the mathematical ratios used to assess model reliability. Diagram generated via Google Gemini (4 February 2025) using architectural guidance prompts to visualise metric logic.
Buildings 16 01369 g005
Figure 6. Representative performance results of rooftop segmentation for the fine-tuned FLUX.1-Kontext (aerial images adapted from Google Maps). Note: Results correspond to the 4250 LoRA checkpoint. This figure summarises the model’s overall performance and detailed prediction examples across the testing dataset.
Buildings 16 01369 g006
Figure 7. The performance of all zero-shot models, including SAM3. Notes: SAM3, accessed 18 December 2025; Gemini 3 Pro image preview, accessed 31 December 2025; FLUX Kontext, accessed 18 December 2025; Qwen Image Edit 2509, accessed 17 December 2025; FLUX.2, accessed 17 December 2025.
Buildings 16 01369 g007
Figure 8. Comparative zero-shot performance maps: SAM3 vs. FLUX Kontext vs. FLUX.2 vs. Qwen vs. Gemini over the testing dataset.
Buildings 16 01369 g008
Figure 9. The FLUX Kontext LoRAs’ performance, showing the checkpoints and prediction accuracy of the mean metric value.
Buildings 16 01369 g009
Figure 10. Best LoRA (Step 4250) prediction performance map across the testing dataset.
Buildings 16 01369 g010
Figure 11. Training stability and IoU distribution for Flux Kontext. Ridgeline plots show the evolution of per-roof overlap across fine-tuning checkpoints. The shaded reference band highlights the interquartile range at the optimal 4250-step checkpoint.
Buildings 16 01369 g011
Figure 12. The FLUX.2 LoRAs’ performance, showing the early checkpoint gain and the degradation of prediction accuracy of the mean metric value.
Buildings 16 01369 g012
Figure 13. Best LoRA (Step 750) prediction performance map across the testing dataset.
Buildings 16 01369 g013
Figure 14. Training stability and IoU distribution for FLUX.2. Ridgeline plots show the evolution of per-roof overlap across fine-tuning checkpoints. The shaded reference band highlights the interquartile range at the optimal 750 step checkpoint.
Buildings 16 01369 g014
Figure 15. Qwen LoRAs’ performance, showing the checkpoints and prediction accuracy of the mean metric value.
Buildings 16 01369 g015
Figure 16. Best LoRA (Step 3000) prediction performance map across the testing dataset.
Buildings 16 01369 g016
Figure 17. Training stability and IoU distribution for Qwen Image Edit. Ridgeline plots show the evolution of per-roof overlap across fine-tuning checkpoints. The shaded reference band highlights the interquartile range at the optimal 3000-step checkpoint.
Buildings 16 01369 g017
Figure 18. Comparison of IoU scores under Black-Building and White-Building evaluation configurations for the evaluated architectures.
Buildings 16 01369 g018
Figure 19. Quantitative comparison of zero-shot segmentation performance across evaluated models.
Buildings 16 01369 g019
Figure 20. The performance analysis shows fine-tuning effect on the model’s performance (Zero-Shot vs. LoRA-adapted).
Buildings 16 01369 g020
Figure 21. Qualitative results for image 107.png in the vertical column, for Zero-Shot models: FLUX Kontext, FLUX.2, Qwen, Gemini 3 Pro image preview, and SAM3. The legend colour shows the segmentation categories (aerial images adapted from Google Maps).
Buildings 16 01369 g021
Figure 22. Qualitative results for image 107.png in the vertical column, for LoRA fine-tuned FLUX Kontext, FLUX.2, Qwen vs. zero-shot models: Gemini 3 Pro image preview and SAM3. The legend colour shows the segmentation categories (aerial images adapted from Google Maps).
Buildings 16 01369 g022
Figure 23. The FLUX.2 performance sample shows that some buildings and roof overhangs were missed in segmentation (aerial images adapted from Google Maps).
Buildings 16 01369 g023
Figure 24. Gemini 3 Pro image preview performance sample shows misclassifications (aerial images adapted from Google Maps).
Buildings 16 01369 g024
Figure 25. The Qwen performance sample shows mixing buildings with adjacent vegetation and missing buildings (aerial images adapted from Google Maps).
Buildings 16 01369 g025
Figure 26. Example segmentation results for FLUX.1 Kontext evaluated on image 115 and checkpoint 4250. The comparison highlights the performance evaluation difference between Black-Building and White-Building mask polarities. (aerial imagery adapted from Google Maps).
Buildings 16 01369 g026
Figure 27. FLUX Kontext LoRA at step 4250 on image 104, illustrating confusion between visually similar surfaces such as parking areas and shipping containers as buildings (aerial images adapted from Google Maps).
Buildings 16 01369 g027
Figure 28. Shows FLUX.2, LoRA 750, image 113,115 and 116, clarifying over-segmentation of large planar surfaces, incorrectly classifying adjacent green recreational courts as rooftop structures, and missing part of large roofs (aerial images adapted from Google Maps).
Buildings 16 01369 g028
Figure 29. Shows Qwen, LoRA 5000, image 100, 102, and 119, where Qwen struggles with dense canopies, and confused cars and big vegetation with buildings (aerial images adapted from Google Maps).
Buildings 16 01369 g029
Table 1. Final dataset output.
Data TypeDescriptionQuantityFormat/Resolution
Primary aerial imageryHigh-resolution tiles9797PNG, 1024 × 1024 px
Ground-truth rooftop masksBinary masks121PNG, 1024 × 1024 px
LoRA trainingAerial images, corresponding binary masks97 training tiles and 24 test tilesPNG mask
Table 2. SAM3 parameter configurations for roof prediction.
ParameterDescriptionValue
Confidence thresholdMinimum confidence score to keep detection (range from 0 to 1)0.50
Pipeline modeSegmentation modePositive only
Max detectionsMaximum number of instances per tile100
InstancesKeeping only detections whose boxes overlap a positive box or contain a positive pointAll instances
Crop factorThe bounding box crop factor for building combined SEGS1.5
Min sizeMinimum region size for keeping segments (pixels)25
Fill holesPost-processing to fill internal holes in segmentsEnabled
Table 3. Training and system configuration.
ComponentSetting
Dataset size97 images
Resolutions bucketing512 × 512, 768 × 768, 1024 × 1024 px
Checkpoint intervalEvery 250 steps
Training steps5000
Table 4. Unified hyperparameter configuration for LoRA adaptation.
ParameterValuesDescription
Network architectureFLUX.1 Kontext, FLUX.2, and Qwen Image Edit 2509LoRA
LoRA linear rank/α32/32Rank and scaling for linear layers
LoRA convolutional rank/α16/16Rank and scaling for convolutional layers
OptimiserAdamW (8-bit)Memory-efficient optimiser
Learning rate1 × 10−4Fixed learning rate
Weight decay1 × 10−4Regularisation term
Loss functionMSE (latent residual)Mean squared error on diffusion residuals
Noise schedulerFlowMatchDynamic weighting across diffusion timesteps
Batch size1Per-step image batch
Training steps5000Total optimisation iterations
Precisionbf16 (mixed)Mixed precision for stability and speed
Table 5. The Comparison of Black- vs. White-Building masks’ IoU shows the value of the inflation gap.
Model Architecture“Black-Building” IoU“White-Building” IoUPerformance Difference (Δ)
FLUX.1 Kontext95.8%89%6.8%
Qwen Image Edit95.02%86.74%8.28%
Gemini 3 Pro image preview93.27%85.14%8.13%
SAM394.07%84%10.07%
FLUX.293.15%82%11.15%
Table 6. Best model performance (Values are reported as percentages and rounded to the nearest whole number).
Model CategoryModelParadigmIoUDiceAccuracyPrecisionRecall
Zero-ShotFLUX.1 KontextEditing (Zero-shot)4555797150
FLUX.2Editing (Zero-shot)6778909170
Qwen Image Edit 2509Editing (Zero-shot)3346634162
Gemini ProEditing (Zero-shot)8591959491
SAM3Segmentation-First8491969588
LoRA-AdaptedFLUX.1 KontextStep 42508994979693
FLUX.2Step 7508290959387
Qwen Image Edit 2509Step 30008793969690
Disclaimer/Publisher’s Note: The statements, opinions and data contained in all publications are solely those of the individual author(s) and contributor(s) and not of MDPI and/or the editor(s). MDPI and/or the editor(s) disclaim responsibility for any injury to people or property resulting from any ideas, methods, instructions or products referred to in the content.