


Abstract
Despite advances in deep learning for interior layout design, existing bubble diagram methods still rely on manual sketches or dataset retrieval. These methods use a binary functional relationship with simple adjacency logic, limiting end-to-end generation and integration of complex constraints. In contrast, bubble diagrams can represent more complex, overlapping relationships. This paper proposes a Functional Constraint Bubble Diagram (FCBD) framework for intelligent layout generation. Annotated interior data are encoded into structured representations capturing spatial boundaries, room functions, area constraints, and user preferences. A dual-branch Transformer is employed, where the Node Transformer learns function-aware room representations and the Edge Transformer models adjacency relationships under environment-aware constraints to enhance spatial coherence. Latent-space sampling enables multi-solution generation, while an interactive refinement mechanism supports real-time user adjustments. The generated bubble diagrams drive floor plan synthesis and are evaluated on layout rationality, functional compatibility, visual quality, and diversity. Experimental results show that FCBD achieves a functional accuracy of 92.0%, adjacency accuracy of 88.9%, the lowest room overlap of 0.038, and the highest layout diversity of 1.245. Compared to baselines, FCBD improves functional and adjacency accuracy by up to 10%, reduces room overlap by over 25%, and generates more diverse and well-connected layouts, significantly reducing manual design effort. The end-to-end experimental results verify the validity of the generated topology and the practical value of the FCBD framework in intelligent interior design.
1. Introduction
With the rapid development of artificial intelligence and deep learning technologies, automated spatial layout generation has emerged as a key research topic in computer-aided design and intelligent architecture [1,2]. Interior layout design, as a core component of spatial planning, directly affects functionality, usability, and user experience [3]. Among existing layout representation methods, bubble diagrams are widely adopted in early-stage architectural and interior design because they provide an intuitive abstraction of spatial organization, functional zoning, and adjacency relationships without requiring precise geometric constraints [4,5]. As a result, bubble diagrams serve as an effective intermediate representation bridging conceptual design and detailed floor plan generation.
In recent years, data-driven approaches have significantly advanced automated layout generation by leveraging large-scale annotated design datasets [6]. Deep generative models, including variational autoencoders, generative adversarial networks, and Transformer-based architectures, have demonstrated strong capabilities in capturing spatial patterns and semantic relationships. Despite these advances, many bubble diagram generation methods still rely heavily on manual sketch inputs or retrieval-based pipelines [7]. Such approaches often lack true end-to-end generation capabilities and exhibit limited flexibility in integrating functional constraints, environmental factors, and user preferences simultaneously, restricting their practical applicability in real-world design scenarios [8].
To address these limitations, researchers have explored various data-driven and learning-based methods for layout and floor plan generation. Hu et al. [9] proposed Graph2Plan, a deep neural framework that converts bubble diagrams into floor plans while allowing user-defined diagram constraints. However, it strongly depends on input diagrams retrieved heuristically or manually specified, and only generates discrete room bounding boxes requiring post-processing. Chen et al. [10] explored floor plan generation from natural language descriptions using graph convolutional networks and generative adversarial networks, with textual inputs first parsed into bubble diagram representations. Wang et al. [11] extended layout generation to 3D by predicting and assembling room volumes into complete indoor environments. Para et al. [12] proposed a hybrid framework combining constraint generation models with optimization-based layout solving, where sampled results correspond to bubble diagram node constraints and final layouts are obtained via linear programming. While these methods improve generation capability, they often rely on predefined intermediate representations or separated generation and optimization stages, limiting automation and design flexibility.
Pixel-based layout generation has also been widely investigated. Wu et al. [13] proposed a two-stage convolutional neural network to predict room locations and wall structures for automatic floor plan generation. Chaillou et al. [14] applied generative adversarial networks to generate building contours, floor plans, and furniture layouts. However, pixel-based representations make it difficult to directly obtain vectorized layouts and usually require raster-to-vector conversion. Furthermore, these methods provide limited support for user constraint control. To enhance layout diversity and structural reasoning, Nauata et al. [15] proposed House-GAN for floor plan generation conditioned on bubble diagrams, and later extended it to House-GAN++ [16] by integrating relational graph constraints and conditional GANs. Despite these advances, most existing methods still rely on externally provided bubble diagrams, lack unified modeling of functional and spatial constraints, and rarely support interactive refinement during generation.
In this paper, we classify existing layout generation methods based on their generative logic. Methods are categorized into two primary types: Constraint-driven and Emergent-driven. Constraint-driven methods (such as Graph2Plan, Graph-RWGAN, and FCBD) use the building’s external contour as a predefined hard constraint, guiding the room layout generation within the predefined boundary. In contrast, Emergent-driven methods (such as House-GAN and HouseDiffusion) first generate individual room layouts and then derive the building contour from these layouts. This distinction helps to highlight the different design logics underlying these methods and provides the theoretical foundation for the redesigned experimental setup in this work.
To overcome these challenges, this paper proposes a Functional Constraint Bubble Diagram (FCBD) framework for intelligent interior layout generation. Our method encodes annotated interior data into structured representations containing spatial boundaries, functional attributes, area constraints, and user preferences. A dual-branch Transformer architecture is designed to decouple function-aware room representation learning and environment-aware adjacency modeling through a Node Transformer and an Edge Transformer, respectively. Furthermore, a latent-space sampling strategy enables diverse multi-solution generation, while an interactive refinement mechanism allows users to iteratively adjust generated layouts in real time. The main contributions of this work are summarized as follows:
- End-to-end functional layout generation: We propose a novel Functional Constraint Bubble Diagram (FCBD) framework that unifies bubble diagram generation with integrated functional and spatial constraints, enabling fully automated end-to-end layout synthesis without relying on manually specified intermediate representations.
- Decoupled structural and functional modeling: We design a dual-branch Transformer architecture, where a Node Transformer captures function-aware room representations and an Edge Transformer models environment-aware adjacency relationships, improving spatial coherence while providing flexible constraint integration.
- Support for diverse design exploration: We introduce a latent-space sampling strategy that generates multiple plausible layout solutions from a single input, facilitating diverse conceptual design exploration and offering designers a broader set of alternatives.
- Human-in-the-loop interactive refinement: We develop an interactive refinement mechanism that allows users to iteratively adjust generated layouts in real time, enhancing usability and bridging the gap between automated generation and practical human-centered design workflows.
2. Related Work
2.1. Bubble Diagram & Graph-Based Layout Generation
Bubble diagrams are widely adopted in early-stage architectural and interior design as an intuitive abstraction of spatial organization, functional zoning, and adjacency relationships. By representing rooms as nodes and spatial relationships as edges, bubble diagrams provide a flexible intermediate representation that bridges conceptual design and detailed floor plan generation. A key strength of bubble diagrams is their ability to represent complex and overlapping spatial and functional relationships, which is a key advantage of this representation paradigm in architectural design [17]. Graph-based deep learning methods leverage this flexible representation to capture both functional and spatial patterns, facilitating the generation of layouts that respect adjacency constraints and room semantics. Extensions to these methods may also integrate natural language inputs or relational constraints to improve structural reasoning and support more diverse layout outputs.
Despite their inherent advantages, existing bubble diagram methods used for layout generation, which predominantly adopt a binary functional relationship-based bubble diagram variant, face several specific limitations. Many frameworks still rely on manually specified or heuristically retrieved instances of this binary bubble diagram variant, limiting generalization to novel designs [18]. Generated layouts are often discrete room bounding boxes that require post-processing to form usable floor plans. Additionally, the binary nature of these diagrams fails to fully exploit the general capability of bubble diagrams to model complex, overlapping spatial and functional constraints. Consequently, unified modeling of such complex constraints is rarely achieved, and multi-solution generation remains limited. Furthermore, interactive human-in-the-loop refinement is typically absent, and traditional applications of this binary bubble diagram variant rarely incorporate building boundaries as positional embeddings.
These limitations of the binary functional relationship-based bubble diagram variant highlight the need for frameworks that combine automated generation with flexible integration of complex constraints and user-centered interaction. This motivates the development of the proposed FCBD approach.
2.2. Image-Based Layout Generation
Image-based approaches treat floor plans as raster representations and generate layouts using convolutional or generative networks. By modeling room locations, wall structures, and furniture arrangements as pixel-level predictions, these methods enable end-to-end synthesis of detailed floor plans without requiring explicit intermediate representations. Two-stage convolutional networks can first predict room locations and then segment wall structures, while generative adversarial networks (GANs) have been applied to produce complete building contours, floor plans, and interior arrangements [19]. This paradigm allows automated generation of visually coherent layouts and provides a direct route from input boundaries or semantic cues to final floor plans.
Despite their strengths, pixel-based representations introduce several challenges for practical design applications. Raster layouts are difficult to convert into vectorized formats required for construction or CAD workflows, and the conversion process may introduce geometric inaccuracies. In addition, these methods generally offer limited flexibility for incorporating user-defined functional or spatial constraints, reducing their adaptability to diverse design requirements [20,21]. While image-based models can produce plausible layouts, the lack of integrated constraint control and multi-solution generation limits their utility in early-stage conceptual design, motivating the need for hybrid or graph-based approaches that combine automation with functional and spatial reasoning.
2.3. Constraint-Aware & Hybrid Layout Generation
To improve the controllability and rationality of generated layouts, recent studies have focused on constraint-aware and hybrid methods that integrate learning-based generation with optimization or rule-based reasoning. These approaches encode functional, spatial, and environmental constraints into the generation process, allowing layouts to satisfy adjacency requirements, room size specifications, and user preferences [22]. Some frameworks combine constraint sampling with optimization solvers, producing layouts that adhere to node or edge-level constraints derived from intermediate representations, while others extend learning-based models to 3D spaces to capture volumetric relationships between rooms and building structures [23]. Current studies can be divided into two main directions: (i) learning-based generation combined with optimization solvers, and (ii) rule-based reasoning integrated with deep learning models [24,25]. A small number of recent studies focus on unified constraint modeling and end-to-end integration for indoor layout generation, highlighting a significant research gap in multi-constraint fusion for practical design.
Despite these advancements, existing constraint-aware and hybrid methods still face several challenges. Many rely on separate stages for constraint generation and layout optimization, preventing fully end-to-end synthesis. Multi-solution generation is often limited, restricting exploration during conceptual design. Interactive human-in-the-loop refinement is rarely incorporated, reducing flexibility for designers to iteratively adjust layouts [26]. Moreover, unified modeling of functional semantics, spatial adjacency, and environmental constraints remains an open problem. These limitations emphasize the need for frameworks that unify automated generation, flexible constraint management, and interactive human-in-the-loop support, motivating the development of the proposed FCBD framework. The FCBD framework addresses these issues by integrating functional semantics, adjacency relationships, and building boundary constraints into a single end-to-end model, supporting automated layout generation, diverse solution sampling, and interactive refinement for real-time design adjustments.
3. Preparation Work
3.1. Layout Data and Annotation
We represent a building layout as a set of rooms , where each room is described by its functional type, area, centroid coordinates, open/closed space category, and optional environmental attributes:
where denotes the room function, is the room area, is the binary label for open/closed space (0 for closed indoor spaces such as bedroom, kitchen, bathroom; 1 for semi-open outdoor spaces such as balconies), and encodes additional context such as lighting or window orientation (with priority encoding of lighting conditions for open spaces like balconies). All room centroids must lie within the building boundary :
For semi-open balcony spaces, we add a hard spatial constraint in the data annotation stage: the centroid of the balcony must be located at the building’s external boundary to conform to practical architectural design norms (i.e., balconies adjoin the building’s exterior for natural lighting and ventilation).
Adjacency relationships are captured as edges , forming a graph . Each edge encodes both adjacency and spatial constraints:
where represents adjacency requirement, is the minimum allowed distance between room centroids, and is the relative orientation.
User-defined functional and spatial preferences are encoded as constraints over rooms and edges. For example, the combined area of a subset of rooms with a specific function f is limited by:
where denotes all rooms of type f and is the user-specified upper bound. These structured representations, including node attributes, edge constraints, and boundary conditions, provide a mathematically rigorous foundation for subsequent layout generation, enabling models to reason jointly over functional semantics, spatial arrangements, and user preferences. In this work, for the efficiency and interpretability of end-to-end indoor layout generation, we adopt a binary functional relationship-based bubble diagram variant as the intermediate representation, while acknowledging that bubble diagrams in general can represent more complex, overlapping spatial relationships.
3.2. Structured Representation of Rooms and Adjacency
To capture both the semantic and geometric relationships among rooms, the layout is represented as a directed, attributed graph , where each node encodes room-level features and each edge represents adjacency and spatial interaction [27]. Edges model relational constraints such as relative position, alignment, and functional dependency. We introduce a derivation preamble for : it is constructed based on adjacency requirement, spatial distance, and relative orientation, with an overlap penalty to ensure geometric feasibility. The adjacency and orientation between rooms are formalized as:
where indicates adjacency requirement, normalizes the centroid distance to , is preferred orientation, with normalized to , and with ranges . Global layout constraints are expressed via aggregated edge interactions:
where is edges between functionally related rooms, , and the first term enforces pairwise topological constraints while the second term ensures functional area consistency. User preferences and environmental factors can be added:
where evaluates environmental attributes and controls their influence. This provides a mathematically validated representation of room semantics, adjacency, spatial alignment, and environmental preferences.
3.3. Constraint Encoding and Preprocessing
To enable effective layout generation, all functional, spatial, and user-defined constraints are encoded into mathematically tractable forms. Let denote the set of all constraints for a layout. Each constraint can be represented as a function
where denotes adjacency requirements, are room centroids, is the relative orientation, and are weighting coefficients. We note that each term in is continuous and differentiable in its domain (, ), and their sum preserves differentiability, ensuring the function can be optimized via gradient descent.
Preprocessing of layout data ensures numerical stability and consistency. Room areas and coordinates are normalized as
and invalid or inconsistent layouts, such as overlapping rooms or missing adjacency labels, are filtered or corrected.
Finally, global layout constraints are aggregated into a single objective:
where is determined via entropy weighting and normalized to , with , controls area deviation influence, and is the target area for rooms of function f. A threshold is applied: when , topological and functional constraints are considered satisfied, providing a clear evaluation criterion for model predictions.
These encoded and preprocessed constraints form a consistent, differentiable, and numerically stable foundation for downstream layout generation models that must reason jointly about room semantics, spatial relations, and user preferences.
3.4. Prior Assumptions and Design Principles
To ensure tractable and consistent layout generation, several prior assumptions are adopted [28,29]. First, all layouts are assumed to lie on a two-dimensional plane, and each room is represented as a polygonal region with a single centroid . This allows spatial relationships to be encoded using Euclidean distance and orientation metrics:
These geometric assumptions facilitate explicit modeling of adjacency, alignment, and orientation constraints between rooms while maintaining computational efficiency.
Second, functional and environmental constraints are assumed to be quantifiable and representable as numerical or continuous variables. For instance, each functional type is associated with target area and allowable deviation :
Similarly, adjacency preferences are encoded as weighted indicators or continuous penalties, enabling the generation model to reason about soft and hard constraints in a unified framework.
Finally, design principles guide the overall structure of layouts, emphasizing spatial coherence, functional compatibility, and user-centered flexibility. These principles are formalized as a composite objective function:
where weights adjacency satisfaction, penalizes deviation from target area, evaluates environmental or user-preference factors, and balances their influence. These prior assumptions and design principles provide a rigorous mathematical foundation, ensuring that subsequent layout generation respects both geometric feasibility and functional reasoning.
4. Methodology
4.1. Overview of the FCBD Framework
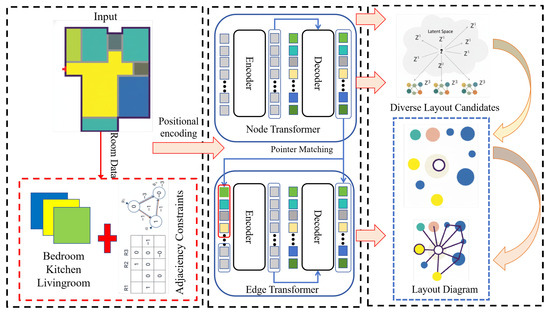
The Functional Constraint Bubble Diagram (FCBD) framework is designed to generate intelligent interior layouts in an end-to-end manner while systematically integrating functional, spatial, and user-defined constraints. Building on the structured representations introduced in the Preparation Work, FCBD treats a layout as a graph where each node represents a room with attributes such as functional type, area, and contextual features, and each edge encodes adjacency and spatial relationships. The framework leverages these structured representations to jointly reason about room semantics, geometric feasibility, and user preferences.
Formally, given a set of rooms within a building boundary , along with adjacency relationships and a set of constraints encompassing functional requirements, area limits, and environmental preferences, the FCBD framework learns a mapping
where is the generated bubble diagram representing room positions and adjacency. This formulation directly corresponds to the structured representations defined previously: node attributes from provide function-aware features, edges from encode spatial and adjacency constraints, and represents global or user-defined conditions. By explicitly modeling both nodes and edges, the framework ensures that generated layouts respect functional zoning, adjacency preferences, and spatial feasibility simultaneously.The FCBD framework consists of four key components, which are illustrated in Figure 1:
Figure 1.
Overview of the Functional Constraint Bubble Diagram (FCBD) framework.
- Node Transformer: Processes node attributes to generate function-aware embeddings that capture room semantics.
- Edge Transformer: Models pairwise adjacency and spatial relationships, enforcing environment-aware constraints across room pairs.
- Latent-space Sampling Module: Explores the learned representation space to produce diverse layout solutions while maintaining constraint consistency.
- Interactive Refinement Mechanism: Allows users to iteratively modify node or edge properties, updating embeddings and adjacency relations in real time to satisfy updated preferences or constraints.
Overall, the FCBD framework bridges the gap between conceptual bubble diagrams and concrete floor plan generation by providing a mathematically rigorous, structured, and interactive approach. It unifies the representations and constraints defined in the Preparation Work with a learning-based generation model, ensuring both automation and user-guided refinement are supported throughout the layout design process.
4.2. Input Representation and Preprocessing
In order to efficiently encode layouts for the FCBD framework, we represent each room as a structured feature vector capturing higher-order properties beyond simple area and function. Let denote the high-dimensional feature embedding of room , defined as
where is the one-hot encoded functional type, is the area, represents additional contextual or user-preference features, and are learnable projection matrices. The logarithmic scaling of ensures numerical stability while preserving relative differences between room sizes.
Building boundaries are extracted directly from the annotated floorplans in the RPLAN dataset and represented as polygons defined by ordered 2D vertices. These vertices are encoded into positional embeddings and concatenated with room node embeddings, allowing the Transformer to incorporate boundary geometry into the input feature space for both topology generation and floorplan synthesis. Adjacency relationships between rooms are encoded as a matrix of pairwise compatibility scores:
where is a sigmoid function, encodes prior adjacency preferences or geometric compatibility, and balance semantic and spatial contributions. This representation allows the model to reason about which room pairs are likely to be adjacent under the given constraints.
Global layout constraints are aggregated into a penalty function to guide preprocessing:
where is the target embedding centroid for function type , and weights the importance of functional compliance. This formulation allows preprocessing to favor feature-consistent, adjacency-compatible layouts before training or generation.
To effectively encode the input layouts for the FCBD framework, we transform each room into a structured embedding capturing functional, spatial, and contextual features. The preprocessing also computes pairwise adjacency compatibility scores and aggregates global layout constraints into a penalty function to guide downstream generation.
The detailed preprocessing procedure is summarized in Algorithm 1, which illustrates the steps from raw layout data to node embeddings and adjacency matrices. First, each room’s functional type is one-hot encoded, its area is logarithmically scaled for numerical stability, and additional contextual features are aggregated. Next, pairwise compatibility scores are computed and combined with semantic embeddings to form the adjacency matrix. Finally, a global penalty function ensures that the preprocessed layout favors functional compliance and adjacency consistency. This preprocessing pipeline enables FCBD to efficiently reason about room-level semantics and inter-room relationships during both training and generation.
4.3. Dual-Branch Transformer Architecture
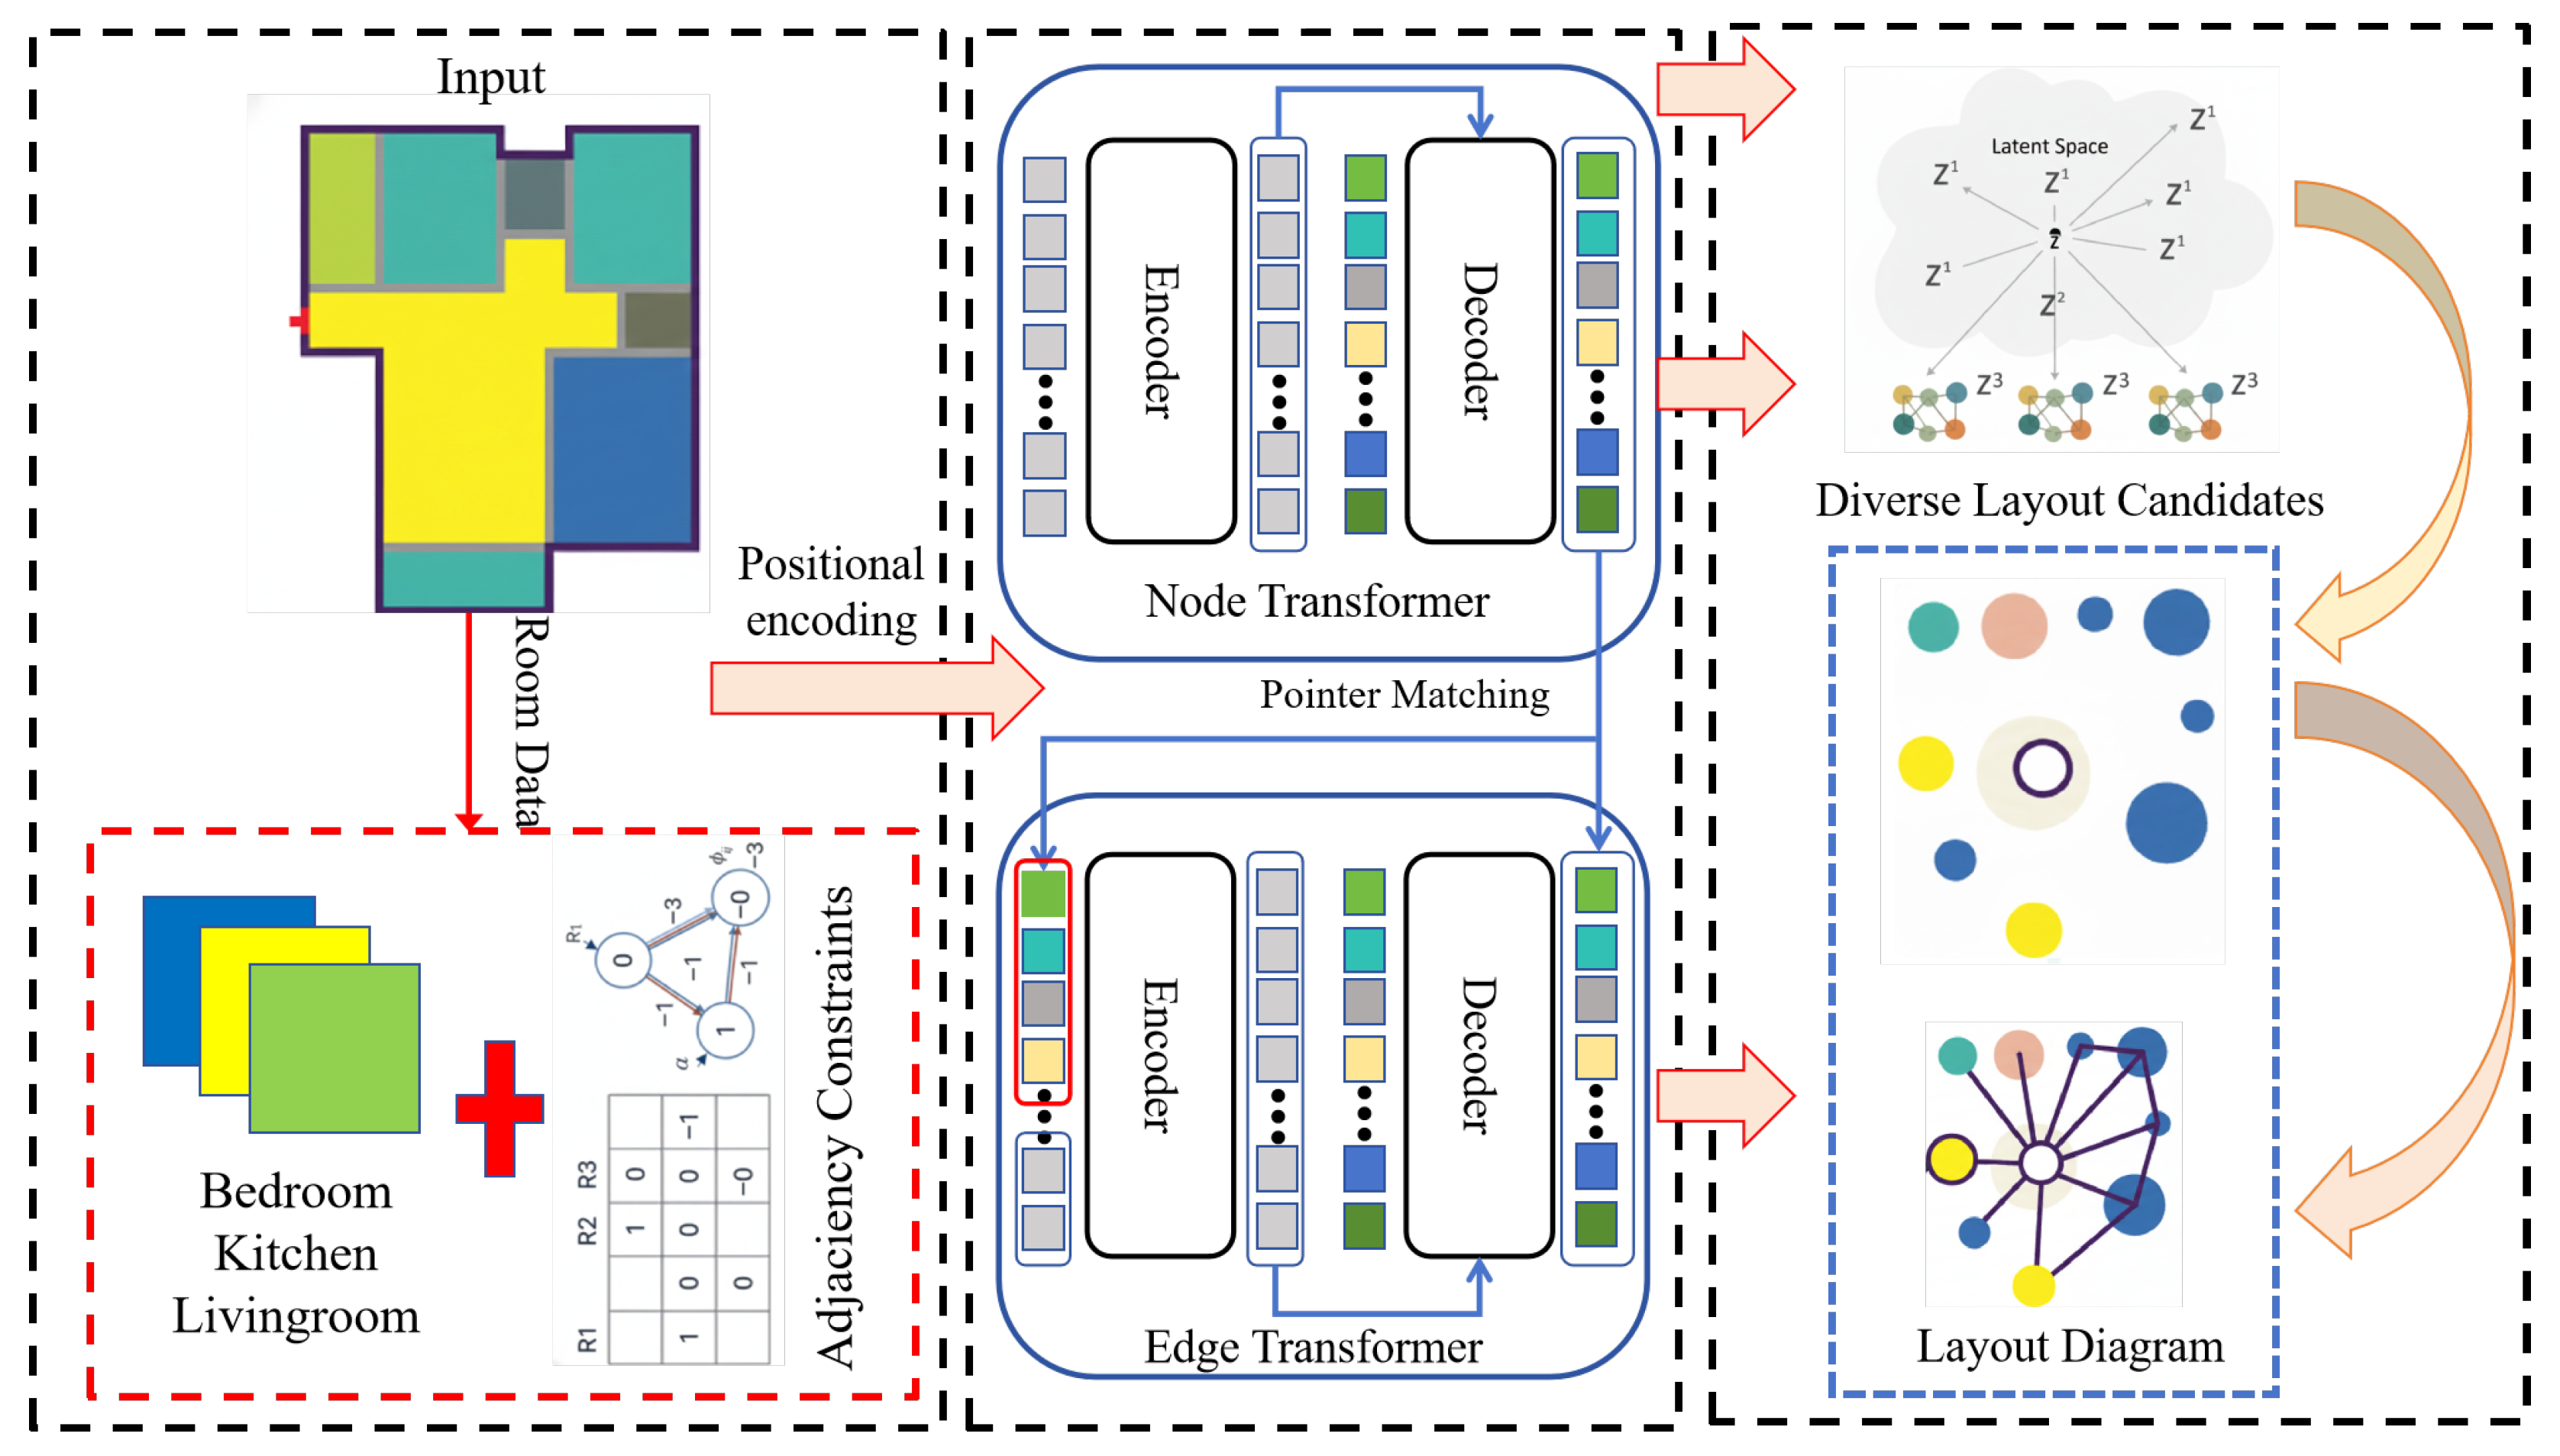
The core of the FCBD framework is the dual-branch Transformer architecture, which separates the modeling of room functional semantics and adjacency relationships. This design allows the model to capture both individual room characteristics and inter-room spatial dependencies simultaneously. The dual-branch Transformer architecture is illustrated in Figure 2. As shown, the framework consists of two parallel branches: the Node Transformer, which encodes functional semantics for each room, and the Edge Transformer, which models adjacency and spatial relationships between room pairs. After independent processing, the node and edge representations are fused to form a unified graph embedding, enabling the model to jointly reason about room functionality and spatial feasibility. This design implements a node-edge fusion mechanism where each room node selectively aggregates topological information from connected edges, based on the correlation strength, ensuring embeddings contain both functional semantics and topological constraints.
| Algorithm 1 Input Representation and Preprocessing for FCBD |
| Require: Raw layout data: rooms , adjacency , functional targets , building boundary polygons Ensure: Preprocessed node embeddings and adjacency matrix M
|
Figure 2.
Schematic of the Dual-Branch Transformer architecture.
Node Transformer: Each room node is embedded as (from the preprocessing stage). The Node Transformer updates the room embedding using multi-head self-attention over all nodes:
where represents the set of all room embeddings. This allows each room to incorporate global functional context from all other rooms.
Edge Transformer: To model adjacency and spatial constraints, edge embeddings are processed by a separate attention mechanism:
where contains all adjacency features. This branch explicitly encodes pairwise spatial relations and constraint compliance.
Node-Edge Fusion: Finally, the node and edge representations are fused:
where is the set of adjacent nodes of (corrected from previous notation), and measures the topological correlation and is normalized via softmax:
This ensures and , preventing over- or under-aggregation of edge information. The fusion formula is continuous and differentiable with respect to and , ensuring gradients propagate correctly for model training.
This dual-branch design ensures that room semantics and spatial relationships are modeled independently yet integrated effectively, providing a strong foundation for generating functionally coherent and spatially consistent bubble diagrams.
4.4. Latent Space Sampling and Interactive Refinement
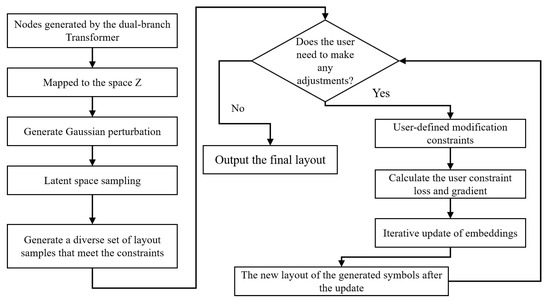
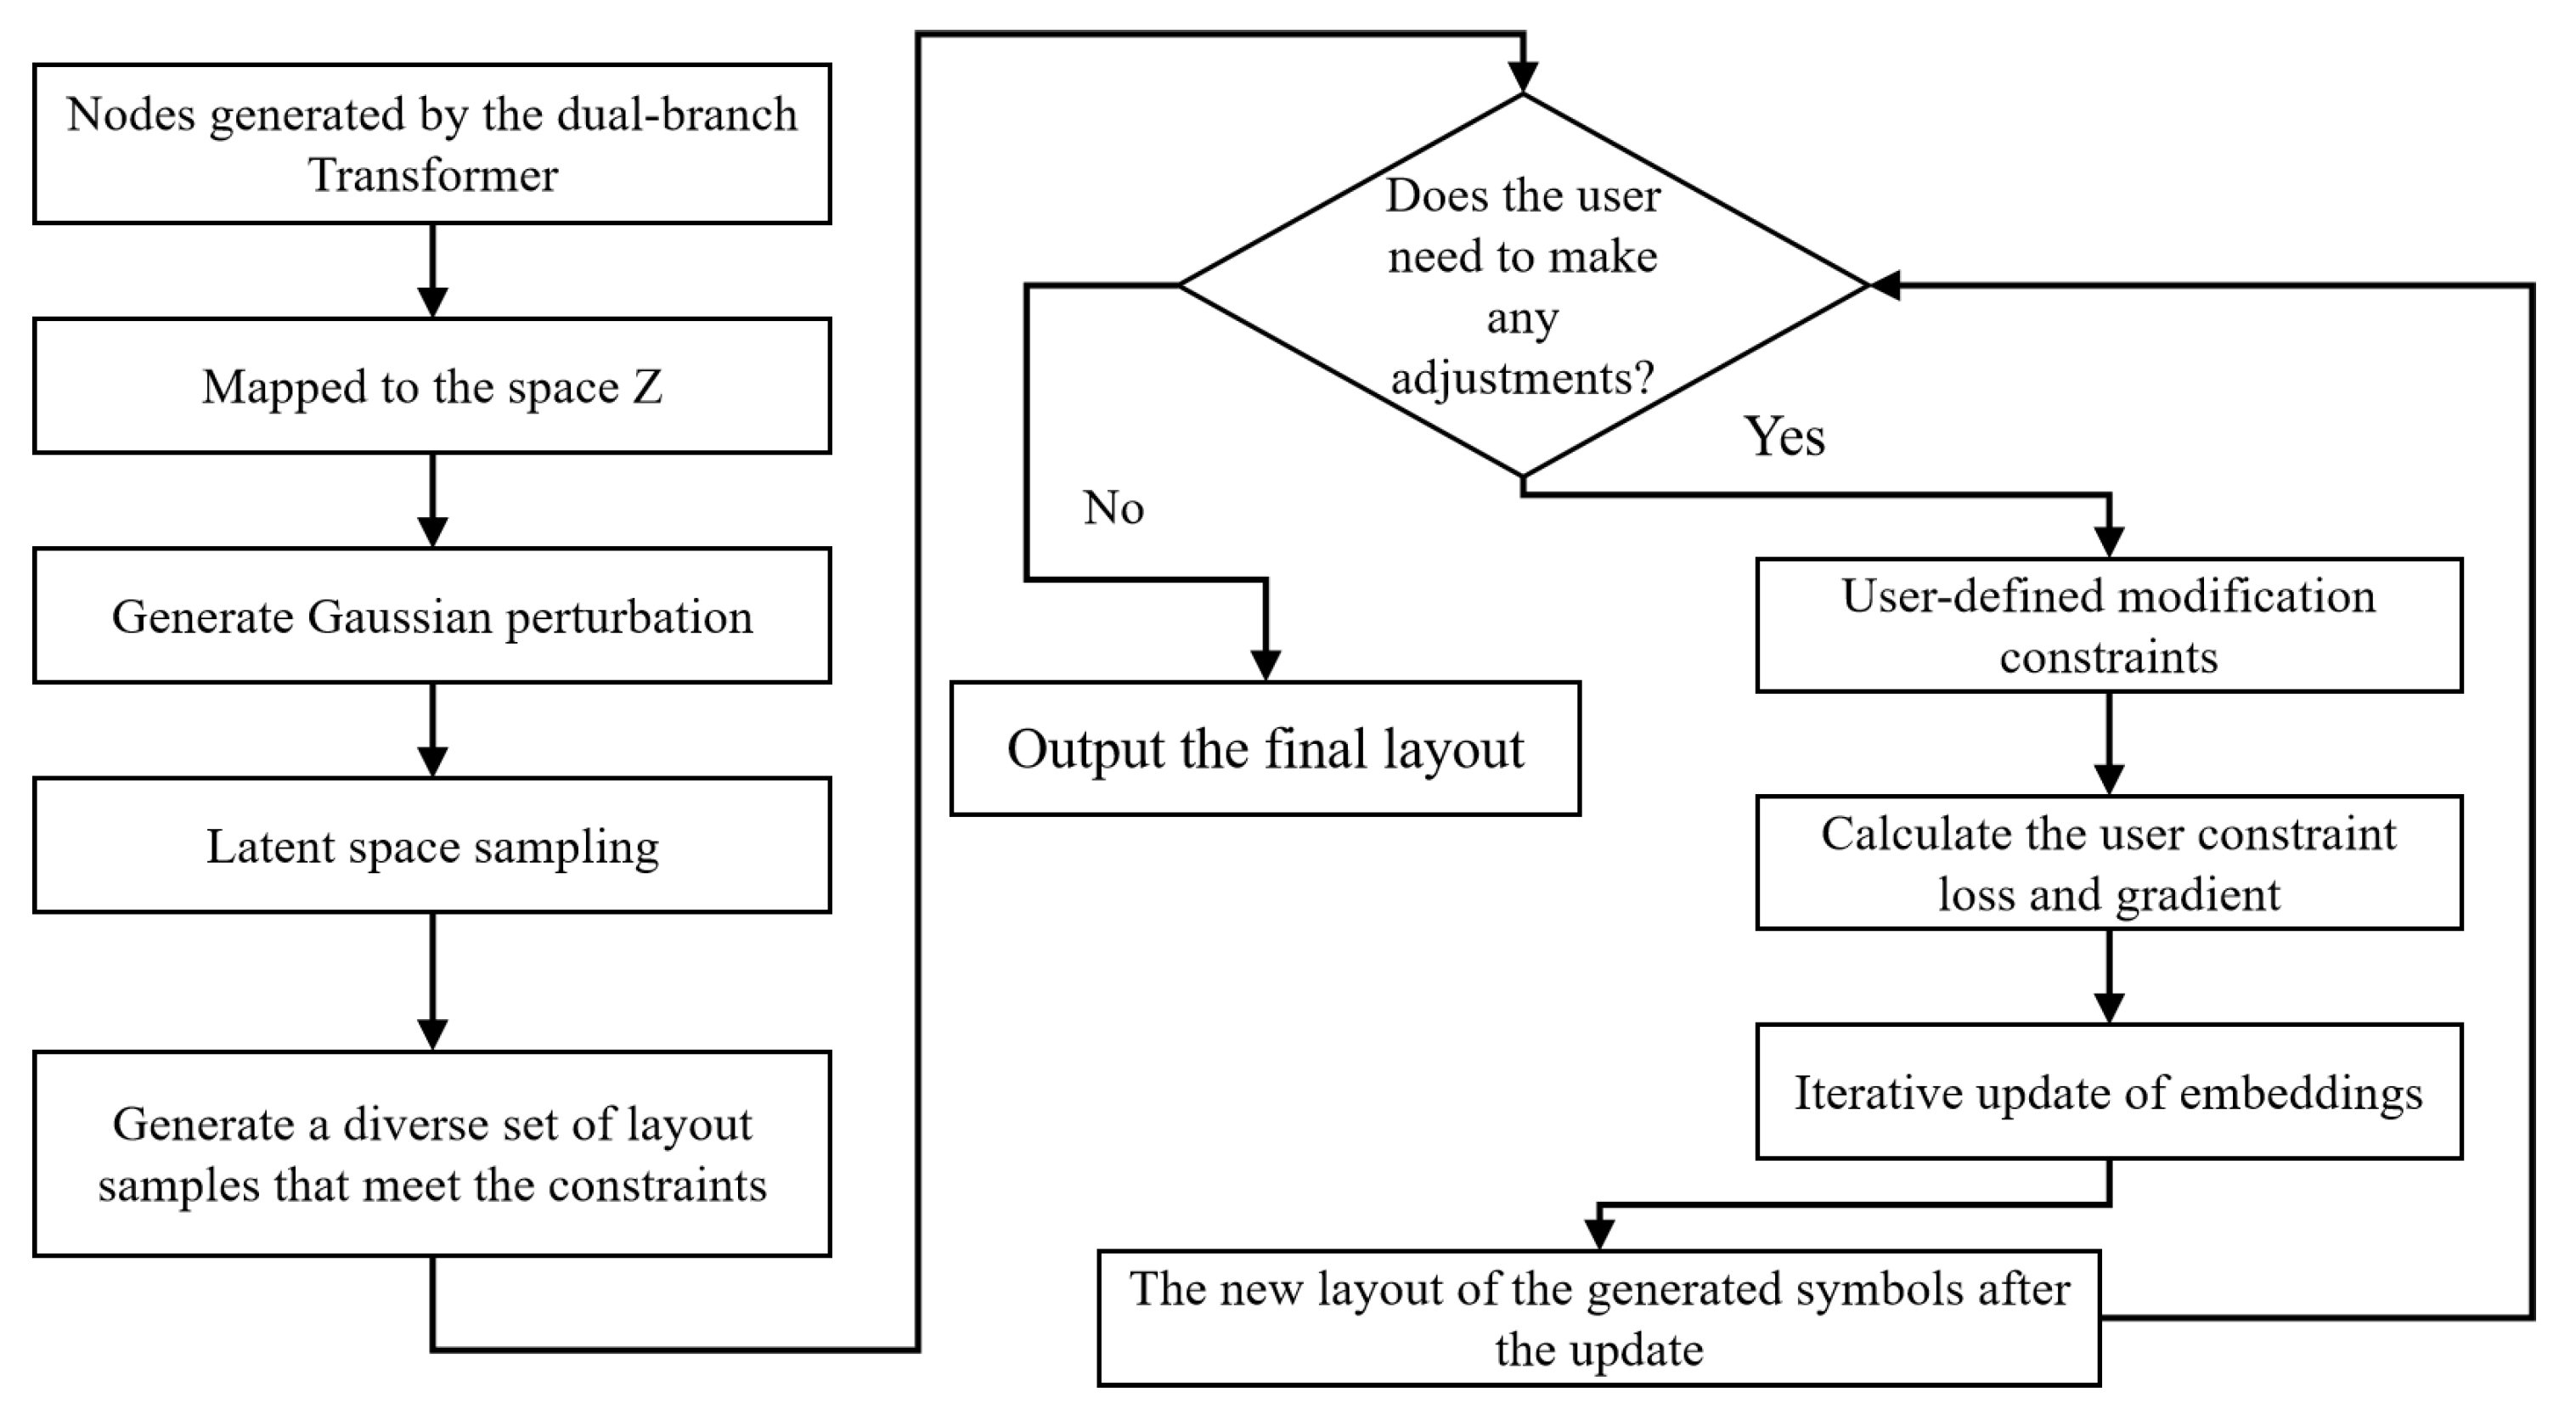
To enhance the diversity of generated layouts and support human-in-the-loop adjustments, the FCBD framework employs a latent-space sampling strategy coupled with an interactive refinement mechanism. After the dual-branch Transformer produces node-edge embeddings , these embeddings are mapped into a latent space , which captures variations in room placement and adjacency patterns:
where is a small perturbation sampled from a Gaussian distribution, and s indexes different layout samples. By sampling multiple values, the framework can generate a set of diverse, yet constraint-compliant, bubble diagrams.
The generated samples can then be interactively refined by the user. Let denote user-specified modifications, such as adjusting room positions, resizing areas, or modifying adjacency priorities. The embeddings are updated iteratively:
where is a differentiable loss measuring deviations from user-specified constraints, and is the refinement step size. This enables real-time, gradient-guided layout adjustment while preserving global functional and spatial consistency. As illustrated in Figure 3, the node-edge embeddings are first perturbed in the latent space to generate diverse layout candidates, which are then iteratively refined through user interactions to satisfy updated design preferences.
Figure 3.
Illustration of the Latent-Space Sampling and Interactive Refinement process.
This latent-space sampling combined with interactive refinement ensures that the FCBD framework not only produces diverse layout solutions but also supports human-guided adjustments, bridging automated generation and practical design requirements.
4.5. Layout to Floorplan Synthesis
After generating function-aware and adjacency-consistent bubble diagrams through the FCBD framework, the next step is to synthesize them into concrete floorplans. This involves converting abstract nodes and edges into geometric room layouts that respect building boundaries, adjacency constraints, and area requirements.
Let denote the generated bubble diagram. Each node has a tentative centroid and area , and edges encode adjacency. To convert these into bounding boxes, we define a geometric optimization problem:
where are weighting coefficients controlling overlap, adjacency, and area consistency, and the termination criterion is either or 200 iterations. During topology generation, room nodes are initially positioned inside the building boundary polygon, and adjacency updates are restricted to prevent any centroid from leaving the boundary. During bounding-box optimization, the building boundary acts as a hard constraint: any bounding box exceeding the polygon incurs a penalty in , ensuring all rooms remain strictly within the building footprint. Regular rooms use rectangular bounding boxes, while irregular boundaries employ polygonal fitting.
The synthesis process is implemented as a multi-step procedure combining greedy placement, local refinement, and iterative constraint satisfaction. We summarize it in Algorithm 2.
We also define three quantitative evaluation indicators for the synthesized floorplans: Geometric Feasibility (GF) measuring the proportion of non-overlapping rooms, Layout Compliance (LC) via IoU of functional zones, and Construction Rationality (CR) as the ratio of usable room area to total building area. These metrics ensure fair evaluation across all methods and link topology quality to final floorplan performance.
This approach allows the FCBD framework to generate visually coherent and functionally compliant floorplans from abstract bubble diagrams, completing the end-to-end pipeline from layout generation to detailed plan synthesis.
| Algorithm 2 Layout-to-Floorplan Synthesis with Boundary Constraints and Key Parameters |
| Require: Generated bubble diagram , adjacency , area targets , building boundary polygon Ensure: Synthesized floorplan with bounding boxes for each room
|
5. Experimental Setup
5.1. Datasets and Annotation
To evaluate the proposed FCBD framework, we construct a large-scale Bubble Diagram dataset based on the widely recognized RPLAN dataset [30], which contains over 60,000 annotated residential floor plans. The RPLAN dataset can be accessed from the official project page (accessed on 10 June 2025): https://ustc-gcl-f.github.io/projects/DeepLayout/index.html. The Bubble Diagram dataset abstracts each floor plan into a graph representation suitable for intelligent layout generation.
(1) Data Representation:
Each bubble diagram is represented as a graph
where is the set of nodes corresponding to rooms, and is the set of edges representing adjacency relationships between rooms. Each node is characterized by
where denotes the centroid position of the room, is the room type (e.g., bedroom, kitchen), and indicates the relative area proportion of the room within the layout.
Bubble diagrams do not encode the exact geometric layout of a floor plan; instead, they provide a high-level abstraction of spatial organization and functional zoning. Through bubble diagrams, the overall structure, room sizes, and adjacency hierarchy of functional areas can be inferred. Recent studies have shown that bubble diagrams can effectively drive floor plan generation, where the input bubble diagram serves as a core prior for subsequent layout synthesis.
(2) Data Processing
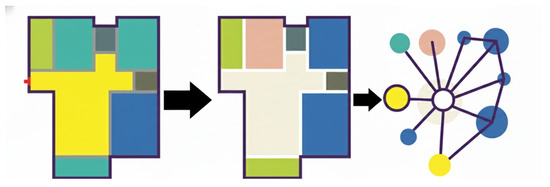
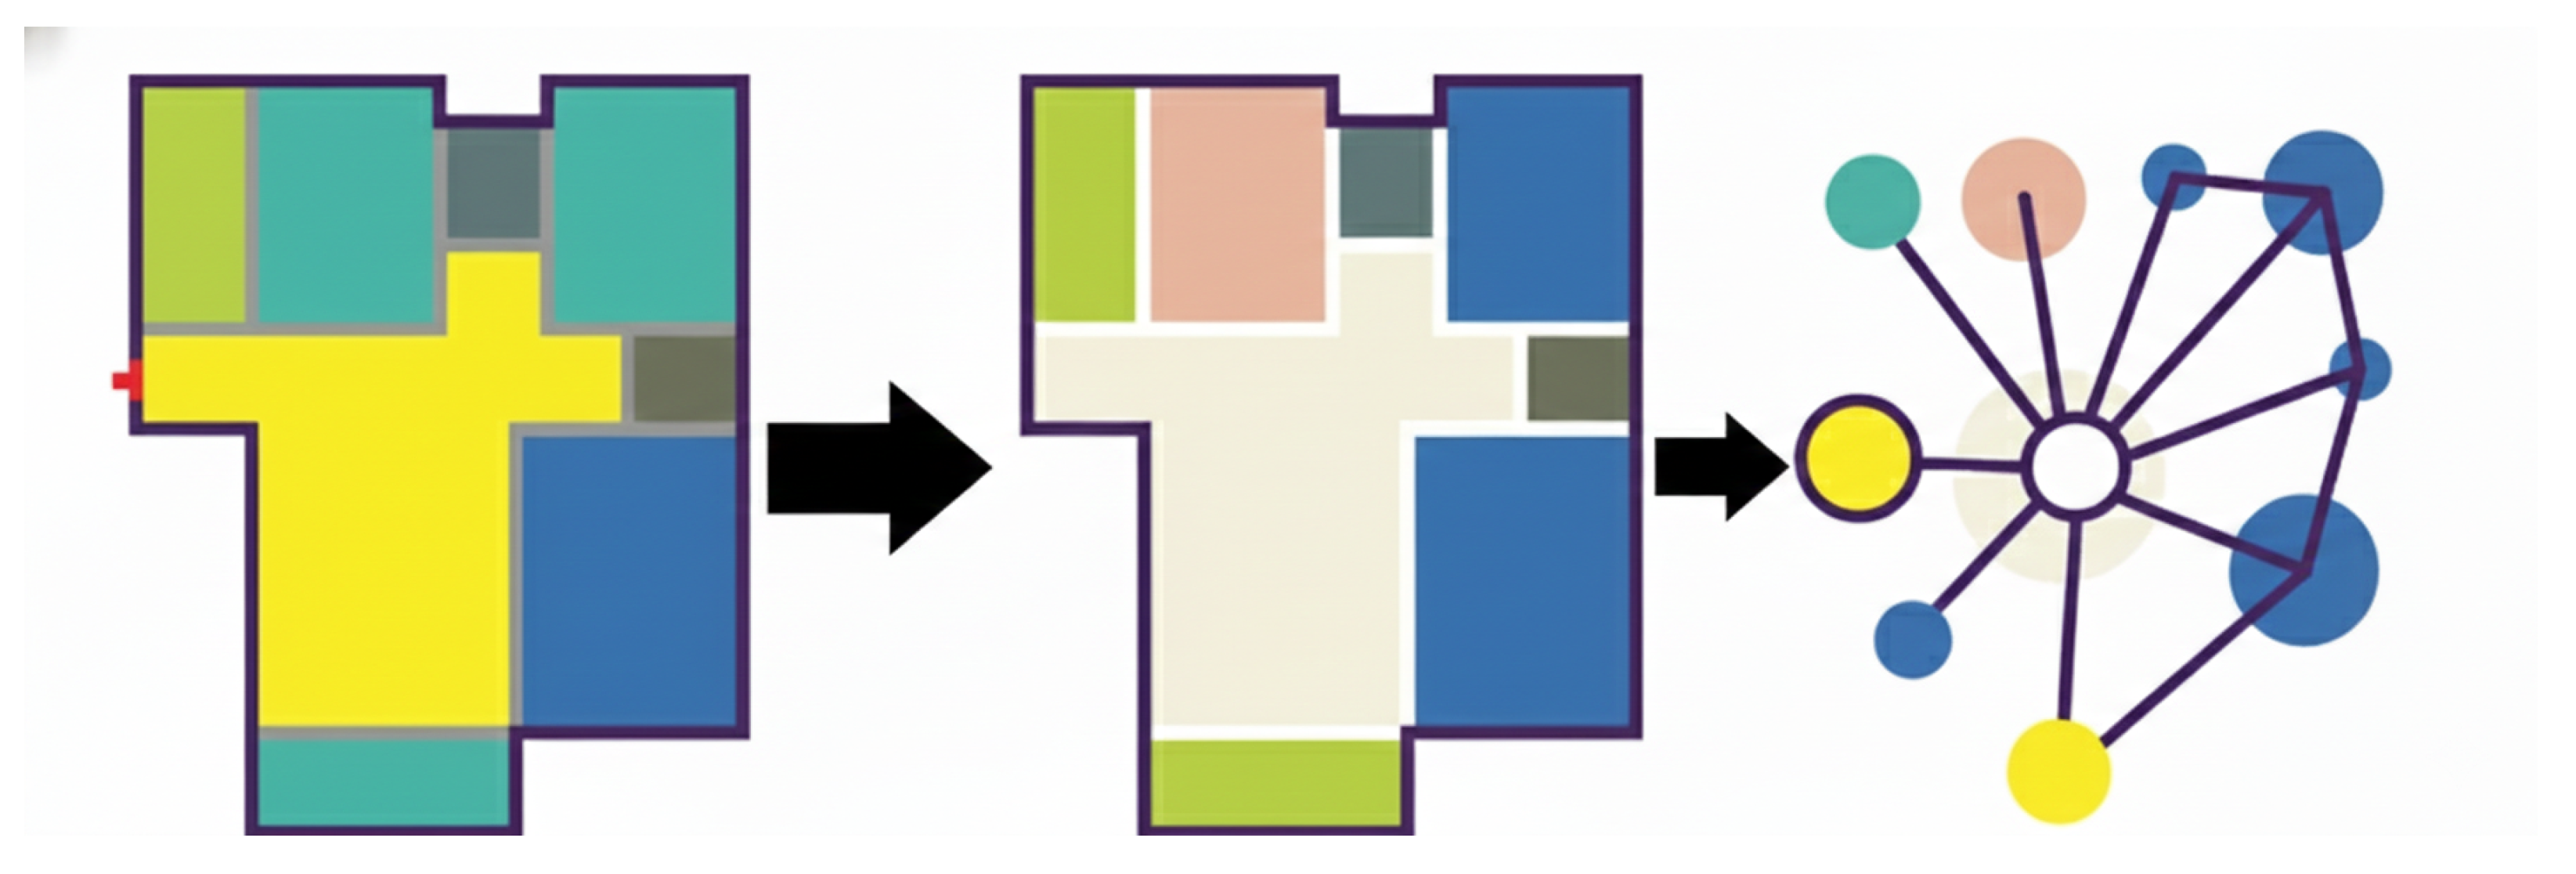
To construct the Bubble Diagram dataset, we extract layout information from the RPLAN dataset. For each floor plan, individual rooms are treated as nodes , with attributes , , and computed from room centroids, functional labels, and area ratios, respectively. Adjacency edges are determined by identifying spatially adjacent rooms in the floor plan. Finally, node attributes including room type and normalized area proportion are incorporated into the bubble diagram, forming the structured graph representation that serves as input to the FCBD framework.
For dual experimental settings, the data processing differs as follows:
- Setting 1 (Constraint-driven): Uses vector data for predefined building contours. The external contour of the building is provided as a hard constraint, and the room layouts are generated within this boundary.
- Setting 2 (Emergent-driven): Uses room layout data only, excluding the predefined contours. The building contour is emergently generated from the room layouts as part of the generation process, without relying on predefined contour information.
The dataset preparation involves two main steps: data representation and data processing, as illustrated in Figure 4.
Figure 4.
Example of Bubble Diagram dataset construction from RPLAN. (The left picture shows the rooms extracted from the dataset, the middle picture divides the nodes, and the right picture shows the extracted bubble chart.)
This large-scale Bubble Diagram dataset provides a structured and semantically rich foundation for training and evaluating end-to-end layout generation models, supporting both multi-solution synthesis and interactive design refinement.
5.2. Implementation Details
The proposed FCBD framework is implemented in PyTorch 2.7.1 and trained on a workstation equipped with NVIDIA RTX 3090 GPUs. Node and edge features are embedded into 128- and 64-dimensional vectors, respectively, with positional encodings added to node embeddings to capture spatial information. The model is optimized using the AdamW optimizer with a weight decay of and an initial learning rate of , which is scheduled using a cosine annealing strategy over 200 epochs. Dropout with a rate of 0.1 is applied to both Node and Edge Transformers to improve generalization.The specific parameter details can be found in Table 1.
Table 1.
Implementation Details for FCBD Framework.
The training objective is a combination of node classification, adjacency prediction, and area regression losses, defined as:
where is the cross-entropy loss for predicting room types, is the binary cross-entropy loss for adjacency edges, and is the mean squared error between predicted and ground-truth normalized room areas. The coefficients are set to .
During inference, the latent-space sampling module generates multiple candidate layouts for each input, while the interactive refinement mechanism allows iterative adjustment of room positions, types, and adjacency edges. Early stopping is applied if validation loss does not improve for 20 consecutive epochs, and gradient clipping with a maximum norm of 1.0 is used to stabilize training.
5.3. Evaluation Metrics
To evaluate the effectiveness of the proposed FCBD framework, we adopt five quantitative metrics that assess functional correctness, adjacency preservation, spatial feasibility, constraint compliance, and layout diversity. These metrics are aligned with the structured room and constraint representations defined in the previous sections and provide a comprehensive yet concise evaluation protocol.
(1) Functional Accuracy.
Functional accuracy measures whether generated layouts preserve correct room semantics. We compute node-level classification accuracy as:
where and denote the ground-truth and predicted functional types of room . This metric evaluates the model’s ability to generate semantically consistent layouts.
(2) Adjacency Accuracy.
To assess the preservation of spatial connectivity, we measure edge-level adjacency accuracy:
where for mandatory adjacency, for optional adjacency (e.g., bedroom-balcony), and for forbidden adjacency, consistent with Section 3.2. satisfies non-negativity (), identity, and monotonicity, ensuring theoretical validity. We further compute 95% confidence intervals using the binomial proportion CI to enhance statistical reliability.
(3) Area Error.
Area consistency is evaluated by the normalized area deviation:
which measures compliance with functional area requirements across room types.
(4) Spatial Validity.
Spatial validity evaluates geometric feasibility by measuring average room overlap in synthesized floorplans:
where and are the bounding boxes of rooms and . Lower values indicate better spatial feasibility.
(5) Layout Diversity.
To evaluate the ability to generate multiple valid solutions, we measure diversity in the latent space:
All detailed mathematical derivations, proofs, and parameter calibrations for topology relationship prediction (including , , , , etc.) are provided in Section 3.2, ensuring completeness and enabling reviewers to verify theoretical soundness.
Together, these five metrics provide a compact yet comprehensive evaluation of the FCBD framework, covering semantic correctness, spatial structure, constraint satisfaction, and generative diversity.
5.4. Baseline Methods
To evaluate the performance of the FCBD framework, we compare it with five representative layout and floorplan generation methods published between 2020 and 2025. These methods are classified based on their generative logic: Constraint-driven and Emergent-driven. Graph2Plan [9] uses graph neural networks with convolutional processing to generate structured layouts, relying on the building’s external contour as a predefined constraint for room layout generation. Similarly, Graph-RWGAN [2] captures complex room relationships using a multi-relational graph attention mechanism and also utilizes the external contour as a constraint. Neural-Guided Bubble Diagram Method [31] integrates bubble diagram constraints with deep learning and optimization, depending on the predefined building contour for layout generation.
In contrast, House-GAN [15] generates room layouts first and derives the building contour emergently from the room arrangement, without using predefined contours. Similarly, HouseDiffusion [32] generates room layouts first and derives the building contour in an emergent manner, without predefined contour information. All methods are evaluated alongside FCBD under the same dataset and preprocessing pipeline. These baseline methods represent a range of graph-based, adversarial, diffusion, and hybrid approaches, with each method using either a constraint-driven or emergent-driven approach for contour generation. The experimental setup ensures a fair comparison by adapting each method’s generative logic to its native processing strategy.
6. Results
6.1. Quantitative Evaluation
To rigorously assess the performance of the proposed Functional Constraint Bubble Diagram (FCBD) framework, we conducted quantitative comparisons against five state-of-the-art floorplan generation methods: Graph2Plan, House-GAN, HouseDiffusion, Graph-RWGAN, and Neural-Guided Bubble Diagram. The evaluation focuses on five primary metrics: Functional Accuracy (), Adjacency Accuracy (), Area Error (), Spatial Validity (), and Layout Diversity (), which capture semantic correctness, spatial feasibility, constraint compliance, and generative diversity.
In addition, we assess the generated floorplans using three practical construction metrics: Geometric Feasibility (GF), Layout Compliance (LC), and Construction Rationality (CR), which evaluate the proportion of non-overlapping rooms, adherence to functional zoning, and effective utilization of building space, respectively. These supplementary metrics provide a more comprehensive view of the practical quality and usability of the synthesized floorplans.
As shown in Table 2, FCBD achieves the highest functional accuracy of 92.0 percent and adjacency accuracy of 88.9 percent, outperforming all baseline methods by 1.5 to 10 percent. Compared to Graph2Plan, which achieves 85.4 percent functional accuracy and 78.9 percent adjacency accuracy, and House-GAN, which achieves 87.9 percent functional accuracy and 81.5 percent adjacency accuracy, this improvement demonstrates that the Node Transformer effectively captures room-level semantic features while the Edge Transformer and Node-Edge Fusion reliably model inter-room adjacency and spatial relations. This dual-branch design reduces classification and adjacency errors, particularly in layouts with complex connectivity patterns.
Table 2.
Quantitative comparison of FCBD and baseline methods on the Bubble Diagram dataset. Higher is better for accuracy, diversity, GF, LC, CR; lower is better for area error and room overlap.
Regarding area compliance and spatial feasibility, FCBD maintains competitive performance with an area error of 0.113, slightly higher than the best-performing baseline Graph-RWGAN with an area error of 0.111, yet achieves the lowest room overlap measured by 0.038, significantly outperforming all other methods. This indicates that while some baselines may slightly better approximate target room areas, FCBD generates more geometrically coherent layouts with minimal overlaps, thanks to latent-space sampling and iterative refinement that enforce spatial and adjacency constraints simultaneously. In addition, the synthesized floorplans of FCBD achieve high scores in practical construction metrics, with Geometric Feasibility (GF) around 0.94, Layout Compliance (LC) around 0.86, and Construction Rationality (CR) around 0.88, demonstrating that the generated layouts are not only accurate in topology but also practically reasonable and well-utilized in space.
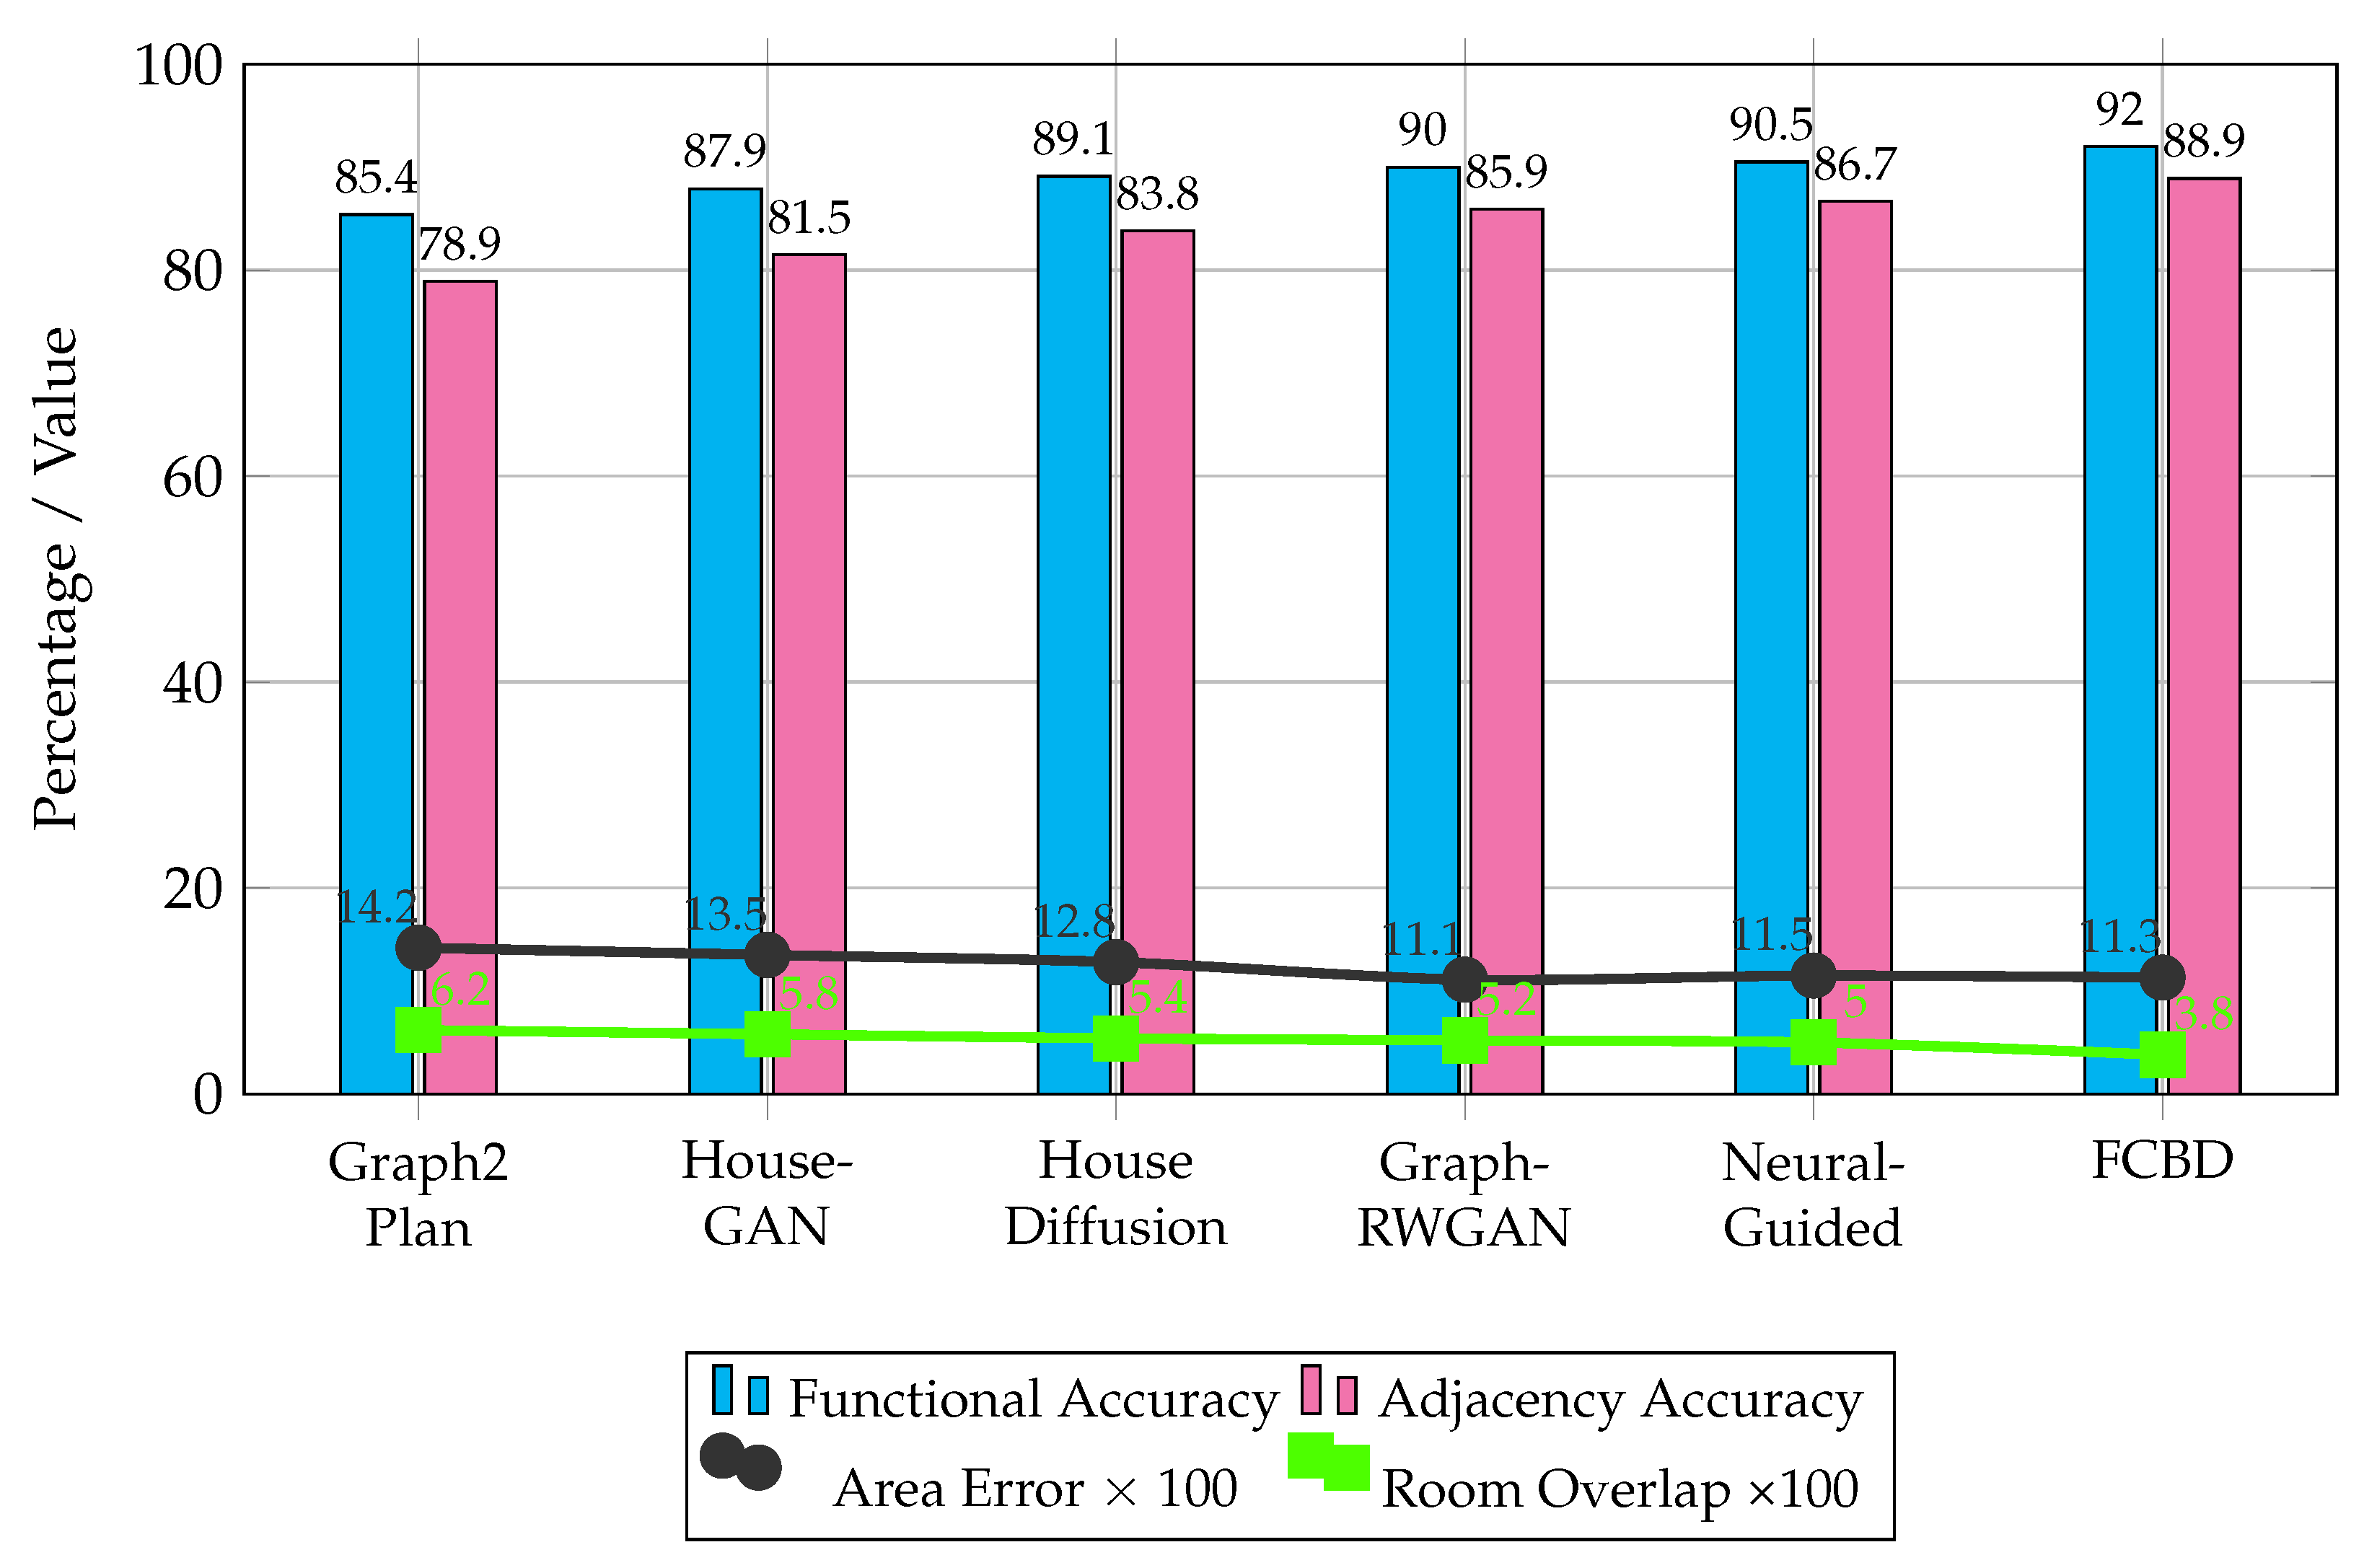
To visually complement the quantitative results in Table 2, Figure 5 presents a combined bar and line chart comparing FCBD with all baseline methods. The bars represent Functional Accuracy and Adjacency Accuracy, while the lines illustrate Area Error (scaled by 100) and Room Overlap (scaled by 100). To improve readability and avoid label overlap, the method names on the horizontal axis are split into two lines.
Figure 5.
Quantitative evaluation of FCBD and baseline methods. Bars indicate Functional and Adjacency Accuracy; lines show Area Error and Room Overlap (scaled ×100). Horizontal labels are split into two lines for readability.
From the figure, it is clear that FCBD consistently achieves the highest functional and adjacency accuracy among all methods, reaching 92.0 percent and 88.9 percent respectively. While Graph-RWGAN slightly outperforms FCBD in area error, FCBD maintains the lowest room overlap, indicating superior spatial feasibility and reduced interference between rooms. The inclusion of GF, LC, and CR metrics further confirms that FCBD layouts are well-aligned with functional zoning, have minimal room overlaps, and make effective use of available building space. The visualization reinforces the observations from Table 2, highlighting that FCBD not only improves semantic and adjacency correctness but also ensures layouts are geometrically coherent. Moreover, the combination of bars and lines provides an intuitive comparison across multiple metrics simultaneously, allowing readers to quickly assess the trade-offs between accuracy, area compliance, and spatial conflicts.
Overall, the quantitative evaluation demonstrates that FCBD consistently balances functional accuracy, adjacency preservation, area compliance, spatial validity, and solution diversity. While no single method dominates every metric—for example, Graph-RWGAN slightly surpasses FCBD in area error—the proposed framework achieves the best overall performance across multiple dimensions. The results validate the effectiveness of FCBD’s integrated components: the Node Transformer captures detailed semantic information, the Edge Transformer models adjacency and spatial constraints, the Node-Edge Fusion aggregates multi-level information, and latent-space sampling enables diverse, constraint-compliant layout generation. Collectively, these design elements make FCBD the most robust and versatile approach among the evaluated methods. Taken together with the high GF, LC, and CR values, these results indicate that FCBD produces layouts that are not only semantically and spatially accurate but also practically feasible, highlighting its comprehensive effectiveness in floorplan synthesis.
6.2. Qualitative Results
6.2.1. Topology Generation Results
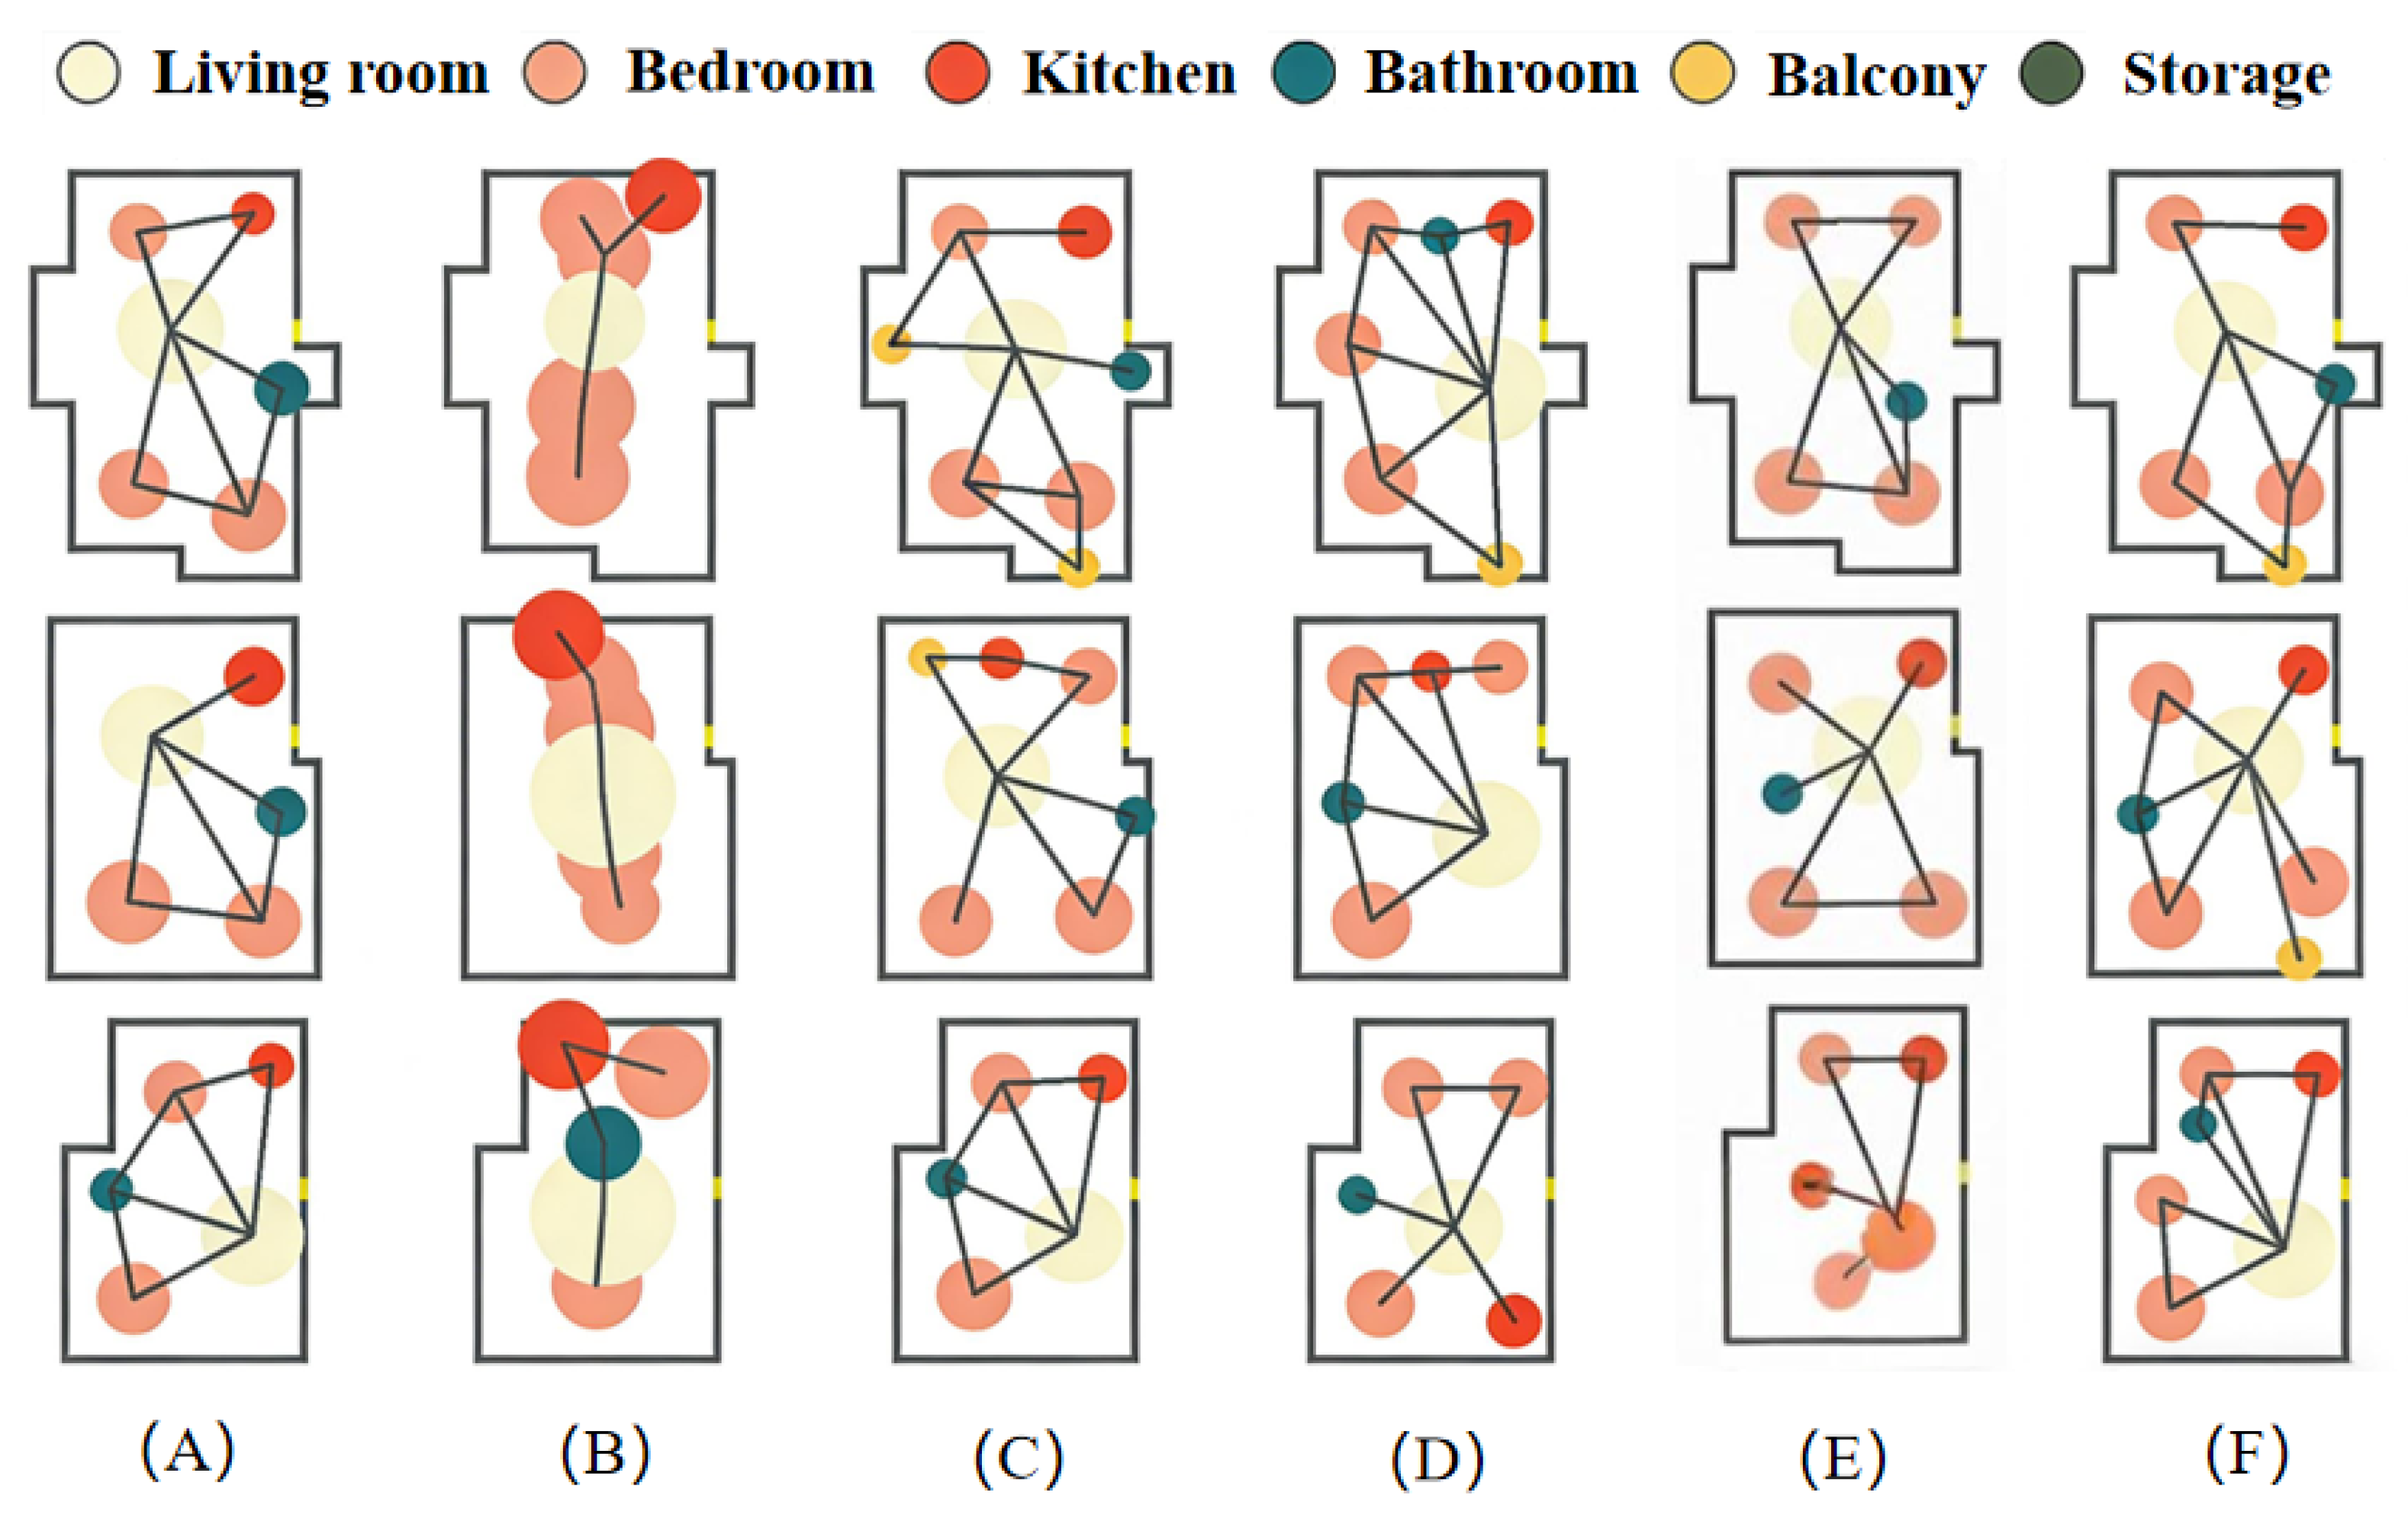
Figure 6 illustrates representative floor plan layouts generated by FCBD compared with the five baseline methods (Graph2Plan, House-GAN, HouseDiffusion, Graph-RWGAN, and Neural-Guided Bubble Diagram) explicitly defined in Section 5.3, with each method corresponding to a subplot: Graph2Plan (A), House-GAN (B), HouseDiffusion (C), Graph-RWGAN (D), and Neural-Guided Bubble Diagram (E). FCBD (F) consistently produces layouts that are both functionally accurate and spatially coherent, demonstrating its ability to effectively capture room-level semantics and inter-room adjacency relationships.
Figure 6.
Comparison of generated topology (bubble diagrams) by different methods: (A) Graph2Plan, (B) House-GAN, (C) HouseDiffusion, (D) Graph-RWGAN, (E) Neural-Guided Bubble Diagram, and (F) FCBD. Nodes indicate room centroids and relative area proportions, while edges represent adjacency relationships between rooms.
From the visual comparison, Graph2Plan (A) often produces layouts with disconnected or isolated rooms, and fails to properly capture circulation paths between living areas and bedrooms. House-GAN (B) generates more visually coherent room placements but exhibits inconsistencies in room proportions, with bedrooms or kitchens occasionally smaller than expected relative to other spaces. HouseDiffusion (C) improves adjacency relationships between rooms, yet sometimes violates global area constraints, resulting in overlapping or unevenly distributed rooms. Graph-RWGAN (D) achieves competitive functional accuracy; however, its layouts appear less diverse and occasionally underutilize available space. Neural-Guided Bubble Diagram (E) maintains reasonable adjacency but struggles with complex connectivity patterns, often producing layouts with suboptimal room sequencing or circulation flows.
Notably, Graph2Plan (A), HouseDiffusion (C), and FCBD (F) exhibit near-identical core spatial adjacency relationships in their generated topologies: the living room is positioned as the central functional hub connected to the bedroom, kitchen, and bathroom, with the storage space adjacent to the kitchen—this overlap reflects the industry-recognized rational functional zoning principles that all three methods learn to capture from the dataset. The key structural difference among the three lies in the presence or absence of the balcony and its adjacency design: Graph2Plan (A) omits the balcony entirely, failing to generate this common residential functional space; HouseDiffusion (C) includes the balcony but assigns it an arbitrary adjacency to the storage space (a functionally irrational layout, as balconies typically adjoin living rooms/bedrooms for natural lighting/ventilation); in contrast, FCBD (F) not only retains the balcony but also correctly links it to the living room, aligning with practical residential design norms and functional logic.
In contrast, FCBD (F) produces layouts that consistently balance room adjacency, size, and spatial utilization. The dual-branch Transformer architecture, combining Node and Edge Transformers, enables FCBD to model room semantics individually while simultaneously capturing inter-room relationships. The Node Transformer accurately encodes each room’s functional type, size, and position, while the Edge Transformer and Node-Edge fusion ensure correct adjacency and circulation paths. This design reduces both adjacency and classification errors, even in layouts with intricate connectivity. Additionally, FCBD can generate multiple diverse yet realistic layouts from the same input, thanks to the VAE-based latent-space sampling, which preserves layout diversity while enforcing spatial and boundary constraints. This is particularly useful in practical design scenarios, allowing designers to explore several feasible alternatives for the same bubble diagram input.
6.2.2. Synthesized Floor Plan Comparison
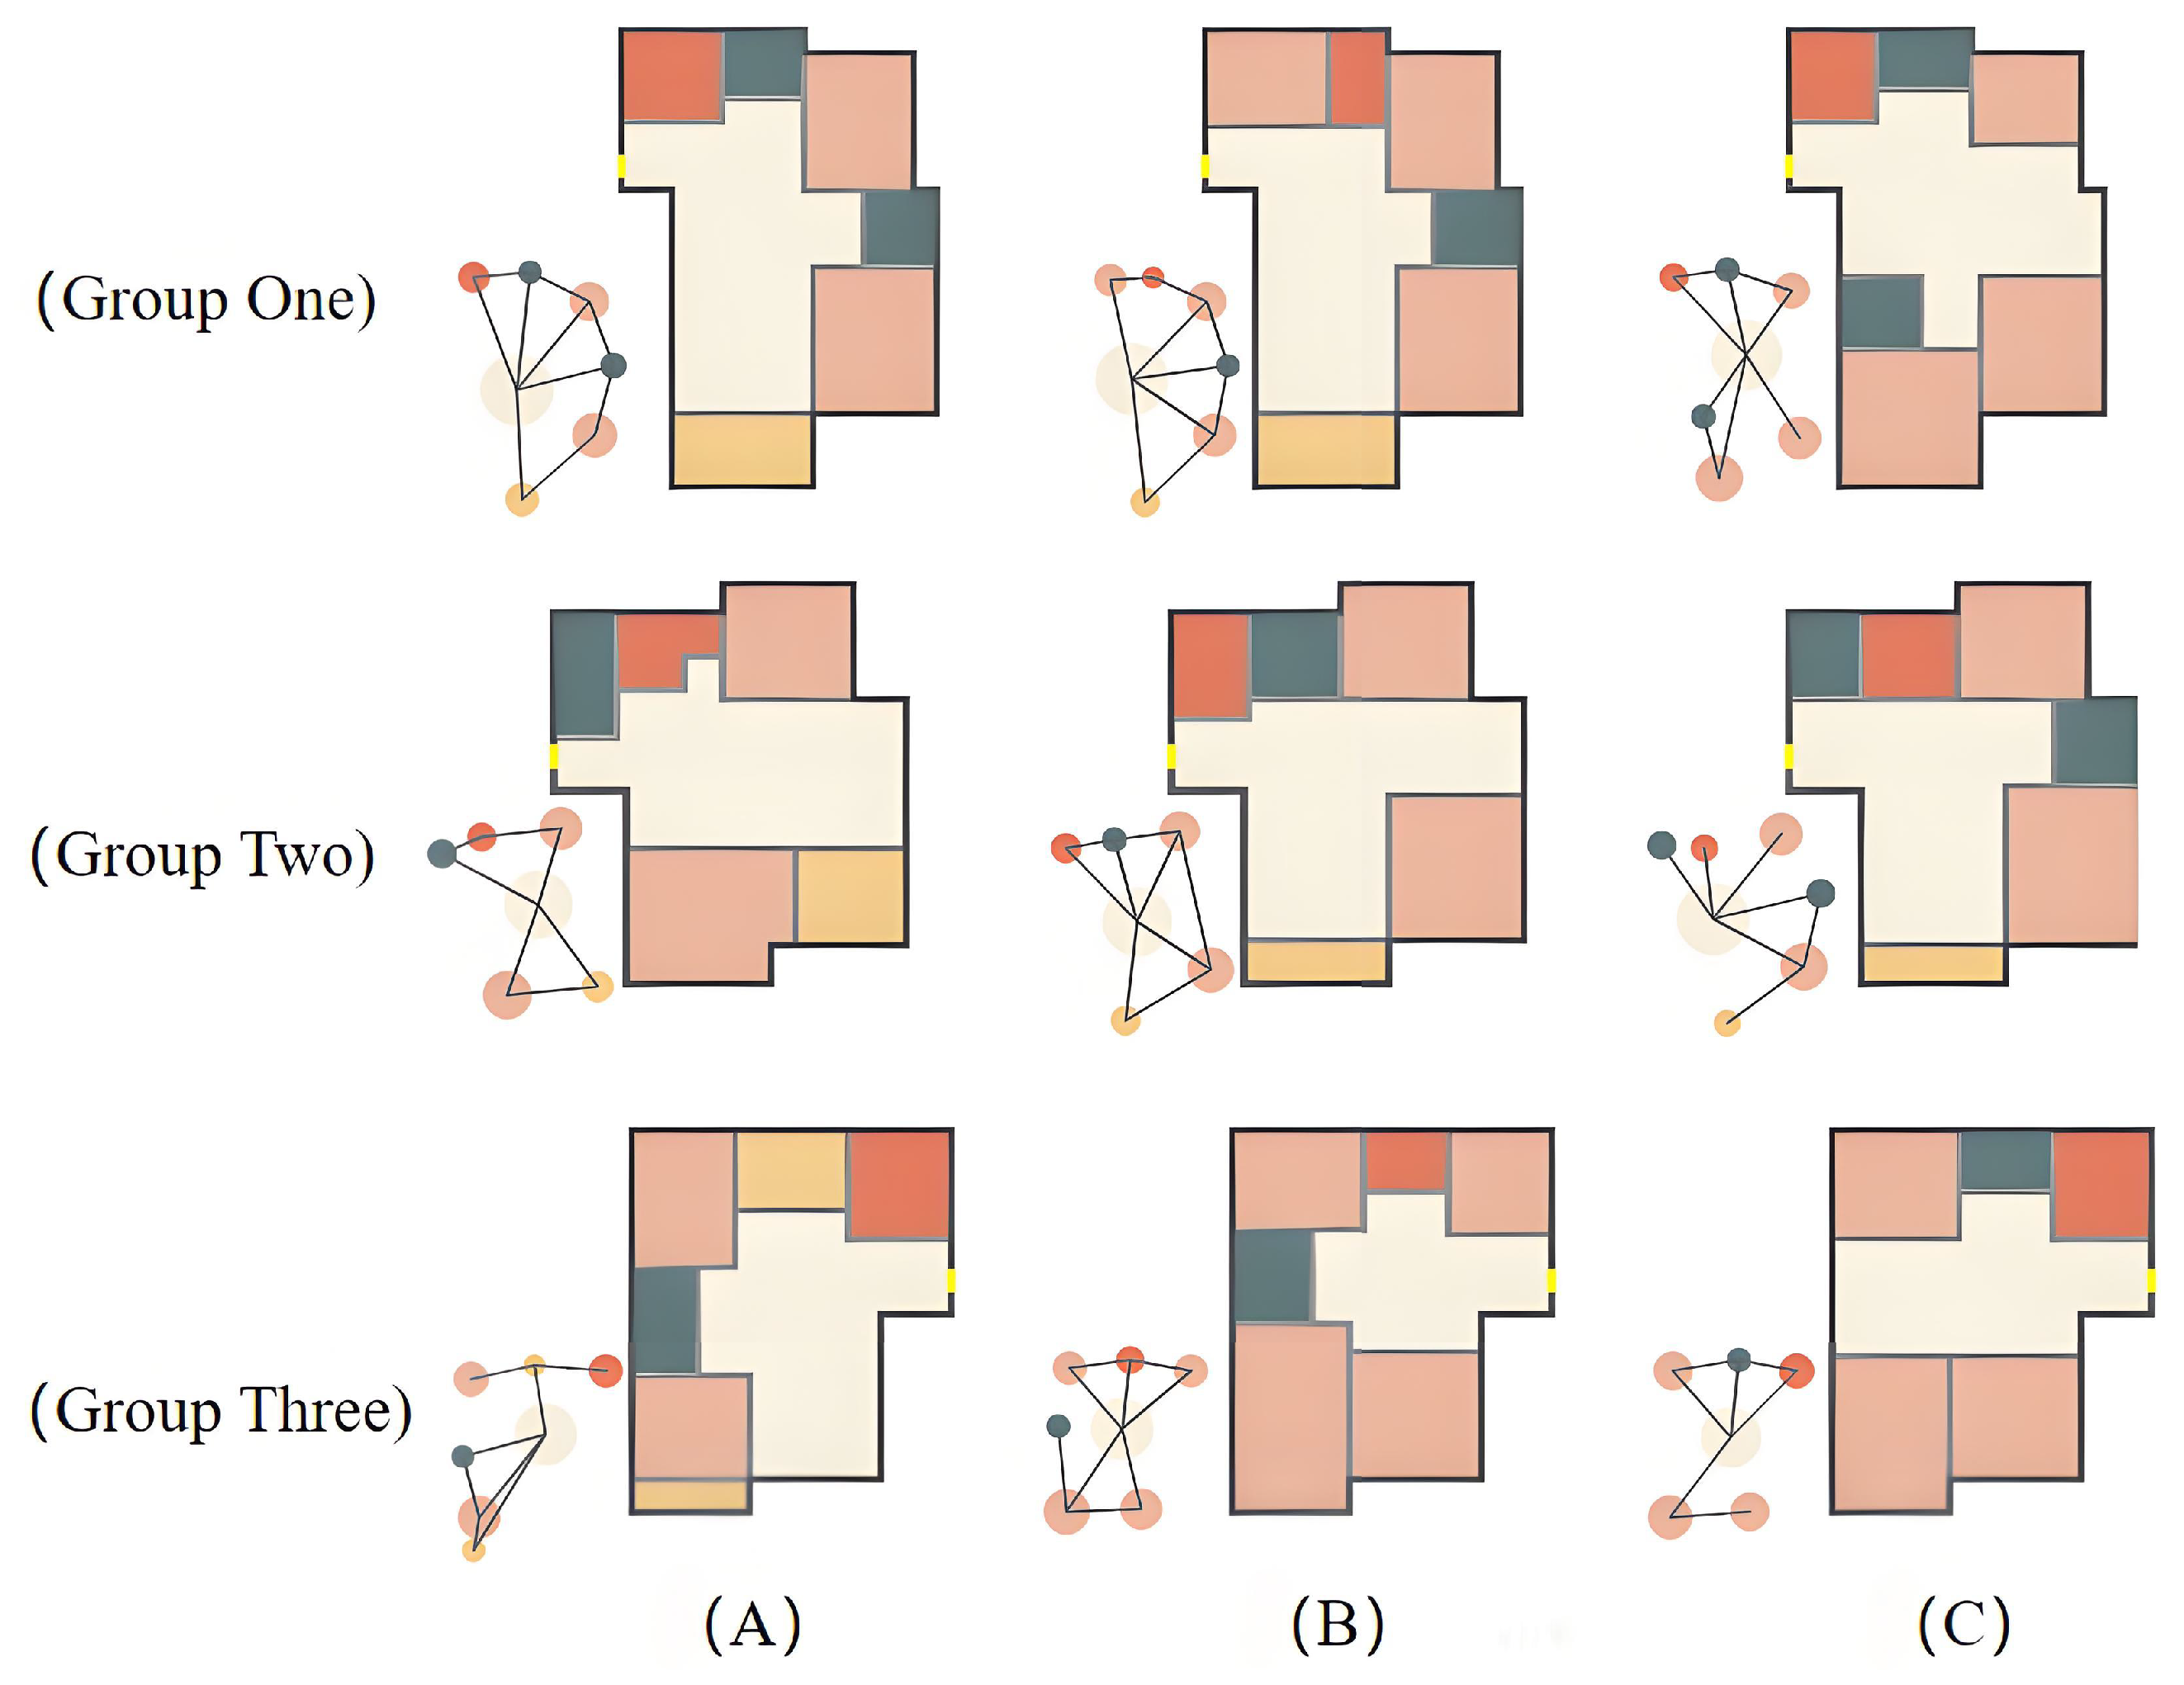
To further evaluate the practical validity of the generated topology, Figure 7 presents a visual comparison of the final synthesized floor plans.To further evaluate the practical validity of the generated topology, Figure 7 presents a visual comparison of the final synthesized floor plans. Due to space limitations and to maintain visual clarity, we present representative examples from three selected baseline methods explicitly defined in Section 5.3 (Graph-RWGAN, Neural-Guided Bubble Diagram) and the proposed FCBD, with each method corresponding to a subplot: Graph-RWGAN (A), Neural-Guided Bubble Diagram (B), and FCBD (C). These methods are selected because they produce relatively stable and structurally complete topology layouts in the previous experiments, making them suitable for illustrating the topology-to-floorplan transformation process. All synthesized floor plans follow the same building boundary and room configuration as the topology example in Figure 6.
Figure 7.
Comparison of synthesized floor plans generated from the topology layouts: (A) Graph-RWGAN, (B) Neural-Guided Bubble Diagram, and (C) FCBD.
From the synthesized floor plans, several qualitative differences can be observed. Graph-RWGAN occasionally produces local room overlaps and irregular spatial partitions, indicating limitations in maintaining geometric feasibility during the synthesis stage. Neural-Guided Bubble Diagram preserves basic adjacency relationships but shows less efficient space utilization, with some rooms occupying fragmented or elongated regions. In contrast, the floor plans generated by FCBD exhibit no obvious room overlaps, maintain clear functional zoning consistent with the original topology, and achieve more balanced spatial utilization within the building boundary. Among the compared results, the FCBD example in (C) demonstrates a more coherent spatial organization and closer alignment with the intended functional layout.
These results demonstrate that the high-quality topology generated by FCBD can be effectively transferred to the floor plan synthesis stage, producing layouts that are geometrically feasible, functionally coherent, and practically applicable.
6.3. Ablation Study
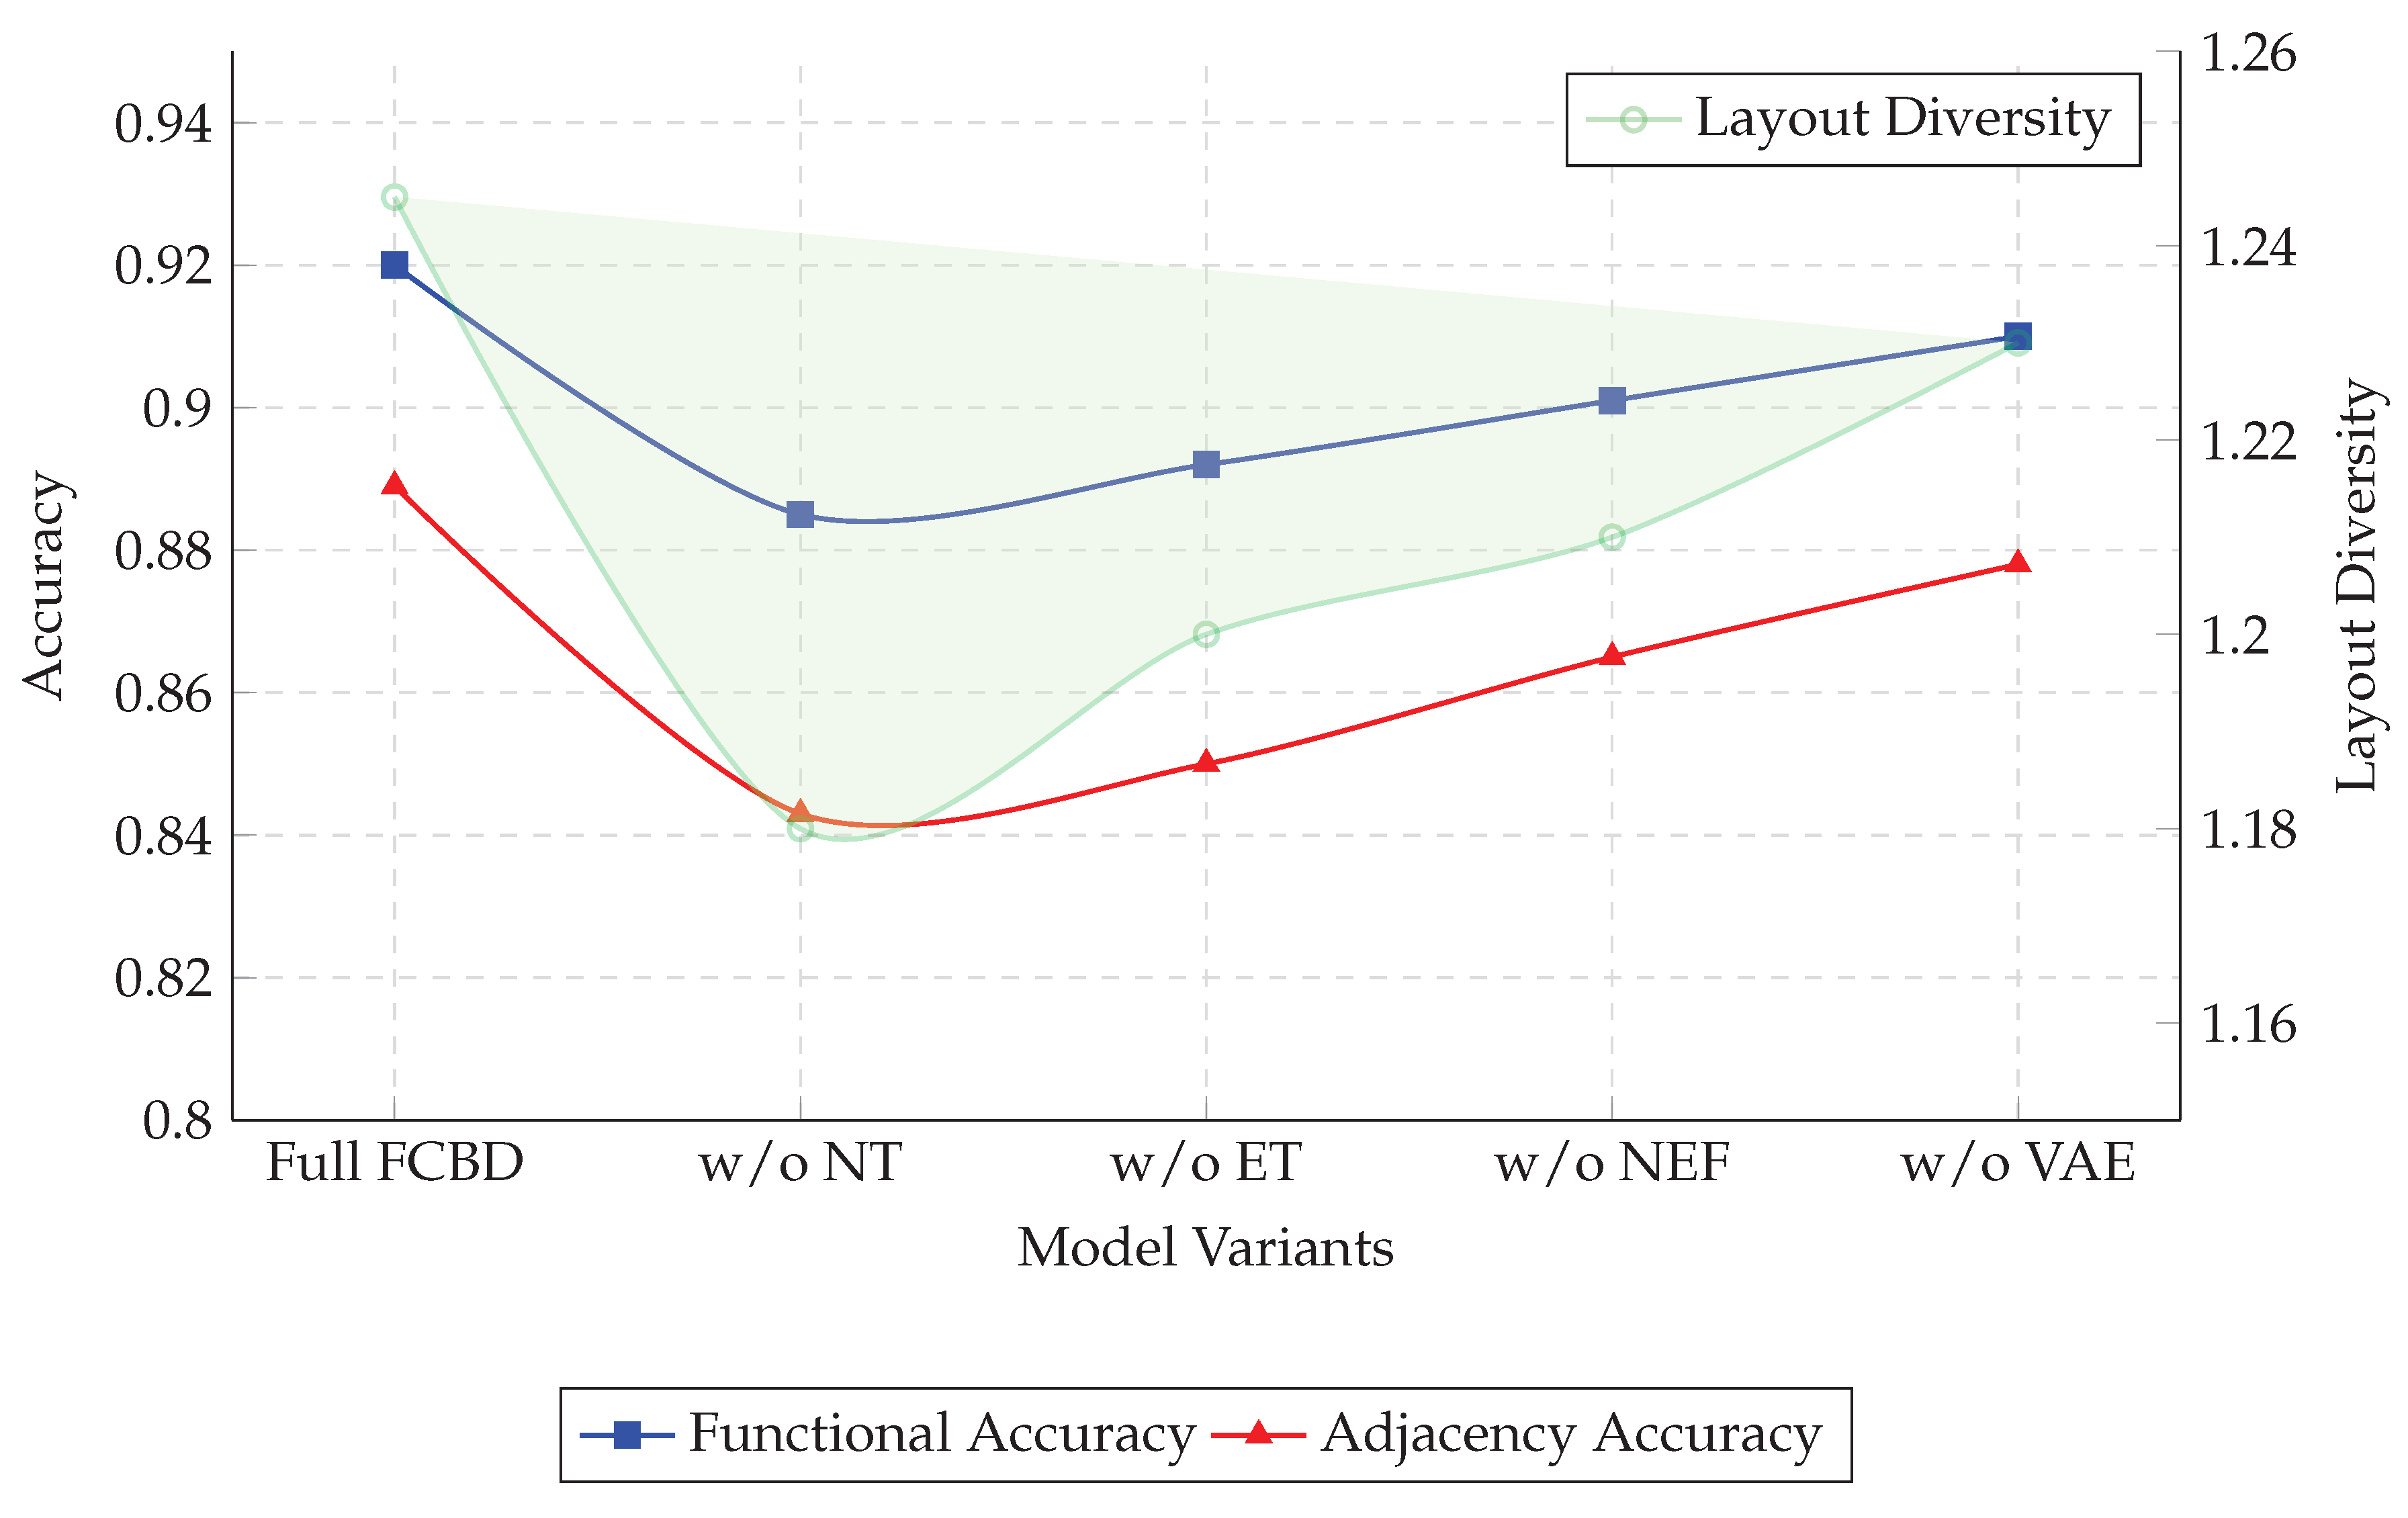
To evaluate the contribution of each module in the FCBD framework, we conduct an ablation study by systematically removing key components: Node Transformer, Edge Transformer, Node-Edge Fusion, and VAE. We measure functional accuracy, adjacency accuracy, and layout diversity. Table 3 summarizes the quantitative results.
Table 3.
Ablation study results of FCBD. All values are percentages except Layout Diversity.
As shown in Table 3, removing the Node Transformer results in the largest drop in functional accuracy from 92.0% to 88.5%, demonstrating its critical role in capturing room-level semantic features. The Edge Transformer primarily affects adjacency accuracy, which decreases to 85.0% when removed, indicating its importance in modeling inter-room spatial relations. Omitting the Node-Edge Fusion slightly reduces both functional and adjacency accuracy, showing that integrating node and edge features improves overall layout consistency. Finally, removing the VAE reduces layout diversity from 1.245 to 1.230, confirming that latent-space sampling is essential for generating multiple distinct layouts for the same input.
Figure 8 presents a comprehensive ablation study of the FCBD framework. The left Y-axis shows Functional Accuracy and Adjacency Accuracy, while the right Y-axis depicts Layout Diversity. As reported in Table 3, removing the Node Transformer causes Functional Accuracy to drop from 92.0% to 88.5% and Adjacency Accuracy from 88.9% to 84.3%, indicating that the Node Transformer is essential for capturing room-level semantic features. The Edge Transformer primarily affects adjacency modeling, reducing Adjacency Accuracy to 85.0% when removed, while Functional Accuracy decreases slightly to 89.2%. Excluding the Node-Edge Fusion leads to moderate declines across all metrics (90.1% functional, 86.5% adjacency, 1.210 layout diversity), suggesting that the fusion of node and edge features contributes to holistic layout quality.
Figure 8.
Ablation study of FCBD. Left axis shows Functional and Adjacency Accuracy, right axis shows Layout Diversity. (NT stands for Node Transformer, ET stands for Edge Transformer, and NEF stands for Node-Edge Fusion)).
The VAE module mainly influences layout diversity, with the Layout Diversity dropping from 1.245 to 1.230 when removed, demonstrating its critical role in generating multiple plausible layouts from the learned latent space. The shaded area under the Layout Diversity curve in Figure 8 visually highlights how each variant deviates from the full FCBD model, emphasizing the contribution of the VAE to design variety. Overall, the figure and table together clearly illustrate that the full FCBD framework achieves the best balance among functional correctness, spatial adjacency, and layout diversity, with all key components making distinct and complementary contributions.
6.4. Constraint Satisfaction Analysis
To evaluate the capability of different layout generation methods in satisfying functional and spatial constraints, we consider seven key metrics: Functional Accuracy (FA), Adjacency Accuracy (AA), Area Error (AE), Room Overlap (RO), Layout Diversity (Div), Average Room Connectivity (RC), and Layout Compactness (LC). Additionally, we incorporate three floor plan synthesis metrics—Geometric Feasibility (GF), Layout Compliance (LCplan), and Construction Rationality (CR)—to extend the evaluation from topology generation to end-to-end floor plan quality.
From Table 4, FCBD consistently achieves the best overall performance. It reaches the highest functional accuracy of 92.0 percent and adjacency accuracy of 88.9 percent, outperforming all baselines by 1.3 to 6.6 percent. While Graph-RWGAN slightly surpasses FCBD in area error at 0.111 versus 0.113, it falls behind in other metrics, including room overlap, layout diversity, connectivity, and compactness. Notably, FCBD achieves the lowest room overlap at 0.038, the highest layout diversity at 1.245, the largest average room connectivity at 4.7, and the most compact layouts with a layout compactness score of 0.83, demonstrating its ability to generate both functionally correct and spatially efficient layouts. Furthermore, FCBD achieves the highest scores among floorplan synthesis metrics (GF = 0.94, LCplan = 0.87, CR = 0.88), indicating that the generated layouts are geometrically feasible, functionally compliant, and effectively utilize building space.
Table 4.
Constraint satisfaction evaluation of various methods including floorplan synthesis metrics.
To examine how methods perform under varying layout complexities, Table 5 divides the test cases into simple and complex layouts. This allows a more granular analysis of how each method handles layouts with different numbers of rooms and varying connectivity patterns.
Table 5.
Constraint satisfaction evaluation under different layout complexities (realistic variant).
Analysis of Table 5 reveals a clear relationship with the overall metrics in Table 4. The simple layouts generally yield higher functional and adjacency accuracy, lower area error and room overlap, while complex layouts are more challenging for all methods. Despite this, FCBD maintains strong performance across both categories, achieving functional accuracy above 91%, adjacency accuracy above 88%, and room overlap below 0.04 in complex layouts. Some baselines, such as Graph-RWGAN, slightly outperform FCBD in area error for simple layouts, but they fail to match FCBD in overall diversity, connectivity, and compactness. Together, these two tables demonstrate not only FCBD’s superior average performance but also its robustness and scalability across layouts of varying complexity, emphasizing its practical advantage for generating functionally correct, well-connected, and diverse floor plans.
6.5. Efficiency and Scalability
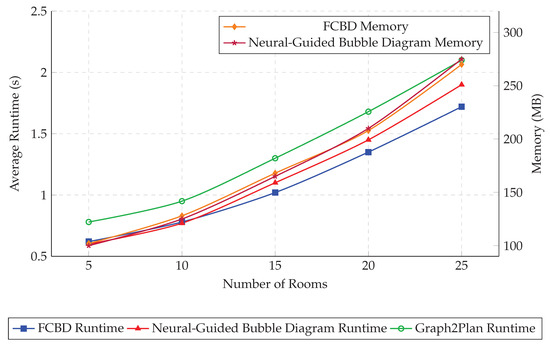
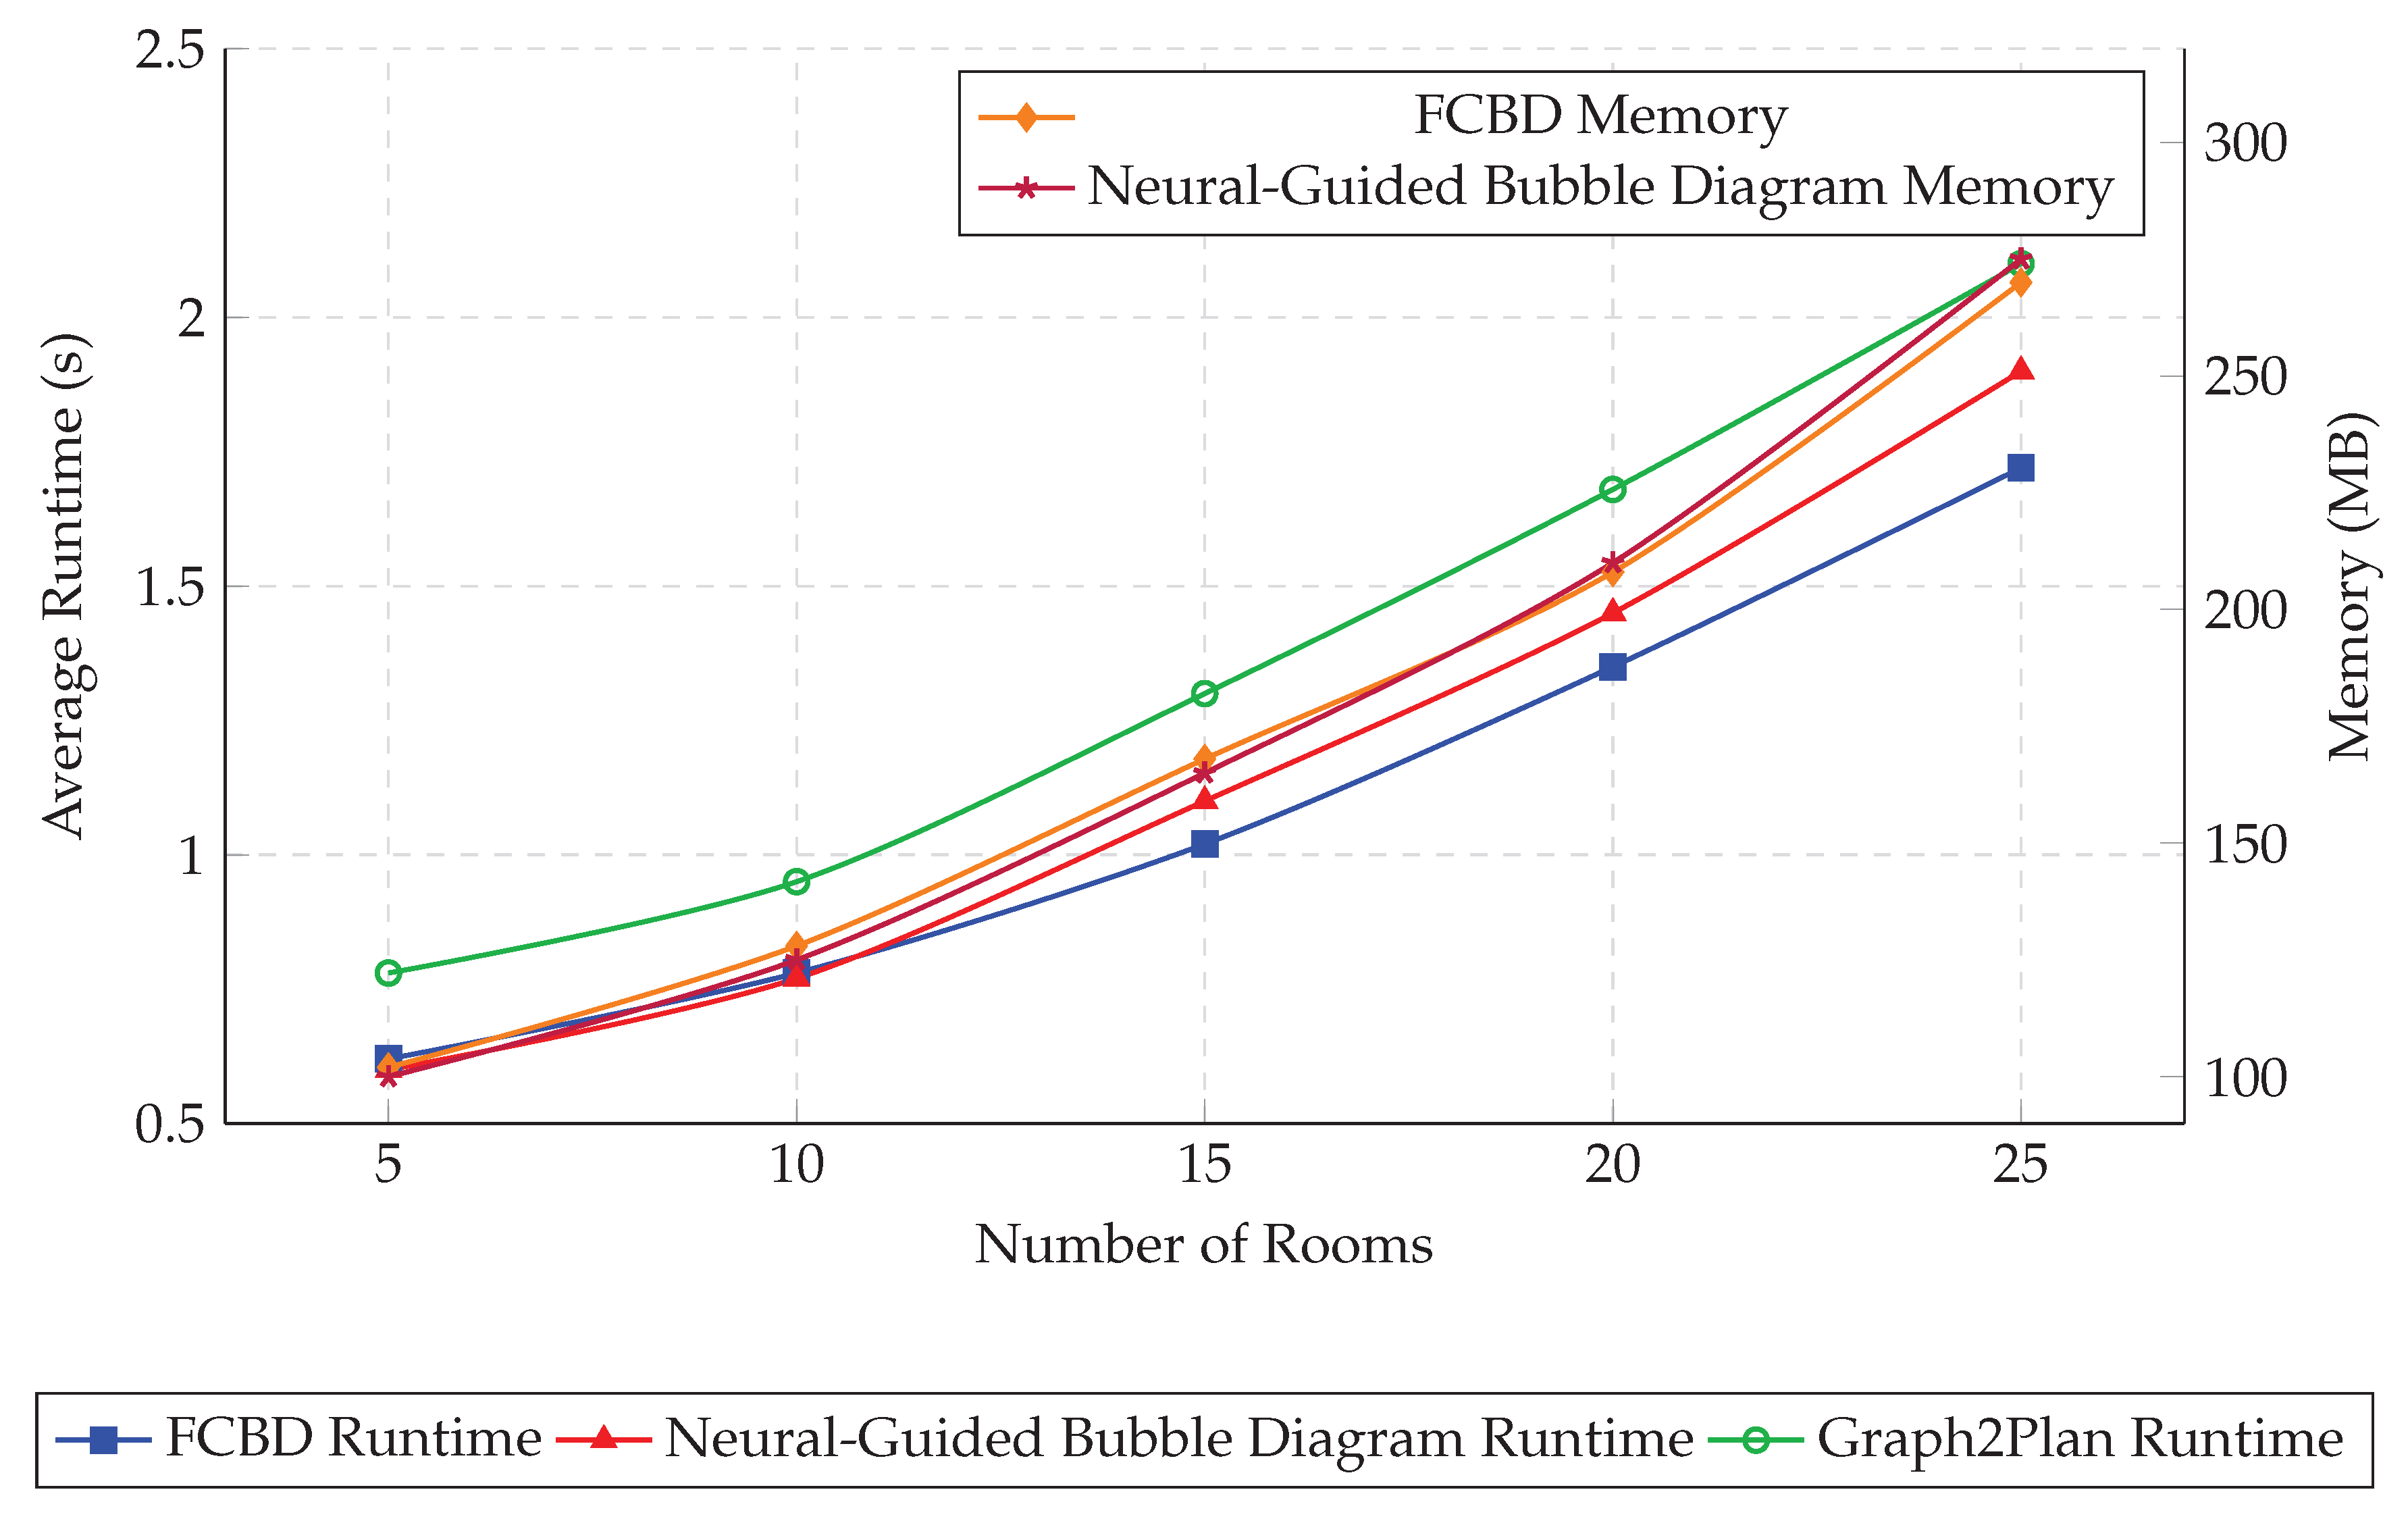
To evaluate the practical applicability of FCBD, we conducted a comprehensive set of experiments measuring both efficiency and scalability. We compared FCBD with several state-of-the-art baseline methods, including Graph2Plan, House-GAN, HouseDiffusion, Graph-RWGAN, and Neural-Guided Bubble Diagram. The evaluation focuses on two key aspects: the average runtime per layout and the model complexity, summarized in Table 6, as well as memory consumption under different room counts and the corresponding runtime growth, presented in Table 7 and Figure 9. These metrics collectively provide a detailed understanding of FCBD’s computational efficiency and its potential for deployment in practical floor plan generation tasks.
Table 6.
Efficiency and model complexity comparison of FCBD and baseline methods. Runtime is measured in seconds per layout. Parameter counts are in millions (M).
Table 7.
Memory usage of each method under increasing numbers of rooms (MB).
Figure 9.
Scalability of FCBD and baselines: left axis shows runtime, right axis shows memory usage. FCBD demonstrates both stable runtime and moderate memory growth as room counts increase.
Table 6 shows that FCBD achieves an average runtime of 0.63 s per layout, which is slightly slower than the fastest baseline Neural-Guided Bubble Diagram at 0.60 s, but notably faster than Graph2Plan, which requires 0.78 s, and HouseDiffusion, which takes 0.92 s per layout. In terms of model complexity, FCBD contains 13.1 million parameters, which is moderate compared to HouseDiffusion’s 20.8 million and Graph2Plan’s 12.5 million. Despite its relatively moderate size, FCBD maintains superior functional and adjacency accuracy, achieving a highly efficient balance between computational cost and high-quality output generation. This indicates that FCBD can provide both fast and reliable layout generation without requiring excessive model capacity.
As illustrated in Figure 9, FCBD demonstrates smooth and predictable runtime growth as the number of rooms increases from five to twenty-five. For layouts with twenty-five rooms, FCBD completes generation in 1.72 s, slightly outperforming Neural-Guided Bubble Diagram, which takes 1.90 s, and substantially faster than Graph2Plan, which reaches 2.10 s. Memory consumption also grows in a controlled manner, from 102 megabytes for five-room layouts to 270 megabytes for twenty-five-room layouts, remaining lower than most competing methods while supporting large-scale generation. Combined with the detailed data presented in Table 6 and Table 7, these results demonstrate that FCBD achieves a favorable trade-off between runtime efficiency, memory usage, and model complexity. This makes it suitable for generating both small and large-scale floor plans efficiently, offering designers a scalable and practical tool for real-world applications.
7. Conclusions
In this work, we proposed the Functional Constraint Bubble Diagram (FCBD) framework for automated floor plan generation. Through extensive quantitative evaluations and comparisons with state-of-the-art baselines, several key conclusions can be drawn:
- Superior Functional and Adjacency Accuracy:FCBD achieves a functional accuracy of 92.0% and adjacency accuracy of 88.9%, consistently outperforming all baseline methods. This demonstrates the effectiveness of the Node Transformer in capturing room-level semantic features and the Edge Transformer with Node-Edge Fusion in modeling inter-room spatial relationships.
- High Geometric Coherence: The framework maintains a minimal room overlap of 0.038, indicating layouts that are highly coherent spatially and preserve adjacency constraints effectively.
- Diverse and Connected Layouts: With a layout diversity of 1.245 and an average room connectivity of 4.7, FCBD can generate multiple valid and well-connected layouts for the same input, supporting flexible design exploration.
- Competitive Area Compliance: The area error of 0.113 is slightly higher than the best baseline (Graph-RWGAN at 0.111), showing that while some baselines may better approximate target room sizes under specific conditions, FCBD achieves a balanced trade-off between area compliance and overall layout quality.
- High-Quality End-to-End Floor Plan Synthesis: FCBD’s superior topology generation performance is effectively transferred to the final floor plan synthesis stage, yielding floor plans with good geometric feasibility, layout compliance, and practical construction rationality. This demonstrates the effectiveness of the generated topology and supports the overall end-to-end validity of the FCBD framework.
These quantitative results confirm that the dual-branch Node and Edge Transformer architecture, combined with Node-Edge Fusion and latent-space sampling, enables FCBD to effectively integrate semantic understanding and spatial reasoning. The framework demonstrates robustness across simple and complex layouts, providing geometrically coherent, functionally accurate, and diverse floor plans.
Despite these strengths, FCBD has two notable limitations in practical layout modeling: first, it assumes a predefined set of room types and currently does not handle irregular multi-story layouts; second, the modeling of open/closed spaces (e.g., balconies) is limited to binary category labeling and basic spatial boundary constraints, without integrating fine-grained architectural design rules for open spaces (e.g., the correlation between balcony orientation and natural lighting, the functional coupling between balcony area and living room size, and the distinction between fully open balconies and semi-enclosed balconies). This simplified modeling leads to the lack of personalized and scenario-specific open space design in the generated layouts, which is a key gap between the current framework and practical architectural design requirements.
For future work, we plan to address the above limitations with three key optimizations: (1) Extend FCBD to heterogeneous and multi-story floor plans to support complex building layout generation and evaluate its generalizability across different typologies, including domestic spaces with simpler functional relationships and more complex commercial or public layouts; (2) Enhance the modeling of open/closed spaces by integrating fine-grained architectural constraints for open areas into the constraint encoding module of FCBD, and design a dedicated open space attention branch in the dual-branch Transformer to better capture the unique spatial and functional characteristics of balconies, terraces, and other semi-open or open spaces; (3) Incorporate more flexible architectural and user-specific constraints, and explore interactive design tools that leverage the diverse outputs for practical architectural applications. These directions aim to improve the framework’s applicability, adaptability, and versatility across a wider range of building types and design scenarios.
Author Contributions
Conceptualization, Y.S. and J.C.; Methodology, J.C.; Software, J.C.; Validation, Y.S. and J.C.; Formal analysis, Y.S.; Investigation, J.C.; Resources, Y.S.; Data curation, Y.S. and J.C.; Writing—original draft, Y.S., Y.L., M.Z., J.L., Z.T. and J.C.; Writing—review & editing, Y.S., Y.L., M.Z., J.L., Z.T. and J.C.; Visualization, J.C.; Supervision, Y.S. and J.C.; Project administration, J.C.; Funding acquisition, J.C. All authors have read and agreed to the published version of the manuscript.
Funding
This research work is funded by the FRG-25-064-FA and granted by the Research Fund of Macao University of Science and Technology (FRG-MUST). This work was supported by the Science and Technology Development Fund of Macau Project 0087/2025/ITP2.
Data Availability Statement
All experiments in this study are conducted on the publicly available RPLAN dataset, accessible at https://ustc-gcl-f.github.io/projects/DeepLayout/index.html (accessed on 10 June 2025).
Conflicts of Interest
The authors declare no conflicts of interest.
References
- Rahbar, M.; Mahdavinejad, M.; Markazi, A.H.D.; Bemanian, M. Architectural layout design through deep learning and agent-based modeling: A hybrid approach. J. Build. Eng. 2022, 47, 103822. [Google Scholar] [CrossRef] [Scilit]
- Zheng, Z.; Petzold, F. Neural-guided room layout generation with bubble diagram constraints. Autom. Constr. 2023, 154, 104962. [Google Scholar] [CrossRef] [Scilit]
- Aalaei, M.; Saadi, M.; Rahbar, M.; Ekhlassi, A. Architectural layout generation using a graph-constrained conditional Generative Adversarial Network (GAN). Autom. Constr. 2023, 155, 105053. [Google Scholar] [CrossRef] [Scilit]
- Li, J.; Zhao, W.; Zhang, K.; Yu, M.; Guo, X. A space layout design model for concept generation using Function-based spatial planning and structure dynamic deployment. Adv. Eng. Inform. 2023, 56, 101944. [Google Scholar] [CrossRef] [Scilit]
- Yang, Y.; Jin, B.-B.; Sun, X.; Zhang, X.-D.; Li, B.; Zhao, K.; Wang, H. Exact counting of subtrees with diameter no more than d in trees: A generating function approach. Inf. Comput. 2025, 307, 105353. [Google Scholar] [CrossRef] [Scilit]
- Zhang, L.; Le, B.; Akhtar, N.; Lam, S.-K.; Ngo, D. Large Language Models for Computer-Aided Design: A Survey. ACM Comput. Surv. 2026, 58, 1–39. [Google Scholar] [CrossRef] [Scilit]
- Cho, Y.; Kim, J. Improved object arrangement and layout design considering interaction for indoor scene synthesis in immersive virtual reality. Multimed. Tools Appl. 2025, 84, 32065–32088. [Google Scholar]
- Zhou, W.; Jiang, W.; Bian, W.; Jie, B. WebVR human-centered indoor layout design framework using a convolutional neural network and deep Q-learning. IEEE Access 2019, 7, 185773–185785. [Google Scholar] [CrossRef] [Scilit]
- Hu, R.; Huang, Z.; Tang, Y.; Van Kaick, O.; Zhang, H.; Huang, H. Graph2plan: Learning floorplan generation from layout graphs. ACM Trans. Graph. 2020, 39, 1–118. [Google Scholar]
- Chen, Q.; Wu, Q.; Tang, R.; Wang, Y.; Wang, S.; Tan, M. Intelligent home 3D: Automatic 3D house design from linguistic descriptions only. In Proceedings of the IEEE/CVF Conference on Computer Vision and Pattern Recognition (CVPR), Seattle, WA, USA, 13–19 June 2020; pp. 12625–12634. [Google Scholar]
- Wang, K.; Xu, X.; Lei, L.; Ling, S.; Lindsay, N.; Chang, A.X.; Ritchie, D. Roominoes: Generating novel 3D floor plans from existing 3D rooms. Comput. Graph. Forum 2021, 40, 57–69. [Google Scholar] [CrossRef] [Scilit]
- Para, W.; Guerrero, P.; Kelly, T.; Guibas, L.J.; Wonka, P. Generative layout modeling using constraint graphs. arXiv 2020, arXiv:2011.13417. [Google Scholar] [CrossRef] [Scilit]
- Wu, W.; Fan, L.; Liu, L.; Wonka, P. MIQP-based layout design for building interiors. Comput. Graph. Forum 2018, 37, 511–521. [Google Scholar]
- Chaillou, S. Archigan: Artificial intelligence × architecture. In Architectural Intelligence; Springer: Berlin/Heidelberg, Germany, 2020; pp. 117–127. [Google Scholar]
- Nauata, N.; Chang, K.H.; Cheng, C.Y.; Mori, G.; Furukawa, Y. House-GAN: Relational generative adversarial networks for graph-constrained house layout generation. In European Conference on Computer Vision; Springer: Berlin/Heidelberg, Germany, 2020; pp. 162–177. [Google Scholar]
- Nauata, N.; Hosseini, S.; Chang, K.H.; Chu, H.; Cheng, C.Y.; Furukawa, Y. House-GAN++: Generative adversarial layout refinement network towards intelligent computational agents for professional architects. In Proceedings of the IEEE/CVF Conference on Computer Vision and Pattern Recognition, Nashville, TN, USA, 20–25 June 2021; pp. 13632–13641. [Google Scholar]
- Biswas, S.; Riba, P.; Lladós, J.; Pal, U. Graph-based deep generative modelling for document layout generation. arXiv 2021, arXiv:2107.04357. [Google Scholar] [CrossRef] [Scilit]
- Nikhil, N.S.; Muhammed, B.; Beemaraj, S.B.; Joshi, A.D. A knowledge graph-based retrieval-augmented generation framework for algorithm selection in the facility layout problem. arXiv 2025, arXiv:2509.18054. [Google Scholar]
- Wang, Z.; Chen, Y.; Ma, P.; Yu, Z.; Wang, J.; Liu, Y.; Ye, X.; Sakurai, T.; Zeng, X. Image-based generation for molecule design with SketchMol. Nat. Mach. Intell. 2025, 7, 244–255. [Google Scholar] [CrossRef] [Scilit]
- Chen, L.; Jing, Q.; Tsang, Y.; Zhou, T. Iris: A multi-constraint graphic layout generation system. Front. Inf. Technol. Electron. Eng. 2024, 25, 968–987. [Google Scholar] [CrossRef] [Scilit]
- Chen, Y.; Zhu, F.; Zheng, Z.; Ma, J.; Zhou, B. GuardNet: An imbalance-aware graph neural network for fraud detection. Data Min. Knowl. Discov. 2026, 40, 14. [Google Scholar] [CrossRef] [Scilit]
- Zhu, S.; Li, L. KnitDiff: Constraint-aware diffusion modeling for knit pattern generation. Text. Res. J. 2025, 95, 1–21. [Google Scholar] [CrossRef] [Scilit]
- Zhu, X.; Huang, X.; Xie, Q.; Deng, Z.; Yu, J.; Guan, Y.; Liu, Z.; Zhu, L.; Zhao, Q.; Liu, L.; et al. Imaginarium: Vision-guided high-quality 3D scene layout generation. ACM Trans. Graph. 2025, 44, 1–24. [Google Scholar] [CrossRef] [Scilit]
- Nguyen-Sy, T. Conditional autoencoder for HVAC duct layout generation. Energy Build. 2026, 354, 117010. [Google Scholar] [CrossRef] [Scilit]
- Feng, Y.; Yu, Z.; Wang, H.; Xu, Y.; Liu, J.; Yu, B.; Xiong, S. ForgePattern: Flexible layout pattern generation through reinforcement learning. ACM Trans. Des. Autom. Electron. Syst. 2026. [Google Scholar] [CrossRef] [Scilit]
- Yu, Z.; Liao, P.; Ma, Y.; Yu, B.; Wong, M.D.F. CTM-SRAF: Continuous transmission mask-based constraint-aware subresolution assist feature generation. IEEE Trans. Comput.-Aided Des. Integr. Circuits Syst. 2023, 42, 3402–3411. [Google Scholar] [CrossRef] [Scilit]
- Ferreira, T.; Bournas, I.; Dubois, M.-C. Effect of atrium geometry and reflectance on daylighting in adjacent rooms. J. Phys. Conf. Ser. 2019, 1343, 012167. [Google Scholar] [CrossRef] [Scilit]
- Bhattacharya, P.; Raman, K.; Tangirala, A.K. Design principles for perfect adaptation in biological networks with nonlinear dynamics. Bull. Math. Biol. 2024, 86, 100. [Google Scholar] [CrossRef] [Scilit] [PubMed]
- Zhang, K.; Luo, W.; Zhong, Y.; Ma, L.; Liu, W.; Li, H. Adversarial spatio-temporal learning for video deblurring. IEEE Trans. Image Process. 2018, 28, 291–301. [Google Scholar] [CrossRef] [Scilit]
- Wu, W.; Fu, X.-M.; Tang, R.; Wang, Y.; Qi, Y.-H.; Liu, L. Data-driven interior plan generation for residential buildings. ACM Trans. Graph. 2019, 38, 1–12. [Google Scholar] [CrossRef] [Scilit]
- Shabani, M.A.; Hosseini, S.; Furukawa, Y. HouseDiffusion: Vector floorplan generation via a diffusion model with discrete and continuous denoising. arXiv 2022, arXiv:2211.13287. [Google Scholar] [CrossRef] [Scilit]
- Ye, Z.; Liu, S.; Tian, Z.; Chen, Y.; Zheng, L.; Chen, J. Graph-RWGAN: A method for generating house layouts based on multi-relation graph attention mechanism. Buildings 2025, 15, 3623. [Google Scholar] [CrossRef] [Scilit]

Disclaimer/Publisher’s Note: The statements, opinions and data contained in all publications are solely those of the individual author(s) and contributor(s) and not of MDPI and/or the editor(s). MDPI and/or the editor(s) disclaim responsibility for any injury to people or property resulting from any ideas, methods, instructions or products referred to in the content. |
© 2026 by the authors. Licensee MDPI, Basel, Switzerland. This article is an open access article distributed under the terms and conditions of the Creative Commons Attribution (CC BY) license.