


Abstract
Because of concentrated connection damage, the impact of sequential hazards on CLT shear wall systems is much more severe than that on traditional concrete and steel structures considering ductile component behaviors. The present paper evaluated the dynamic response of CLT wall structures in wind-only and sequential seismic–wind scenarios and compared the structural dynamic responses and damage levels of different CLT wall systems. The structural models were established separately based on an SOM benchmark structure, a SOFIE project three-story CLT shear wall structure, and a PT CLT wall platform structure from the NHERI Tall Wood project. The equivalent fluctuating wind load was calculated with the ASCE 7 average wind speed, the reference ESDU wind profile, calibrated wind pressure distribution, and simulated fluctuation from the NatHaz Online Wind Simulator. The sequential load was applied to the structural models in the order of seismic excitation, resting time, and then dynamic wind load. The dynamic responses of different CLT wall structures were compared among loading scenarios with increasing seismic and wind intensities. The wind-excited peak story displacement and acceleration for both CLT structures were significantly magnified in the sequential seismic–wind scenarios compared with the wind-only scenarios. The simulation results indicated that the sequential seismic–wind scenarios caused significant acceleration in damaged connections for the conventional CLT shear wall structure. The PT CLT wall structure had minor displacement and acceleration, which were linear to the wind loading factors. For the conventional CLT shear wall structure, the magnification of the acceleration was found to have a strong correlation with the natural frequencies of the damaged structure. This study demonstrated that the wind responses of the PT wall structures were in a safe range after the seismic event, and conventional CLT wall structures need to be re-evaluated under sequential scenarios for structural resilience assessment.
1. Introduction
Mass timber structures attract attention from academia and industry due to their outstanding sustainability. Though not generally approved due to the uncertainty of their seismic performance, it is believed that mass timber structures with CLT walls can be used for tall buildings [1]. In ASCE 7-22 [2,3], a CLT shear wall structure system has been officially included. The provided response modification coefficient in the equivalent lateral force method seismic design, based on the FEMA P-695 methodology [4], enabled a CLT-bearing wall structure system to be applied to a tall timber building. It was found that conventional CLT shear walls tend to have premature connection damage [5,6]. Based on that finding, post-tensioned (PT) CLT rocking wall systems were developed to provide better structural resilience than the conventional CLT shear wall [7,8,9].
Unlike in reinforced concrete or steel frame structures, which have high residual strength before destruction, connection damage in a conventional CLT shear wall caused by a seismic event can significantly damage the temporary structural performance of the building [10]. Under these circumstances, once conventional CLT shear walls in a structure sustain damage during an earthquake, the originally designed wind load may be sufficient to drive the structure to its serviceability limit state, which is a plausible post-earthquake scenario; this may lead to severe problems such as unacceptably large displacement or acceleration [10]. However, the multi-hazard scenario of sequential seismic and wind events has not been considered in existing studies [11,12]. In multi-hazard scenarios, material degradation plays a critical role in the post-event performance of structural systems. Although this study focuses on CLT walls, numerous investigations on reinforced concrete structures have shown that deterioration mechanisms, such as stiffness loss, bond degradation, micro-cracking, and nonlinear damage accumulation, significantly affect the seismic response (e.g., [13,14]) and subsequent behavior under wind or aftershock loading. Similar to concrete deterioration, accumulated damage in CLT walls, including toe crushing, connection degradation, and loss of contact stiffness, can alter the natural frequency and amplify wind-induced responses after an earthquake. Incorporating deterioration models, inspired by established concrete damage frameworks, would provide a more realistic representation of post-seismic behavior and strengthen future sequential hazard simulations. Though a developed self-centering PT wall system should provide better performance due to its high total displacement capacity, it is not evident whether that can resolve the potential drawback of CLT wall structure systems. Therefore, though limited to CLT wall system structures, structural performance in sequential loading scenarios is worth considering to assess multi-hazard structural reliability and resilience thoroughly.
The serviceability of a structure under wind load is one of the critical considerations for the performance-based design of CLT wall structures [15]. With growing structure scales, the influence of wind load can be expected to increase. Meanwhile, the structure’s design requirement limits the structure to be only affected when it is considered serviceable under high wind load scenarios. However, research on the wind response of tall timber structures is limited. Skidmore, Owinds & Merrill LLP (SOM) conducted a pilot study on mass timber structural designs that proposed a series of mass timber towers as benchmark structures [16]. The benchmark structures contain a CLT wall and core, a glulam column, and a concrete link beam, with various story numbers (10–40) [16]. Based on this, some of these benchmark structural models were further investigated in a wind tunnel for a detailed wind response under a serviceability-state wind load with different Angles of Attack (AOAs) and exposure conditions [17,18]. The evaluation was conducted by determining the wind load from a wind tunnel test by using an aeroelastic model combined with a structural simulation using the finite element software SAP2000. The study shows that as long as the damping ratio exceeds 5%, the buildings can satisfy the performance requirement for Peak Floor Accelerations (PFA) of the National Building Code of Canada (NBCC) for office and residential usage. In wind response assessments, the wind profile for the exposure condition, the average wind speed, the AOA, and the wind pressure distribution (from an aeroelastic wind tunnel test) are the key factors in determining the wind load on the structure.
Numerical simulation is a cost-effective approach to assess the behavior of CLT wall structures under wind load or the sequential load of seismic and wind events [19]. There are several successful cases of seismic analysis for mass timber structures with different commercial FE programs. The rocking of walls cannot be captured in most of these models, such as in [20]. The wall model was developed to include a vertical bar element and a horizontal hysteresis spring. Though it can predict hysteresis horizontal shear/sliding with an equivalent spring, rocking cannot be captured. In another study, walls were simulated with 2D shell elements by sharing their nodes with other components as the connection on the wall [17,21]. This modeling method can roughly capture a structure’s overall behavior while compromising the local and detailed hysteresis responses. Another modeling attempt modeled the wall panel in meshed shell elements and connections in 1D springs [22]. A similar method was also used to investigate the impact of connection stiffness on a complete building structure [23]. This modeling strategy can capture the impact of openings and the connection, but it can only be applied to a smaller structure, such as a two-story platform. Besides the above ideas for reproducing detailed wall systems or defining a numerical model as an assembly of a complete system, a numerical Axial–Shear (N-V) interaction domain model was established to simplify the design of CLT shear walls [13]. However, the simplification considers the connection in elastic–perfectly plastic behavior. Therefore, though the model can directly reference the wall design, the behavior of the connections cannot be captured. Most importantly, neglecting rocking behavior in these example models fails to capture the influence of vertical load on the lateral stiffness and strength of walls observed in experimental tests [24]. As a result, an improved, efficient wall model developed in a previous study was used to capture the behavior of CLT wall systems under lateral load, considering deformation modes.
In this study, the dynamic response of CLT wall structures in scenarios of sequential seismic and wind hazards will be assessed with structural models that capture the hysteresis behavior of CLT walls. The model was developed with the open-source software OpenSees as an integrated wall model to capture the behavior of walls, including sliding, rocking (overturning), and vertical compression. A SOM building structural model was developed to verify the equivalent fluctuating wind load. Then, two other models were separately developed and verified for conventional and PT CLT wall systems. Based on these models, to achieve the main objective, the specific goals are (1) to establish a simplified equivalent dynamic wind load on the structure and verify with cases, (2) to examine the performance of the CLT wall systems in a wind-only scenario, and then (3) to evaluate the performance of CLT wall systems in parametric scenarios of sequential seismic and high-wind hazards. This study addresses a multi-hazard serviceability gap for CLT wall systems by demonstrating a computationally efficient sequential earthquake–wind evaluation framework. Using nonlinear CLT wall models for benchmark, conventional, and PT rocking systems, this paper provides a comparative case-study assessment of post-earthquake wind-response amplification and clarifies the applicability and limitations of the proposed approach.
2. Wind Load Modeling
In order to simulate the fluctuating wind load, the following procedure is proposed to obtain a realistic fluctuating wind load in an efficient way. The equivalent fluctuating wind load needs to have realistic fluctuating behavior and to capture the wind profile for the exposure condition, average wind speed, Angle of Attack, and wind pressure distribution, as they are the key factors in determining the wind load structure.
As shown in [17], when the attack angle of wind was perpendicular to the broad side of the structure, the structural performance was in the worst scenario. As a result, the Angle of Attack (AOA) was fixed at 90 degrees to simplify the analysis, which means that the wind blows on the wide-side surface perpendicularly. With the finite element structural model, the wind loads were applied to the front surface with the wind profile and the tested factor of wind pressure. The nodal loads were calculated as
where A is the allocated area of each node; is the density of air, which was considered 1.25 kg/m3; V is the wind speed at the height, obtained from the wind profile combined with the fluctuating behavior; and Cf is the coefficient of wind pressure at each node, obtained from Computational Fluid Dynamic (CFD) analysis or approximation from load standard ASCE 7 [2].
2.1. Wind Profile
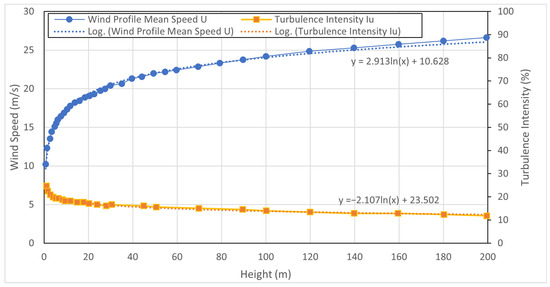
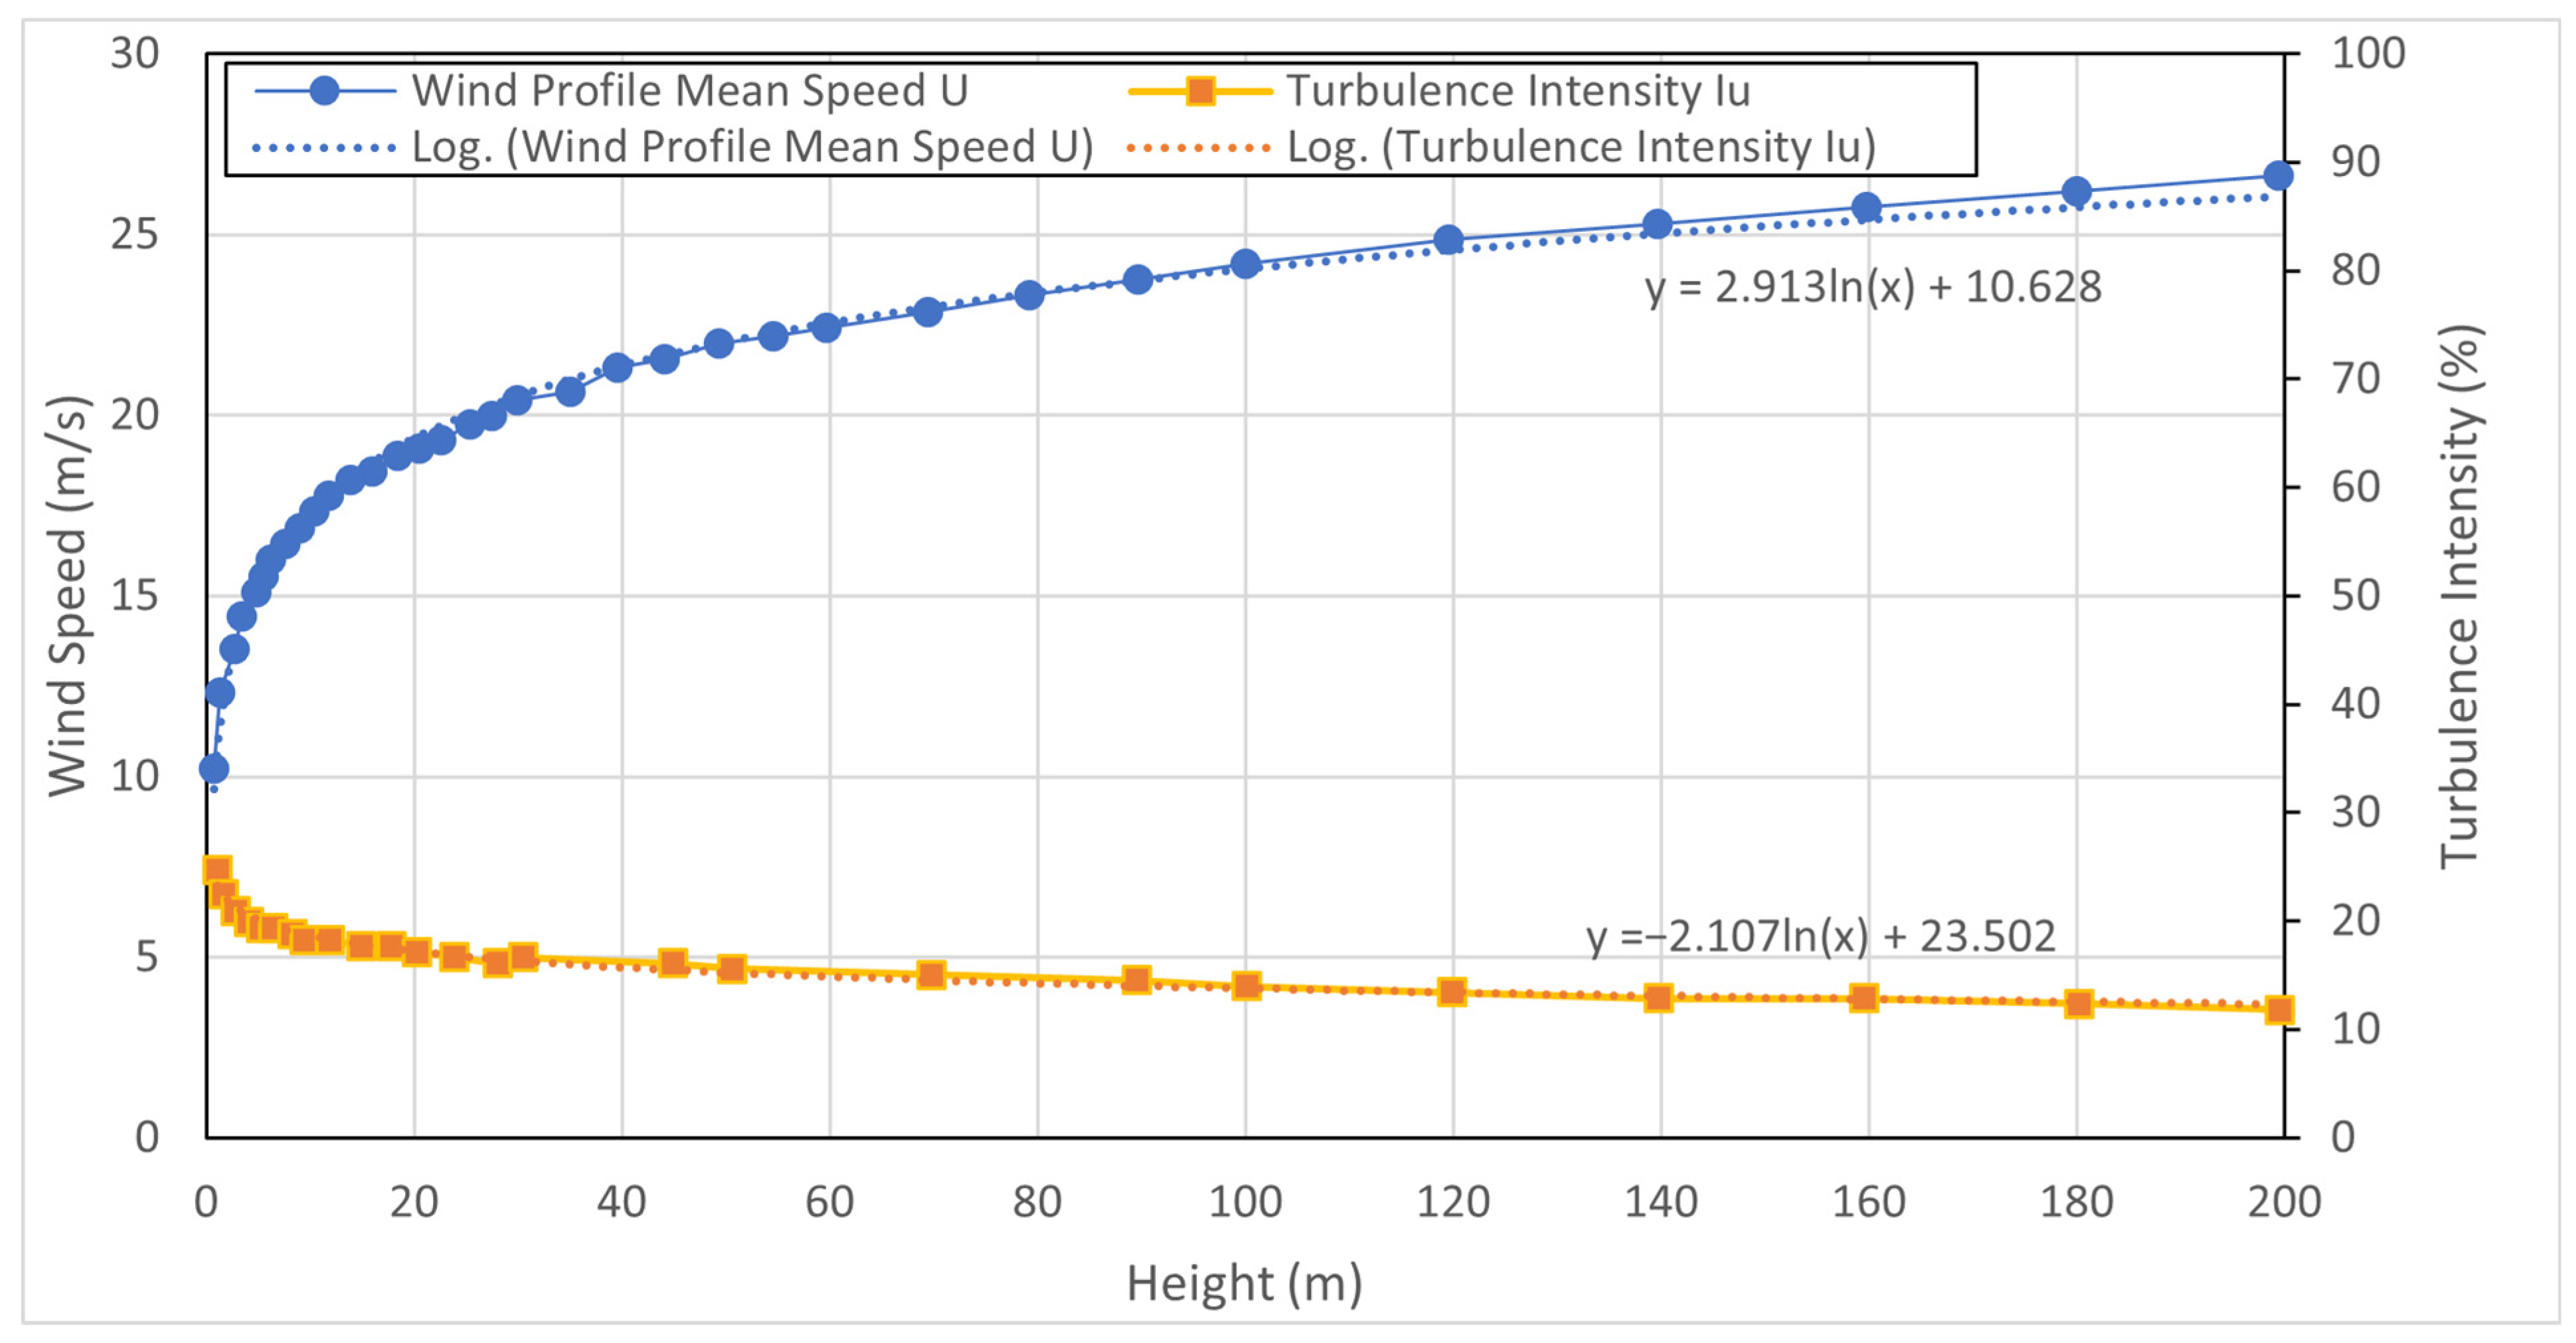
Two significant parameters need to be fully captured: the wind speed and the turbulence intensity. The wind profile is the suburban exposure’s Engineering Sciences Data Unit (ESDU) profile. The normalized mean velocity and turbulence intensity were obtained referring to a study by Bezabeh [17]. The mean wind speed was determined with a design average wind speed of 24 m/s at a building top of 102 m. As shown in Figure 1, an exponential approximation was made to capture the wind speed and turbulence intensity based on the height for input in the models. The wind speed was adjusted based on the 50-year wind loads from design wind speed maps in ASCE 7 [2].
Figure 1.
Example wind profile for SOM building (H = 102 m, mean wind speed at building top = 24 m/s) with suburban exposure conditions.
2.2. Wind Pressure Coefficient
The wind pressure coefficient, , can be obtained from a wind tunnel test, CFD analysis, or simplified approximation from current design standards. The wind pressure coefficient was calculated using the CFD software ANSYS Fluent 2020 R1 [25] for the SOM building. The wind profile, including the wind speed and turbulence intensity, was input into the height function within the k-ε turbulence model. For the 3d CFD model, wind speed was directly input with the approximated function and the height, using the wind speed equation in Table 1. Due to the limitations of the software, the turbulent parameter of the complete inlet can only be input as a constant. Based on the LES model input, the turbulence intensity is defined as 15% of the average value. The turbulent viscosity ratio and Subgrid Kinetic Energy were set as 10 and 1 m/s2, respectively, which are typical reference values [26]. The geometry and boundary conditions of the wind field are defined to provide sufficient room to minimize the boundary influence on each side, as recommended by [26]. The side and top of the wind field boundary were in slip boundary conditions, while the ground and the body surface were in non-slip conditions. The distances from the building to the inlet and outlet were, respectively, six times and 22 times the width of the structure, while the distance from the body surface to both sides was eight times the width.
Table 1.
Simulated and referenced [17] CFy, along with the height of the SOM building at representative levels.
Solving the NS equations of the continuous wind field can provide pressure distribution at the boundaries, which was transferred to represent the wind pressure on the structure perimeter. The calculated CFy mean at 15 s along the height is shown in Table 1. The pressure data of the calculated wind field at the front surface of the building were extracted with the location of the surface nodes. Then, the nodal results were calculated for the averaged area based on the location on the surface. For example, the contributing area of an edge node is calculated as the product of half of the horizontal distance to the allocated node and half of the distance between the two allocated vertical nodes. Then, the results were averaged and assigned to each level. As shown in Table 1, the original calculated result provides a similar trend to the reference value from Bezabeh [17]. When applied with a factor of 0.79, the modified result can fit the reference result, which provides a reference for the supplementary source of wind pressure distribution data.
To maintain consistency with the reference benchmark for verification, the reference wind pressure distribution factor reported in [17] was adopted as the wind pressure coefficient in the subsequent computation and structural modeling. In the structural model, the coefficients were applied as a story-dependent constant on the nodes of each floor, with the adopted distribution summarized in Table 1. For load application, the pressure distribution was mapped to the model discretization by computing area-averaged coefficients on the building surface and assigning the corresponding nodal values. The wind load at each node was then computed from the adopted wind pressure coefficients and the wind speed in the reference wind profile. CFD-derived coefficients were used only as a supplementary check of trends and were not used as the final coefficient source for the benchmark verification.
Other than the SOM benchmark structure, the pressure distribution on the other two example structures was not obtained from a wind tunnel or CFD calculation due to the lack of related references. Considering the computation efficiency, instead of determining detailed wind pressure distribution, the wind force coefficients referred to ASCE 7 [2] for simple structures. Per equations 26.10-1.SI and 27.3-1 from ASCE 7, the wind load was calculated as the external and internal pressure difference. The wind pressure coefficient can be, therefore, calculated as in Equation (2),
where the wind direction factor involved is Kd, the topographic factor is Kzt, the ground elevation factor is Ke, the gust effect factor is G, the internal wind coefficient is Cpi, and the external pressure coefficient is Cp. The coefficients were determined based on ASCE 7 equations and clauses for each specific case.
2.3. Fluctuating Wind Speed
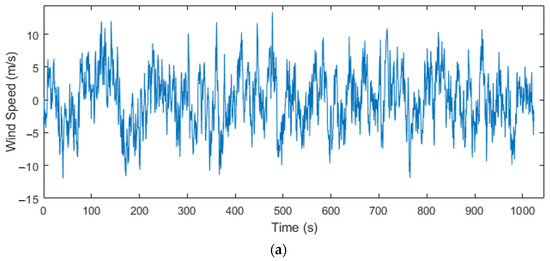
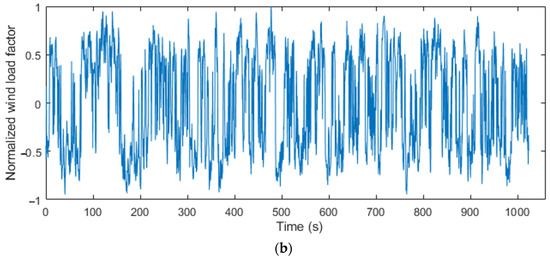
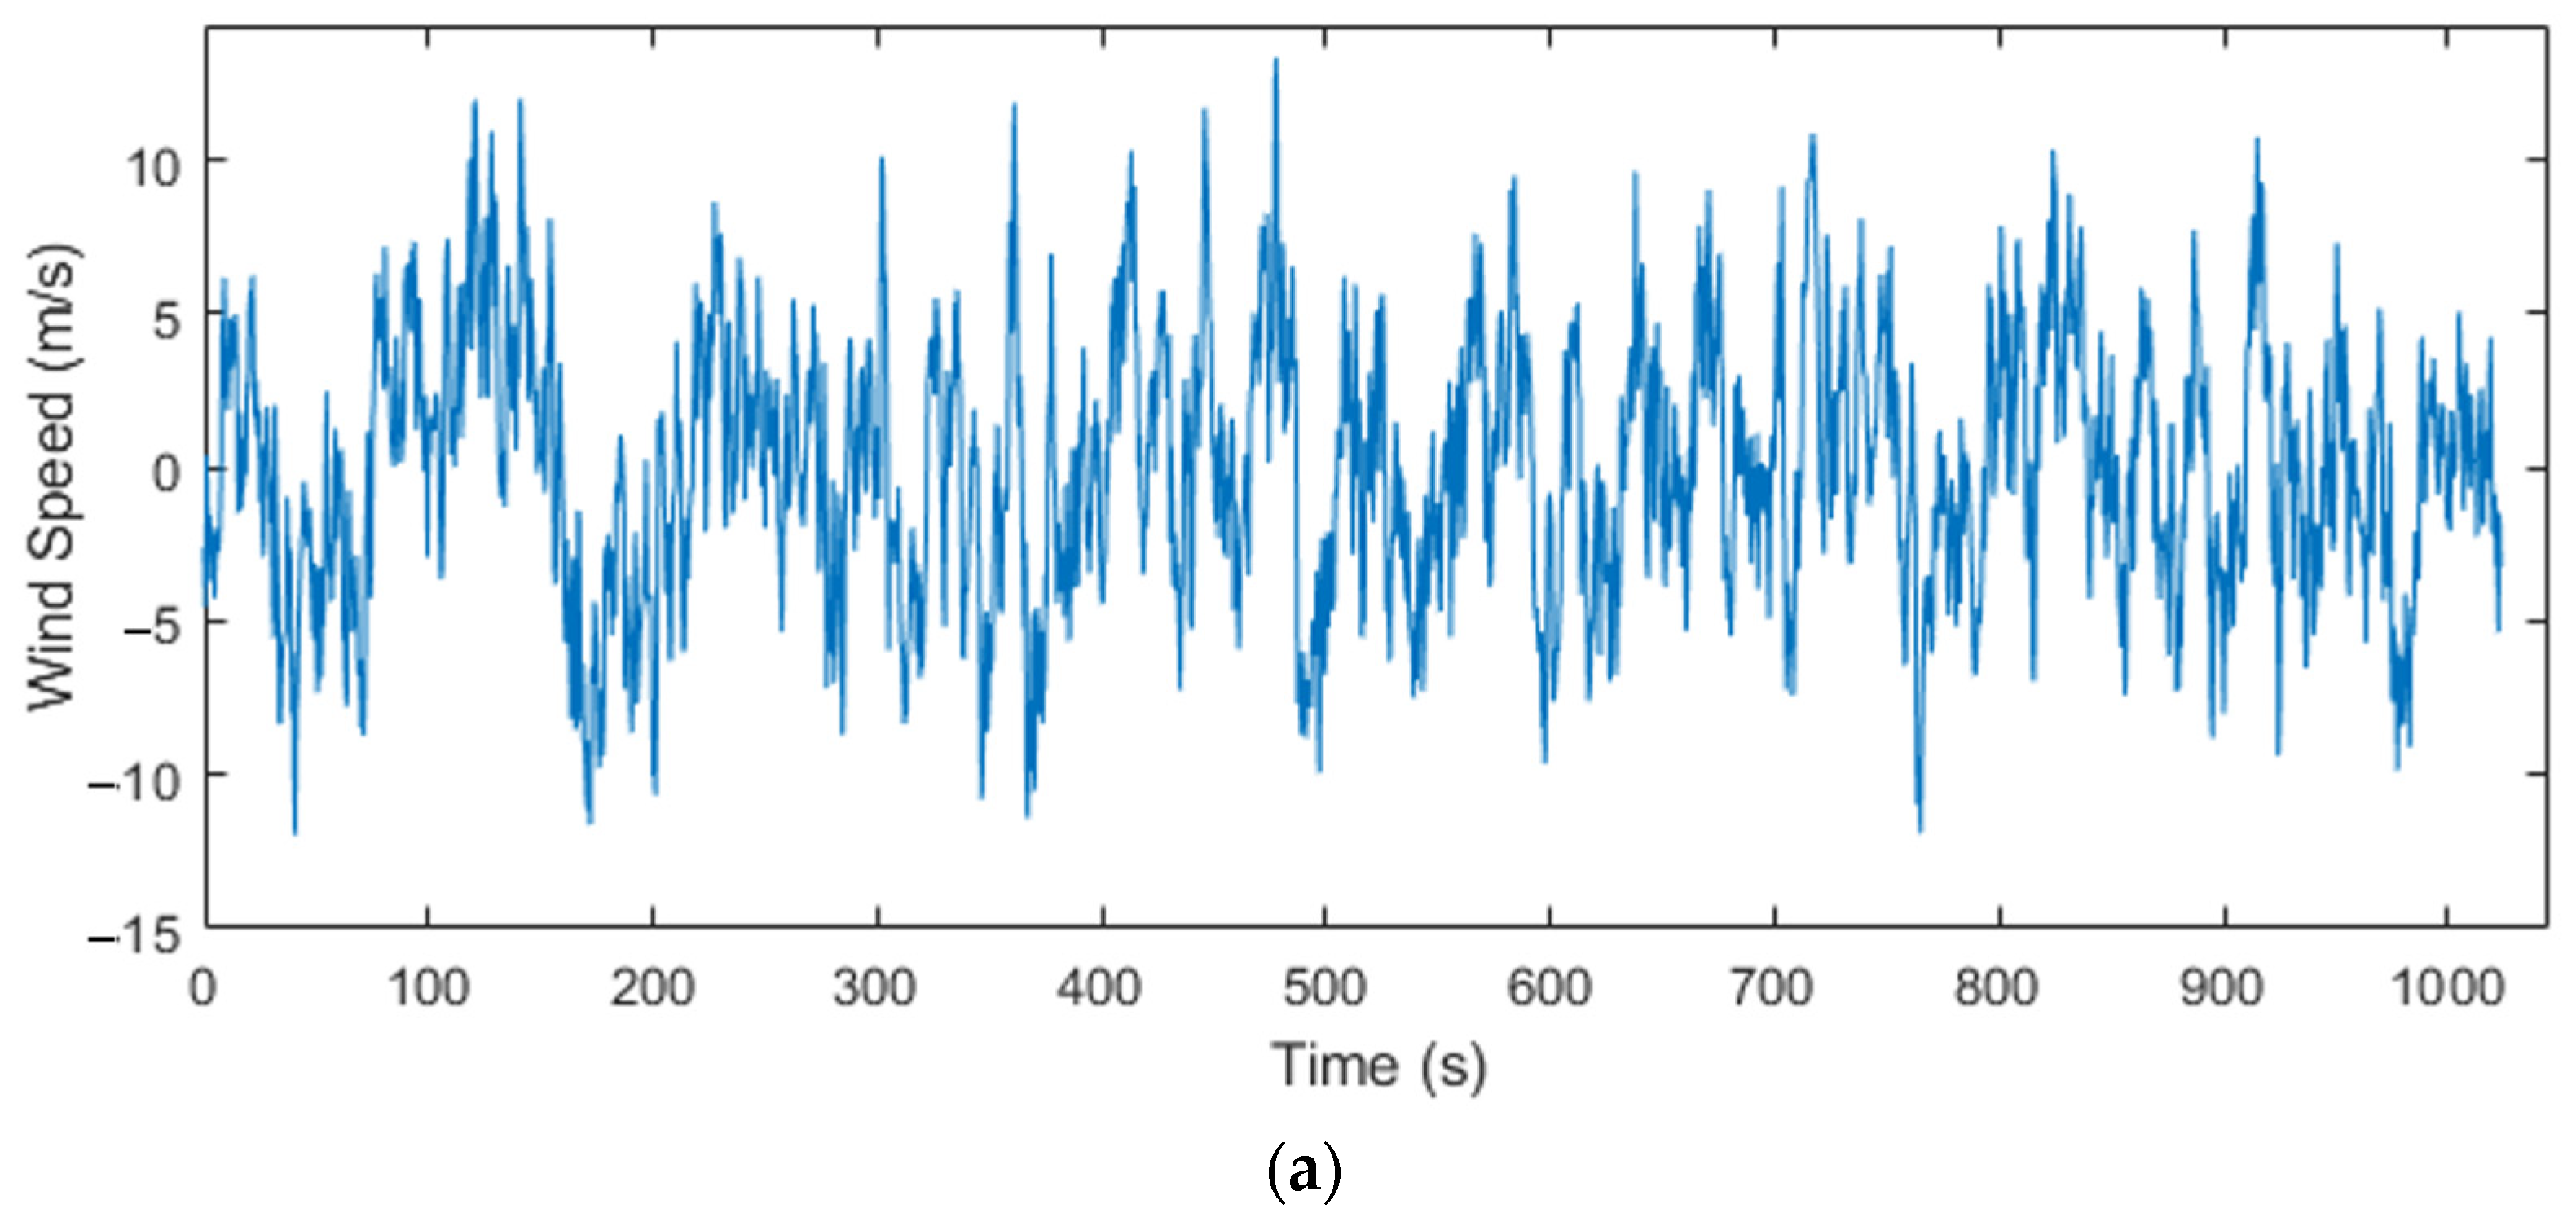
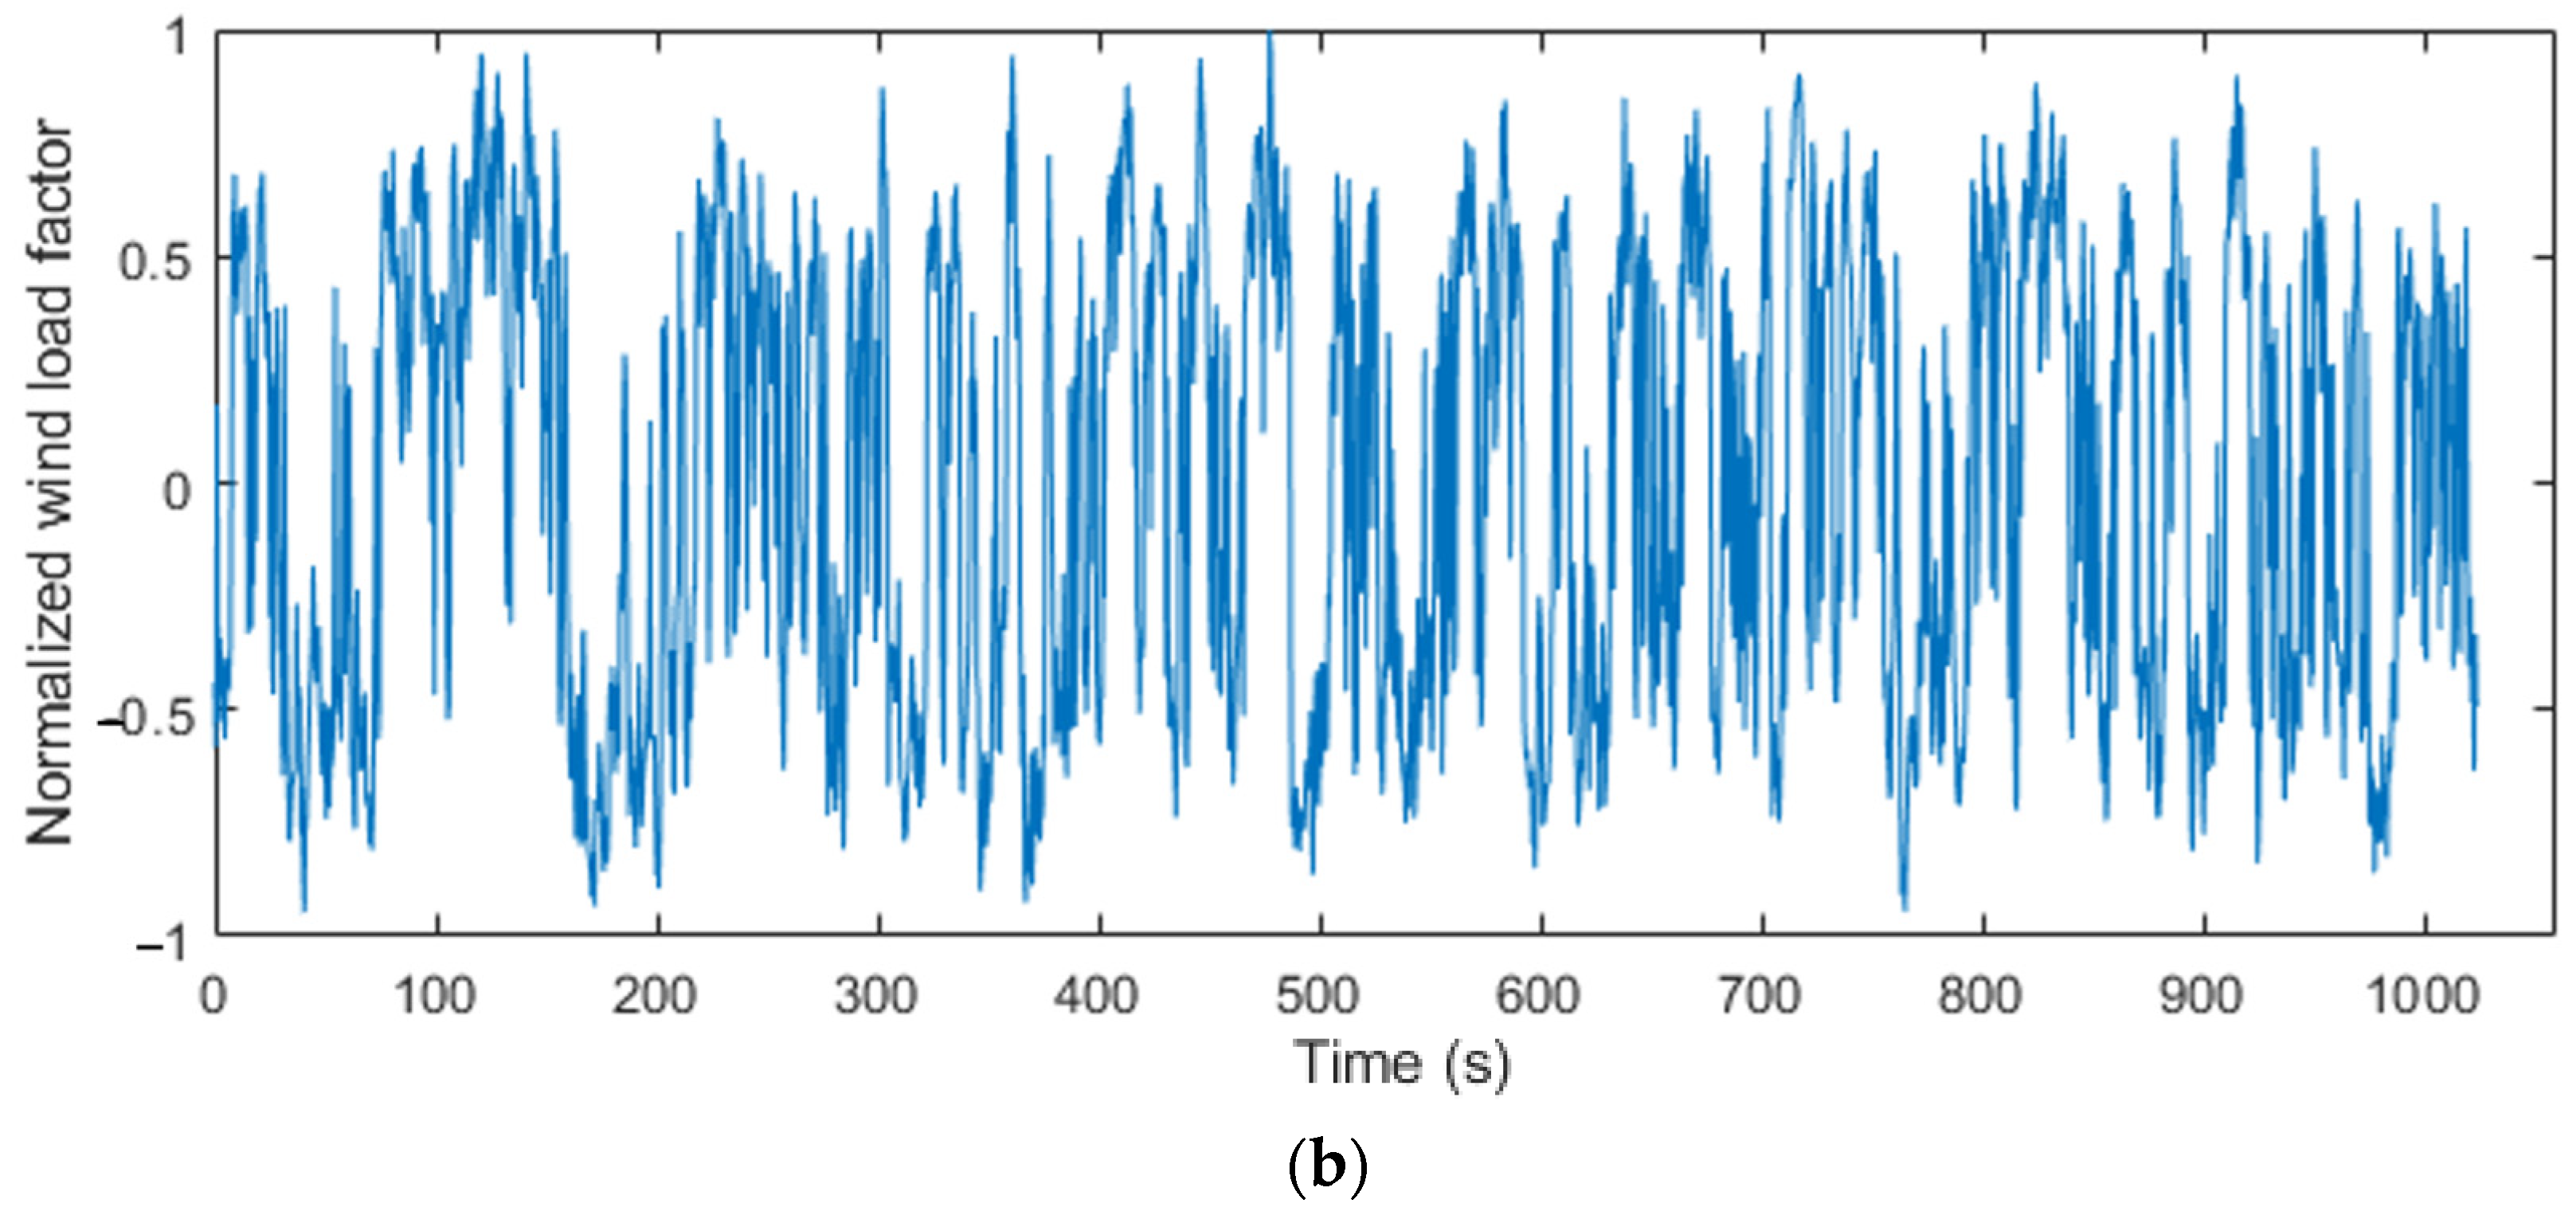
Due to the lack of wind tunnel time series data, the fluctuating wind pressure on the structure was simulated with an equivalent fluctuating wind load. Though the turbulence caused by the fluctuating wind speed and structure deformation cannot be considered in this approach, it is cost-effective and can provide an equivalent wind pressure on the structure surface. Based on the monotonic wind pressure calculated in Section 2.2, in order to generate the fluctuating wind load, a time series of load factors was applied. The load factor was derived based on the fluctuating wind speed generated by the NatHaz Online Wind Simulator (NOWS) [27]. The corresponding wind load factor, , was computed from the wind speed record based on the quadratic wind–pressure relationship, normalized by (Equation (3)). The time history, was then applied in OpenSees as a multiplicative factor to the nodal wind load derived from the adopted pressure coefficient distribution to obtain the fluctuating wind load time history. The wind speed time series was simulated considering 1024 frequencies and a cut-off frequency of 1 Hz with a discrete frequency function with Cholesky decomposition and FFT. An example of the generated wind speed time history record is shown in Figure 2a. The 3 s gust wind speed was 46 m/s, which is the design wind speed for the Upper Michigan region per ASCE 7-22 [2]. The load factor time history records were then calculated based on the generated wind speed record. Since the wind pressure is proportional to the square of the wind speed value, the wind load factor was calculated as
in which Fvi and Vi were, respectively, the wind load factor and wind speed at the ith time step, and Vmax is the maximum wind speed in the time history record. The calculated wind load factor time history record is shown in Figure 2b.
Figure 2.
(a) Example wind speed time history and (b) the generated wind load factor time history for the fluctuating wind speed.
The generated load factor time series was applied in OpenSees to the structural models with the derived wind load distribution for nonlinear dynamic time history analysis. In OpenSees, only one time series can be input in one analysis. Due to the limitation of the software, the fluctuating wind load factor cannot be separately input with different levels. The fluctuating wind load factor was generated separately considering the mid-height of the target structure. Meanwhile, to represent the wind response with the fluctuating wind speed while reducing computational requirements, a shorter wind load factor time history record was randomly picked from the original one with the required time length.
A 5 s segment was selected from the simulated wind speed record to reduce computational cost for nonlinear time history analyses while ensuring that the same wind-excitation segment is used for both wind-only and post-earthquake wind cases. Therefore, the reported wind responses are intended for relative comparison (damage-induced amplification under identical excitation) and demonstration of the framework, rather than for reproducing long-duration storm statistics (e.g., RMS, exceedance probability), which would require substantially longer simulations. Due to platform implementation constraints, the fluctuating component is introduced through a single-load-factor time series applied uniformly along height; therefore, synchronized multi-point pressure fields and their spatial correlations are not explicitly represented in this study.
3. Structural Models and Loading Scenarios
Three archetypes are analyzed: an SOM benchmark building (for wind-response verification), a conventional CLT shear-wall building, and a PT rocking CLT wall platform. All models are implemented in OpenSees; wall panels are represented with elastic shell elements, and floors are idealized as rigid diaphragms for global compatibility, while nonlinear behavior is concentrated in connection/rocking components. The sequential protocol applies earthquakes, rest, and wind to compare post-event wind-response sensitivity under identical wind excitation within the stated assumptions. The key nonlinear components are represented by zero-length hysteretic springs governed by a pinching-type rule. Each spring follows a piecewise backbone (force–deformation envelope) with cyclic unloading/reloading, pinching, and degradation intended to reproduce the observed connection-dominated behavior under cyclic loading. These springs are used to capture stiffness reduction and energy dissipation effects that influence post-event dynamic properties and subsequent wind response.
3.1. SOM Benchmark Structural Model Setup
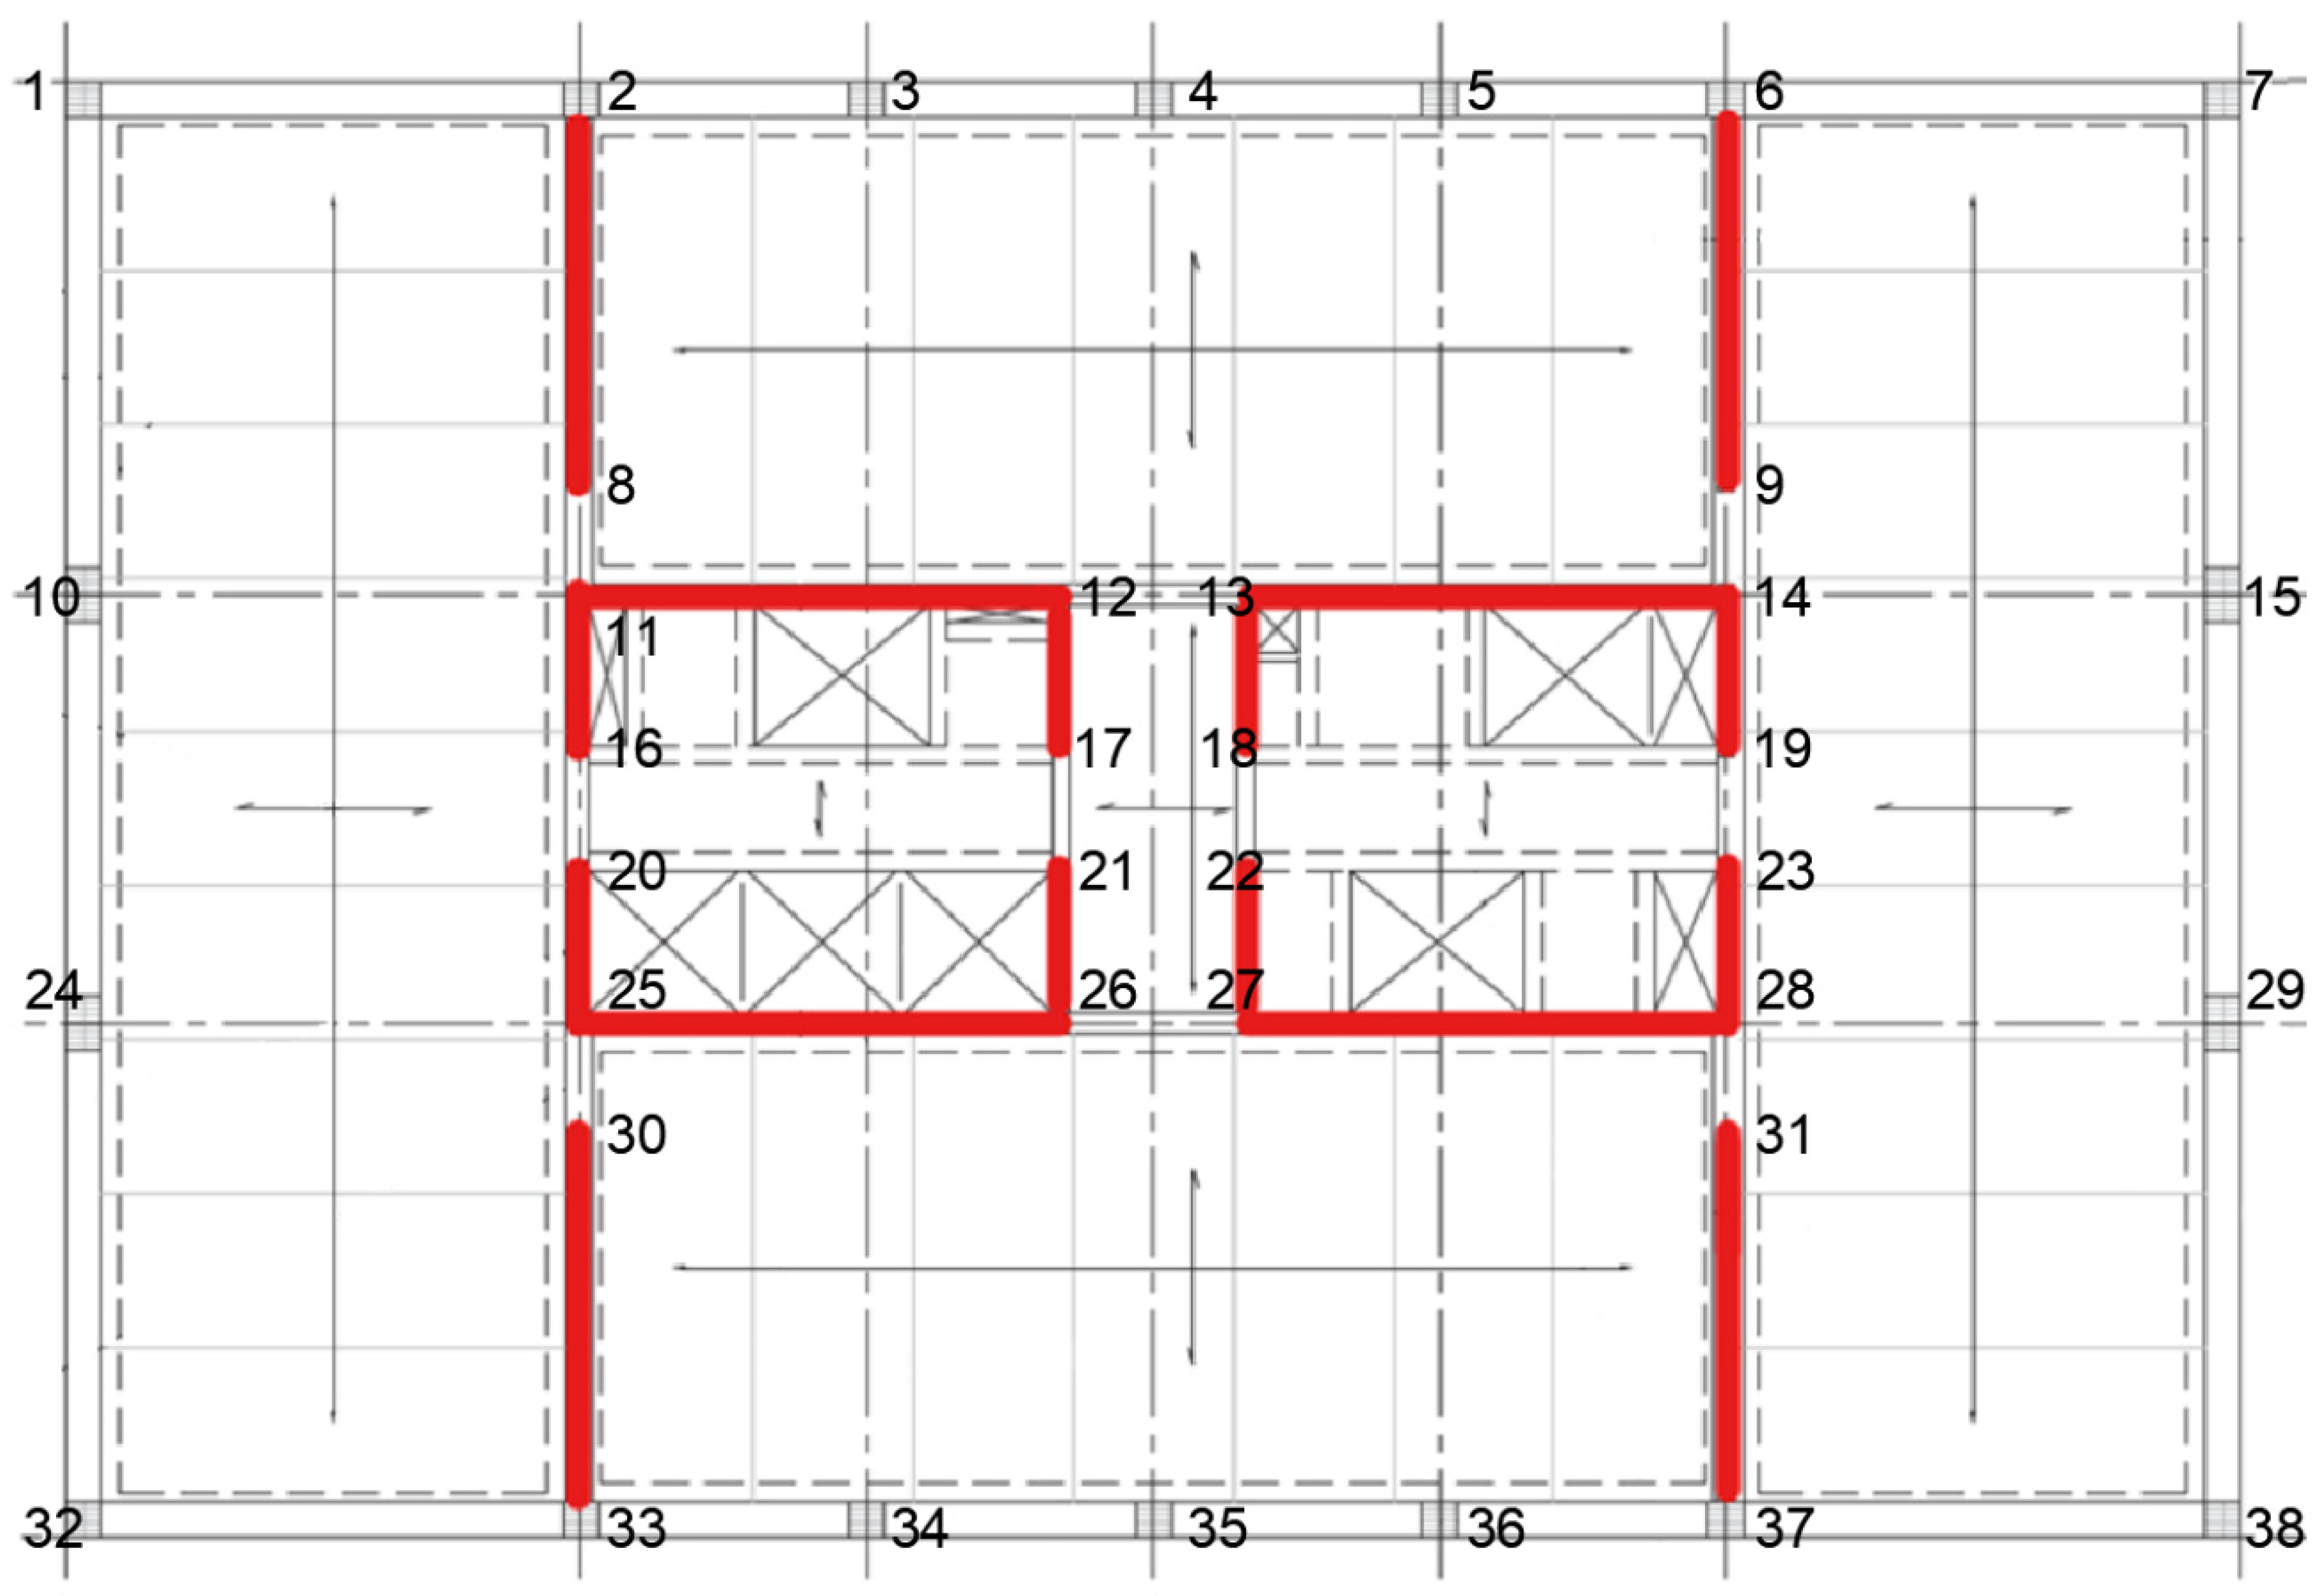
In order to verify the simulation structure response under wind loading, a benchmark building model was established based on references. The structural model was established and analyzed in the open-source FEM software OpenSees. The horizontal geometry and allocation are based on the plan provided in the SOM timber tower project report [5], as shown in Figure 3. The CLT shear wall and core were marked in thickened lines. The height of the story is defined as 2745 mm.
Figure 3.
Plan and wall allocation of SOM benchmark structural model (red line: wall locations, shaded rectangular box: column location).
The node number allocation is conducted to avoid conflicts between node numbers and contains location information. The number of nodes is established for each layer based on the location. For example, the node of the bottom left corner on the seventh floor was assigned as node 732. Meanwhile, the base nodes were duplicated for the wall elements, with the number adding up to 50. The number of stories in the node was recorded by adding 100 per level.
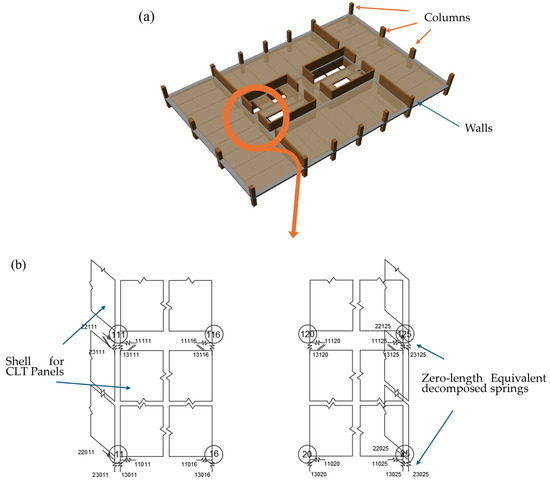
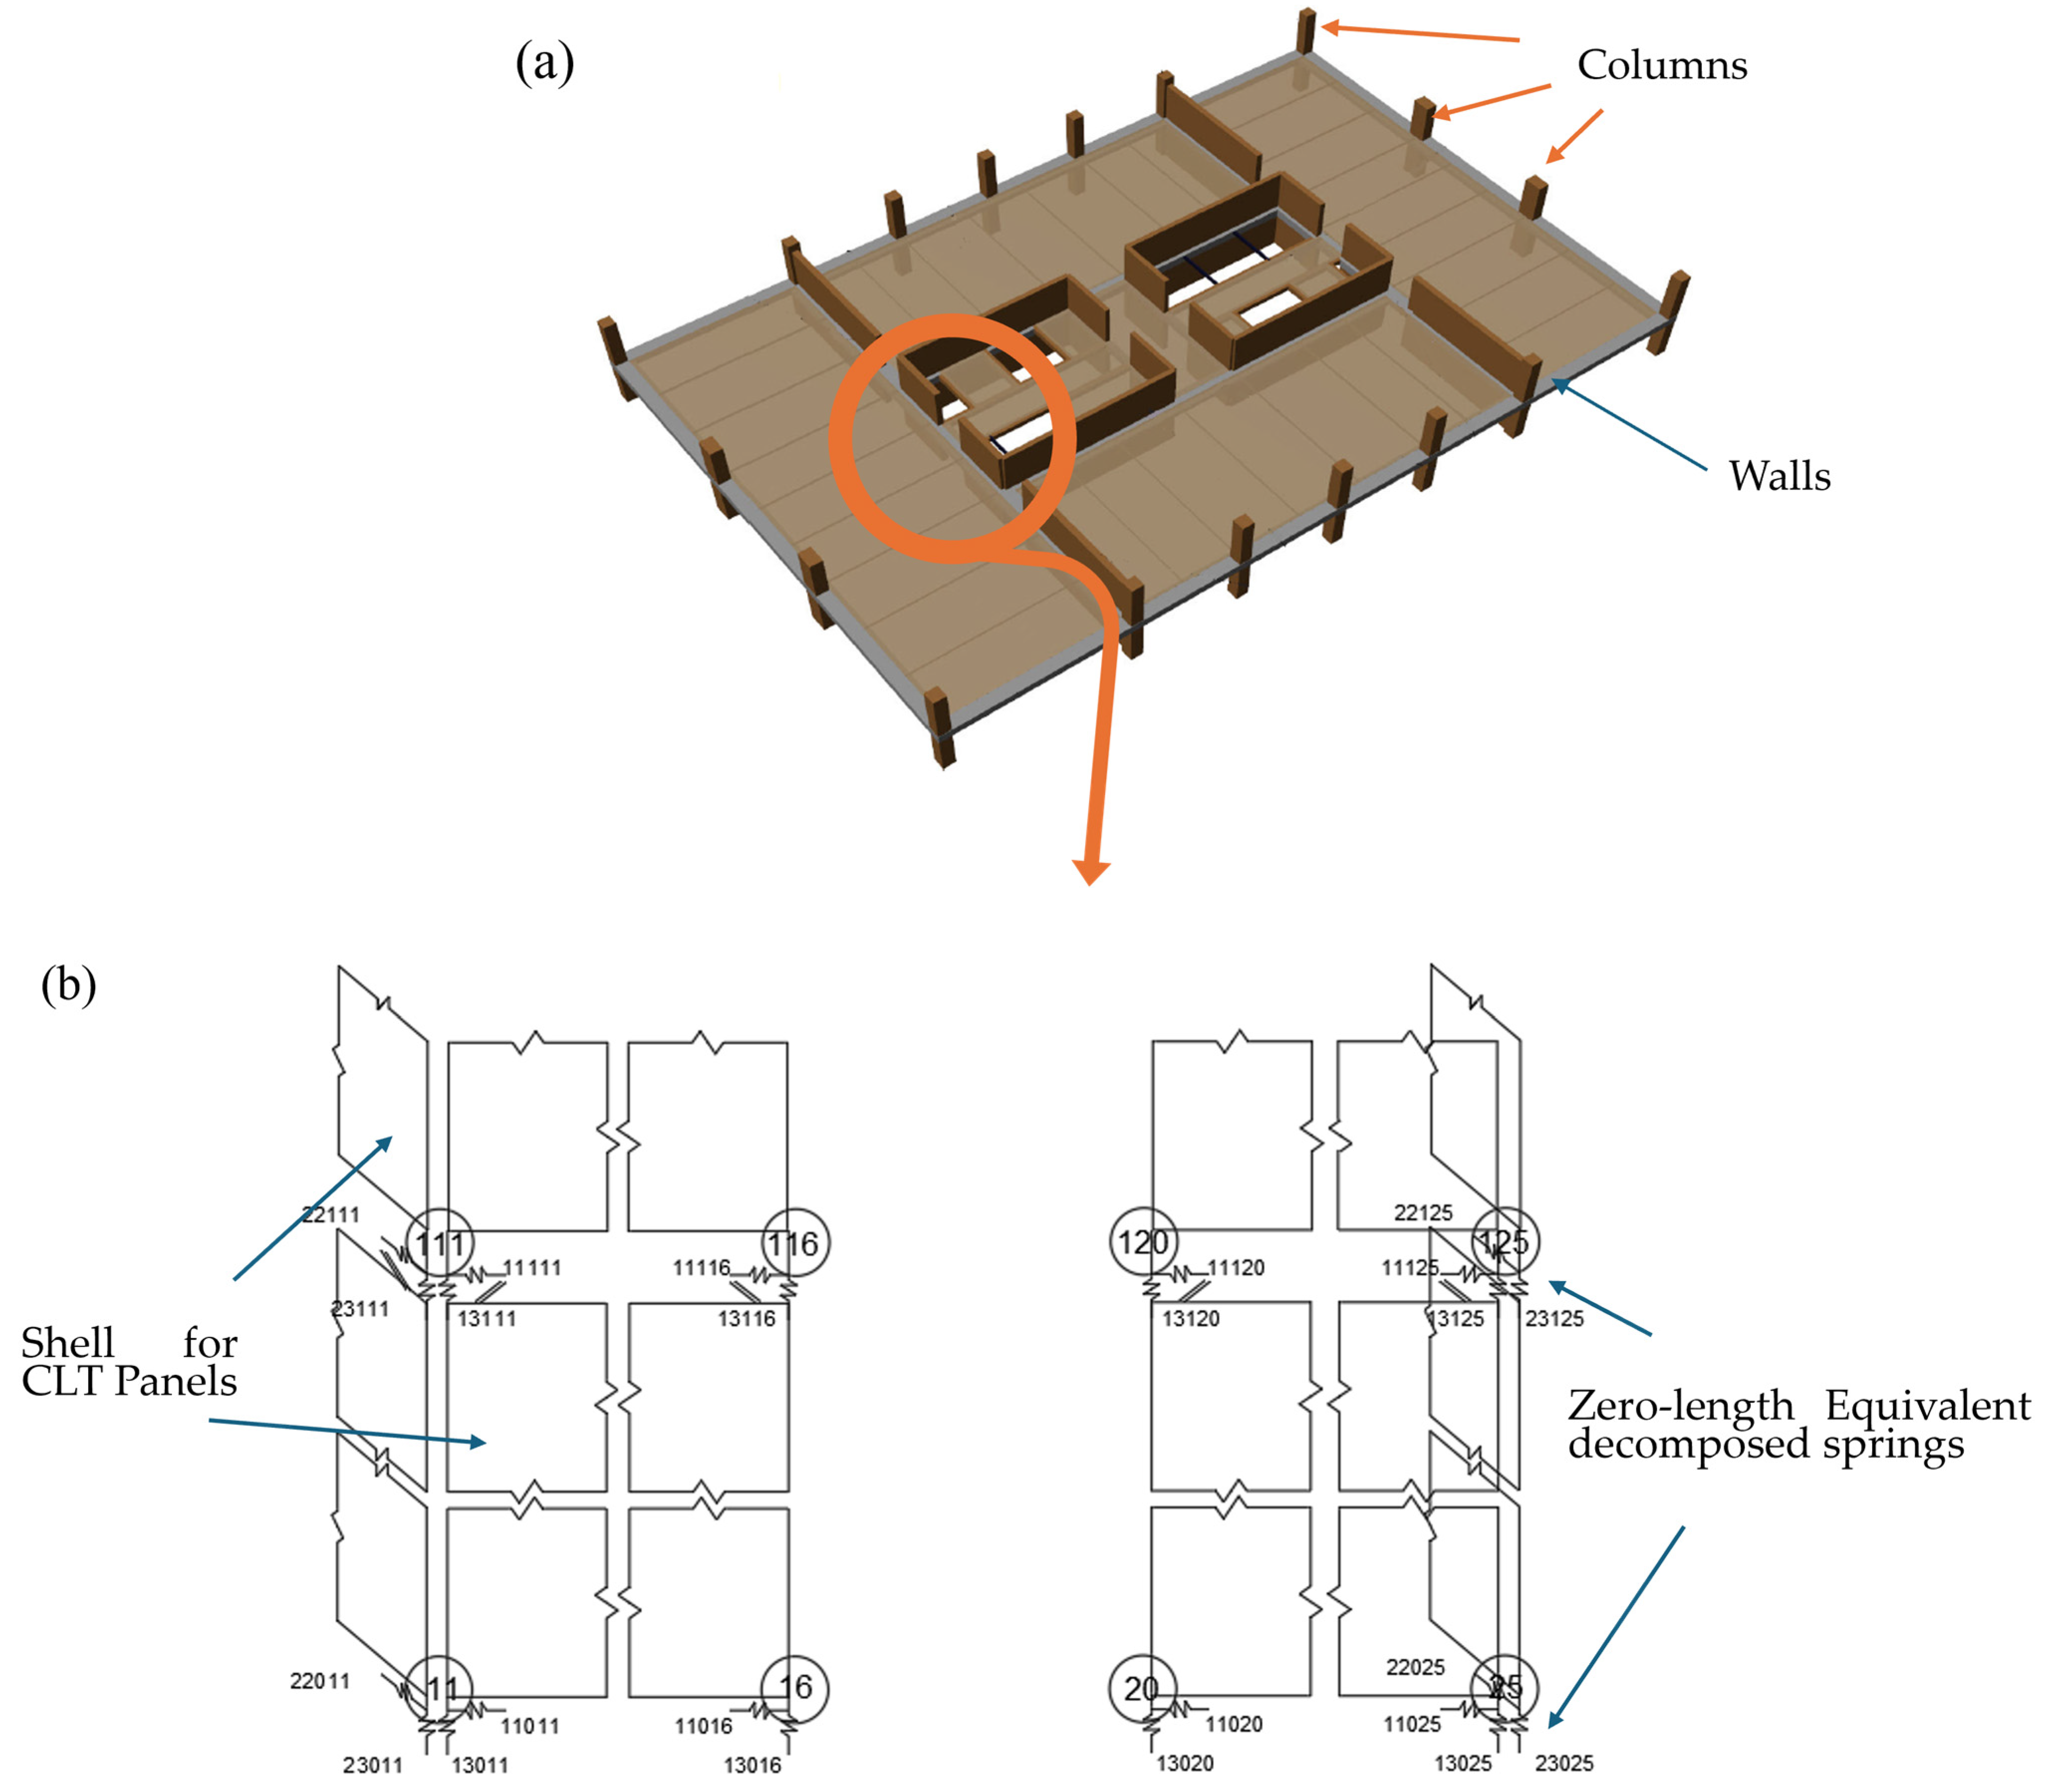
The model was built with the developed decomposed model with equivalent springs. The wall shaft element (Type 1) is modeled with a shell element. One-dimensional zero-length spring elements (Type 2) were used to simulate the equivalent connections. There are two horizontal ones and two vertical ones calibrated in the previous sections for each wall shaft. The primary and link beams (Type 3) and column (Type 4) were assigned as 1D timber beam elements. The slabs (Type 5) were simplified to five major plates. The slab is considered stiff for the investigation of the horizontal drift of the structure. The secondary beam was considered and included in the equivalent stiff slab plates. The number was assigned as the story number, followed by the element type and the element identification number. For example, the left bottom wall shaft on the seventh story is numbered as 70,116, which means level 7, Type 1, element number 16.
As shown in Figure 4a,b, the wall, beam, column, and slab elements were assigned following the SOM benchmark structure design plan. Structural openings, such as windows and doors, are not considered in this study. The columns were directly connected to the adjacent stories. The wall panels simulated with shell elements were connected to the base or lower slab with the decomposed equivalent springs and fully fixed with the top slabs. The beams and slabs were assigned, connecting the elements in the story.
Figure 4.
(a) Scheme of the model element allocation in the standard story and (b) example of wall and connection node allocation.
The CLT panels are considered relatively stiff compared with the connections. As a result, the deformations are mostly related to the connections rather than the elastic deformation of the panel. The material of the wall shaft was assigned with an isotropic elastic modulus of 10,000 MPa and a Poisson’s ratio of 0.35, which is the major direction average value according to [20]. The connections were assigned with the calibrated pinching model in the previous section. The column was assigned as glued laminated timber with an axial stiffness of 1173 kN/mm [5]; accordingly, the axial elastic modulus was 8655 MPa for both beam and column elements. The slab was assigned to be stiff and has an elastic modulus of 100 GPa. Static gravity was applied to all the nodes after the structural model was assembled with the nodes and the elements according to the design loads [16].
The modal analysis result of the first five modes of the buildings from the reference [14] and the model predictions are listed in Table 2. The third mode contains the most considerable difference, which is 34.22%. Other than that, the differences between the model result and the correlated reference values were up to 9.26%. In addition to the modal-frequency check, the SOM benchmark model is further verified at the response level by comparing peak story displacement and peak story acceleration under the same wind-excitation setting with the published reference results (Table 2). Because detailed reference outputs such as story shear time histories and energy-component decomposition are not reported in the benchmark dataset, the present verification focuses on response quantities that are available and directly comparable (peak displacement/acceleration). The result illustrates that the structural model is fully functional and provides a reasonable structural dynamic response.
Table 2.
The primary modes and frequencies of SOM benchmark structural model comparison with the reference value.
3.2. Three-Story Conventional Wall Structure Setup
Similar to the SOM benchmark structure, a structural model with a conventional shear wall system was built based on a three-story building from the SOFIE project [28,29] in the first stage. The structural model was established based on the previous wall model with decomposed equivalent springs and stiff shell elements as slabs. The conventional CLT shear wall is modeled in OpenSees with near-rigid CLT panels and nonlinear connection behavior concentrated in zero-length springs using a pinching-type hysteresis model. Compression contact at the wall base is represented by non-tension elements in parallel to the connection springs. Model parameters follow previously published calibration for comparable CLT wall assemblies. Considering the excessive stiffness provided by the CLT panels in the wall, the openings on the slab and wall panels were neglected for simplification. The equivalent decomposed springs’ parameters and the shell element for the wall model were calibrated based on the correlated connection and CLT wall test [30]. The equivalent springs separately represented the horizontal and vertical behavior at the bottom nodes. The vertical decomposed spring was calibrated for the parallel combination of compression and tension behavior in the two directions. The compression behavior simulated the contact between the CLT wall panel and slab. The tension behavior was equivalent to the brackets and hold-downs in the rocking hysteresis behavior. The equivalent horizontal spring represents the combination of the brackets and hold-downs in the shear direction. The details of the model development, parameter calibration, and earthquake simulation validation can be referred to in the authors’ previous study [31].
3.3. PT Wall Platform Structure Setup
Similarly, an example platform structure with PT CLT walls was built based on the reference to examine the performance of PT CLT walls. The example structural model was established based on a two-story platform structure, the first stage of the ongoing Natural Hazards Engineering Research Infrastructure (NHERI) Tall Wood project [32,33]. The PT rocking wall is modeled to capture uplift/rocking through distributed compressive toe-contact springs at the wall base and a post-tensioning tendon represented by a corotational truss element with a steel constitutive model including prestress. The CLT panel is modeled with elastic shell elements to retain global stiffness and deformation compatibility with low computational cost. Energy dissipation components (when present) are represented by equivalent springs consistent with the adopted archetype. The structure was a two-story platform supported by two parallel PT rocking CLT walls and eight columns. The eight columns were designed for vertical gravity load resistance. For PT CLT walls, the wall model was slightly different. In the vertical direction, the equivalent decomposed spring served as the compression of the CLT panel to base contact and the tension resistance of the PT tendon. The horizontal direction spring was defined to be stiff to prevent sliding, as in the experiment setting. The CLT wall panels were connected to the slabs with stiff shear keys, which were simulated as a constraint that shares only displacement in horizontal directions. The slabs were simulated as stiff shell elements. The structural model was evaluated with a series of uniaxial seismic excitation following the experiment project [32,33].
3.4. Loading Scenarios
The structure was first examined for dynamic response under wind-only scenarios with the modeled equivalent fluctuating wind load. Then, the structure was simulated with the sequential seismic–wind hazard scenarios. The structural performance of the sequential scenario was examined by comparing the structural behavior during the wind load period in the sequential scenarios and the response in the wind-only scenarios with the same wind load. The example structural models were separately applied with sequential events with increasing Peak Ground Accelerations (PGAs) for the same seismic record to examine the impact of the seismic event intensity on the structure’s performance.
In sequential scenarios, the loads were applied by following the main event’s order after the event sequence. After the main event of seismic excitation, the structure’s performance will be influenced by the damage to the connections during energy dissipation. Between the main seismic event and after the event, the structure rested at least 20 times during the period (assuming a 5% damping ratio) to maintain the damage condition while eliminating the interference [34]. The rest period is introduced to allow earthquake-induced transient vibrations to decay before applying the wind excitation so that the post-event wind response reflects the updated (damaged) structural state rather than residual oscillations from the earthquake analysis. A duration of 20 T (T = fundamental period) is used as a conservative decay window under typical damping assumptions; this value is a modeling choice for numerical separation of hazards rather than a representation of an actual inter-event interval. The structures were directly applied with the fluctuating wind load for the nonlinear dynamic analysis in the wind-only scenarios.
There were three models examined in the following study to investigate the wind pressure and response simulation and the performance of the CLT wall system in seismic–wind sequential scenarios. The analysis was limited to a wind-only scenario to verify the wind pressure and response simulation method for the SOM benchmark structural model. The seismic–wind sequential scenario was not applied to the SOM building structure due to the high computational cost for the complex building in nonlinear dynamic analysis with an entire seismic event. The other two models, which were separately a three-story building with a conventional CLT shear wall system and a two-story platform with a PT CLT rocking system, were examined in wind-only and sequential scenarios. In order to confirm the calculated result with reference data, the initial seismic event for both models was the El Centro 1940 N-S ground motion record with a peak ground acceleration of 0.5 g. A series of seismic events involving Northridge cases with different PGAs was then conducted to investigate the impact of seismic intensity on the structure. The seismic record was obtained from the design and experiment on the PT rocking wall platform structure in the ongoing Natural Hazards Engineering Research Infrastructure (NHERI) Tall Wood project [32,33]. The PGAs include the Serviceability Limit Earthquake (SLE) level (0.19 g), the Design-Based Earthquake (DBE) level (0.54 g), the original record (0.55 g), the MCE level (0.76 g), and an extreme case of 1.2 times the Maximum Considered Earthquake (12MCE) level (0.89 g). Wind loads with different load factors (1, 1.1, 1.2, 1.5, and 2) were simulated in scenarios with the same earthquake event (DBE) to investigate the influence of wind load intensity on the structural responses. The sequential scenarios were named in the following sections based on the earthquake event code and the general wind load factor, as shown in Table 1. The selected records are adopted to remain consistent with the calibration/validation datasets used in the referenced experimental programs and the previously calibrated wall models. We acknowledge that record-to-record variability (e.g., near-fault pulse-like motions, different spectral shapes, and bidirectional/vertical components) may lead to different damage patterns and post-event dynamic properties, which can in turn alter the subsequent wind response; extending the framework to a larger suite of ground motions is an important next step and is listed as a limitation of the present study.
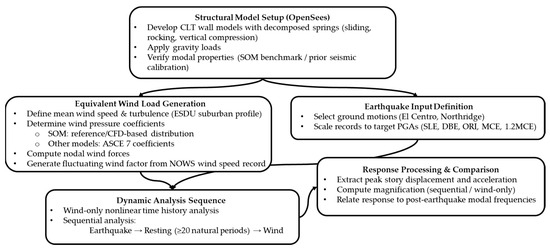
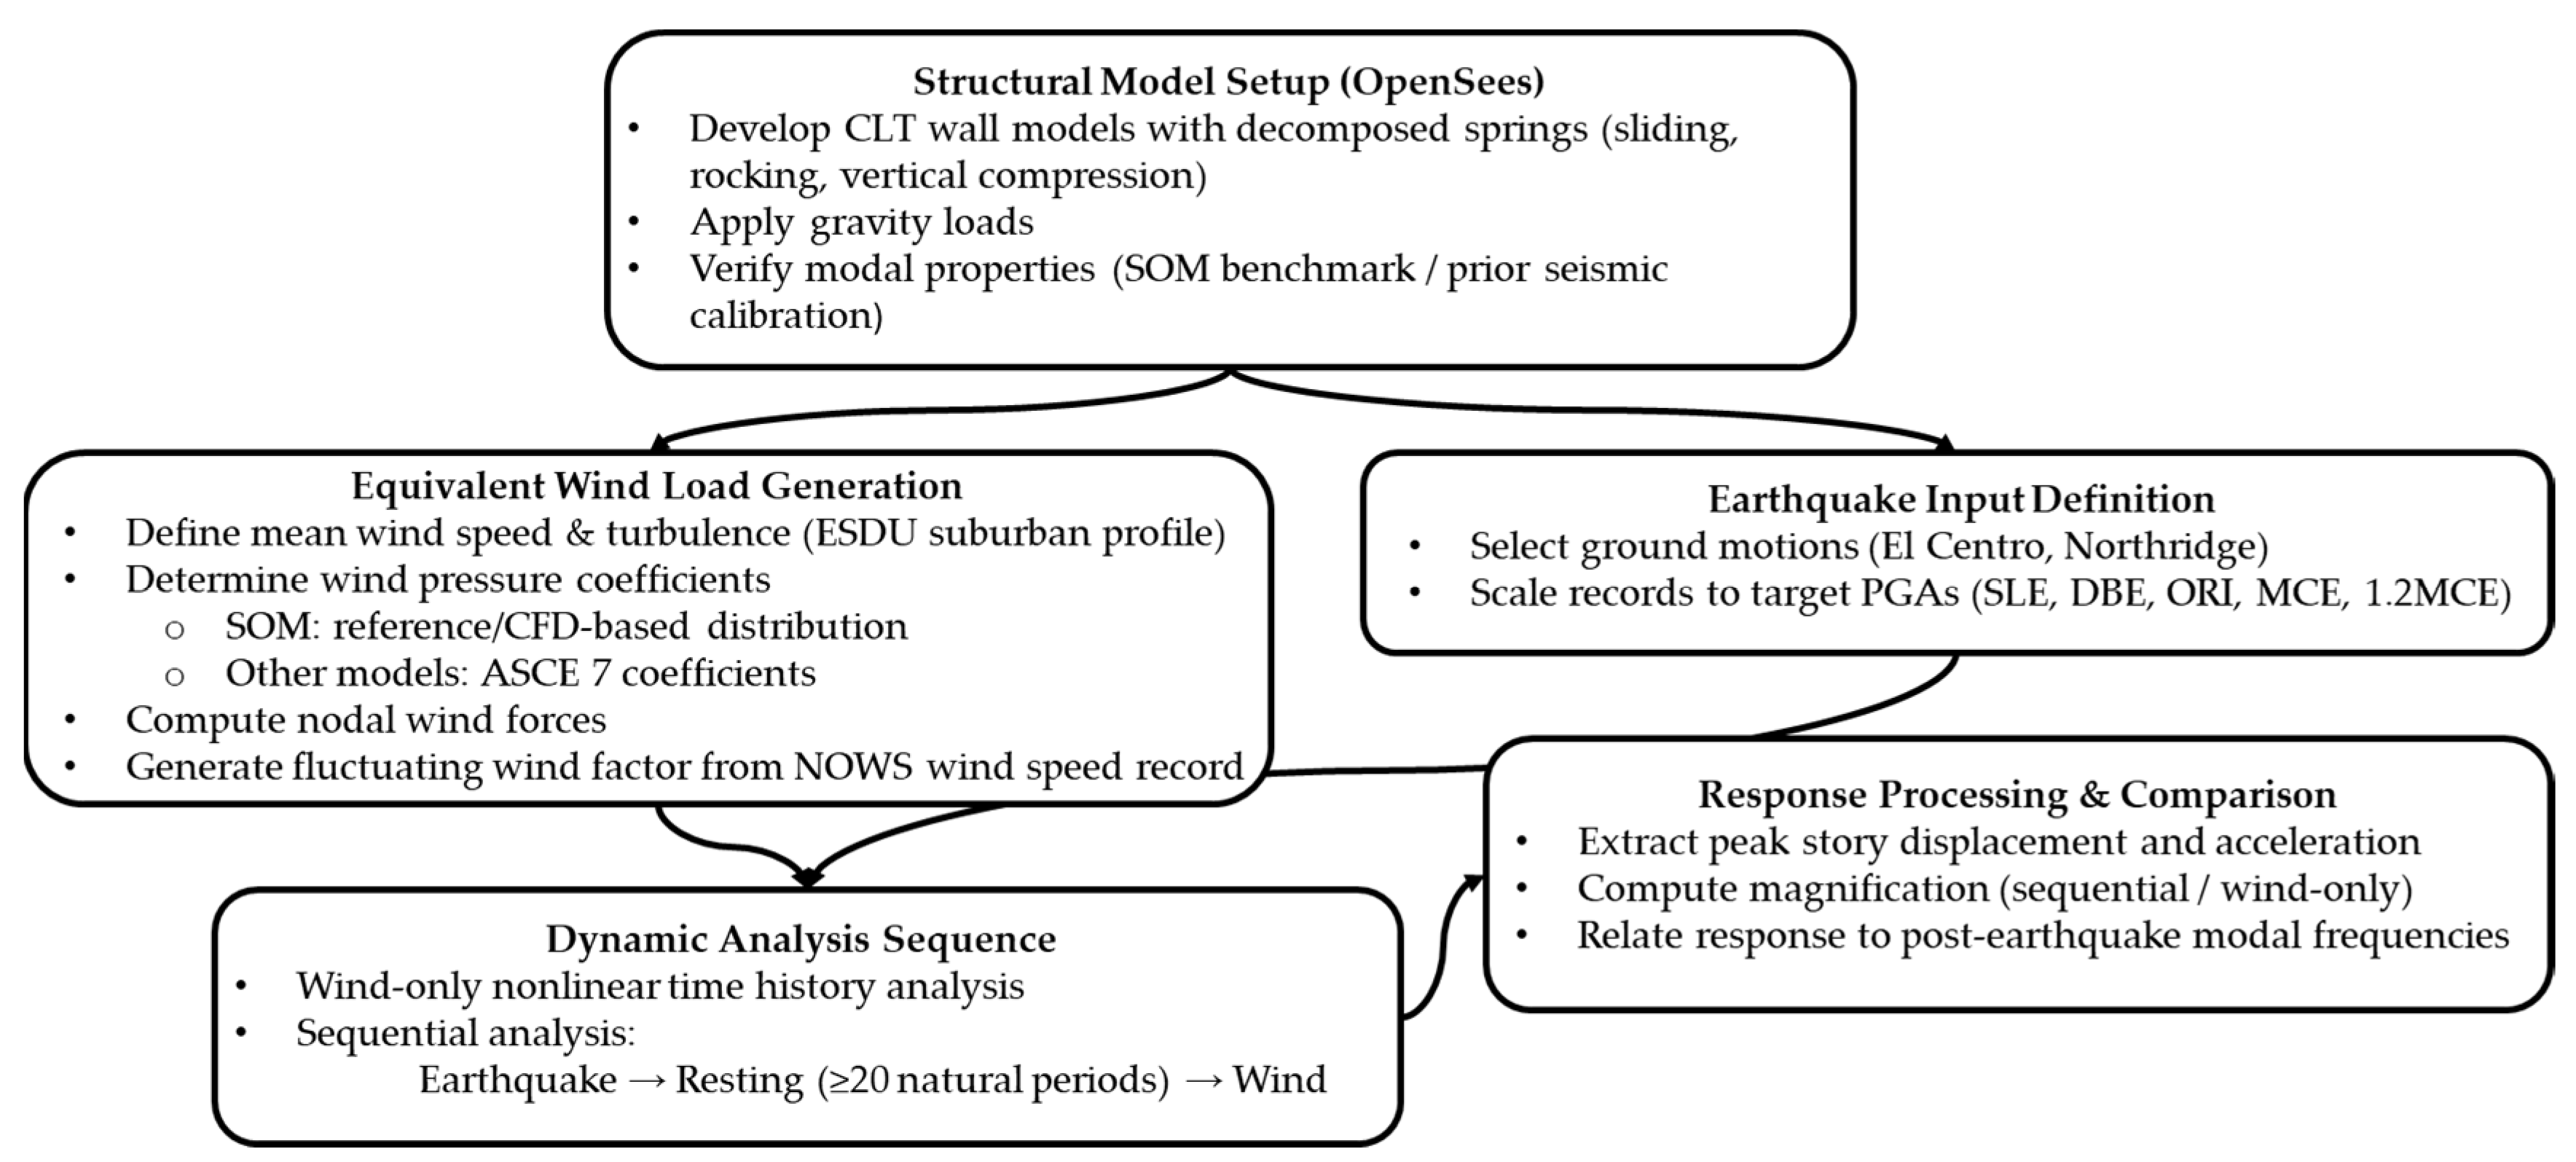
Also, Figure 5 provides a schematic overview of the numerical workflow adopted in this study, highlighting the ordering of wind load generation, earthquake input definition, dynamic analysis sequence, and response evaluation.
Figure 5.
Numerical analysis workflow for wind and sequential seismic–wind loading.
4. Model Response Results Subjected to Wind
4.1. SOM Benchmark Structural Model
The displacement and acceleration of the nodes in each story were separately recorded during the analysis. The story displacement and acceleration were calculated as the average value of the nodes in each story.
The result has an average 13.57% difference compared to the reference value. The model underestimated 21.73% of the maximum displacement at 30 stories. The average 13.57% difference in peak story displacement is mainly attributed to (i) the use of an equivalent fluctuating wind-load representation rather than synchronized multi-point pressure fields, (ii) the adoption of a single-load-factor time series uniformly applied along height due to software limitations, and (iii) the omission of aeroelastic/structure–wind interaction effects. Given these intended simplifications, the benchmark comparison is used here to demonstrate that the proposed wind-load synthesis reproduces the overall response trend and order of magnitude for comparative serviceability assessment, rather than to claim wind-tunnel-level replication. The peak story acceleration of the SOM structural model under fluctuating wind was calculated as 7.81 milli-g, which is close to the reference value (10 milli-g) [17,21]. Combined with the modal analysis results in Section 3.1, the results show that the SOM building model, along with the equivalent fluctuating wind load, can provide a dynamic reference response of the structure with reasonable accuracy.
4.2. Three-Story Conventional Wall Structure
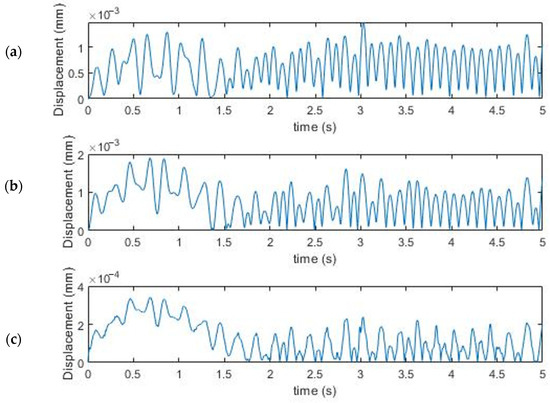
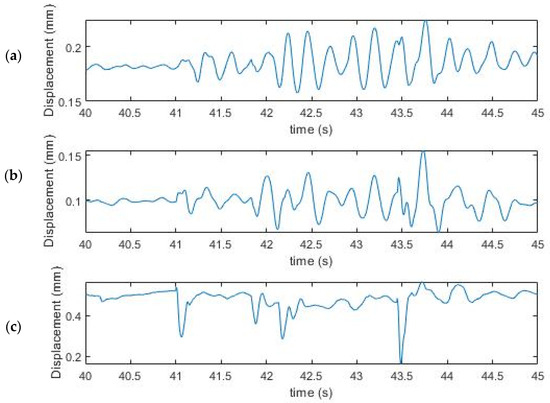
For the wind-only scenario, the wind load was applied in the same way as in the SOM building. The wind profile was kept consistent with the one used in the previous model of the SOM benchmark structure. The wind pressure coefficient was determined based on ASCE 7 regulations, as described in Section 2.2. The equivalent static wind load was then calculated for each node based on the wind speed and wind pressure coefficient at the location. The fluctuating wind speed was then applied with the simulated fluctuating wind load factor, as shown in Section 2.3. The structural model was then analyzed in a nonlinear dynamic simulation for 5 s of wind excitation with a time step of 0.001 s, which computed the nodal reaction, displacement, and acceleration. The story displacement and acceleration were then calculated as each node’s average number on the same story. The final story displacement was calculated as the value of vector addition considering both directions. As shown in Figure 6, the structure vibrated with the wind load, especially during the first 1.5 s, when the wind forced the structure to vibrate. To be noticed, the vibration was mostly in a pattern of a sine curve, while the vector addition of the two directions reversed the negative values.
Figure 6.
Story displacement during the wind loading of the three-story building model at (a) the roof, (b) second floor, and (c) first floor.
The peak story acceleration and peak story displacement were separately calculated from the result time history. The peak story displacements of the three stories were 1.49 × 10⁻³, 1.90 × 10⁻³, and 3.40 × 10⁻⁴ mm. For all three stories, the displacement is less than 2 × 10⁻³ mm, which is minor. The results may indicate that the structural model has a high stiffness compared to the generated fluctuating wind load. At the same time, the structure’s natural frequencies contain many differences from the loading frequencies. The peak story accelerations were 0.97, 0.61, and 1.72 milli-g for each story, which were also small. The result for the wind-only scenario will be compared with the wind response in the sequential scenarios to show the impact of the seismic event on the structure.
4.3. PT Wall Platform Structure
The wind load was applied to the building in the same way as in previous models. With the same wind profile, the wind speed was identical to that of the previous model at each height. Since it is a platform structure with a fully opened room, some minor adjustments were made to allow the structure to be applied with wind pressure. For simplification, the structure was considered to have a fully enclosed curtain wall along the margin of the platform. Therefore, the overall structure can be considered a rectangular box. Accordingly, the wind pressure coefficient was determined following ASCE 7 regulations, as described in Section 2.2. The pressure coefficients were then applied to the external nodes as area-averaged values based on nodal associate areas. The simulated fluctuating wind load factor was then applied as the load factor time series in the model, as shown in Section 2.3. The structural model was computed for the wind response for 5 s of wind excitation with a time step of 0.001 s. Since the wind excitation was applied uniaxially parallel to the PT walls, the displacement and acceleration in the other direction were not analyzed in the following content. The peak story displacement and acceleration were determined as the maximum absolute value that appeared in the time history results.
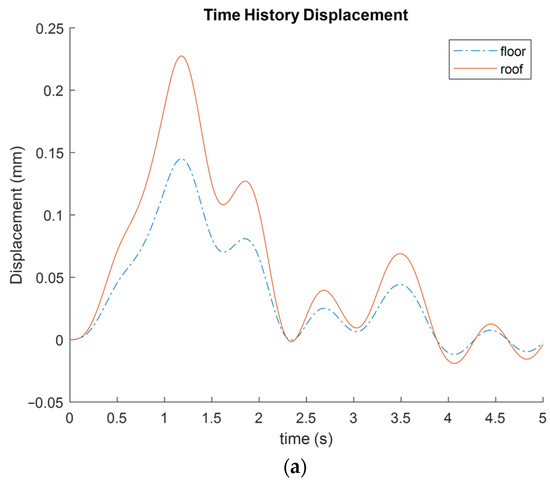
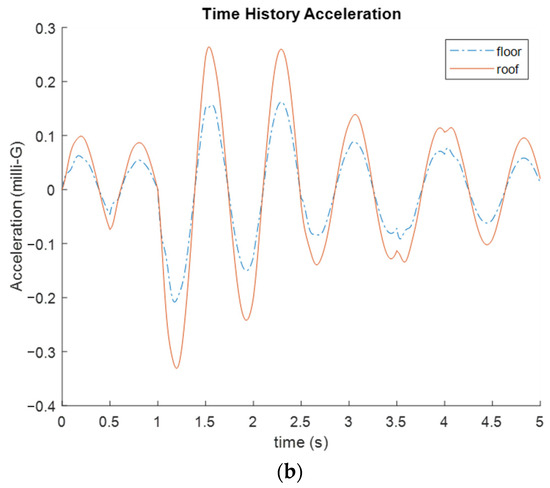
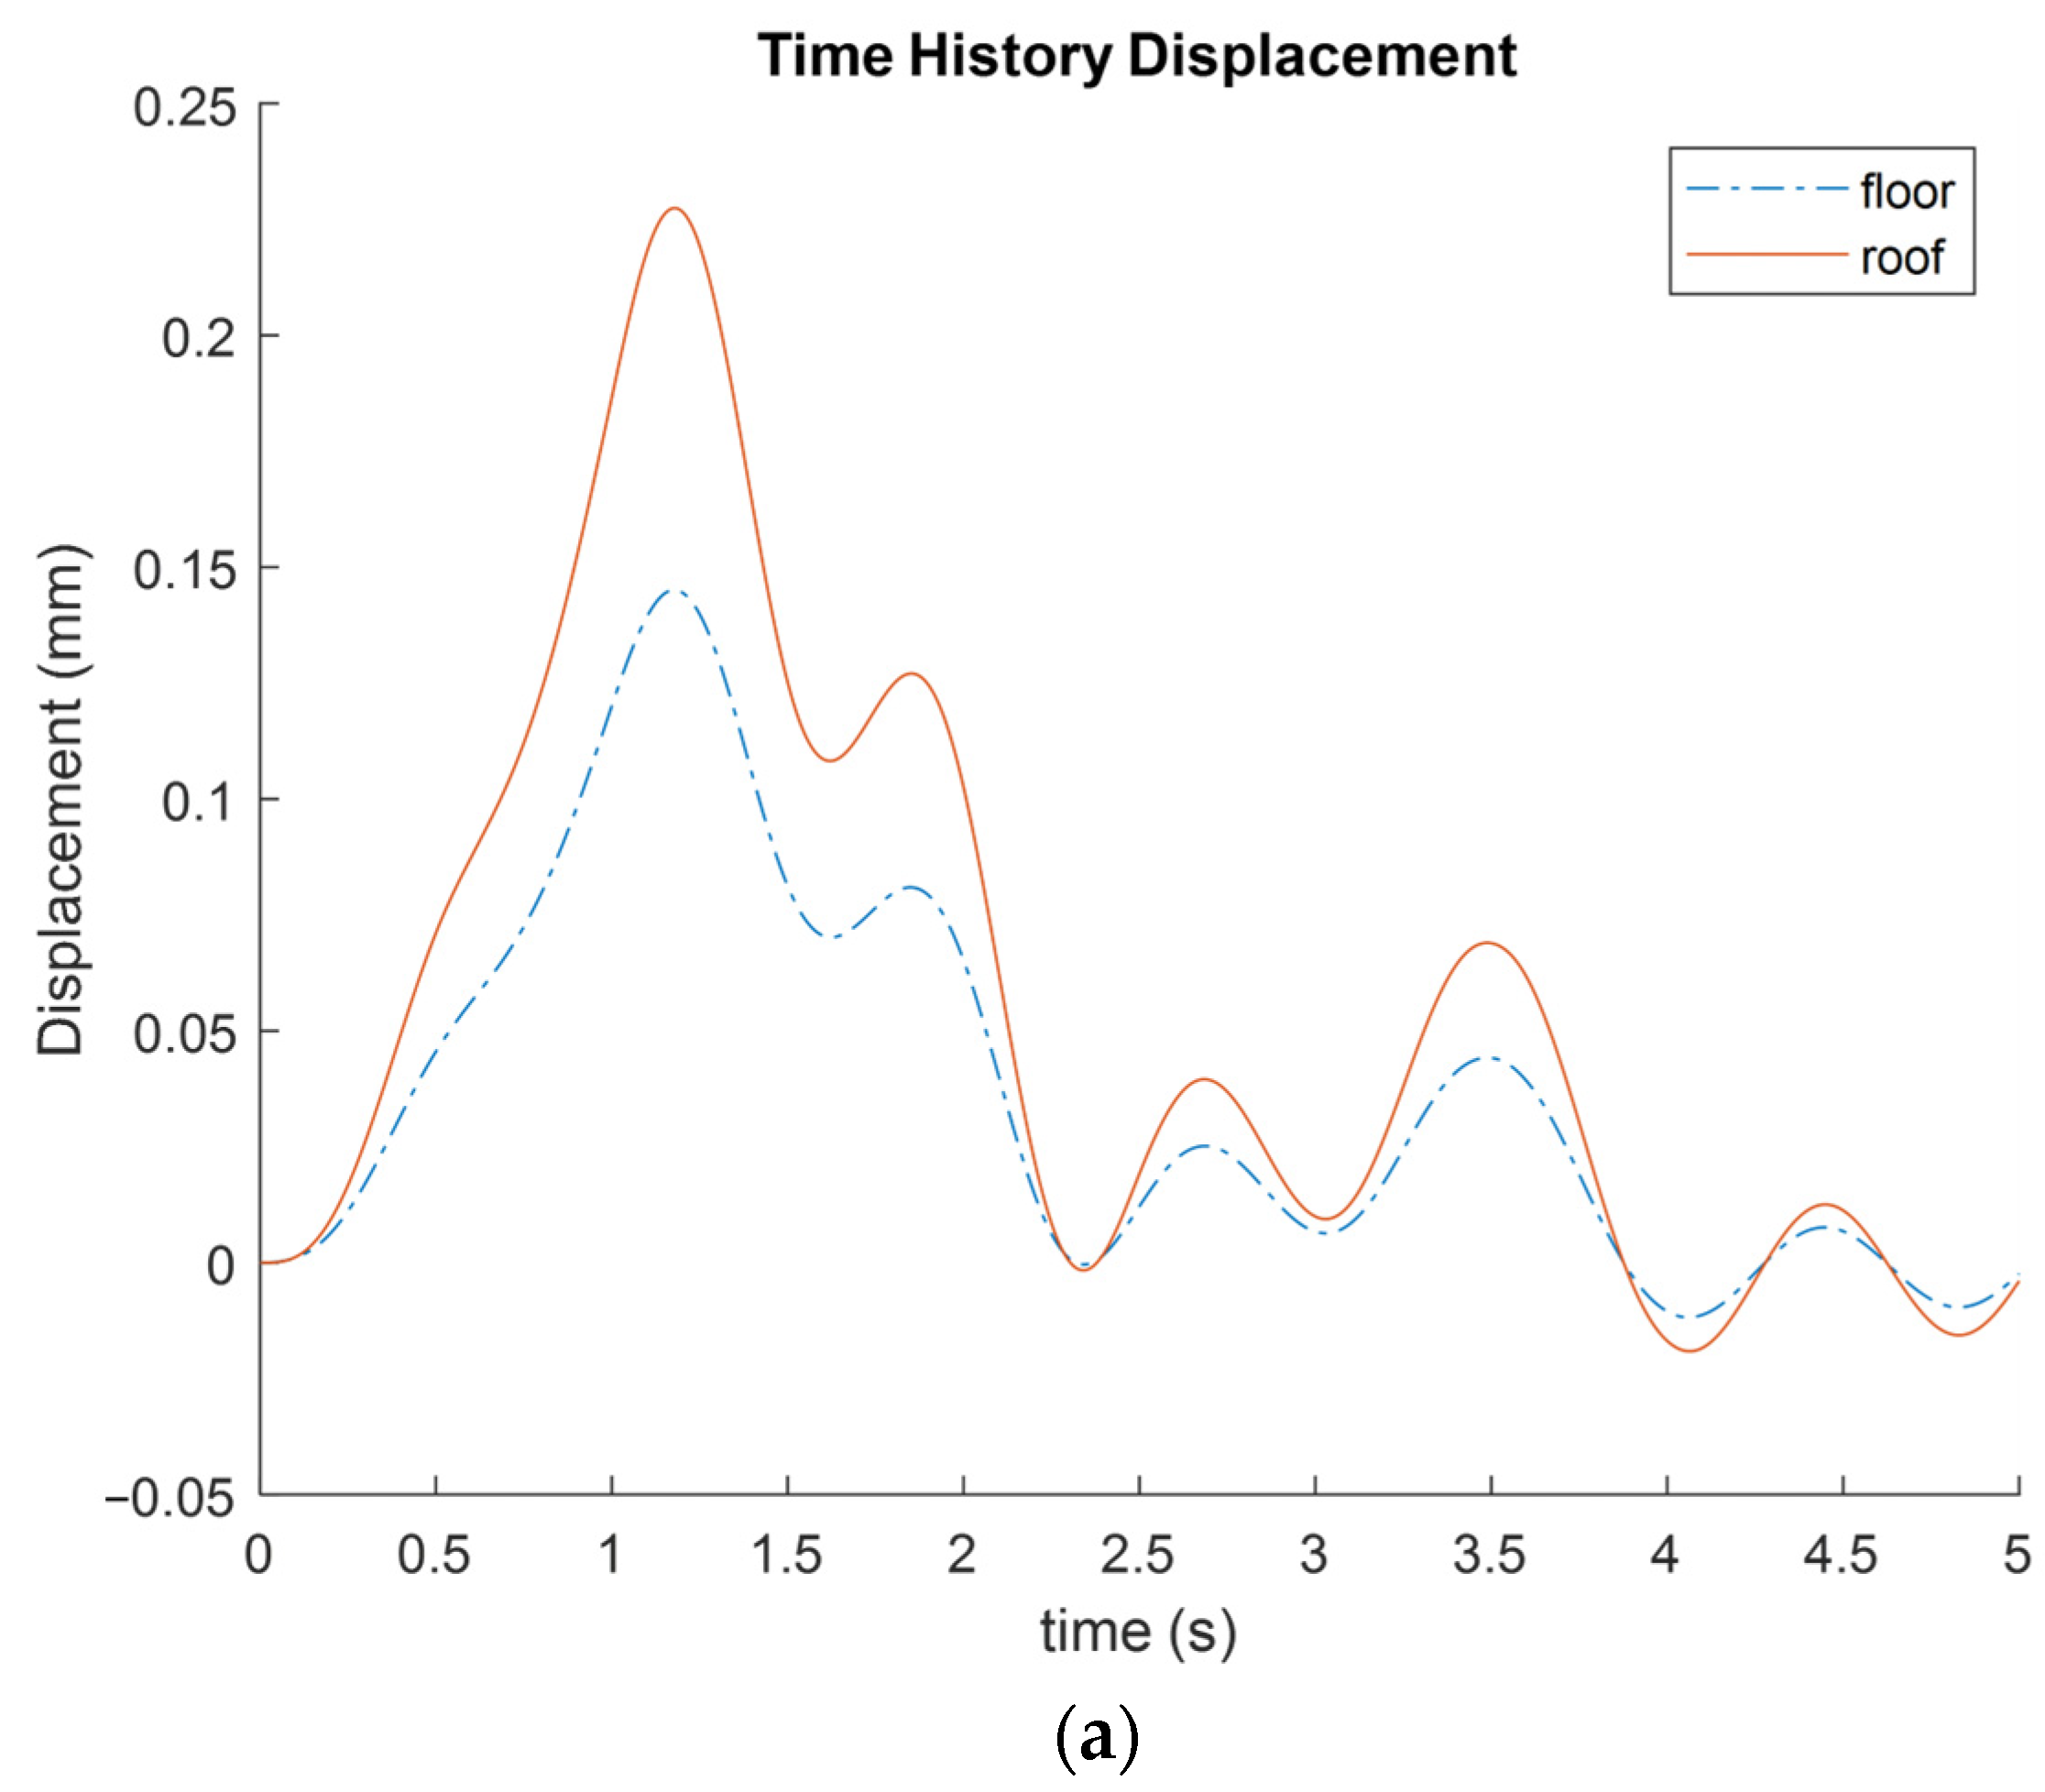
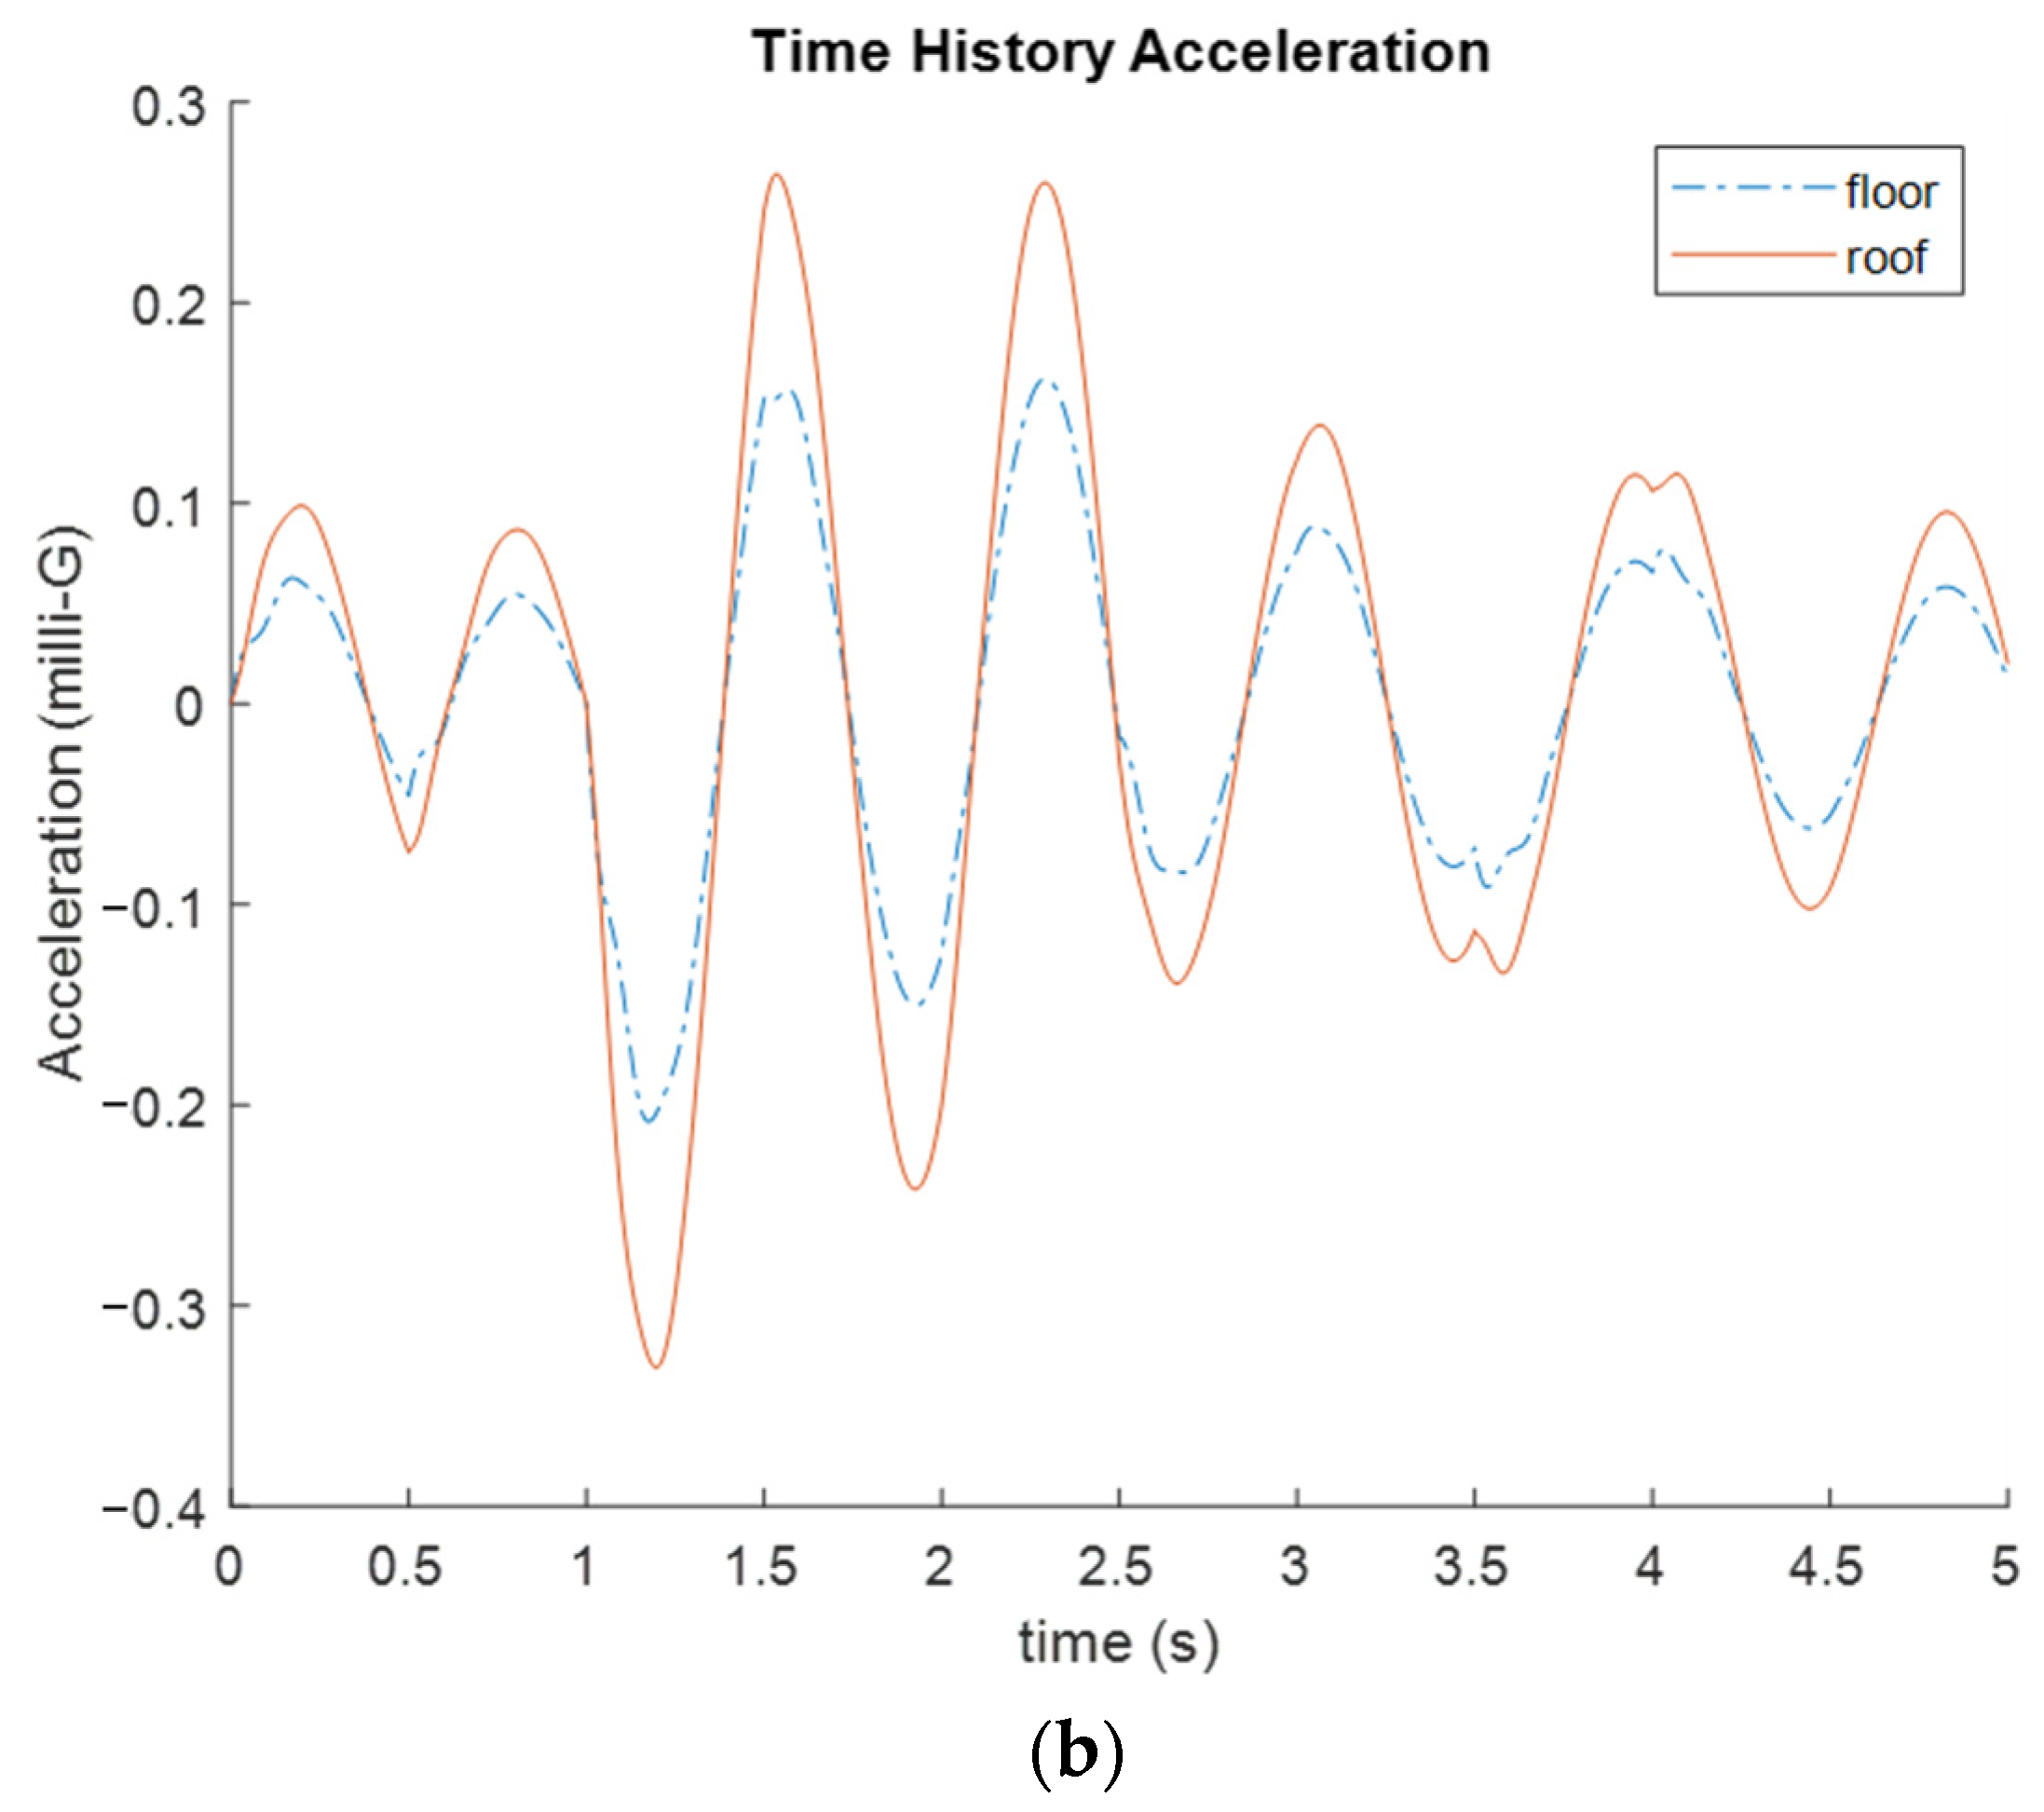
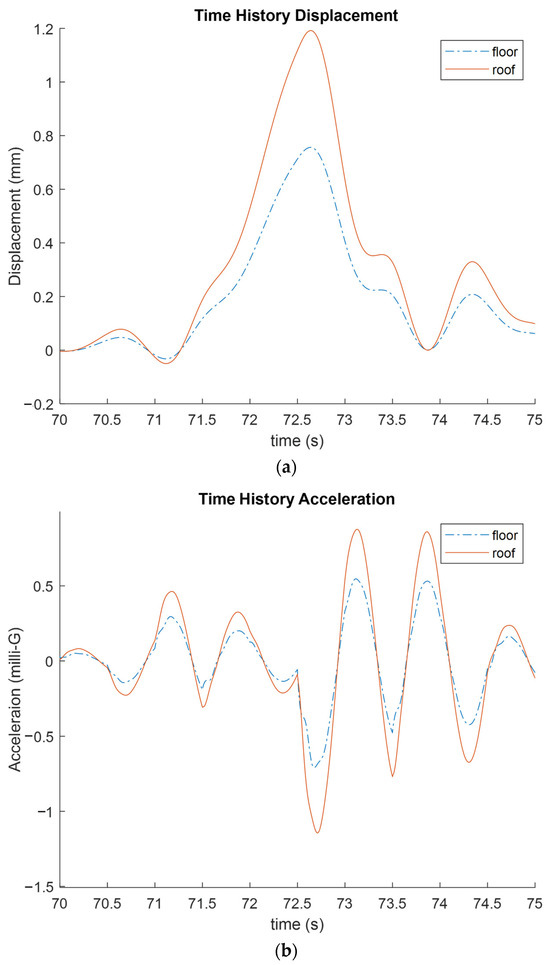
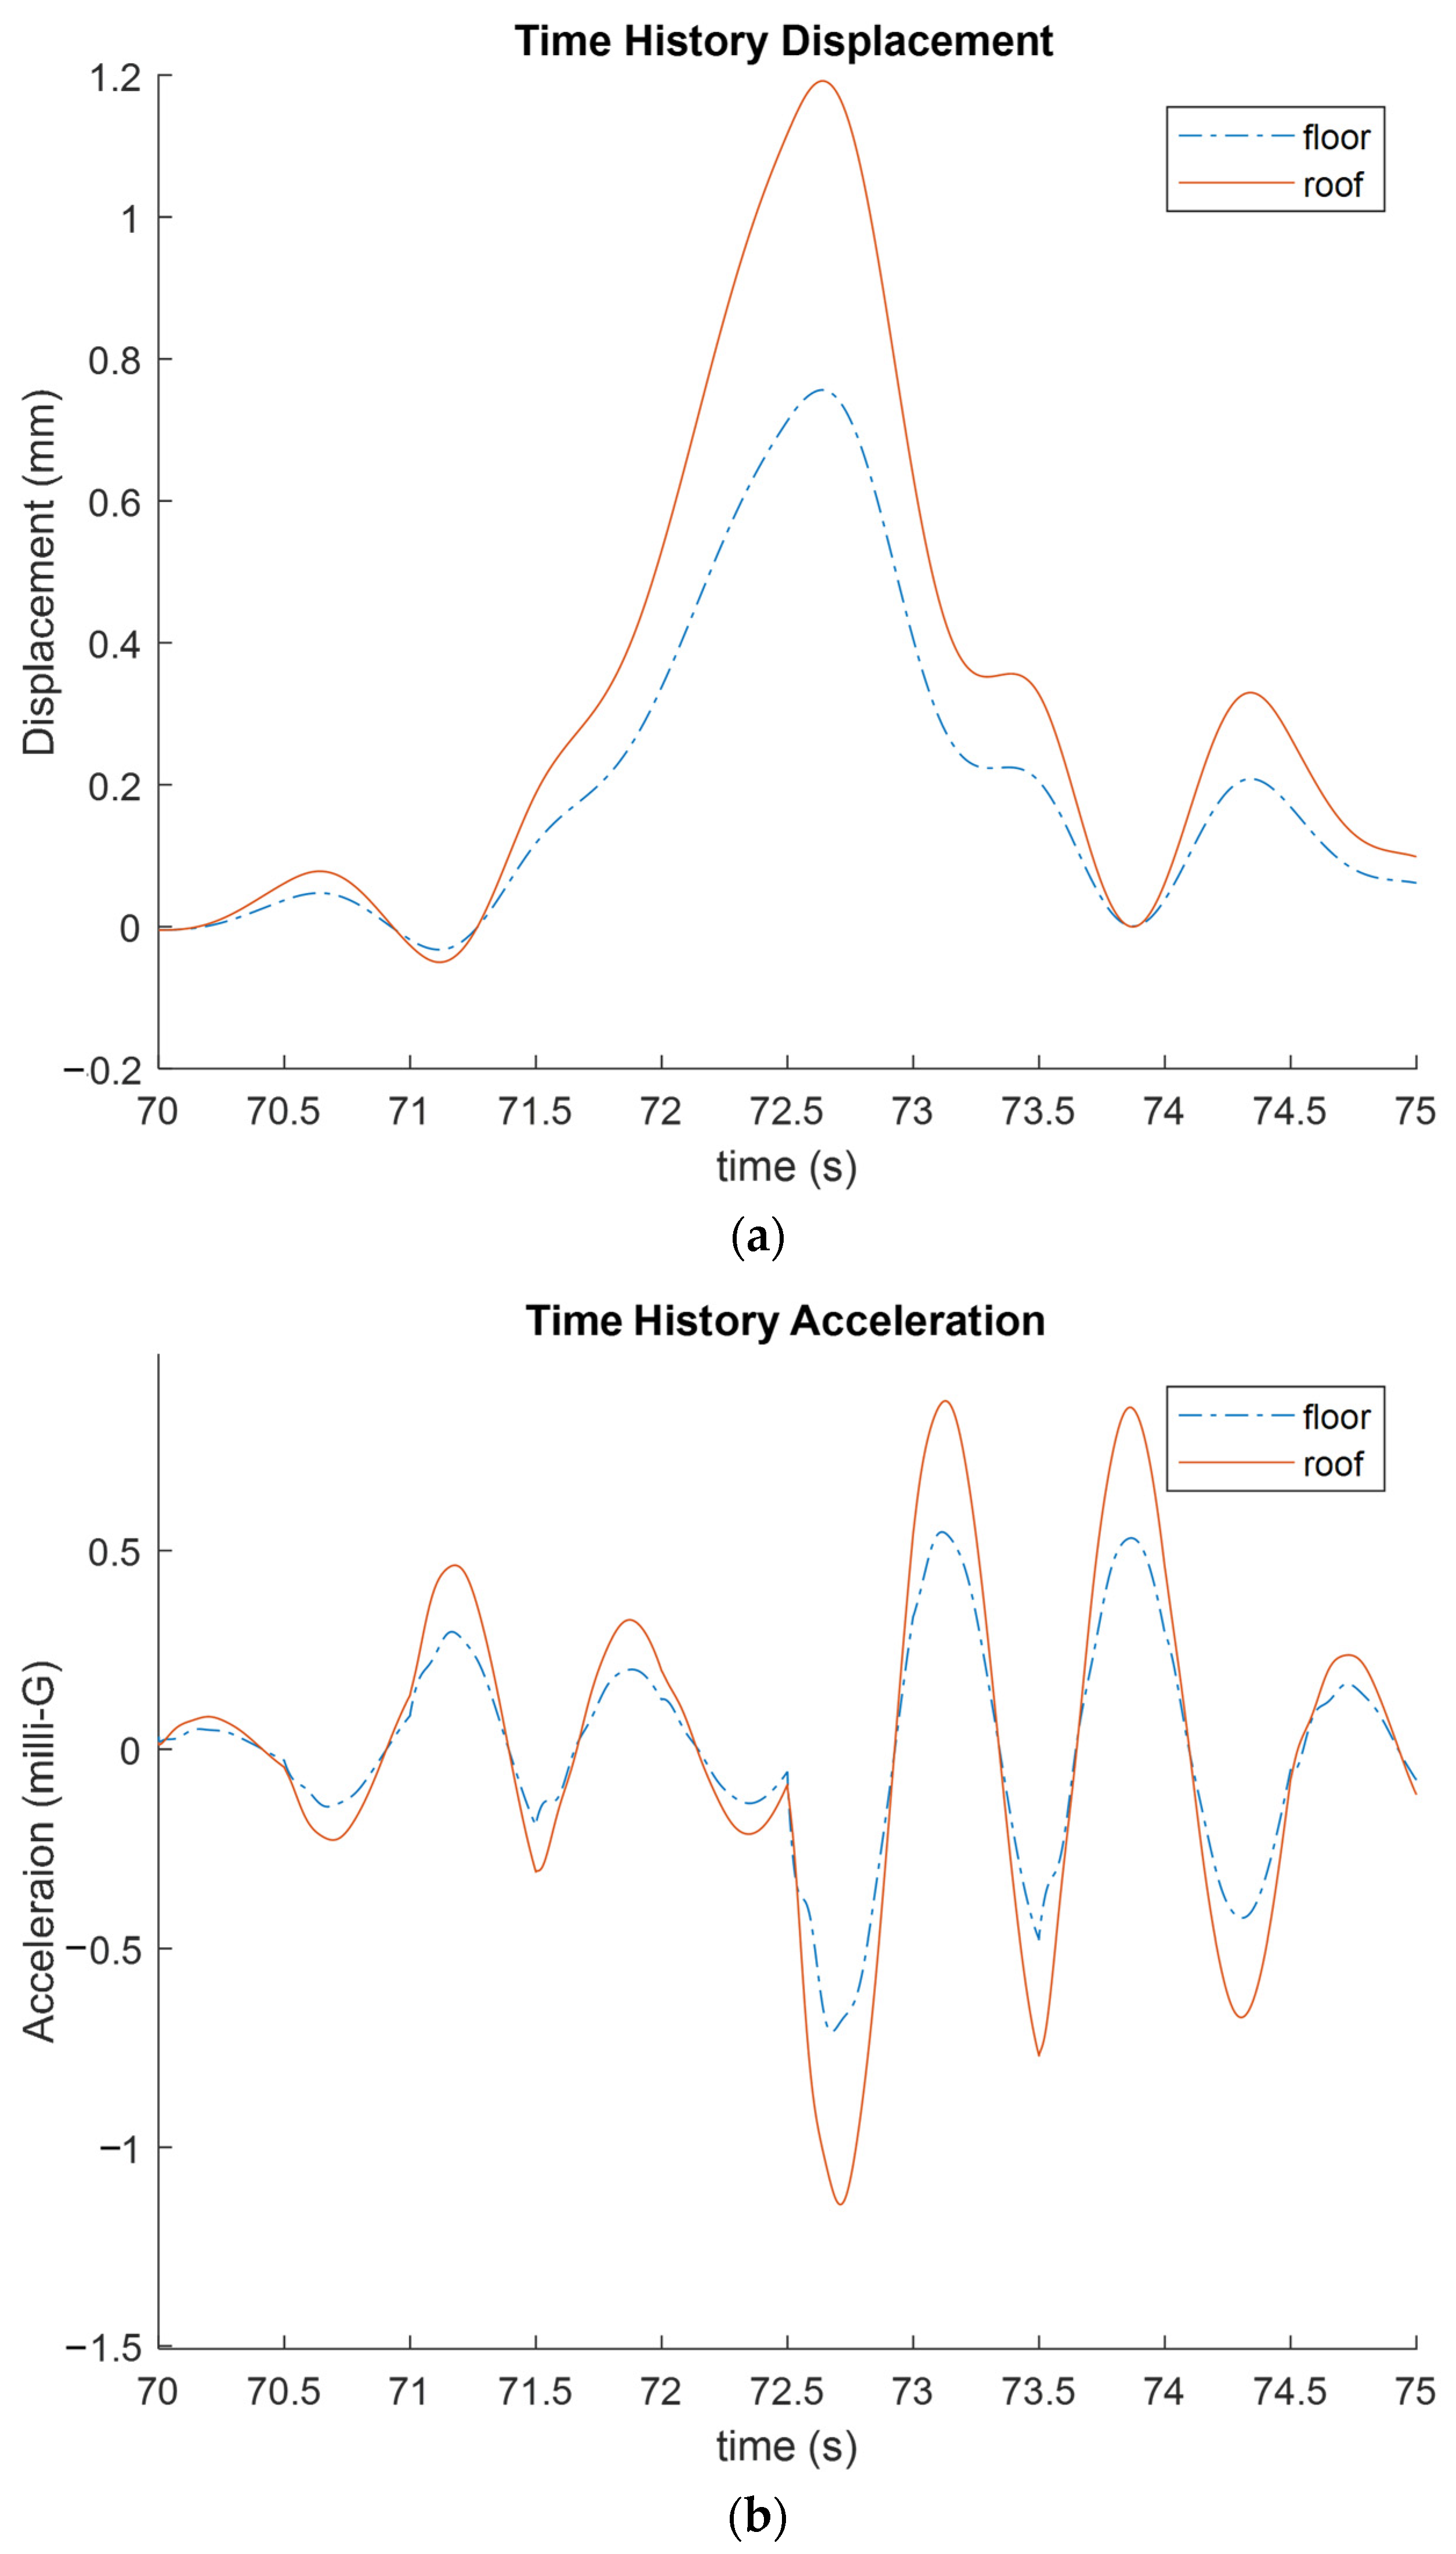
As shown in Figure 7a, the wind load pushed the structure to the positive direction to a maximum of 0.22 mm. The maximum accelerations were calculated separately as 0.16 and 0.26 milli-g for the floor and roof. The displacement appears to experience a peak at 1 to 1.5 s compared with that of the conventional wall structure, which indicates that the identical wind load pattern was successfully applied to the structures. Meanwhile, though the total height is less, the displacements of the PT platform structure were much larger than the conventional CLT shear wall structure, while the peak acceleration was slightly smaller. The result indicated that the lower overall stiffness of the PT platform structure might cause higher displacement and lower acceleration, though the wind loads did not significantly influence both structures.
Figure 7.
Calculated time history result for the PT wall platform structural model: (a) story displacement; (b) story acceleration.
5. Model and Results for CLT Structure in Sequential Scenario
Based on the developed models of the conventional CLT wall structure and PT rocking wall structure, further simulations of structures in sequential seismic–wind scenarios were conducted. The scenarios were applied as a sequence of seismic excitations, the resting of the structure, and then the equivalent fluctuating wind load. The scenario and loading protocols are discussed in Section 3.
5.1. Three-Story Benchmark Structural Model
5.1.1. Wind-Only and Sequential Scenario Comparison
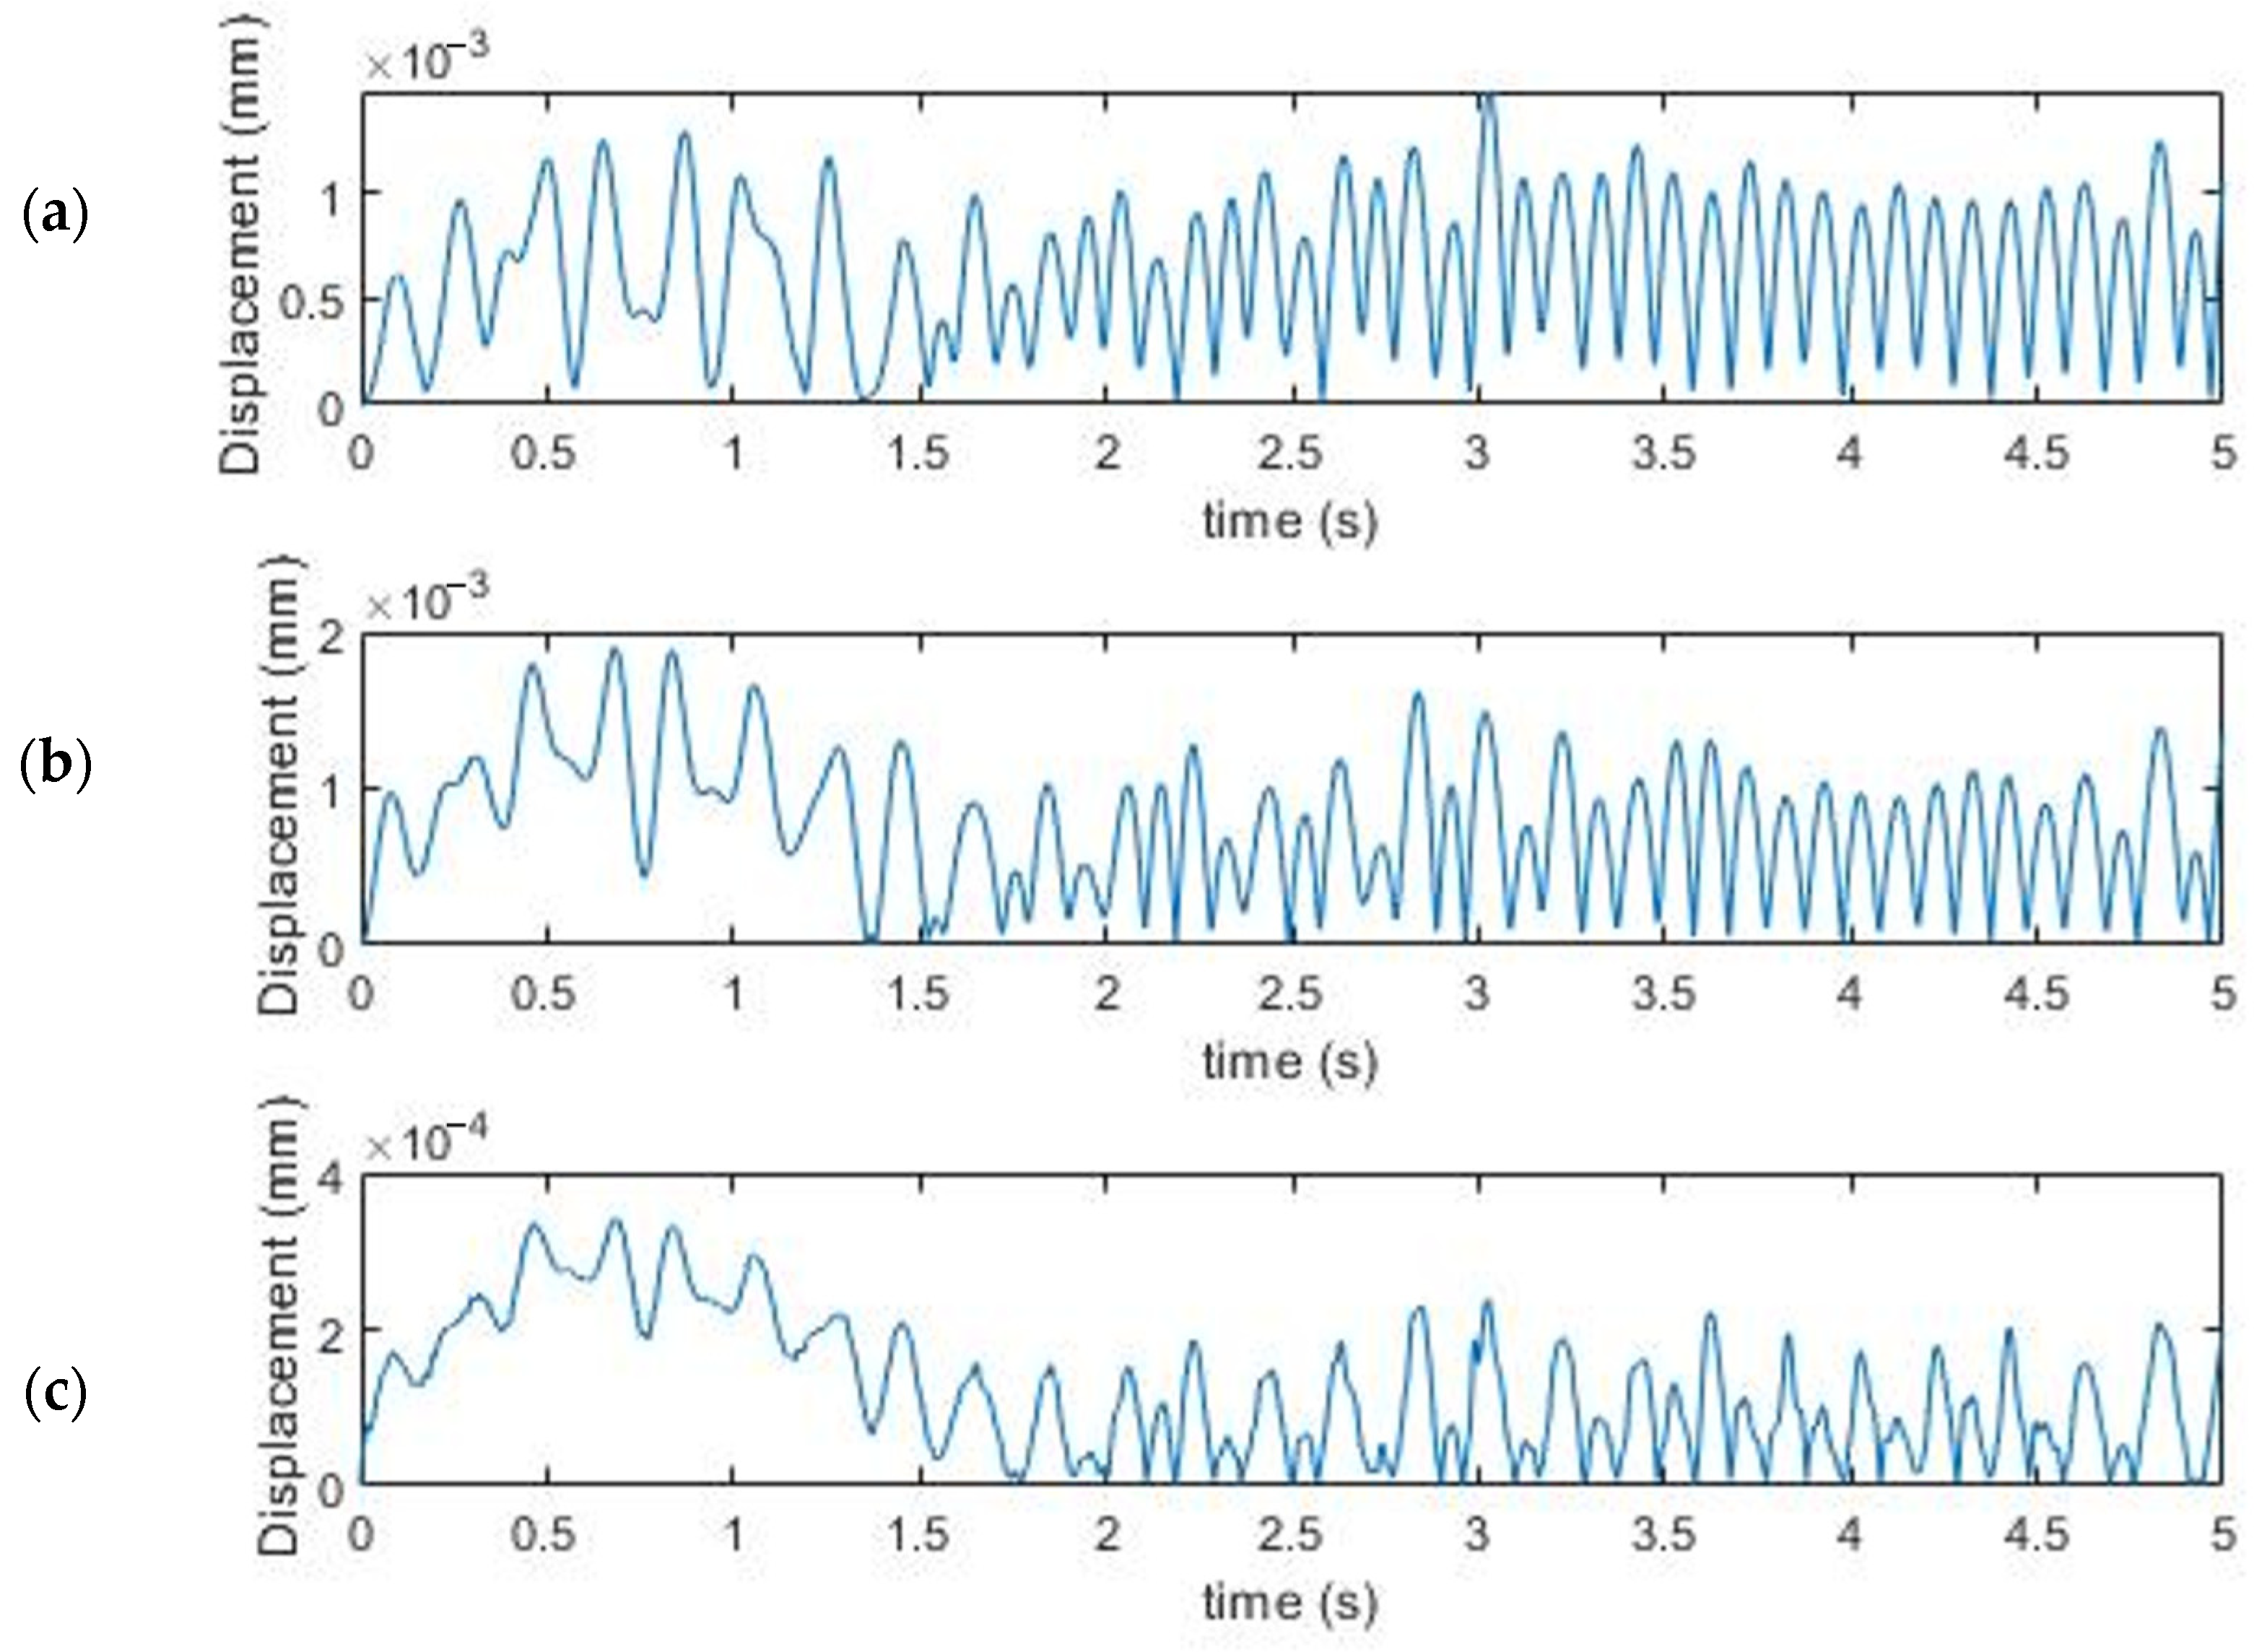
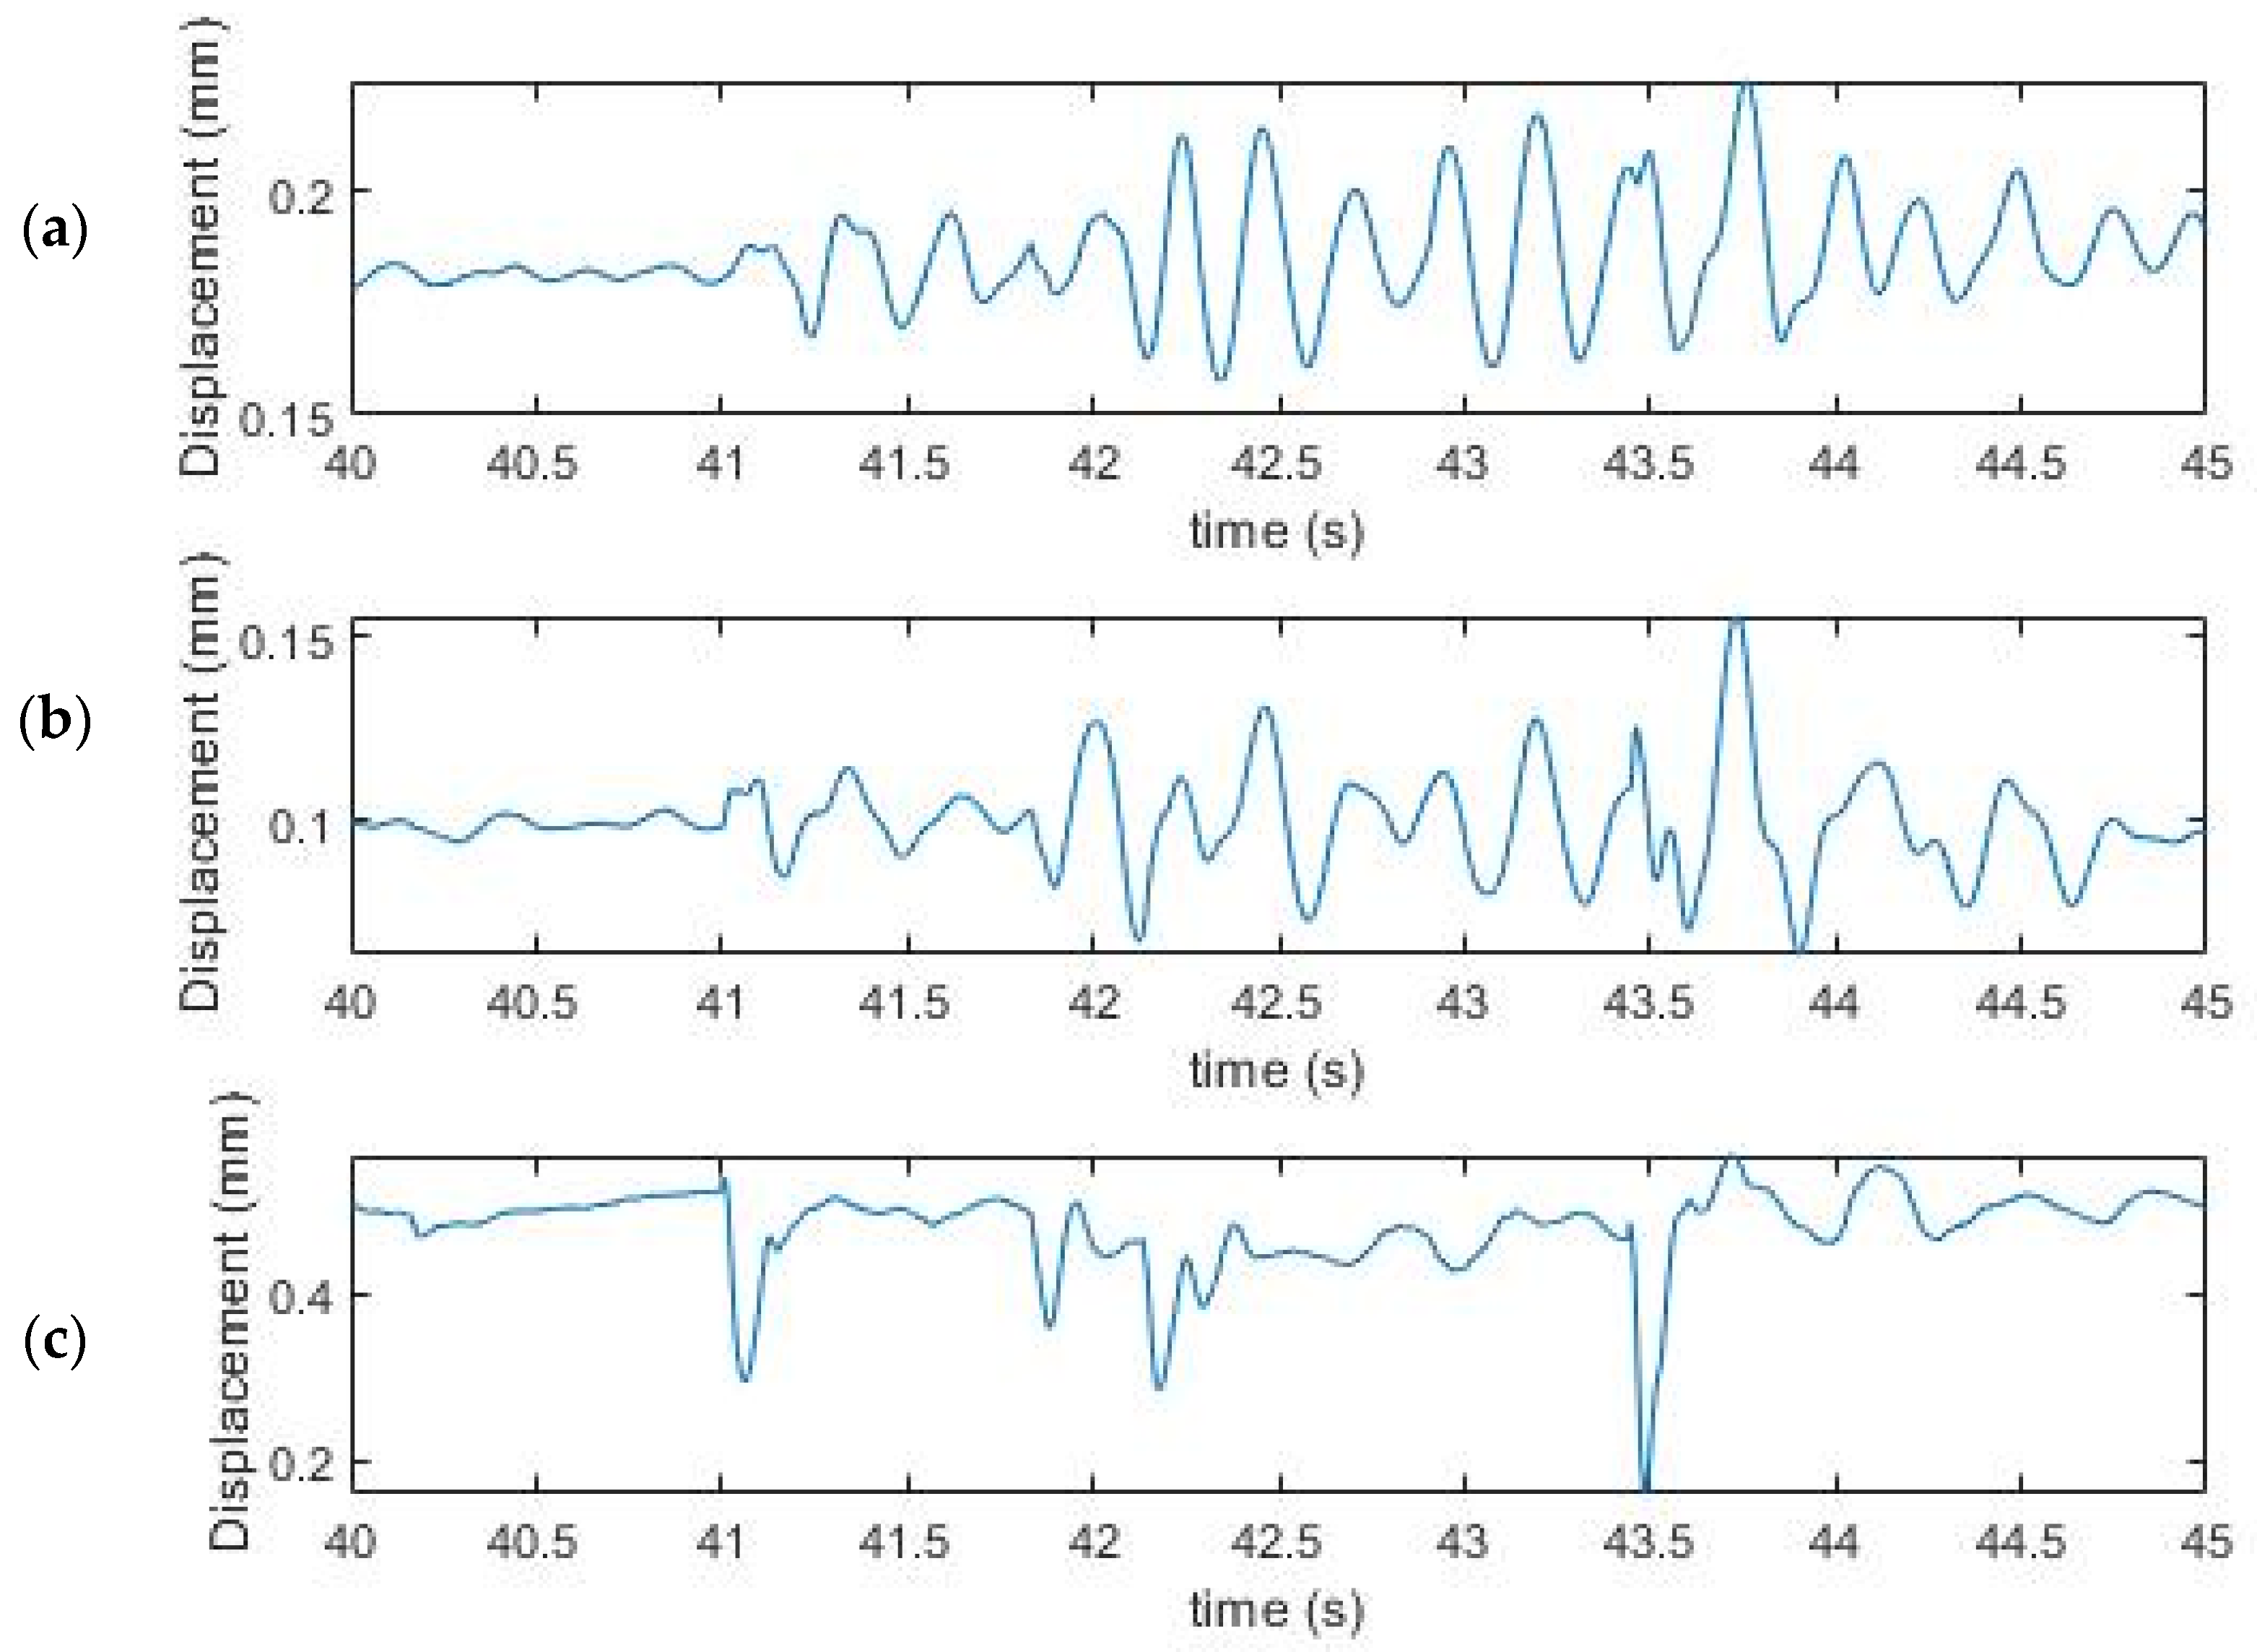
As a first step, in order to demonstrate the difference in the wind-only and sequential seismic–wind scenarios regarding structural behavior, a three-story benchmark structure with a conventional CLT shear wall structure was initially applied with the El Centro seismic record of 0.5 g PGA, which was examined in the previous study [31]. After the seismic event, the status of the structure was left in a resting phase with no external load or acceleration to rest the vibrations. When the structure was fully rested, as discussed in Section 3, 5 s of equivalent fluctuating wind load was applied, which was identical to the wind-only scenario. During the analysis, the nodal displacement and acceleration were recorded for the story displacement and acceleration, as in Section 4. The story displacement of the structure during the wind load period is plotted in Figure 8.
Figure 8.
Story displacement of the three-story building in the wind under a sequential hazard scenario at the (a) roof, (b) second floor, and (c) first floor.
Compared with Figure 6, the vibrating periods were significantly changed. The amplitudes were also magnified. The change indicated that the structure’s stiffness had been damaged in the seismic event. The peak story displacement and acceleration were calculated based on the result history, as shown in Table 3. The peak story acceleration and displacement were separately calculated for the magnification factor between the scenarios with and without the main seismic event, with the same wind load. As shown in Table 4. The peak story acceleration was separately magnified from 11.77 to 70.63 times. The significant peak story acceleration may indicate that the structure was damaged such that its natural frequencies changed in the seismic event. Despite this, the magnification of peak story acceleration and peak story displacement illustrates that the seismic event significantly impacts the structural performance under a wind load.
Table 3.
Earthquake and wind intensity of the considered sequential scenarios.
Table 4.
Comparison of structural responses in sequential and wind-only scenarios.
5.1.2. Seismic Events with Different Intensity for the Three-Story Benchmark Model
In order to investigate the impact of seismic event intensity, the three-story structural model was simulated for the wind response with a variety of main seismic intensities (PGA = 0.19 g to 0.89 g) with the same earthquake record. The scenario case name and peak ground acceleration can be referred to in Section 3. The peak story acceleration and displacement were calculated and listed in Table 5 for each scenario. The magnification did not increase with the increase in peak ground acceleration. Firstly, since the magnification factor was at least 52.55, the structure was deeply damaged by the intensity of the SLE event and all other more intense events. Notably, the SLE referred to the serviceability limit earthquake level of the PT platform, which might be more intense than the designed earthquake level for a three-story conventional CLT wall structure. The damaged structure has a series of changed natural periods, along with the complicated fluctuating wind, which contains multiple frequencies. The structure response was, therefore, impacted as a nonlinear pattern to the PGA. The results demonstrated that the chosen seismic events would damage the target structure’s wind resistance.
Table 5.
Wind-excited peak story acceleration and displacement of the 3-story conventional CLT shear wall structure after different seismic events.
Modal analysis was conducted with the structural models after seismic events to perform a more specific check of the damaged structure. The frequencies of the first six primary vibration modes of each damaged structure are listed in Table 6. The natural frequencies were directly influenced by the overall stiffness and stiffness distribution after the damage in the seismic event, considering the structure’s mass was consistent. Though not entirely linear, the magnified acceleration and displacement listed in Table 5 can be positively correlated to the natural frequencies for each case. Pearson’s correlation coefficient, r, between the peak story displacement and average frequency of the first six modes was calculated as 0.32, while for the peak story acceleration, it was calculated as 0.77. The coefficients indicated that the peak story displacement has a medium correlation with the natural frequencies of the damaged structure, while the correlation between the peak story acceleration and the natural frequencies was strong.
Table 6.
Natural frequencies (Hz) of the primary modes of the damaged structure after each seismic event.
The stronger correlation (e.g., r ≈ 0.77) suggests that the cases with larger post-earthquake stiffness reduction (reflected by a larger frequency drop) also tend to exhibit larger wind-response amplification under the same wind excitation, consistent with a damage-induced shift in dynamic characteristics. The weaker correlation (e.g., r ≈ 0.32) likely reflects the combined effects of nonlinear hysteresis and very small wind-only baselines, so the correlation should be viewed as a descriptive indicator rather than evidence of causality.
5.1.3. Wind Event with Different Wind Load Factor for the Three-Story Benchmark Model
When keeping the seismic event consistent with the DBE level, the impact of wind intensity was investigated by applying an additional wind load factor to the fluctuating wind load. The magnification was calculated by comparing the structural response under each sequential scenario to that of the original wind-only scenario. The calculated magnification of the peak story acceleration and the peak story displacement are listed in Table 7. Similar to Section 5.1.2, the magnification appears to be nonlinear with the wind load factor. The peak story acceleration and displacement magnification at the top story, respectively, have Pearson’s coefficients of 0.018 and 0.32, indicating that the structure was nonlinear after the seismic event. The peak story acceleration and displacement were not increased with the increase in wind load. Considering that the damaged structure conditions were the same in the different wind load intensities, the results illustrated that the structure experienced nonlinear elasticity during the wind event. The damage caused by the seismic event had reduced the elastic range of the structure such that it was unable to maintain linear elastic behavior during the wind load.
Table 7.
Wind-excited peak story acceleration and displacement of the 3-story conventional CLT shear wall structure after DBE seismic event with different wind load intensities.
5.2. PT Platform Model
5.2.1. Result Comparison Between Wind-Only and Sequential Scenarios
Like the three-story conventional shear wall structural model, the PT wall platform structure was first applied with the El Centro seismic record of 0.5 g PGA to show the overall difference in the wind-only and sequential seismic–wind scenario in the structural behavior. Noticeably, the natural period of the PT platform structure was three times that of the three-story conventional structure. Therefore, the resting time was three times that of the three-story structural model to ensure that the vibration did not continue in the wind event. After resting, 5 s of the equivalent fluctuating wind load was identical to the wind-only scenario and the conventional shear wall structural model. The story displacement and acceleration time history in the wind event are plotted separately in Figure 9a,b. The story displacement and acceleration were calculated based on the time history nodal displacement and acceleration, as in Section 4.
Figure 9.
Time history results during the wind event: (a) story displacement and (b) story acceleration.
As shown in Figure 9, compared with the wind-only scenario result, the peak of displacement and the sudden acceleration change were delayed for about 1 s. The delay might be the reason for the structural damage caused during the seismic event. The peak displacement and acceleration of the structure were calculated and are listed in Table 7. After the El Centro seismic event, the peak story acceleration was magnified by 3.37 and 3.32 times. The peak story displacement was magnified by 4.67 and 4.51 times. The damage to the PT platform structure during the seismic event caused an increase in the peak story acceleration and peak story displacement.
5.2.2. Seismic Events with Different Intensities for the PT Platform Model
When applied with the increasing peak ground acceleration of the same earthquake record (Northridge), the peak acceleration and displacement magnification were calculated and compared with the wind-only scenario, as listed in Table 8. Both the acceleration and displacement were magnified, while the factor was relatively stable, which was not directly related to the intensity of the seismic event. The phenomenon illustrates that the structure was still linear even after the 1.2MCE seismic event. In the meantime, the different seismic events left similar damage, while the structure damaged after the SLE seismic event might have caused damage to the structure such that it changed to a natural frequency closer to the equivalent fluctuating wind load.
Table 8.
Peak story acceleration and displacement comparison between the sequential scenario and the wind-only scenario.
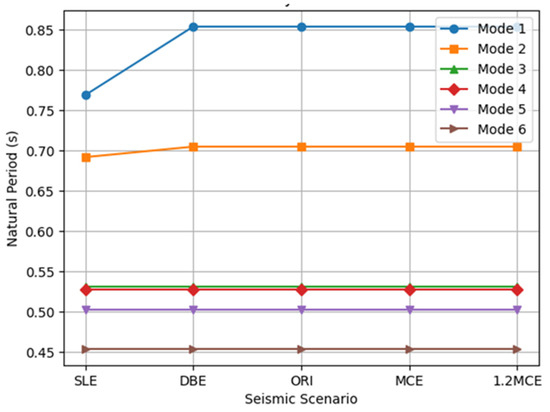
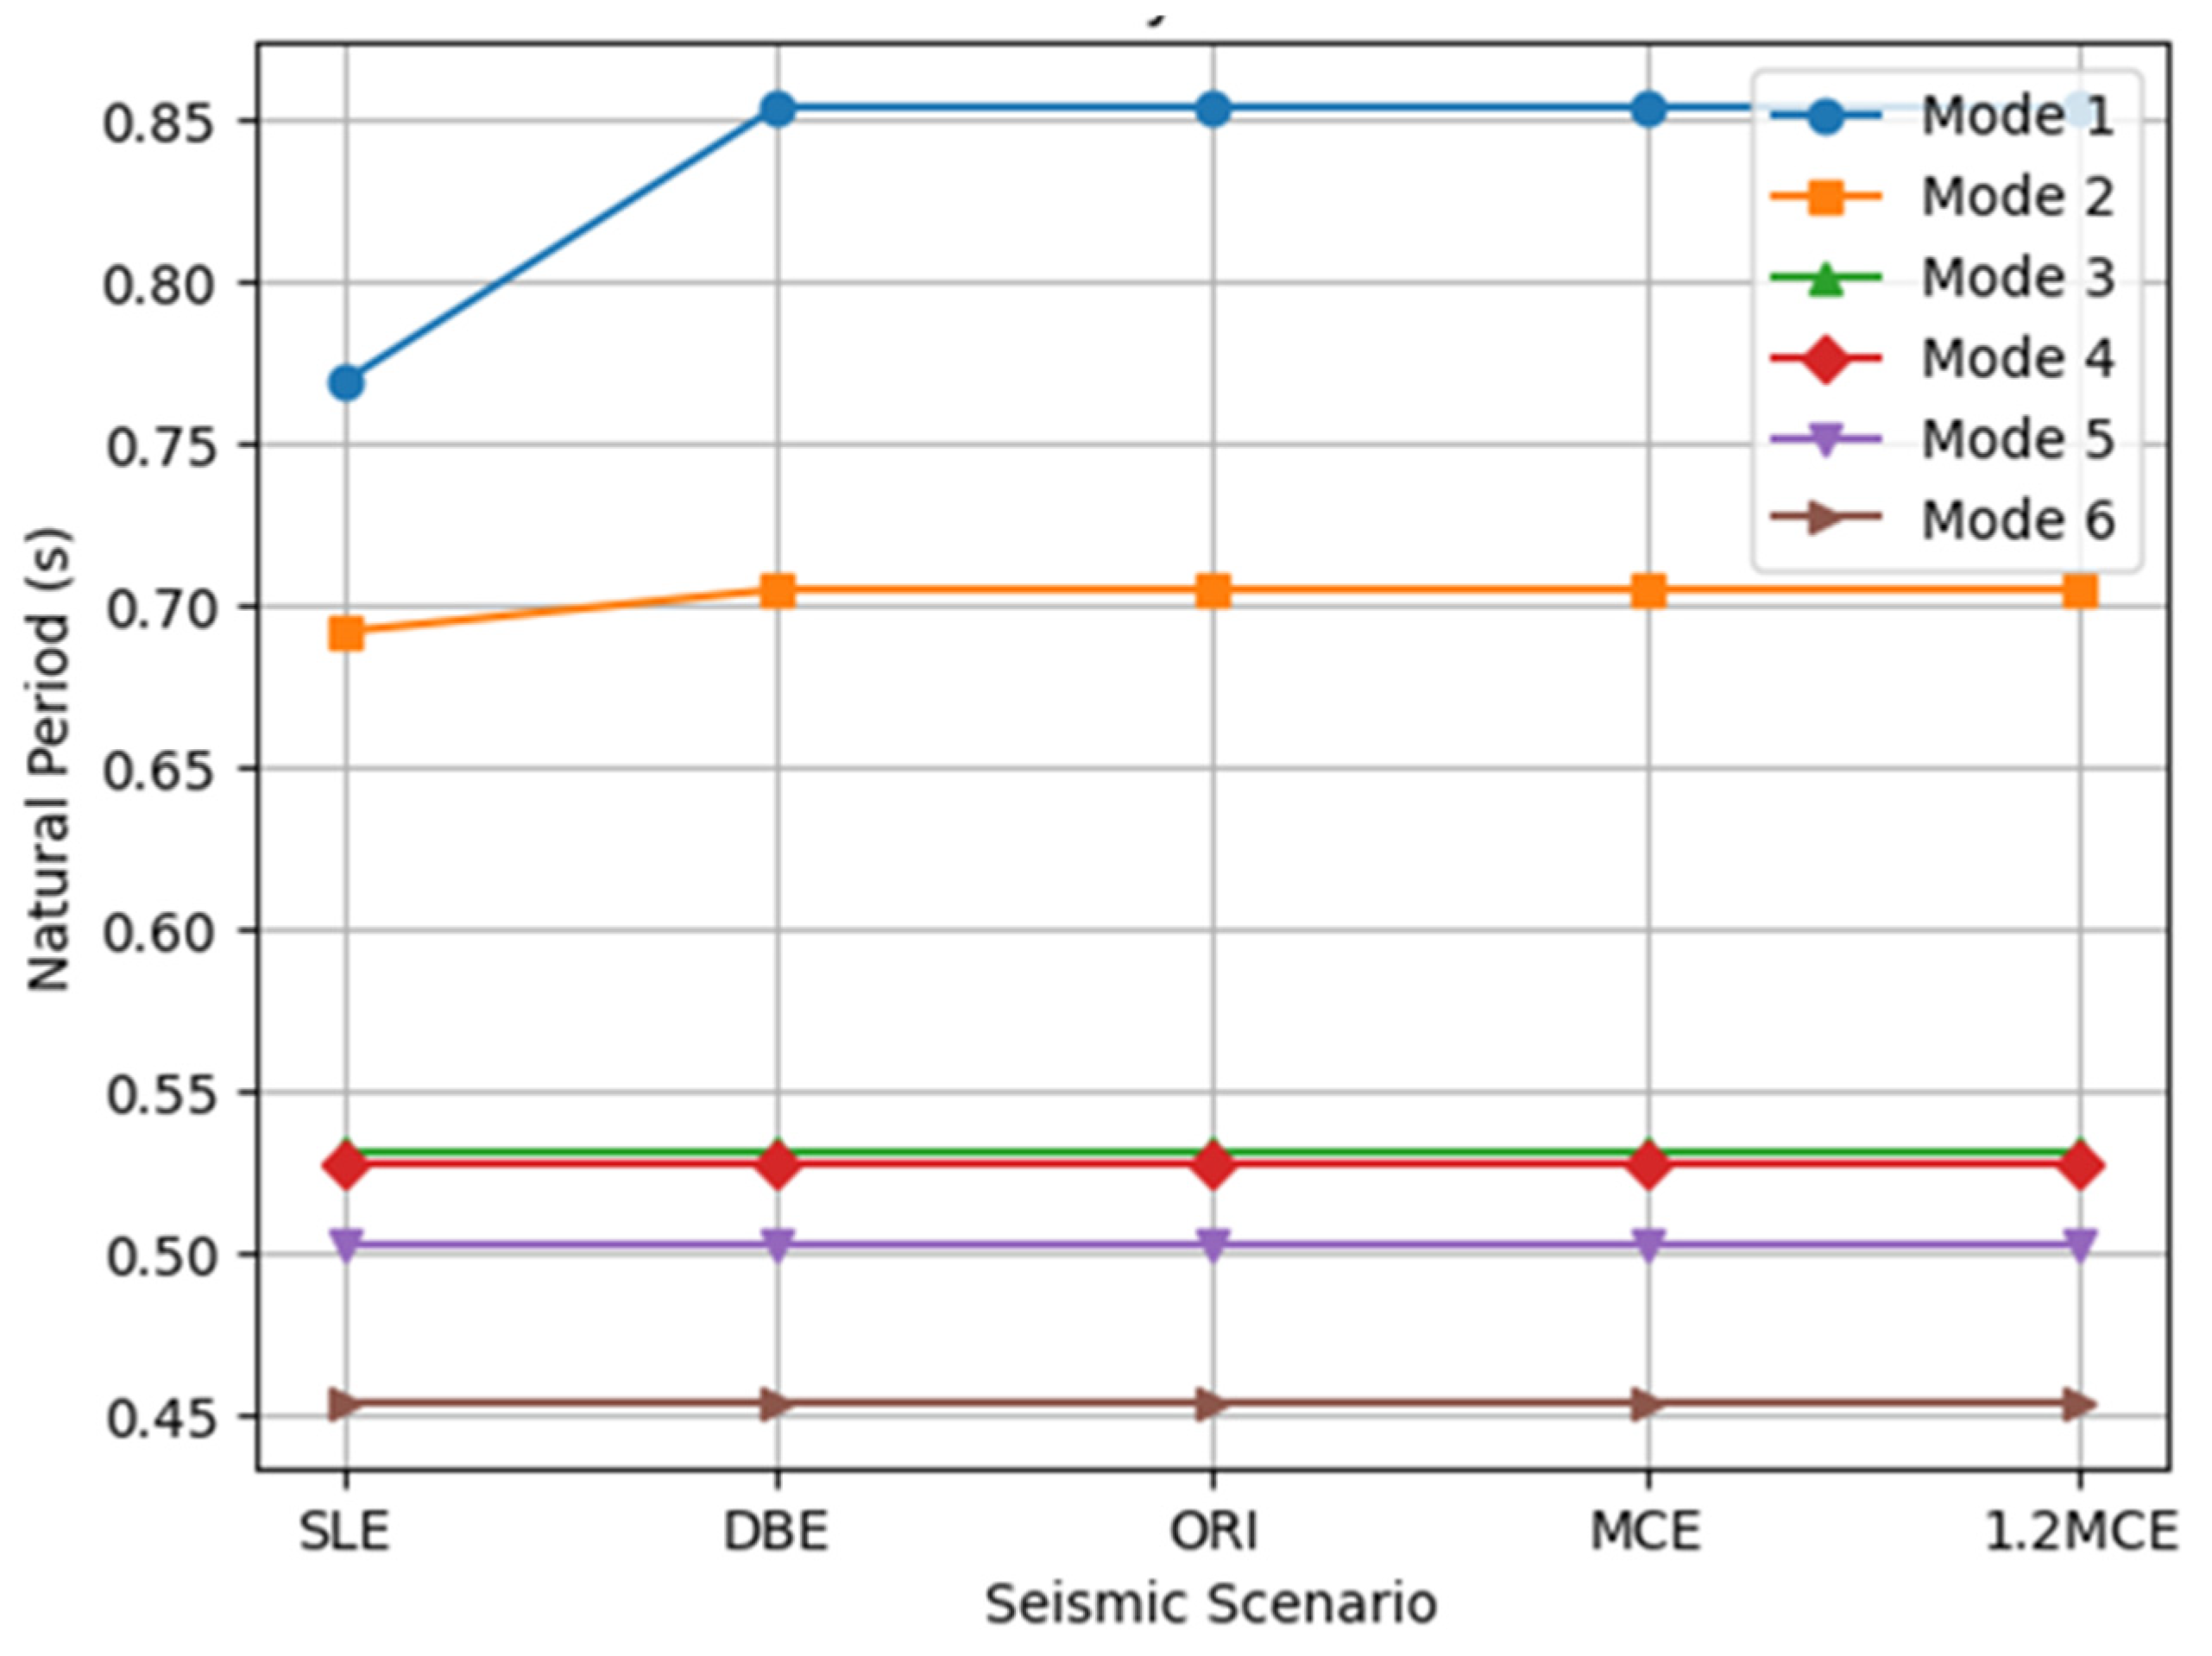
After each seismic event, modal analyses were conducted on the structural model to check on the potential connection to the behavior of the structure. The resulting natural frequencies of the six primary modes of the structural model with each seismic event are listed in Figure 10. The natural periods of the first two modes of the structure in the SLE scenario were different from those of other cases. Combined with Table 9, the differences found in the natural period of support showed that the impact of the seismic event on the performance of the damaged structure was not directly proportional to the event intensity. The resulting natural period of the damaged structure also reflected the overall structural performance in the following event. The difference in the resulting accelerations indicated that some other differences exist that did not influence the primary vibration modes. The seismic event that was not SLE might have caused the PT wall structural model to be linearly elastic or perfectly plastic, resulting in the same stiffness distribution after the different seismic events and the same natural periods for the primary vibration modes.
Figure 10.
Natural periods (s) of the example structure’s primary modes after the seismic event in each scenario.
Table 9.
Magnification of peak story acceleration and displacement of sequential scenarios with different seismic intensities.
5.2.3. Wind Event with Different Wind Load Factor for the PT Platform Model
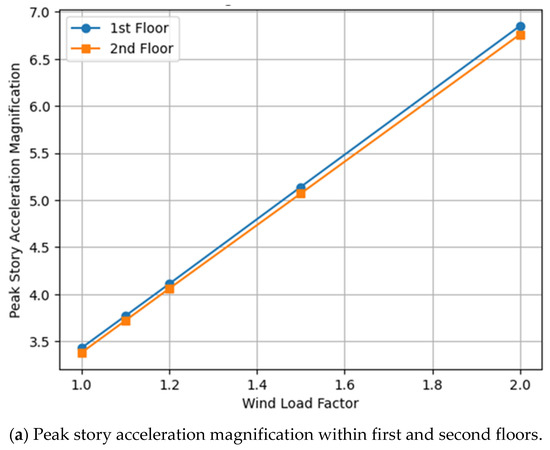
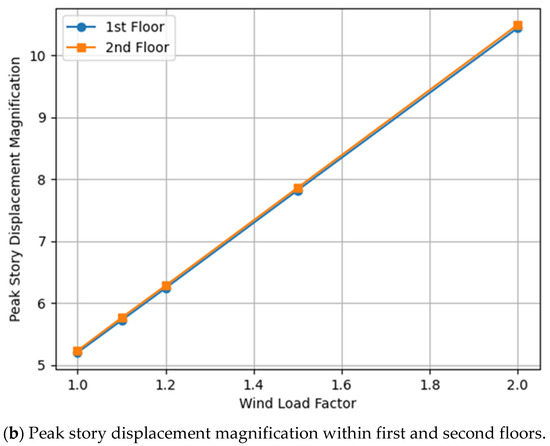
Like the three-story conventional CLT wall building structure, the PT wall platform structural model was applied with the DBE seismic event and then separately applied with 1.1 to 2.0 times the equivalent fluctuating wind load. The magnification of the peak story acceleration and displacement was calculated compared with the results of the original wind-only scenarios. The magnification of both the peak story acceleration and peak story displacement was linear to the wind load factor, indicating that the structure remained linear during the wind load after the seismic event. The calculated results are listed in Figure 11.
Figure 11.
Peak story acceleration and displacement magnification of PT platform structural model in sequential scenarios with different wind load factors.
5.3. Comparison Between the Conventional CLT Wall and PT CLT Wall
After the seismic event, the peak story displacement and acceleration were significantly magnified for both structures. With the same seismic event, El Centro at PGA = 0.5 g, the same wind profile, and an identical fluctuating wind load factor, the conventional CLT structure model had 70.66 times the magnification in acceleration and 1440 times the displacement, while the PT CLT wall structure performed better, with 3.37- and 4.61-times magnification in peak story acceleration and displacement, respectively. The magnification values of the peak story acceleration and displacement of the conventional CLT wall structure were, respectively, 20.96- and 312.36-times that of the PT CLT wall structural model. Though the height and different wind pressure distributions may cause different wind loads, the conventional CLT structure’s performance was impacted by the earthquake at a more severe level under the same scenario.
Although the displacement magnification appears extremely large, it should be interpreted together with the absolute response level: the wind-only peak top-story displacement is extremely small (3.40 × 10⁻⁴ mm), whereas the post-earthquake sequential peak reaches 5.64 × 10⁻¹ mm, so the ratio is dominated by a very small denominator. More importantly, the top-story peak acceleration increases markedly from 1.72 milli-g (wind-only) to 121.50 milli-g (sequential), which is directly relevant to serviceability/occupant comfort considerations. Mechanistically, seismic cycling degrades connection stiffness and increases hysteretic nonlinearity (pinching), leading to reduced post-event stiffness and shifted modal properties; this can increase susceptibility to dynamic amplification under the applied fluctuating wind excitation. No PSD-based resonance or numerical sensitivity study is performed here; thus, any resonance-like interpretation is qualitative within the stated wind-load idealizations.
Though the structure was designed based on a different level of earthquake, the difference in the performance indicated that the chosen conventional CLT shear wall structure was damaged in the applied seismic excitations (from PGA = 0.18 g), which reduced the linear elastic range of the structure. As shown in Table 9, for the PT wall structural model, the increase in peak ground acceleration generated similar peak story acceleration and displacement during the sequential wind load. The results indicate that the PT example structure maintained a comparatively near-linear condition after the seismic event. In contrast, as shown in Table 5, the significant acceleration showed that the conventional CLT wall structure might not be sufficient in the following wind event. For both structures, the peak story acceleration was found to have a strong correlation with the natural frequencies of the damaged structures rather than the seismic event intensity.
When applied with the same seismic event (DBE) and followed by increasing wind load, the wind responses of the conventional CLT wall structure model once again illustrated that the structure was demonstrating nonlinear responses. The PT CLT wall structure provided a magnification of peak story acceleration and displacement linear to the wind load factor, which indicated that the structure was limited to nonlinearity during the wind event after the earthquake. The sequential seismic and wind event was illustrated as hazardous for CLT wall structures, especially for the conventional CLT wall structure. Compared with the conventional CLT wall structure, the PT CLT wall structure showed much more reliable performance in the sequential seismic–wind multi-hazard scenario.
In engineering practice, conventional CLT shear wall systems are typically designed following established building code provisions (e.g., ASCE 7 seismic demands with wood shear wall detailing per SDPWS/AWC guidance), whereas PT rocking mass-timber wall systems are still not largely implemented, and only through project-specific performance-based procedures and emerging design guidance. Therefore, the comparatively stable post-event wind response observed for the PT rocking wall in this study should be interpreted as an indicative case-study outcome under the adopted modeling assumptions, rather than as a generalized code-level claim.
From a resilience perspective, self-centering rocking systems are intended to limit residual drift and concentrate damage in replaceable energy-dissipation components rather than in primary wall panels/connections, which can potentially reduce post-event repair scope and downtime. A quantitative maintenance/repair-cost model is beyond the scope of this study; therefore, we provide this implication as a qualitative discussion and list detailed repair-cost quantification as future work.
The analyses reported herein are deterministic case studies; statistical confidence intervals are not provided because record-to-record variability and parameter uncertainty are not sampled in the current scope. Accordingly, magnification factors and correlation coefficients are reported as descriptive indicators to support mechanism discussion and comparative assessment between systems, rather than as statistically converged metrics.
5.4. Limitations and Applicability
This study is presented as a deterministic demonstration framework to compare wind-only and post-earthquake wind responses of CLT wall systems using previously calibrated nonlinear wall models. The results should be interpreted within the following limitations.
The fluctuating wind action is represented by an equivalent load derived from simulated wind-speed time histories and pressure coefficients. This approach does not explicitly model aeroelastic/structure–wind interaction or synchronized multi-point pressure fields and their spatial correlations. In addition, due to software implementation constraints, a single-wind-load-factor time series is applied uniformly along height. A short wind-duration segment is used to reduce computational cost; therefore, the reported responses are intended for relative comparison under identical excitation rather than long-duration storm statistics or exceedance-probability assessment.
The sequential scenarios consider a limited set of ground motions and primarily uniaxial excitation; record-to-record variability (including near-fault pulse-like motions), bidirectional/vertical components, and a broader suite of archetypes are not covered. Record-to-record variability is not addressed in this study; therefore, the findings should be interpreted as case-study observations under the selected ground motions and modeling assumptions. Extending the framework to larger suites of records/archetypes (with uncertainty quantification) is a key direction for future work. The resting time between hazards is selected to allow transient vibrations to decay (based on typical damping assumptions), but this remains a modeling choice rather than an observed inter-event interval.
The structural models adopt idealizations such as rigid diaphragm behavior and simplified representations of building envelopes for wind pressure application in the platform example. Connection behavior is represented through calibrated hysteretic spring models; however, detailed local failure modes and parameter uncertainty are not explicitly quantified. No probabilistic fragility/reliability assessment or formal confidence intervals are provided; the reported magnification factors and correlation trends are, therefore, descriptive indicators for the examined cases. The present study does not compute explicit damage indices, residual drift, or energy-based damage measures; therefore, “damage” is inferred indirectly through changes in response demand and amplification under the sequential protocol. Accordingly, descriptions such as “linear elastic” should be interpreted as indicating comparatively modest nonlinear demand in the examined cases, rather than as a definitive performance-based damage-state classification. Nonstructural infill/partition participation is not explicitly modeled. Such components may contribute to stiffness/damping under service winds and may degrade after seismic excitation, potentially altering baseline wind response and post-event amplification trends. The results should, therefore, be interpreted for the modeled lateral wall systems within the stated assumptions.
Within these assumptions, the framework is most suitable for screening-level and comparative evaluations of how seismic damage may amplify subsequent wind-induced demands and for contrasting the post-event wind response of conventional and PT rocking CLT wall systems. Future work will extend the framework to longer wind records, spatially correlated wind loading, larger suites of ground motions and archetypes, and uncertainty quantification to enable probabilistic multi-hazard performance evaluation.
6. Conclusions
This paper numerically examined the dynamic response of both a conventional CLT shear wall structure and a PT CLT wall structure subjected to wind-only and sequential seismic–wind scenarios with nonlinear finite element time history analysis. An equivalent fluctuating wind load was first generated by considering the ASCE wind average speed, ESDU wind profile, wind pressure coefficient, and fluctuation from the NatHaz Online Wind Simulator. The fluctuating wind load was first examined with the SOM benchmark structural model by comparing its peak responses with reference test results. The sequential seismic–wind load was applied to the structures in the order of seismic event, resting, and the equivalent fluctuating wind load. Both the conventional and the PT CLT wall structure models developed from the authors’ previous work were applied with sequential scenarios. The structural responses during the wind load, primarily the story displacement and acceleration, were compared between the wind-only and sequential scenarios to assess the damage and changes in the structures. A series of seismic events with increasing peak ground acceleration and a series of increasing wind load factors were separately applied to both models to assess the impact of seismic intensity and wind intensity on the structure’s behavior in sequential seismic–wind hazard scenarios. The main results and conclusions were discussed as follows.
- With the generated fluctuating wind load, the SOM benchmark structure model had an average 13.57% difference in peak story displacement compared to the down-scale wind tunnel test reference value. The maximum displacement at 30 stories was 21.73% underestimated by the model. The peak story acceleration was calculated as 7.81 milli-g, which was also close to the reference value (10 milli-g). The result indicated that the method of generating fluctuating wind load could provide a reasonable equivalent to the detailed wind analysis for dynamic structure response and can, therefore, be used as a practical tool for preliminary wind response assessment of CLT structures when detailed wind tunnel data are unavailable.
- In comparing the sequential and wind-only scenarios, the conventional CLT structure model had 70.66-times magnification in peak story acceleration and 1440 times in peak story displacement. The simulation results indicated that the linear elastic range of the conventional CLT structure after seismic events was reduced, providing nonlinear wind responses with increasing PGAs and wind load factors. The magnification factors should be interpreted together with the absolute response levels. Because the wind-only baseline displacements are extremely small in the examined case, relatively modest absolute increases after the earthquake can yield very large ratios; thus, the ratios are used here as comparative indicators of damage-induced amplification under identical wind excitation. For the damaged structure after earthquake events, the magnification of the displacement and acceleration was found to have medium (r = 0.32) and strong (r = 0.77) positive correlations with the natural frequencies. These results indicate that post-earthquake wind serviceability should be explicitly evaluated for conventional CLT shear wall structures, as seismic damage can increase wind-induced response even under serviceability-level wind loading.
- The magnifications in peak story acceleration and displacement of the PT CLT wall structure were calculated as 3.37 and 4.61 times, respectively, by comparing the wind-only scenario and the initial sequential scenario with the seismic event of the El Centro record. Since the magnification of acceleration and displacement was similar among the cases with different PGAs, the PT CLT wall structure remained limited to nonlinearity or a perfect plastic state after the seismic event during the wind load for scenarios with PGAs larger than the SLE case. This behavior suggests that the self-centering rocking behavior of PT CLT wall systems is effective in maintaining post-earthquake wind performance and is recommended for structures where post-event functionality and serviceability are critical.
- As the wind responses magnified after the earthquake, the conventional CLT wall structure and the PT CLT wall structure were both damaged during the seismic event. For the ElC case, the magnifications of peak story acceleration and displacement of the conventional CLT wall structure were separately 20.96 and 312.36 times that of the PT CLT wall structure model. With the increasing seismic event intensity and wind load factor, the PT CLT wall structure provided responses linear to the intensity, while the conventional CLT wall structure demonstrated nonlinear behavior (r = 0.018 for acceleration and 0.318 for displacement to wind load factor). These differences demonstrate that PT CLT wall structures provide superior resilience in sequential seismic–wind scenarios due to their higher ductility and displacement capacity and should be considered a preferred design strategy for CLT buildings in regions subjected to combined seismic and wind hazards.
This paper demonstrated that the structural responses of conventional CLT wall structures under sequential scenarios need to be assessed for structure resilience assessment, particularly with respect to post-earthquake wind serviceability. Meanwhile, the PT wall structure was more ductile, as the wind responses were in a safe range after the seismic event, indicating its suitability for resilience-based design of CLT buildings. Based on the developed model and system, detailed fragility and reliability analysis of CLT structures in sequential seismic–wind multi-hazard scenarios can be conducted with more archetypes as the next stage.
Author Contributions
Conceptualization, Y.M.; Methodology, Y.M. and Q.D.; Software, Y.M.; Formal Analysis, Y.M.; Investigation, Y.M. and Q.D.; Writing—Original Draft, Y.M.; Writing—Review and Editing, Y.M., Q.D. and X.Z.; Supervision, Q.D.; Project Administration, Q.D. All authors have read and agreed to the published version of the manuscript.
Funding
This research received no external funding.
Data Availability Statement
The original contributions presented in the study are included in the article, further inquiries can be directed to the corresponding author.
Conflicts of Interest
The authors declare no conflicts of interest.
References
- Michalak, H.; Michalak, K. Sustainable Mass Timber Structures—Selected Issues in the Structural Shaping of Tall Buildings. Appl. Sci. 2025, 15, 10296. [Google Scholar] [CrossRef] [Scilit]
- ASCE 7-22; Minimum Design Loads and Associated Criteria for Buildings and Other Structures. American Society of Civil Engineers: Reston, VA, USA, 2022.
- Menon, S.; Song, X. A stabilized computational nonlocal poromechanics model for dynamic analysis of saturated porous media. Int. J. Numer. Methods Eng. 2021, 122, 5512–5539. [Google Scholar] [CrossRef] [Scilit]
- Amini, M.O. Determination of Seismic Performance Factors for Cross Laminated Timber Shear Wall System Based on FEMA P695 Methodology. Ph.D. Thesis, Colorado State University, Fort Collins, CO, USA, 2018. [Google Scholar]
- Chen, F.; Li, M.; Li, Z. Self-centering mass timber structures: A review on recent research progress. Eng. Struct. 2024, 303, 117474. [Google Scholar] [CrossRef] [Scilit]
- Kadhim, M.M.A.; Jawdhari, A.; Adheem, A.H.; Fam, A. Analysis and design of two-way slabs strengthened in flexure with FRCM. Eng. Struct. 2022, 256, 113983. [Google Scholar] [CrossRef] [Scilit]
- Sun, X.; He, M.; Li, Z.; Lam, F. Seismic performance assessment of conventional CLT shear wall structures and post-tensioned CLT shear wall structures. Eng. Struct. 2019, 196, 109285. [Google Scholar] [CrossRef] [Scilit]
- Sun, X.; He, M.; Li, Z. Experimental and analytical lateral performance of posttensioned CLT shear walls and conventional CLT shear walls. J. Struct. Eng. 2020, 146, 04020091. [Google Scholar] [CrossRef] [Scilit]
- Zhu, H.; Bezabeh, M.A.; Iqbal, A.; Popovski, M.; Chen, Z. Seismic design and performance evaluation of post-tensioned CLT shear walls with coupling U-shaped flexural plates in Canada. Earthq. Spectra 2025, 41, 2203–2224. [Google Scholar] [CrossRef] [Scilit]
- Benedetti, F.; Álvarez M, J.; Jara-Cisterna, A.; Opazo-Vega, A.; Rosales, V. Effect of the Initial Damage State on the Seismic Behavior of a Five-Story CLT Building. Buildings 2025, 15, 727. [Google Scholar] [CrossRef] [Scilit]
- Xie, Q.; Zhang, L.; Miao, Z.; Zhou, W.; Li, S. Lateral Behavior of Traditional Chinese Timber-Frames Strengthened with Shape-Memory Alloy: Experiments and Analytical Model. J. Struct. Eng. 2020, 146, 04020083. [Google Scholar] [CrossRef] [Scilit]
- Sfetsos, A.; Politi, N.; Vlachogiannis, D. Multi-Hazard Scenarios of Extreme Compounded Events at the Local Scale Under Climate Change. Atmosphere 2025, 16, 1007. [Google Scholar] [CrossRef] [Scilit]
- Rasa, A.Y.; Budak, A. A parametric investigation on seismic performance of ageing Sarıyar dam. Struct. Eng. Mech. Int. J. 2024, 91, 123–133. [Google Scholar]
- Rasa, A.Y.; Budak, A.; Düzgün, O.A. The influence of concrete degradation on seismic performance of gravity dams. Earthq. Struct. 2024, 26, 59. [Google Scholar]
- Berile, N.K.; Bezabeh, M.A. Performance-based wind design of tall mass timber buildings with coupled post-tensioned cross-laminated timber shear walls. J. Wind. Eng. Ind. Aerodyn. 2025, 257, 105981. [Google Scholar] [CrossRef] [Scilit]
- SOM. Timber tower research projects. SOM Timber Tower Syst. Rep. 2014, 1. Available online: https://www.som.com/wp-content/uploads/2021/08/timber-tower-final-report-and-sketches-1633640951.pdf (accessed on 11 March 2026).
- Bezabeh, M.A.; Bitsuamlak, G.T.; Popovski, M.; Tesfamariam, S. Probabilistic serviceability-performance assessment of tall mass-timber buildings subjected to stochastic wind loads: Part I-structural design and wind tunnel testing. J. Wind. Eng. Ind. Aerodyn. 2018, 181, 85–103. [Google Scholar] [CrossRef] [Scilit]
- Naser, M.Z. Autonomous Fire Resistance Evaluation. J. Struct. Eng. 2020, 146, 04020103. [Google Scholar] [CrossRef] [Scilit]
- Victoria, L.C.; Aquino, C.D.; Branco, J.M.; Miguel, L.F. Numerical Analysis of Cross-Laminated Timber (CLT) Buildings: A Parametric Study on Steel Connectors When Subjected to Seismic Loading Under Eurocode 8 and NBR 15421. Buildings 2025, 15, 754. [Google Scholar] [CrossRef] [Scilit]
- Sun, X.; He, M.; Li, Z.; Lam, F. Seismic performance of energy-dissipating post-tensioned CLT shear wall structures I: Shear wall modeling and design procedure. Soil Dyn. Earthq. Eng. 2020, 131, 106022. [Google Scholar] [CrossRef] [Scilit]
- Bezabeh, M.; Bitsuamlak, G.T.; Popovski, M.; Tesfamariam, S. Dynamic Response of Tall Mass-Timber Buildings to Wind Excitation. J. Struct. Eng. 2020, 146, 04020199. [Google Scholar] [CrossRef] [Scilit]
- Yasumura, M.; Kobayashi, K.; Okabe, M.; Miyake, T.; Matsumoto, K. Full-scale tests and numerical analysis of low-rise CLT structures under lateral loading. J. Struct. Eng. 2016, 142, E4015007. [Google Scholar] [CrossRef] [Scilit]
- Zhang, X.; Pan, Y.; Tannert, T. The influence of connection stiffness on the dynamic properties and seismic performance of tall cross-laminated timber buildings. Eng. Struct. 2021, 238, 112261. [Google Scholar] [CrossRef] [Scilit]
- Sciomenta, M.; Fanti, R.; Doudak, G.; Polastri, A.; Casagrande, D. Predicting the non-linear behaviour of cross laminated timber shearwalls with cut-out openings. Structures 2024, 68, 107138. [Google Scholar] [CrossRef] [Scilit]
- ANSYS. Ansys Fluent: Fluid Simulation Software; ANSYS: Canonsburg, PA, USA, 2020. [Google Scholar]
- Huang, S.; Li, Q.S.; Xu, S. Numerical evaluation of wind effects on a tall steel building by CFD. J. Constr. Steel Res. 2007, 63, 612–627. [Google Scholar] [CrossRef] [Scilit]
- Kwon, D.; Kareem, A.J.N.M.L.R. University of Notre Dame, Indiana, USA. NatHaz On-Line Wind Simulator (NOWS): Simulation of Gaussian Multivariate Wind Fields. 2006. Available online: http://windsim.ce.nd.edu/int_winsim.html (accessed on 11 March 2026).
- Ceccotti, A.; Lauriola, M.P.; Pinna, M. SOFIE project-cyclic tests on cross-laminated wooden panels. In Proceedings of the 9th World Conference on Timber Engineering (WCTE2006), Portland, OR, USA, 6–10 August 2006. [Google Scholar]
- Ceccotti, A.; Sandhaas, C.; Okabe, M.; Yasumura, M.; Minowa, C.; Kawai, N. SOFIE project–3D shaking table test on a seven-storey full-scale cross-laminated timber building. Earthq. Eng. Struct. Dyn. 2013, 42, 2003–2021. [Google Scholar] [CrossRef] [Scilit]
- Gavric, I.; Fragiacomo, M.; Ceccotti, A. Cyclic behaviour of typical metal connectors for cross-laminated (CLT) structures. Mater. Struct. 2015, 48, 1841–1857. [Google Scholar] [CrossRef] [Scilit]
- Ma, Y.; Dai, Q. Lateral Perforamnce Simulation of Conventional CLT Shear Wall and Structure by Equivalent Decomposed Wall model. J. Struct. Eng. 2023, 149, 04022214. [Google Scholar] [CrossRef] [Scilit]
- van de Lindt, J.W.; Furley, J.; Amini, M.O.; Pei, S.; Tamagnone, G.; Barbosa, A.R.; Rammer, D.; Line, P.; Fragiacomo, M.; Popovski, M. Experimental seismic behavior of a two-story CLT platform building. Eng. Struct. 2019, 183, 408–422. [Google Scholar] [CrossRef] [Scilit]
- van de Lindt, J.W.; Amini, M.O.; Furley, J.; Pei, S.; Tamagnone, G.; Barbosa, A.R.; Line, P.; Rammer, D.; Fragiacomo, M. Experimental seismic behavior of a two-story CLT platform bulding: Shake table testing results. In Proceedings of the WTCE 2018-World Conference on Timber Engineering; Korean Institute of Forest Science: Seoul, Republic of Korea, 2018; 7p. [Google Scholar]
- Yin, Y.-J.; Li, Y. Loss estimation of light-frame wood construction subjected to mainshock-aftershock sequences. J. Perform. Constr. Facil. 2011, 25, 504–513. [Google Scholar] [CrossRef] [Scilit]

Disclaimer/Publisher’s Note: The statements, opinions and data contained in all publications are solely those of the individual author(s) and contributor(s) and not of MDPI and/or the editor(s). MDPI and/or the editor(s) disclaim responsibility for any injury to people or property resulting from any ideas, methods, instructions or products referred to in the content. |
© 2026 by the authors. Licensee MDPI, Basel, Switzerland. This article is an open access article distributed under the terms and conditions of the Creative Commons Attribution (CC BY) license.