


Abstract
Rapid and accurate building assessment after an earthquake remains a persistent challenge for engineers in seismic areas. Manual inspections are often slow, hampered by road blockages, damaged utilities, and ongoing aftershock risks. This study presents the design, field deployment, and validation of a scalable IoT-based structural health monitoring (SHM) platform developed for real-time post-earthquake decision support. The system integrates multi-axis MEMS accelerometers and inclinometers, supported by on-site signal processing and a cloud-based analytics backend. A comprehensive damage assessment algorithm evaluates parameters such as frequency changes, inter-storey drift, roof displacement, torsional irregularities, and permanent tilt by combining multiple indicators rather than relying on a single measure. The system was deployed in a 22-storey reinforced concrete office building and continuously recorded several seismic events, including a Mw 6.2 earthquake. The results showed that drift values remained within code-defined limits and no permanent deformation occurred. Event-driven edge processing and optimized data management confirmed the system’s scalability for large building portfolios. The findings indicate that IoT-based SHM platforms can complement conventional inspections by providing rapid, data-driven screening to support resilient urban recovery.
1. Introduction
Major earthquakes remain a significant threat to cities, especially in highly active seismic zones like Türkiye. Just consider recent decades: the 1999 İzmit earthquake (Mw 7.5), the 2020 İzmir quake (Mw 6.9), the 2022 Düzce event (Mw 6.0), and the catastrophic Kahramanmaraş sequence in February 2023 (Mw 7.7 and 7.6). Each of these disasters devastated homes, schools, and factories—no building type was untouched. After the 2023 Kahramanmaraş–Hatay earthquakes, reports recorded over half a million units that either collapsed, were slated for demolition, or were severely damaged. More than a million others suffered minor damage. The massive scale quickly overwhelmed damage assessment teams.
Traditionally, post-earthquake assessment relies on engineers inspecting buildings on site. This approach works if only a small number of structures are involved, but it fails when tens or hundreds of thousands require inspection within days instead of months. Blocked roads, heavy debris, and ongoing aftershocks make reaching every building nearly impossible [1]. Even after a smaller event like the 2022 Düzce earthquake, damage surveys took about two weeks. Picture a future Mw 7.5 earthquake striking Istanbul, with over 500,000 buildings at risk—manual inspection simply cannot keep up.
Structural health monitoring (SHM) presents an alternative. These systems automate the measurement of how buildings behave before, during, and after earthquakes. By installing accelerometers, inclinometers, or displacement sensors inside a structure, engineers can monitor changes in natural frequencies, damping, and inter-storey drift—crucial indicators of damage and loss of stiffness. Yet despite a long research history and extensive literature, SHM is still not widely used in most real-world building stocks. The reasons are clear: high hardware costs, complicated installation, reliance on proprietary or closed technology [2], and a lack of open datasets for researchers to test damage detection algorithms on a large scale.
Up to now, most SHM research projects in buildings have been short-term. Researchers set up expensive, low-noise sensors and perform ambient vibration measurements for a few days or weeks. But these systems are costly and cannot be left in place—there is always the risk of theft, equipment damage, or prohibitive expense. The result? Multiple strong-motion events in the same building are rarely recorded, so most analyses depend on ambient data rather than actual earthquake shaking.
Now, advances in IoT technology, low-cost MEMS sensors, embedded processing, and cloud computing are transforming the situation. It is becoming possible to envision SHM systems that are scalable, always active, and deployed across many buildings simultaneously [3]. While MEMS accelerometers do not match the ultra-low noise of high-end piezoelectric sensors for sensitive ambient vibration studies in regular concrete buildings, they are sufficient when strong earthquake shaking prevails or when installed on stiffer structures like bridges, wind turbines, or base-isolated buildings. This paves the way for much wider and more practical SHM deployments in areas where they are most needed.
1.1. Motivation and Objectives
Earthquake studies indicate that in Türkiye, a significant quake—magnitude 7 or above—occurs roughly every seven years. On 6 February 2023, two major earthquakes struck just hours apart. The first hit at 4:17 a.m., registering Mw 7.7 with its epicenter 8.6 km deep near Pazarcık in Kahramanmaraş. The second, at 1:24 p.m., struck Elbistan, also in Kahramanmaraş, at Mw 7.6 and a depth of 7 km. Later, on 20 February, another earthquake (Mw 6.4) hit Yayladağı in Hatay at 8:04 p.m. Together, these three earthquakes devastated 11 provinces [4].
A report from the Strategy and Budget Presidency outlines the scale of destruction. Using data from the Ministry of Environment, Urbanization, and Climate Change, they found 518,009 residential units either collapsed, slated for demolition, or severely damaged. An additional 131,577 units suffered moderate damage, while 1,279,727 were lightly affected. The education sector was also impacted: as of 3 March 2023, only 8162 out of 20,340 Ministry of Education school buildings in the region had been inspected. It is clear that post-earthquake damage assessment takes far too long.
Several issues contribute to delays in post-quake evaluations. There is a shortage of trained engineers and inspectors, which slows the timeline for site visits. Damaged roads and debris make it difficult to reach critical locations. Aftershocks continue to destabilize structures, often requiring multiple inspections for the same building. Most seismic data is collected from ground motion networks, not from sensors inside the buildings themselves, which limits both the detail and usefulness of the information.
This study aims to address these challenges. The objective is to develop and validate a structural health monitoring (SHM) system that operates continuously, records how buildings respond to strong earthquakes, and provides clear, quantitative information for each structure. With such a system in place, officials can make faster, more objective decisions after a major earthquake—across thousands of buildings simultaneously.
1.2. Need for Real-Time SHM
Looking back at the history of structural health monitoring (SHM), most research focused on short-term monitoring, typically using ambient vibrations to study how structures respond. The main reason for this approach was that early SHM systems could only collect data on-site within a limited network. This restriction meant researchers had to use highly sensitive, low-noise accelerometers—specialized devices that were expensive and quickly raised overall costs [5].
Because these systems were costly, researchers were reluctant to leave them installed in buildings for long durations. The possibility of theft or damage was simply too great. As a result, most monitoring efforts were brief, and it was uncommon to obtain records from more than one significant earthquake in the same building. Usually, researchers had to rely solely on ambient vibration data. This entire group of related challenges slowed SHM’s transition from experimental settings to widespread, real-world adoption across many buildings [6].
Today, the situation has changed. Technological advancements, especially in smart systems, have made SHM more attainable and cost-effective. The growth of the Internet of Things (IoT) and web-based solutions has reduced barriers, and the price of SHM devices has decreased. High-resolution sensing is now more accessible, but there is a catch: many of the more affordable sensors still cannot detect ambient vibrations in typical reinforced concrete buildings due to their higher noise levels [7].
Nevertheless, studies indicate that MEMS-based accelerometers perform well in environments like bridges, wind turbines, telecom towers, and seismically isolated structures. But for reinforced concrete buildings, if you want to analyze structural behavior using ambient data, those expensive, ultra-low-noise accelerometers are still necessary [8].
What is the alternative? This study takes another approach: install numerous low-cost accelerometers across many buildings and stream acceleration data continuously to a central platform [9]. This arrangement allows for the collection of multiple earthquake records from a single building. By concentrating on earthquake-induced accelerations—which are much stronger than ordinary vibrations—the system can use affordable sensors to evaluate structural response and track changes from one earthquake to another [10].
Integrating these technologies has enabled the creation of a comprehensive IoT system that reports automatically. With ongoing monitoring and automatic reporting during real earthquake events, this SHM platform finally offers a practical solution to the longstanding challenges that once hindered the field.
1.3. Related Work
Structural health monitoring (SHM) research has gained significant momentum recently, driven by next-generation sensors and advancements in IoT and wireless networks. Rahita and colleagues reviewed the literature and discovered that IoT has become a central component in SHM systems over the last decade. Their findings highlight key advancements: more intelligent sensors, improved data processing, and more dependable wireless communication. These developments enhance SHM’s real-time monitoring capabilities—providing continuous oversight with greater sensitivity [5].
Sivasuriyan’s team examined current trends in smart sensor integration. They investigated the widespread adoption of piezoelectric, fiber-optic, MEMS-based accelerometers, GPS, LVDTs, and RFID sensors. Their work also demonstrated that incorporating BIM and AI-powered data analysis makes predictive maintenance within SHM systems much more effective [11].
Wireless sensor networks (WSNs) have received significant attention recently. Dagsever and collaborators developed a WSN-based multi-sensor platform that integrates a PZT impact detector, strain gauge, accelerometer, and environmental sensors into a compact 3 × 3 cm flexible PCB. The platform is highly energy efficient and operates on Bluetooth Low Energy. Its lightweight, scalable design represents a major breakthrough, particularly for aerospace and transportation structures [12].
Preserving historic buildings presents unique challenges. Cakir’s group focused on the Antalya Clock Tower, first conducting vibration tests and finite element modeling. They then reinforced the structure with external carbon-fiber composite wrapping and injection infill. Post-intervention monitoring showed no further crack growth, demonstrating how effective modern, material-based strengthening strategies can be for heritage structures [13].
Aras monitored the seismic retrofitting of a five-storey reinforced concrete building in Kadıköy, Istanbul. The team tracked changes in dynamic properties throughout the retrofitting process: switching to a mat foundation, adding shear walls, and jacketing columns and beams. Ambient vibration measurements indicated that destructive actions—such as removing partition walls or demolishing columns—led to decreases in natural frequencies, while strengthening interventions increased frequencies. They compared these results with finite element models and documented how the building’s behavior evolved before and after retrofitting [14].
In related research, Aras and Çatbaş investigated the dynamic properties of a six-storey building following column loss. They introduced damage in stages: first by removing surface finishes, then corner columns, and finally another column. AVS measurements and simulations showed only slight reductions in modal frequencies, but a new vertical vibration mode appeared. This indicates that after damage, not only do frequencies shift, but new modes can develop—underlining the importance of dynamic measurement for post-earthquake assessment of buildings [15].
On the sensor technology side, Occhipinti’s group conducted a comprehensive experiment to assess MEMS accelerometers for SHM applications. They tested various MEMS and traditional piezoelectric sensors on a shake-table using a 2:3 scale, two-storey masonry building model. All sensors successfully recorded the building’s earthquake response, but for operational modal analysis, only ultra-low-noise MEMS sensors (less than 1 μg/√Hz, preferably under 0.5 μg/√Hz) provided reliable results [16]. The main technical characteristics of the evaluated MEMS, piezoelectric, and force-balance accelerometers are summarized in Table 1, including noise density, sensitivity, dynamic range, and bandwidth.
Table 1.
Comparison of technical specifications of accelerometers [16].
In summary, these studies highlight three primary trends in SHM: first, enhancing scalability through IoT and wireless technologies; second, improving measurement accuracy with advanced, high-precision sensors; and third, applying innovative, material-based strengthening techniques to historic structures. This collective understanding forms the foundation for the current work.
2. Materials and Methods: IoT-Based SHM System Design
2.1. System Overview
The SHM solution employs a sophisticated, multi-layer IoT architecture designed for comprehensive structural monitoring. At the foundational level, compact sensor nodes are directly mounted onto the structure—these could be placed on beams, columns, floors, or other critical points. These smart nodes do not just passively collect data; they also process information locally, enabling them to detect anomalies or threshold breaches in real time and immediately trigger alerts or predefined actions. This capability helps in identifying issues at the earliest possible stage, reducing the risk of damage or failure.
Following the edge layer, the communication infrastructure comes into play. This layer utilizes a combination of wired and wireless technologies to efficiently transfer data from the distributed sensor nodes to a central gateway. The gateway acts as a bridge, aggregating and forwarding the data securely to cloud-based servers. This system is designed to be robust, capable of adapting to different building layouts and networking environments, which ensures reliable data transmission even in complex or large-scale structures.
In the cloud and application layer, a powerful web-based platform handles the core computational tasks. Here, massive volumes of time series data are stored and managed in scalable databases. Advanced analytics engines process this data, extracting meaningful patterns and insights, such as detecting gradual structural shifts, sudden impacts, or long-term trends that could indicate wear or instability. The platform also generates rich visualizations—interactive dashboards and trend charts that make it easy for engineers and facility managers to interpret the health of the structure at a glance. Additionally, the system is configured to automatically send out detailed reports and instantaneous alerts via email, SMS, or other channels to relevant stakeholders whenever predefined criteria are met, ensuring that no critical event goes unnoticed.
Multiple edge devices can be deployed throughout a single building, strategically installed in areas such as the basement, at various key floors, on the roof, or at particularly vital columns and supports. This distributed deployment provides a high-resolution, three-dimensional view of the structure’s dynamic behaviors and responses to environmental or operational loads. The sensors themselves, typically MEMS accelerometers and inclinometers, capture fine-grained measurements of acceleration and tilt. These signals are digitized using a high-precision 24-bit analog-to-digital converter (ADC), and they are then processed by onboard microcontrollers. The processed data is transmitted, often using industrial-grade protocols, like TCP/IP, Modbus, or MQTT, to ensure reliability and security as it moves to the cloud. Time synchronization across all devices is maintained using precision pulse per second (PPS) signals, and GPS modules can be incorporated when even higher temporal accuracy is required, such as in large, distributed monitoring networks.
This meticulously designed architecture allows for direct, side-by-side comparison of structural responses from different locations within the same building and even across multiple buildings. As a result, engineers and safety personnel gain not only a more complete understanding of how individual structures behave under various conditions but also the ability to benchmark performance and detect potential risks across a portfolio of assets. This approach dramatically enhances the capacity for proactive maintenance, early warning, and overall structural safety management.
To clarify the physical wiring and communication topology, at the basic level, each sensor node connects to an industrial PoE switch located inside the building. The overall end-to-end sensor-to-cloud communication architecture is illustrated in Figure 1. The PoE switch does not just handle data, it also supplies power to the sensors, and it remains operational during power outages because it is backed up by an uninterruptible power supply. From there, all the data is sent to a central gateway, which then connects to the cloud. Sometimes this connection uses a standard Ethernet line, while other times it relies on a 4G or LTE modem if necessary. This arrangement keeps the wiring straightforward and the connections reliable. If the internet goes down, the edge devices continue operating as usual—they keep saving data to their own flash memory and later automatically upload any stored data once the connection is restored.
Figure 1.
End-to-end sensor-to-cloud data transmission architecture.
2.2. Hardware Architecture
This hardware platform offers a lot in a compact design. At its core is a dual-core ARM Cortex-M7 and Cortex-M4 microcontroller, (STMicroelectronics, Geneva, Switzerland) providing both strong processing capabilities and efficient power usage. The system manages data collection, signal processing, and communication simultaneously—no delays; no waiting.
Focusing on the sensing layer, it features a three-axis accelerometer and three-axis inclinometers, all operating in the X, Y, and Z axes. This setup enables detection of both fast, dynamic motions and slower, gradual changes in structural behavior. A built-in microphone means the device does not just detect movement—it can listen as well. This multi-modal sensing delivers a more comprehensive view of the environment.
All analog signals are processed by a 24-bit ADC (Texas Instruments, Dallas, TX, USA), ensuring highly accurate digital readings. Stable measurements are maintained by low-noise reference regulators at 2.5 V, 3.3 V, and 5 V. For storage and synchronization, the board is equipped with 16 MB of QSPI flash memory (Winbond Electronics Corporation, Taichung, Taiwan). Additionally, a PPS (pulse per second) input and optional GPS extension allow every measurement to be precisely time-stamped and located—no guesswork, just dependable data. A detailed summary of the hardware architecture and PCB component specifications is presented in Table 2.
Table 2.
Technical specifications of the developed PCB.
The front view of the developed multi-sensor PCB, highlighting the microcontroller, voltage regulators, accelerometer, inclinometer, and communication interfaces, is shown in Figure 2. The communication setup manages a lot. It connects directly to a wide range of sensors and devices using CAN bus, RS-422, RS-232, USB OTG, and Ethernet—including Power over Ethernet if required. This means you are not restricted to just the built-in accelerometer or inclinometer. You can connect geophones, LVDT displacement sensors, pressure transducers, strain-gauge sensors, digital temperature or humidity sensors, GNSS receivers, and even fiber-optic displacement or tilt sensors. Such versatility makes this device the core of a multi-dimensional SHM system. The back-side layout of the PCB, including the 24-bit ADC, QSPI flash memory, relay outputs, and communication interfaces, is illustrated in Figure 3.
Figure 2.
The multiple sensor (acceleration, inclination, etc.) Pcb front view.
Figure 3.
The multiple sensor (acceleration, inclination, etc.) Pcb back view.
The device’s dual relay outputs take its capabilities far beyond standard structural health monitoring. They play a crucial role in earthquake early warning systems. When ground movement exceeds a defined acceleration—or when triggers like STA/LTA or PGA-based algorithms activate—the relays respond immediately. They connect directly to sirens, gas or power shut-offs, elevator systems, or industrial PLCs, enabling rapid, automatic actions where delays are not an option. With this, the device goes beyond just monitoring—it becomes an active safety component. A comprehensive list of supported sensor types and their associated communication interfaces is provided in Table 3.
Table 3.
Supported sensor types and connection interfaces.
In summary, this hardware combines precise sensing, reliable processing, adaptable communication, and genuine control features in a single system. It is not just designed for research; it is built for real-world use, providing a robust platform for both SHM and earthquake early warning wherever it is deployed.
2.3. Software Architecture
The hardware combines multiple sensing and communication capabilities with embedded software designed for real-time data processing and remote connectivity. The software is organized into three layers. The embedded layer handles low-level data acquisition and signal processing. The communication layer oversees data transmission across various protocols. The web or cloud integration layer manages visualization, device administration, and reporting through a web-based interface. This layered architecture ensures the system operates dependably and scales effectively, whether deployed in the field or used in a laboratory setting.
In this study, robustness matters have also been taught in post-earthquake SHM. This platform does not just promise it. It has been built in edge-level buffering with onboard QSPI flash, Power over Ethernet for steady power, and event-based triggers that keep data flowing, even if communication drops out, if it is necessary to provide more detail. In this setup, the developed accelerometers are connected via PoE switches, all supported by an uninterruptible power supply (UPS). If there is a power outage, the UPS ensures the PoE switches and the 4G modem—with its SIM card—continue to operate without disruption. Should the electricity remain but the internet connection fails, the device continues functioning normally. It stores earthquake data in its onboard RAM and flash memory until connectivity is restored. The system always maintains a rolling buffer, keeping the previous 300 s of data before the first reading that exceeds the threshold. The Turkish Structural Health Monitoring Regulation specifies this acceleration threshold as 0.005 g.
Continuous monitoring of multiple buildings generates large volumes of time series data. To ensure scalability, the proposed system implements an event-driven data management strategy. To manage all that information efficiently, this system uses an event-driven strategy. Rather than sending every piece of raw, high-frequency data to the cloud, the embedded layer processes data at the edge: it filters out unnecessary details and only uploads when something significant occurs, such as a seismic event. For regular background noise, it just transmits statistical summaries. If nothing noteworthy is happening, the system reduces data size by decimating and compressing the recordings, conserving a lot of bandwidth. By combining edge filtering with selective cloud uploads, the platform keeps server demands under control and can easily scale from monitoring a single building to an entire city’s infrastructure, without needing major upgrades or additional resources.
2.3.1. Embedded Layer
This layer operates essential low-level drivers, a resolute task manager, and advanced real-time signal processing algorithms on both the ARM Cortex-M7 and Cortex-M4 processors. It ingests acceleration, inclination, and acoustic signals captured through the high-resolution 24-bit ADC and then systematically channels this data through robust embedded filters, such as Butterworth band-pass filters and sophisticated STA/LTA-based triggering mechanisms. This rigorous filtering ensures that only relevant signals are analyzed, significantly improving event detection capabilities. Pre-processing functions are also conducted at this stage, enabling ultra-fast and highly accurate analysis before the data is passed on to higher-level systems.
In addition to signal handling, the embedded layer efficiently manages memory resources by buffering incoming data in high-speed QSPI flash memory, ensuring seamless data flow and minimizing the risk of data loss. It is also responsible for comprehensive error management, actively detecting and responding to faults to maintain system stability. System health is vigilantly monitored through the use of watchdog timers, which help prevent software crashes or system hang-ups. Furthermore, the embedded layer exercises intelligent control over power-saving modes, dynamically adjusting power consumption based on operational demands to extend device longevity and optimize energy efficiency.
2.3.2. Communication Layer
The system integrates seamlessly with a wide variety of infrastructures, owing to its extensive support for multiple communication protocols—including CAN, RS-422, RS-232, USB OTG, and Ethernet/PoE. This versatility allows it to fit into both legacy and modern setups across different industries. When it comes to Ethernet connectivity, the system leverages the LWIP TCP/IP stack, ensuring efficient and robust network communication. Data is transmitted using JSON/REST data frames, which not only facilitates reliable delivery but also ensures compatibility and easy integration with contemporary web platforms and cloud services.
Time synchronization is treated as a core feature rather than an afterthought. The inclusion of an NTP (Network Time Protocol) input alongside a GPS module ensures precise alignment of timestamps across all data streams. This means that data collected from various devices remains perfectly synchronized, allowing users to correlate and analyze information from multiple sources on a unified, accurate timeline—an essential capability for applications requiring high levels of precision, such as industrial automation, scientific research, and distributed monitoring systems.
2.3.3. Cloud and Web-Based Platform Integration
The developed web-based platform collects data from embedded devices in real time. You can view everything instantly, including raw acceleration, tilt readings, and important metrics already calculated by the device, such as RMS, PGA, and dominant frequency. Everything is stored in the cloud, so you do not need to worry about storage management. The interface lets you explore time domain and frequency domain graphs, PSD analysis, displacement outputs, and alarm records. When the system activates a relay or makes an earthquake early warning decision, it records the event and immediately notifies infrastructure operators—by email, SMS, or directly to their systems through an API.
Security is a core feature. The software uses TLS encryption and requires user authentication. It is designed to support a large number of devices, whether they are on the same network or distributed across multiple locations. Each device has a unique ID, making it easy to track, manage, and update devices—including over-the-air firmware updates—all from the web platform. The layered architecture of the proposed SHM system—comprising embedded processing, communication infrastructure, and cloud-based analytics—is presented in Figure 4.
Figure 4.
The overall principle of operation of the end-to-end SHM system.
2.4. Damage Algorithm Structure
This damage detection approach employs a multi-layer configuration, with edge and cloud processing operating together. At the edge, the system rapidly detects warning indicators and records events in real time. Afterwards, the cloud manages the intensive tasks—computing modal properties, analyzing trends, and reliably calculating damage indices. The complete data-processing workflow of the proposed IoT-based SHM system during post-earthquake damage assessment is illustrated in Figure 5.
Figure 5.
The data flow of the IoT-based SHM system during post-earthquake damage assessment.
First, the structure is equipped with more than three accelerometers. These sensors transmit their data through a gateway, sending everything to a 4G/LTE-enabled cloud system. Once the data arrives in the cloud, it is stored and filtered for basic pre-processing before moving on to analysis.
During the analysis stage, the system calculates the peak ground acceleration (PGA) measured during the earthquake. It also examines the building’s dynamic properties, such as natural frequencies, mode shapes, modal safety criteria, and damage indices. These values are compared before and after the seismic event to identify any changes. Roof displacement is monitored closely as well, since tracking it helps detect shifts in the building’s overall behavior.
The next phase is the decision support layer. At this point, the system accesses building inventory information and utilizes a database of fragility curves. Using these resources, it assesses how various building types perform against the seismic limit states defined by codes and the literature. Two main control mechanisms are used here. Change control examines pre- and post-earthquake parameters to find significant variations. Threshold control checks for values such as frequencies, displacements, or safety criteria that exceed critical limits.
The decision support framework utilizes fragility curves grounded in established seismic assessment techniques, rather than relying on black box, data-driven models. For reference, it uses generic fragility functions for reinforced concrete buildings from FEMA P58, which are consistent with the Turkish Building Earthquake Code (TBDY-2018) (TBDY-2018) [17]. These curves are not designed to predict precise damage probabilities. Instead, they provide context for measured response parameters—such as inter-storey drift and roof displacement—based on performance thresholds defined in the relevant Turkish building codes. As additional building-specific information becomes available, the framework allows for regional calibration in the future.
In the final step, the system evaluates the probability of damage and presents the findings to decision-makers via a visualization and management platform. This end-to-end process enables teams to rapidly and reliably assess how a structure has performed after an earthquake.
Figure 6 illustrates the workflow of the decision algorithm designed to detect post-earthquake structural damage. The process begins with processing acceleration and inclination data from the sensors and proceeds through a series of threshold checks and parameter comparisons, concluding with a classification of the building’s structural risk level.
Figure 6.
Damage algorithm/risk algorithm.
Initialization stage. The algorithm is triggered when the acceleration recorded at the ground level exceeds 0.005 g. Once this condition is met, a 900 s data window is considered for pre- and post-event analysis (300 s before and 600 s after the trigger).
2.4.1. Frequency-Based Stiffness Change
Begin by determining the structure’s initial natural period, , as well as its post-earthquake period, . These values are typically obtained from the acceleration time series’ spectral density, using either a Fourier transform or a peak picking technique:
where is the dominant natural frequency. The change in frequency is interpreted as an indicator of stiffness loss.
The decision rule is as follows:
If exceeds 1.05 times , or is less than 0.95 times , it indicates a significant change in stiffness. When this occurs, the algorithm proceeds to risk level 1. The value specified here [14] was determined based on continuous monitoring of frequency changes during the strengthening process of a real structure.
A shift in natural frequency alone is not enough to confirm structural damage. Many factors can lead to frequency changes, such as temperature variations, different soil conditions, or minor non-structural modifications. That is why the algorithm does not rely solely on a fixed frequency threshold. Instead, it treats frequency-based stiffness changes as an early warning but always verifies them against other indicators: inter-storey drift, torsional irregularity, and permanent inclination. The system only triggers an alert when multiple independent signals all suggest abnormal behavior. This method increases reliability and reduces false positives.
2.4.2. Inter-Storey Drift and Roof Displacement
We determine the inter-storey drift, denoted as , as well as the roof displacement, , by analyzing the displacement time histories of the building during dynamic events. These displacement time histories are obtained through the process of double integration of the recorded acceleration data from sensors placed throughout the structure.
To calculate the drift between two adjacent floors, we simply take the difference in their displacements, as given by the equation:
where represents the displacement at the i-th floor and is the displacement at the floor below. In this way, the inter-storey drift quantifies the relative motion between successive floors, which is a key indicator of structural deformation and potential damage during events like earthquakes.
The roof displacement, meanwhile, is defined as , which corresponds to , and the displacement is measured at the topmost floor of the building. This value reflects the overall lateral movement of the structure and can be used to assess building sway and potential stability concerns. Both the inter-storey drift and the roof displacement are continuously monitored and compared against predetermined threshold values set by structural codes or engineering guidelines. If either the drift or the displacement exceeds these critical thresholds, this signals a significant increase in risk, resulting in the risk classification escalating to either Risk 2 or Risk 3.
These higher risk levels may trigger alerts, inspections, or emergency interventions to ensure occupant safety and structural integrity, highlighting the importance of accurate and timely monitoring of these key structural parameters.
To keep integration drift in check, I first pre-processed the acceleration signal baseline correction, zero-mean enforcement, and band-pass filtering before running the double integration. Displacement and inter-storey drift values work here as relative indicators inside a decision support framework. They are not meant to be precise, absolute measurements of displacement.
To address integration drift, we incorporated several correction steps before calculating displacement. First, we baseline-corrected the raw acceleration data. Linear detrending was applied to remove low-frequency bias from sensor offsets and temperature fluctuations. We then enforced a zero mean to eliminate any residual DC components. Following this, a 4th-order Butterworth band-pass filter (0.5–5 Hz) was used to isolate the building’s primary vibration modes and prevent amplification of low-frequency noise during integration.
For displacement estimation, we performed cumulative trapezoidal double integration. While long-term drift can still occur, we adjusted the displacement time series by normalizing the endpoints—ensuring zero residual displacement at the end of the seismic window, unless the inclinometer indicated actual permanent deformation.
It is important to clarify that the displacement and inter-storey drift values presented here are not intended as absolute deformation measurements. Instead, they serve as relative indicators within a decision support framework that aligns with code requirements. By defining them this way, we minimize uncertainty from integration drift while maintaining the system’s sensitivity to genuine changes in structural response.
2.4.3. Torsional Irregularity
We evaluate the torsional behavior of the structure by examining how much the lateral displacement differs between sensor points and . When these differences become large, it typically indicates that the building is at greater risk for torsional irregularity. The Turkish Seismic Code (TBDY-2018) defines torsional irregularity for any storey based on one primary factor: the ratio of the maximum inter-storey drift to the average drift in the same direction. If this ratio exceeds 1.2, the storey is classified as torsionally irregular. This ratio is identified in the code as the torsional irregularity coefficient, .
where:
- Δmax is the largest inter-storey drift at that storey;
- Δavg is the average inter-storey drift in the same direction at that storey.
As an illustrative example, suppose that inter-storey drifts measured on the 3rd floor of a building in the X direction are:
- Sensor 1: 4.2 mm;
- Sensor 2: 3.8 mm;
- Sensor 3: 4.0 mm;
- Sensor 4: 6.1 mm ← Δmax
The average drift is:
The torsional irregularity coefficient becomes:
Since , torsional irregularity is present at this storey according to TBDY-2018, indicating asymmetric behavior during earthquake excitation and higher structural risk.
2.4.4. Permanent Inclination and Plastic Deformation
During the final stage of the assessment process, it is important to carefully compare the columns’ initial inclination values, denoted as , to their corresponding values after the earthquake, represented as .
This comparison is crucial for detecting any significant changes in structural alignment. If the post-earthquake inclination value, , exceeds 1.001 times the initial value, , or falls below 0.999 times, , it indicates a substantial deviation from the original state. Such a marked change is considered a serious concern because it suggests that the columns have undergone permanent plastic deformation rather than temporary, elastic movement. Plastic deformation means the material has been pushed beyond its ability to recover, resulting in a lasting shift that can compromise the stability and integrity of the entire structure.
As a result, when these thresholds are surpassed, the system automatically assigns a risk level 4 to highlight the urgent need for intervention, repairs, or further evaluation by structural engineers to ensure the safety and functionality of the building. This final comparison thus serves as a critical checkpoint in the evaluation process, helping to identify columns that have suffered irreversible damage and require immediate attention. The practical installation of the inclinometer system within a reinforced concrete high-rise building is illustrated in Figure 7.
Figure 7.
Field installation of inclinometer sensors in a reinforced concrete high-rise building (Silicon Valley case study).
The bidirectional inclinometer installation strategy used to capture column tilt and torsional effects is presented in Figure 8.
Figure 8.
Schematic representation of inclinometer placement on opposite faces of a reinforced concrete column to capture bidirectional tilt response.
2.4.5. Risk Levels and Outputs
The proposed algorithm that categorizes structural risk into five distinct levels, each representing an increasing degree of concern based on specific structural indicators.
Risk 0: This level signifies that the structure is functioning within normal parameters, with no critical thresholds exceeded. All monitored variables remain stable, indicating that the building is currently safe and no immediate action is required. If the assessed risk level is zero, this condition is represented as a score of 10 out of 10 to ensure a clear and intuitive understanding for end users.
Risk 1: At this stage, the algorithm detects shifts in the building’s natural frequency, which may suggest the onset of stiffness loss within structural components. While this alone may not confirm damage, it serves as an early indicator that the structure could be undergoing subtle changes, warranting closer observation to catch potential issues before they develop further. If the assessed risk level is 1, this condition is represented as a score of 8 out of 10 to ensure a clear and intuitive understanding for end users.
Risk 2: In addition to frequency shifts, the structure now experiences inter-storey drift that surpasses established safety limits. This means that the relative movement between floors is greater than what is considered acceptable, increasing the potential for structural distress. The combination of frequency shifts and excessive drift provides a stronger signal that the building’s integrity may be compromised if conditions persist or worsen. If the assessed risk level is 2, this condition is represented as a score of 6 out of 10 to ensure a clear and intuitive understanding for end users.
Risk 3: Here, the situation escalates further. The frequency shifts and excessive inter-storey drift are still present, but now either roof displacement or torsional irregularity also exceeds acceptable thresholds. Roof displacement refers to excessive movement at the top of the building, while torsional irregularity indicates uneven twisting. Either of these additional factors points to more severe structural responses, increasing the likelihood of damage and signaling the need for urgent assessment and possible intervention. If the assessed risk level is 3, this condition is represented as a score of 4 out of 10 to ensure a clear and intuitive understanding for end users.
Risk 4: This is the most critical risk level. Not only are frequency changes, inter-storey drift, and roof displacement or torsional irregularity present at dangerous levels, but the structure also shows a permanent change in inclination—meaning the building is leaning or tilting in a way that will not self-correct. Such a significant and persistent deformation strongly indicates that major structural damage has occurred, and the building’s safety is now in serious jeopardy. These five risk levels are designed to fulfill two essential roles. If the assessed risk level is 4, this condition is represented as a score of 2 out of 10 to ensure a clear and intuitive understanding for end users.
First, they provide early warnings that can activate emergency systems, such as triggering relays to initiate alarms or automatic shutdowns. Second, they offer a framework for reporting and long-term structural health monitoring (SHM), enabling engineers and decision-makers to track the building’s condition over time, plan maintenance, and ensure safety throughout the structure’s lifespan. By systematically assessing and categorizing risk, the algorithm supports both immediate response actions and ongoing management of structural health.
2.5. Measurement Accuracy and Uncertainty
The accuracy of this IoT-based SHM device relies on three main factors: the MEMS accelerometers, the 24-bit ADC, and the complete signal processing chain. The accelerometers maintain a noise density below 20 µg/√Hz over the relevant frequency range, making them well-suited for monitoring strong-motion earthquakes in reinforced concrete buildings. With a 24-bit ADC, the system records both small ambient vibrations and large seismic events without any saturation.
To minimize measurement uncertainty, the design includes stable low-noise voltage regulators with a 2.5 V reference, a shielded PCB layout, and digital filtering directly on the embedded system. Time synchronization using ntp controls phase errors between sensors. This setup is not intended for ultra-low-amplitude operational modal analysis that requires laboratory-grade sensors, but it provides reliable precision for tracking building responses during earthquakes and for monitoring changes in stiffness over time.
3. The Case Study High-Rise Office Building (Silicon Valley)
Researchers deployed the IoT-based SHM system in a high-rise office building located in the center of the Silicon Valley technology campus in Gebze, Kocaeli, Türkiye. This building rises to 22 storeys, including its basement levels. Its considerable height and distinctive structural characteristics made it a suitable choice for this pilot study.
For installation, the team positioned high-sensitivity MEMS-based accelerometers at critical locations throughout the building. They designed the sensor layout to detect the building’s dynamic movements along the vertical axis and to assess any torsional behavior.
The monitored high-rise office building located in Silicon Valley is presented in Figure 9. The corresponding accelerometer deployment layout across different structural levels is illustrated in Figure 10. The sensors are arranged as follows:
Figure 9.
Silicon Valley high-rise building.
Figure 10.
Layout of accelerometer installation across different building levels. Blue dots indicate accelerometer locations, while the red dashed line represents the building’s reference vertical axis used to evaluate global lateral deformation and drift distribution.
- −
- Basement level (−2 storey): a sensor here records reference ground motion.
- −
- Ground floor: another sensor monitors how the base responds relative to the upper levels.
- −
- Ninth floor: one sensor on each floor tracks inter-storey drift and changes in stiffness.
- −
- Roof: two sensors placed in different corners capture the building’s upper-level response and any torsional (twisting) movements.
Figure 11, Figure 12, Figure 13, Figure 14 and Figure 15 present real-world examples of how the monitoring devices are installed throughout the building, accompanied by structural views for context. In Figure 11, the device is shown installed in the second basement, this location serves as the baseline, capturing ground motion as it arrives. Figure 12 displays the ground-floor setup, which enables us to observe how motion is transferred from the building’s base to the superstructure. For the intermediate floors, Figure 13 provides a clear view of how we monitor inter-story drift and evaluate changes in stiffness between levels. On the roof, Figure 14 shows the installation used to track peak lateral displacement and detect any torsional amplification. Lastly, Figure 15 offers a comprehensive structural view, illustrating the exact placement of each sensor within the overall building. With these installations, we can monitor the building’s vertical response from the foundation up to the roof.
Figure 11.
Device Id: 53, second basement floor.
Figure 12.
Device Id: 51, ground floor.
Figure 13.
Device Id 55, ninth floor.
Figure 14.
Device Id: 54, rooftop/south side of the building.
Figure 15.
Device Id 52, rooftop/ north side of the building.
With this setup, it becomes possible to observe how vibration responses, modal properties, and torsional effects change with height in the building.
Prior to this study, the building already featured an SHM system. That system was able to record events like the explosions on 18 and 19 August 2018, as well as the Yalova earthquake (ML 4.5) on 20 December 2018. However, the old system had notable limitations—its processing capacity was insufficient, and accessing the data was difficult. Analysts could only examine the recordings on-site.
In this study, the old equipment was replaced with a comprehensive IoT-based SHM platform, allowing the team to start anew. Now, the entire process—from data collection and storage, to cloud transmission, analysis, and visualization—operates together in real time on a single platform. Additional sensors were installed, and data synchronization and reliability were improved, addressing the shortcomings of the previous system.
The upgraded system proved effective during the 23 April 2025 Istanbul earthquake (ML 6.2), capturing detailed information on how the building reacted. This enabled the team to compare the effects of the 2025 earthquake with those from 2018, including both the explosions and the Yalova event. They tracked how modal parameters and stiffness evolved over time and identified signs of structural fatigue after years of seismic activity. The spatial intensity distribution of the 23 April 2025 Istanbul earthquake, as reported by AFAD, is presented in Figure 16.
Figure 16.
Intensity shake map of the 23 April 2025 earthquake event [18].
The geographical distance between the earthquake epicenter and the monitored building is illustrated in Figure 17.
Figure 17.
Distance between the earthquake epicenter and the monitored building (base map adapted from Google Earth).
In summary, this example demonstrates that IoT-based SHM systems are effective not only for monitoring changes in building behavior over the long term but also for providing fast, dependable assessments after earthquakes. Having records from both earlier and more recent events allows engineers to continuously monitor seismic safety and building performance year after year.
Description of the High-Rise Office Building and Signal Processing
The second field test of the proposed IoT-based SHM system is conducted in a high-rise office building located at the Silicon Valley technology campus in Kocaeli, Türkiye. This structure rises 22 stories and is constructed using a conventional cast-in-place reinforced concrete system. For resisting lateral loads, the design integrates moment-resisting reinforced concrete frames with strategically placed shear walls in both the longitudinal and transverse directions. This dual frame–wall system combines both stiffness and ductility, enhancing the building’s ability to withstand seismic forces.
In the enhanced SHM system, each IoT sensor node collects three-axis acceleration data at a rate of 200 Hz, directly at its installation point on every floor. Sensors are installed in the basement, on the ground floor, a few intermediate stories, and at two locations on the roof. This setup allows us to monitor both the building’s overall lateral movement and any torsional behavior as you move up the structure.
Before beginning modal analysis or searching for damage indicators, we pre-process all acceleration data using a band-pass filter. Each channel is filtered between 0.5 Hz and 5 Hz. This frequency range is chosen to eliminate low-frequency noise from sources like sensor drift or temperature variation, as well as to filter out high-frequency noise and local vibrations that do not correspond to the building’s main global modes. The result is a clean structural response suitable for reliable frequency domain analysis, identifying operational modes, and calculating crucial performance metrics, such as inter-storey drift and roof displacement. The recorded raw acceleration time histories from multiple building levels during the 23 April 2025 Istanbul earthquake are presented in Figure 18.
Figure 18.
Records of earthquake events.
This study zeroes in on one high-rise reinforced concrete office building for field validation, but the SHM architecture and damage algorithm are not limited to just that type.
They are built to work across all kinds of building typologies. The decision framework depends on normalized and relative indicators, frequency ratios, inter-storey drift ratios, torsional irregularity indices, and permanent inclination.
This design lets people use the same system for low-rise residential buildings, mid-rise public buildings, and other structures. All it takes is tweaking sensor placement density and calibrating thresholds based on relevant codes.
4. Results
4.1. Stability of Fundamental Periods in the High-Rise Office
The IoT-based SHM platform was deployed for the first time on a 22-storey reinforced concrete office tower at the Silicon Valley technology campus. Accelerometers were installed in the basement, on several intermediate floors, and on the roof, allowing us to monitor the building’s dynamic response during different seismic events. We performed frequency domain analyses before and after the 30 October 2020 Izmir earthquake. The fundamental frequency decreased slightly, by roughly 0.8%. This is a minimal change, well within the range expected from ordinary environmental or operational fluctuations in tall buildings. Nevertheless, our system detected it, highlighting the sensitivity of our measurement and data processing approach.
During all the events we monitored—whether it was the 2018 explosion incidents, the 2018 Yalova earthquake (ML 4.5), or the 2025 Istanbul earthquake (ML 6.2)—we experienced no data loss. Data acquisition, transmission, and cloud storage all remained intact. The system performed successfully in real-world conditions, during actual seismic activity, demonstrating its reliability for continuous structural monitoring.
Refer to Table 4 to observe how the first-mode frequencies in both the X and Y directions evolved over time. In the X direction, the fundamental frequency ranged from 0.75 to 0.88 Hz during the 2018 events, increased to 1.00 Hz following the Yalova earthquake, and then rose again to 1.07 Hz after the 2025 Istanbul earthquake—a total increase of about 42%. In the Y direction, frequencies varied between 0.79 and 0.90 Hz in 2018, dropped to 0.73 Hz after Yalova, and then climbed to 0.98 Hz in 2025, resulting in an overall increase of 24%. These long-term variations are significant. They underscore the importance of ongoing monitoring, as gradual changes in stiffness, environmental effects, and structural interventions all influence the building’s performance over its lifetime.
Table 4.
Frequencies of the building according to events.
Table 4 lays out the building’s dominant modal frequencies in both X and Y directions for different recorded events. Looking at the older 2018 data—explosion and Yalova earthquake—the frequencies mostly sit between 0.43 and 0.57 Hz. The 20 December 2018 Yalova earthquake stands out because both X and Y directions hit exactly 0.4375 Hz. That kind of match hints at a steady, uniform dynamic response across the building for that event.
Jump to the 23 April 2025 Istanbul earthquake (ML 6.2), and things change. The frequencies climb to 0.69 Hz in X and 0.697 Hz in Y. That is a big shift. If you compare it to the lowest 2018 numbers, you are looking at a 53% jump in X (from 0.4522 to 0.69) and a 62% increase in Y (from 0.4309 to 0.697). On top of the sheer size of the change, the near-perfect match between X and Y in 2025 (0.69 and 0.697 Hz) shows that the results are internally consistent—solid ground for monitoring down the line.
But it is important to take the 2018 data with a grain of salt. These are short recordings from years ago, and the details about how they were collected are not all clear, so you cannot really stack them up directly against the new monitoring data. It makes more sense to use them as a rough backdrop, not as strict benchmarks for calculations. The real insights will come from ongoing, long-term monitoring. When you gather lots of well-documented earthquake and ambient vibration records over time, you can really start to see how the building’s stiffness changes—pick out what is just temporary noise and what might show actual damage, recovery, or even strengthening. That is where the data will tell the full story.
4.2. Inter-Storey Drift, Roof Displacement, and Torsional Behavior
We determined inter-storey drift ratios and roof displacements by double-integrating the acceleration records. Table 5 presents the maximum roof displacements. The building’s roof experienced 4 cm movement in the Y direction and 15.8 cm in the X direction, both comfortably within the drift and displacement limits specified by the Turkish Seismic Code (TBDY-2018). The inter-story displacement distribution along the building height is illustrated in Figure 19. This indicates that the building remained elastic throughout the 2025 Istanbul earthquake.
Table 5.
Maximum displacements—roof level.
Figure 19.
The inter-storey displacement distribution along the height.
The frequency results from the two roof accelerometers were consistent with each other and matched the building’s anticipated modal characteristics. This agreement supports the accuracy and timing of our recorded data.
To assess torsional behavior at the roof level, we compared lateral displacements from the two sensor locations. We observed torsional rotation corresponding to 4 cm (Y) and 14.8 cm (X) of differential displacement. However, after normalizing these by the TBDY-2018 torsional irregularity coefficient, the resulting values stayed below the 1.2 threshold. Therefore, the roof did not exhibit any torsional irregularity.
4.2.1. Roof-Level Assessment
During the 2025 Istanbul earthquake, roof-level accelerometers provided essential data on the overall movement of the building. The results are clear: the roof displaced 4 cm in the Y direction and 15.8 cm in the X direction (see Table 4). Both values are comfortably below the maximum limits specified by TBDY-2018 for high-rise reinforced concrete buildings, indicating that the structure remained within its elastic range.
When we compared the modal parameters from each roof sensor, they showed close agreement and matched the expected first-mode response. This indicates that the sensors were well-synchronized and our signal processing was effective.
To assess torsional behavior, we analyzed the difference in displacement between the two roof accelerometers. The torsional component measured 4 cm (Y) and 14.8 cm (X). After normalizing these using the torsional irregularity coefficient from TBDY-2018, the results remained below the 1.2 threshold. Therefore, the roof did not exhibit any torsional irregularity during the earthquake.
4.2.2. Ninth Floor Assessment
On the ninth floor, the inter-storey drift measured 4.8 cm in the Y direction and 6.1 cm in the X direction. Both values remain within the drift limits specified by TBDY-2018. The modal parameters recorded by the floor accelerometer were consistent with those observed on the roof and other floors, supporting the idea that the building’s dynamic behavior remains stable throughout its height.
However, with only a single accelerometer installed on this floor, it is not possible to reliably assess torsional irregularity. Accurately capturing the twisting motion of the floor requires multiple sensors operating together. This is a clear limitation in the current instrumentation arrangement. The maximum displacement values for the roof and ninth floors are summarized in Table 6.
Table 6.
Maximum displacements—roof and ninth floor.
4.2.3. Ground Floor Assessment
Ground floor displacement demands remained much lower than those observed in the upper stories—just 0.2 cm in the Y direction and 1.3 cm in X. This is consistent with the building’s stiff-base response. When we examined frequency estimates from the ground floor, they did not match those obtained higher up. The main reason for this is increased ambient noise, weaker motion, and a lower signal-to-noise ratio at the ground level. As a result, we excluded the ground floor data from the comparative modal analysis. The combined displacement results for roof, ninth, and ground floors are summarized in Table 7.
Table 7.
Maximum displacements—roof, ninth, and ground floors.
4.2.4. Overall Evaluation of Drift and Torsion
Here is what the data reveals across all monitored floors. The building remained comfortably within the inter-storey drift and roof displacement limits specified by TBDY-2018. There was no significant change in natural period, and the modal shapes stayed consistent, showing no evidence of degradation. Torsional irregularity was never observed; the torsion coefficient stayed under 1.2 throughout. Tilt sensors detected almost no permanent tilt—around 0.01%—indicating that the structure did not experience any lasting deformation.
Taken together, these findings place the building at risk level 0. In other words, the damage assessment algorithm found no evidence of damage.
These results also underscore an important point: the building’s dynamic properties can shift due to weather, changing loads, or simply over time. Significant changes in modal parameters usually occur following strong earthquakes. This is why long-term structural health monitoring is so valuable. It can detect changes in stiffness and help identify the earliest signs of damage or effects of retrofitting.
4.3. Field Deployment Final Results: Event-Level Performance Summary from Silicon Valley
In this study, we built a web-based interface that quickly sums up how a structure responds after dynamic events, like earthquakes. It takes sensor data as events unfold, runs them through an automated workflow, and puts the most important performance indicators—things like period stability, column curvature, top-storey displacement, inter-storey drift, and torsional response—together on one dashboard. You also get instant report generation, all in the same place. This system creates a reliable, repeatable way to document what happens after an event, speeding up decisions for teams out in the field.
Take Figure 20, for example. It shows what the interface displays for the Vadi Ofis building at the Silicon Valley site during the 23 April 2025 Silivri earthquake (ML 6.2). The dashboard brings together event peak values and before-and-after similarity metrics, so you get an immediate, automated summary of how the structure performed—making it much easier to interpret the building’s response right after the quake.
Figure 20.
Example of the event-based performance dashboard generated by the Silicon Valley web-based structural health monitoring platform for the Valley Office building (2018, conventional construction, concrete shear walls, height: ~70 m).
On 23 April 2025, when that 6.2 earthquake hit Silivri, we were monitoring the Silicon Valley building using our online SHM system. The event dashboard gave it a 10/10 for overall performance, saying it was healthy. That means the building’s response stayed within the limits we set.
The system checks how stable the building is by looking at how it vibrates before and after the quake. The main frequency was about 0.69 Hz, which is about 1.45 s before and 1.44 s after—basically no change. The column curvature also stayed the same, around 1.5708 rad.~90 degrees.
The highest values recorded were a top-storey displacement of 15.8 cm (X) and 8.0 cm (Y) and a storey drift of 14.8 cm (X) and 4.8 cm (Y). The torsional behavior plot indicates the building twisted consistently across all floors, but it was still within the safe zone.
5. Discussion
Field deployment shows that the proposed IoT-based SHM platform reliably captures how buildings respond to earthquakes and delivers data that actually helps with decisions after an event. It has been running for years without losing data, even when communication drops out or the weather turns rough. That says a lot about how tough the edge-to-cloud setup is in the real world.
The damage assessment algorithm skips absolute thresholds and does not lean on detailed building-specific models. Instead, it uses normalized indicator frequency ratios, relative inter-storey drift, torsional irregularity indices, and permanent inclination changes. That keeps the system flexible. Different building types; different heights—it adapts. There is no need for heavy calibration for each building, and it stays in line with seismic codes. That is what makes it scalable.
This framework is not here to replace top-tier SHM techniques, like operational modal analysis, with dense sensor arrays, finite element updating, or machine learning. Sure, those methods are sensitive and powerful in controlled settings, but they rarely scale well after a major quake. They demand a lot of data and heavy computing, and their results are not always clear for first responders in the field. The system here is built for speed, clarity, and reliability. Within seconds of an earthquake, it can deliver automated risk classification without waiting around.
As for displacement and inter-storey drift, when you estimate them by double-integrating acceleration signals, you run into drift. That is a known issue. In this study, those values serve as relative indicators, not precise measurements. The data gets pre-processed to cut down drift. The real goal is not to pin down every structural detail but to give fast, useful information to support decisions right after an earthquake.
One more thing about those frequency comparisons between 2018 and 2025—they are not direct signs of damage. The 2018 data came from a basic acquisition setup, while the 2025 records used the full IoT system.
In the end, the results make it clear: scalable IoT-based SHM systems really can cut through uncertainty after earthquakes. By moving from isolated, research-only deployments to standardized, always-on infrastructure, these systems can back up traditional inspections and do a lot to boost resilience in earthquake-prone areas.
5.1. Interpretation of Long-Term Frequency Variations
The shift in dominant modal frequencies from 2018 to 2025 is not as simple as it seems. Modal frequency is influenced by more than just structural stiffness. Factors like boundary conditions, how mass is distributed, environmental variations, and even our data collection methods all contribute.
In 2018, our data acquisition was short-term and limited. The specifics of signal processing were unclear, sensor specifications were not documented, and timing or synchronization details were unknown. Since 2025, we have been using a fully synchronized IoT-based setup with 24-bit ADCs, precise GPS/PPS time synchronization, and uniform filtering methods.
As a result, some frequency differences are simply due to improved data cleaner signals, better sensor placement, and reduced noise. It is not entirely about the structure becoming stiffer or weaker.
Also, higher frequencies do not necessarily signal structural damage. In reinforced concrete buildings, frequencies can rise because of non-structural stiffening, partition walls adding rigidity, changes in the interaction between the building and soil, or shifts in mass distribution over time.
That is why we consider the 2018 data as a rough historical context rather than a strict baseline. Our main priority now is monitoring long-term trends, which really begins with the more consistent instrumentation and methodology introduced in 2025.
5.2. Comparison with State-of-the-Art SHM Approaches
Most state-of-the-art SHM research focuses on data-driven or model-based approaches for damage detection. The recent literature is full of operational modal analysis, machine learning classifiers, and finite element model updating. These techniques perform well under controlled conditions, with high sensitivity and notable outcomes. But when applied to the unpredictable environment of a post-earthquake city, challenges emerge: extensive data requirements, significant computational demands, and outputs that are difficult for decision-makers to interpret.
This new framework changes the approach. It is designed for real-time response, clarity, and decision-making that aligns with established codes. Rather than replacing advanced SHM tools, it complements them, providing fast, straightforward risk categorization. The aim is to support emergency teams and officials in managing large building stocks when time is of the essence.
5.3. Limitations of the Proposed System
The results are encouraging, but there are several key limitations to consider. First, sensor density in this case study is quite low. This limits the system’s ability to capture every vibration mode in detail or provide a high-resolution view for complete modal identification. It is mainly intended to monitor the overall structural behavior, not to detect local damage with high accuracy.
Second, displacement and inter-storey drift values are obtained through double integration of acceleration signals. Although baseline correction and filtering were applied, there remains a risk of integration drift, especially during longer events. This introduces some uncertainty into the measurements.
Third, frequency shifts are not always indicative of damage. They can be caused by changes in environmental conditions or varying operational states. The multi-parameter decision framework helps mitigate this risk, but some level of uncertainty will always be present.
Lastly, this SHM platform is not designed to replace comprehensive structural inspections or detailed model-based analyses. It should be seen as a rapid screening and decision support tool, particularly valuable for quickly evaluating many buildings after an earthquake.
6. Conclusions
This study presents the design, deployment, and real-world evaluation of a scalable IoT-enabled structural health monitoring system developed for rapid post-earthquake assessments of buildings. The system integrates multiple sensor-equipped edge devices, on-site real-time signal processing, reliable communication infrastructure, and a cloud-based analytics platform for storing, visualizing, and analyzing structural response data.
When implemented on a 22-storey reinforced concrete office tower, the system recorded detailed seismic vibrations, computed modal parameters, monitored inter-storey drift and torsion, and detected persistent changes in inclination. Across all observed seismic events—including the 2025 Istanbul earthquake—the building remained within elastic limits and did not exceed any code-defined thresholds. Through our multi-stage risk algorithm, the building’s status was classified as risk level 0, indicating no visible or hidden damage.
A field test on a high-rise reinforced concrete building proved that the system runs reliably over the long haul, with no data loss. It did not just keep working—it caught how the structure reacted to earthquakes and tracked changes in its dynamic properties over time. These results show that IoT-based SHM systems, when they run nonstop, really help cut down on uncertainty after an earthquake. They do not replace traditional visual inspections, but they add a valuable layer that makes post-event evaluations more complete.
In conclusion, our SHM platform demonstrates that cost-effective MEMS sensors, contemporary IoT technologies, and automated damage detection algorithms can combine to form a viable, scalable solution for post-earthquake safety evaluations. Fast, data-driven assessments reduce pressure on inspection teams, enhance resilience, and contribute to safer cities.
7. Future Works
7.1. Digital Twin Integration
Looking forward, the next phase involves linking the proposed SHM system directly to numerical digital twin models. This enables us to evaluate a building’s structural state nearly in real time. The digital twin, which continually updates itself using live sensor data, provides a physics-based perspective on how the building’s behavior evolves over time. By aligning real-world response measurements—such as modal frequencies, damping ratios, inter-storey drift, roof displacement, and torsional effects—with finite element models, we can automatically refine the models, address uncertainties, and detect stiffness degradation much more precisely.
This arrangement goes beyond simple monitoring. It also allows us to perform scenario-based predictions. The digital twin can simulate how the building would react to future earthquakes or as-yet-unseen environmental loads. Such predictive capabilities help us schedule maintenance, plan retrofits, and ensure smooth operations. Furthermore, by integrating the digital twin with machine learning-driven anomaly detection, we can further improve our ability to distinguish between benign environmental influences and genuine structural issues. Ultimately, incorporating digital twins transforms the SHM system into something much more advanced—a platform for informed decision-making and enhanced resilience, rather than just another tool for data collection.
7.2. Large-Scale Deployment and Network Optimization
As SHM expands from limited pilot programs to full-scale citywide or national networks, it ensures that smooth operation becomes a significant challenge. Overseeing thousands of sensor nodes deployed throughout a wide variety of buildings—each streaming acceleration and tilt data—calls for a more intelligent management strategy.
The next steps focus on efficient ways to handle this growing array of devices. Attention turns to developing data routing and prioritization methods that can withstand high-stress situations. When an earthquake occurs, and every sensor transmits data simultaneously, the system must control bandwidth usage, minimize delays, and guarantee that critical information arrives at the cloud reliably. Leveraging edge computing is particularly valuable in this context. If sensors can filter out irrelevant data, detect key events, and compress transmissions, they prevent the cloud and network from becoming overwhelmed.
Scaling up also involves fundamental tasks—automating the onboarding of new devices, deploying firmware updates, monitoring system health, and ensuring strong security. Strategically placing sensors, considering each building’s design, risk profile, and available funds, helps cities and organizations deploy SHM networks cost-effectively. With more effective network strategies, SHM systems can move beyond individual buildings to span entire cities, enabling resilience monitoring on a much larger scale.
Author Contributions
Conceptualization, V.E. and A.C.Z.; methodology, V.E.; software, V.E.; validation, V.E. and A.C.Z.; formal analysis, V.E.; investigation, V.E.; resources, A.C.Z.; data curation, V.E.; writing—original draft preparation, V.E.; writing—review and editing, V.E. and A.C.Z.; visualization, V.E.; supervision, V.E.; project administration, V.E.; funding acquisition, V.E. All authors have read and agreed to the published version of the manuscript.
Funding
This research received no external funding. The Article Processing Charge (APC) was covered by the corresponding author.
Data Availability Statement
The acceleration and displacement datasets generated and analyzed during the current study are not publicly available due to building owner confidentiality and security considerations but are available from the corresponding author upon reasonable request. Processed data supporting the findings of this study are included within the article.
Conflicts of Interest
The authors declare no conflict of interest.
References
- Cremen, G.; Baker, J.W. Quantifying the benefits of building instruments to FEMA P-58 rapid post-earthquake damage and loss predictions. Eng. Struct. 2018, 176, 243–253. [Google Scholar] [CrossRef] [Scilit]
- You, T.; Wang, W.; Fang, C.; Chen, Y. Rapid probabilistic loss assessment of buildings based on post-earthquake structural deformation conditions. J. Build. Eng. 2022, 45, 103629. [Google Scholar] [CrossRef] [Scilit]
- Lim, J.S.; Cruz, H.; Pourhomayoun, M.; Mazari, M. Application of IoT for concrete structural health monitoring. In Proceedings of the 2018 International Conference on Computational Science and Computational Intelligence, CSCI 2018, Las Vegas, NV, USA, 12–14 December 2018; pp. 1479–1482. [Google Scholar] [CrossRef] [Scilit]
- Strateji ve Bütçe Başkanlığı. 2023 Kahramanmaraş ve Hatay Depremleri Raporu. K.MARAŞ, Mar. 2023. Available online: https://www.sbb.gov.tr/wp-content/uploads/2023/03/2023-Kahramanmaras-ve-Hatay-Depremleri-Raporu.pdf (accessed on 25 February 2026).
- Rahita, A.C.; Zaki, A.; Nugroho, G.; Yadi, S. Internet of Things (IoT) in Structural Health Monitoring: A Decade of Research Trends. Instrum. Mes. Metrol. 2024, 23, 123–139. [Google Scholar] [CrossRef] [Scilit]
- Muttillo, M.; Stornelli, V.; Alaggio, R.; Paolucci, R.; Di Battista, L.; de Rubeis, T.; Ferri, G. Structural Health Monitoring: An IoT Sensor System for Structural Damage Indicator Evaluation. Sensors 2020, 20, 4908. [Google Scholar] [CrossRef] [Scilit]
- Hassan, M.; Nassr, A.; Mohammed, U.S.; Abdelraheem, M. An IoT based Structural Health Monitoring System for Critical Infrastructures. In Proceedings of the in 2021 IEEE Global Conference on Artificial Intelligence and Internet of Things, GCAIoT 2021, Dubai, United Arab Emirates, 12–16 December 2021; pp. 130–135. [Google Scholar] [CrossRef] [Scilit]
- Zhang, Y.; Wu, H.; Yi, L.; Luo, B.; Qiu, Y.; Tang, F. Reinforcement learning-based IoT sensor scheduling strategy for bridge structure health monitoring. In Proceedings of the 2022 IEEE International Conferences on Internet of Things (iThings) and IEEE Green Computing & Communications (GreenCom) and IEEE Cyber, Physical & Social Computing (CPSCom) and IEEE Smart Data (SmartData) and IEEE Congress on Cybermatics (Cybermatics), Espoo, Finland, 22–25 August 2022; pp. 93–100. [Google Scholar] [CrossRef] [Scilit]
- Atencio, E.; Komarizadehasl, S.; Lozano-Galant, J.A.; Aguilera, M. Using RPA for Performance Monitoring of Dynamic SHM Applications. Buildings 2022, 12, 1140. [Google Scholar] [CrossRef] [Scilit]
- Yesilyurt, A.; Akram, M.R.; Zulfikar, A.C. Assessment of engineering demand parameters through SHM for RC-structures. J. Civ. Struct. Health Monit. 2019, 9, 253–261. [Google Scholar] [CrossRef] [Scilit]
- Sivasuriyan, A.; Vijayan, D.S.; Devarajan, P.; Stefańska, A.; Dixit, S.; Podlasek, A.; Sitek, W.; Koda, E. Emerging Trends in the Integration of Smart Sensor Technologies in Structural Health Monitoring: A Contemporary Perspective. Sensors 2024, 24, 8161. [Google Scholar] [CrossRef] [Scilit]
- Dagsever, F.; Khodaei, Z.S.; Aliabadi, M.H.F. WSN-Based Multi-Sensor System for Structural Health Monitoring. Sensors 2025, 25, 4407. [Google Scholar] [CrossRef] [Scilit] [PubMed]
- Cakir, F.; Acar, V.; Zulfikar, A.C.; Tutar, A.I. A novel strengthening process for masonry tower-type structures with irregular geometry using carbon fiber composite ropes. Bull. Earthq. Eng. 2025, 23, 5625–5664. [Google Scholar] [CrossRef] [Scilit]
- Aras, F. Monitoring the dynamic properties of a reinforced concrete building through its seismic strengthening. Measurement 2023, 216, 112907. [Google Scholar] [CrossRef] [Scilit]
- Aras, F.; Çatbaş, F.N. Monitoring the changes in the dynamic properties of an RC building experiencing column loss. J. Civ. Struct. Health. Monit. 2024, 14, 1257–1274. [Google Scholar] [CrossRef] [Scilit]
- Occhipinti, G.; Iacono, F.L.; Tusa, G.; Costanza, A.; Fertitta, G.; Lodato, L.; Macaluso, F.; Martino, C.; Mugnos, G.; Oliva, M.; et al. Shake Table Tests on Scaled Masonry Building: Comparison of Performance of Various Micro-Electromechanical System Accelerometers (MEMS) for Structural Health Monitoring. Sensors 2025, 25, 1010. [Google Scholar] [CrossRef] [Scilit]
- Ministry of Environment and Urbanization. Turkish Building Earthquake Code (TBDY-2018). Ankara, Turkey; 2018. Report. Available online: https://www.resmigazete.gov.tr/eskiler/2018/03/20180318M1-2-1.pdf (accessed on 25 February 2026).
- Ministry of the Interior DAEMP. Marmara-Denizi-Depremi Ön Değerlendirme Raporu. 2025. Report. Available online: https://deprem.afad.gov.tr/assets/pdf/marmara-denizi-depremi.pdf (accessed on 24 February 2026).
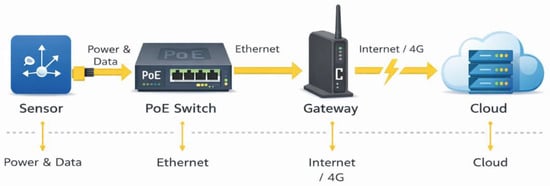
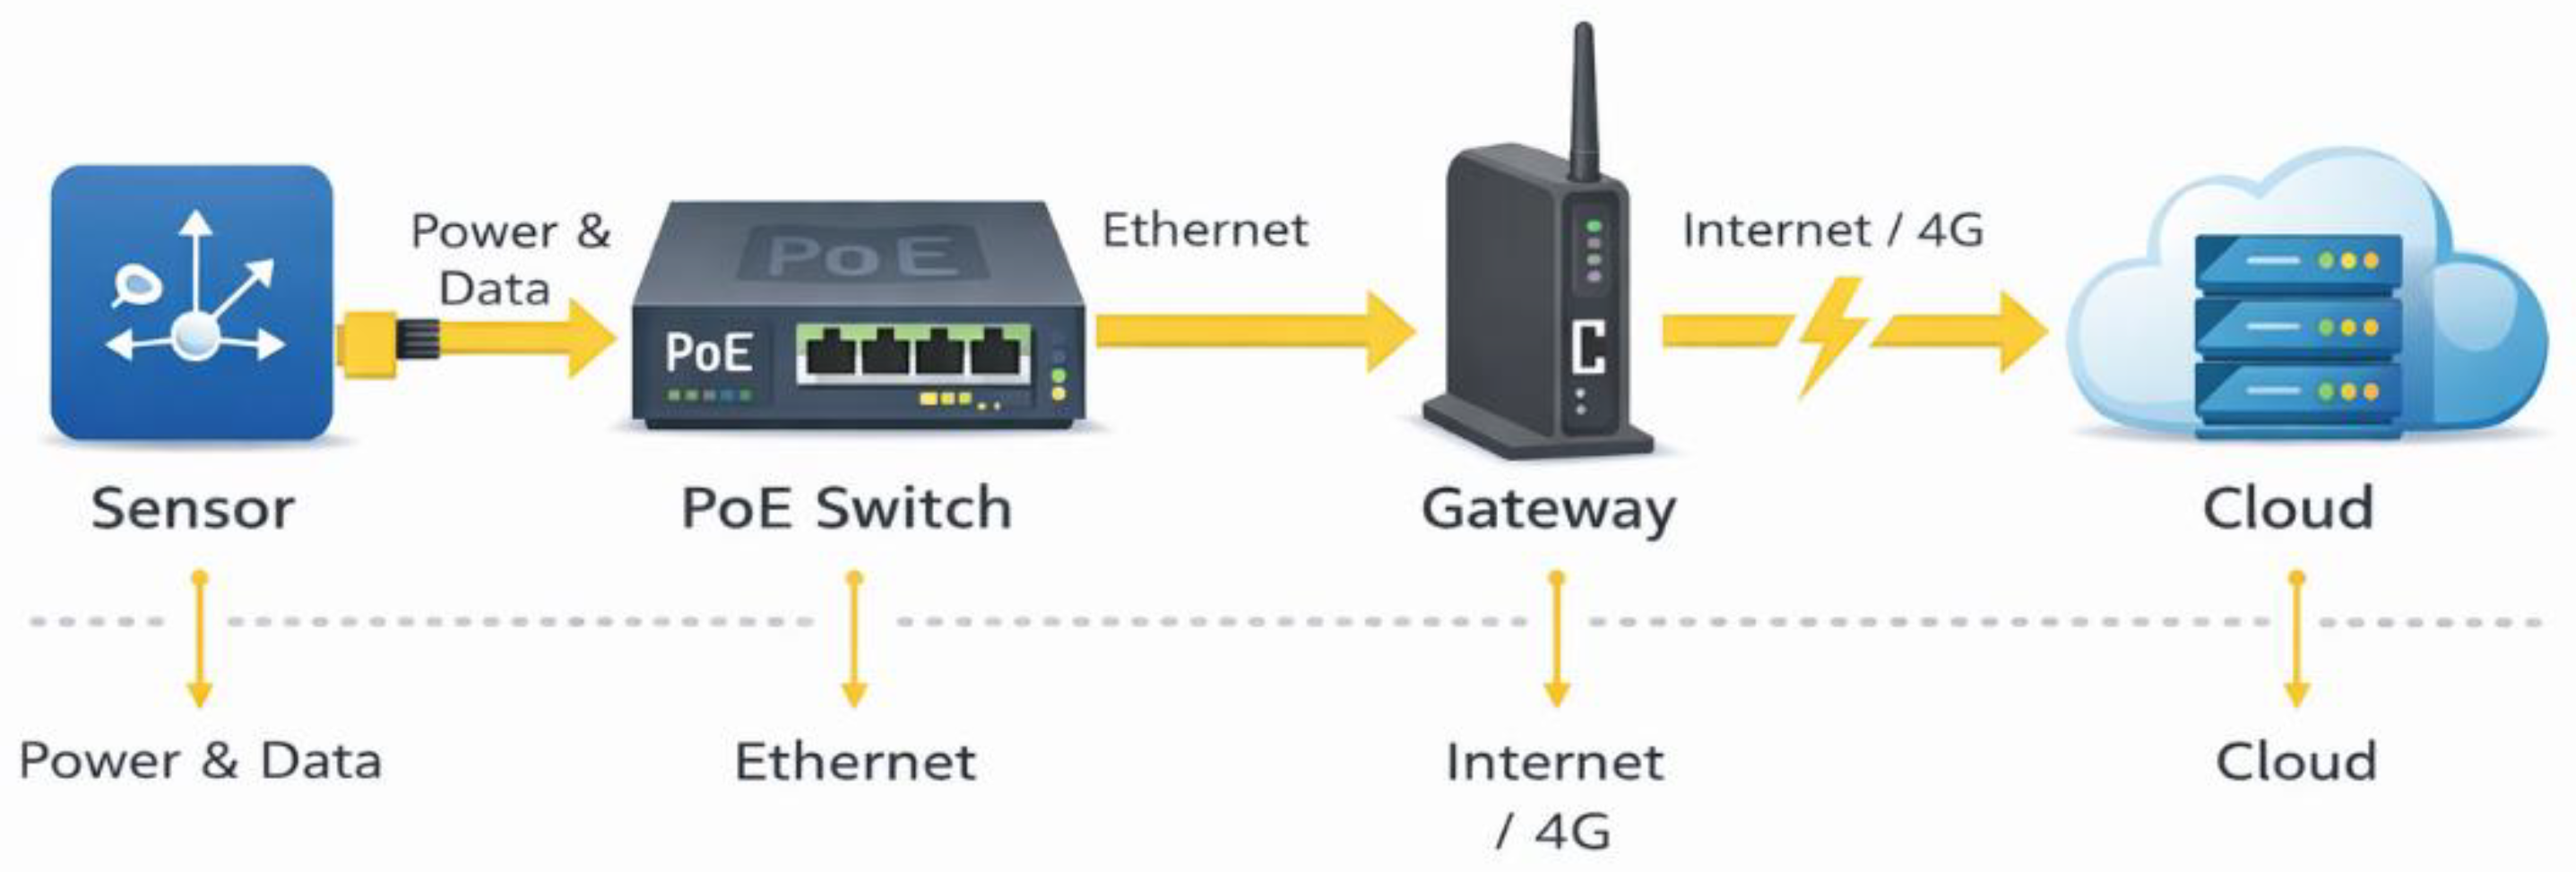
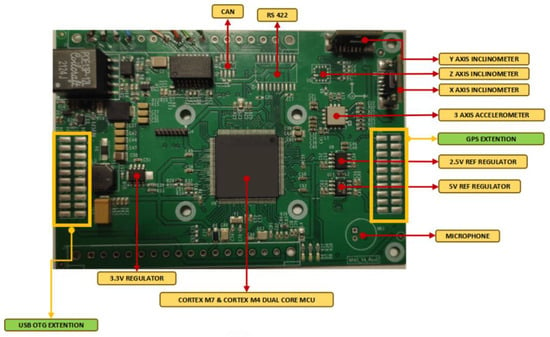
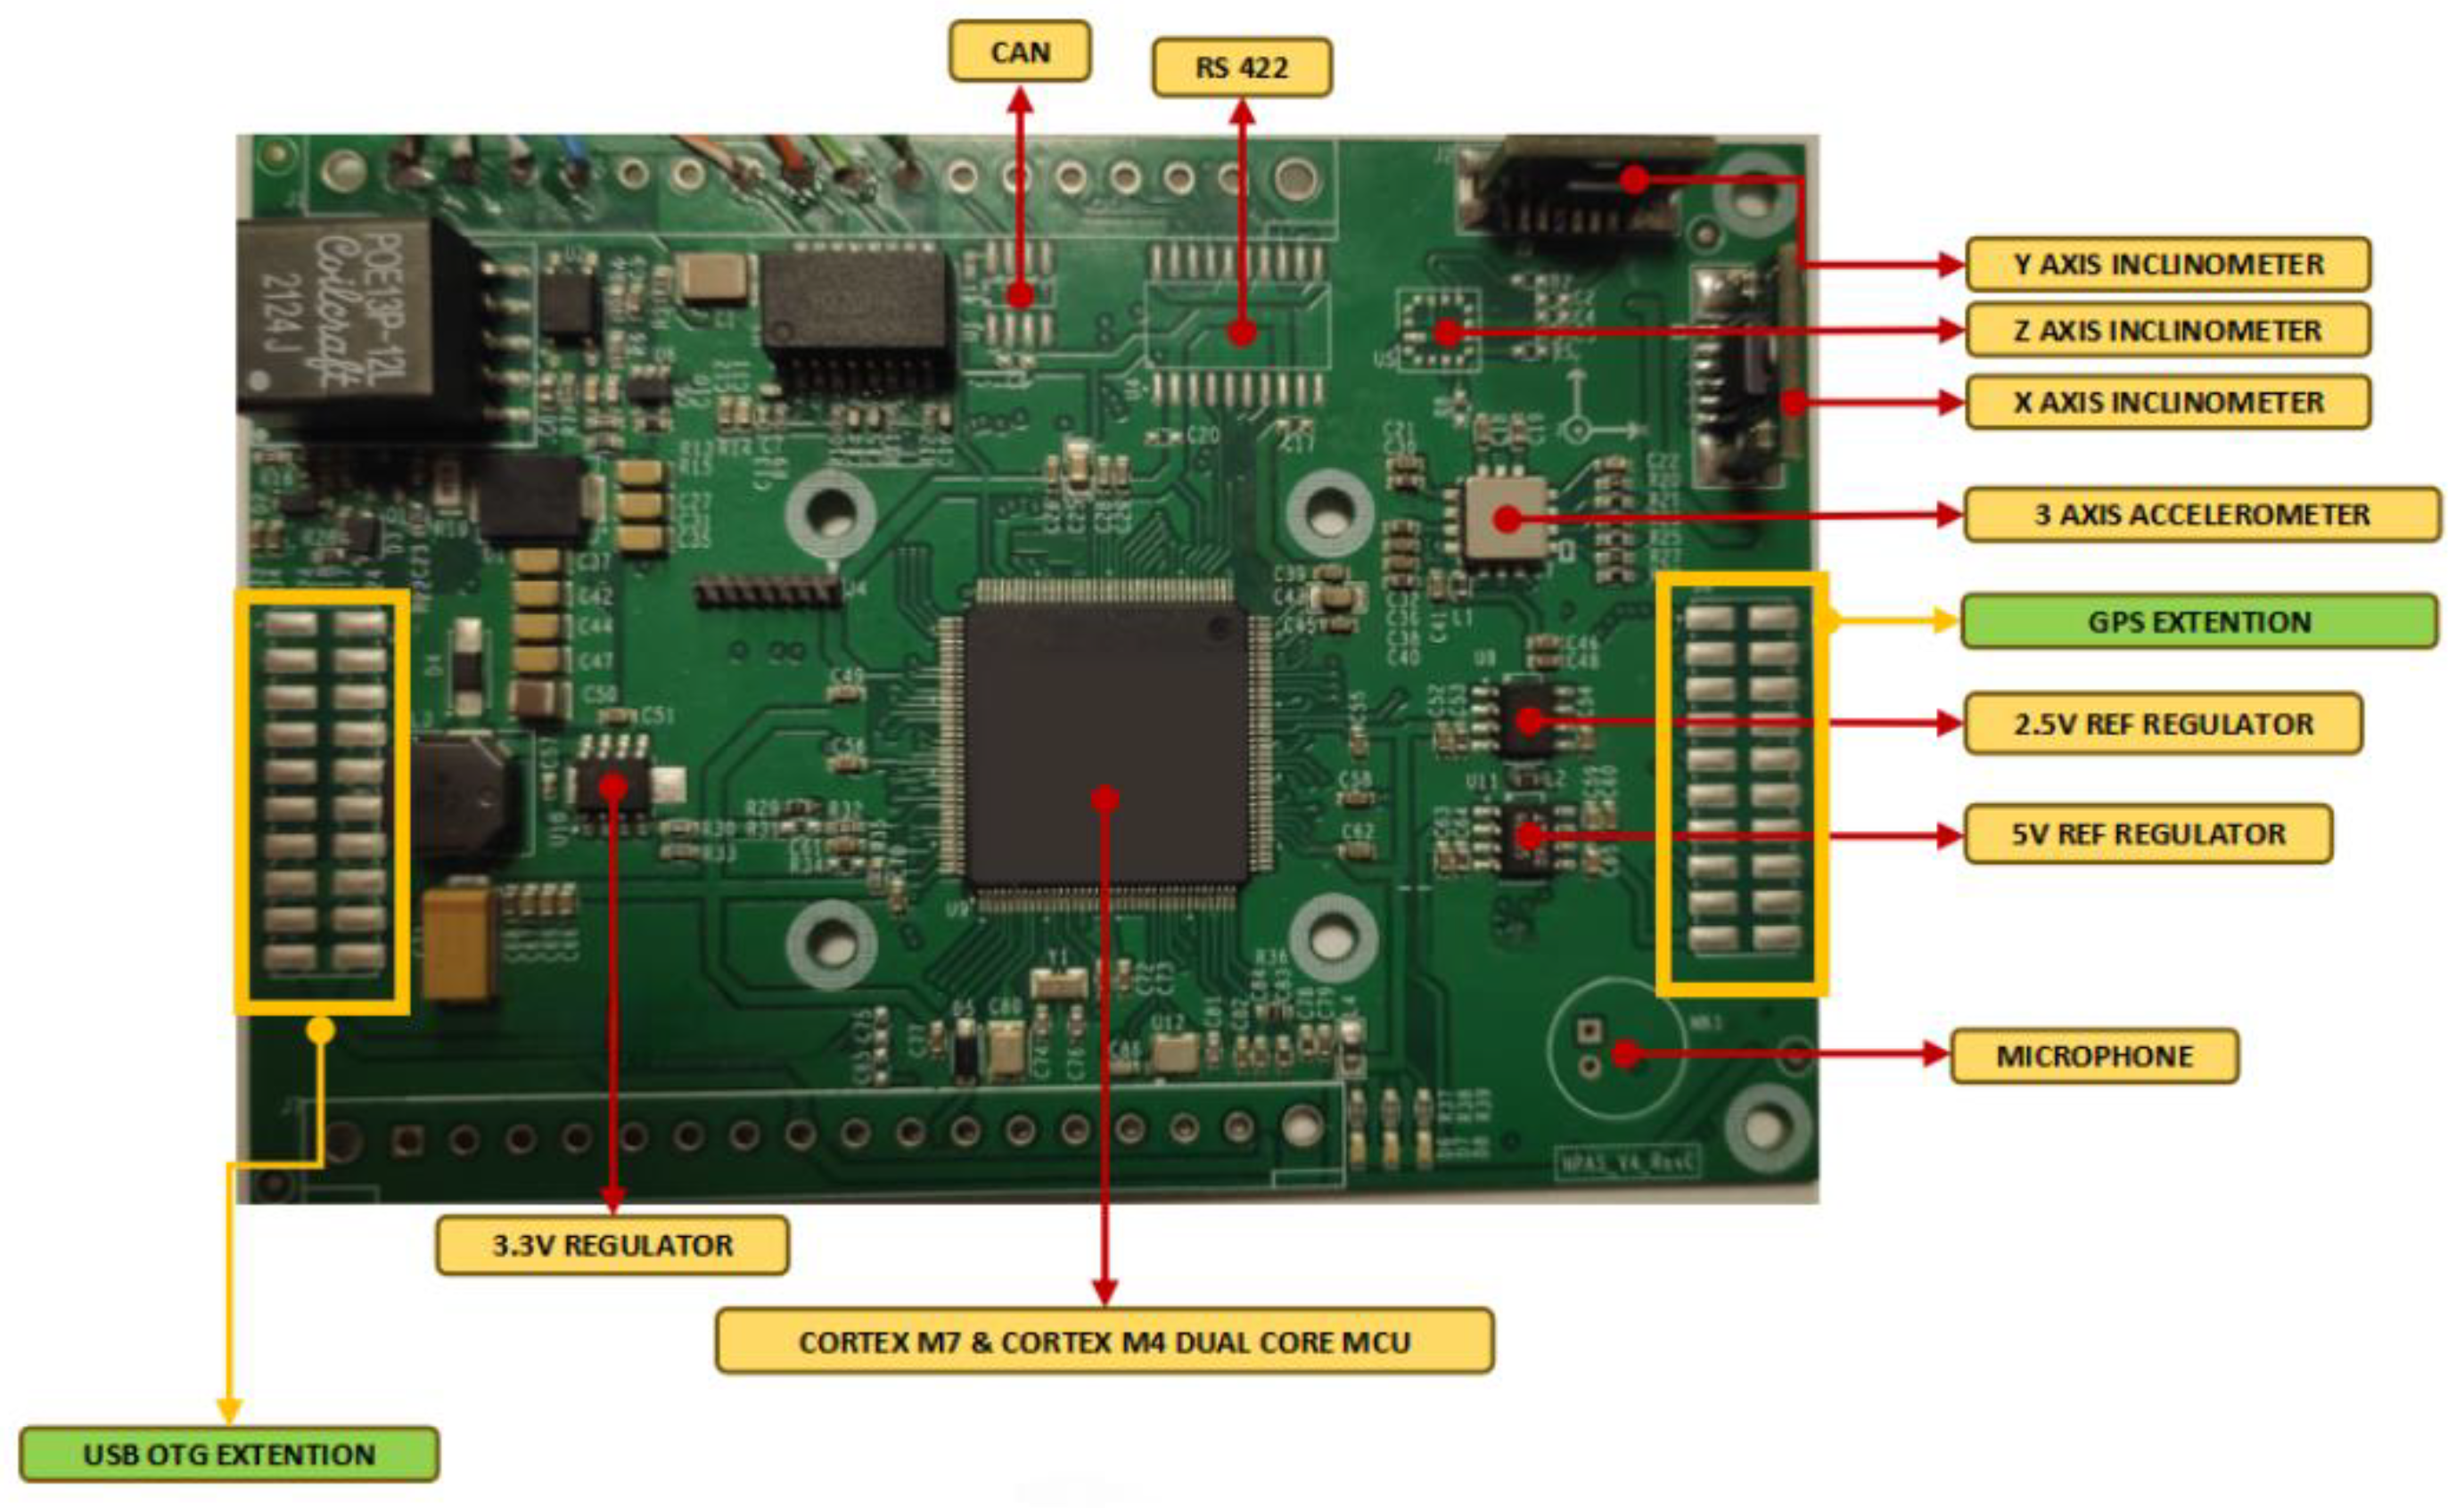
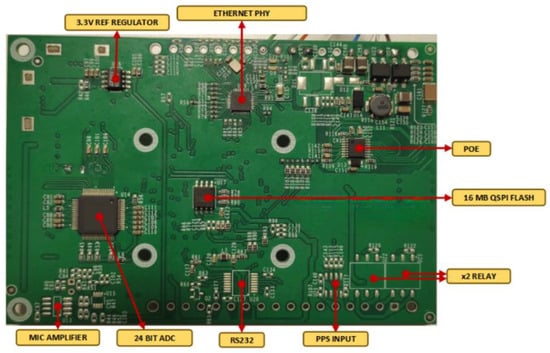
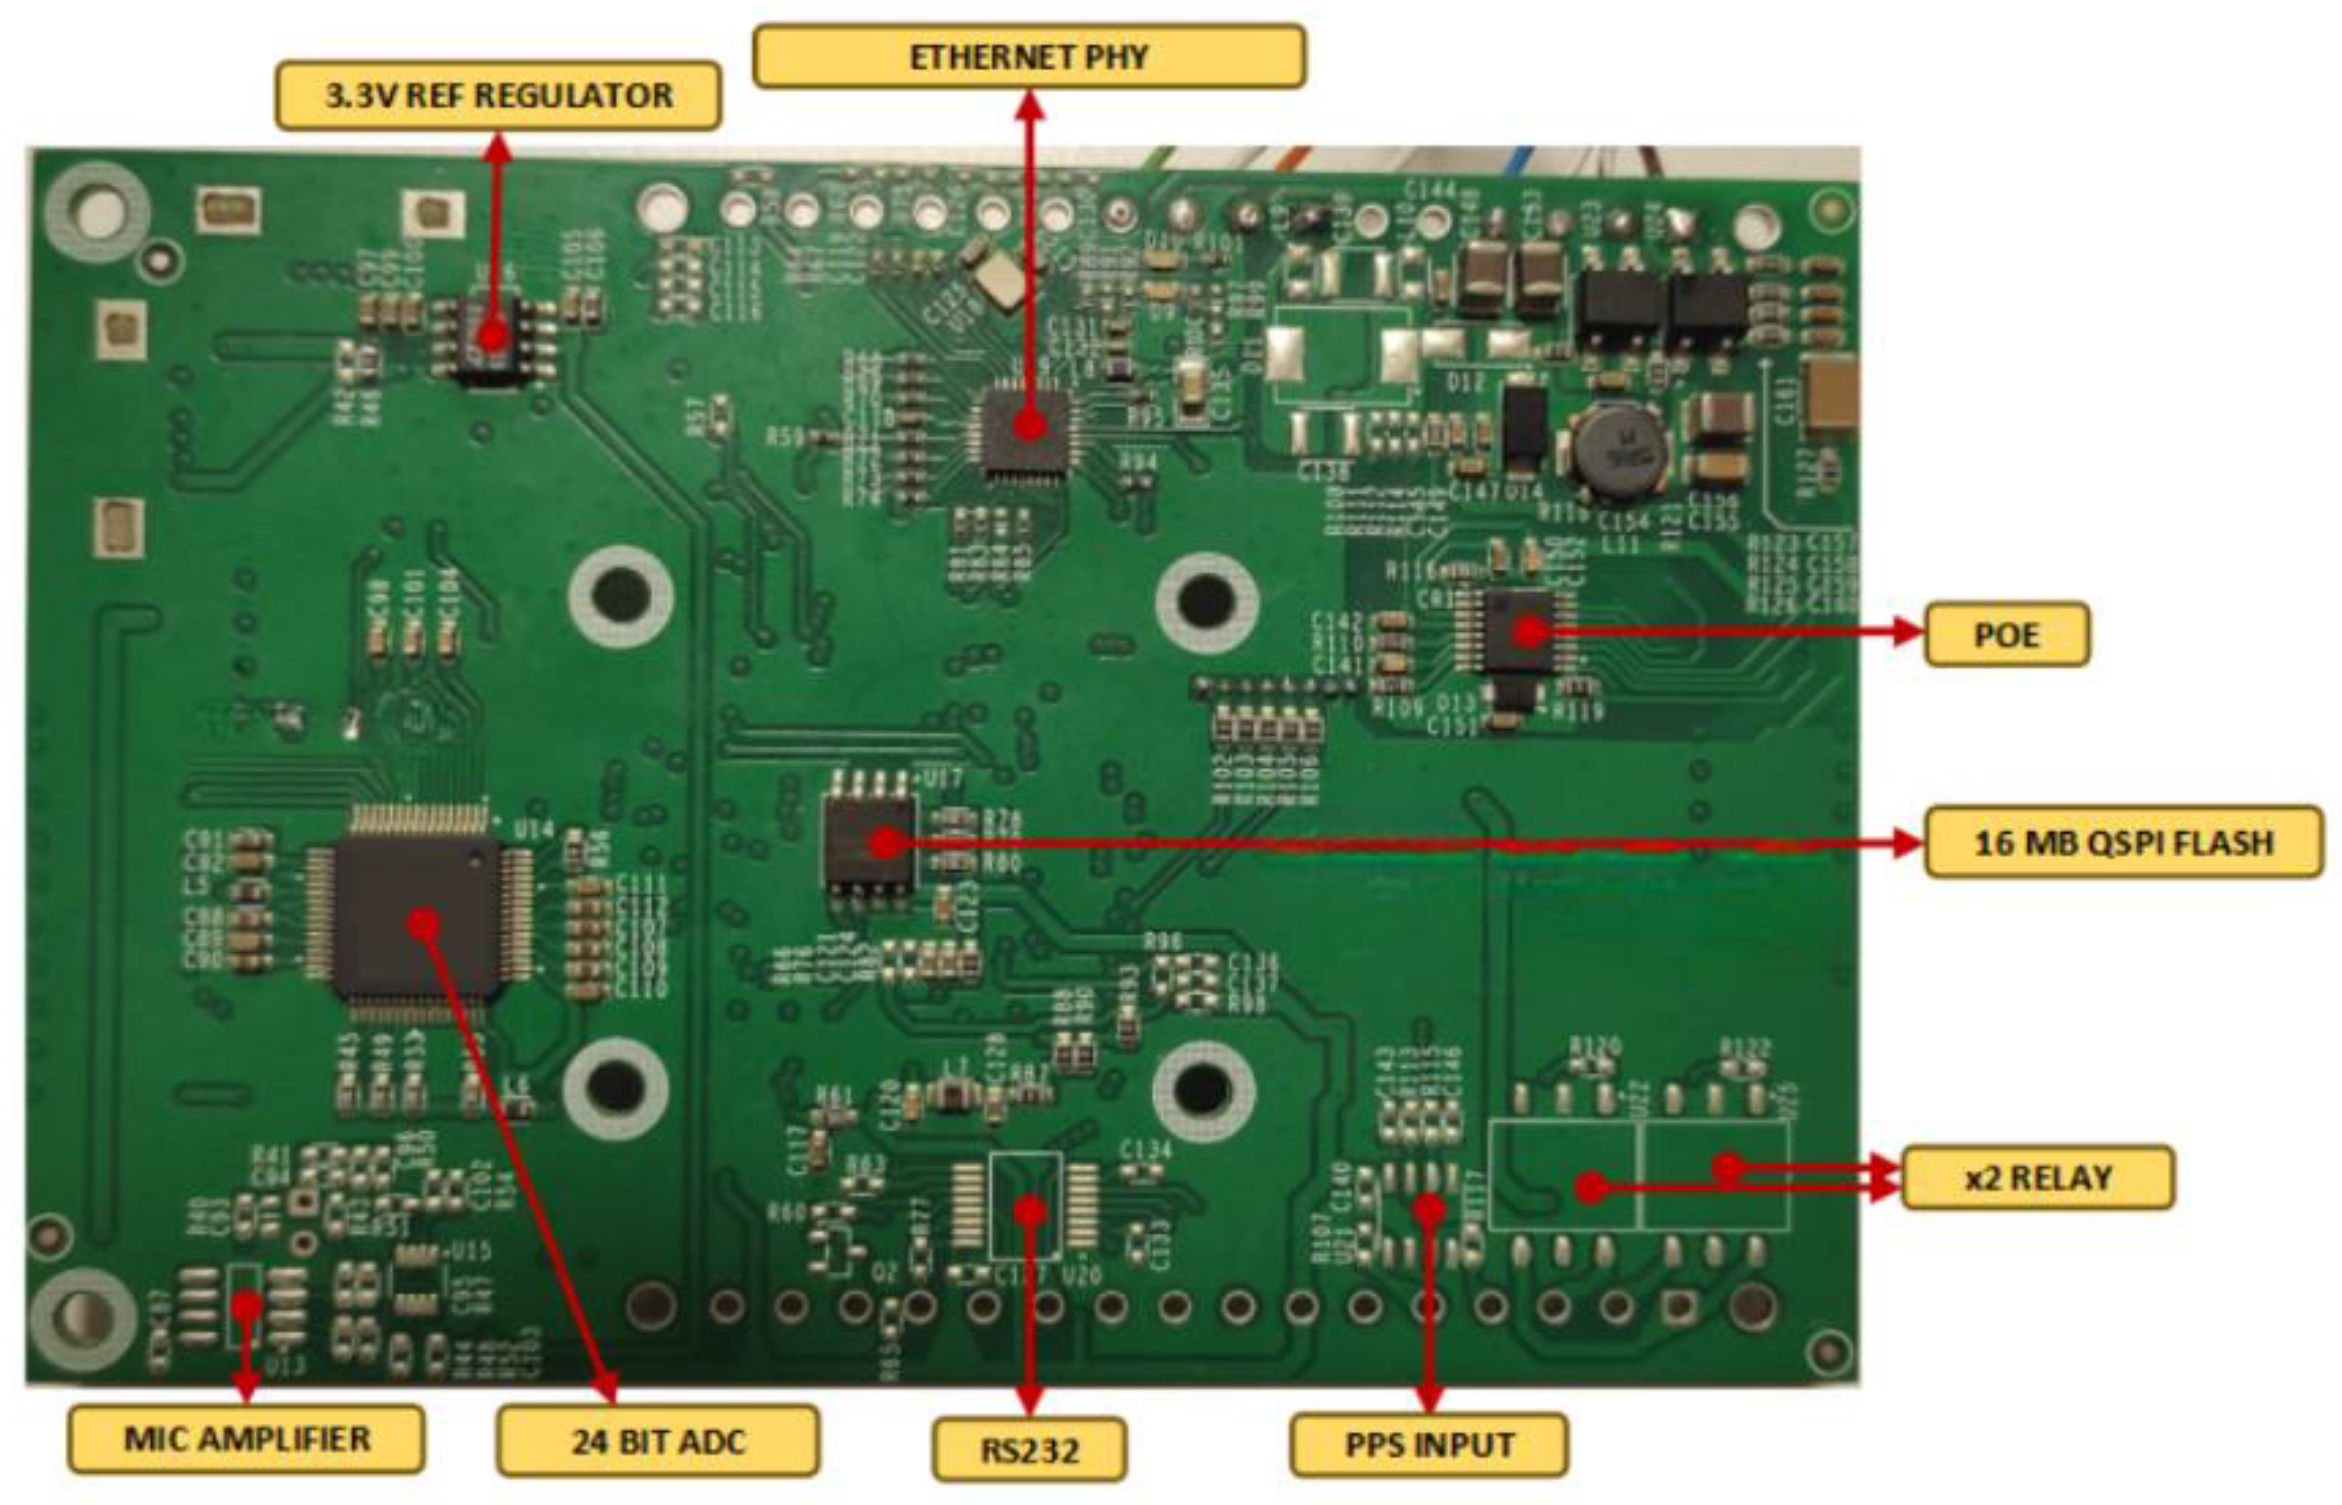
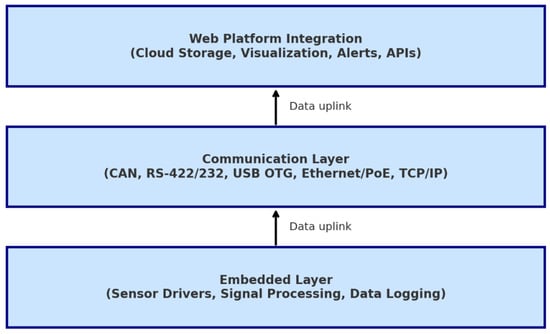
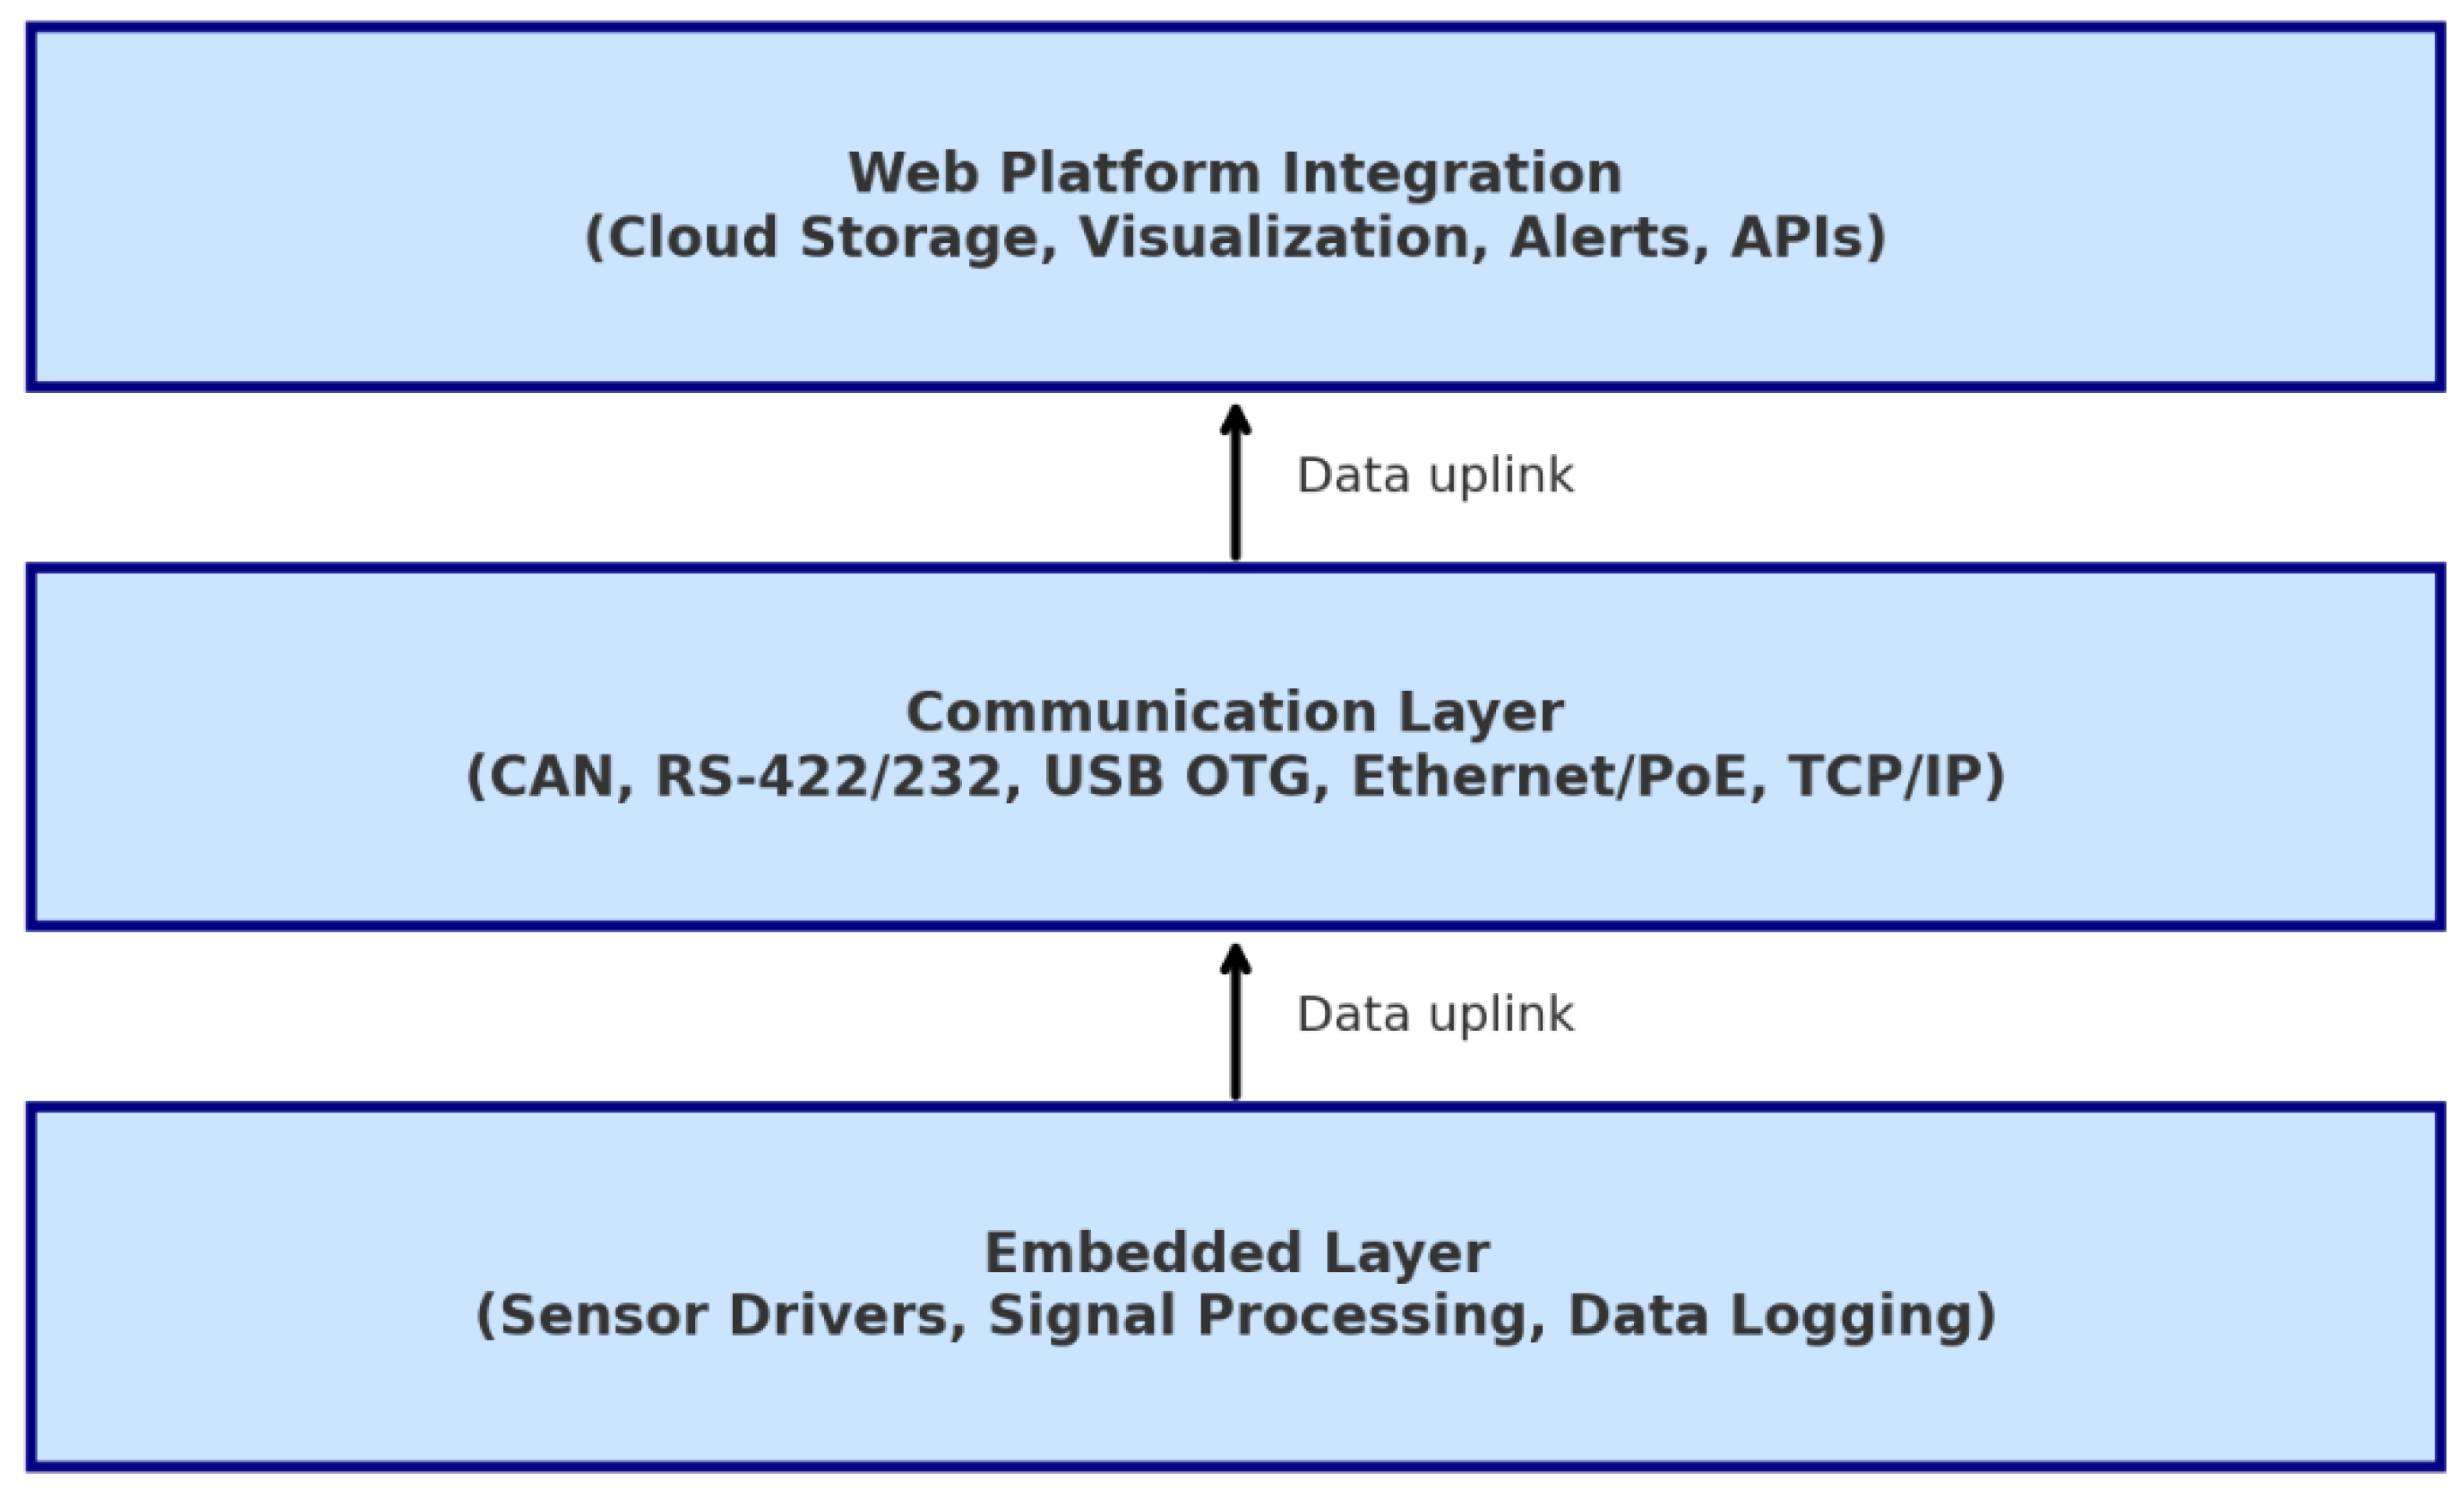
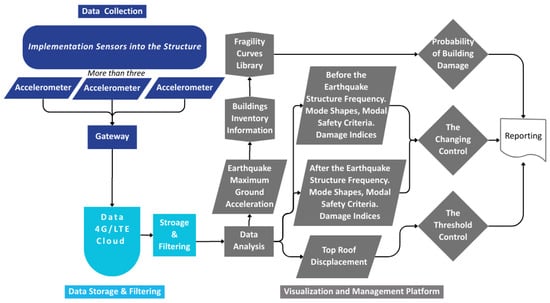
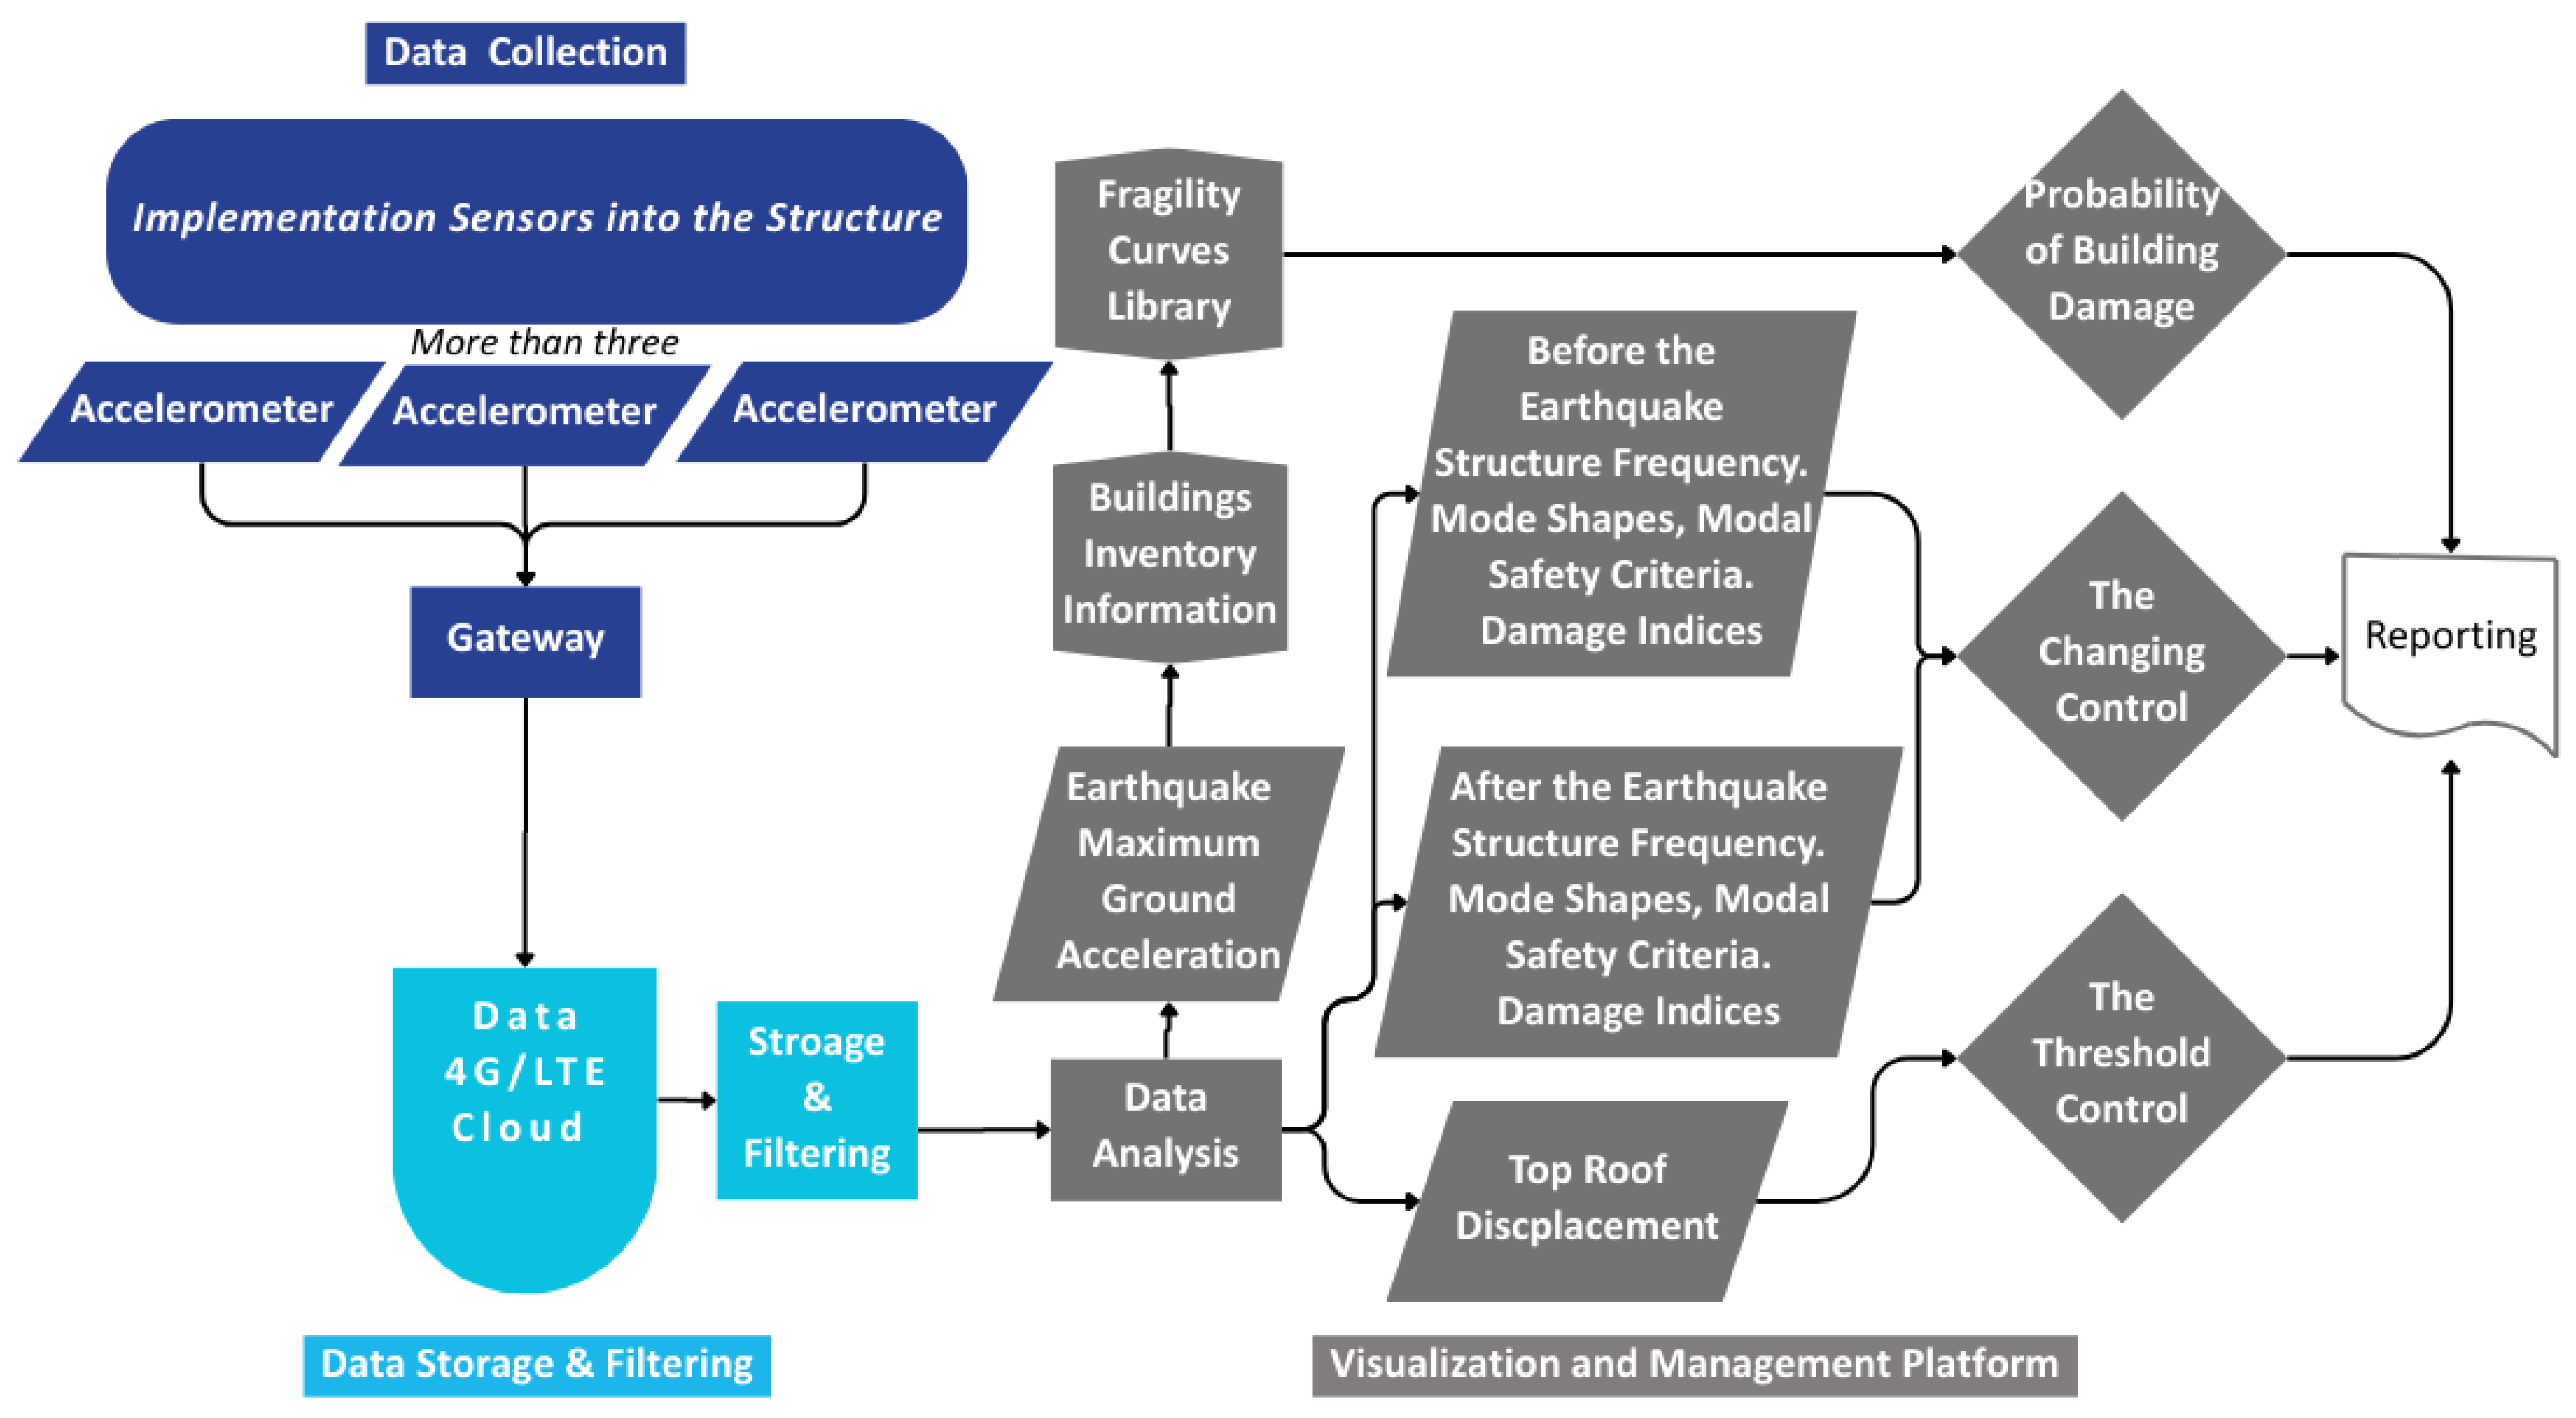
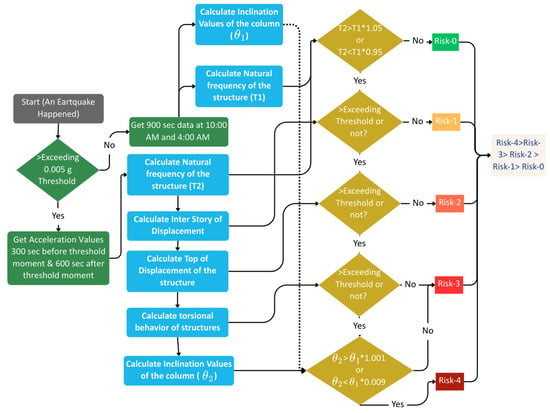
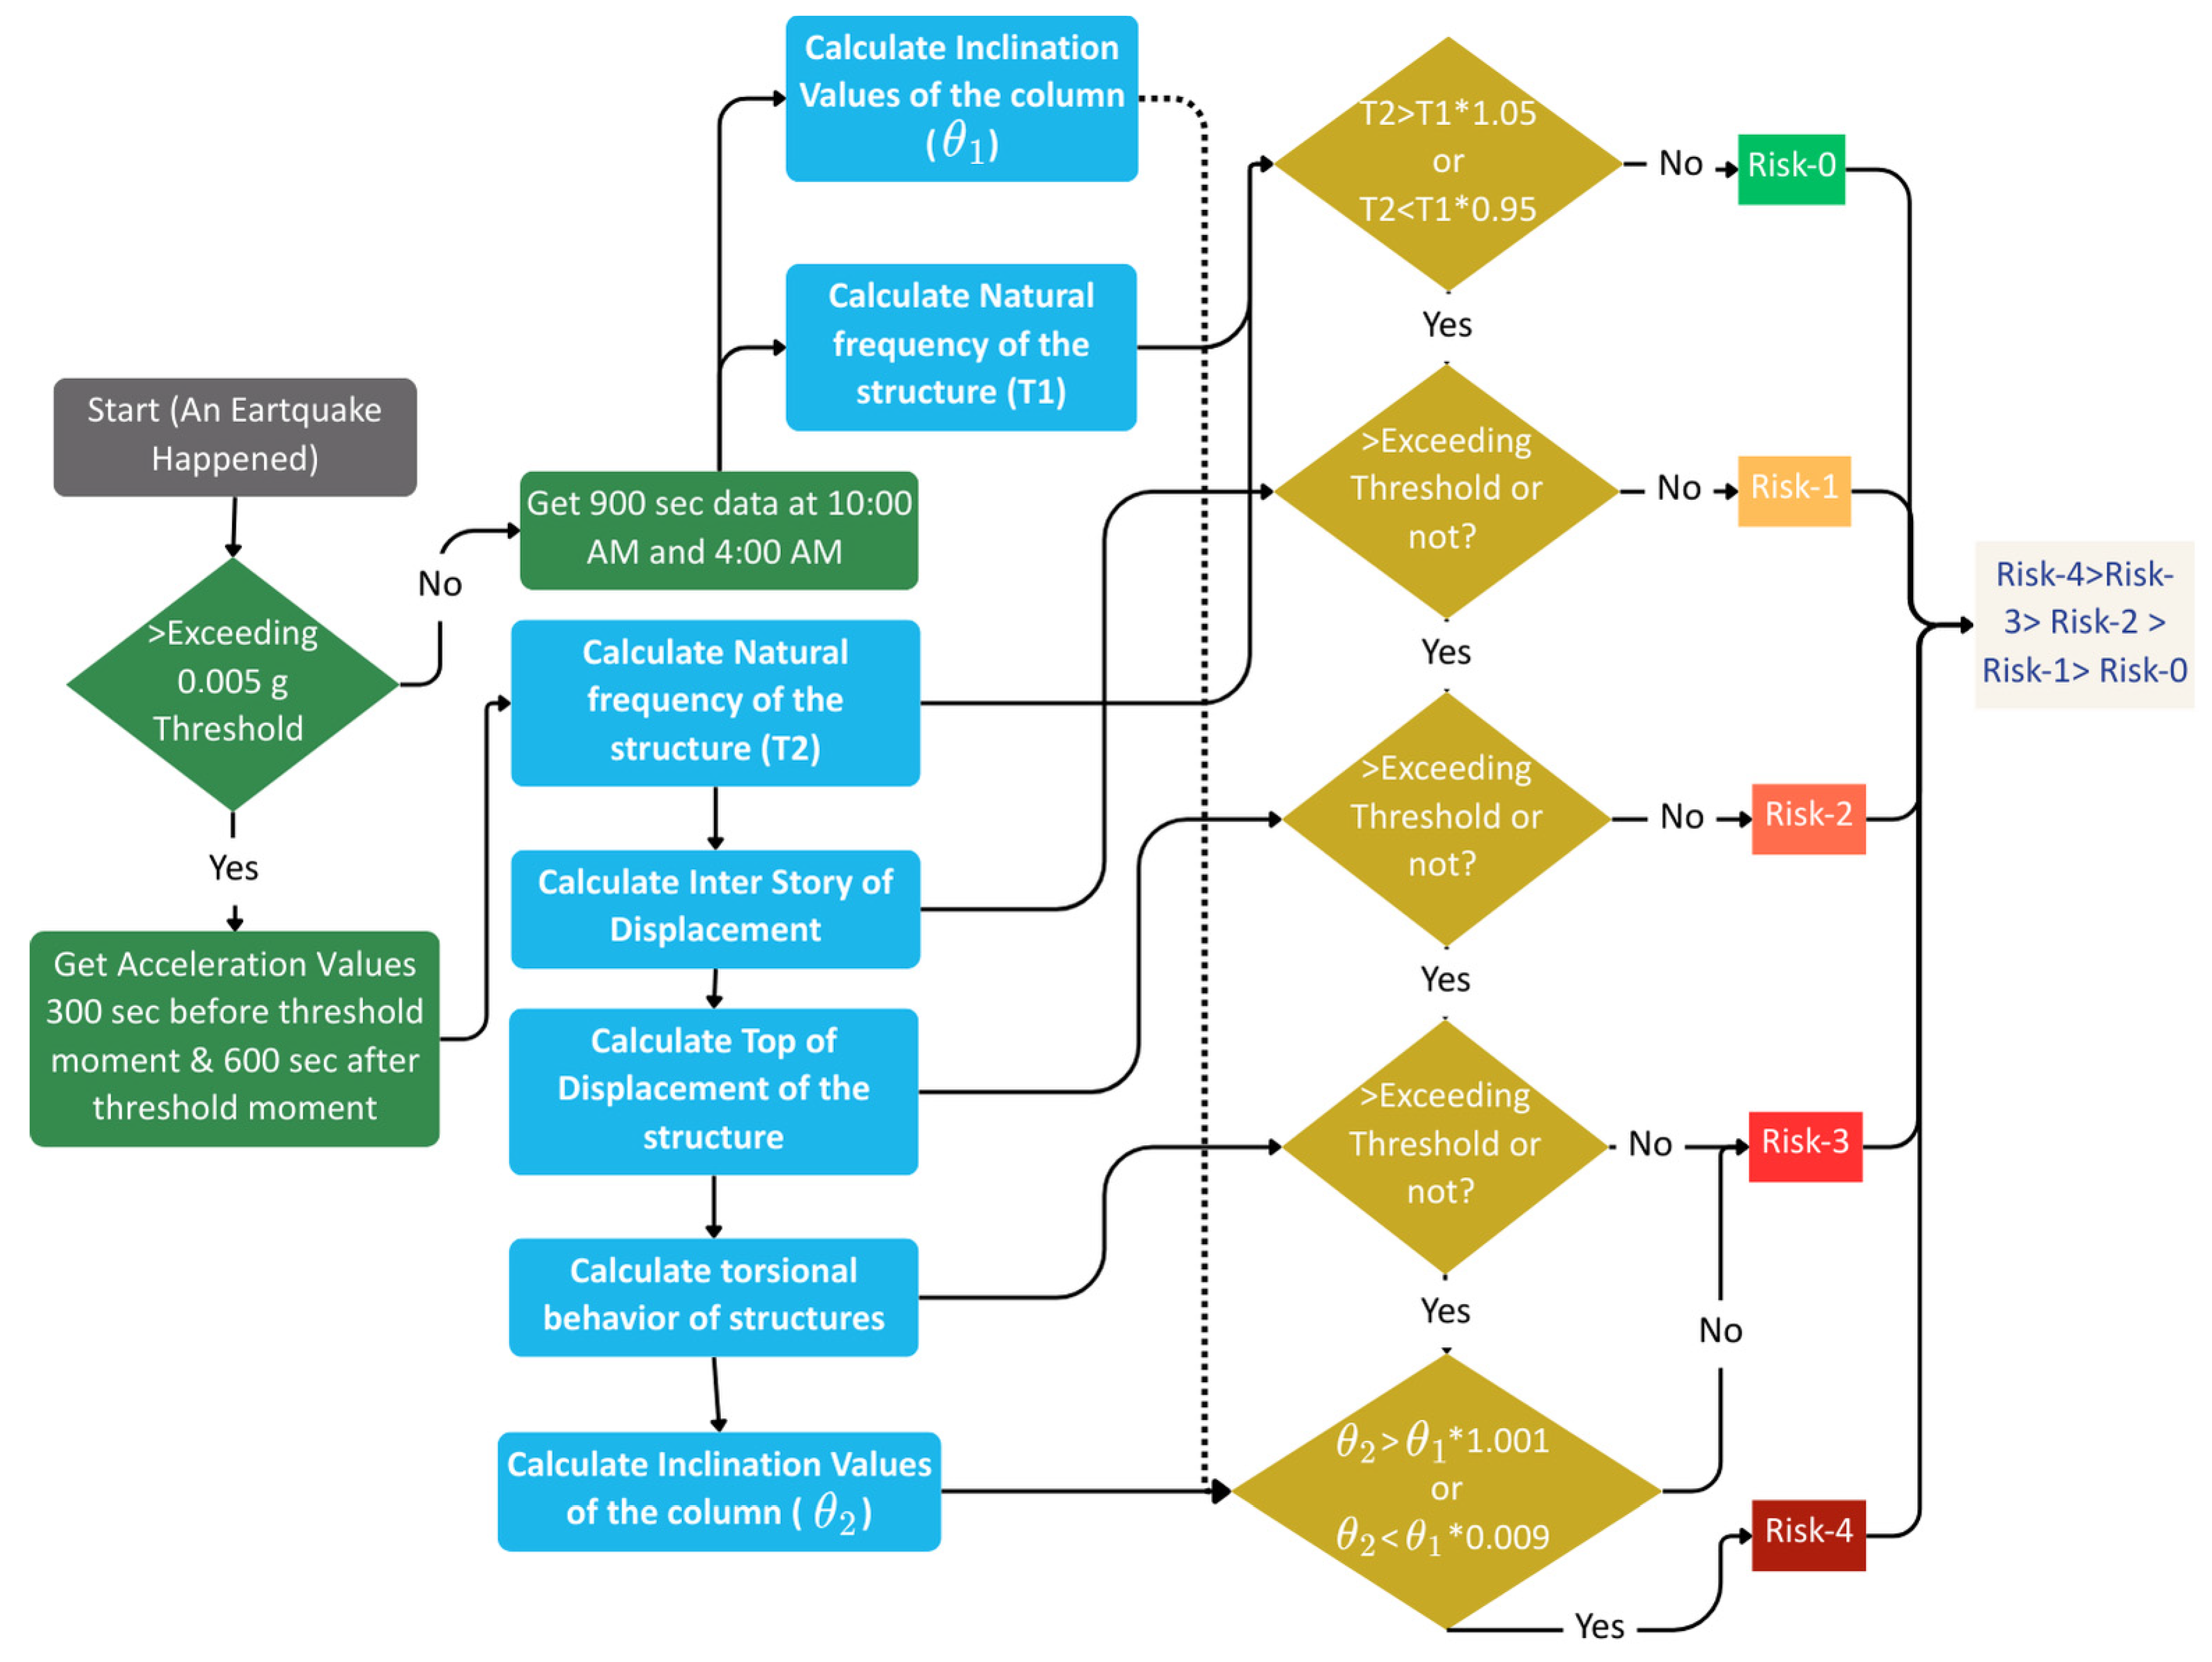


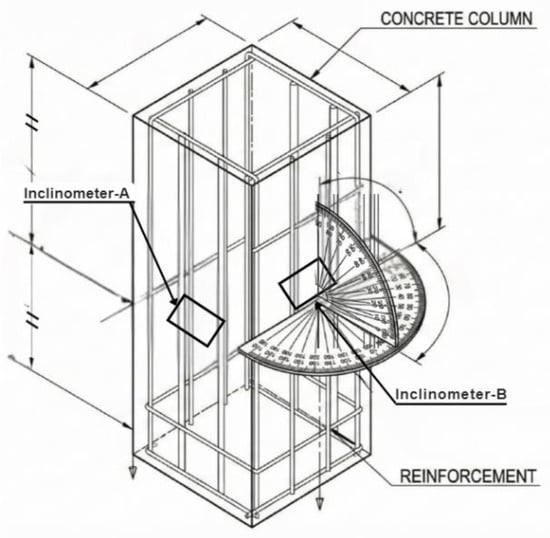
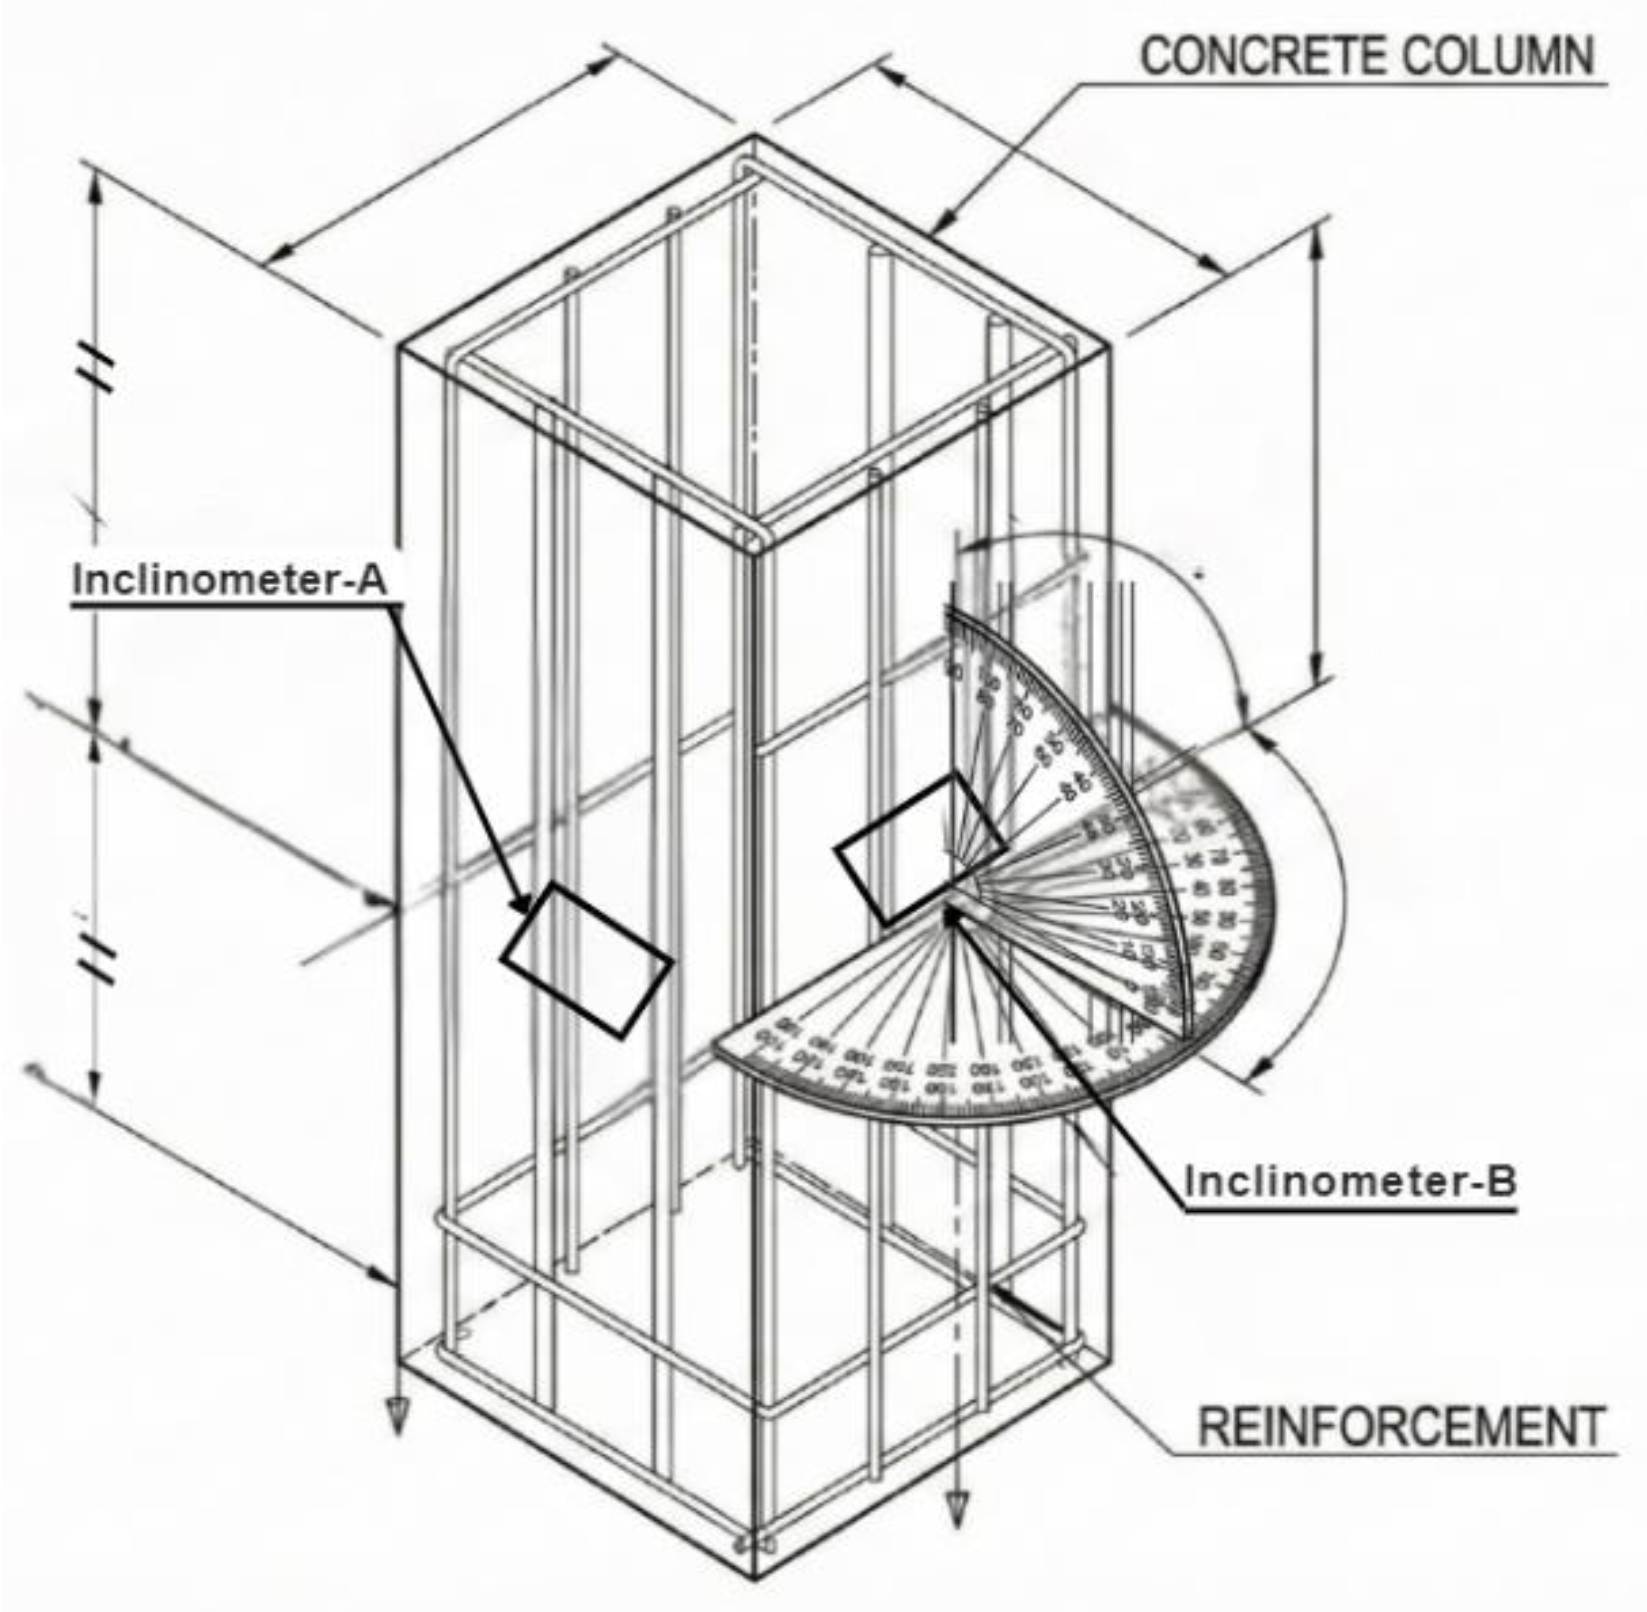

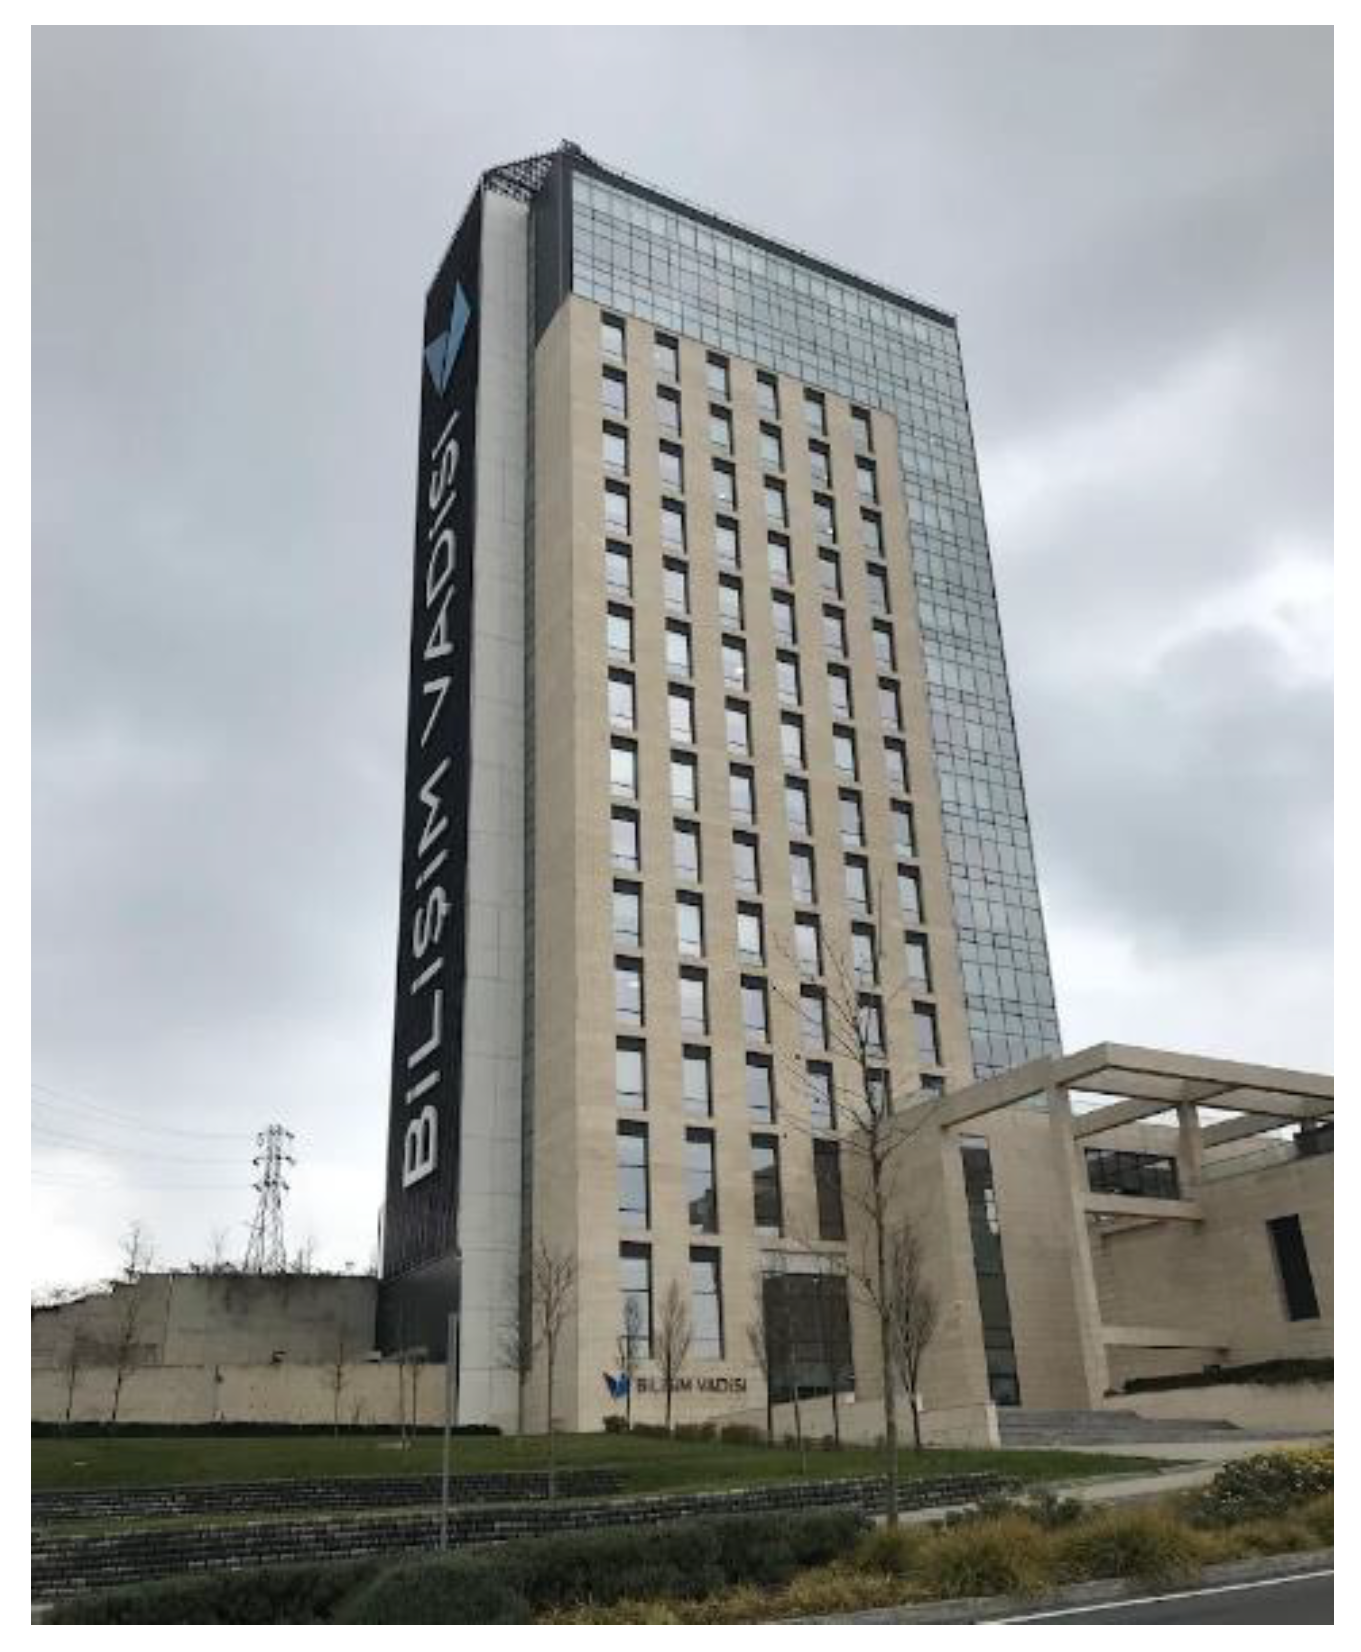
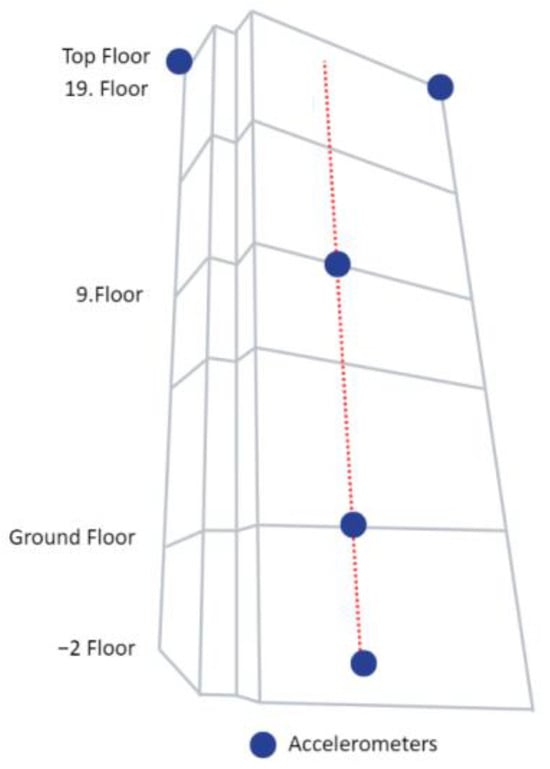
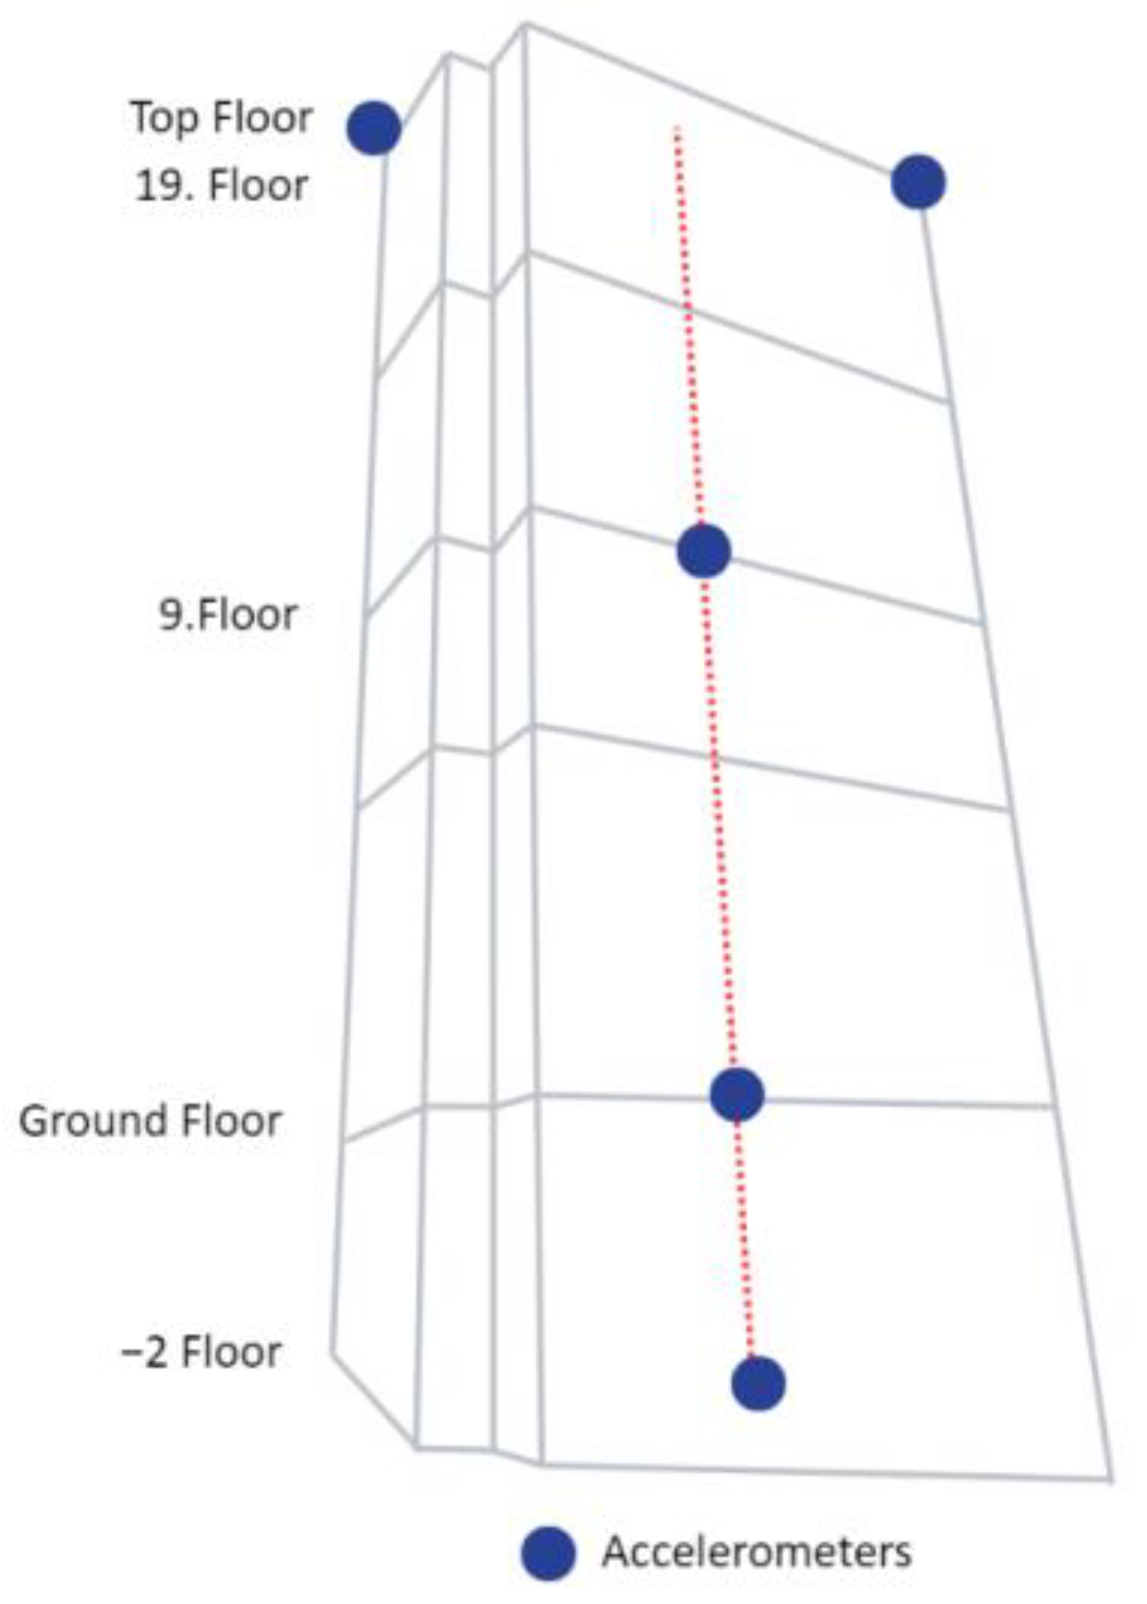
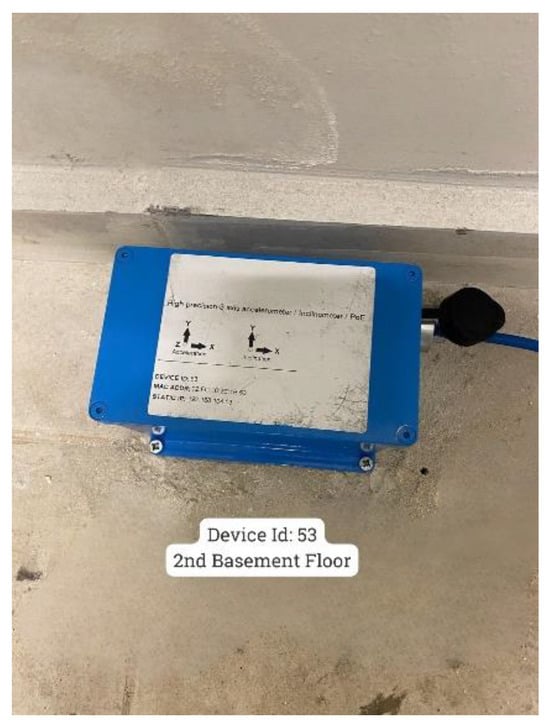
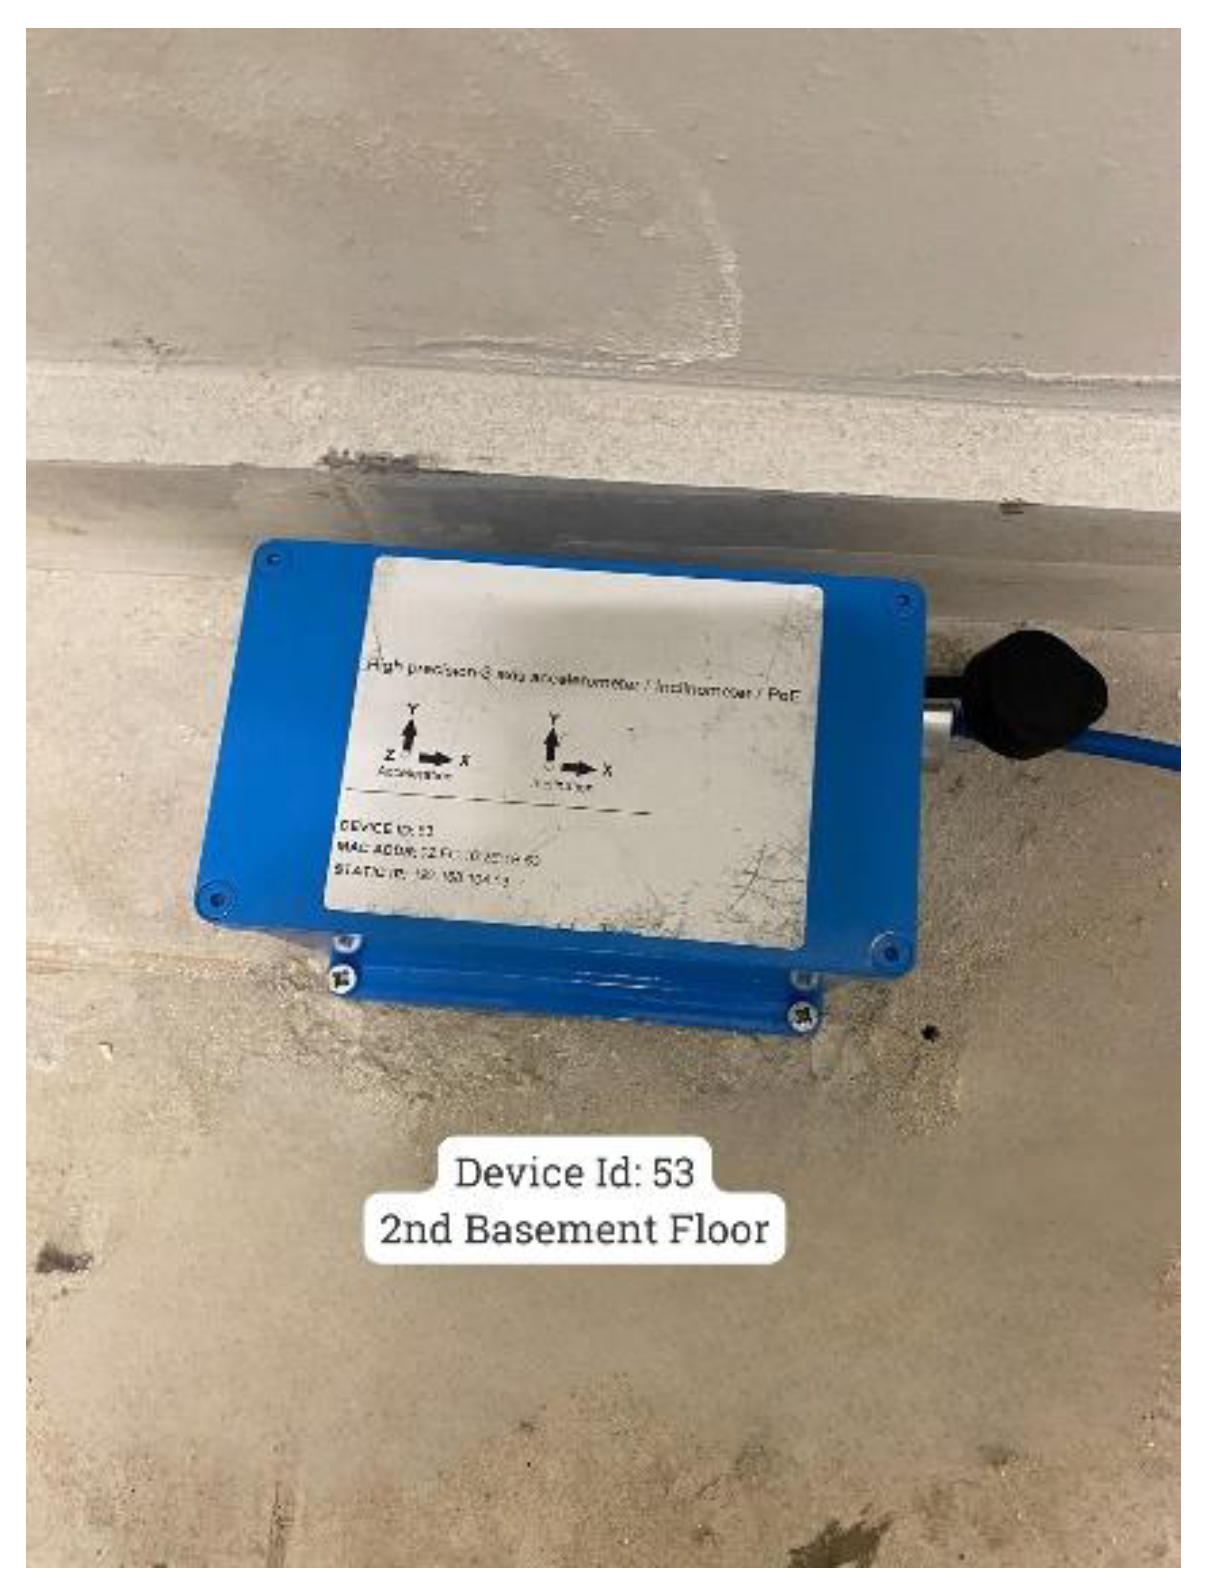
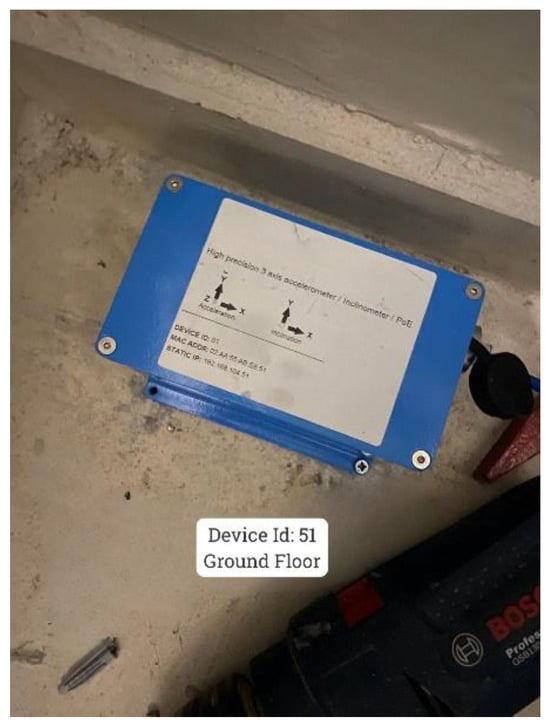
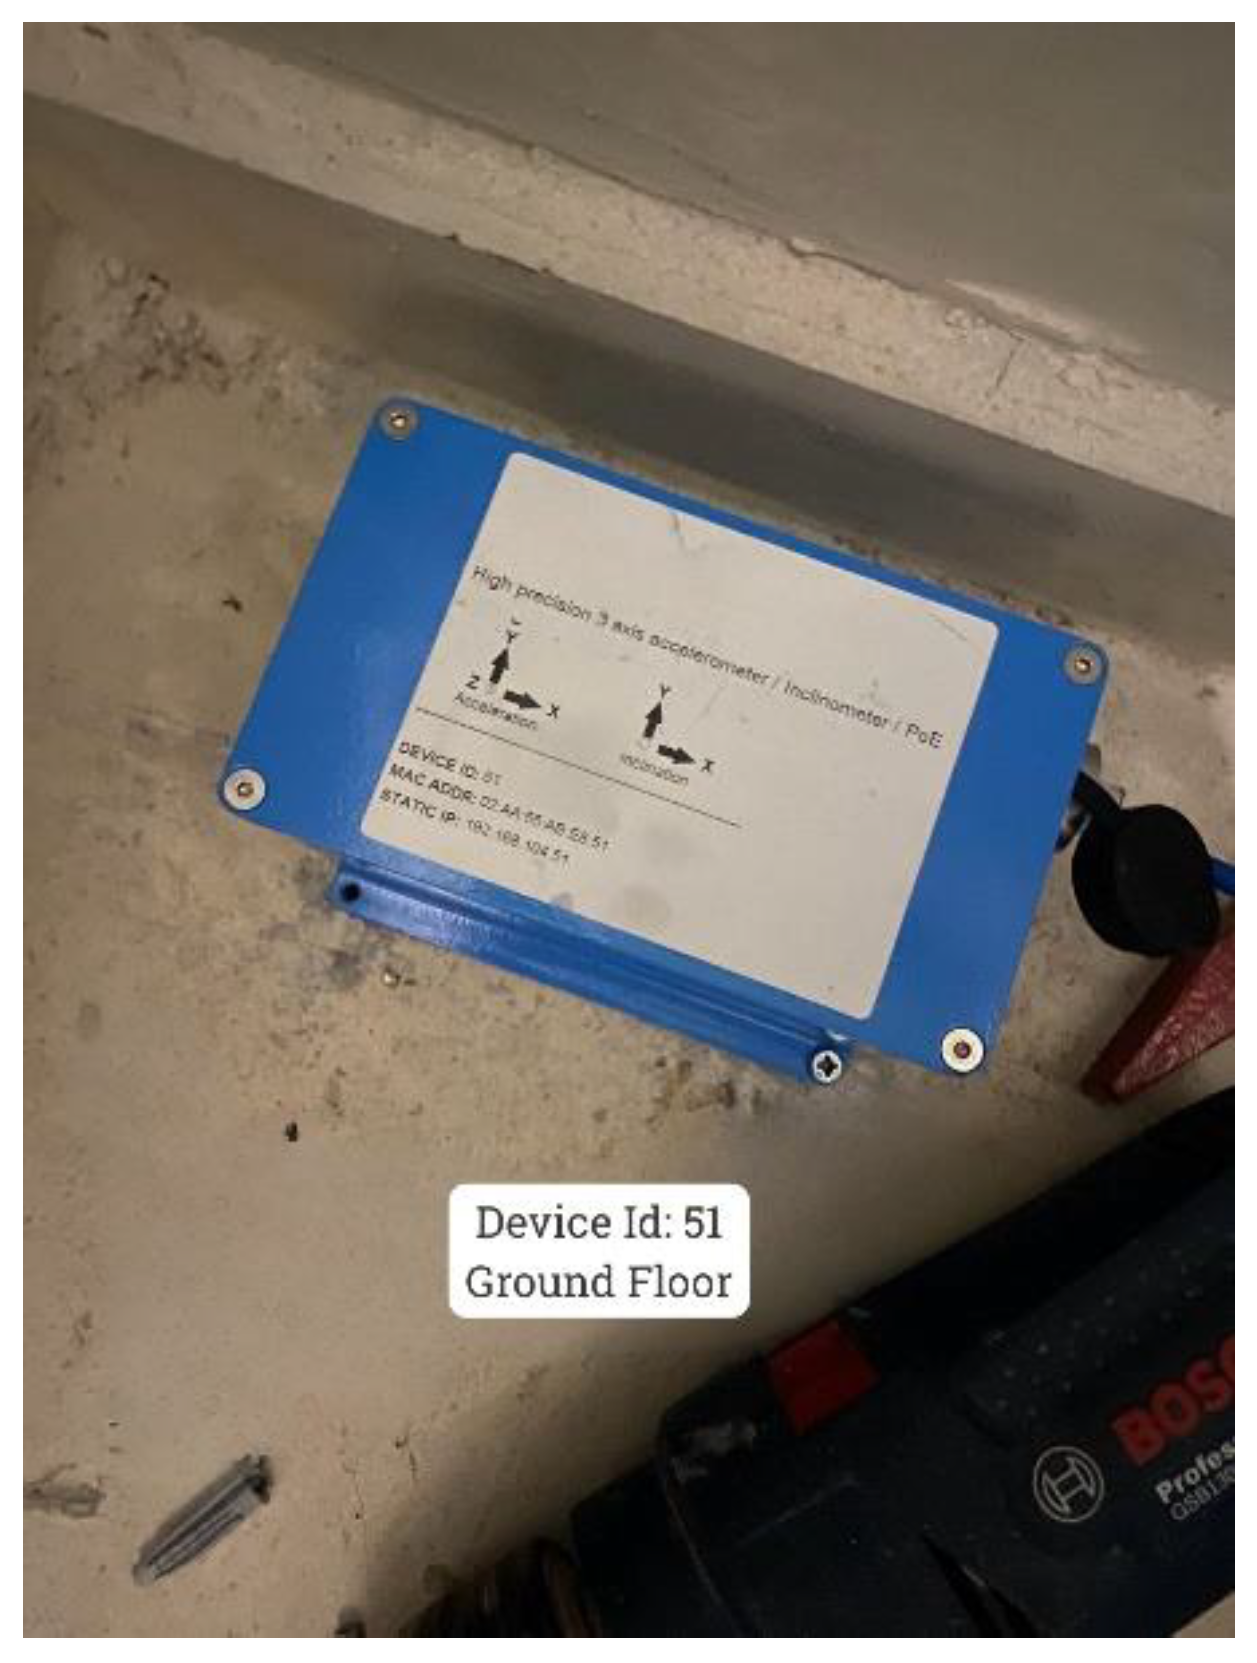
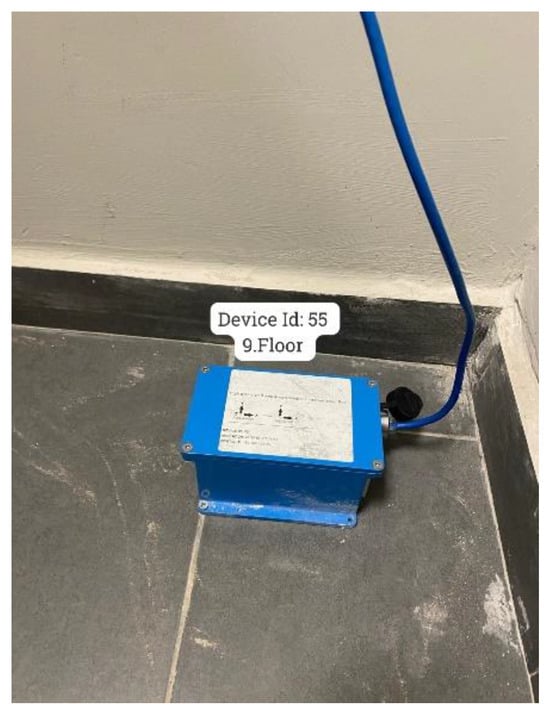
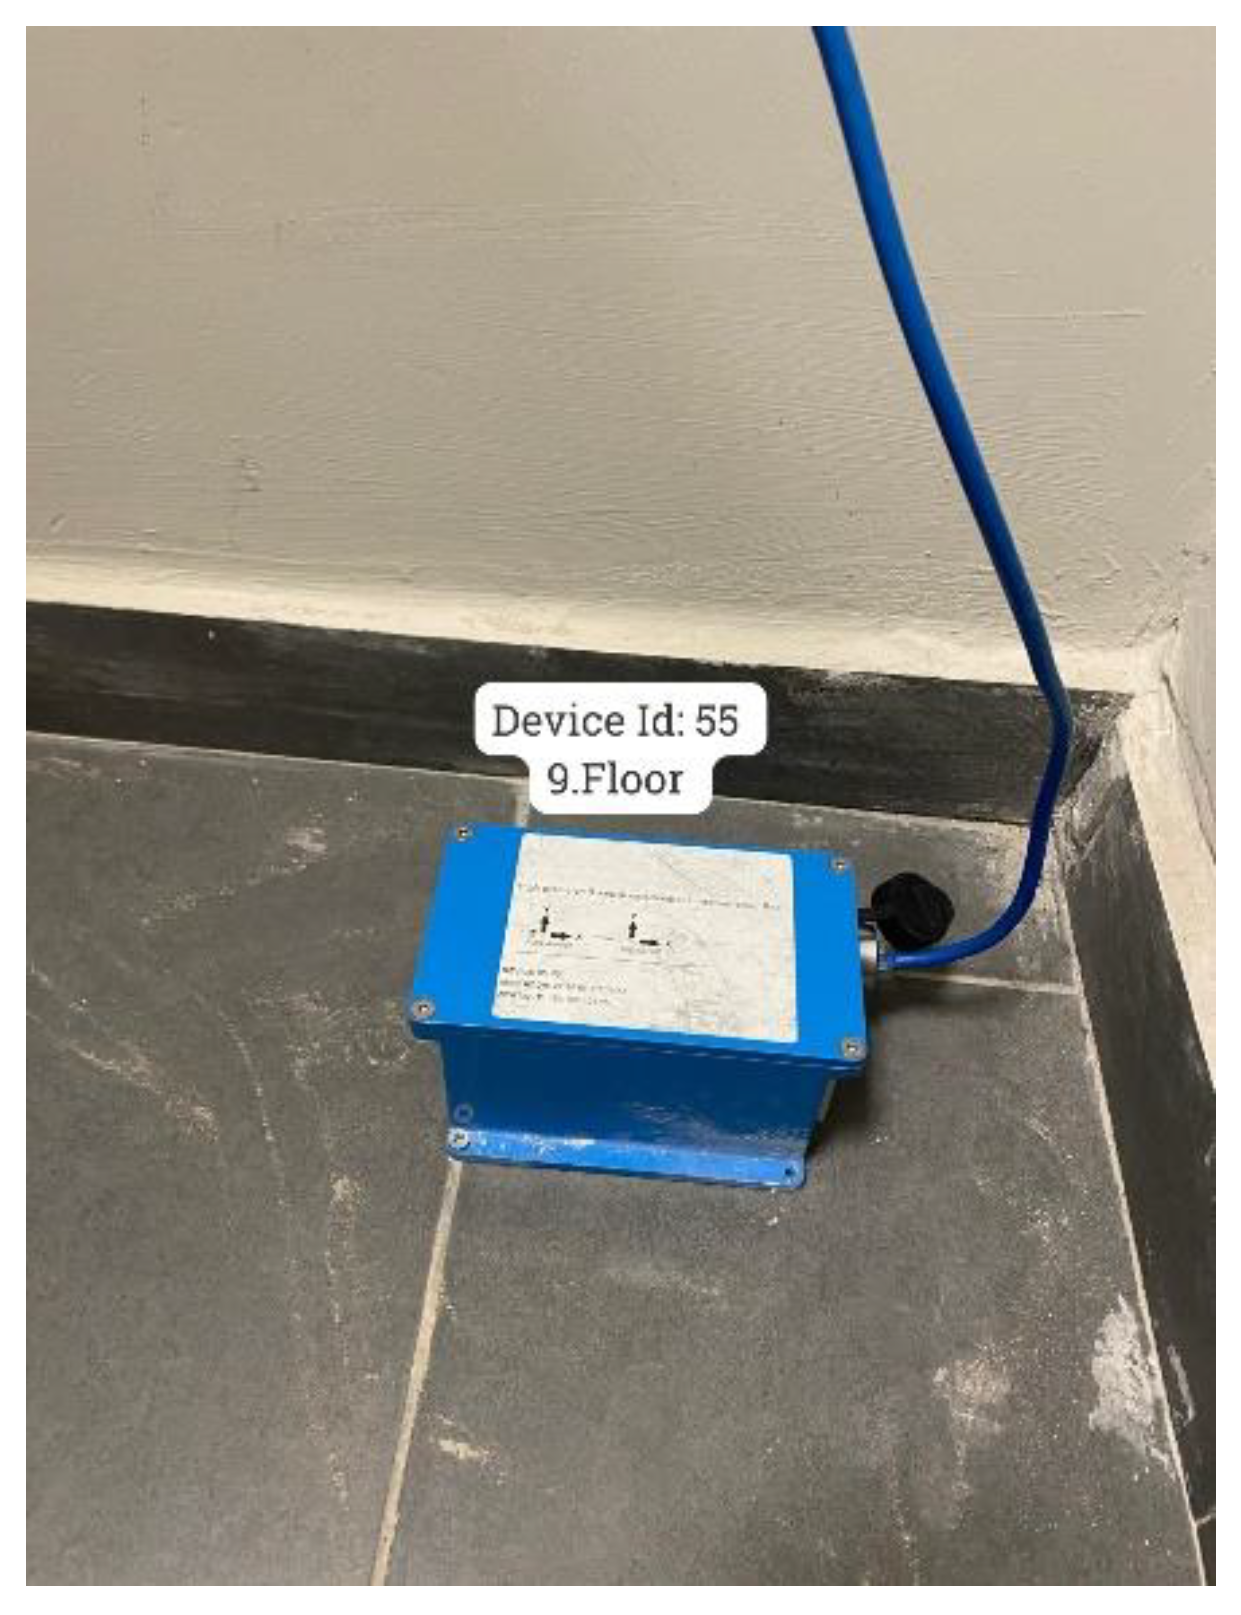
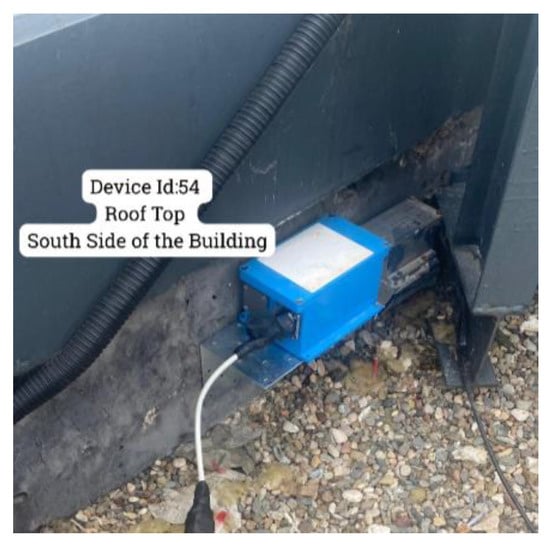
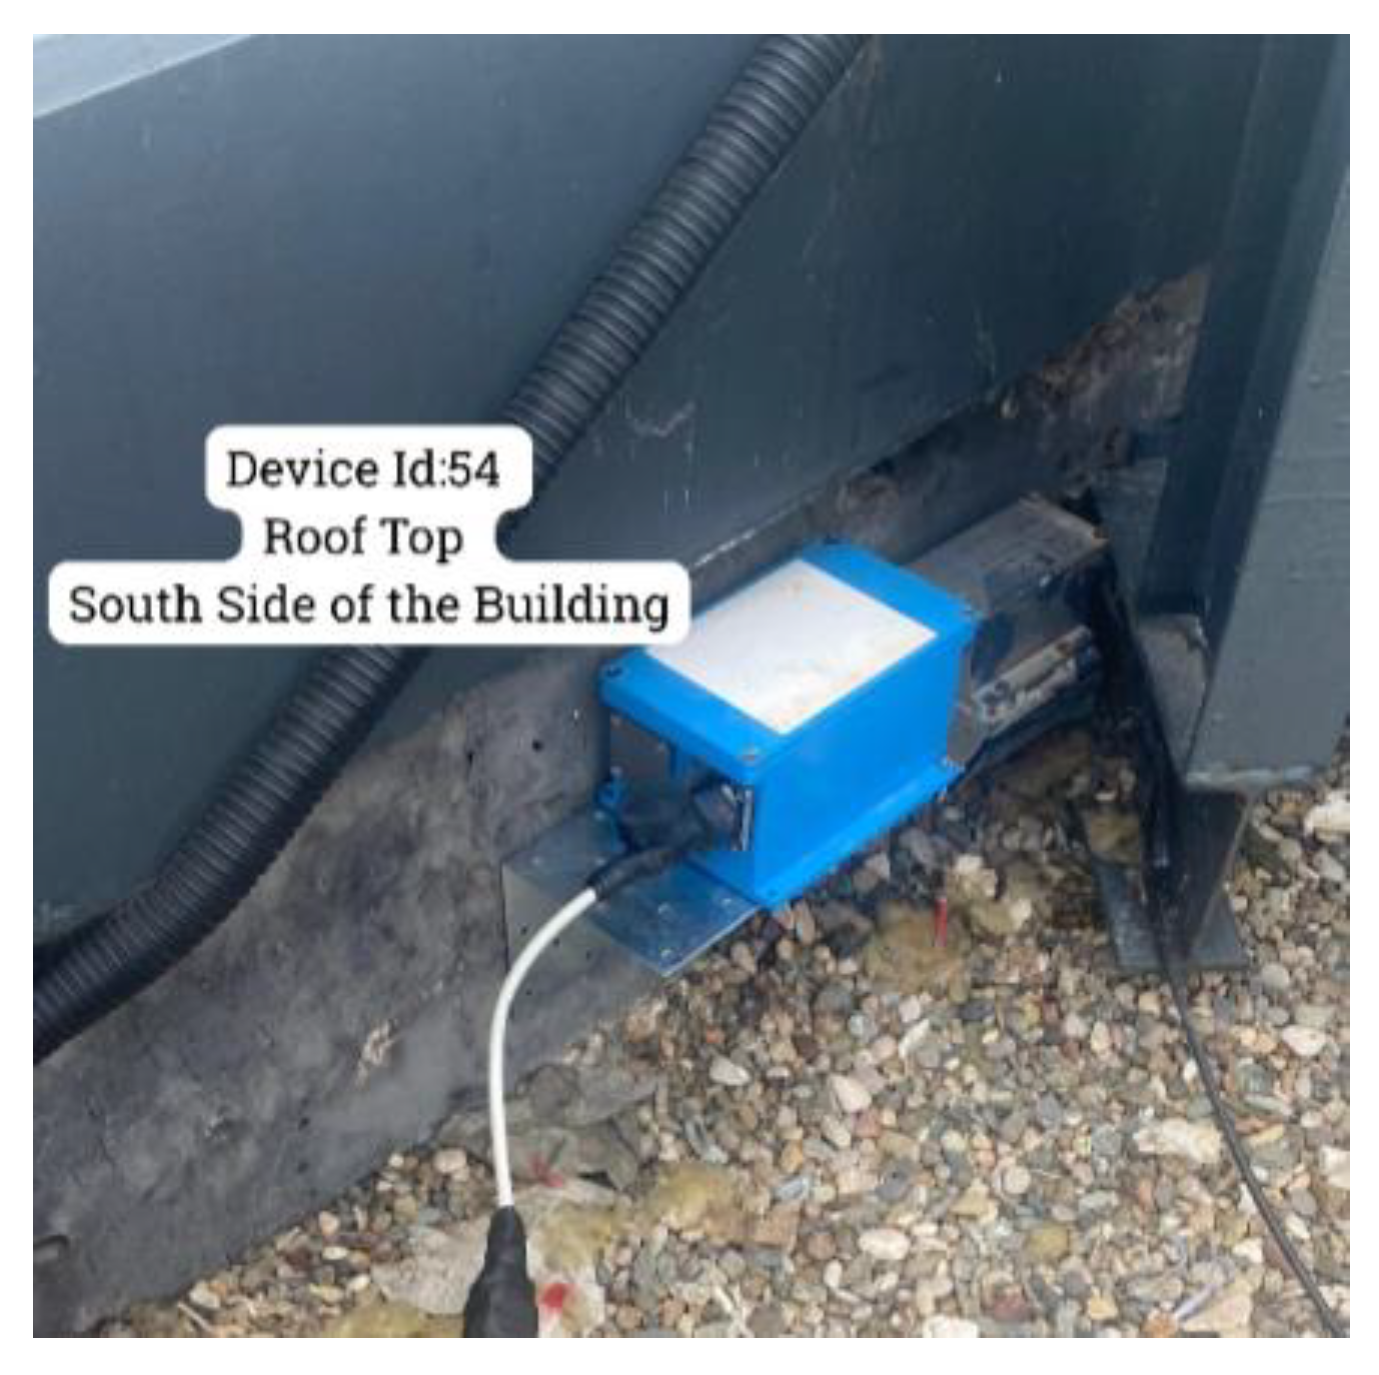
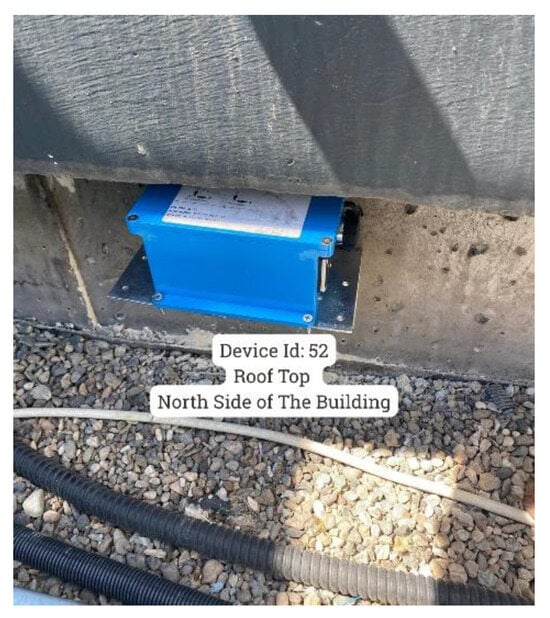
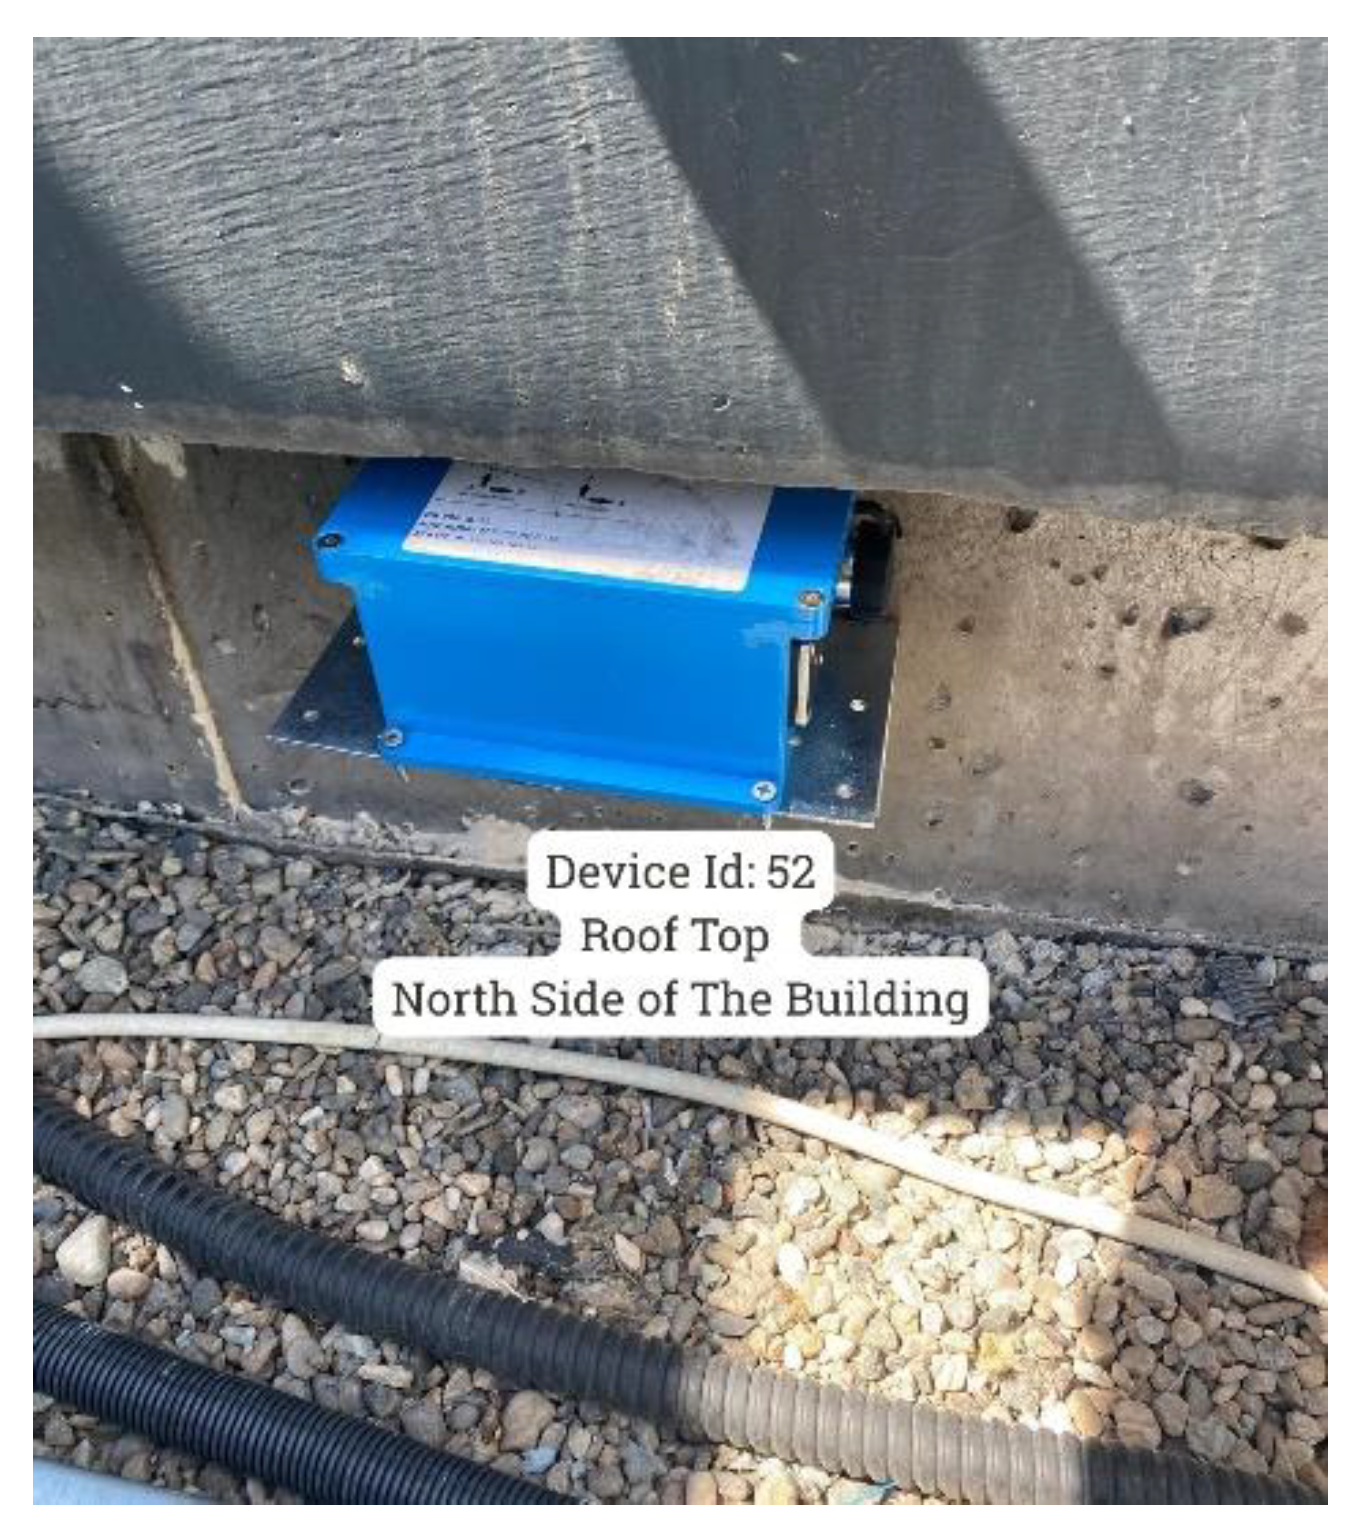
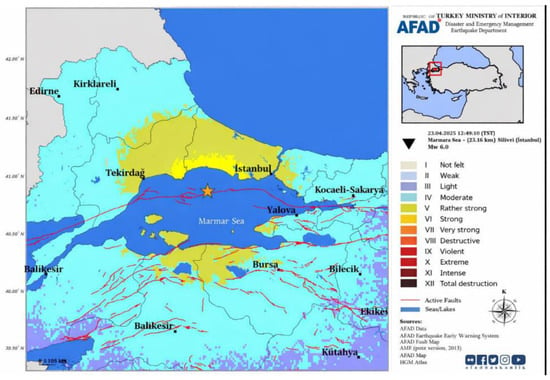
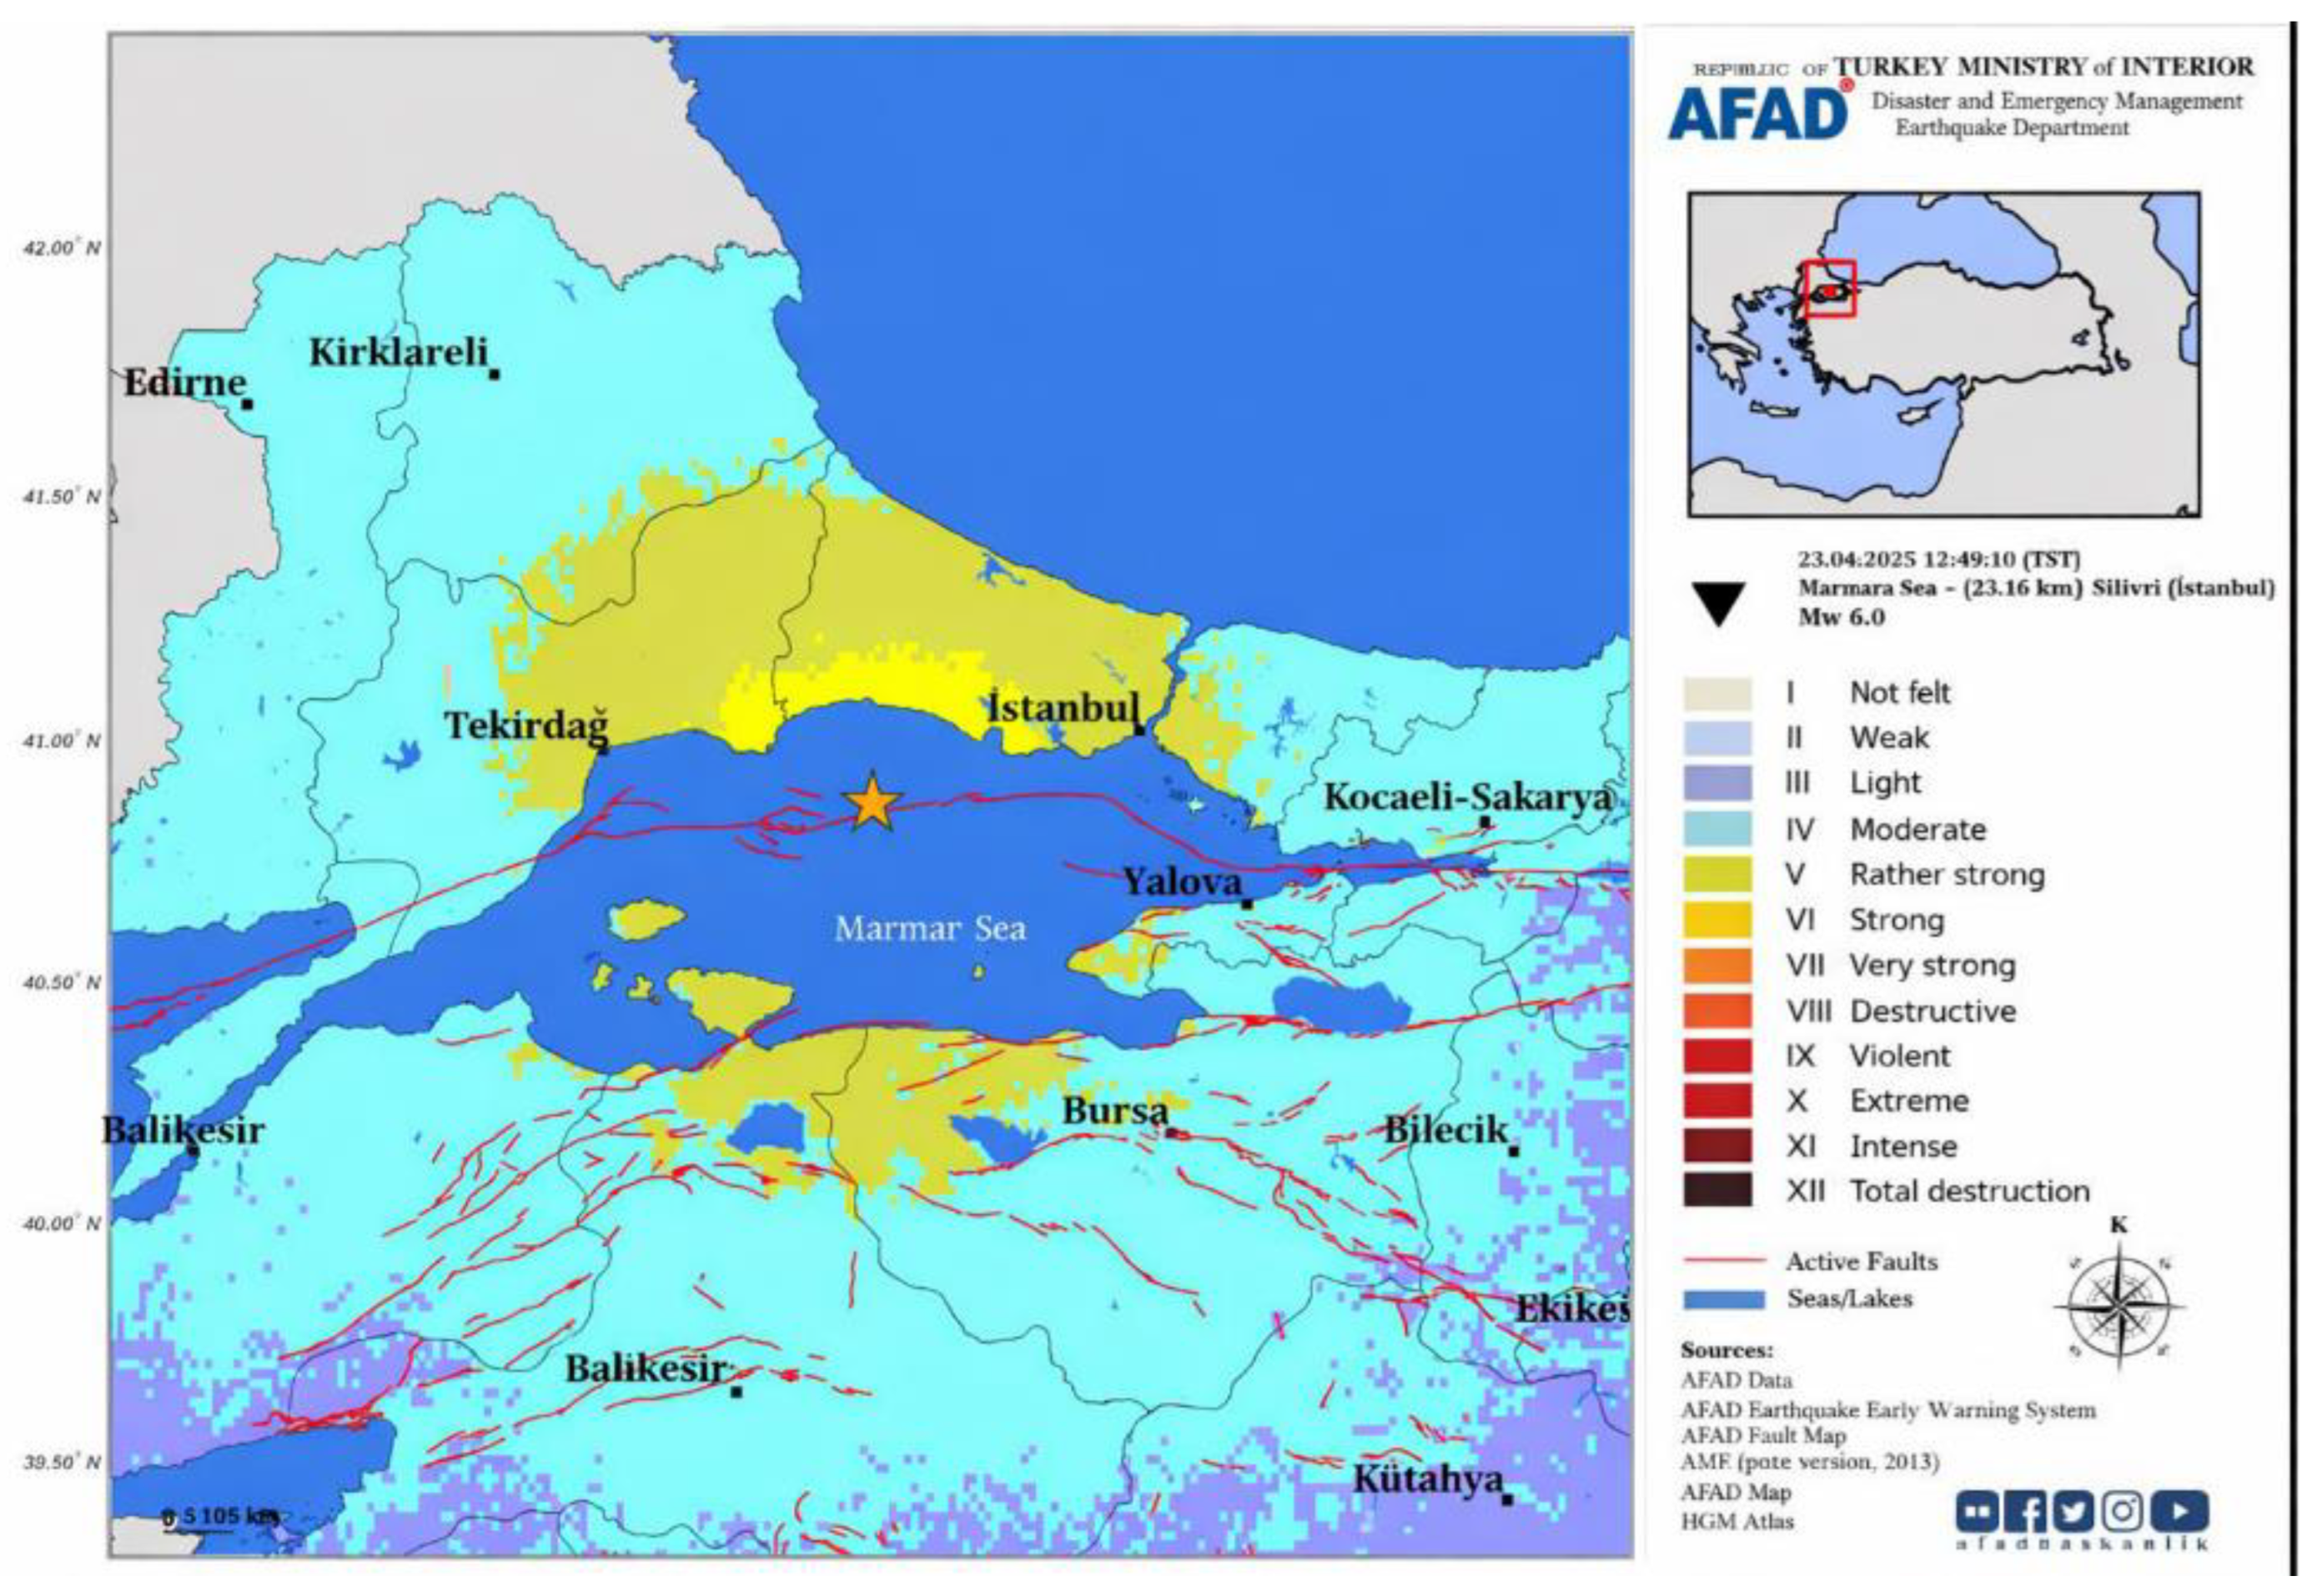
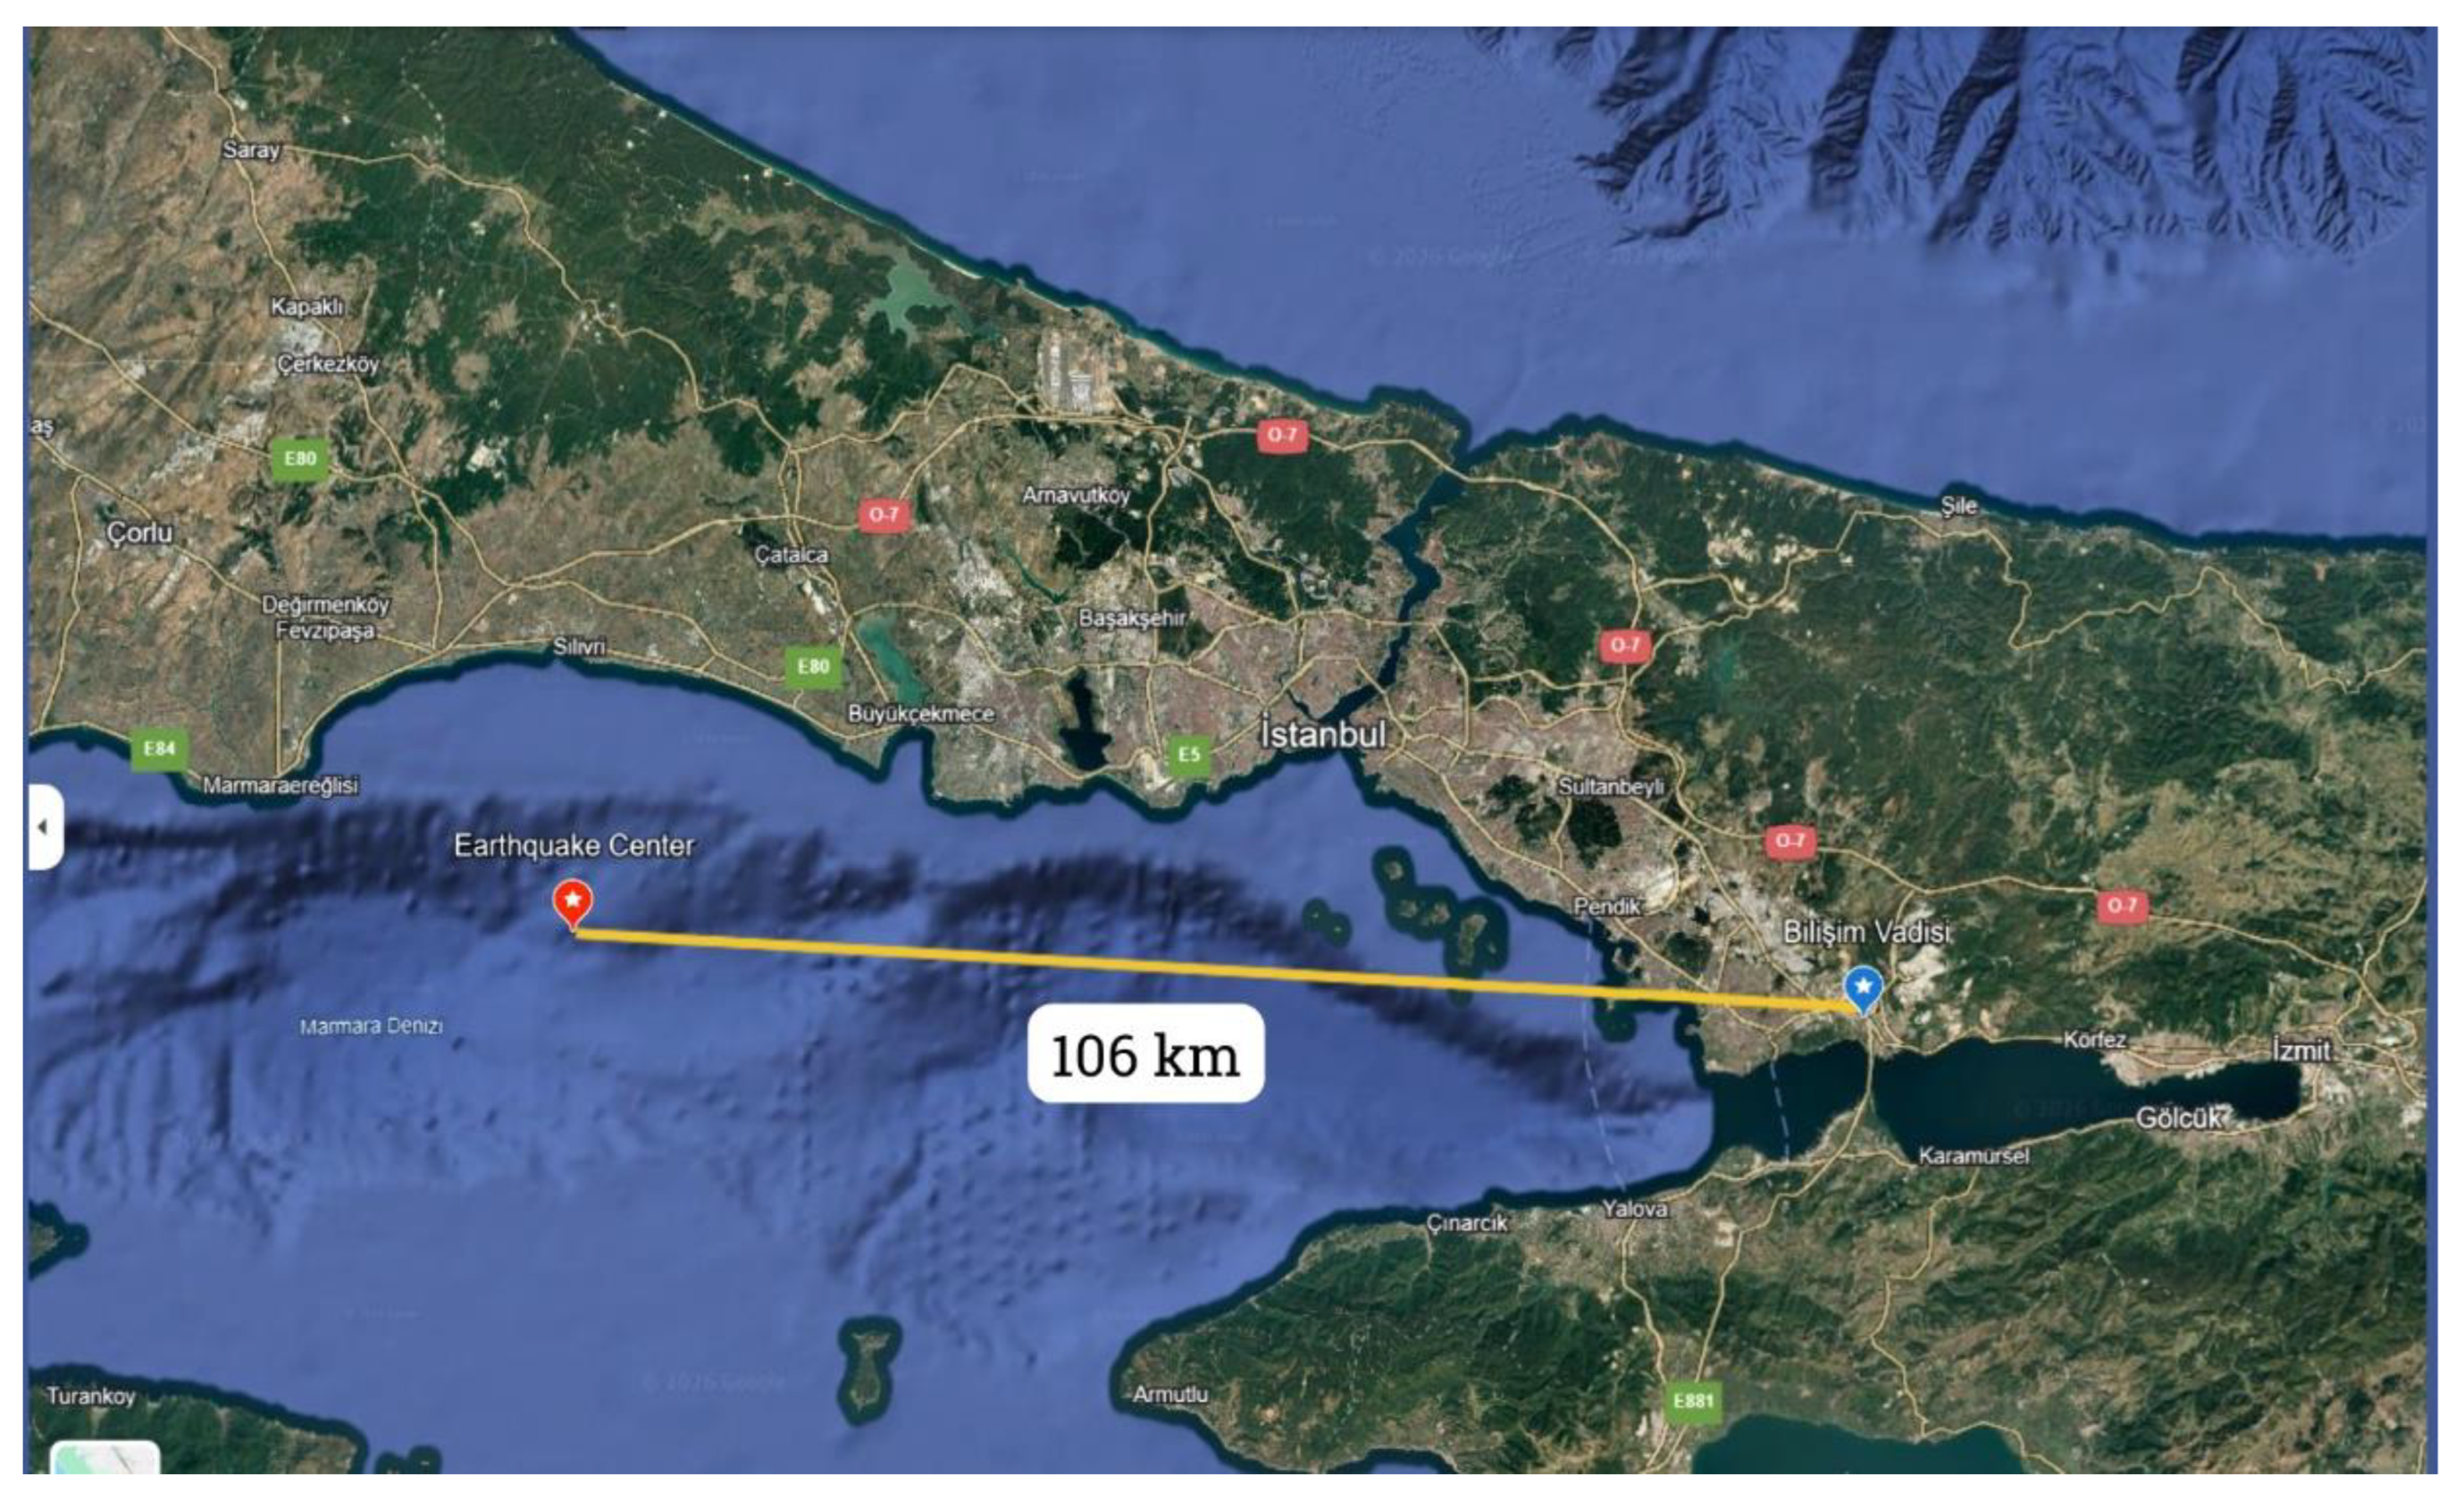
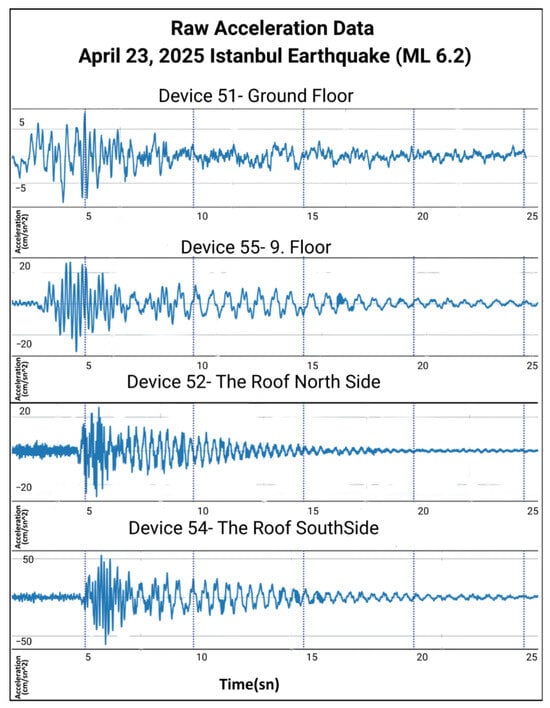
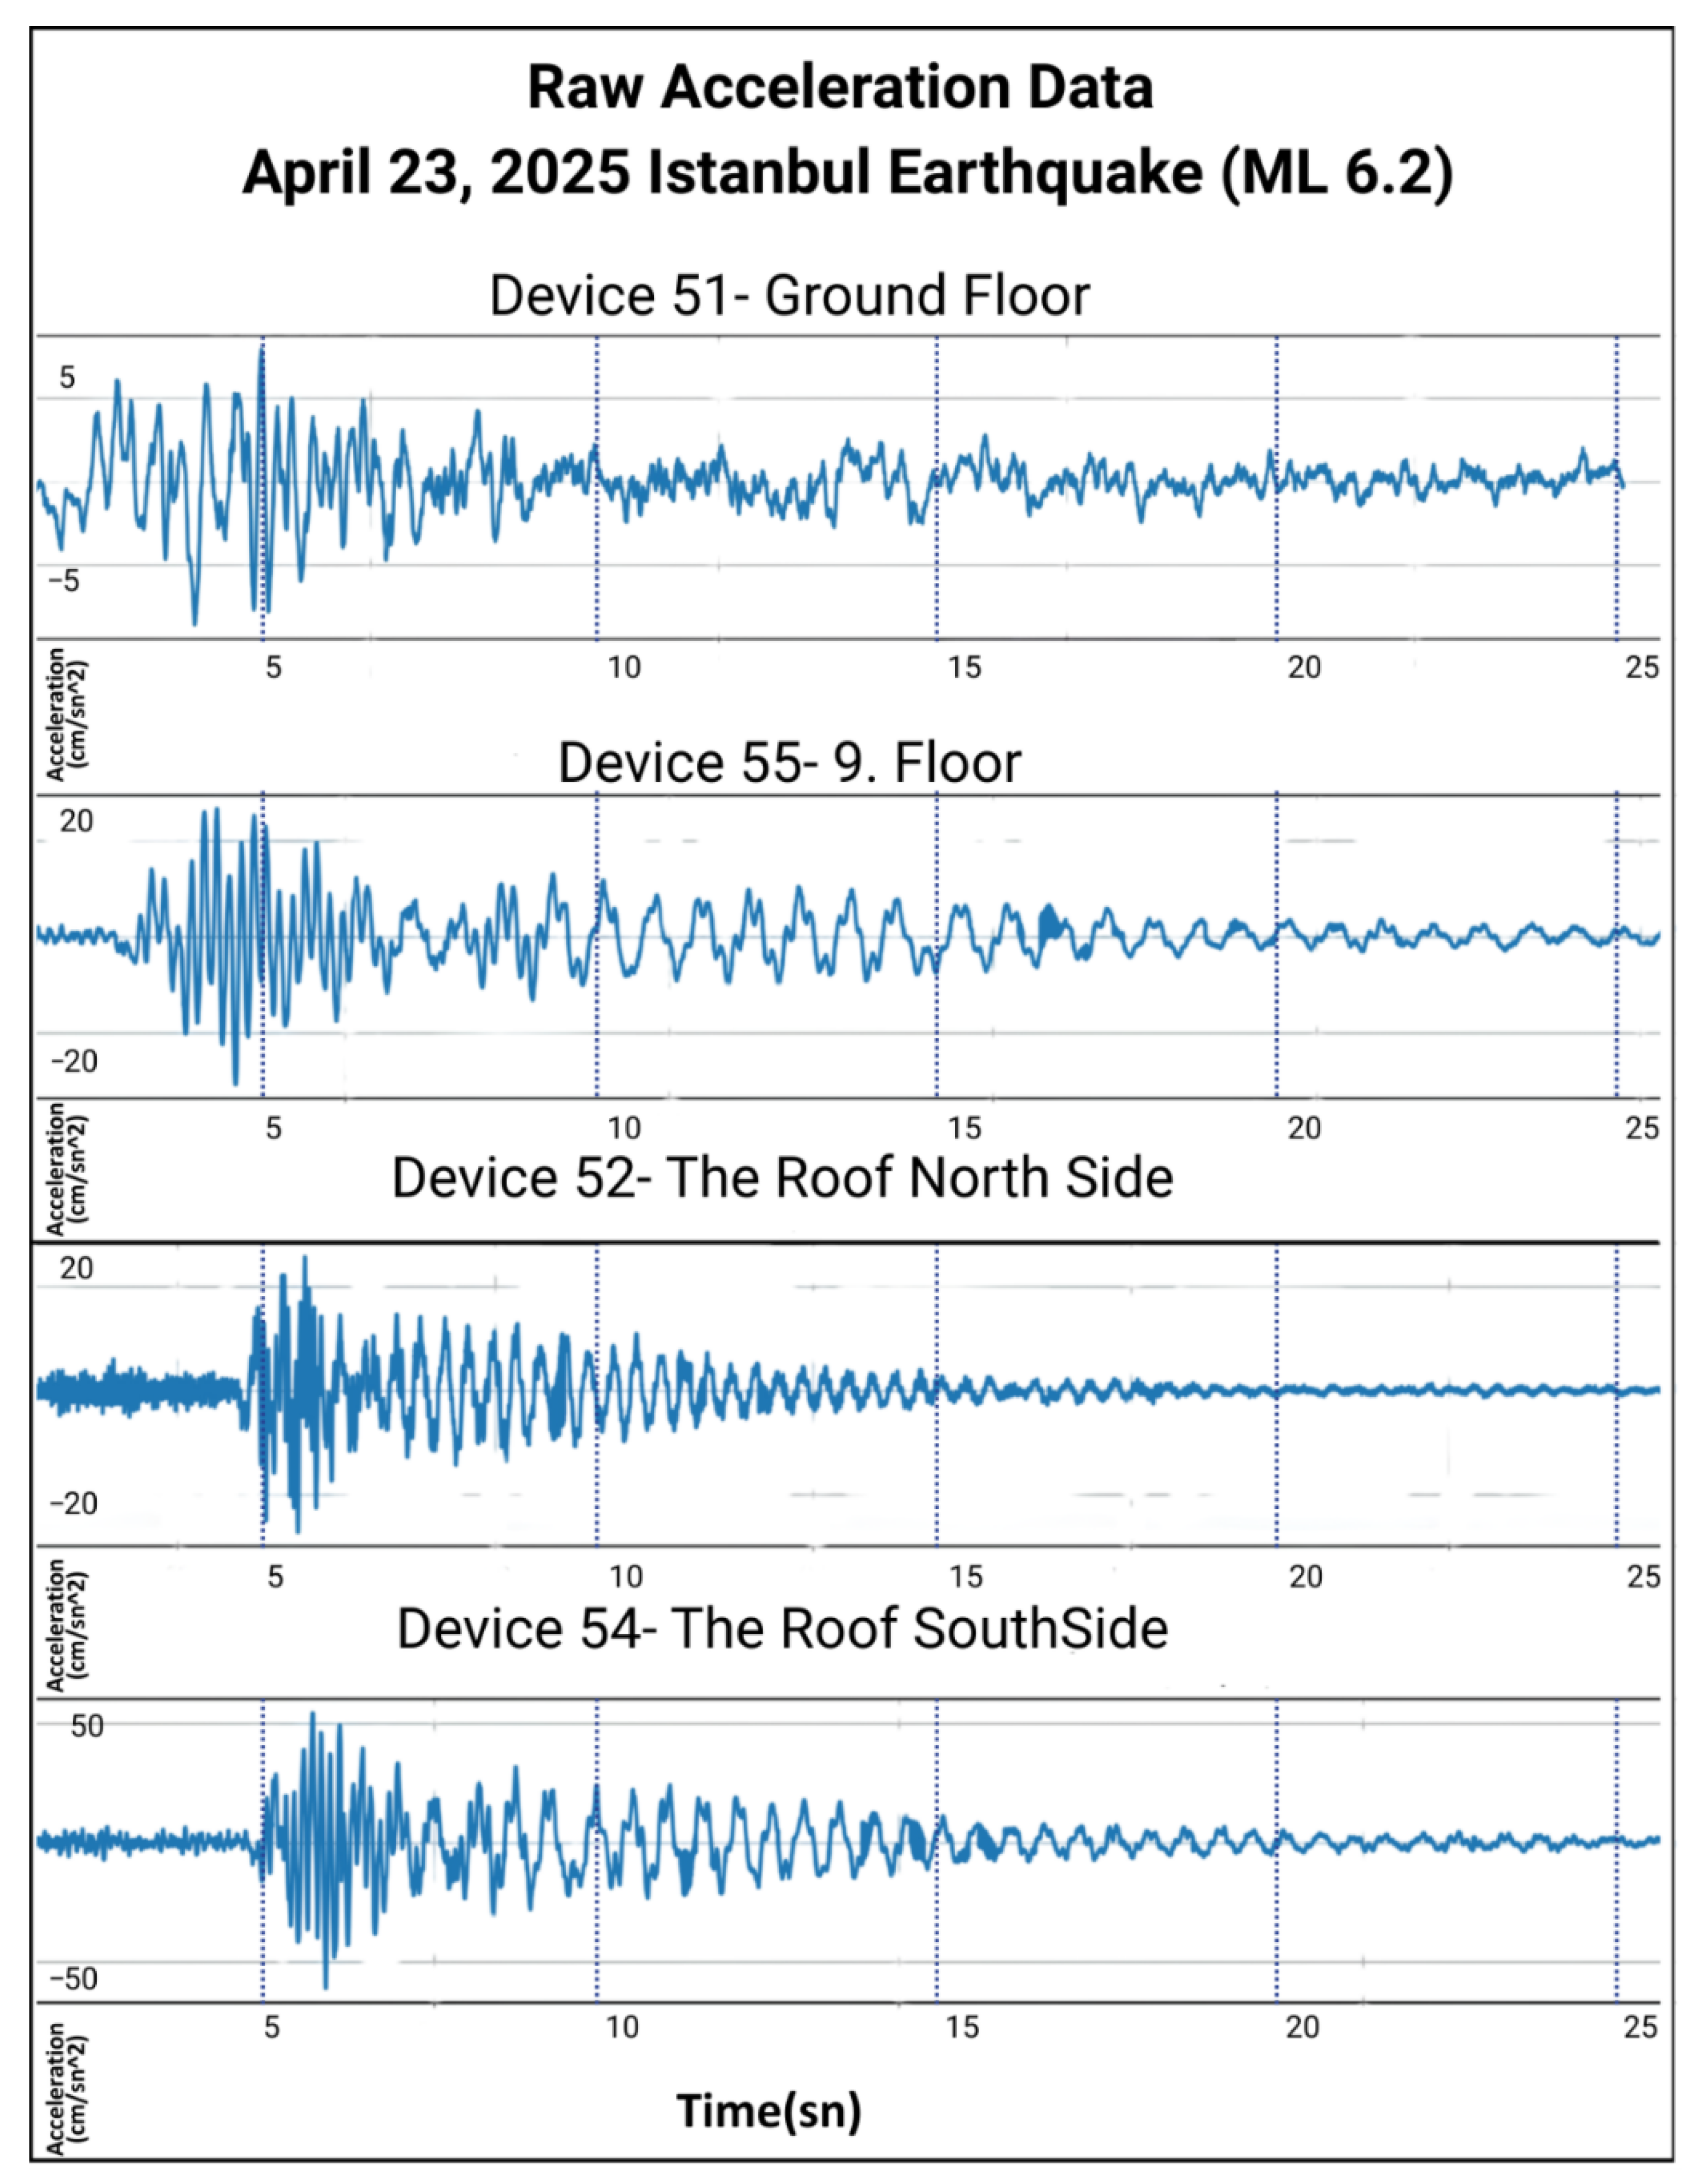
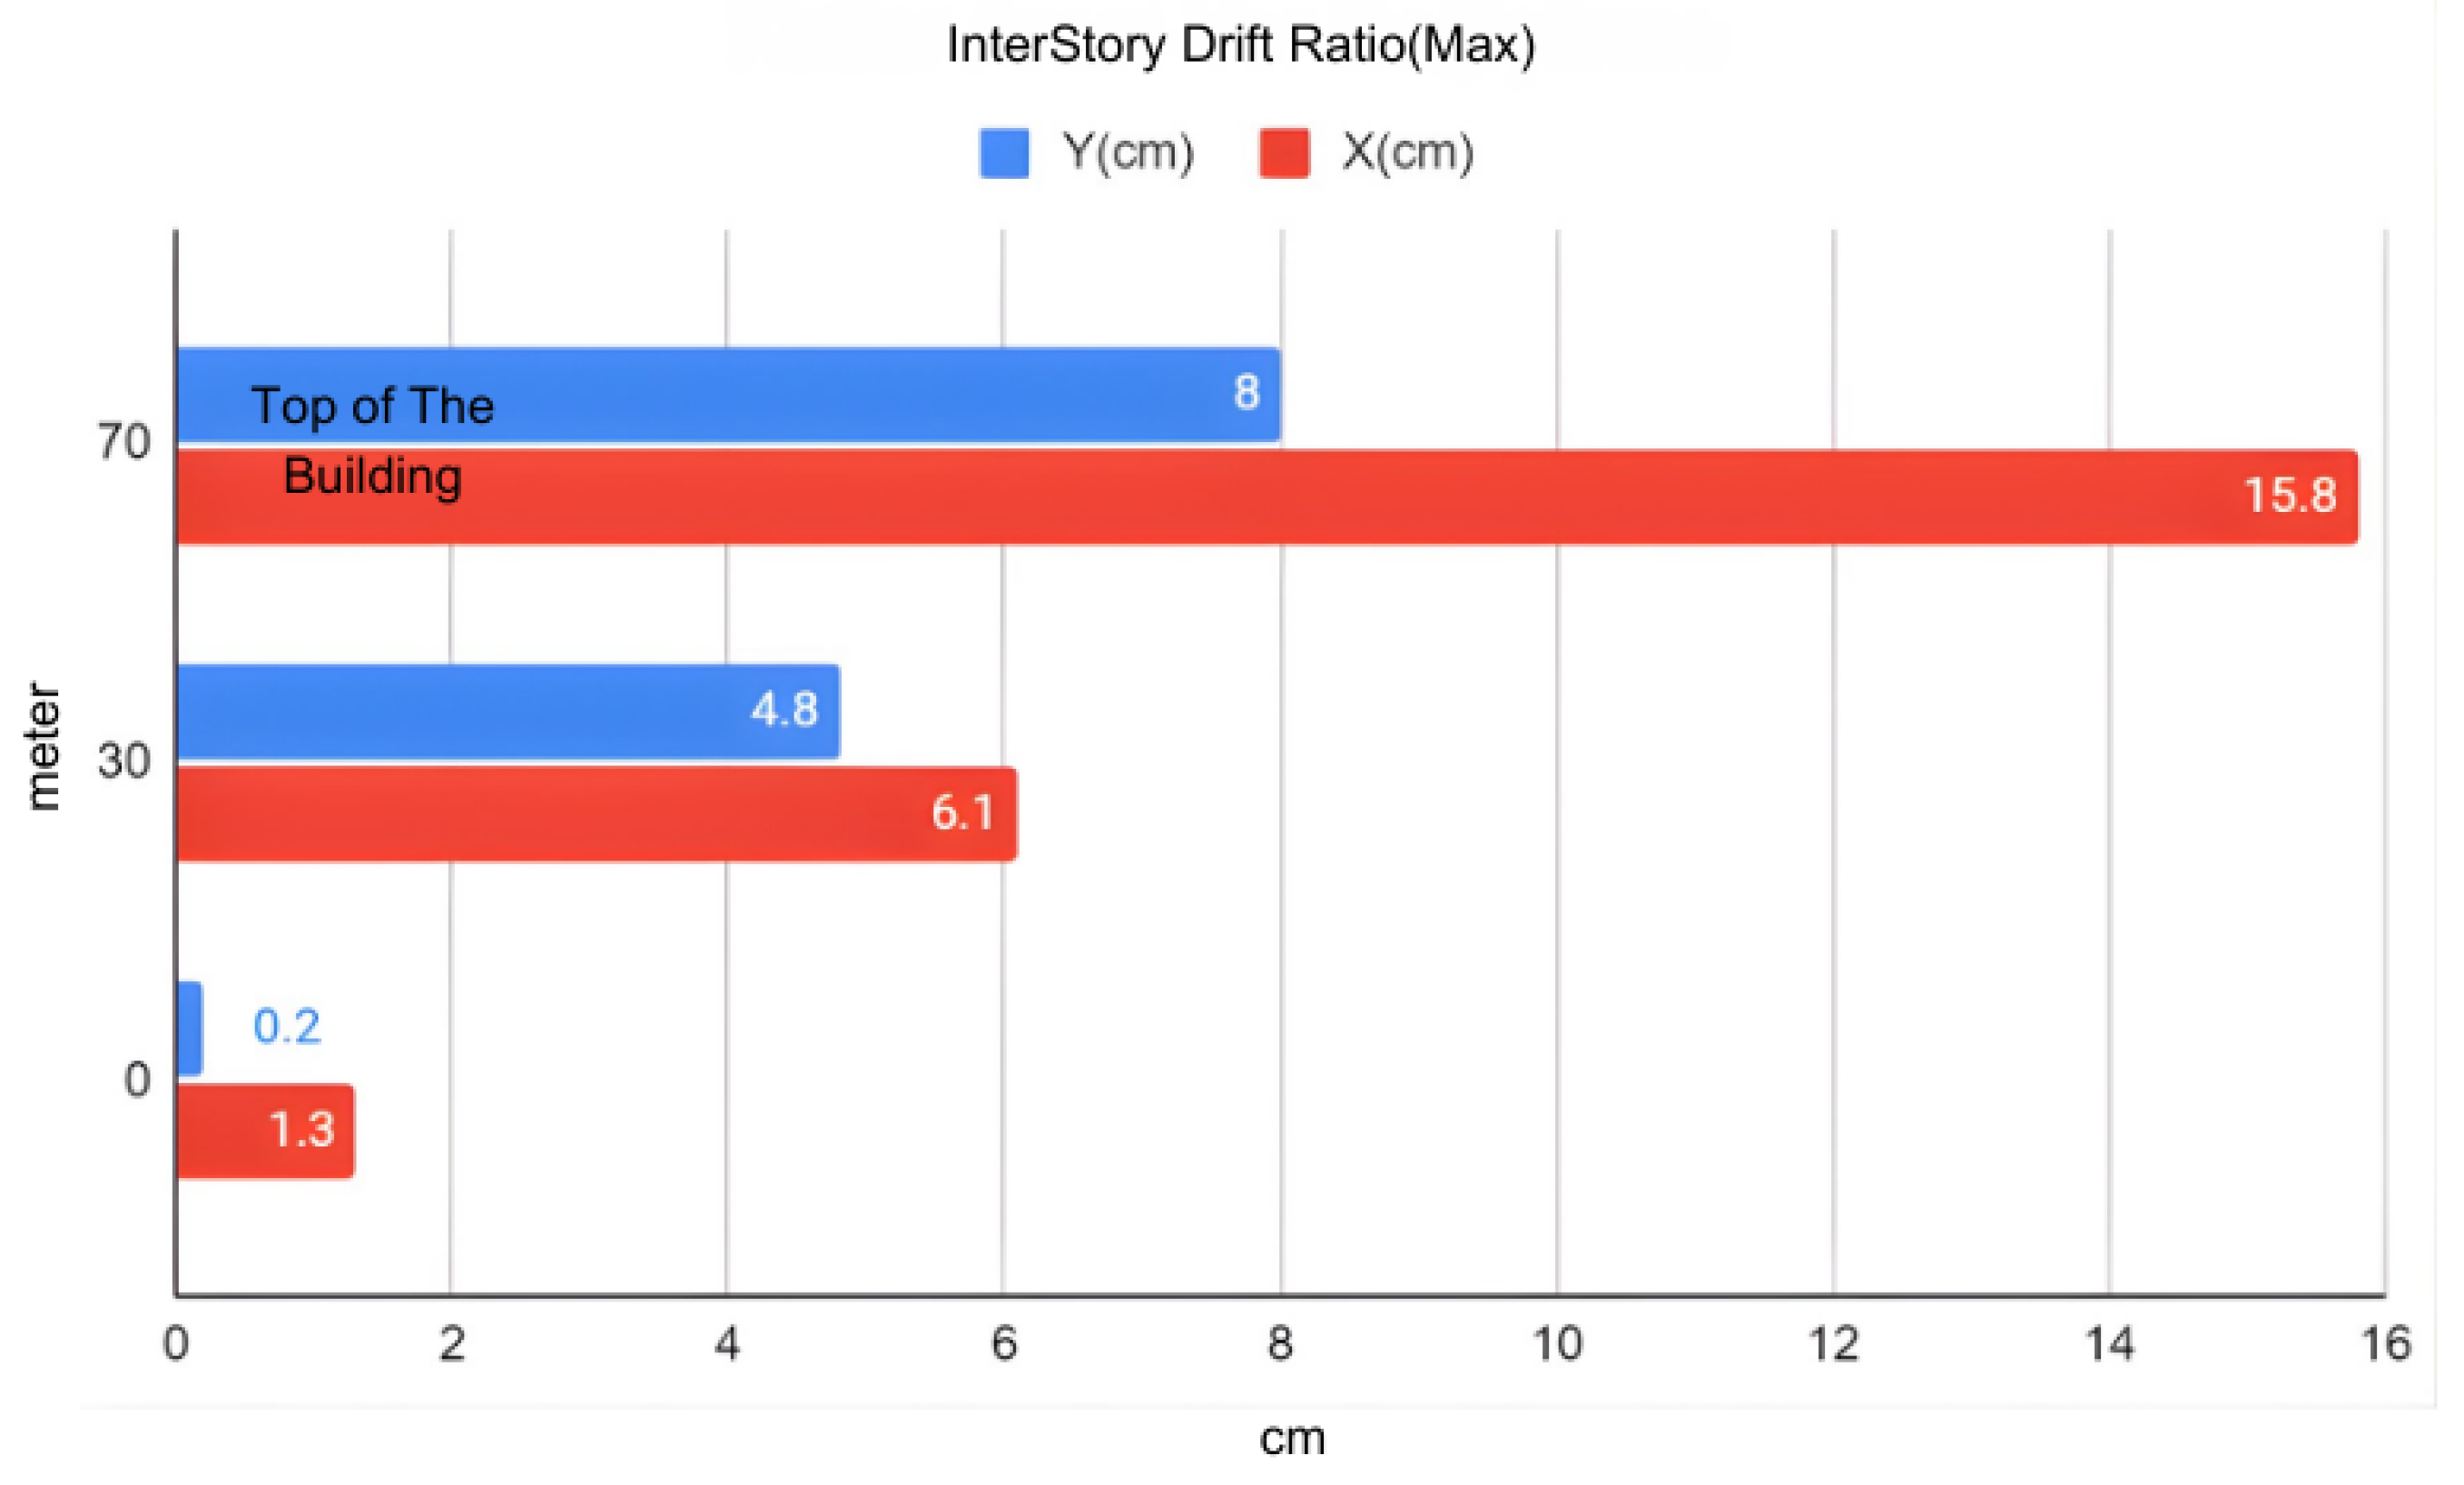
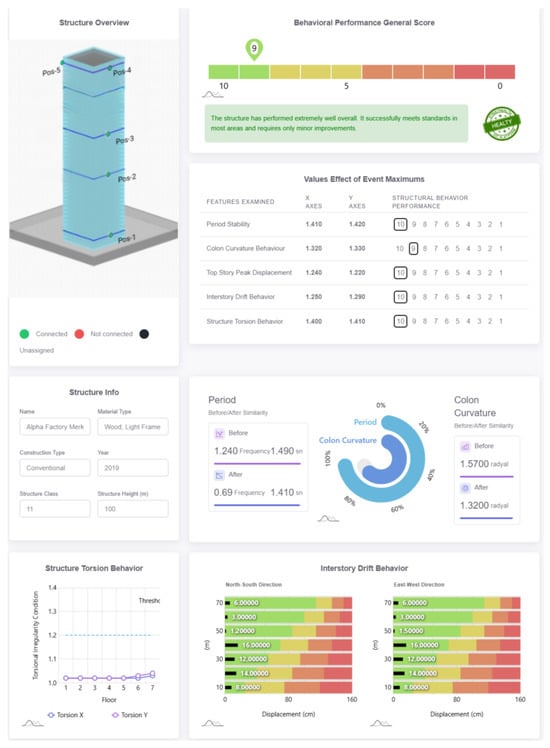
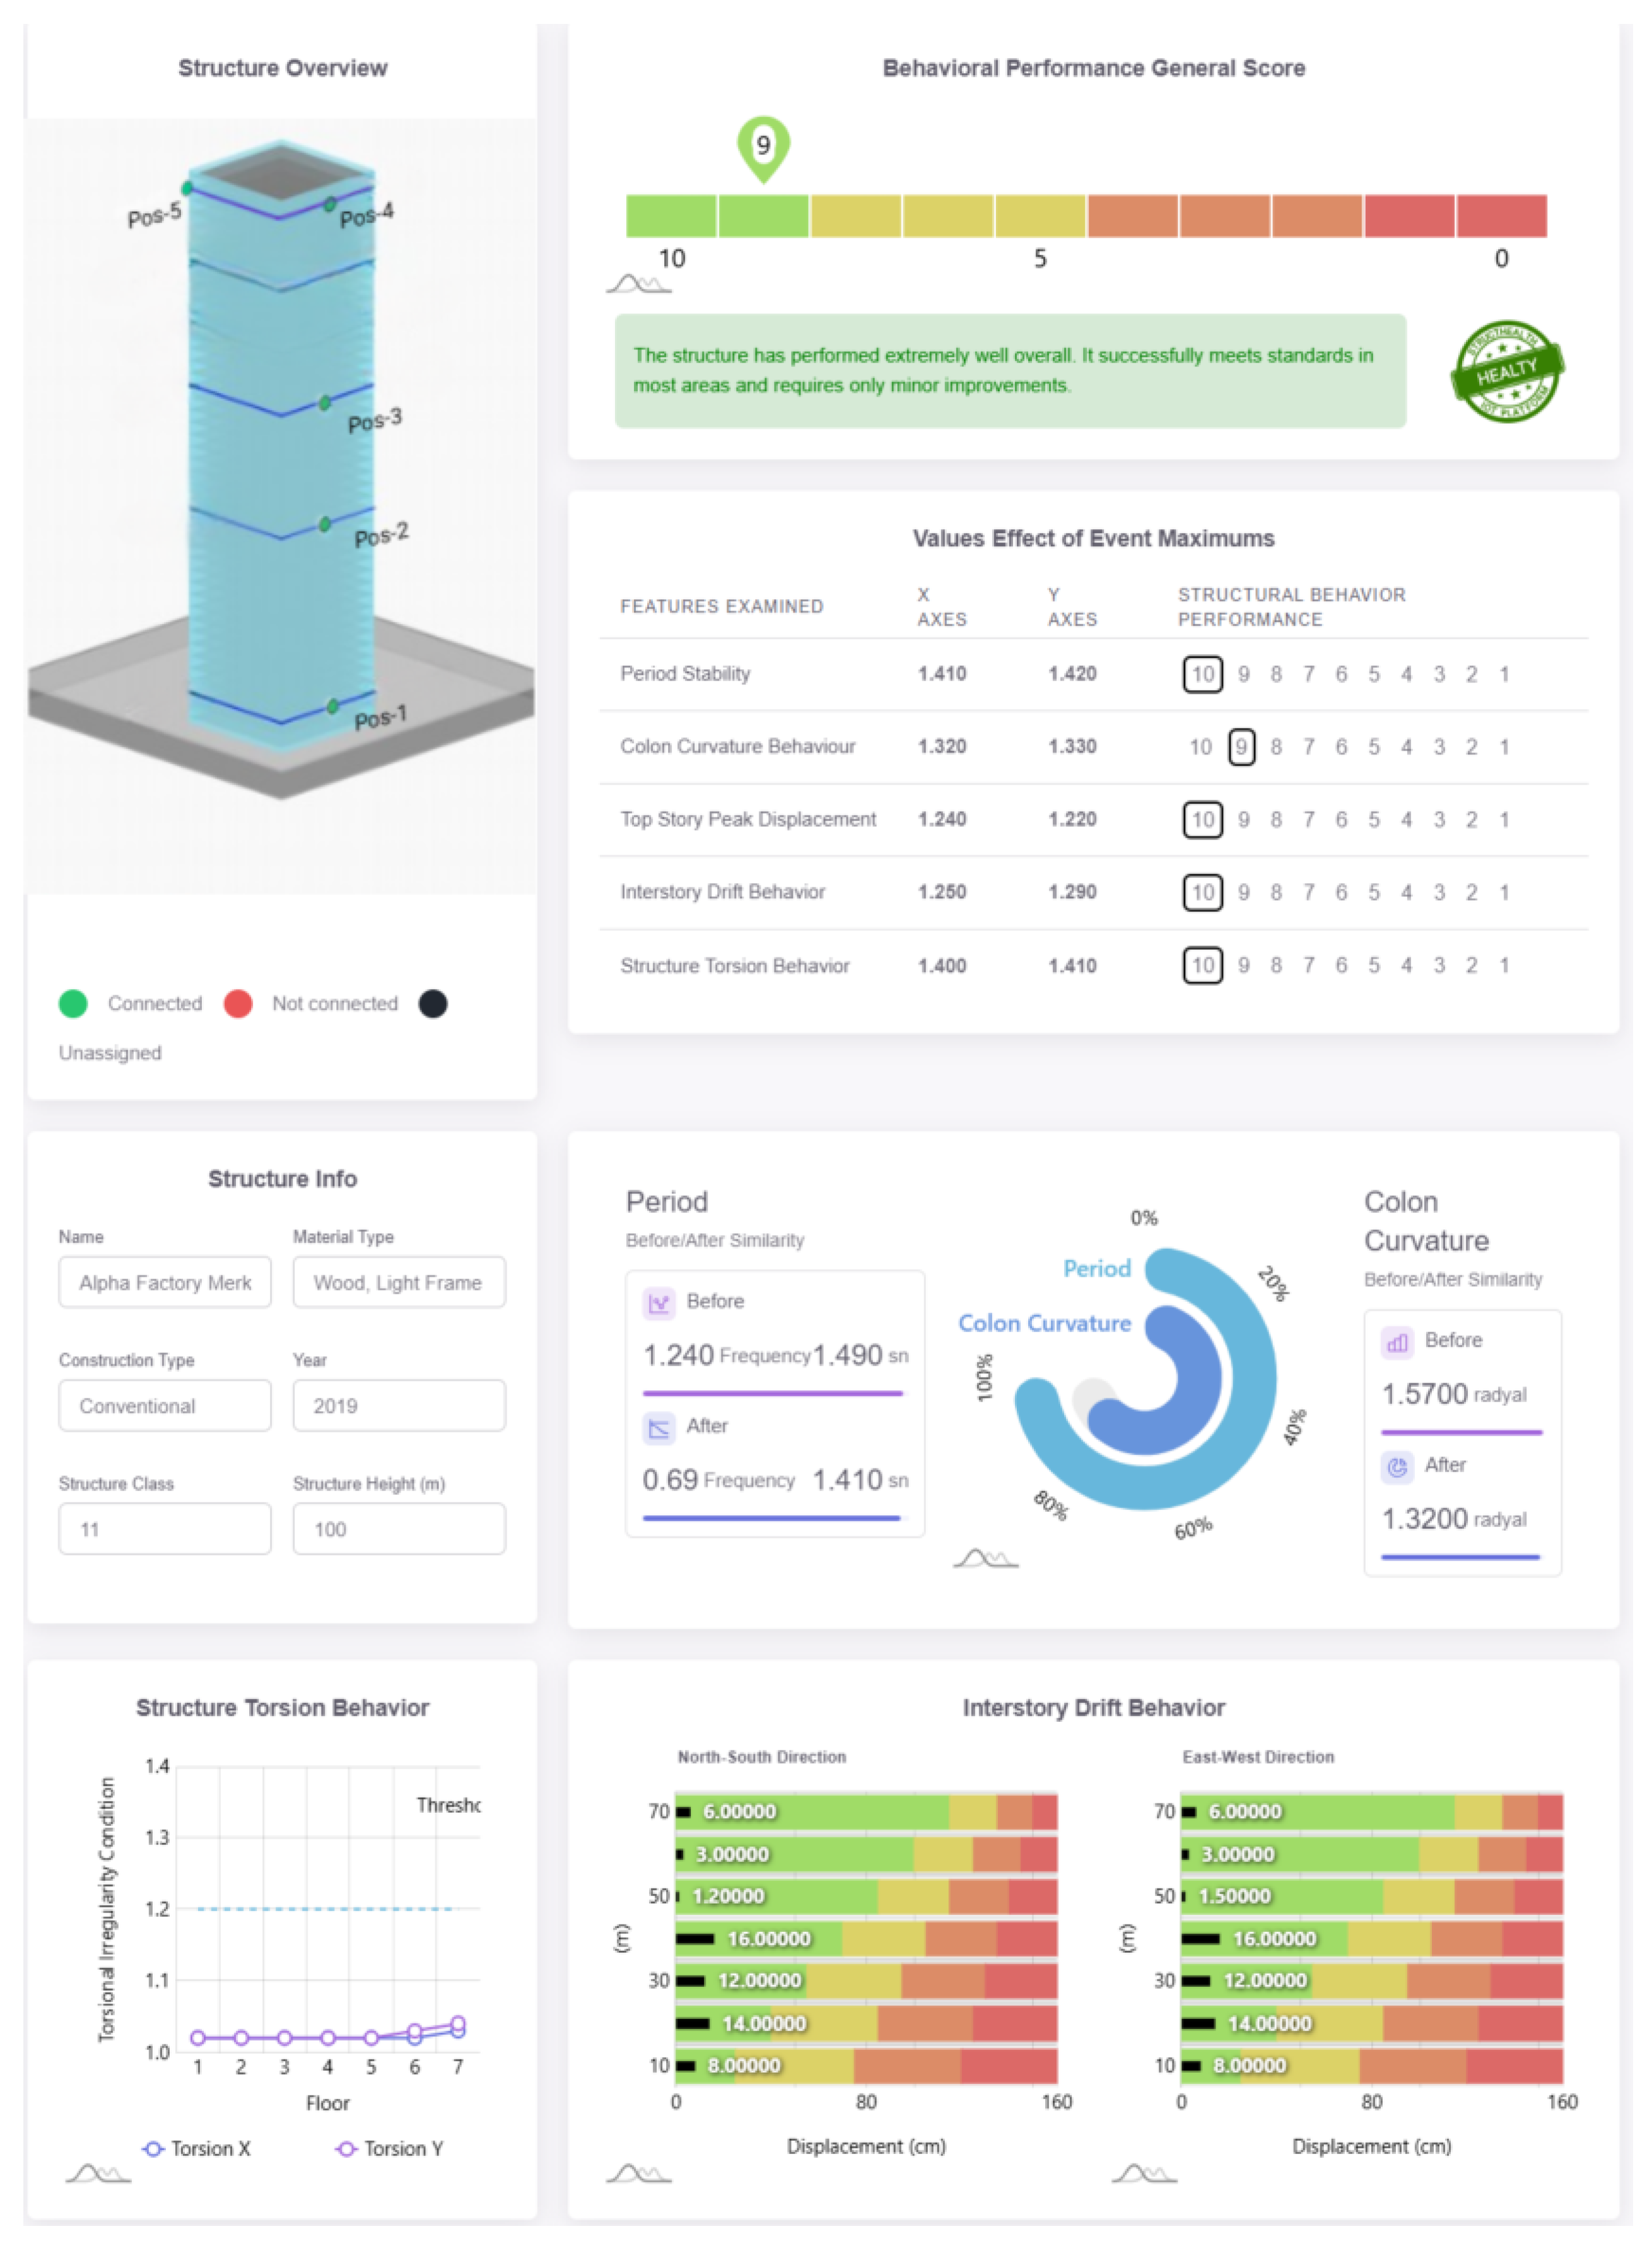

Disclaimer/Publisher’s Note: The statements, opinions and data contained in all publications are solely those of the individual author(s) and contributor(s) and not of MDPI and/or the editor(s). MDPI and/or the editor(s) disclaim responsibility for any injury to people or property resulting from any ideas, methods, instructions or products referred to in the content. |
© 2026 by the authors. Licensee MDPI, Basel, Switzerland. This article is an open access article distributed under the terms and conditions of the Creative Commons Attribution (CC BY) license.